the relationship between user perception and …eprints.whiterose.ac.uk/93413/1/paper_223.pdfvance...
TRANSCRIPT
This is a repository copy of The Relationship between User Perception and User Behaviour in Interactive Information Retrieval Evaluation.
White Rose Research Online URL for this paper:http://eprints.whiterose.ac.uk/93413/
Version: Accepted Version
Proceedings Paper:Zhuang, M., Toms, E. and Demartini, G. (2016) The Relationship between User Perceptionand User Behaviour in Interactive Information Retrieval Evaluation. In: Advances in Information Retrieval. 38th European Conference on Information Retrieval, 20 -23 Mar 2016, Padua, Italy. Lecture Notes in Computer Science . Springer International Publishing , pp. 293-305.
https://doi.org/10.1007/978-3-319-30671-1_22
[email protected]://eprints.whiterose.ac.uk/
Reuse Unless indicated otherwise, fulltext items are protected by copyright with all rights reserved. The copyright exception in section 29 of the Copyright, Designs and Patents Act 1988 allows the making of a single copy solely for the purpose of non-commercial research or private study within the limits of fair dealing. The publisher or other rights-holder may allow further reproduction and re-use of this version - refer to the White Rose Research Online record for this item. Where records identify the publisher as the copyright holder, users can verify any specific terms of use on the publisher’s website.
Takedown If you consider content in White Rose Research Online to be in breach of UK law, please notify us by emailing [email protected] including the URL of the record and the reason for the withdrawal request.

The Relationship between User Perception and User
Behaviour in Interactive Information Retrieval
Evaluation
Mengdie Zhuang, Elaine G. Toms, and Gianluca Demartini
Information School, University of Sheffield, Sheffield, S10 2TN,UK
{mzhuang1, e.toms, g.demartini}@sheffield.ac.uk
Abstract Measures of user behaviour and user perception have been used to
evaluate interactive information retrieval systems. However, there have been
few efforts taken to understand the relationship between these two. In this pa-
per, we investigated both using user actions from log files, and the results of the
User Engagement Scale, both of which came from a study of people interacting
with a novel interface to an image collection, but with a non-purposeful task.
Our results suggest that selected behavioural actions are associated with select-
ed user perceptions (i.e., focused attention, felt involvement, and novelty),
while typical search and browse actions have no association with aesthetics and
perceived usability. This is a novel finding that can lead toward a more system-
atic user-centered evaluation.
Keywords: user-centered evaluation; user perception evaluation; user behav-
iour evaluation
1 Introduction
Typically, interactive information retrieval (IIR) systems evaluations assess search
processes and outcomes using a wide range of measures such as time-on-task, user
satisfaction, and number-of-queries submitted. Some of these measures relate to user
perception of the results, the search experience, or the interface; they use data from
user responses to questions collected either during or after a search task is complete.
Some measures relate to user behaviour, that is, the actions and selections made by
the user while interacting with a system. These measures are calculated from data
collected by system log files while the user is in the process of searching or browsing,
and include, typically, time/date stamp, interface object used (e.g., mouse movements,
search box), and keystrokes. Most evaluations will include a combination of these
measures particularly in lab-based studies. In general we presume that both types of
measures are indicative of performance, opinion and outcome.
This research uses an existing dataset that contains both perception and behaviour-
al data to test the relationship between the two. This will be a first step toward testing
the hypothesis that user behavioural actions predict user perceptions of IR systems. If
this is indeed the case, the assessment of IIR evaluations can be significantly simpli-
fied for automatic data collection of essential measures. At the same time strong cor-
relations (if they exist) among the various perception and behavioural measures will
suggest that the measures are evaluating the same phenomena, which may lead to a
more parsimonious set of measures. Surprisingly, we still do not know which
measures are the more reliable and robust, and indicative of overall results.
This paper is structured as follows: Section 2 discusses how both user perception
and behaviour are used in IIR evaluations. Section 3 describes the dataset used in this
study, the measures extracted from the dataset, and our approach to the analysis. Sec-
tions 4-6 deal, respectively, with the results, discussion and conclusions.
2 Background
The evaluation of IR systems has puzzled the field for half a century. Initially rele-
vance emerged as the measure of preference to assess primarily topical relevance
using, e.g., mean average precision, mean reciprocal rank, and discounted cumulative
gain[15]. But with interactive IR came a focus on users and their needs, which exam-
ined the effect of individual differences [6, 9] on search, and evaluated search out-
comes [16], as well as user behaviour [24] and user perception [16] of the search pro-
cess. More recently broader aspects of user context [5, 8] have been considered.
Due to the iterative nature of the search process, we do not know if and when an
outcome meets a user’s need. A user may assess an outcome immediately, but when
the task that prompted the search is complex, that judgment may only come after a
succession of search tasks (and other types of information tasks) and over a period of
time. Individual differences such as age, gender, expertise, mental effort, and learning
style may affect the process, but there is as yet definitive influential set [1, 6, 8].
The core measures used in evaluations to date have tended to combine elements of
user behaviour (e.g., number of queries) and perception (e.g., satisfaction) as demon-
strated by results of the various TREC, INEX and CLEF interactive tracks over the
years. These have been characterized in multiple ways [14, 19, 25]. One of the few
attempts to examine the interactions between these two dimensions is the work of Al-
Maskari and Sanderson [1, 2], who examined the relationship between selected as-
pects of behaviour and perception, and found significant associations between user
satisfaction and user effectiveness (e.g., completeness), and user satisfaction and sys-
tem effectiveness (e.g., precision, recall). To our knowledge, there is only one meas-
ure that integrates user behaviour with user perception: Tague-Sutcliffe’s informa-
tiveness measure [20] that assesses the performance of the system simultaneously
with the perception of the user. But this is atypical and due to the effort (e.g., constant
user feedback) required in implementation is rarely used [10].

2.1 User Perception
The multiple measures of user perception are often associated with measures of
perceived usability. Satisfaction, for example, was borrowed from usability research
and tends to be consistently deployed in IIR studies. Other measures include ease of
use, perception of time, and usefulness of results. All are measured post the user’s
interaction with the system, and require user response to a set of questions or items.
One recent multi-dimensional measure is the User Engagement Scale (UES) [16]
which calculates six dimensions (Table 1) of a user experience: Aesthetic Appeal,
Novelty, Focused Attention, Felt Involvement, Perceived Usability, and Endurability
(see definitions in Table 1). The scale contains 31 items; each item is presented as a
statement using a 5 point scale from “strongly disagree” to “strongly agree”. Unlike
other measures, the model underpinning the UES shows how Endurability is ex-
plained either directly or indirectly by the other five dimensions. The UES has been
used to evaluate multiple types of systems (e.g., e-shopping [16], wikiSearch [17],
Facebook [4]). This scale follows standard psychometric scale development methods
[7], and has been tested for reliability and validity. Although differences have
emerged [17] in the various applications, it is the most tested measure of user percep-
tion of a system.
2.2 User Behaviour
How a user interacts with a search system is characterized typically by a set of
low-level user actions and selections at the interface (see [2, 14, 18, 20]):
• frequency of interface object use, e.g., number of times search box has been used;
• counts of queries, categories viewed in a menu, mouse clicks, mouse rollovers;
• time spent using objects, viewing pages.
Multiple efforts have attempted to look for patterns in these actions, patterns that
might have the capability to predict likelihood of a successful outcome [21, 24]. The
challenge with user behaviour measures is that they are only descriptive of the out-
come, and are not interpretive of the process. That is to say, they lack the rationale
behind why those behaviours may lead to a successful outcome. The challenge with
log files is the voluminous number of data points and the need to find a reliable ap-
proach to defining groups or sets based on behavioural patterns. Not all users are alike
and nor do they all take the same approach to searching for the same things as evi-
denced by the TREC, INEX and CLEF interactive tracks.
2.3 Research Objectives
We hypothesise that behavioural patterns are indicative of a user perception of IIR
system usage. That is, selected behavioural variables are associated with selected user
perceptions of the user’s interaction with that system. We test this hypothesis by iso-
lating measures of user behaviour as represented by actions in a log file and examin-
ing the association with a user perception of their experience as measured by the UES.
3 Methods
3.1 Overview
We used the data collected by the CLEF 2013 Cultural Heritage Track (CHiC).
This section briefly describes that dataset, the measures we extracted from the dataset,
and how we approached the analysis, but see [12] for the details of that study.
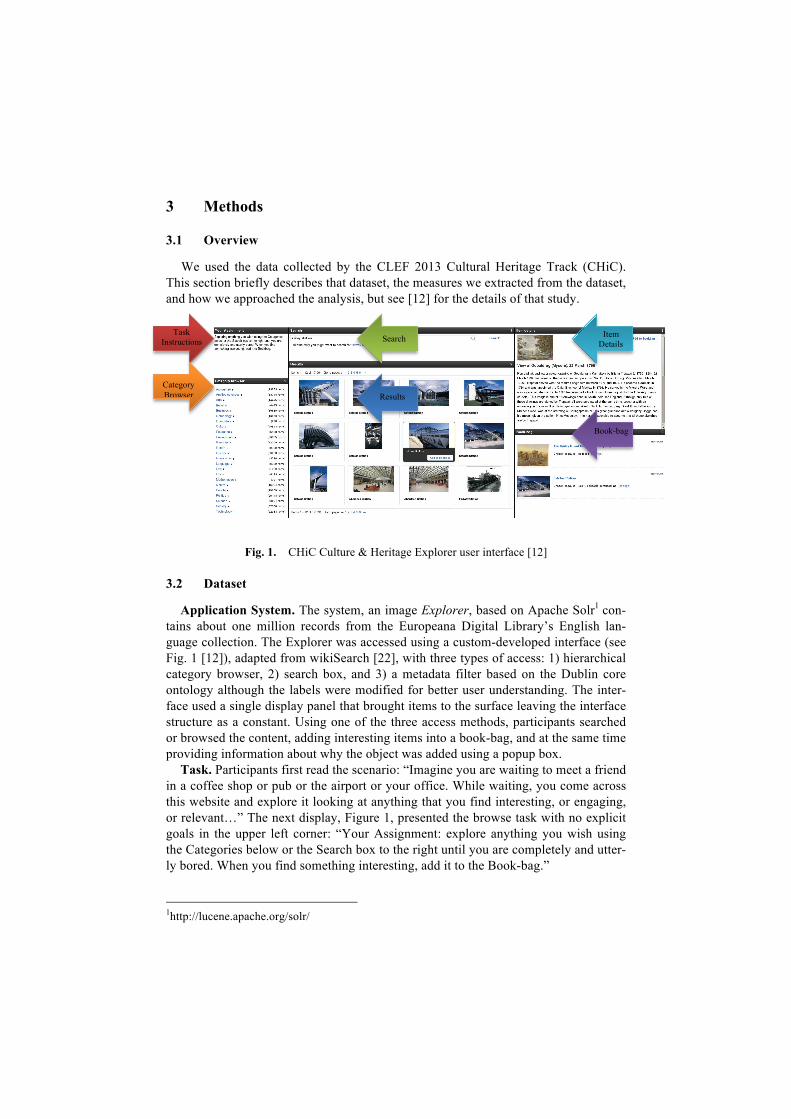
Fig. 1. CHiC Culture & Heritage Explorer user interface [12]
3.2 Dataset
Application System. The system, an image Explorer, based on Apache Solr1 con-
tains about one million records from the Europeana Digital Library’s English lan-
guage collection. The Explorer was accessed using a custom-developed interface (see
Fig. 1 [12]), adapted from wikiSearch [22], with three types of access: 1) hierarchical
category browser, 2) search box, and 3) a metadata filter based on the Dublin core
ontology although the labels were modified for better user understanding. The inter-
face used a single display panel that brought items to the surface leaving the interface
structure as a constant. Using one of the three access methods, participants searched
or browsed the content, adding interesting items into a book-bag, and at the same time
providing information about why the object was added using a popup box.
Task. Participants first read the scenario: “Imagine you are waiting to meet a friend
in a coffee shop or pub or the airport or your office. While waiting, you come across
this website and explore it looking at anything that you find interesting, or engaging,
or relevant…” The next display, Figure 1, presented the browse task with no explicit
goals in the upper left corner: “Your Assignment: explore anything you wish using
the Categories below or the Search box to the right until you are completely and utter-
ly bored. When you find something interesting, add it to the Book-bag.”
1http://lucene.apache.org/solr/
Task
Instructions
Category
Browser
Search
Results
Item
Details
Book-bag
Participants. 180 participants volunteered with 160 on-line participants and 20 in-
lab participants who were recruited via a volunteers’ mailing list.
Procedure. Participants (both lab and online) used a web-based system, SPIRES
[11] which guided them through the process. The only difference between the two is
that lab participants were interviewed, which is outside the scope of this analysis. The
SPIRES system started with an explanation of the study, acquired informed consent,
and asked for a basic demographic profile and questions about culture before present-
ing the Explorer and the task to participants. Once participants had executed the task,
and essentially were “bored,” they moved on to the 31 item UES questionnaire [7, 16]
about their perceptions of the search experience and the interface, and provided a
brief explanation of objects in the book-bag, the metadata and the interface.
3.3 Measures
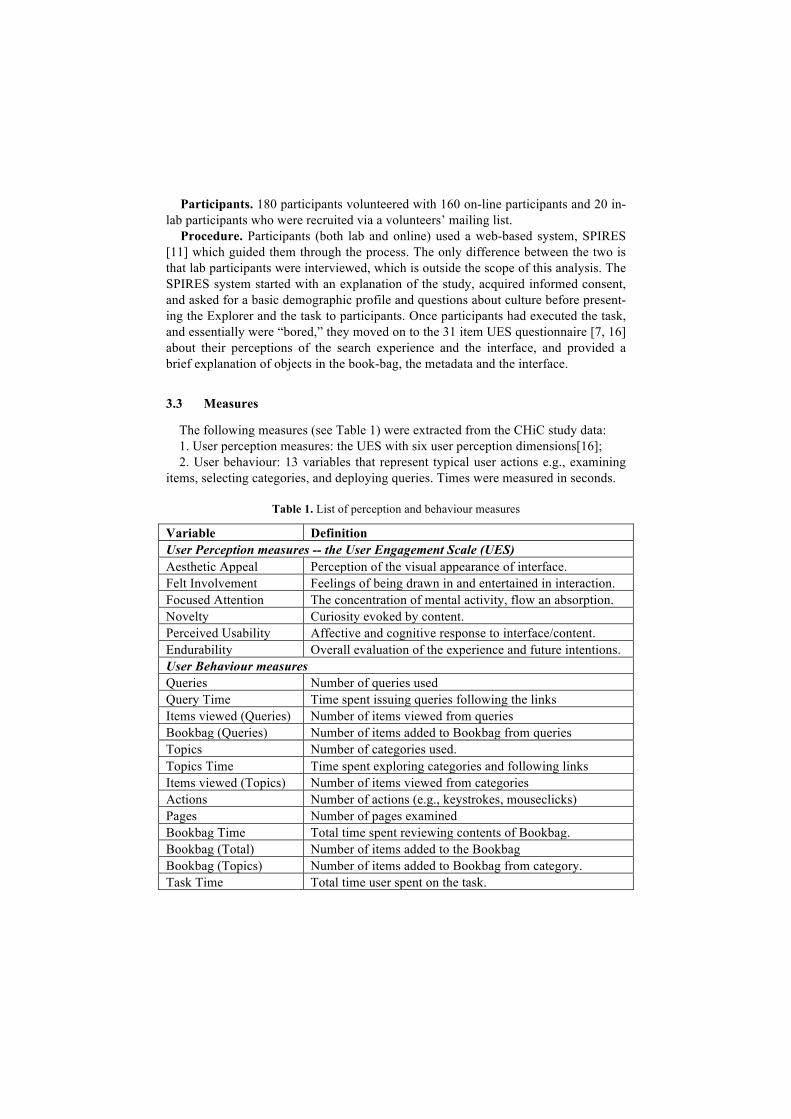
The following measures (see Table 1) were extracted from the CHiC study data:
1. User perception measures: the UES with six user perception dimensions[16];
2. User behaviour: 13 variables that represent typical user actions e.g., examining
items, selecting categories, and deploying queries. Times were measured in seconds.
Table 1. List of perception and behaviour measures
Variable Definition
User Perception measures -- the User Engagement Scale (UES)
Aesthetic Appeal Perception of the visual appearance of interface.
Felt Involvement Feelings of being drawn in and entertained in interaction.
Focused Attention The concentration of mental activity, flow an absorption.
Novelty Curiosity evoked by content.
Perceived Usability Affective and cognitive response to interface/content.
Endurability Overall evaluation of the experience and future intentions.
User Behaviour measures
Queries Number of queries used
Query Time Time spent issuing queries following the links
Items viewed (Queries) Number of items viewed from queries
Bookbag (Queries) Number of items added to Bookbag from queries
Topics Number of categories used.
Topics Time Time spent exploring categories and following links
Items viewed (Topics) Number of items viewed from categories
Actions Number of actions (e.g., keystrokes, mouseclicks)
Pages Number of pages examined
Bookbag Time Total time spent reviewing contents of Bookbag.
Bookbag (Total) Number of items added to the Bookbag
Bookbag (Topics) Number of items added to Bookbag from category.
Task Time Total time user spent on the task.

3.4 Data Analysis
Data Preparation. After extracting the data, each participant set was scanned for
irregularities. Pilot participants and those who did not engage (e.g. left the interface
for hours) were removed. 157 participants remained. The two datasets were saved into
a spreadsheet or database for preliminary examination, and exported to SPSS.
User Perception. First, Reliability Analysis assessed the internal consistency [3] of
the UES sub-scales using Cronbach’s α. Second, the inter-item correlations among
items were used to test the distinctiveness of the sub-scales. Third, Exploratory Factor
Analysis using Maximum Likelihood with Oblique Rotation (as we assumed correlat-
ed factors [18]) to estimate factor loadings tested the underlying factors, to compare
with previous UES analyses, and validate it for use in this research.
User Behaviour. First, the raw log file data were exported to a spreadsheet. A two-
step data reduction process sorted 15396 user actions into 157 participant groups con-
taining participant id, time stamp, action type and parameter. Next Exploratory Factor
Analysis (using Maximum Likelihood with Oblique Rotation) was used to identify the
main behavioural classes. These then were used to calculate the measure per partici-
pant for each variable listed in Table 1. Finally, Cluster Analysis extracted symbolic
user archetypes across 157 participants.
Correlation Analysis. Correlation analysis using Pearson’s r was then used to ex-
amine the relationship between user perception and user behaviour.
4 Results
The results first present the analysis of the user perception measures, then the user
behaviour measures and finally the analysis of the relationship between the two.
4.1 User Perception
First, the Reliability Analysis resulted in Cronbach’s α = 0.79 to 0.90 indicating
good internal consistency for each of the sub-scales; values between 0.7 and 0.9 are
considered optimal [7]. Next, correlations among the UES subscales (see Table 2)
were tested. Values <0.5 are indicate that the sub-scale should remain distinct
while >0.5 indicates that the scale might be merged during Factor analysis.
Table 2. Correlations among UES sub-scales (**p<0.01)
Sub-scale Aesthetics (AE) EN FA FI NO
Endurability (EN) 0.692* 1
Focused Attention (FA) 0.370 0.621* 1
Felt Involvement (FI) 0.558* 0.826* 0.793* 1
Novelty (NO) 0.546* 0.715* 0.650* 0.824* 1
Perceived Usability (PU) 0.471* 0.596* 0.206 0.385 0.234

An initial examination of the scree plot (i.e., the eigenvalues of the principal com-
ponents) that resulted from the Factor Analysis identified a four-factor solution that
accounted for 59.8% of the variance. A five-factor solution, albeit accounting for 63%
of the variance, was less appropriate as only two items were loaded on Factor 5 with
lower absolute loading values than those on Factor 4. The four-factor model demon-
strated a very high Kaiser-Meyer-Olkin Measure of Sampling Adequacy (KMO =
0.924), indicating that the factors are distinct. The statistically significant result from
Bartlett’s Test of Sphericity (!!=3609.9, df=465, p<0.001) also suggested relation-
ships existed amongst the dimensions. Table 3 summarises the four factors that were
generated: Factor 1 contained 11 items from Novelty (3 of 3), Focused Attention (1 of
7), Felt Involvement (3 of 3), and Endurability (4 of 5). Factor 4 remained as in the
original UES, Focused Attention (6 of 7) almost remained distinct (Factor 2), and
Perceived Usability (8 of 8) plus 1 item from Endurability formed Factor 3. Factor 2-4
had good internal consistency as demonstrated by Cronbach’s α. Correlation analysis
resulted in significant, although moderate, correlations amongst the factors. Given the
results, some of the overlapped items may be removed from Factor 1 (Cronbach’s α >
0.95) (see Table 3). However, we used the original factors in our remaining analysis.
Table 3. Factors resulting from the Factor Analysis (**p<0.01)
Factor
Factor Sub-scale Cronbach's α M n 2 3 4
1 EN, FA, FI, NO 0.95 2.67 11 0.66** 0.45 0.59**
2 FA 0.90 2.19 6 -0.26** 0.36**
3 PU,EN 0.86 3.14 9 0.51**
4 AE 0.89 2.55 5
4.2 User Behaviour
First, we performed Exploratory Factor Analysis on the behavioural measures listed
in Table 1 to assess, first if they highly correlate and, second, to identify distinctive
groups according to behavioual actions. The result demonstrated a mediocre Kaiser-
Meyer-Olkin Measure of Sampling Adequacy (KMO = 0.634), and Bartlett’s Test of
Sphericity (!! =2736.4, df=78, p<0.001) suggests that there were relationships
amongst the items. This resulted in a three-factor solution, which accounted for ap-
proximately 76% of the variance.
Table 4 displays the factor weights for three user behaviour factors. Factor 1 seems
to represent search actions, and Factor 2, browsing actions. Factor 3 mainly contains
general task-based actions. However, both Actions and Pages are present in both fac-
tors, and thus were excluded from further analysis. In order to test for other irrelevant
variables in each factor, we performed a reliability analysis by factor ablation measur-
ing Cronbach’s α if items Deleted. Notably, the exclusion of Bookbag (Topics) from
Factor 3 would yield an α value of 0.537, which makes it the most critical measure.
Factor 1 (Cronbach’s α =0.846) and Factor 2 (Cronbach’s α =0.707) reflected good
internal consistency. Correlation values between General behaviour and the other two

behaviours are considered as moderate (i.e., 0.362 and 0.251 with 1 and 2 respective-
ly). This indicates that searching and browsing behaviour had a moderate correlation
with general behaviour. The correlation between Searching behaviour and Browsing
behaviour was 0.621, which is considered significant. The resulting factor from this
analysis suggests that participants’ behaviours could be described from three main
dimensions (Searching, Browsing, and General).
Table 4. Exploratory Factor Analysis of user behaviour data
Factor 1
Searching
Factor 2
Browsing
Factor 3
General
Queries 0.970 -0.019 -0.103
Query Time 0.961 -0.079 0.051
Items viewed (Queries) 0.946 0.057 -0.135
Bookbag (Queries) 0.693 -0.221 0.421
Topics 0.060 0.998 -0.391
Topics Time -0.162 0.887 0.196
Item viewed (Topics) -0.077 0.793 0.114
Actions 0.519 0.616 0.102
Pages 0.307 0.394 0.300
Bookbag Time -0.015 -0.230 1.037
Bookbag (Total) 0.225 0.003 0.824
Bookbag (Topics) -0.398 0.380 0.749
Task Time 0.275 0.118 0.614
To assess how participants acted, one action item (i.e., the one with highest weight,
shown in italics in Table 4), was selected from each factor and submitted to a Cluster
Analysis using Ward’s hierarchical clustering method [23]. The results were manually
inspected including descriptive statistics for each action item, and the resulting den-
drogram. The 157 participants best distributed into 3 clusters (see Table 5).
Table 5. Means of user behaviour variables in each cluster
Cluster Label n Queries Topics Bookbag Time(s)
1 Explorers 10 18.2 9.8 821.6
2 Followers 98 2.7 10.10 29.8
3 Berrypickers 49 3.96 11.4 137.6
Each of the clusters represents a set of participants who exhibit certain types of be-
haviours illustrative of information seekers. The first represents explorers, who spent
the longest time checking items in the book-bag, and used on average the most que-
ries. They were clearly concerned about their results, and specific about what they
were looking for. The second group contains directionless followers. They do not
appear to have specific interests about the content and just trailed the inter-linked
categories rather than using queries. They added fewer items to the bookbag, and
appeared to stop early. The third group acted much like Bates’ berrypickers [5]. Their
search and browse activities interacted to sustain participants’ interests in the collec-
tion. They seemed to obtain information by noticing and stopping to examine other
contents, which are not strongly relating to the item that they currently viewing. Some
used queries to refine their searches. The interpretation of three clusters suggests the
three behavioural factors described the participants in this case. For the subsequent
examination of the relationship between perception and behaviour, these three behav-
iour factors (Table 4) were used.
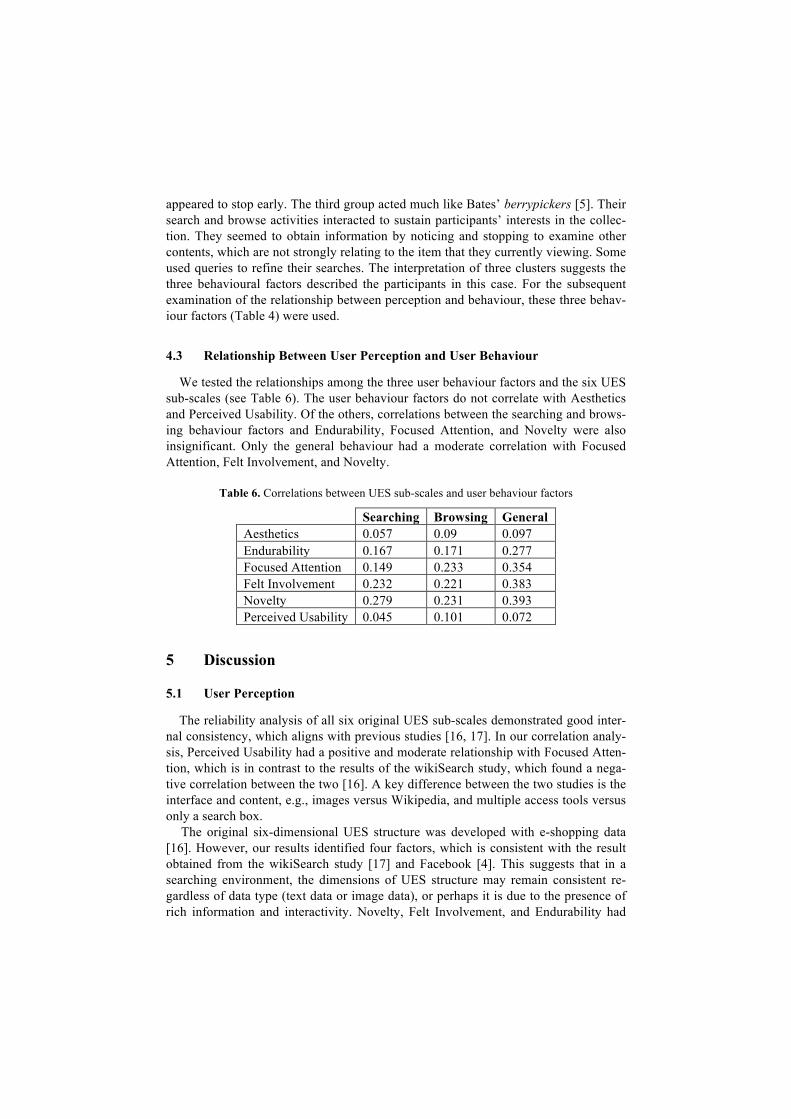
4.3 Relationship Between User Perception and User Behaviour
We tested the relationships among the three user behaviour factors and the six UES
sub-scales (see Table 6). The user behaviour factors do not correlate with Aesthetics
and Perceived Usability. Of the others, correlations between the searching and brows-
ing behaviour factors and Endurability, Focused Attention, and Novelty were also
insignificant. Only the general behaviour had a moderate correlation with Focused
Attention, Felt Involvement, and Novelty.
Table 6. Correlations between UES sub-scales and user behaviour factors
Searching Browsing General
Aesthetics 0.057 0.09 0.097
Endurability 0.167 0.171 0.277
Focused Attention 0.149 0.233 0.354
Felt Involvement 0.232 0.221 0.383
Novelty 0.279 0.231 0.393
Perceived Usability 0.045 0.101 0.072
5 Discussion
5.1 User Perception
The reliability analysis of all six original UES sub-scales demonstrated good inter-
nal consistency, which aligns with previous studies [16, 17]. In our correlation analy-
sis, Perceived Usability had a positive and moderate relationship with Focused Atten-
tion, which is in contrast to the results of the wikiSearch study, which found a nega-
tive correlation between the two [16]. A key difference between the two studies is the
interface and content, e.g., images versus Wikipedia, and multiple access tools versus
only a search box.
The original six-dimensional UES structure was developed with e-shopping data
[16]. However, our results identified four factors, which is consistent with the result
obtained from the wikiSearch study [17] and Facebook [4]. This suggests that in a
searching environment, the dimensions of UES structure may remain consistent re-
gardless of data type (text data or image data), or perhaps it is due to the presence of
rich information and interactivity. Novelty, Felt Involvement, and Endurability had

been demonstrated to be reliable sub-scales in the e-shopping environment, and some
of the items within these sub-scales were used successfully to measure website en-
gagement and value as a consequence of website engagement in online travel plan-
ning [13]. This highlights the notion that different user perception dimensions may be
more relevant to different interactive search systems. In our setting we observed that
Endurability, Felt Involvement, and Novelty show the same information.
5.2 User Behaviour
Extracting types of user actions from the logfile resulted in three key behavioural
classes that relate to users’ search or browse behaviours and their general task-based
actions. The searching behaviours were primarily associated with query actions. The
browsing behaviours included actions related to using the categories as well as those
related to keystroke and mouse activity and what could be construed as navigational
activities. Actions and Pages, the items viewed, did not map well to any factor. While
the third, which we call general, is more associated with actions related to the result
and task. Notably actions associated with items selected as a result of using categories
fit into this factor, whereas, those that resulted from using a query loaded with the
other actions associated with a query.
In addition to examining and grouping the behavioural actions into usable sets, we
found a novel set of user archetypes (explorers, followers, berrypickers) among our
participant group. The explorers submitted sets of highly relevant queries. More spe-
cifically, subsequent queries were aimed at refining former ones. For instance, an
explorer exhibited a closely related pathway: modern sculpture, modern british sculp-
ture, hepworth, hepworth sculpture, henry moore, henry moore sculpture, family of
man, family of man sculpture. In contrast, the query pathways input by followers and
berrypickers are typically short (both pathway and query length), e.g., Scotland, Ed-
inburgh. The user archetypes and pattern of query might be useful in evaluation simu-
lations and in advancing log analysis techniques.
5.3 Relationship Between User Perception and User Behaviour
There are little indications of which measures are the reliable and robust. Therefore,
as a first step to test the relationships between perception and behaviour measures,
correlation values >0.35 should be considered. When we measured correlation of user
behaviours with user perception, the results were not as anticipated. User behaviour
appears to be not strongly related to a user’s perception of Aesthetics and Perceived
Usability. How people searched and browsed through the images seems unrelated to
their subsequent perception of the system. This may be attributed to user expectations
about aesthetics and usability that limit the degree of variation among individuals.
Similarly the searching and browsing behaviours have no strong correlation with
Endurability, Focused Attention, Felt Involvement and Novelty. This suggests that
single exploring behaviours could not comprehensively contribute to calculating user
engagement. However, the general behaviours which had more to do with managing
the results had a moderate correlation with Focused Attention, Felt Involvement and

Novelty, which were combined into a single factor in our analysis of the UES. This
indicates that system data that shows the general behaviour of users could contribute
to these existing user engagement sub-scales; depending on the nature of the experi-
ment, different user behaviour variables could be extracted from log files.
6 Conclusion
The key objective of our research was to assess whether a relationship exists be-
tween user behaviour and user perception of information retrieval systems. This was
achieved by using actions from log files to represent behaviour and results from the
UES to represent perception. The data came from a study in which people had no
defined task while interacting with a novel interface to a set of images. In the past,
studies have considered measures of behaviour and perception as two relatively inde-
pendent aspects in evaluation. Our results showed that the aesthetics and usability
perceptions of those searching and browsing appear un-influenced by their interac-
tions with the system. However, general actions were associated with attention, in-
volvement and novelty.
In addition, our research tested the UES scale, and like the wikiSearch results [16],
we found four factors. This may be because both implementations were in infor-
mation finding systems, and not the focused task of a shopper [15]. We also produced
a novel set of information-seeking user archetypes (i.e., explorers, followers, and
berrypickers), defined by their behavioural features which may be useful in testing
evaluation simulations and build novel log analysis techniques that simulate user stud-
ies. Moreover, these user archetypes were reflective of search reality as behavioural
measures were direct observables. On the other hand, user perception measures are
based on a psychometric scale or descriptive data and thus are largely affected by
context.
Our findings are preliminary and we need to replicate them using additional da-
tasets. We have isolated selected behavioural variables that are significant to the anal-
ysis. The emerging relationship with the UES demonstrates that we may be able to
isolate selected variables from log files that are indicative of user perception. Being
able to do so would mean that IIR evaluations could be parsimoniously completed
using only log file data. This means that we need also to refine the UES so that the
result consistently outputs distinctive reliable and valid factors that represent human
perception. The additional part of the analysis lies with the task and with the user’s
background and personal experience, which may account for the remaining variance
in the result.
References
1. Al-Maskari, A., Sanderson, M.: The effect of user characteristics on search effectiveness in
information retrieval. Information Processing & Management, vol. 47, pp. 719-729 (2011)
2. Al-Maskari, A., Sanderson, M.: A review of factors influencing user satisfaction in
information retrieval. JASIST, vol. 61, pp. 859-868 (2010)

3. Aladwani, A.M., Palvia, P.C.: Developing and validating an instrument for measuring user-
perceived web quality. Information & management, vol. 39, pp. 467-476 (2002)
4. Banhawi, F., Ali, N.M.: Measuring user engagement attributes in social networking
application. In: Semantic Technology and Information Retrieval, pp. 297-301. IEEE, (2011)
5. Bates, M.J.: The design of browsing and berrypicking techniques for the online search
interface. Online Information Review, vol. 13, pp. 407-424 (1989)
6. Borgman, C.L.: All users of information retrieval systems are not created equal: an
exploration into individual differences. Inf. Process. Manage., vol. 25, pp. 237-251 (1989)
7. DeVellis, R.: Scale Development. Sage, Newbury Park, California (2003)
8. Dillon, A., Watson, C.: User analysis in HCI:the historical lessons from individual
differences research. Int. Journal of Human-Computer Studies, vol. 45, pp. 619-637 (1996)
9. Fenichel, C.H.: Online searching: Measures that discriminate among users with different
types of experiences. JASIS, vol. 32, pp. 23-32 (1981)
10. Freund, L., Toms, E.G.: Revisiting informativeness as a process measure for information
interaction. In: Proc. WISI Workshop of SIGIR '07 , pp. 33-36. (2007)
11. Hall, M.M., Toms, E.G.: Building a common framework for IIR evaluation. Information
Access Evaluation. Multilinguality, Multimodality, and Visualization, pp. 17-28. (2013)
12. Hall, M.M., Villa, R., Rutter, S.A., Bell, D., Clough, P., Toms, E.G.: Sheffield submission
to the chic interactive task: Exploring digital cultural heritage. In: Proc. CLEF '2013. (2013)
13. Hyder, J.: Proposal of a Website Engagement Scale and Research Model: Analysis of the
Influence of Intra-Website Comparative Behaviour. PhD Thesis,University of Valencia (2010)
14. Kelly, D.: Methods for evaluating interactive information retrieval systems with users.
Foundations and Trends in Information Retrieval, vol. 3, pp. 1-224 (2009)
15. Manning, C.D., Raghavan, P., Schütze, H.: Introduction to information retrieval.
Cambridge university press Cambridge (2008)
16. O'Brien, H.L., Toms, E.G.: The development and evaluation of a survey to measure user
engagement. JASIST, vol. 61, pp. 50-69 (2010)
17. O’Brien, H.L., Toms, E.G.: Examining the generalizability of the User Engagement Scale
(UES) in exploratory search. Info. Proc. & Mgmt, vol. 49, pp. 1092-1107 (2013)
18. Reise, S.P., Waller, N.G., Comrey, A.L.: Factor analysis and scale revision. Psychological
assessment, vol. 12, pp. 287 (2000)
19. Su, L.T.: Special Issue: Evaluation Issues in Information Retrieval Evaluation measures for
interactive information retrieval. Info. Proc. & Mgmt, vol. 28, pp. 503-516 (1992)
20. Tague-Sutcliffe, J.: Measuring information : an information services perspective. Academic
Press, San Diego ; London (1995)
21. Teevan, J., Liebling, D.J., Geetha, G.R.: Understanding and predicting personal navigation.
Proc. Int. Conf. Web search and data mining, pp. 85-94. ACM, Hong Kong, China (2011)
22. Toms, E.G., Villa, R., McCay-Peet, L.: How is a search system used in work task
completion? Journal of information science, vol. 39, pp. 15-25 (Feb. 2013)
23. Ward Jr, J.H.: Hierarchical grouping to optimize an objective function. Journal of the
American statistical association, vol. 58, pp. 236-244 (1963)
24. White, R.W., Drucker, S.M.: Investigating behavioral variability in web search.
Proceedings of the 16th Int. Conf. WWW, pp. 21-30. ACM, Banff, Alberta, Canada (2007)
25. Yuan, W., Meadow, C.T.: A study of the use of variables in information retrieval user
studies.JASIS, vol. 50, pp. 140-150 (1999)