the relationship of organizational culture and …
TRANSCRIPT

THE RELATIONSHIP OF ORGANIZATIONAL CULTURE AND MANAGERIAL
LEADERSHIP
A Dissertation
Submitted to the Graduate Faculty
of the
North Dakota State University
of Agriculture and Applied Science
By
Heidi Helen Heim Larson
In Partial Fulfillment of the Requirements
for the Degree of
DOCTOR OF PHILOSOPHY
Major Program:
Education
Option: Institutional Analysis
July 2016
Fargo, North Dakota

North Dakota State University
Graduate School
Title THE RELATIONSHIP OF ORGANIZATIONAL
CULTURE AND MANAGERIAL LEADERSHIP
By
Heidi Helen Heim Larson
The Supervisory Committee certifies that this disquisition complies with North Dakota
State University’s regulations and meets the accepted standards for the degree of
DOCTOR OF PHILOSOPHY
SUPERVISORY COMMITTEE:
Dr. Brent Hill
Chair
Dr. Tim O. Peterson
Dr. Claudette Peterson
Dr. Tom E. Hall
Approved:
7/27/16 Dr. William Martin
Date Department Chair

iii
ABSTRACT
The purpose of this research is to examine the relationship of managerial leadership and
organizational culture based on the integration of the two culture theories of Grid and Group
Competing Values Framework (Hierarchy, Market, Adhocracy and Clan Culture types), and the
managerial leadership theory Full Range Leadership model (Transformational and Transactional
Leadership behaviors). The study methods were comprised of a quantitative web based survey
research with a convenience sample of an organization. The data was analyzed with Canonical
Correlation as well as exploratory data analysis. The findings supported the relationship of
Group and Clan cultures and Transformational leadership behaviors. More specifically, there
was a relationship of Clan culture and Transformational leadership behaviors of Intellectual
Stimulation, Idealized Influence, and Individualized Consideration. There was also support for
Grid and Market culture and Transactional leadership behaviors. Market culture was specifically
associated with Transformational Leadership behavior of Management by Exception. The
unexpected findings were the relationship of Contingent Reward Transactional behavior and
Market culture and the relationship of Group culture to Adhocracy culture. Overall, the finding
of the research supported the relationship and integration of the culture theories of Grid and
Group and Competing Values Framework and Transactional and Transformational Managerial
Leadership behaviors of the Full Range Leadership Model.

iv
DEDICATION
This dissertation is dedicated to my family; husband-Corey, children-Megan, Jarron and Ryan
who grew tired of me always working on my school work, and much appreciation to my parents-
Irene and Maurus, sister-Amie, who were always willing to help with the kids at a moment’s
notice, brothers- Doug and Jeff that entertained the kids at the farm, and my in-laws-Diana, Don,
and uncle Kevin that helped care for the kids in the summer at the lake while I was writing.
I also dedicate this to my Advisor, Dr. Brent Hill (methodological expert), wife, Kim and newest
member of their family that joined them the day following the defense. Thank you to my
committee Dr. Tim O. Peterson (managerial leadership expert), Dr. Claudette Peterson (adult
learning expert), and Dr. Tom E. Hall (educational leadership expert).

v
TABLE OF CONTENTS
ABSTRACT ................................................................................................................................... iii
DEDICATION ............................................................................................................................... iv
LIST OF TABLES ......................................................................................................................... xi
LIST OF FIGURES ..................................................................................................................... xvi
CHAPTER I: INTRODUCTION ................................................................................................... 1
Statement of the Problem .................................................................................................... 3
Purpose of the Study ........................................................................................................... 3
Research Questions ............................................................................................................. 4
Assumptions, Limitations, and Delimitations ..................................................................... 5
Assumptions ............................................................................................................ 5
Limitations .............................................................................................................. 5
Delimitations ........................................................................................................... 5
Operational Definitions ....................................................................................................... 6
Significance of the Study .................................................................................................... 6
Organization of the Remainder of the Study ...................................................................... 7
CHAPTER II: LITERATURE REVIEW ...................................................................................... 8
Theoretical Framework ....................................................................................................... 9
Organizational Culture ............................................................................................ 9
Structural Functionalism ....................................................................................... 11
Dimensions of culture: Douglas’ Grid and Group. ................................... 14
Group dimension (high, low) ........................................................ 14
Grid dimension (high, low) ........................................................... 15
The four cultural types .................................................................. 15
vi
Competing Values Framework ............................................................................. 18
Culture types of the Competing Values Framework................................. 19
Managerial Leadership.......................................................................................... 21
Definitions................................................................................................. 21
Theories..................................................................................................... 22
Management and leadership behaviors ..................................................... 24
Transactional/transformational behaviors ..................................... 24
Comparison and Integration of Theoretical Models ......................................................... 27
Comparison of Model Dimensions ....................................................................... 29
Comparison of Cultural Typologies and Integration of Managerial Leadership .. 31
Individualist and Adhocracy culture ......................................................... 31
Collectivist and Clan culture ..................................................................... 32
Market and Bureaucratic culture ............................................................... 33
Hierarchy and Corporate culture ............................................................... 34
Conclusion from the Literature ......................................................................................... 35
CHAPTER III: METHODS ......................................................................................................... 37
Research Questions ........................................................................................................... 37
Sample............................................................................................................................... 38
Procedures and Data Collection ........................................................................................ 38
Data Cleaning and Correction ........................................................................................... 39
Instruments ........................................................................................................................ 40
Social Game Assessment Tool (Modified) ........................................................... 40
Organizational Culture Assessment Instrument .................................................... 41
Multifactor Leadership Questionnaire 5x Rater Form .......................................... 42

vii
Data Analysis .................................................................................................................... 43
CHAPTER IV: RESULTS ........................................................................................................... 45
Data Collection and Demographics .................................................................................. 46
Data Manipulation ............................................................................................................ 47
Computing the Full Range Composite Scores (MLQ 5X) ................................... 47
Computing the Grid and Group Composite Scores (SGAT) ................................ 48
Computing the Competing Values Composite Scores (OCAI) ............................ 48
Parametric Assumptions ................................................................................................... 49
General Descriptive Statistics ........................................................................................... 49
Findings Relevant to Research Question 1a ..................................................................... 52
Bivariate Correlations ........................................................................................... 52
Canonical Correlation Analysis ............................................................................ 53
Canonical variates ..................................................................................... 54
Redundancy analysis. ................................................................................ 55
Findings Relevant to Research Question 1b ..................................................................... 56
Bivariate Correlations ........................................................................................... 56
Canonical Correlation Analysis ............................................................................ 57
Canonical variates ..................................................................................... 57
Redundancy analysis. ................................................................................ 59
Findings Relevant to Research Question 2 ....................................................................... 59
Bivariate Correlations ........................................................................................... 60
Canonical Correlation Analysis ............................................................................ 63
Transformational and Transactional Leadership factors (combined)
and Grid and Group .................................................................................. 63
Canonical variates ......................................................................... 65
viii
Redundancy analysis ................................................................................. 66
Transformational Leadership factors and Grid and Group ....................... 67
Canonical variates ......................................................................... 67
Redundancy analysis ..................................................................... 69
Transactional Leadership factors and Grid and Group ............................. 69
Canonical variates ......................................................................... 69
Redundancy analysis ..................................................................... 71
Findings Relevant to Research Question 3a ..................................................................... 71
Bivariate Correlations ........................................................................................... 71
Canonical Correlation Analysis ............................................................................ 76
Transformational and Transactional Leadership factors (combined)
and Competing Values (Preferred) ........................................................... 76
Canonical variates ......................................................................... 76
Redundancy analysis ..................................................................... 78
Transformational Leadership factors and Competing Values
(Preferred) ................................................................................................. 78
Canonical variates ......................................................................... 79
Redundancy analysis ..................................................................... 81
Transactional Leadership factors and Competing Values (Preferred) ...... 81
Canonical variates ......................................................................... 82
Redundancy analysis ..................................................................... 84
Findings Relevant to Research Question 3b ..................................................................... 84
Bivariate Correlations ........................................................................................... 85
Canonical Correlation Analysis ............................................................................ 91

ix
Transformational Leadership factors (Combined) and Competing
Values (Now) ............................................................................................ 91
Canonical variates ......................................................................... 91
Redundancy analysis ..................................................................... 93
Transformational Leadership factors and Competing Values (Now) ....... 93
Canonical variates ......................................................................... 93
Redundancy analysis ..................................................................... 96
Transactional Leadership factors and Competing Values (Now) ............. 96
Canonical variates ......................................................................... 96
Redundancy analysis ..................................................................... 98
CHAPTER V: DISCUSSION ...................................................................................................... 99
Method Summary............................................................................................................ 100
Discussion of Significant Findings Regarding the Proposed Theory
Integration ........................................................................................................... 101
Analysis of the Relationship of Competing Values and Grid and Group
Models................................................................................................................. 102
Implications for adult education ............................................................. 104
Implications for business/organizational analysis .................................. 104
Analysis of the Relationship of Grid and Group and Full Range Leadership
Model .................................................................................................................. 104
Implications for adult education ............................................................. 106
Implications for business/organizational analysis .................................. 107
Analysis of the Relationship of Competing Values and Full Range
Leadership Model ............................................................................................... 107
Implications for business/organizational analysis .................................. 110
Conclusion ...................................................................................................................... 112

x
REFERENCES ........................................................................................................................... 115
APPENDIX A: INSTRUMENT MOCK UP ............................................................................. 126
APPENDIX B: IRB APPROVAL DOCUMENT FROM NDSU ............................................. 137
APPENDIX C: PERMISSION TO USE MLQ INSTRUMENT ............................................... 138

xi
LIST OF TABLES
Table Page
1. Reported Cronbach Alpha Reliabilities for the OCAI ...................................................... 42
2. Cronbach Alpha Reliabilities for the Subscales of the MLQ 5X...................................... 43
3. Demographics: Gender and Educational Background ...................................................... 47
4. Demographics: Age and Length of Employment ............................................................. 47
5. MLQ 5X Items Used for Full Range Leadership Factors ................................................. 48
6. Descriptive Statistics for Social Games Subscales (Grid and Group) .............................. 50
7. Descriptive Statistics for the OCAI “Preferred” Subscales (Competing Values)............. 50
8. Descriptive Statistics for the OCAI “Now” Subscales (Competing Values) .................... 50
9. Descriptive Statistics for the MLQ 5X Subscales (Full Range Leadership) .................... 50
10. Frequencies of the Grid and Group Culture Types ........................................................... 51
11. Frequencies of the OCAI Culture Types (Now) ............................................................... 51
12. Frequencies of the OCAI Culture Types (Preferred) ........................................................ 52
13. Correlations for Grid/Group and Competing Values (Preferred) Composite Scores ....... 53
14. Summary of Canonical Variate Interpretations ................................................................ 54
15. Loadings for the Grid and Group Canonical Variates ...................................................... 55
16. Loadings for the Competing Values (Preferred) Canonical Variates ............................... 55
17. Redundancy Analysis for the Grid and Group Variables with the Competing Values
(Preferred) Canonical Variates (V1 and V2)...................................................................... 55
18. Redundancy Analysis for the Competing Values (Preferred) Variables with the Grid
and Group Canonical Variates (U1 and U2) ...................................................................... 55
19. Correlations for Grid/Group and Competing Values (Now) Composite Scores .............. 57
20. Summary of Canonical Variate Interpretations ................................................................ 58
21. Loadings for the Grid and Group Canonical Variates ...................................................... 58
22. Loadings for the Competing Values (Now) Canonical Variates ...................................... 59

xii
23. Redundancy Analysis for the Grid and Group Variables with the Competing Values
(Now) Canonical Variates (V1 and V2) ............................................................................. 59
24. Redundancy Analysis for the Competing Values (Now) Variables with the Grid and
Group Canonical Variates (U1 and U2) ............................................................................. 59
25. Correlations for Grid/Group and the Full Range Leadership Model combined factors
for Transformational and Transactional Composite Scores .............................................. 62
26. Correlations for Grid/Group and Full Range Leadership Model for Transformational
Leadership ......................................................................................................................... 64
27. Correlations for Grid/Group and Full Range Model for Transactional Leadership ......... 65
28. Summary of (Rotated) Canonical Variate Interpretations ................................................ 65
29. Loadings for the Grid and Group Canonical Variates (Rotated) ...................................... 66
30. Loadings for the Full Range Leadership (Combined factors) Canonical Variates
(Rotated) ........................................................................................................................... 66
31. Redundancy Analysis for the Grid and Group Variables with the Full Range
Leadership (Combined Factors) Canonical Variates (V1 and V2) .................................... 66
32. Redundancy Analysis for the Full Range Leadership (Combined factors) Variables
with the Grid and Group Canonical Variates (U1 and U2) ................................................ 66
33. Summary of Canonical Variate Interpretations ................................................................ 68
34. Loadings for the Grid and Group Canonical Variates ...................................................... 68
35. Loadings for the Transformational factors (Full Range Leadership) Canonical
Variates ............................................................................................................................. 68
36. Redundancy Analysis for the Grid and Group Variables with the Transformational
factors (Full Range Leadership) Canonical Variates (V1 and V2) .................................... 68
37. Redundancy Analysis for the Transformational factors (Full Range Leadership)
Variables with the Grid and Group Canonical Variates (U1 and U2) ............................... 69
38. Summary of Canonical Variate Interpretations ................................................................ 70
39. Loadings for the Grid and Group Canonical Variates ...................................................... 70
40. Loadings for the Transactional Factors (Full Range Leadership) Canonical Variates ..... 70
41. Redundancy Analysis for the Grid and Group Variables with the Transactional
Factors (Full Range Leadership) Canonical Variates (V1 and V2) ................................... 70

xiii
42. Redundancy Analysis for the Transactional Factors (Full Range Leadership)
Variables with the Grid and Group Canonical Variates (U1 and U2) ............................... 71
43. Correlations for Competing Values (Preferred) and the Full Range Leadership Model
Composite Scores.............................................................................................................. 74
44. Correlations for Competing Values (Preferred) Composite Scores and Full Range
Model Transformational Composite scores ...................................................................... 75
45. Correlations for Competing Values (Preferred) Composite Scores and Full Range
Model Transactional Composite scores ............................................................................ 76
46. Summary of Canonical Variate Interpretations ................................................................ 77
47. Loadings for the factors (Combined) for Transactional and Transformational
Leadership Canonical Variates ......................................................................................... 77
48. Loadings for the Competing Values (Preferred) Canonical Variates ............................... 78
49. Redundancy Analysis for the factors (Combined) for Transactional and
Transformational Leadership Variables with the Competing Values (Preferred)
Canonical Variates (V1 and V2) ........................................................................................ 78
50. Redundancy Analysis for the Competing Values (Preferred) Variables with the
factors (Combined) for Transactional and Transformational Leadership Canonical
Variates (U1 and U2) ......................................................................................................... 78
51. Summary of Canonical Variate Interpretations ................................................................ 80
52. Loadings for the Competing Values (Preferred) Canonical Variates ............................... 80
53. Loadings for the Transformational Leadership Canonical Variates ................................. 80
54. Redundancy Analysis for the Competing Values (Preferred) Variables with the
Transformational Leadership Canonical Variates (V1 and V2)......................................... 81
55. Redundancy Analysis for the Transformational Leadership Variables with the
Competing Values (Preferred) Canonical Variates (U1 and U2) ....................................... 81
56. Summary of Canonical Variate Interpretations ................................................................ 83
57. Loadings for the Competing Values (Preferred) Canonical Variates ............................... 83
58. Loadings for the Transactional Leadership Canonical Variates ....................................... 83
59. Redundancy Analysis for the Competing Values (Preferred) with the Transactional
Leadership Canonical Variates (V1 and V2) ..................................................................... 83

xiv
60. Redundancy Analysis for the Transactional Leadership Variables with the
Competing Values (Preferred) Canonical Variates (U1 and U2) ....................................... 84
61. Correlations for Competing Values Now Composite Scores and Full Range Model
Composite scores .............................................................................................................. 88
62. Correlations for Competing Values Now Composite Scores and Full Range Model
Transformational Composite Scores ................................................................................. 89
63. Correlations for Competing Values Preferred Composite Scores and Full Range
Model Transactional Composite scores ............................................................................ 90
64. Spearman Correlations for Competing Values (Now) Composite Scores and Full
Range Model Composite Scores ....................................................................................... 90
65. Summary of (Rotated) Canonical Variate Interpretations ................................................ 92
66. Loadings for the factors (Combined) for Transformational and Transactional
Leadership Canonical Variates (Rotated) ......................................................................... 92
67. Loadings for the Competing Values (Now) Canonical Variates (rotated) ....................... 92
68. Redundancy Analysis for the factors (Combined) for Transformational and
Transactional Leadership Variables with the Competing Values (Now) Canonical
Variates (V1 and V2) ......................................................................................................... 92
69. Redundancy Analysis for the Competing Values (Now) Variables with the factors
(Combined) for Transformational and Transactional Leadership Canonical Variates
(U1 and U2) ........................................................................................................................ 93
70. Summary of Canonical Variate Interpretations ................................................................ 94
71. Loadings for the Competing Values (Now) Canonical Variates ...................................... 95
72. Loadings for the Transformational Canonical Variates .................................................... 95
73. Redundancy Analysis for the Competing Values (Now) Variables with the
Transformational Canonical Variates (V1 and V2) ........................................................... 95
74. Redundancy Analysis for the Transformational Variables with the Competing Values
(Now) Canonical Variates (U1 and U2) ............................................................................. 95
75. Summary of Canonical Variate Interpretations ................................................................ 97
76. Loadings for the Competing Values (Now) Canonical Variates ...................................... 97
77. Loadings for the Transactional Canonical Variates .......................................................... 98

xv
78. Redundancy Analysis for the Competing Values (Now) Variables with the
Transactional Canonical Variates (V1 and V2) ................................................................. 98
79. Redundancy Analysis for the Transactional Variables with the Competing Values
(Now) Canonical Variates (U1 and U2) ............................................................................. 98

xvi
LIST OF FIGURES
Figure Page
1. Grid and Group model of culture (Harris, 2005). ............................................................. 18
2. Competing Values Framework (adapted from Cameron & Quinn, 2011)........................ 19
3. Integration of models (Grid and Group, Competing Values, Full Range Leadership). .... 29
4. Matrix of scatterplots for Grid and Group composite scores and the Competing
Values (Preferred) composite scores. ............................................................................... 52
5. Matrix of scatterplots for Grid and Group composite scores and the Competing
Values (Now) composite scores........................................................................................ 56
6. Matrix of scatterplots for Grid and Group composite scores and the Full Range
Leadership Model combined factors for Transformational and Transactional
composite scores. .............................................................................................................. 60
7. Matrix of scatterplots for Grid and Group composite scores and the Transformational
Factors of the Full Range Leadership Model. ................................................................... 61
8. Matrix of scatterplots for Grid and Group composite scores and Full Range Model
Transactional scores. ......................................................................................................... 62
9. Matrix of scatterplots for Grid and Group composite scores and the Full Range
Leadership Model (combined) factors for Transformational and Transactional
composite scores. .............................................................................................................. 72
10. Matrix of scatterplots for Competing Values Preferred composite scores and Full
Range Model Transformational scores. ............................................................................ 73
11. Matrix of scatterplots for Competing Values Preferred composite scores and Full
Range Model Transactional scores. .................................................................................. 74
12. Matrix of scatterplots for Competing Values Now composite scores and Full Range
Model combined factors for Transformational and Transactional Composite scores. ..... 85
13. Matrix of scatterplots for Competing Values Now composite scores and Full Range
Model Transformational scores. ....................................................................................... 86
14. Matrix of scatterplots for Competing Values Now composite scores and Full Range
Model Transactional scores. ............................................................................................. 87

1
CHAPTER I: INTRODUCTION
Historically, the importance of culture and leadership can be traced throughout human
history. There are a number of different definitions offered for leadership and culture, and this
gives a sense that there is not clear articulated agreement on the meaning or the relationship. The
terms culture and civilization were often used interchangeably in early accounts in the social
science fields (Cahnman, 1962; Kroeber & Kluchhohn, 1952). The initial interest and the
description of culture and leadership was referred to as the life-ways (Kroeber & Kluchhohn,
1952) or folk-ways (Sumner, 2007/1906) of people. The managerial leadership or culture of an
organization is often credited with the success or failure of the organization. The interest in
leadership, management, and culture became particularly evident in the 1980’s with a focus on
organizational or corporate culture (Alvesson, 1990; Cameron & Quinn, 2011). Today, the
attention to culture and leadership in organizations has continued to flourish. In order to remain
competitive, businesses in the United States annually invest billions on leadership training
(Meinert, 2014). The emphasis on these topics will likely not dissipate anytime soon since there
appears to be a lack of leadership skills in organizations (Stallard, 2014). Furthermore, the
significant financial investment by organizations in leadership training is expected to continually
increase in the coming years (Meinert, 2014).
The relationship between culture and leadership is supported by organizational theories
(Bass & Avolio, 1993; Schein, 1985). Culture theories are based upon values, symbolism, and
norms of an organization (Alvesson, 1990), and culture is referred to as the “glue” of the
organization (Alvesson, 1990; Cameron & Quinn, 2011; Smircich, 1983). Leadership theories
are based on traits, behaviors, contingencies, and attributions (Northouse, 2007; Trice & Beyer,
1993). In the literature, leadership and culture are often viewed independently. Nevertheless, in

2
the research that examines each of them autonomously there is still a sense that they do not occur
in a vacuum (Hunt & Dodge, 2000; Porter & McLaughlin, 2006).
The theories of organizational culture and managerial leadership are analyzed through
different models. Structural-functionalism is an anthropological foundational theory developed
from the work of Durkheim (Salzman, 2001). Individualism is based on the concept of looking
for oneself and Collectivism is where individuals are very dependent upon one another
(Hofstede, Hofstede, & Minkov, 2010). Douglas (2007/1970) developed a social framework
(Grid and Group) to view culture constructed on these concepts. This framework is centered on
the tension between the values and social structures in society. Another analysis of culture was
developed by Cameron and Quinn (2011) to view culture through the lens of competing values
of effectiveness in an organization. This interpretation is based on the contrast of four different
theories (open systems, human relations, internal process, and rational goal theories). This
model views culture as a tension between what is held as important in the organization. By
learning about what is valued in the organization, the managerial leadership behaviors could be
matched to the dimensions.
Over the last hundred years, leadership theories have moved from trait theories to
behavioral theories. There has been an abundant interest in transformational leadership (Dinh, et
al., 2014; Hartnell & Walumbwa, 2011). Not all models explained leadership well, so a model
based on transformational leadership was developed to explain the way a leader transforms
followers (Chemers, 1997). Transformational leadership is a dimension Full Range Leadership
Model along with transactional leadership and laissez-faire leadership (Antonakis, Avolio, &
Sivasubramaniam, 2003; Avolio & Bass, 2004). Transformational and transactional leadership
are strongly related to performance in organizations (Avolio & Bass, 2004; McCleskey, 2014).

3
There are specific behaviors that describe Transactional and Transformational leadership (Avolio
& Bass, 2004).
Statement of the Problem
Improvements in the organization of labor can increase productivity in a business
(Hubbard & O’Brien, 2015). As businesses work to become more competitive and improve
technology to become more productive, effective management, leadership, and organizational
culture are often viewed as avenues for success in these organizations. This interest is evident by
the thousands of books available on the topics of management, leadership and corporate culture
found on bookshelves, the number of research articles on the topics, and the investments by
industry to improve culture and leadership in organizations. Despite the vast amounts of
information and resources focused on leadership and culture and their connection, the
relationship is not succinctly defined. In addition, there is no established single instrument to
measure leadership and culture collectively (Northouse, 2007).
Purpose of the Study
The purpose of the proposed study is to empirically examine the relationship of culture
and managerial leadership behaviors based on the Competing Values Model, Grid and Group,
and the Full Range Leadership Model in an organization located in the Midwest of the United
States. This study will view the dimensions of culture through values and social structure in
order to determine if there is a relationship to leadership style or behaviors (specifically
Transformational and Transactional Leadership). The result of the integration of these models
could create insight into the relationship of culture and managerial leadership in organizations.

4
Research Questions
The three research questions are designed to investigate the relationship of the Grid and
Group Model, the Competing Values Model, and the Full Range Leadership Model. The study is
a quantitative web based survey distributed via email. The results will be collected with the
survey in Qualtrics and analyzed for the relationships identified in the following research
questions:
1a. What are the quantitative relationships among the dimensions identified by the Grid
and Group Theory and the Competing Values Framework (Preferred) as measured by
the Social Game Assessment Tool and Organizational Culture Assessment Instrument
respectively?
1b. What are the quantitative relationships among the dimensions identified by the Grid
and Group Theory and the Competing Values Framework (Now) as measured by the
Social Game Assessment Tool and Organizational Culture Assessment Instrument
respectively?
2. What is the relationship among the dimensions identified by the Full Range
Leadership Model and the Grid and Group Theory as measured by the Multifactor
Leadership Questionnaire 5X Rater Instrument and the Social Game Assessment Tool
respectively?
3a. What is the relationship among the dimensions identified by the Full Range
Leadership Model and the Competing Values Framework (Preferred) as measured by
the Multifactor Leadership Questionnaire 5X Rater Instrument and the Organizational
Culture Assessment Instrument respectively?

5
3b. What is the relationship among the dimensions identified by the Full Range
Leadership Model and the Competing Values Framework (Now) as measured by the
Multifactor Leadership Questionnaire 5X Rater Instrument and the Organizational
Culture Assessment Instrument respectively?
Assumptions, Limitations, and Delimitations
The following are assumptions, limitations, delimitations, and scope that were accepted
for this study.
Assumptions
1. It was assumed that the respondents were at the middle management level of the
organization and not the entire organization.
2. It was assumed the organization is successful based on growth in the areas of
expansion, production, and sales.
3. It was assumed that the participants understood the questions and answered them
honestly.
Limitations
1. The results of the study are only for this individual organization and may not
necessarily be transferred to other organizations limiting external validity.
2. The organization was in a rapid growth cycle at the time of the data collection which
could have an impact on the responses.
3. The sample size is relatively small and limited to the organization.
Delimitations
1. The participants were from one geographical location.

6
2. The responses gathered were limited to the questions relating to the Grid and Group,
Competing Values Framework, and Full Range Leadership model.
Operational Definitions
Culture: Determined by what organization values and is expressed by the symbols, rites,
and rituals of an organization (Trice & Beyer, 1993).
Organization: “any stable pattern of transaction between individuals or aggregations of
individuals” (Ouchi, 1980, p. 140)
Organizational Culture: organizational culture is often referred to as “the way we do
things around here” (Deal & Kennedy, 1982, p. 4). This is the look and feel of an organization.
Management: processes of planning, organizing and controlling in an organization in
order to produce “a degree of consistency in an organization” (Kotter, 1990, p. 4).
Leadership: “process that helps direct and mobilize people and/or their ideas” (Kotter,
1990, p. 3).
Significance of the Study
There is practical application for the findings of this research. Leadership training by
businesses is expected to continue increase and the result of this study will be particularly
beneficial to curriculum development for organizational leadership training. A better
understanding of the relationship of leadership and organizational culture could provide
information for the development and improvement of leadership training tools for organizations.
The knowledge gained from this study could also have an impact on increasing effectiveness and
performance of an organization.

7
Organization of the Remainder of the Study
Chapter II of the study provides the framework for the theoretical integration of the
models. Chapter III describes the planned study design, instrumentation, and data analysis
techniques. Once the data is analyzed, Chapter IV will provide the findings of the study and
Chapter V will describe the results, outcomes, applications, and an outline of recommendations
for further research.
8
CHAPTER II: LITERATURE REVIEW
In the literature, the relationship of the topics of organizational culture and leadership are
discussed (Bass & Avolio, 1993; Jones, 2005; Kotter, 1990; Sarros, Gray, & Denston, 2002;
Schein, 1985). Ironically, this relationship becomes particularly salient when considering the
research that attempts to examine each autonomously: There is a sense that they cannot be
meaningfully studied in isolation (Hunt & Dodge, 2000; Porter & McLaughlin, 2006). However,
there are several somewhat distinct viewpoints on this relationship of organizational culture and
leadership. For example, Schein (1985) stated that culture and leadership are “intertwined” (p.
316). Similarly, Bass and Avolio (1993) hold that the two exist in a state of dynamic interaction,
each continuously influencing and shaping the other. Other views on the relationship of culture
and leadership are more unidirectional in that either the leaders adapt to fit into the local culture
(Tsai, Wu, & Chung, 2009) or that leadership changes the culture to fit the leader’s vision (Trice
& Beyer, 1993). Leaders create a culture in an organization that fits the leader, and the culture
sets the boundaries for the change to occur.
To better understand these differing viewpoints on the relationship between leadership
and organizational culture, this paper will discuss, compare, and integrate relevant theoretical
perspectives. This will begin with the structural-functionalist paradigm as a general framework
for social organizations and culture. More specifically, special attention is given to Douglas’
Grid and Group model (a general theory from the fields of anthropology and sociology that deals
with organizational culture). In addition, the Competing Values Framework (also a theory of
organizational culture) and the managerial leadership (transformational and transactional
leadership behaviors) will be reviewed.

9
Theoretical Framework
The following section will expound upon the key concepts of culture (and organizational
culture in particular), and managerial leadership. These foundational concepts will facilitate later
discussions regarding Grid and Group, Competing Values Framework,
transformational/transactional leadership, and their integration.
Organizational Culture
Over the last century and a half, definitions of culture (and subsequently, organizational
culture) have emerged in the disciplines of social sciences, business, and education. Tylor is
credited as the first person to offer a systematic and concise definition of culture (in English) in
1871 (Cahnman, 1962; Kroeber & Kluchhohn, 1952; Morrill, 2008; Peterson, 1979). Tylor
(1871) began the first chapter of his book Primitive Culture by defining culture as “that complex
whole which includes knowledge, belief, art, morals, law, custom, and any other capabilities and
habits acquired by man as a member of society” (p. 1). Anthropologists Kroeber and Kluchhohn
(1952) noted that after 1871 there was a lag in interest in the topic of culture; in fact, they
identified only six other definitions of culture in the literature from 1871 until the 1920’s. After
the 1920’s, interest grew and the number of definitions cited for culture expanded to over 160
definitions by 1952 (Kroeber & Kluchhohn, 1952). These definitions varied in context to
included groups, expectations, behaviors, subcultures, historical concepts, symbols, norms and
values to name a few dimensions. After reviewing all 164 definitions of culture found in the
literature, Kroeber and Kluckhohn (1952) developed an integrated definition: “Culture is a
product; is historical; includes ideas, pattern, and values; is selective; is learned; is based upon
symbols; and is an abstraction from behavior and the product of behavior” (p.157). In particular,

10
many authors emphasize that culture is learned (Hofstede, Hofstede, & Minkov, 2010; Schein,
1985).
It was not until the 1980’s that interest in the study of culture in corporate organizations
became prevalent (Alvesson, 1990; Cameron & Quinn 2011). Ouchi (1980) defined an
organization as “any stable pattern of transaction between individuals or aggregations of
individuals” (p. 140). Robbins and Coulter (2014) further pointed out that rituals and symbols
are an important part of the mechanism by which employees learn culture in an organization. In
general, symbols are the things (both physical and non-physical) that have a shared meaning
within a cultural group (Ritzer, 2011). Schein (1985) distinguished the elements of culture into
three levels: artifacts, espoused beliefs and values, and basic underlying assumptions. In
particular, the artifacts in a culture are the visible symbols that can be experienced, such as
architecture, behaviors, and rituals. Douglas (1986) described Durkheim’s view of the symbols
in society as the “sacred” ideas and objects—words, names, places, music, food, ideologies, and
icons (e.g., flags). Although such artifacts and symbols are visible, their meaning is not as
visible (Schein, 2010). Another related view describes the symbolic aspect of culture as that
which connects the conscious to the unconscious (Jenner, 2000). Furthermore, Batteau (2000)
asserted that that an organization does not develop until shared values, beliefs, and symbols are
levied by a group. Social organizations are developed in this process, and the conscious and
unconscious symbols are a measure of the values held by those in the organization.
In addition to symbols, theories of culture are also grounded in shared values and norms
(Alvesson, 1990). In terms of the culture of an organization, Deal and Kennedy (1999) hold that
values and beliefs are the cultural foundation and what is shared and accepted. They stated that
values and belief are “what we are all about, what we rally around even when things get tough”

11
(p. 4). Values and beliefs are viewed from an individual standpoint and a perspective that views
the organization as a whole. From an individual perspective, the values are what the individual
feels is right. Values are also viewed as an action or expression (Balken, 1998) and are related to
performance in an organization (Cameron & Quinn, 2011; Deal & Kennedy, 1999). Deal and
Kennedy (1982) found that companies that had a strong culture also had a well-developed and
deeply meaningful system of values. Values are celebrated in the symbolic rites and rituals of a
company and are reinforced by the leader.
Although the transition to a culture definition aimed at formal corporate organizations
was not until the 1980’s, the broad underlying elements of the earlier general definitions did not
dramatically change. Corporate organizational culture is often referred to as “the way we do
things around here” (Deal & Kennedy, 1982, p. 4). Schein (1985), a trailblazer in the work of
organizational culture and leadership, posed a much more rigorous definition of culture that
nevertheless embodied the earlier ideas of culture as patterned and is what is perpetuated by
members as to how to properly deal with problems as well as how to feel about the problems.
Structural Functionalism
Numerous useful theories and models dealing with organizations and culture are viewed
through the paradigm of structural functionalism. The theories based on structural functionalism
explain how social systems work and attempt to reach stability. In general, structural
functionalism focuses on the relationships among the various components of a society (or any
cohesive social organization) as well as the particular roles and purposes of those components
(Ritzer, 2010). The stability of the organization is dependent on such demands as protection,
constancy in messages, authority, policy, and overall goals within the organization (Selznick,
1948). Durkheim viewed social systems as units, how the units function as a whole, and how

12
they specialized (Kuper, 1985). Organizational growth and specialization causes a division of
labor (Ritzer, 2010). The division of labor is a result of a need for organization (Turner, 2013).
Durkheim conceived the concepts of collective conscious and the division of labor (Ritzer &
Stepnisky, 2013). Turner, Beeghley, and Powers (2012) agreed with Durkheim that people are
born in to the culture and it is what controls their perceptions, behaviors and actions based on the
cultural norms of the social system. From a structural functional viewpoint, each system
performs a function in society that creates balance in the system, such that the system becomes
more specialized. The growth and change of specialization can create an imbalance, and the
system work towards normalization and homeostasis.
Durkheim’s structural-functionalist framework is based upon a continuum that defines
the mode of social cohesion or solidarity (Ritzer, 2011). The two opposing positions of this
continuum are mechanical solidarity and organic solidarity. Turner, Beeghley, and Powers
(2012) described Durkheim’s typology of mechanical solidarity as a high Collective Conscience
(culture) for the descriptive variables of volume, intensity and determinateness and a low
collective conscience (culture) relationship for these variables in organic solidarity. The organic
culture exhibits decentralized decision making and participation in the decision process is
encouraged which can result in blurring the levels of analysis. A mechanistic culture is
bureaucratic in orientation featuring hierarchies and controls that function better in a stable
environment (Bass, 1996). The view of Durkheim was that the collective conscious is more
valued in a mechanical society and has less of an effect on an organic society where there is a
division of labor (Ritzer & Stepnisky, 2013). Organic cultures are less rigid and open to new
experiences, which are a better fit for transformational leadership and are more effective in an
unstable environment. Similarly, a transformational culture is characterized by a flexible,

13
organic, and open culture focused on the vision of the organization. Teamwork and creativity
are promoted in the culture (Bass, 1996).
Individualism-Collectivism is a continuum based on adaptation, growth, geography and
economics (Allik & Realo, 2004; Hofstede et al., 2010). This is a dimensional view of culture
wherein individualistic societies place the needs of the individual before the needs of the group.
The individualistic society is loosely connected and the expectation is that everyone looks out for
oneself. On the other dimensional plane, collectivist societies are integrated and dependent on
each other and make decisions for the good of the group (Hofstede et al., 2010). These
dimensions also explain conflict based on beliefs (Form, 1975). Durkheim (1933/1947), in the
Division of Labor described organic and mechanical solidarity in individualistic and
collectivistic societies. A society or social organization characterized by individualistic organic
solidarity has a clear division of labor where individuals and subgroups have differentiated roles
and responsibilities (i.e., people tend to have specializations). In contrast, a collectivistic
mechanistic society or organization is characterized by the homogeneity of the roles and
responsibilities of each individual (Durkheim, 1933/1947). The division of labor keeps the
individualistic societies in order (Allik & Realo, 2004).
There are conflicting points of view for Durkheim’s notion of growth as a movement
towards individualism. The counterpoint is that social capital growth is building a consensus of
working for a common goal and giving up individualism and there is a distinct movement
towards collectivism (Allik & Realo, 2004). In this case individuals with similar norms will
group together, and over time the individual norm will become the norm for the group (Avolio &
Bass, 1995; Katzenbach & Smith, 1993). Lewellen (1993) postulated that sometimes the culture
of individualism may not match the economic system which can stagnate the function of society.

14
Earley and Gibson (1998) proposed that the paradigm is situation specific and an individual can
display individualistic or collectivistic behaviors depending on the situation. The individualism-
collectivism distinction can also be incorporated into the context of culture and leadership.
Killick (2009) made an observation of Amazonian tribes. Although autonomous, they follow a
leader that offers an exchange of government school as well as follow a leader in a crisis. The
important point is that in an individualistic culture, there is a willingness to move towards a
collectivistic activity as long as the activity, such as education in this case, is valued.
Dimensions of culture: Douglas’ Grid and Group. Culture is an integral aspect of the
entire social system of an organization. Mary Douglas (2011/1982) developed a typology to view
culture that was essentially an operationalization of Durkheim’s structural-functionalist concepts
of social systems. The view of Douglas (2007/1970) was that a classification system develops
from social relations. When the social forces are strong, there is stability in the organization.
She viewed this classification framework as stable as long as there are not external forces that
could cause change to the system. The other aspect she described reflected the demands on the
individual. This view developed a concept of the Grid and Group structured typology that
exemplified the state of the individual and of the classification or structure of the system. The
typology demonstrated the impact of the group and individual interactions as well as the social
preferences. By implementing this typology, there are patterns and trends of social interactions
and behaviors that emerge in the systems that are mapped that denote (social) organization
(Douglas, 2011/1982). Lockhart (2001) postulated that in the Grid and Group model, all four
cultures are present in society in varying degrees.
Group dimension (high, low). The group dimension denotes the forces on individuality
or the level the individual belongs to a group (Harris, 2005). This dimension is supported by the

15
social science dimensions of individualism (low group) and contrasting collectivism
(Mamadouh, 1999). A high group society is not concerned about the individual and is
exemplified by membership criteria for the group. The goal of a high group organization is
concerned with the continuation of the organization and the survival of the group overshadows
the survival of the individuals (Harris, 2005). In a strong group organization there is no distinct
separation from work and social (Douglas, 2011/1982). In a weak group organization, there is
little concern with group activities and the individuals are only concerned for themselves (Harris,
2005).
Grid dimension (high, low). The grid is the dimension of the structure or rules that
controls the individual. It is the prescription for what is socially acceptable (Mamadouh, 1997).
In a high grid, the strong classification system keeps individuals apart and controls their relations
(Douglas, 2011/1982). The individual is under the control of others and dominated by rules and
restrictions and roles are distinct. Leadership power is centralized and exemplified by position
(Harris, 2005). At the extreme low grid these rules are no longer present and the individual is
more prone to external influences (Douglas, 2011/1982). A low grid exemplifies individual
independence with relaxed rules and minimal role distinctions. The decentralized leadership
power in a weak grid is found to be personal, granted by the individuals, and earned over time
(Harris, 2005). According to Douglas (2011/1982) society will move from a high grid towards
the low grid dimension as there is increased value placed on the individual.
The four cultural types. The Grid and Group dimension outline 4 culture types in each
of the quadrants based on Douglas’ model. A culture that is defined as a weak grid and a weak
group is defined as an Individualist culture. This culture is characterized by few rules that
govern, and there is independence. The Individualist culture is not restricted by rules and

16
competitiveness exists. In this culture, the individual is willing to take risks for gain and there is
no value placed on the continuation of the organization. The social game of the culture type is
“Individualism” (Harris, 2005, p. 41). Innovation is rewarded in this culture type (Douglas,
2011/1982). In addition, the individuals can make their own decisions and failure is blamed on
the individual (Mamadouh, 1999). This culture type is also accepting of individual differences
(Wildavsky, 1987).
A culture that is a strong grid and weak group is defined as a Bureaucratic culture.
Harris (2005) described this culture type as a hierarchal system where there is limited
socialization in the institution. In this culture, there is little autonomy or potential advancement.
The social game is “authoritarianism” (p. 41). There is compliance to rules and individuals have
little input in the formation of goals for the organization. Mamadouh (1999) points out that in
this culture type the structure is what controls the individual and “fairness” for the individual is
not considered (p. 400). This is supported by the idea that decisions are imposed from the
external environment (Wildavsky, 1987).
A culture that is a strong grid and strong group is defined as a Corporate culture. Harris
(2005) described the social game in this culture type as “hierarchy.” In this culture, the focus is
on the collective group, leadership power is centralized, and there is a strong sense of rules and
controls. The group maintains the culture in a way that is in the best interest for the group and
traditions are important. Douglas (2007/1970) described the role of rituals as a priority in
celebrating the whole rather than the parts. This culture generates mistrust in the organization the
culture supports pressure to validate the rules (Mamadouh, 1999). This is supported by the idea
that the individual must sacrifice for the good of the whole (Wildavsky, 1987).

17
Harris (2005) described the weak grid strong group culture as a Collectivist culture and
the social game as “egalitarianism” (p. 41). The strong group places value on the norms and the
continuation of the group and there is a strong commitment to the group. The weak grid
influence does not value authority in this culture type and decision making is decentralized
Douglas (2011/1982) viewed this weak grid/strong group culture as the group having a barrier
against external forces as a result of the collectiveness. Relationships between members are a key
factor in this culture type and roles are not defined (Mamadouh, 1999). The culture type strives
for greater equality in society (Wildavsky, 1987).
Harris (2005) provided a more recent interpretation and application of the Grid and
Group typology within the context of the modern American school. Although this particular
treatment of the framework pertains to schools, these concepts can easily be generalized to most
any modern hierarchical organization (Spady & Marx, 1984, as cited in Deal & Peterson, 1990).
Harris felt that Douglas’ Grid and Group is a matrix that could be applied to schools to identify
the culture of the schools based on what is valued in the school setting. Figure 1 below depicts
the typology and the four culture prototypes based on the work of Douglas. The Grid and Group
are the forces and the culture type is represented within each quadrant. This typology views the
grid as the rules that individuals live by and the group depicts the value placed on collectivism.
The strong grid is where the rules and hierarchy are set in place, decisions come from the top,
and there are distinct roles. In a weak grid the roles are not defined. Characteristics of a strong
group are a strong connection in the group and to the institution. A weak group is defined by
individualism and little loyalty to the institution (Harris, 2005).

18
Figure 1. Grid and Group model of culture (Harris, 2005).
Competing Values Framework
The perception of effectiveness in an organization is based upon congruent values held
by those in the organization (Quinn & Cameron, 1983). Based on this premise, the Competing
Values typology was first developed by Quinn and Rohrbaugh (1983, 1981). The values of
organizational effectiveness were identified by a panel who reviewed a list of items that were
first recognized for organizational effectiveness in a study conducted by John Campbell. In the
context of competing values of organizational effectiveness, Quinn and Rohrbaugh (1983)
developed a framework for organizational analysis based on effectiveness and attributed to the
domain of organizational theories of open systems, human relations, internal process, and
rational goal models. The model was based on the scope of well-being and development,
organizational structure from stability to flexibility, and the set of values related to processes and
outcomes. The emerged four dimensional model encompassed the internal focused human

19
relations model (flexibility and people) in contrast to the externally focused rational goal model
(organizational control and effectiveness). The second opposing quadrants were the external
focused open systems model (flexibility and effectiveness) and internal process model (people
and control). The internal nature of the human relations model and internal process model is
focused on the people within the organization, which is in contrast to open systems and rational
goal model where the focus is on the organization and not the people (Quinn, 1991; Quinn &
Rohrbaugh, 1983, 1981). It is important to also note the open systems and rational goal share an
external focus, the human relations and internal process model share an internal focus, the human
relations and open systems share a prominence of flexibility, and the internal process and
rational goal model rely on controls (Quinn, 1991). The model was applied by Quinn to
organizational performance and managerial roles.
Figure 2. Competing Values Framework (adapted from Cameron & Quinn, 2011).
Culture types of the Competing Values Framework. Figure 2 depicts the Competing
Values model that was further developed and refined by Cameron and Quinn (2011) in a

20
framework based on four Culture types that are categorized by the values held in an organization.
The typology is based on 2 dimensions and four culture types. The internal attributes are
associated with Hierarchy and Clan culture types, and the external attributes are associated with
Market and Adhocracy culture types. Based on these culture types, the Organizational Culture
Assessment Instrument (OCIA) was developed by Cameron and Quinn (2011) as a tool for
evaluating organizational Culture. There is agreement by some that an organization is not
inclusively one culture type (Cameron & Quinn 1999; Wilkins & Ouchi, 1983), rather it is a
dimension of opposing value systems of effectiveness. Cameron and Quinn (2011) described
four culture types in the Competing Values Framework.
The Hierarchy culture archetype is portrayed as internally focused and described as
“procedures govern what people do” (Cameron & Quinn, 2011, p. 42; 1999, p. 58). The theories
of controls and efficiency are valued as effective and centralized power is dominant in a
Hierarchy culture. This culture type is often found in large stable bureaucratic organizations that
are well developed and specialized (Cameron & Quinn, 2011). Wilkins and Ouchi (1983)
postulated that bureaucracy culture will not be efficient if the control mechanisms are not in
place and employees do not feel they are being treated equitably or in an equitable manner.
The Market culture archetype is based on external transactions in organizations and
transactional costs are viewed as important. This culture is competitive and fixated on
productivity and reaching benchmarks. Similarly, Ouchi (1980) also described market cultures as
focused on transactions.
The externally focused Adhocracy culture dimension is described as creative and
adaptable (Cameron & Quinn, 2011; 1999). This culture type fosters innovation,
entrepreneurship, and vision in the organization. Power is decentralized and transferred

21
throughout a project promoting individuality. The flexibility of this archetype supports
“transformation” (Cameron & Quinn, 2011, p. 53).
The Clan culture is characterized as a tight knit group compared to a family where there
is a shared belief within the group (Cameron & Quinn, 2011; 1999). Teamwork is valued and
rewarded. The people that work in this type of an organization are very committed to the
organization and its traditions. Likewise, Wilkins and Ouchi (1983) characterized clan culture as
one that takes longer to cultivate and the goals are for the best interest of the group. Ouchi
(1980) compared Durkheim’s notion of organic solidarity of an occupational group to what he
determined to be a “clan” in that there is dependence on one another (p.136).
Managerial Leadership
Definitions. Similar to the previously discussed culture definitions, leadership also has
numerous and diverse definitions. When leadership is mentioned people intuitively have
different perceptions of a leader (Northouse, 2007, p. 2). Many view leaders as “heroic” (Deal &
Kennedy, 1982; Vecchio, 2007). A leader is associated with a vision (Avolio & Bass, 2004;
Kotter, 1988; Kouzes & Posner, 2007). In some instances, leadership was described as a
function of management (Robbins & Coulter, 2014), and others pointed out a significant
difference between leadership and management (Kotter, 1990, 1999; Yukl, 2013). Kotter (1990)
defined the differences between leadership and management and described management as the
processes of planning, organizing and controlling in an organization in order to produce “a
degree of consistency in an organization” (Kotter, 1990, p. 4). Whereas, leadership is defined as
“the process of influencing others to understand and agree about what needs to be done and how
to do it, and the process of facilitation individual and collective efforts to accomplish shared
objectives” (Yukl, 2013, p. 7). Or simply, “leadership is ultimately about creating a way for

22
people to contribute to making something extraordinary happen.” (Alan Keith, as cited in Kouzes
& Posner, 2007, p. 2).
Theories. Organizational theories incorporate the relationships of management,
leadership, and culture (Osborn, Hunt, & Jauch, 2002). Some view that Leadership theory was
initially founded on “The Great Men” (Carlyle, 1840) theory which attributed leadership to a
particular personality trait of the leader. There was support for the Trait Theory when it was first
developed (Colbert, Judge, Choi, & Wang, 2012). However, a limitation of this theory is that it
is very narrowly focused on attempting to identify an effective leader by attributes alone and
does not take the culture or environment of the organization into consideration. When it became
clear that the trait theory could not explain all the variances, leadership theories moved from trait
theories to behavioral theories (Hernandez, Eberly, Avolio, & Johnson, 2011; Northouse, 2007).
The key leadership research studies that created the shift to behavioral theories were the Ohio
and Michigan State studies. These approaches viewed the leadership behaviors as “task and
relational” (Northouse, 2007, p. 78). Kouzes and Posner (2007) stated that “Leadership is not
about personality; it’s about behavior” (p. 15). In their research, they identified five exemplary
practices (behaviors) of leaders as: model the way, inspire a shared vision, challenge the process,
enable others to act, and encourage the heart (p. 14). Leadership relies on emotional intelligence
skills and the leaders that are effective are more emotionally intelligent and can portray an array
of leadership behaviors that fits each situation (Goleman, 2000). In other words, effective
leaders practice a variety of behaviors and utilize the behavior that is needed for the current
situation (Yukl, 2013).
As a consequence of industrialization, management theory was brought to light as a
scholarly work and practice by Peter Drucker in the 1950’s (Zahra, 2003). Management theory

23
has moved from the conventional McGregor’s Theory X to the new theory of management-
theory Y. Theory X is the based on the belief that workers are generally lazy and have to be
motivated and monitored by management in order for production to occur. Theory X focuses on
the management functions of control and does not take into account the social needs of the
workers. Conversely, Theory Y takes into account the physiological needs of workers and holds
the belief that they are self-motivated and interested in new opportunities (McGregor, 1957).
Theory X perspectives are compared to the managerial leadership behaviors associated with the
rational goal model and internal process model, and theory Y is associated with open systems
model and human relations model (Quinn, 1991).
The functions of leadership and management has also been viewed from an
organizational growth perspective. In order to remain competitive, the leadership and
management in the organization must be responsible for the strategic decisions regarding the
structural and functional organizational change. As industries change and strategically grow as a
means to remain competitive in the market, reorganization into a more centralized structure is
required to function optimally by efficiently utilizing resources. In order for the organization to
continue to grow to meet the market demands, the organization will create more independent
divisions with new product lines in expanded locations which requires further structural
reorganization to meet the existing functional needs (Chandler, 2000/1962). Cameron and Quinn
(2006) identified changes in organizational culture and leadership styles throughout the
organizational development and growth cycle. There are management and leadership style
(behaviors) are more effective at different stages of the company life cycle and associated culture
type. Some behaviors that are effective in some stages of the life cycle can be ineffective as the
life cycle of the organization progresses.

24
Management and leadership behaviors. Although the definitions of management and
leadership do not always align, there is agreement that managers can be leaders and leaders can
be managers (Kotter, 1990, 1999). Kotter (1999) had an important point that leadership should
not be confused with management: “Leadership compliments management; it doesn’t replace it”
(p. 52). A manager is someone who makes plans without vision. He further pointed out that the
there is a balance between the bureaucratic management behaviors and the leadership behaviors
with no controls and posited that a balance of both are needed. In a situation of high volatility
more leadership is required and in stable times more management is needed (Kotter, 1988). This
concept was confirmed in a study by Peterson and Van Fleet (2008) which identified that
different managerial leadership behaviors were critical depending on the volatility of the
situation. In their study, problem solving and obstacle elimination were important behaviors of
managerial leader during a crisis and consideration and praise-recognition were important
behaviors during a stable situation. In this same study, credible, information dissemination,
inspiration, compelling direction, and role clarification were nearly equally important behaviors
in both a crisis and a stable situation. Peterson, Beard, and Van Fleet (2012) found similar
findings in another study where consideration was a critical behavior in a time of stability and
problem solving behavior was critical in a time of crisis. This study also found inspiration to be
an important managerial leadership behavior in both stability and crisis situations. Comparable
leadership behaviors in a college student population were also established by Peterson and
Peterson (2015, 2012).
Transactional/transformational behaviors. The groundwork for the Transformational
and Transactional leadership theory (Full Range Leadership Model) was first developed by
James MacGregor Burns and adopted by Bernard Bass (Bass, 1985). Burns (2010/1978) was the

25
first to describe leadership as “Transactional” or “Transformational”. The Transactional
leadership is a relationship between a leader and follower which is limited to the exchange of
something of value. On the other hand, the Transformational leader is a leader that brings about
engagement of the followers and raises the follower (and the leader) to a new moral level.
Interest in Transformational leadership stemmed from the noticeable influence a leader has on an
organization that was not explained well with the current models compounded by the drive for
increasing organizational performance (Chemers, 1997). The Full-Range Leadership model
(developed by Avolio and Bass) is a leadership theory composed of three types of leadership
which are Transformational Leadership, Transactional Leadership, and Laissez-faire Leadership.
In this model, these three types of leadership are determined by nine different factors: five
Transformational factors, three Transactional factors, and one Laissez-faire/passive-avoidance
factor (Antonakis et al., 2003; Avolio & Bass, 2004).
The typology of Transformational Leadership is composed of dimensions that are
associated with both leadership behaviors and leadership attributes. The factors that identify
transformational leadership reflect a higher order construct and include: Idealized Influence
(attribute and behavior), Inspirational Motivation, Intellectual Simulation, Individualized
Consideration (Avolio & Bass, 2004; Bass, 1996; Bass, Avolio, Jung, & Berson, 2003).
Idealized Influence is separated into both attributes of Idealized Influence and behaviors of
Idealized Influence (Avolio & Bass, 2004). Chemer (1997) identified the Idealized Influence
factor as having “charisma” (p. 86). This type of leader demonstrates a behavior of offering
support and encouragement to followers (Tejada, Scandura, and Pillia, 2001). Chemers (1997)
identified the Inspirational Motivation factor also as having properties of charisma and a
mechanism by which the follower is moved emotionally by the leader. This attribute challenges

26
and inspires followers fostering esprit de corps. The leader expresses shared goals and
understanding (Avolio & Bass, 2004). The Intellectual Stimulation leadership factor is described
as a creative and entrepreneurial motivation of the followers. This leadership attribute challenges
followers to find better processes (Bass, 1996) by encouraging them to think in a different way to
determine the best approach to a dilemma (Avolio & Bass, 2004). The Individualized
Consideration leadership factor relates to the attention to individual needs and the behavior is
described as a “coach” (Bass, 1996, p. 6). In addition, the Individualized Consideration factor is
related to the development of culture by supporting growth of all individuals which fosters a
collectivistic culture (Avolio & Bass, 2004).
The Transactional leadership typology is described as an exchange theory that is centered
on transactions (Bass, 1985; Lowe, Kroeck, & Sivasubramaniam, 1996). This type of leadership
is theorized to be a combination of the factors of Contingent Reward and Management by
Exception (Avolio & Bass, 2004; Chemers, 1997). The Management by Exception is considered
to be the form of leadership where there is constant monitoring and action is taken to either
correct or reward performance. The active Management by Exception leader is more actively
involved and the passive Management by Exception leader only intervenes to make corrections
(Antonakis et al., 2003). Bass (1996) described this factor as a manager that monitors actions
that are outside of the standards. The Contingent Reward factor is identified by an exchange of
rewards for reaching goals (Antonakis et al., 2003). Rites (Trice and Beyer, 1993) and symbols
(Bass & Avolio, 1993) are viewed as a reward or reinforcement in exchange for behaviors and
performance in an organization.
The passive-avoidance or laissez-faire form of leadership is passive and provides no
direction (Bass et. al, 2003). This leader is one that takes no action and this leadership style is
27
considered to be not effective (Antonakis et al., 2003). Laissez-faire leadership style is
considered “nontransaction” (Bass, 1996). Since this leadership style takes no action, there is no
interaction or relationship with the leader. Kouzes and Posner (2007) stated that “leadership is a
relationship” (p. 23).
One facet of Transformational/Transactional Leadership behavior is that a Transactional
Leader works with the existing organizational culture, whereas a Transformational Leader
transforms and changes the culture (Avolio & Bass, 2004). The difference between transactional
and transformational leadership is that the latter moves followers up Maslow’s Hierarchy from
the level of needs and safety to the level of self-actualization. This movement is a raise in
consciousness (Bass et al., 2003; Avolio & Bass, 2004). The Transformational Leader is
visionary (Avolio & Bass, 2004; Lowe et al., 1996), and uses vision as a mechanism for change.
Trice and Beyer (1993) also credited a visionary leader for creating a new organizational culture
in that the leader creates the culture based on their vision of what the leader wants for the new
organization. In their view, a visionary leader can create a new culture over a period of time.
Yukl (1999) described the transformational leadership theory as different than other leadership
theories since it has a particular focus on emotions and value. However, Yukl also noted that
this theory is somewhat vague and broad.
Comparison and Integration of Theoretical Models
The Grid and Group typology explored in an earlier section of this paper, was first
developed by anthropologist Mary Douglas (2007/1970) and was based on the work of
Durkheim. Later, this model was applied in a school setting by Harris (2005). The previously
described Competing Values model refined by Cameron and Quinn (2011) was founded upon a
list of criteria of values for organizational effectiveness. Although these two typologies have
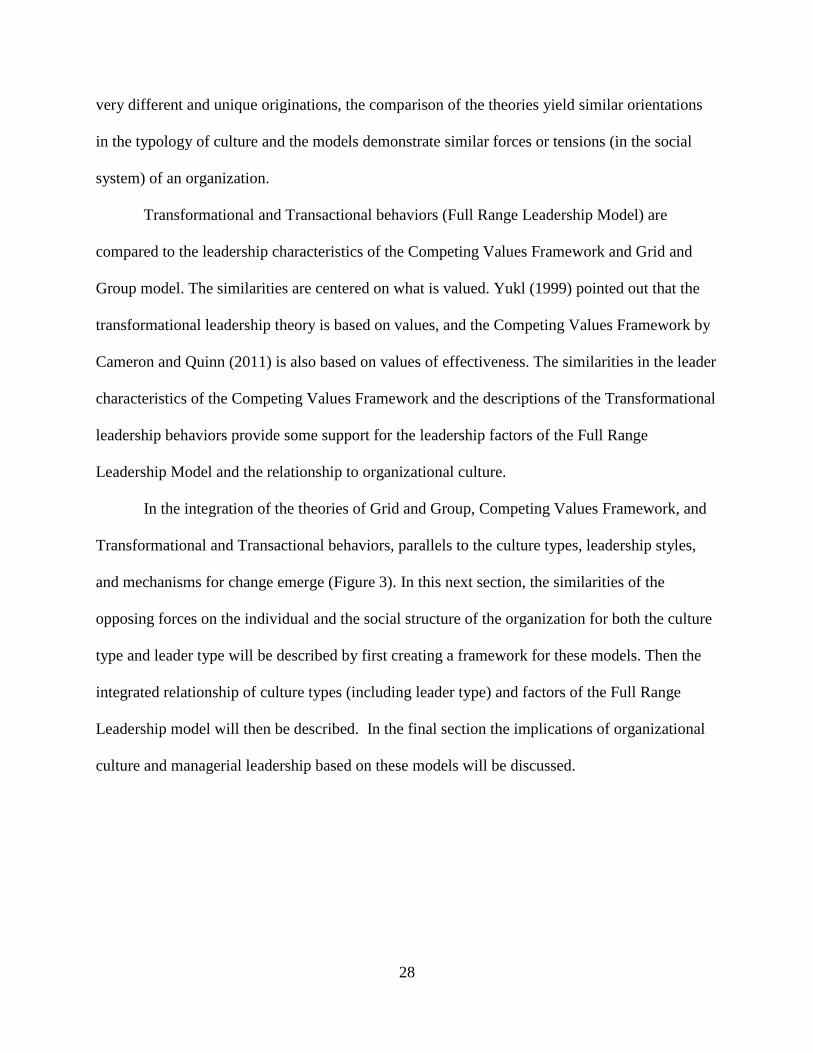
28
very different and unique originations, the comparison of the theories yield similar orientations
in the typology of culture and the models demonstrate similar forces or tensions (in the social
system) of an organization.
Transformational and Transactional behaviors (Full Range Leadership Model) are
compared to the leadership characteristics of the Competing Values Framework and Grid and
Group model. The similarities are centered on what is valued. Yukl (1999) pointed out that the
transformational leadership theory is based on values, and the Competing Values Framework by
Cameron and Quinn (2011) is also based on values of effectiveness. The similarities in the leader
characteristics of the Competing Values Framework and the descriptions of the Transformational
leadership behaviors provide some support for the leadership factors of the Full Range
Leadership Model and the relationship to organizational culture.
In the integration of the theories of Grid and Group, Competing Values Framework, and
Transformational and Transactional behaviors, parallels to the culture types, leadership styles,
and mechanisms for change emerge (Figure 3). In this next section, the similarities of the
opposing forces on the individual and the social structure of the organization for both the culture
type and leader type will be described by first creating a framework for these models. Then the
integrated relationship of culture types (including leader type) and factors of the Full Range
Leadership model will then be described. In the final section the implications of organizational
culture and managerial leadership based on these models will be discussed.
29
Figure 3. Integration of models (Grid and Group, Competing Values, Full Range Leadership).
Comparison of Model Dimensions
Both culture typologies view the individual on one continuum and the organizational or
social classification on the other. In the Grid and Group model, the grid refers to the
organizational or social forces and the group refers to the forces on the individual (Harris, 2005).
For the Competing Values model, the stability and control and flexibility and discretion are the
organizational and social forces. The internal focus and integration is the cohesion, and external
focus and differentiation describe the independence (Cameron & Quinn, 2011).
The grid is the forces of the organization and is defined as “the degree to which an
individual’s choices are constrained within a social system imposed by prescriptions such as role

30
expectations, rules, and procedures” (Harris, 2005, p. 34). Maximum autonomy is found in a
weak grid and minimal autonomy is found in a strong grid (Harris, 2005). The strong grid forces
of the Grid and Group model are aligned with the stability and control forces of the Competing
Values Model which is a mechanistic organization governed by rules and the weak grid is
aligned with the flexibility and discretion forces which describe a more flexible organic
organization (Cameron & Quinn, 2011).
The group determines the forces on the individual and is defined as “the degree to which
people value collective relationships and the extent to which they are committed to the larger
social unit” (Harris, 2005, p. 36). A strong group is characterized as strong social incorporations
and the interest of the group is prioritized over individuals (Harris, 2005). The comparable
individual force of internal focus dimension of the competing values model is based on the
human relations model and the internal process model which is characterized by human
commitment, consolidation, and continuity (Quinn, 1991). The contrasting weak group is
characterized by minimal social incorporation (Harris, 2005) and is compared to the external
focus dimension where externally focused values are accentuated (Cameron & Quinn, 2011).
In viewing the leadership types identified in the competing values and Grid and Group
models, similarities can be recognized within in the contrasting dimensions. This is also
supported by other models. Harris (2005) applied a situational leadership model (Hersey &
Blanchard, 1982, as cited by Harris, 2005) to support the Grid and Group leadership behaviors.
The weak group leadership behavior is described as “low-supportive” behavior, whereas the
strong group leadership behavior is designated as “high supportive” (p. 56-57). On the other
dimension, the strong grid leadership demonstrated “high-directive” behavior and weak grid
culture types were listed as a “low directive” behavior wherein the leader does not make the final
31
decision (p. 56-57). In the weak grid the leader has minimal oversight and in the strong grid the
leader takes more of an active role. The strong group/strong grid culture type was designated as
described as a “coaching” behavior (p.57). The strong grid/weak group leadership is described
as “directive” (p. 57). The leadership in the weak grid/strong group culture type was viewed as a
“supporting” behavior (p.57). The weak grid/weak group behavior was described as
“delegating” (p. 57). These described leadership behaviors are similar to the Competing Values
leadership roles described by Quinn (1991) and leadership types by Cameron and Quinn (2011)
discussed in the next section within each identified culture archetype.
Comparison of Cultural Typologies and Integration of Managerial Leadership
Individualist and Adhocracy culture. The weak grid/weak group Individualist culture
described by Harris (2005) is similar to the Adhocracy culture dimension identified by Cameron
and Quinn (2011). Both the Individualist and Adhocracy culture are defined by decentralized
power and individuality/independence and risk taking (Cameron & Quinn, 2011; Harris, 2005).
Flexibility, creativity, accountability, and productivity are valued in this weak grid and weak
group dimension (Harris, 2005). Similarly, the Adhocracy culture dimension fosters creativity
and flexibility in the organization (Cameron & Quinn, 2011). The organization in this dominant
culture type is organic and flexible.
Effective Individualist culture leadership styles exhibit encouragement and support as
well as a competitive work environment. In a school setting, a successful principal (leader) is
charismatic, trust-building, and appreciative of individual strengths (Harris, 2005). The
Competing Values successful leadership types for the Adhocracy culture are identified as an
innovator, visionary, and an entrepreneur (Cameron & Quinn, 2011). The individual strengths
and innovation illuminate the weak grid of this culture as well as the organic structure that would

32
be found in this culture type and leadership style. The Full Range Leadership model defines
Intellectual Stimulation as creative and entrepreneurial stimulation of the followers. This
attribute fosters innovative processes (Bass, 1996). This leadership attribute aligns with the
innovative and entrepreneur leader type described for the Adhocracy culture of the Competing
Values Framework (Cameron & Quinn, 2011).
Collectivist and Clan culture. The strong group/weak grid Collectivist culture and Clan
culture are analogous in that commitment is high and is tied to group goals (Cameron & Quinn,
2011; Harris, 2005). Harris (2005) describes Collectivist cultures as Egalitarian and defined
Egalitarian as “the equality of humankind and the desirability of political, economic, and social
equality for all” (p. 146). Harris also described this strong group culture dimension in a school
setting where cooperation, group harmony, and academic achievement tied to group goals is
what is valued (Harris, 2005). Cameron and Quinn (2011) described the comparable Clan
cultures as a tight knit group and comparable to a family where there is shared values within the
group.
The leadership styles of the Collectivist and Clan culture type are also connected. The
successful school leadership style in a collectivist school culture is where the teacher and
principal share roles. In this culture, power and decision making are decentralized and the
decisions are made by the consensus of the group (Harris, 2005). Leadership success has been
identified as support of teamwork, promotion of school goals, and shared decision making
(Harris, 2005). This is consistent with the described leader type of facilitator, mentor, team
builder associated with the Clan culture described in the Competing Values Framework
(Cameron & Quinn, 2011). This is also consistent with the interrelated human relations model
where the leadership type is caring and the power is derived from personal connections (Quinn,

33
1991). This leadership description bears similarities to Transformational leadership factors of the
Full Range Leadership Model. Bass (1996) described the attribute of Inspirational Motivation as
focused on goals and vision. This leadership attribute is consistent with promoting the
Clan/Collectivist culture associated with common goals, decisions, and teamwork. Bass (1996)
reported that a collectivist culture is willing to follow an inspirational leader. The Individualized
Consideration factor of the Transformational leader is also characterized as a “coach or mentor”
(Bass, 1996, p. 6) which is the same leader type description found in the Clan culture of the
Competing Values Framework.
Market and Bureaucratic culture. In the Competing Values Framework, the Market
culture dimension values competitiveness and productivity and is results-oriented (Cameron &
Quinn, 2011). The competitive advantage is important to the individuals. This is compared to
the strong grid/weak group Bureaucratic culture analogy of baseball described by Harris (2005)
wherein individual goals, performance and statistics are measured and valued. In a strong
grid/weak group Bureaucratic culture, the separation of work and personal (and social) is valued
and there is not a strong connection to the institution (Harris, 2005). According to Bass (1996),
in a transactional culture the individuals do not feel they are a part of the organization or
represent what the organization stands for which aligns with weak group of the Bureaucratic
culture and the external focus of the individuals.
In a Bureaucratic culture, a successful administrator (leader) has been identified as one
who would embrace and utilize structure, supervise closely, and one that would motivate by role
and reward (Harris, 2005). Harris (2005) stated that the work is a result of individualized goals
rather than the overall communal goals. Cameron and Quinn (2011) identified the leader type of
the comparable Market culture as hard driver, competitor, and producer and reaching goals is

34
valued. Based on the Rational Goal Model, the leadership type is described as directive,
decisive, and highly goal oriented (Quinn, 1991). The goal achievement of the Competing
Values model is aligned with motivation of goal achievement in the Grid and Group model. In a
Transactional culture of the Full Range Leadership Model, the Contingent Reward factor of the
Transactional Leadership type is based on rewards in exchange for success which aligns with the
leadership style associated with this archetype. The Management by Exception factor of the
Transactional Leadership closely monitors actions (Bass, 1996) which align with the
Bureaucratic Culture leadership characteristics of the Grid and Group (Harris, 2005).
Hierarchy and Corporate culture. The direct correlations of the strong grid/strong
group Hierarchy culture type and the Corporate culture are that that rules, procedures, and
centralized power dominate this culture (Cameron & Quinn, 2011; Harris, 2005). The
Hierarchy culture values control (Cameron & Quinn, 2011). Harris (2005) describes the social
game of the Corporate culture as “hierarchy” (p. 129).
Harris (2005) identified the leadership in a Corporate school culture as a coaching
leadership and where there is centralized decision making. Harris (2005) also credited a
successful leader in a Corporate school is one that nurtures similar views and actions and
develops a clear classified organization. The linked Hierarchy culture archetype of the
Competing Values Model identified the leader type in this culture as a planner, structured, and
one that oversees progress (Cameron & Quinn, 2011). These culture types are more loosely
connected and the similarity lies in that the leader promoting a clear hierarchal structure (Grid
and Group) is similar to the organizing characteristic of the leader type found in the Competing
Values framework. Quinn (1991) recognized that an effective manager in this culture maintains
a familiar order and structure as well as provides clear lines of communication. This description

35
also aligns with the close observation (strong group) leader characteristics of the Grid and Group
archetype. In comparison, the Management by Exception factor of the Transactional Leader also
is described as a monitor (Bass, 1996) which is congruent with the monitor leader characteristic
of the Hierarchy culture (Cameron & Quinn, 2011), and close supervision characteristic of the
Grid and Group (Harris, 2005).
Conclusion from the Literature
In integration of the Grid and Group, Competing Values, and Transactional/
Transformation Leadership behavior (Full Range Leadership) theories, they are all found to be
interrelated and there are potential implications for organizations that can be recognized. In
viewing these models, there is not necessarily one best managerial leader type or one best culture
archetype for an organization and an organization is not just one culture type. Rather, the best
managerial leader and the best culture is one where there is culture congruence and a managerial
leadership behavior that fits the culture. For example, an existing or new leader that attempts to
change the existing culture of an organization could be met with resistance by the organization.
According to Robbins and Coulter (2014), individuals in an organization hold on to the values
that they are comfortable with and which have a history of working in the organization.
Organizational continuity is maintained as long as it is valued as in the best interest, and only
changes if the change is viewed to be the best interest (Salzman, 2001). Managerial Leadership
strategy creates change that affects the function and structure of an organization (Chandler,
2000/1962). As part of group function, some values can be adapted and undergo transformation
as a process of change (Schein, 1985). Culture can derail leadership’s strategy, according to
Peter Drucker, who is credited with the famous (undocumented) quote, “Culture eats strategy for
breakfast.” Therefore, cultural congruence and managerial leadership style are crucial for

36
organizational success (Cameron & Quinn, 2011). The transactional leadership behaviors align
more with the stability and control dimension of the models and the transformational leadership
behaviors align with the flexibility and more organic culture types. As previously discussed,
Kotter (1988) described a manger as someone who makes plans without vision. The
Transformational leader is visionary and a Transactional Leadership mechanism is by contingent
rewards. The manager qualities align more closely with the Transactional Leadership behaviors
and the visionary leadership qualities align with the Transformational Leadership behaviors. A
change in leadership in an organizational from Transactional Leadership to a Transformational
Leadership style or vice versa could have implications depending on the culture type of the
organization. If the culture type and managerial leadership behavior are not a congruent, it could
create uncertainty and unsettling in an organization.
In this paper, comparisons have been drawn between the Grid and Group Model and the
Competing Values Model culture types and leadership behaviors. Leadership behaviors of the
Full Range Leadership Model reinforce the managerial leadership types and roles identified in
the associated Grid and Group and the Competing Values Models. The constructs of managerial
leadership and culture types appear to be interconnected. Understanding the culture types and
managerial leadership behaviors that exist in an organization could be instrumental in
understanding the dynamics of an organization.

37
CHAPTER III: METHODS
Chapter 3 discusses the research questions, the procedures and the design of the study,
and the methods used for the data analysis.
Research Questions
The three research questions were designed to investigate the relationship of the Grid and
Group Model, the Competing Values Model, and the Full Range Leadership Model. The study
was a quantitative web based survey distributed via email. The results were collected with the
survey and analyzed for correlation of the variables listed in the following research questions:
1a. What are the quantitative relationships among the dimensions identified by the Grid
and Group Theory and the Competing Values Framework (Preferred) as measured by
the Social Game Assessment Tool and Organizational Culture Assessment Instrument
respectively?
1b. What are the quantitative relationships among the dimensions identified by the Grid
and Group Theory and the Competing Values Framework (Now) as measured by the
Social Game Assessment Tool and Organizational Culture Assessment Instrument
respectively?
2. What is the relationship among the dimensions identified by the Full Range
Leadership Model and the Grid and Group Theory as measured by the Multifactor
Leadership Questionnaire 5X Rater Instrument and the Social Game Assessment Tool
respectively?
3a. What is the relationship among the dimensions identified by the Full Range
Leadership Model and the Competing Values Framework (Preferred) as measured by
38
the Multifactor Leadership Questionnaire 5X Rater Instrument and the Organizational
Culture Assessment Instrument respectively?
3b. What is the relationship among the dimensions identified by the Full Range
Leadership Model and the Competing Values Framework (Now) as measured by the
Multifactor Leadership Questionnaire 5X Rater Instrument and the Organizational
Culture Assessment Instrument respectively?
Sample
The volunteer subjects were sampled from a pool of (n = 33) full time employees of an
agricultural cooperative organization in the Midwestern part of the United States (convenience
sample). Creswell (2015) explained that with a convenience sample, the data can still provide
useful information to examine a hypothesis. The organization was in a period of high growth and
expansion with locations in seven communities within a regional area of a state. This
organization had merged with a larger organization within the last year. Only the approximately
46 managers have direct access to the work computers in the organization and will be the
convenience sample for this study. This was information provided by the General Manager that
indicated that his managers confirmed that they completed the survey.
Procedures and Data Collection
The Organizational Culture Assessment Instrument, Social Game Assessment Tool
(modified), and the Multifactor Leadership Questionnaire 5X Rater form instruments as
described above were placed in web-based survey format using Qualtrics (provided by North
Dakota State University). The survey was distributed to participants via a link in an email from
the General Manager (GM) of the organization. The initial email was followed by five email
reminders over the course of five months. The visual appearance of the survey aligned with

39
recommendations of Dillman, Smyth, and Christian (2008) which include proper spacing, easy to
read font type and size, the questions are organized in a such a way that participants will not
have to re-read parts of the questions, the scrolling necessary was very minimal and section of
questions were identified.
Prior to beginning the study, the proper IRB documents were filed and approved by the
NDSU Institutional Review Board (IRB approval documentation can be found in Appendix B).
The invitation to participate in the survey included information that participants were required to
be over 18 to participate, participants could discontinue at any time, the survey responses were
anonymous, results will only be reported in aggregate form, the participants would not benefit
from taking the survey, and the survey questions could potentially cause some minor discomfort.
The General Manager was asked to send out five reminders in the following five-month period.
In accordance with policy, the General Manager was ultimately in charge of the distribution of
the emails related to the survey. The data was collected via Qualtrics and all analyses conducted
in Stata (version 14).
Data Cleaning and Correction
A codebook was created for the data, and the data was evaluated for errors. Data were
subsequent cleaned and prepared in an acceptable method prior to the analysis. The data was
cleaned and examined for missing data. There were three participants’ answers that did not add
up to 100 as per the directions for the Organizational Culture Assessment Instrument (OCAI).
These were given a new value based on the proportion of their response. For example, one of
these participants answered with 10%, 10%, 50%, and 20%. These were adjusted proportionally
so that the new values were 11%, 11%, 56%, and 22%.

40
Instruments
The study design was a quantitative (web based) survey research study. The instruments
used to investigate the relationship of the culture and leadership models were the Organizational
Culture Assessment Instrument (OCAI), Social Game Assessment Tool (modified), and the
Multifactor Leadership Questionnaire 5X (Rater form) as described in this section. According to
Creswell (2015), survey research is useful in describing trends.
Social Game Assessment Tool (Modified)
Harris (2005) developed the Social Game Assessment Tool to view the Grid and Group
Culture type of an organization. This instrument has 12 questions on an 8 point Likert scale to
assess Grid and 12 questions on an 8 point Likert Scale to assess Group. Since the survey was
originally developed for schools, it will be modified by changing education references in the
questions to a reference to business. The justification for this modification is to allow the
respondents to more closely match the questions to their organization which is not an educational
setting. For the purposes of this research, there is an assumption that the instrument can be
modified in this way to apply to business with similar implications of the findings. The original
tool had the questions placed on an 8 point Likert scale. The modified survey used had an 8 point
Likert Scale with wording on the scale with 8 different points ranging from Very Strongly
Disagree to Very Strongly Agree. The following is an example of the modification. The original
tool described one of the questions as: I prefer a work atmosphere where educators and students
have: no allegiance/loyalty to the school (on the end of the Likert scale by the number 1) - much
allegiance/loyalty to the school (on the other end of the Likert scale by the number 8). The
modified question in the survey stated that: I prefer a work atmosphere where workers have no
allegiance/loyalty to the organization rather than full allegiance/loyalty to the organization (on a

41
Likert scale with 8 selections ranging from Very Strongly Disagree to Very Strongly Agree).
There were 2 questions for each of the Grid and Group that were eliminated since they were
school specific questions that could not be easily modified. The modified instrument that will be
used is located in Appendix A.
The reliabilities for the two subscale of Harris’ (2005) Grid and Group Assessment Tool
are very good, with a Cronbach alpha of 0.705 and 0.855 for the grid subscale and group
subscale, respectively (Hill, unpublished analysis of Grid and Group, 2016).
Organizational Culture Assessment Instrument
In their research, Cameron and Quinn (2011) have found that an organization holds a
dominant culture type. The Organizational Culture Assessment Instrument (OCAI) developed by
Cameron and Quinn was used for this study as a means to determine the congruent culture type
of the organization based on the Competing Values Framework. This instrument has six groups
of four statements (one for each culture type). Each statement in the group has to be weighted for
relevance in the organization with the total equaling 100. This instrument appeared twice in the
survey and for the first round, the participants were asked to score the organization for each of
the questions based on how they find the organization now. For the second round of the same
instrument, the instructions directed the participants to score the organization as how they would
prefer the organization to be in five years. The six groups of questions measured the domains of
Dominant Characteristics, Organizational Leadership, Management of Employees,
Organizational Glue, Strategic Emphasis, and Criteria for Success. The four culture types
identified by the instrument are Market, Clan, Adhocracy, and Hierarchy. This instrument has
been tested for validity and is a reliable instrument to assess organizational culture (Heritage,
Pollock, & Roberts, 2014). The instrument has also demonstrated validity in measuring the

42
culture types (Cameron & Freeman, 1991). The instrument was placed in Appendix A. Cameron
and Quinn (2011) reported reliability analysis with Cronbach’s alpha coefficients from several
sources listed in Table 1.
Table 1
Reported Cronbach Alpha Reliabilities for the OCAI
Culture type Quinn & Spreitzer (1991) Yeung, Brockbank, &
Ulrich (1991)
Zammuto &
Krakower (1991)
Clan .74 .79 .82
Adhocracy .79 .80 .83
Hierarchy .73 .76 .67
Market .71 .77 .78
Multifactor Leadership Questionnaire 5x Rater Form
The Multifactor Leadership Questionnaire (MLQ) is an instrument that was developed by
Avolio and Bass (2004) to examine transactional, transformational, and non-leadership. It is
available in the 5X format that examines five transformational leadership factors, three
transactional factors, and one laissez-faire non-leadership factor (Antonakis et al., 2003). It is
considered to be the best method for assessing the full range leadership model (Antonakis et al.,
2003; Avolio & Bass, 1995). Only the rater form of the MLQ 5X instrument was used for data
collection in this study in order to assess the overall leadership of the organization. The original
paper version of the MLQ 5X rater form instrument has 45 statements followed by a five-point
Likert scale (0-4) following each statement. The paper form has a key at the top that equates 0
with Not at all to 4 with Frequently, if not always. The online survey format for this study had
the exact wording for each of the five points of the paper Likert scale. However, the statements
for each value were placed at the top of each block of questions rather than the numbers beside
each statement due to lack of space in the questions blocks. The MLQ 5X Rater form instrument
has four questions each that are associated with Idealized Influence (attribute), Idealized

43
Influence (behavioral), Inspirational Motivation, Intellectual Stimulation, Individualized
Consideration, Management by Exception (Active), Management by Exception (Passive),
Contingent Reward, and Laissez- Faire Leadership. The instrument also has three questions each
to determine Extra Effort and Effectiveness, and 2 questions for satisfaction. Avolio and Bass
(2004), reported that the MLQ 5X instrument demonstrated validity. The certificate for
permission to use the instrument will be placed in Appendix C. In addition, the permission
allowed for 5 questions of the instrument to be published. The 5 allowed questions are labeled
for the leadership behaviors associated with this study and are available for viewing in Appendix
B.
Avolio and Bass (2004), reported that the MLQ 5X demonstrated validity. The
reliabilities reported by Avolio and Bass (2004) for the various dimensions in the MLQ
instrument are all good ranging from .69 to .83 (n = 27,285). See Table 2 for the complete list of
reliabilities.
Table 2
Cronbach Alpha Reliabilities for the Subscales of the MLQ 5X
Subscale Cronbach’s alpha
Idealized influence (attributed) .75
Idealized influence (behavioral) .70
Inspirational motivation .83
Intellectual stimulation .75
Individualized consideration .77
Contingent reward .69
Management by exception (active) .75
Management by exception (passive) .70
Laissez-faire .71
Data Analysis
In order address the research questions for this study, canonical correlation analysis
(CCA) and regression/correlation were used to examine the potential interrelationships.
44
Canonical correlation can be useful to evaluate the relationship between two distinct sets of
variables (Stevens, 2002). Exploratory data analysis was utilized throughout (Tukey, 1977).

45
CHAPTER IV: RESULTS
The purpose of the proposed study is to empirically examine the relationship of culture
and leadership based on the Competing Values Model, Grid and Group, and
Transformational/Transaction Leadership Behaviors in an organization located in the Midwest of
the United States. The three research questions were designed to investigate the relationship of
the Grid and Group Model, the Competing Values Model, and the Transformational/Transaction
Leadership Behaviors of the Full Range Leadership Model. Questions one and three were split
into two parts (labeled a and b) to analyze the data taking into account the two aspects of the
Organizational Culture Assessment Instrument. The Organizational Culture Assessment
Instrument asks the participants how they would like their organizational culture to be in 5 years
“Preferred” (related to research Questions 1a and 3a), and how they view the organizational
culture “Now” (related to research Questions 1b and 3b).
1a. What are the quantitative relationships among the dimensions identified by the Grid
and Group Theory and the Competing Values Framework (Preferred) as measured by
the Social Game Assessment Tool and Organizational Culture Assessment Instrument
respectively?
1b. What are the quantitative relationships among the dimensions identified by the Grid
and Group Theory and the Competing Values Framework (Now) as measured by the
Social Game Assessment Tool and Organizational Culture Assessment Instrument
respectively?
2. What is the relationship among the dimensions identified by the Full Range
Leadership Model and the Grid and Group Theory as measured by the Multifactor

46
Leadership Questionnaire 5X Rater Instrument and the Social Game Assessment Tool
respectively?
3a. What is the relationship among the dimensions identified by the Full Range
Leadership Model and the Competing Values Framework (Preferred) as measured by
the Multifactor Leadership Questionnaire 5X Rater Instrument and the Organizational
Culture Assessment Instrument respectively?
3b. What is the relationship among the dimensions identified by the Full Range
Leadership Model and the Competing Values Framework (Now) as measured by the
Multifactor Leadership Questionnaire 5X Rater Instrument and the Organizational
Culture Assessment Instrument respectively?
Data Collection and Demographics
The instruments used to collect the data to examine the relationship of the culture and
managerial leadership models are the Organizational Culture Assessment Instrument (OCAI),
Social Game Assessment Tool (modified), and the Multifactor Leadership Questionnaire 5X
(Rater form). The Social Game Assessment Tool was modified to refer to business rather than
schools. The data from the survey was collected via a Qualtrics web based survey distributed by
the General Manager to an agricultural based organization in the Midwestern part of the United
States. Data from a convenience sample of n = 33 participants was collected. The gender
distribution was 19 males and 11 females (n = 30 reported), and all participants were Caucasian.
The participants were all employed full-time (n = 33) in the organization with an average time
employed by the organization of 10.67 years, ranging between 6 months to 36 years with the
organization (n = 32). The average age of the participants was 45.48 years with a range of 24 to
65 years of age. Education level (n = 32) was fairly evenly distributed between High school/GED

47
(n = 8), Some college (n = 8), two-year college degree (n = 6), and four-year college degree
(n = 10). This data was reported in Tables 3 and 4.
Table 3
Demographics: Gender and Educational Background
Gender High
school/GED Some college
Two-year
college degree
Four-year
college degree Total %
Male 3 6 4 6 19 63.33
Female 4 1 2 4 11 36.67
Total 7 7 6 10 30 -
% 25.00 25.00 18.75 31.25 - -
Table 4
Demographics: Age and Length of Employment
Variable n M SD Min Max
Age 33 45.48 11.26 24 65
Employment Time 32 10.67 10.00 .5 36
Data Manipulation
Following the data collection, data manipulation was required to compute the composite
scores from the subscales of the three instruments used in the study.
Computing the Full Range Composite Scores (MLQ 5X)
The Multifactor Leadership Questionnaire 5x identifies leadership behaviors of
transformational and transactional. Bass (1996) identified several studies that grouped Charisma
(Idealized Influence), Inspirational Motivation, Intellectual Stimulation, and Individualized
Consideration as Transformational, and Contingent Reward and Management by Exception as
Transactional. Some studies also linked Laissez-Faire with Transactional Leadership behavior
and some listed it as a separate non-leadership style (Bass, 1996). The focus of this study is on
the behaviors of transformational and transactional leadership. Therefore, Idealized Influence
(Attributed and Behavior), Inspirational Motivation, Intellectual Stimulation, and Individualized
Consideration will be used to identify Transformational behaviors, and Contingent Reward and

48
Management by Exception as Transactional behaviors which is consistent with other studies
(Antonakis & House, 2014; Michel, Lyons, & Cho, 2011). For the purposes of this study, the
Laissez-Faire or non-transactional or non-leadership behaviors will not be evaluated which is
also consistent with other studies (Michel, Lyons, & Cho, 2011).
Table 5
MLQ 5X Items Used for Full Range Leadership Factors
Factor Composite of Items
Transformational Leadership Idealized Influence-Attributed
Idealized Influence-Behavioral
Inspirational Motivation
Intellectual Stimulation
Individualized Consideration
Transactional Leadership Contingent Reward
Management by Exception-Active
Management by Exception-Passive
Computing the Grid and Group Composite Scores (SGAT)
The grid composite score was computed as the average of the 10 grid subscale items. The
group score was computed the same with an average of the 10 group subscale items. Each of
these composite scores are on a scale of 1 to 8.
Computing the Competing Values Composite Scores (OCAI)
There are four composite scores for each factor (Clan, Hierarchy, Market, and
Adhocracy) for each context (Now and Preferred). Each composite was computed as an average
of the six items that were assigned to each factor. Data was collected first as to how the
participants feel the culture of the organization is “Now,” and then again as to how they would
prefer the culture in five years—i.e., “Preferred.” The Now and Preferred are scored separately.
The result was reported as four composite scores for each culture type Now (Hierarchy Now,
Market Now, Adhocracy Now, and Clan Now) and for Preferred (Hierarchy Preferred, Market
Preferred, Adhocracy Preferred, and Clan Preferred).

49
Parametric Assumptions
The data were examined for potential violations of the assumptions required for analyses
based on the general linear model (Garson, 2015). There are no reasons to suspect any violations
of independence of observations. The skewness and kurtosis of each variable was computed and
examined to check for departures from normality. Skewness and kurtosis were analyzed for the
variables as shown in table below. Skewness and kurtosis outside the range of ±2 are outside a
normal range and can be more sensitive to a smaller sample size (Lomax & Hahs-Vaughn,
2012). Linearity was confirmed by visual inspection of relevant scatterplots (see Figures 4
through 14).
Additional method-specific assumptions (e.g., collinearity) were checked as needed. Any
issues or violations are addressed in the respective sections. Of special note, Adhocracy was
omitted from the canonical correlation analyses due to collinearity issues. The OCAI used
constant-sum scaling for the four dimensions, which imposes a very high degree of inter-
correlation. In fact, any one dimension could be perfectly predicted from a combination of the
other three.
General Descriptive Statistics
The mean, standard deviation, minimum, and maximum were calculated for each of the
variables in the study and reported in Tables 6-8. The Group (5.09) had the largest mean in the
Social Game Instrument, and Clan Preferred (32.99) and Clan Now (28.90) had the highest
mean.

50
Table 6
Descriptive Statistics for Social Games Subscales (Grid and Group)
Variable n M SD Min Max
Grid 33 3.73 .86 1.1 5.4
Group 33 5.09 .84 2.9 6.5
Table 7
Descriptive Statistics for the OCAI “Preferred” Subscales (Competing Values)
Variable n M SD Min Max
Hierarchy (P) 32 21.08 7.53 9.20 42.50
Market (P) 32 20.99 9.41 0.00 44.33
Adhocracy (P) 32 21.30 5.99 10.80 35.00
Clan (P) 32 32.99 14.55 5.17 72.50
Table 8
Descriptive Statistics for the OCAI “Now” Subscales (Competing Values)
Variable n M SD Min Max
Hierarchy (N) 32 23.17 7.79 6.7 37.5
Market (N) 32 27.38 13.38 3.3 63.0
Adhocracy (N) 32 20.55 6.02 6.2 31.7
Clan (N) 32 28.90 13.53 3.3 70.0
Table 9
Descriptive Statistics for the MLQ 5X Subscales (Full Range Leadership)
Variable n M SD Min Max
Idealized Influence
(Attributed)
33 3.39 1.11 1.0 5.0
Idealized Influence
(Behavior)
33 3.32 0.91 1.3 4.8
Individualized
Consideration
33 3.09 1.12 1.0 4.8
Inspirational Motivation 33 3.73 1.15 1.0 5.0
Intellectual Stimulation 33 3.23 0.89 1.8 4.8
Contingent Reward 33 3.23 1.12 1.0 4.8
Management by
Exception (Active)
33 2.80 0.78 1.3 4.3
Management by
Exception (Passive)
33 2.54 1.09 1.0 5.0

51
The Frequency for the mean calculation for each culture type of the Grid and Group as
determined by the Social Game Instrument was calculated for Corporate (4 participants),
Bureaucratic (1 participants), Individualist (3 participants), and Collectivist (19 participants)
culture dimensions. The OCAI instrument survey determined the culture type as it is now and the
culture type preferred in the future. The Frequency for the culture types determined now for the
Competing Values Framework by the OCAI were Hierarchy (7 participants), Market (14
participants), Adhocracy (4 participants), and Clan (17 participants). The Frequency for the
culture types determined as Preferred in the future for the Competing Values Framework by the
OCAI were Hierarchy (5 participants), Market (7 participants), Adhocracy (2 participants), and
Clan (15 participants). The Collectivist (Social Game) and the Clan Now and Clan Preferred
(OCAI) were observed to be the larger variable types. The factors for Transformational
Leadership behaviors also exhibited the highest means. This was reported in Tables 10-12.
Table 10
Frequencies of the Grid and Group Culture Types
Type Freq. Percent
Corporate 4 13.33
Bureaucratic 1 3.33
Individualist 6 20.00
Collectivist 19 63.33
Table 11
Frequencies of the OCAI Culture Types (Now)
Type Freq. Percent
Hierarchy 7 16.67
Market 14 33.33
Adhocracy 4 9.52
Clan 17 40.48
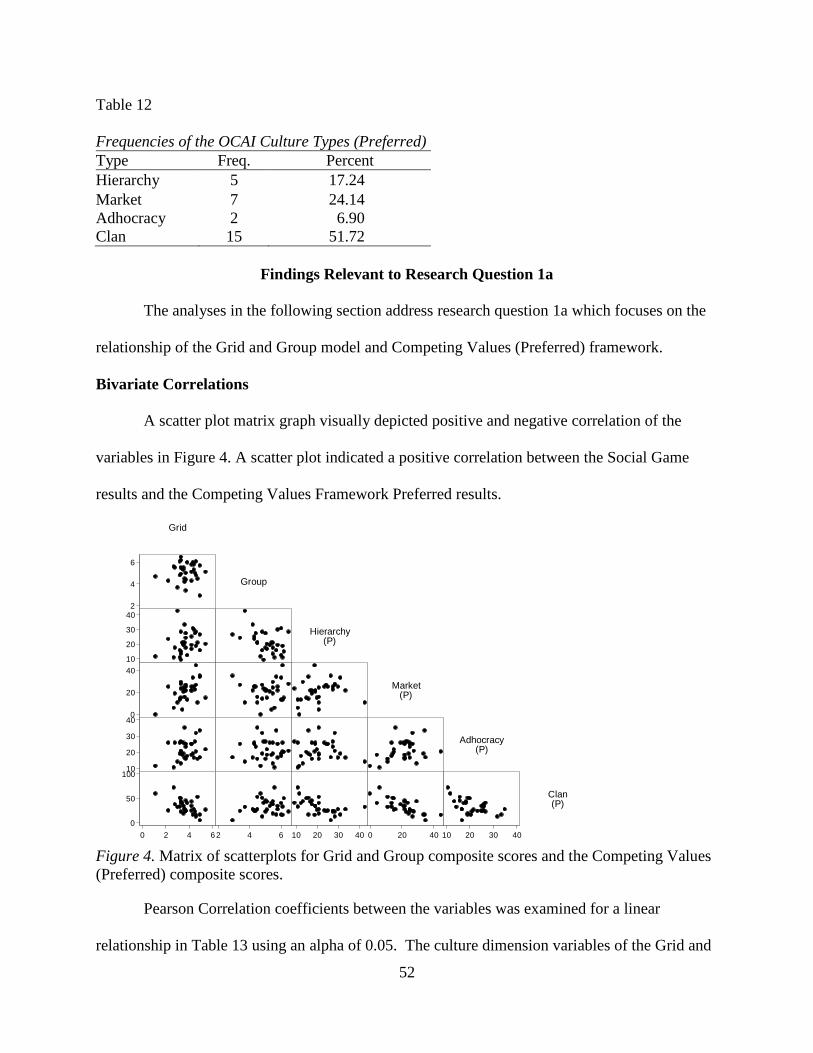
52
Table 12
Frequencies of the OCAI Culture Types (Preferred)
Type Freq. Percent
Hierarchy 5 17.24
Market 7 24.14
Adhocracy 2 6.90
Clan 15 51.72
Findings Relevant to Research Question 1a
The analyses in the following section address research question 1a which focuses on the
relationship of the Grid and Group model and Competing Values (Preferred) framework.
Bivariate Correlations
A scatter plot matrix graph visually depicted positive and negative correlation of the
variables in Figure 4. A scatter plot indicated a positive correlation between the Social Game
results and the Competing Values Framework Preferred results.
Figure 4. Matrix of scatterplots for Grid and Group composite scores and the Competing Values
(Preferred) composite scores.
Pearson Correlation coefficients between the variables was examined for a linear
relationship in Table 13 using an alpha of 0.05. The culture dimension variables of the Grid and
Grid
Group
Hierarchy(P)
Market(P)
Adhocracy(P)
Clan(P)
0 2 4 6
2
4
6
2 4 6
10
20
30
40
10 20 30 40
0
20
40
0 20 40
10
20
30
40
10 20 30 40
0
50
100

53
Group and Competing Values Framework identified negative moderate correlation of Grid
culture with Clan Preferred (r = -0.5541, p = 0.001), Market Preferred is moderately negatively
correlated with Clan Preferred (r = -0.7466, p < 0.001), Grid is mildly positively correlated to
Market Preferred (r = 0.5223, p = 0.002), Group is marginally negatively correlated with
Hierarchy Preferred (r = -0.3960, p = 0.025).
Table 13
Correlations for Grid/Group and Competing Values (Preferred) Composite Scores
Grid Group Hierarchy (P) Market (P) Adhocracy (P)
Group .0067
Hierarchy (P) .2577 -.3960*
Market (P) .5223* .0254 .2542
Adhocracy (P) .2735 .0031 -.0009 .3245
Clan (P) -.5541* .1814 -.5616* -.7466* -.5097*
* p < .05
Canonical Correlation Analysis
A canonical correlation analysis of the variables was conducted to evaluate the
multivariate relations between the two sets of variables for the Grid and Group and Competing
Values Framework (Preferred). The full canonical model was statistically significant and we can
reject the null hypothesis that there is no relationship between the variables. The test of
significance was run for all canonical correlations and found to be significant with (Wilks’
Lambda = .543, F[6, 54] = 3.209, p = 0.009). Wilk’s Lambda is the unexplained variance to the
model, thus by taking 1 - Λ we can determine the model effect size and conclude that 45.7% is
the overall effect that can be explained by the relationship of these two sets of variables in the
model (Sherry & Henson, 2005). The second canonical correlation was not as significant with
(Wilks’ Lambda = .839, F[2, 28] = 2.688, p = 0.0855). Since the model was statistically
significant and had a large effect size, further analysis is warranted to determine which
combination of variables explains the effect.

54
Canonical variates. The canonical correlation coefficients for the first function was
0.5935 and 0.4013 for the second function. In the first function as depicted in the tables 15 and
16 below, the structured coefficients were evaluated for a relationship of the canonical variables.
The structure coefficient (canonical loading) are the relationship between the variables and the
canonical variates (Dattalo, 2014). For the structure coefficients, the Grid is more closely related
to the first canonical function (-0.9508) and Group is more closely related to the second function
(0.9509). The Clan Preferred (0.9825) – Market Preferred (-0.8235) is more closely related to the
first function and Hierarchy Preferred (-0.7395) is related to the second function. The squared
structure coefficients indicate that 90.4% of the variation in U1 is explained by the variation in
V1, whereas only 9.6% of variation in U2 is explained by V2.
An Orthogonal Varimax rotation was performed and a comparison of rotated and un-
rotated structure. It appears that the Grid and Clan Preferred – Market Preferred dimension have
the most effect on the first canonical function and Group and Hierarchy for the second function.
This did not provide any additional information than the un-rotated variates.
Table 14 provides a succinct summary of the interpreted meanings of each canonical
variate.
Table 14
Summary of Canonical Variate Interpretations
Canonical Variate Interpretation (Constructs)
U1 "Grid"
U2 "Group"
V1 "Clan/Market Preferred"
V2 "Hierarchy Preferred" (plus some Market;
Adhocracy may be reduced due to collinearity)

55
Table 15
Loadings for the Grid and Group Canonical Variates
Variable Canonical Variates
U1 U2
Grid -.9508 -.3098
Group .3094 -.9509
Table 16
Loadings for the Competing Values (Preferred) Canonical Variates
Variable
Canonical Variates
V1 V2
Hierarchy (P) -.6196 .7395
Market (P) -.8235 -.4628
Clan (P) .9825 -.0026
Table 17
Redundancy Analysis for the Grid and Group Variables with the Competing Values (Preferred)
Canonical Variates (V1 and V2)
Variable
Canonical Variates
V1 V2
Grid -.5643 -.1243
Group .1837 -.3816
Table 18
Redundancy Analysis for the Competing Values (Preferred) Variables with the Grid and Group
Canonical Variates (U1 and U2)
Variable
Canonical Variates
U1 U2
Hierarchy (P) -.3678 .2968
Market (P) -.4888 -.1858
Clan (P) .5831 -.0010
Redundancy analysis. The redundancy analysis of the canonical variates in Tables 17
and 18 indicated a strong correlation between the Grid and Clan/Market Preferred dimension and
moderate correlation between the Group and Hierarchy Preferred for the second function.
Overall, appears to be a definite correspondence between the Market/Clan dimension of
CV (Preferred) and Grid and between Hierarchy and Group; would expect a stronger relationship

56
between Group and Adhocracy, but this could be a collinearity issue.
Findings Relevant to Research Question 1b
Relationship of Grid and Group and Competing Values “Now.” The following analysis
is to explore the research question 1b of this study. The analysis will use the data gathered from
the Competing Values Organizational Culture Assessment Instrument that asks the participants
how they would rate their company culture “Now” and the relationship to Grid and Group Social
Game Instrument.
Bivariate Correlations
A scatter plot matrix graph in Figure 5 visually depicts the positive and negative
correlation of the variables.
Figure 5. Matrix of scatterplots for Grid and Group composite scores and the Competing Values
(Now) composite scores.
Grid
Group
Hierarchy(N)
Market(N)
Adhocracy(N)
Clan(N)
0 2 4 6
2
4
6
2 4 6
0
20
40
0 20 40
0
20
40
60
0 20 40 60
10
20
30
10 20 30
0
50
100

57
Table 19
Correlations for Grid/Group and Competing Values (Now) Composite Scores
Grid Group Hierarchy (N) Market (N) Adhocracy (N)
Group .0067
Hierarchy (N) .3505* -.2645
Market (N) .4490* -.2555 -.0167
Adhocracy (N) -.0808 .4442* -.2847 -.3880*
Clan (N) -.6095* .2072 -.4323* -.4323* .1027
* p < .05
Pearson Correlation Coefficients between the variables found in Table 19 was examined
for a linear relationship using an alpha of 0.05. There was a positive relationship between
culture dimension variables of Group and Competing Values Framework Adhocracy Now (r =
0.4442, p = 0.0109), and Grid and Hierarchy Now (r = 0.3505, p = 0.0492), and Market Now (r
= 0.4490, p = 0.0099). There was a strong negative relationship between Grid and Competing
Values Framework Clan Now (r = -0.6095, p = <0.001).
Canonical Correlation Analysis
A canonical correlation analysis of the variables was conducted to evaluate the
multivariate relations between the two sets of variables for the Grid and Group and Competing
Values Framework and the full canonical model was statistically significant for all canonical
correlations (Wilks’ Lambda .456, F[6, 54] = 4.327, p = 0.001). The model confirms that 54.4%
was the overall effect explained by the relationship of these two sets of variables (Sherry &
Henson, 2005). The second canonical correlation was not as significant (Wilks’ Lambda .855,
F[2,28] = 2.376, p = 0.111). Since the model was statistically significant and had a large effect
size, further analysis was warranted to determine which combination of variables explains the
effect.
Canonical variates. The canonical correlation coefficients for the first function was
(0.6830) and (0.3809) for the second function. In the first function as depicted in tables 21 and

58
22, the structured coefficients were evaluated for a relationship of the canonical variables. For
the structure coefficients, the Grid was more closely related to the first canonical function
(-0.8565) and Group (-0.8567) was more closely related to the second function. The Clan Now
(0.9211) / Market Now (-0.7562) dimension and Hierarchy (-0.6395) was more closely related to
the first function and Clan Now (0.3595) for the second. The squared structure coefficients
indicate that 73.4% of the variation in U1 was explained by the variation in V1, whereas only
26.6% of variation in U2 was explained by V2.
An orthogonal Varimax rotation was performed and a comparison of rotated and un-
rotated structure. It appears that the Grid and Clan/Market (Now) have the most effect on the
first canonical function which is consistent with the un-rotated. The rotated functions also
indicated a mild relationship of Group and Hierarchy Now/Market Now for the second function.
Table 20 provides a succinct summary of the interpreted meanings of each canonical
variate.
Table 20
Summary of Canonical Variate Interpretations
Canonical Variate Interpretation (Constructs)
U1 "Grid"
U2 "Group"
V1 "Clan/Market Now"
V2 “Clan Now”
Table 21
Loadings for the Grid and Group Canonical Variates
Variable
Canonical Variates
U1 U2
Grid -.8565 -.5162
Group .5159 -.8567
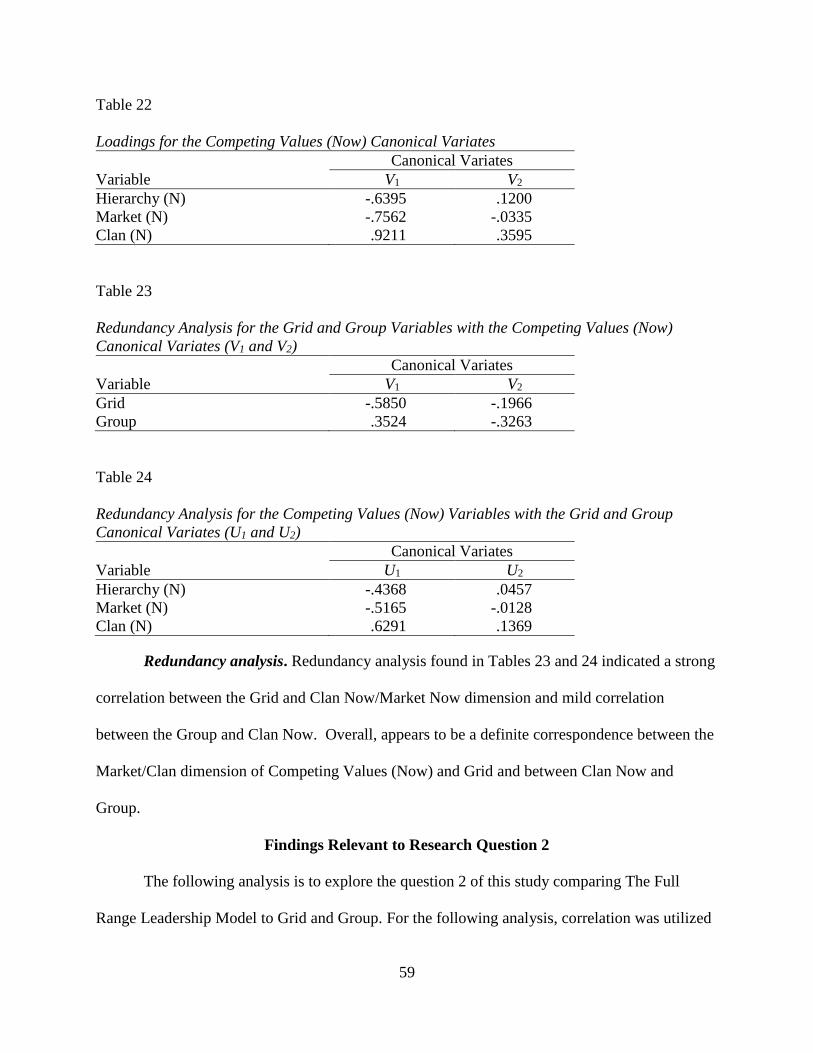
59
Table 22
Loadings for the Competing Values (Now) Canonical Variates
Variable
Canonical Variates
V1 V2
Hierarchy (N) -.6395 .1200
Market (N) -.7562 -.0335
Clan (N) .9211 .3595
Table 23
Redundancy Analysis for the Grid and Group Variables with the Competing Values (Now)
Canonical Variates (V1 and V2)
Variable
Canonical Variates
V1 V2
Grid -.5850 -.1966
Group .3524 -.3263
Table 24
Redundancy Analysis for the Competing Values (Now) Variables with the Grid and Group
Canonical Variates (U1 and U2)
Variable
Canonical Variates
U1 U2
Hierarchy (N) -.4368 .0457
Market (N) -.5165 -.0128
Clan (N) .6291 .1369
Redundancy analysis. Redundancy analysis found in Tables 23 and 24 indicated a strong
correlation between the Grid and Clan Now/Market Now dimension and mild correlation
between the Group and Clan Now. Overall, appears to be a definite correspondence between the
Market/Clan dimension of Competing Values (Now) and Grid and between Clan Now and
Group.
Findings Relevant to Research Question 2
The following analysis is to explore the question 2 of this study comparing The Full
Range Leadership Model to Grid and Group. For the following analysis, correlation was utilized

60
to first evaluate the results for the combined variables of Transformational and Transactional
Leadership of the Full Range Leadership Model and the relationship to Grid and Group.
According to Avolio and Bass (2004), the factors for Transformational Leadership include:
Idealized Influence Attributed, Idealized Influence Behavior, Individualized Consideration,
Intellectual Stimulation, and Inspirational Motivation. The Factors for Transactional Leadership
include: Contingent Reward, Management by Exception Active, and Management by Exception
Passive. Following the analysis of the combined factors of Transformational and Transactional
Leadership of the Full Range Leadership Model compared to the Grid and Group, correlations
were then run for the individual Transformational and Transactional factors compared to Grid
and Group.
Bivariate Correlations
A scatter plot in Figure 6 indicated a positive correlation between the Social Game results
and the (combined) factors for Transformational and Transactional of the Full Range Leadership
Model results.
Figure 6. Matrix of scatterplots for Grid and Group composite scores and the Full Range
Leadership Model combined factors for Transformational and Transactional composite scores.
Grid
Group
Transformational
Transactional
0 2 4 6
2
4
6
2 4 6
0
5
0 5
2
3
4

61
A scatterplot matrix in Figure 7 and 8 depicted significances between the factors of the
Grid and Group and five Transformational and three Transactional leadership factors of the Full
Range Leadership Model. There was positive correlation between the Social Game results and
the factors of Transformational and Transactional Leadership results of the Full Range
Leadership Model.
Figure 7. Matrix of scatterplots for Grid and Group composite scores and the Transformational
Factors of the Full Range Leadership Model.
Grid
Group
IdealizedInfluenceAttributed
IdealizedInfluenceBehavior
IndividualizedConsideration
InspirationalMotivation
IntellectualStimulation
0 2 4 6
2
4
6
2 4 6
0
5
0 5
0
5
0 5
0
5
0 5
0
5
0 5
2
3
4
5

62
Figure 8. Matrix of scatterplots for Grid and Group composite scores and Full Range Model
Transactional scores.
Pearson Correlation Coefficients between the variables found in Table 25 was examined
for a linear relationship using an alpha of 0.05. There was not a significant relationship
identified with the Grid and Group results and the (combined) factors for Transformational and
Transactional of the Full Range Leadership Model results.
Table 25
Correlations for Grid/Group and the Full Range Leadership Model combined factors for
Transformational and Transactional Composite Scores
Grid Group Transformational Factors
Group .0067
Transformational Factors .0144 .2601
Transactional Factors .1836 -.2482 .3066
* p < .05
Grid
Group
ContingentReward
Managementby
ExceptionActive
Managementby
ExceptionPassive
0 2 4 6
2
4
6
2 4 6
0
5
0 5
1
2
3
4
1 2 3 4
0
5

63
Pearson Correlation Coefficients between the variables found in Table 26 was examined
for a linear relationship. For the factors associated with Transformational Leadership, there was a
significant linear relationship identified between the Transformational factor of Intellectual
Stimulation and the Social Game Group (r = 0.4055, p = 0.0192). There was also a strong
relationship among the five leadership behaviors associated with Transformational Leadership.
Pearson Correlation coefficients found in Table 27 were then examined for Grid and
Group and behavior factors associated with Transactional Leadership. There was a significant
negative correlation between Group and Full Range Leadership Model Management by
Exception Passive behavior associated with Transactional Leadership (r = -0.4278, p = 0.0130).
There was also a mildly negative relationship between the Management by Exception Passive
behavior and the Contingent Reward behavior (r = -0.3923, p = -0.0239).
Canonical Correlation Analysis
Transformational and Transactional Leadership factors (combined) and Grid and
Group. The overall model fit was statistically significant with testing Roy’s Largest Root.
(Roy’s Largest Root .273, F[2, 30] = 4.098, p = 0.027; Wilks’ lambda .778, F (4, 58) = 1.944,
p = 0.115). The significance for group 1-2 was run (Wilks’ lambda .778, F (4, 58) = 1.944,
p = 0.115). The model indicated that 22.2% was the overall effect explained by the relationship
of these two sets of variables.

64
Tab
le 2
6
Corr
elati
ons
for
Gri
d/G
roup a
nd F
ull
Range
Lea
der
ship
Model
for
Tra
nsf
orm
ati
onal
Lea
der
ship
Insp
irat
ional
Moti
vat
ion
.8219*
Indiv
idual
ized
Consi
der
atio
n
.8804*
.8936*
Idea
lize
d
Infl
uen
ce
(Beh
avio
r)
.8915*
.8964*
.8820*
Idea
lize
d
Infl
uen
ce
(Att
ribute
d)
.8647*
.9110*
.8805*
.8274*
Gro
up
.2305
.2269
.2290
.1731
.4055*
Gri
d
.0067
.0884
-.0434
-.0267
.0942
-.0740
Gro
up
Idea
lize
d
Infl
uen
ce
(Att
ribute
d)
Idea
lize
d
Infl
uen
ce
(Beh
avio
r)
Indiv
idual
ized
Consi
der
atio
n
Insp
irat
ional
Moti
vat
ion
Inte
llec
tual
Sti
mula
tion
* p
< .
05

65
Table 27
Correlations for Grid/Group and Full Range Model for Transactional Leadership
Grid Group
Contingent
Reward
Management by
Exception (Active)
Group .0067
Contingent Reward .0583 .1721
Management by Exception (Active) -.2673 -.0857 -.2423
Management by Exception (Passive) -.1008 -.4278* -.3923* .1361
* p < .05
Canonical variates. The canonical correlation coefficients for the first function was
0.4632 and 0.1002 for the second function. For the structure coefficients, the Group (0.9285)
was more closely related to the first canonical function and Grid (-0.9260) was more closely
related to the second function. Combined factors for Transactional Leadership factors (-0.6434)
was related to the first function. Combined factors for Transformational Leadership factors
(0.8471) was related to the second function. However, there appeared to be a strong relationship
with both factors for each functions. The squared structure coefficients indicate that 86.2 % of
the variation in U1 was explained by the variation in V1, whereas only 14.3% of variation in U2
was explained by V2. An Orthogonal Varimax rotation was performed and found that Grid (-
0.9788) was strongly related to Transactional Leadership (0.9944) and Group (0.9775) was
related to Transformational Leadership (0.9142). Table 28 provides a succinct summary of the
interpreted meanings of each canonical variate.
Table 28
Summary of (Rotated) Canonical Variate Interpretations
Canonical Variate Interpretation (Constructs)
U1 "Grid"
U2 "Group"
V1 "Transactional"
V2 “Transformational”

66
Table 29
Loadings for the Grid and Group Canonical Variates (Rotated)
Variable
Canonical Variates
U1 U2
Grid -.9788 -.2046
Group -.2111 .9775
Table 30
Loadings for the Full Range Leadership (Combined factors) Canonical Variates (Rotated)
Variable
Canonical Variates
V1 V2
Transformational Factors .4052 .9142
Transactional Factors .9944 -.1054
Table 31
Redundancy Analysis for the Grid and Group Variables with the Full Range Leadership
(Combined Factors) Canonical Variates (V1 and V2)
Variable
Canonical Variates
V1 V2
Grid .1749 -.0928
Group .4301 .0372
Table 32
Redundancy Analysis for the Full Range Leadership (Combined factors) Variables with the Grid
and Group Canonical Variates (U1 and U2)
Variable
Canonical Variates
U1 U2
Transformational Factors .2462 .0849
Transactional Factors -.2980 .0767
Redundancy analysis. A redundancy analysis of the combined factors for
Transformational and Transactional leadership in Tables 31 and 32 found that Grid (rotated
variates) dimension predicted Transactional Leadership and some Transformational and Group
predicted Transformational Leadership and some Transactional Leadership combined factors.

67
Transformational Leadership factors and Grid and Group. In the analysis of the
factors associated with Transformational Leadership and Grid and Group, the significance of the
overall model fit was significant with Roy’s largest root (Wilks’ lambda .599, F[10,52] = 1.521,
p = 0.158; Roy’s Largest root .454, F[5, 27] = 2.453, p = 0.059). The canonical significance for
group 1-2 was run (Wilks’ lambda .599, F[10,52] = 1.521, p = 0.158). The canonical
significance of group two was not as significant (Wilks’ Lambda .870, F[4, 27] = 1.005, p =
0.422). The model detected that 40.1% was the overall effect explained by the relationship of
these two sets of variables.
Canonical variates. The canonical correlation coefficients for the first function was
0.5589 and 0.3600 for the second function. For the structure coefficients found in Tables 34 and
35, the Group (-0.9334) was more closely related to the first canonical function and Grid
(0.9357) was more closely related to the second function. The Intellectual Stimulation (-0.7264)
was more closely related to the first function and Idealized Influence Attributed (0.4549) and
Inspirational Motivation (0.4139) was more closely related to the second function. The squared
structure coefficients indicate that 87.6 % of the variation in U1 was explained by the variation in
V1, whereas only 12.4% of variation in U2 was explained by V2. An Orthogonal Varimax
rotation was performed and a comparison of rotated and un-rotated structure. It appears that the
Group and Intellectual Stimulation have the most effect on the first canonical function. Grid and
Idealized Influenced Attributed have the most effect on the second function.
Table 33 provides a succinct summary of the interpreted meanings of each canonical
variate.
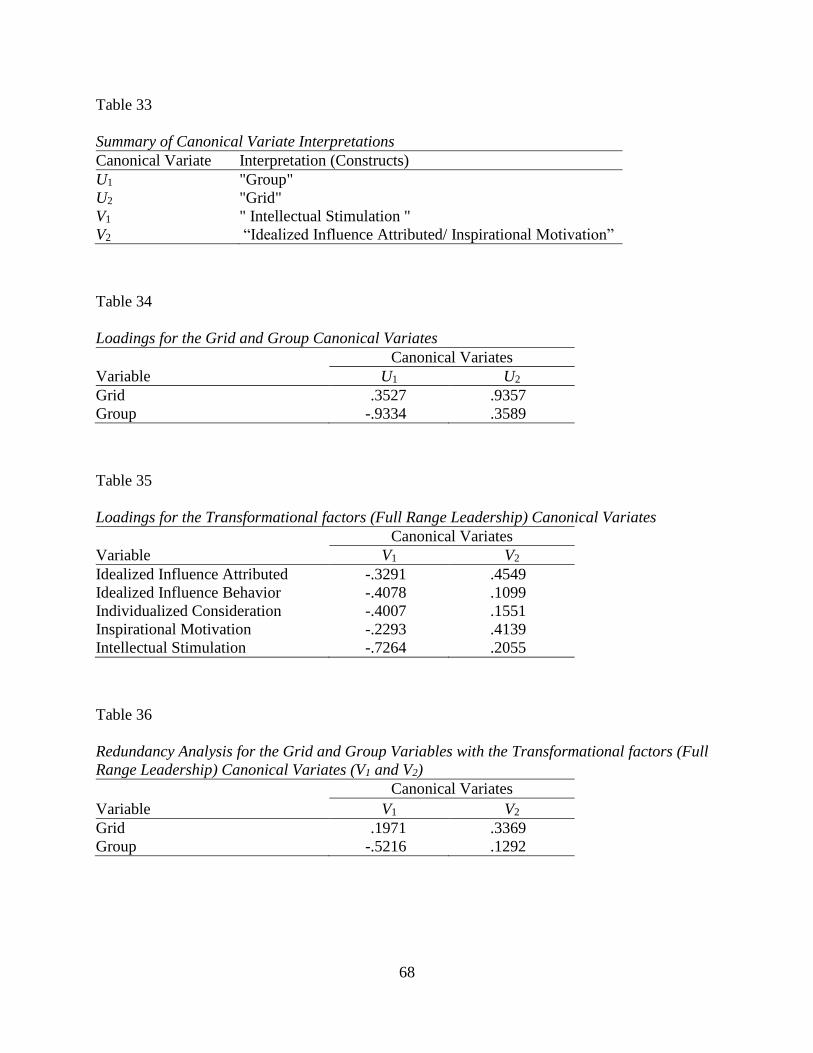
68
Table 33
Summary of Canonical Variate Interpretations
Canonical Variate Interpretation (Constructs)
U1 "Group"
U2 "Grid"
V1 " Intellectual Stimulation "
V2 “Idealized Influence Attributed/ Inspirational Motivation”
Table 34
Loadings for the Grid and Group Canonical Variates
Variable
Canonical Variates
U1 U2
Grid .3527 .9357
Group -.9334 .3589
Table 35
Loadings for the Transformational factors (Full Range Leadership) Canonical Variates
Variable
Canonical Variates
V1 V2
Idealized Influence Attributed -.3291 .4549
Idealized Influence Behavior -.4078 .1099
Individualized Consideration -.4007 .1551
Inspirational Motivation -.2293 .4139
Intellectual Stimulation -.7264 .2055
Table 36
Redundancy Analysis for the Grid and Group Variables with the Transformational factors (Full
Range Leadership) Canonical Variates (V1 and V2)
Variable
Canonical Variates
V1 V2
Grid .1971 .3369
Group -.5216 .1292

69
Table 37
Redundancy Analysis for the Transformational factors (Full Range Leadership) Variables with
the Grid and Group Canonical Variates (U1 and U2)
Variable
Canonical Variates
U1 U2
Idealized Influence Attributed -.1839 .1638
Idealized Influence Behavior -.2279 .0396
Individualized Consideration -.2239 .0558
Inspirational Motivation -.1281 .1490
Intellectual Stimulation -.4060 .0740
Redundancy analysis. Redundancy analysis found in Tables 36 and 37 indicated a fairly
significant moderate correlation between the Group and Intellectual Stimulation dimension. The
Grid and Idealized Influenced Attributed Inspirational Motivation are mildly correlated for the
second function.
Transactional Leadership factors and Grid and Group. In the Canonical Correlation
analysis of the factors associated with Transactional Leadership and Grid and Group, the
significance of the overall model fit was mildly significant with Roy’s Largest Root (Wilks’
lambda .752, F(6, 56) = 1.432, p = 0.219; Roy’s Largest root .254, F[3, 29] = 2.459, p = 0.083).
The canonical significance of group 1-2 and group two were not as significant (Wilks’ Lambda
752, F(6, 56) = 1.432, p = 0.219; Wilks’ Lambda .943, F(2, 29) = 0.879, p = 0.426). The model
indicated that 24.8% was the overall effect was explained by the relationship of these two sets of
variables.
Canonical variates. The canonical correlation coefficient for the first function was .4503
and 0.2391 for the second function. Group (-0.9326) was strongly related to the first function and
Grid (-0.9302) was strongly correlated to the second function. Management by Exception Passive
(0.9645) was related to the first function and Management by Exception Active (0.9111) for the
second function. The squared structure coefficients indicate that 87 % of the variation in U1 was

70
explained by the variation in V1, whereas only 13.5% of variation in U2 was explained by V2.
Orthogonal Varimax rotation indicated similar findings to the un-rotated findings. Table 38
provides a succinct summary of the interpreted meanings of each canonical variate.
Table 38
Summary of Canonical Variate Interpretations
Canonical Variate Interpretation (Constructs)
U1 "Group"
U2 "Grid"
V1 " Management by Exception Passive "
V2 “Management by Exception Active”
Table 39
Loadings for the Grid and Group Canonical Variates
Variable
Canonical Variates
U1 U2
Grid -.3671 -.9302
Group -.9326 .3609
Table 40
Loadings for the Transactional Factors (Full Range Leadership) Canonical Variates
Variable
Canonical Variates
V1 V2
Contingent Reward -.4023 .0370
Management by Exception (Active) .3912 .9111
Management by Exception (Passive) .9645 -.2639
Table 41
Redundancy Analysis for the Grid and Group Variables with the Transactional Factors (Full
Range Leadership) Canonical Variates (V1 and V2)
Variable
Canonical Variates
V1 V2
Grid -.1653 -.2224
Group -.4200 .0863
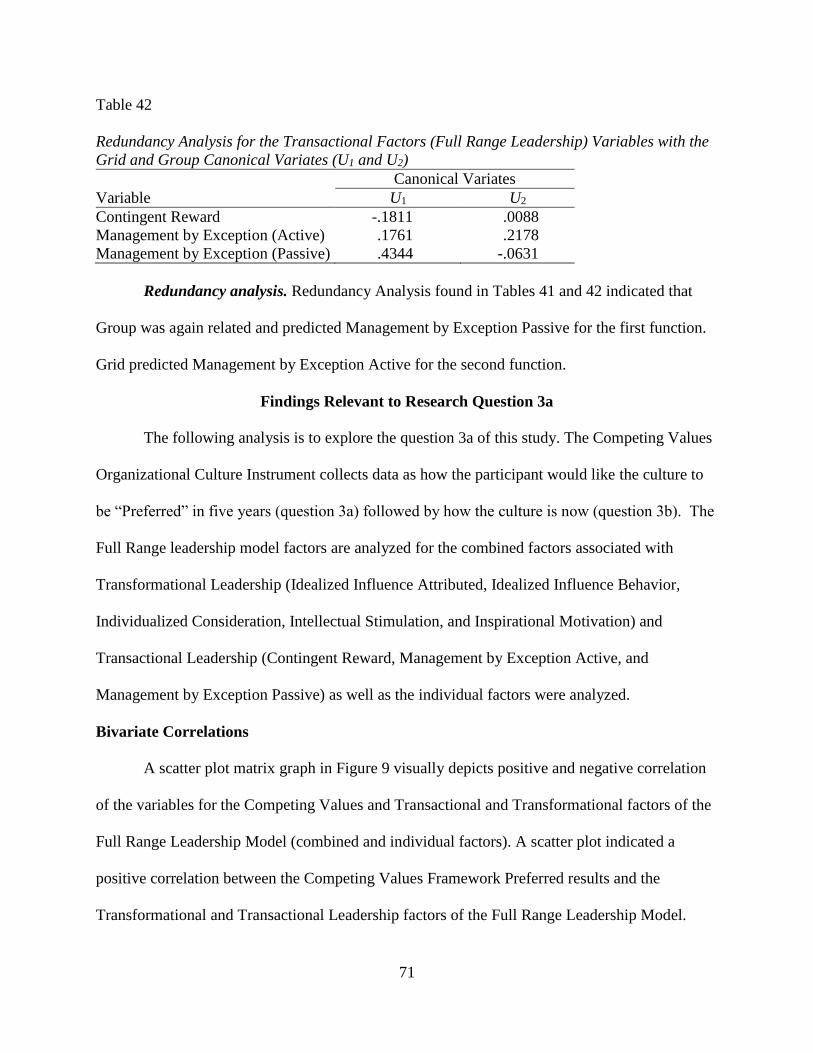
71
Table 42
Redundancy Analysis for the Transactional Factors (Full Range Leadership) Variables with the
Grid and Group Canonical Variates (U1 and U2)
Variable
Canonical Variates
U1 U2
Contingent Reward -.1811 .0088
Management by Exception (Active) .1761 .2178
Management by Exception (Passive) .4344 -.0631
Redundancy analysis. Redundancy Analysis found in Tables 41 and 42 indicated that
Group was again related and predicted Management by Exception Passive for the first function.
Grid predicted Management by Exception Active for the second function.
Findings Relevant to Research Question 3a
The following analysis is to explore the question 3a of this study. The Competing Values
Organizational Culture Instrument collects data as how the participant would like the culture to
be “Preferred” in five years (question 3a) followed by how the culture is now (question 3b). The
Full Range leadership model factors are analyzed for the combined factors associated with
Transformational Leadership (Idealized Influence Attributed, Idealized Influence Behavior,
Individualized Consideration, Intellectual Stimulation, and Inspirational Motivation) and
Transactional Leadership (Contingent Reward, Management by Exception Active, and
Management by Exception Passive) as well as the individual factors were analyzed.
Bivariate Correlations
A scatter plot matrix graph in Figure 9 visually depicts positive and negative correlation
of the variables for the Competing Values and Transactional and Transformational factors of the
Full Range Leadership Model (combined and individual factors). A scatter plot indicated a
positive correlation between the Competing Values Framework Preferred results and the
Transformational and Transactional Leadership factors of the Full Range Leadership Model.

72
Figure 9. Matrix of scatterplots for Grid and Group composite scores and the Full Range
Leadership Model (combined) factors for Transformational and Transactional composite scores.
A scatter plot in Figures 10 and 11 indicated a positive correlation between the
Competing Values Framework Preferred results and the factors associated with Transformational
(5 factors) and Transactional (3 factors) the Full Range Leadership Model.
Pearson Correlation Coefficients between the variables of the Competing Values
(Preferred) and the factors for Transformational and Transactional Leadership behaviors was
examined for a linear relationship using an alpha of 0.05 and reported in Table 43. There was
moderately significant negative relationship to Adhocracy Preferred (-.4029) and the combined
factors of Transactional Leadership.
Pearson Correlation Coefficient was run for the variables of Competing Values Preferred
and the five factors associated with Transformational Leadership in Table 43 and found that
there was nothing significant.
Hierarchy(P)
Market(P)
Adhocracy(P)
Clan(P)
Transformational
Transactional
10 20 30 40
0
20
40
0 20 40
10
20
30
40
10 20 30 40
0
50
100
0 50 100
0
5
0 5
2
3
4

73
Figure 10. Matrix of scatterplots for Competing Values Preferred composite scores and Full
Range Model Transformational scores.
Hierarchy(P)
Market(P)
Adhocracy(P)
Clan(P)
IdealizedInfluenceAttributed
IdealizedInfluenceBehavior
IndividualizedConsideration
InspirationalMotivation
IntellectualStimulation
10 20 30 40
0
20
40
0 20 40
10
20
30
40
10 20 30 40
0
50
100
0 50 100
0
5
0 5
0
5
0 5
0
5
0 5
0
5
0 5
2
3
4
5

74
Figure 11. Matrix of scatterplots for Competing Values Preferred composite scores and Full
Range Model Transactional scores.
Table 43
Correlations for Competing Values (Preferred) and the Full Range Leadership Model Composite
Scores
Hierarchy
(P)
Market
(P)
Adhocracy
(P)
Clan (P) Transformational
Factors
Market (P) .2542
Adhocracy (P) -.0009 .3245
Clan (P) -.5616* -.7466* -.5097*
Transformational Factors -.1454 -.1152 .0428 .2443
Transactional Factors .1026 -.1432 -.4029* .1943 .3066
* p < .05
Hierarchy(P)
Market(P)
Adhocracy(P)
Clan(P)
ContingentReward
Managementby
ExceptionActive
Managementby
ExceptionPassive
10 20 30 40
0
20
40
0 20 40
10
20
30
40
10 20 30 40
0
50
100
0 50 100
0
5
0 5
1
2
3
4
1 2 3 4
0
5

75
Tab
le 4
4
Corr
elati
ons
for
Com
pet
ing V
alu
es (
Pre
ferr
ed)
Com
posi
te S
core
s and F
ull
Range
Model
Tra
nsf
orm
ati
onal
Com
posi
te s
core
s
Hie
rarc
hy
(P)
.2542
Cla
n (
P)
-.5616*
-.7466*
Ad
ho
crac
y
(P)
-.5097*
-.0009
.3245
Inte
llec
tual
Sti
mula
tio
n
.0465
.2947
-.2354
-.0762
Insp
irat
ional
Moti
vat
ion
.8219*
.0296
.1326
-.0177
-.0549
Indiv
idual
ized
Consi
der
atio
n
.8804*
.8936*
.0116
.2362
-.1209
-.1439
Idea
lize
d
Infl
uen
ce
(Beh
avio
r)
.8915*
.8964*
.8820*
.0468
.2597
-.1545
-.1332
Idea
lize
d
Infl
uen
ce
(Att
ribu
ted
)
.8647*
.9110*
.8805*
.8274*
.0711
.2550
-.1872
-.1378
Idea
lize
d
Infl
uen
ce
(Beh
avio
r)
Indiv
idual
ized
Consi
der
atio
n
Insp
irat
ion
al
Moti
vat
ion
Inte
llec
tual
Sti
mula
tio
n
Adhocr
acy
(P
)
Cla
n (
P)
Hie
rarc
hy
(P
)
Mar
ket
(P
)
* p
< .
05

76
Pearson Correlation was run for the three factors associated with transactional leadership
and the variables of the Competing Values Preferred and reported in Table 45. Market Preferred
was negatively correlated with Management by Exception Active (r = -0.4126, p = 0.0189), and
Adhocracy Preferred was negatively correlated with Management by Exception Active (r = -
0.4754, p = 0.0060).
Table 45
Correlations for Competing Values (Preferred) Composite Scores and Full Range Model
Transactional Composite scores
Hierarchy
(P)
Market
(P)
Adhocracy
(P) Clan (P)
Contingent
Reward
Management by
Exception
(Active)
Market (P) .2542
Adhocracy (P) -.0009 .3245
Clan (P) -.5616* -.7466* -.5097*
Contingent Reward -.0611 -.0091 .1506 .1108
Management by
Exception (Active) .1729 -.4126* -.4754* .2800 -.2423
Management by
Exception (Passive)
.0731
.1093
-.3360
-.0565
-.3923*
.1361
* p < .05
Canonical Correlation Analysis
Transformational and Transactional Leadership factors (combined) and Competing
Values (Preferred). The significance of the overall model fit was tested (Wilks’ Lambda .842, F
[6, 54] = 0.806, p = 0.570). The canonical function for group 1-2 was run (Wilks’ Lambda .842,
F [6, 54] = 0.806, p = 0.570). The canonical significance of group two was run (Wilks’ Lambda
Wilks' lambda .954, F[2, 28] = 0.674, p = 0.518). The model indicated that 15.8%% was the
overall effect was explained by the relationship of these two sets of variables.
Canonical variates. Reported in Tables 47 and 48, the canonical correlation coefficients
for the first function was 0.3423 and 0.2143 for the second function. Clan preferred (0.7171)
accounted for the first function and Hierarchy Preferred for the second function (-0.9702).

77
Transactional Leadership (0.9497) was related to the first function and Transformational
Leadership (0.8107) was related to the second function. The squared structure coefficients
indicate that 51.4% of the variation in U1 was explained by the variation in V1, whereas only
1.3% of variation in U2 was explained by V2. An Orthogonal Varimax rotation was performed
and found a strong relationship with Hierarchy Preferred - Clan Preferred for the first function,
and mild relationship of the same factors for the second function. There was a strong relationship
of Transformational factors for the first function and a strong relationship of Transactional
factors for the second function.
Table 46 provides a succinct summary of the interpreted meanings of each canonical
variate.
Table 46
Summary of Canonical Variate Interpretations
Canonical Variate Interpretation (Constructs)
U1 "Transactional"
U2 "Transformational"
V1 " Clan Preferred "
V2 “Hierarchy Preferred”
Table 47
Loadings for the factors (Combined) for Transactional and Transformational Leadership
Canonical Variates
Variable
Canonical Variates
U1 U2
Transformational Factors .5855 .8107
Transactional Factors .9497 -.3130
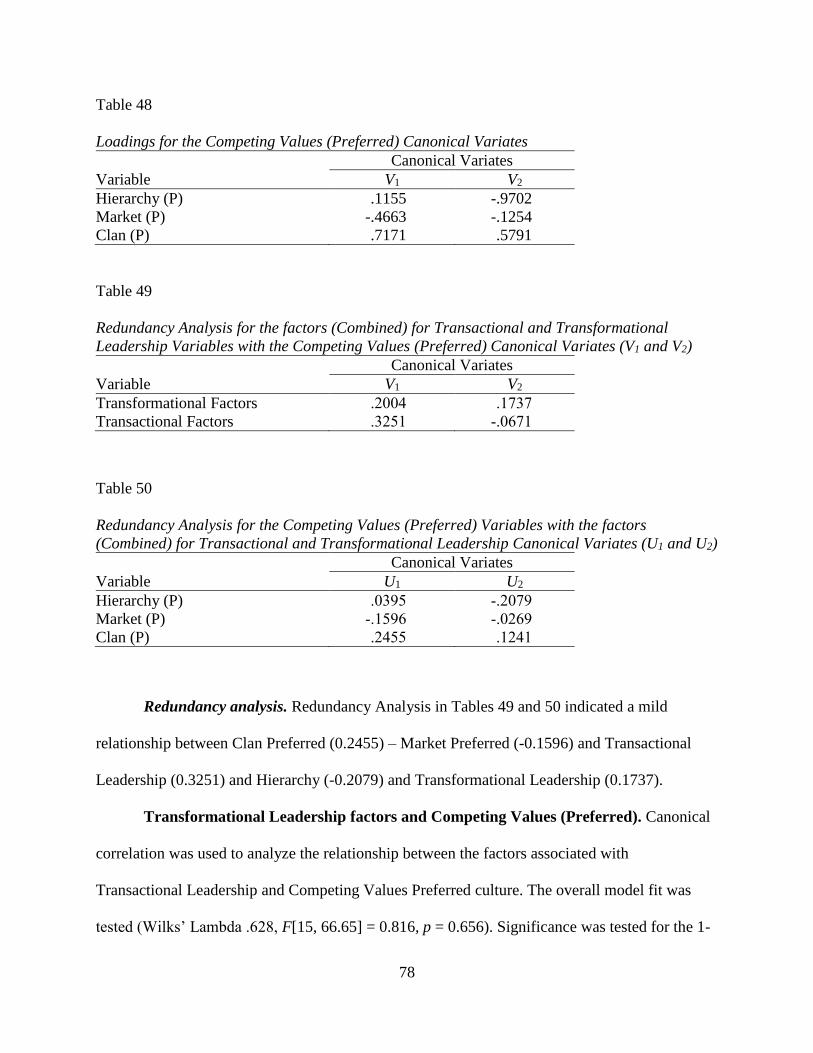
78
Table 48
Loadings for the Competing Values (Preferred) Canonical Variates
Variable
Canonical Variates
V1 V2
Hierarchy (P) .1155 -.9702
Market (P) -.4663 -.1254
Clan (P) .7171 .5791
Table 49
Redundancy Analysis for the factors (Combined) for Transactional and Transformational
Leadership Variables with the Competing Values (Preferred) Canonical Variates (V1 and V2)
Variable
Canonical Variates
V1 V2
Transformational Factors .2004 .1737
Transactional Factors .3251 -.0671
Table 50
Redundancy Analysis for the Competing Values (Preferred) Variables with the factors
(Combined) for Transactional and Transformational Leadership Canonical Variates (U1 and U2)
Variable
Canonical Variates
U1 U2
Hierarchy (P) .0395 -.2079
Market (P) -.1596 -.0269
Clan (P) .2455 .1241
Redundancy analysis. Redundancy Analysis in Tables 49 and 50 indicated a mild
relationship between Clan Preferred (0.2455) – Market Preferred (-0.1596) and Transactional
Leadership (0.3251) and Hierarchy (-0.2079) and Transformational Leadership (0.1737).
Transformational Leadership factors and Competing Values (Preferred). Canonical
correlation was used to analyze the relationship between the factors associated with
Transactional Leadership and Competing Values Preferred culture. The overall model fit was
tested (Wilks’ Lambda .628, F[15, 66.65] = 0.816, p = 0.656). Significance was tested for the 1-

79
3 function (Wilks’ Lambda .628, F[15, 66.65] = 0.816, p = 0.656). The significance for
function 2-3 was tested (Wilks’ Lambda .887, F[8, 50] = .3862, p = 0.923). The significance for
the third was tested (Wilks’ Lambda .967, F [3, 26] = 0.291, p = 0.831). The model indicated
that 37.2% was the overall effect that was explained by the relationship of these two sets of
variables.
Canonical variates. In the first function as depicted in tables 52 and 53 below, the
structured coefficients were evaluated for a relationship of the canonical variables. The
Canonical Correlation Coefficients for the first function was 0.5405, the second 0.2885, and
0.1803 for the third. For the canonical loading structure coefficients, the Hierarchy Preferred (-
0.8636) was related to the first function. Market Preferred (-0.9127) was more closely related to
the second function and the third function (0.833021). The Intellectual Stimulation (0.6305) was
closely related to the first function and Influence-Attributed (0.2505) and Individualized
Consideration (0.2390) was more closely related to the second function. The Idealized Influence
Attributed (0.06275) was closely related to the third function. The squared structure coefficients
indicate that 74.6 % of the variation in U1 was explained by the variation in V1, whereas only
1.8% of variation in was explained by V2, and 4.9% of the variation in U3 was explained by the
variation in V3.
Orthogonal Varimax rotation of the canonical loadings was performed and the first
function indicated a moderately strong relationship to Clan Preferred (0.6746). Market Preferred
(-0.9701) – Clan Preferred (0.5630) dimension was related to the second function, and Market
Preferred – Clan Preferred was also related to the third function. All the factors associated with
Transformational Leadership were related to the first function. Individualized Consideration

80
(0.4284) was related to the second function. Idealized Influence Attributed (0.2775) and
Inspirational Motivation (0.2317) was related to the third function.
Table 51 provides a succinct summary of the interpreted meanings of each canonical
variate.
Table 51
Summary of Canonical Variate Interpretations
Canonical Variate Interpretation (Constructs)
U1 "Hierarchy/Clan Preferred"
U2 "Market Preferred"
U3 “Clan Preferred"
V1 “The Intellectual Stimulation”
V2 “Idealized Influence Attributed /Individualized
Consideration”
V3 “Idealized Influence Behavior/Individualized
Consideration/Inspirational Motivation/Intellectual
Stimulation”
Table 52
Loadings for the Competing Values (Preferred) Canonical Variates
Variable
Canonical Variates
U1 U2 U3
Hierarchy (P) -.8636 -.3172 .3920
Market (P) -.1344 -.9127 -.3860
Clan (P) .6996 .4986 .5119
Table 53
Loadings for the Transformational Leadership Canonical Variates
Variable
Canonical Variates
V1 V2 V3
Idealized Influence (Attributed) .4390 .2505 .5743
Idealized Influence (Behavior) .4211 .1732 .8185
Individualized Consideration .3353 .2390 .8129
Inspirational Motivation .1723 -.0549 .8158
Intellectual Stimulation .6305 -.0779 .7315

81
Table 54
Redundancy Analysis for the Competing Values (Preferred) Variables with the Transformational
Leadership Canonical Variates (V1 and V2)
Variable
Canonical Variates
V1 V2 V3
Hierarchy (P) -.4667 -.0915 .0707
Market (P) -.0727 -.2633 -.0696
Clan (P) .3781 .1438 .0923
Table 55
Redundancy Analysis for the Transformational Leadership Variables with the Competing Values
(Preferred) Canonical Variates (U1 and U2)
Variable
Canonical Variates
U1 U2 U3
Idealized Influence (Attributed) .2373 .0723 .1035
Idealized Influence (Behavior) .2276 .0500 .1476
Individualized Consideration .1812 .0689 .1466
Inspirational Motivation .0931 -.0158 .1471
Intellectual Stimulation .3408 -.0225 .1319
Redundancy analysis. Redundancy analysis in Tables 54 and 55 indicated that
Hierarchy/Clan Preferred was related to Intellectual Stimulation. The rotated variates indicated
the relationship was related to Clan Preferred. There was nothing overall significant with the
second or third functions.
Transactional Leadership factors and Competing Values (Preferred). Canonical
correlation was used to analyze the relationship between the factors associated with
Transactional Leadership and Competing Values Preferred culture. The overall model fit was
evaluated and was significant with testing Roy’s Largest Root (Wilks’ Lambda .658, F[9, 63.43]
= 1.32, p = 0.243; Roy's largest root .425, F[ 3, 28] = 3.971, p = 0.018). Significance was tested
for functions 1-3 (Wilks’ Lambda .658, F[9, 63.43] = 1.32, p = 0.243). The significance for
function 2-3 was tested (Wilk’s Lambda .938, F[4,54] = 0.493, p = 0.780). The third function
82
was also tested (Wilk’s Lambda .991, F[1,28] = 0.257, p = 0.617). Therefore, 34.2% was the
overall effect explained by the relationship of these two sets of variables in the model.
Canonical variates. The Canonical Correlation Coefficients for the first function was
0.5463, the second 0.2312, and 0.0953 for the third as reported in Tables 57 and 58. Market
Preferred (-0.8093) - Clan Preferred (0.5750) are related to the first function. Market Preferred
(0.3245) – Clan Preferred (0.2882) are related to the second function. Hierarchy Preferred
(0.9589) was related to the third function.
Management by Exception Active (0.9599) was related to the first function. Contingent
Reward (0.6067) was related to the second function, and Management by Exception Passive
(0.8804) was related to the third function. The squared structure coefficients indicate that 33-65.5
% of the variation in U1 was explained by the variation in V1 and by V2, and 7.9% of the variation
in U3 was explained by the variation in V3.
Rotated Orthogonal Varimax was performed and for the first function and Hierarchy
(0.7783) and some Market Preferred (0.5183) accounted for the first function, Market Preferred
(-0.8361) and some Clan Preferred (0.5039) for the second and Clan Preferred (0.7878) and
some Hierarchy Preferred (0.5530) for the third. Management by Exception Passive (0.9664)
was related to the first function, and Management by exception Active (0.9583) for the second
function and contingent reward (0.9741) for the third.
Table 56 provides a succinct summary of the interpreted meanings of each canonical
variate.

83
Table 56
Summary of Canonical Variate Interpretations
Canonical Variate Interpretation (Constructs)
U1 "Market Preferred"
U2 "Market/Clan Preferred"
U3 “Hierarchy/Clan Preferred"
V1 “Management by Exception Active”
V2 “Contingent Reward”
V3 “Management by Exception Passive/Contingent Reward”
Table 57
Loadings for the Competing Values (Preferred) Canonical Variates
Variable
Canonical Variates
U1 U2 U3
Hierarchy (P) .2812 .0382 .9589
Market (P) -.8093 .3245 .4895
Clan (P) .5750 .2882 -.7657
Table 58
Loadings for the Transactional Leadership Canonical Variates
Variable
Canonical Variates
V1 V2 V3
Contingent Reward .0397 .6067 -.7940
Management by Exception
(Active) .9599 -.0161 .2798
Management by Exception
(Passive) -.0748 .4683 .8804
Table 59
Redundancy Analysis for the Competing Values (Preferred) with the Transactional Leadership
Canonical Variates (V1 and V2)
Variable
Canonical Variates
V1 V2 V3
Hierarchy (P) .1536 .0088 .0914
Market (P) -.4422 .0750 .0466
Clan (P) .3141 .0666 -.0730

84
Table 60
Redundancy Analysis for the Transactional Leadership Variables with the Competing Values
(Preferred) Canonical Variates (U1 and U2)
Variable
Canonical Variates
U1 U2 U3
Contingent Reward .0217 .1403 -.0757
Management by Exception
(Active) .5244 -.0037 .0267
Management by Exception
(Passive) -.0409 .1083 .0839
Redundancy analysis. Redundancy analysis in Tables 59 and 60 indicated a correlation
between Market/Clan Preferred and Management by Exception Active for the first function. The
second and third function did not indicate a strong relationship. The rotated variates indicated a
relationship to Management by Exception Passive.
Findings Relevant to Research Question 3b
The following analysis is to explore the research question 3b of this study. The data
collected from the Competing Values Organizational Culture Assessment Instrument asked the
participants how they would rate their company right now. This will be compared to the data
collected from the Full Range Leadership Model Multifactor Leadership Questionnaire 5X
(Transformational and Transactional Behaviors). The Full Range leadership model factors are
analyzed for the combined factors associated with Transformational Leadership (Idealized
Influence Attributed, Idealized Influence Behavior, Individualized Consideration, Intellectual
Stimulation, and Inspirational Motivation) and Transactional Leadership (Contingent Reward,
Management by Exception Active, and Management by Exception Passive) as well as the
individual factors were analyzed.

85
Bivariate Correlations
A scatter plot in Figure 12 indicated a positive correlation between Competing Values
Now and the (combined) factors for Transformational and Transactional results of the Full
Range Leadership Model results.
Figure 12. Matrix of scatterplots for Competing Values Now composite scores and Full Range
Model combined factors for Transformational and Transactional Composite scores.
A scatter plot in Figures 13 and 14 indicated a positive correlation between the results of
the Competing Values Now and the five factors for Transformational Leadership and the three
factors for Transactional Leadership of the Full Range Leadership Model.
Hierarchy(N)
Market(N)
Adhocracy(N)
Clan(N)
Transformational
Transactional
0 20 40
0
20
40
60
0 20 40 60
10
20
30
10 20 30
0
50
100
0 50 100
0
5
0 5
2
3
4

86
Figure 13. Matrix of scatterplots for Competing Values Now composite scores and Full Range
Model Transformational scores.
Hierarchy(N)
Market(N)
Adhocracy(N)
Clan(N)
IdealizedInfluenceAttributed
IdealizedInfluenceBehavior
IndividualizedConsideration
InspirationalMotivation
IntellectualStimulation
0 20 40
0
20
40
60
0 20 40 60
10
20
30
10 20 30
0
50
100
0 50 100
0
5
0 5
0
5
0 5
0
5
0 5
0
5
0 5
2
3
4
5

87
Figure 14. Matrix of scatterplots for Competing Values Now composite scores and Full Range
Model Transactional scores.
Pearson Correlation Coefficients between the variables of the Competing Values (Now)
and the combined factors for Transformational and Transactional Leadership behaviors reported
in Table 61 was examined for a linear relationship using an alpha of 0.05. It was determined that
Market Now (-0.4157) was negatively correlated and Clan Now (0.3577) was positively
Correlated with the combined factors associated with transformational Leadership.
Hierarchy(N)
Market(N)
Adhocracy(N)
Clan(N)
ContingentReward
Managementby
ExceptionActive
Managementby
ExceptionPassive
0 20 40
0
20
40
60
0 20 40 60
10
20
30
10 20 30
0
50
100
0 50 100
0
5
0 5
1
2
3
4
1 2 3 4
0
5

88
Table 61
Correlations for Competing Values Now Composite Scores and Full Range Model Composite
scores
Hierarchy
(N)
Market
(N)
Adhocracy
(N) Clan (N)
Transformational
Factors
Market (N) -.0167
Adhocracy (N) -.2847 -.3880*
Clan (N) -.4323* -.8063* .1027
Transformational Factors -.1321 -.4157* .2906 .3577*
Transactional Factors -.1630 .0580 -.3065 .1727 .3066
* p < .05
Pearson Correlation Coefficients between the variables of the Competing Values
(Preferred) and the five factors for Transformational and three factors for Transactional
Leadership behaviors was examined for a linear relationship using an alpha of 0.05 and reported
in Table 62. For the factors associated with transformational Leadership, Market Now was
negatively correlated with Idealized Influence Attributed (r = -0.4318, p = 0.0136),
Individualized Consideration (r = - 0.4447, p = 0.0108), and Intellectual Stimulation (r = -
0.4869. p = -0.0047). Clan Now was positively correlated with Individualized Consideration (r =
0.3595, p = 0.0433), Idealized Influence Attributed (r = 0.4250, p = 0.0153), and Intellectual
Stimulation (r = 0.4231, p = 0.0158). Adhocracy Now was positively correlated with Intellectual
Stimulation (r = 0.4359, p = 0.0126).
Pearson Correlation Coefficient was run for factors of the Competing Values Now and
the Transactional Leadership behaviors and reported in Table 63. Contingent Reward was
negatively correlated with Market Now (r = -0.3621, p = 0.0417), Management by Exception
Passive was positively correlated with Market Now (r = 0.4198, p = 0.0167). Management by
Exception Passive was negatively correlated with Adhocracy Now (r = -0.4108, p = 0.0195).

89
Tab
le 6
2
Corr
elati
on
s fo
r C
om
pet
ing
Va
lues
Now
Com
posi
te S
core
s and F
ull
Range
Mo
del
Tra
nsf
orm
ati
on
al
Co
mp
osi
te S
core
s
Hie
rarc
hy
(N)
-.0167
Cla
n
(N)
-.4323*
-.8063*
Ad
ho
crac
y
(N)
.1027
-.2847
-.3880*
Inte
llec
tual
Sti
mula
tio
n
.4359*
.4231*
-.2359
-.4869
*
Insp
irat
ional
Moti
vat
ion
.8219*
.2444
.2153
-.0527
-.2971
Indiv
idual
ized
Consi
der
atio
n
.8804*
.8936*
.2798
.3595*
-.0770
-.4447*
Idea
lize
d
Infl
uen
ce
(Beh
avio
r)
.8915*
.8964*
.8820*
.2297
.2828
-.1262
-.3160
Idea
lize
d
Infl
uen
ce
(Att
ribu
ted
)
.8647*
.9110*
.8805*
.8274*
.2091
.4250*
-.1586
-.4318*
Idea
lize
d
Infl
uen
ce
(Beh
avio
r)
Indiv
idual
ized
Consi
der
atio
n
Insp
irat
ion
al
Moti
vat
ion
Inte
llec
tual
Sti
mula
tio
n
Adhocr
acy
(N
)
Cla
n (
N)
Hie
rarc
hy
(N
)
Mar
ket
(N
)
* p
< .
05

90
Table 63
Correlations for Competing Values Preferred Composite Scores and Full Range Model
Transactional Composite scores
Hierarchy
(N)
Market
(N)
Adhocracy
(N) Clan (N)
Contingent
Reward
Management
by Exception
(Active)
Market (N) -.0167
Adhocracy (N) -.2847 -.3880*
Clan (N) -.4323* -.8063* .1027
Contingent
Reward
-.0034 -.3621* .2094 .2667
Management by
Exception
(Active)
.0953 .0242 -.2734 .0428 -.2423
Management by
Exception
(Passive)
-.2672 .4198* -.4108* -.0786 -.3923* .1361
* p < .05
Spearman Correlation reported in Table 64 indicated a positive relationship between the
combined factors associated with Transformational Leadership (Idealized Influence-Attributed,
Idealized Influence-Behavior, Individualized Consideration, Intellectual Stimulation, and
Inspirational Motivation), and Clan Now (r = 0.4514) and negative correlation with Market Now
(r = -0.5019).
Table 64
Spearman Correlations for Competing Values (Now) Composite Scores and Full Range Model
Composite Scores
Transformational
Factors
Transactional
Factors
Hierarchy
(N)
Market
(N)
Adhocracy
(N)
Transactional Factors .2975
Hierarchy (Now) -.1485 -.0859
Market (N) -.5019* -.0639 .0875
Adhocracy (N) .2925 -.2933 -.3194 -.2984
Clan (N) .4514* .1329 -.4649* -.8206* .1328
* p < .05

91
Canonical Correlation Analysis
Transformational Leadership factors (Combined) and Competing Values (Now). A
Canonical Correlation was run to evaluate the combined factors for Transformational and
Transactional Leadership compared to the Competing Values Now. The overall model fit was
statistically significant (Wilks’ Lambda .597, F(6, 54) = 2.650, p = 0.025). The canonical
function 1-2 was significant (Wilks’ Lambda .597, F(6, 54) = 2.650, p = 0.025). The canonical
significance of group three was not as significant (Wilks’ Lambda .888, F(2, 28) = 1.772, p =
0.189). The model indicated that 40.3% was the overall effect explained by the relationship of
these two sets of variables.
Canonical variates. The canonical correlation coefficients for the first function was
0.5724 and 0.3352 for the second function. Market Now (0.7267)/Clan Now (-0.3142) was
related to the first function and Clan (0.7267), Market Now (-0.5737), and Hierarchy Now (-
0.5497) are all moderately related to the second function.
Combined factors (Transformational Factors) for Transformational Leadership (-0.6470)
and some Transactional Leadership (0.5312) reported in Tables 66 and 67 are related to the first
function and combined factors (Transactional Factors) of Transactional Leadership (0.8472) and
some Transformational Leadership (0.7625) are related to the second function. The squared
structure coefficients indicate that 41.2% of the variation in U1 was explained by the variation in
V1, whereas only 28.2% of variation in U2 was explained by V2. An Orthogonal Varimax rotation
and a Redundancy Analysis was performed and reported with similar but more significant
findings to the un-rotated Canonical Loadings.

92
Table 65
Summary of (Rotated) Canonical Variate Interpretations
Canonical Variate Interpretation (Constructs)
U1 “Transformational”
U2 “Transactional”
V1 “Clan/Market Now”
V2 “Clan/Hierarchy Now”
Table 66
Loadings for the factors (Combined) for Transformational and Transactional Leadership
Canonical Variates (Rotated)
Variable
Canonical Variates
U1 U2
Transformational Factors .9841 .1776
Transactional Factors .1282 .9917
Table 67
Loadings for the Competing Values (Now) Canonical Variates (rotated)
Variable
Canonical Variates
V1 V2
Hierarchy (N) -.3318 -.4388
Market (N) -.9256 .0188
Clan (N) .8428 .5297
Table 68
Redundancy Analysis for the factors (Combined) for Transformational and Transactional
Leadership Variables with the Competing Values (Now) Canonical Variates (V1 and V2)
Variable
Canonical Variates
V1 V2
Transformational Factors -.3704 .2555
Transactional Factors .3041 .2840

93
Table 69
Redundancy Analysis for the Competing Values (Now) Variables with the factors (Combined) for
Transformational and Transactional Leadership Canonical Variates (U1 and U2)
Variable
Canonical Variates
U1 U2
Hierarchy (N) -.0130 -.1842
Market (N) .4159 -.1923
Clan (N) -.1798 .3166
Redundancy analysis. Redundancy analysis in Tables 68 and 69 indicated that
Clan/Market was related to Transformational Leadership for the first function. There was a less
significant relationship of Clan/Hierarchy Now predicting Transactional for the second function.
Transformational Leadership factors and Competing Values (Now). A canonical
correlation analysis of the variables was conducted to evaluate the multivariate relations between
the two sets of variables for the Competing Values Now and the Full Range Leadership Model
specifically for Transformational Leadership behaviors. A significance test was run for all
canonical correlations or model fit and found to be significant with (Wilks’ Lambda .387, F[15,
66.65] = 1.826, p = 0.049). Therefore, 61.3% was the overall effect explained by the relationship
of these two sets of variables in the model (Sherry & Henson, 2005). The 1-3 function was
significant (Wilks’ Lambda .387, F[15, 66.65] = 1.826, p = 0.049). The 2-3 function of the
canonical correlations was not as significant (Wilks’ Lambda 755, F[8,50] = 0.941, p = .491),
and the third function was also tested for significance (Wilks’ Lambda .906, F[3, 26] = 0.894, p
= 0.457). Adhocracy Now was removed to reduce collinearity.
Canonical variates. The canonical correlation coefficients for the first function was
0.6986, 0.4084 for the second, and 0.3058 for the third function. In Tables 71 and 72, Market
Now (-0.8134)/Clan Now (0.8021) dimension are related to the first function. Clan Now

94
(0.5747) was related to the second function. Hierarchy Now (0.8149)/Market Now (-0.5719)
were related to the third function.
Intellectual Stimulation (0.8204), Idealized Influence Attributed (0.6265), and
Individualized Consideration (0.6139) were related to the first function. Idealized Influence
Attributed (0.2358) and Intellectual Stimulation (-0.1907) were correlated with the second
function. Individualized Consideration (0.5611) was related to the third function. The squared
structure coefficients indicate that 64.3-66.1% of the variation in U1 was explained by the
variation in V1, whereas only 64.3% of variation in U2 was explained by V2, and % of variation in
U2 was explained by V2, and 27% of the variation in U3 was explained by the variation in V3.
An Orthogonal Varimax rotation was performed and a comparison of rotated and un-
rotated structure. It appears that the Clan Now - Market Now and Idealized Influence Attributed
and Individualized Consideration have the most effect on the first canonical function. Market
Now and Intellectual stimulation and Individualized Consideration have the effect on the second
function. Hierarchy Now and Individualized Consideration have the most effect on the third
function. This was similar to the un-rotated findings with a few exceptions to the table below of
the un-rotated interpretation. Table 70 provides a succinct summary of the interpreted meanings
of each canonical variate.
Table 70
Summary of Canonical Variate Interpretations
Canonical Variate Interpretation (Constructs)
U1 "Clan/Market Now " (some “Hierarchy”)
U2 "Clan Now"
U3 “Hierarchy/Market Now "
V1 “Intellectual Stimulation/ Idealized Influence
Attributed/Individualized Consideration”
V2 “Idealized Influence Attributed/Intellectual
Stimulation”
V3 “Individualized Consideration”

95
Table 71
Loadings for the Competing Values (Now) Canonical Variates
Variable
Canonical Variates
U1 U2 U3
Hierarchy (N) -.5187 -.2588 .8149
Market (N) -.8134 -.1060 -.5719
Clan (N) .8021 .5747 .1625
Table 72
Loadings for the Transformational Canonical Variates
Variable
Canonical Variates
V1 V2 V 3
Idealized Influence
Attributed
.6265 .2358 .3745
Idealized Influence Behavior .4946 -.0189 .2046
Individualized Consideration .6139 -.0527 .5611
Inspirational Motivation .4330 -.1880 .3383
Intellectual Stimulation .8204 -.1907 .1655
Table 73
Redundancy Analysis for the Competing Values (Now) Variables with the Transformational
Canonical Variates (V1 and V2)
Variable
Canonical Variates
V1 V2 V3
Hierarchy (N) -.3623 -.1057 .2492
Market (N) -.5683 -.0433 -.1749
Clan (N) .5603 .2347 .0497
Table 74
Redundancy Analysis for the Transformational Variables with the Competing Values (Now)
Canonical Variates (U1 and U2)
Variable
Canonical Variates
U1 U2 U3
Idealized Influence
Attributed .4377 .0963 .1145
Idealized Influence Behavior .3455 -.0077 .0626
Individualized Consideration .4289 -.0215 .1716
Inspirational Motivation .3025 -.0768 .1035
Intellectual Stimulation .5731 -.0779 .0506

96
Redundancy analysis. Redundancy analysis in Tables 73 and 74 indicated a strong
correlation between the Market Now/Clan Now dimension and Intellectual Stimulation,
Idealized Influence Attributed, and Individualized Consideration for the first function. The
second and third function did not indicate a strong relationship among the variables.
Transactional Leadership factors and Competing Values (Now). A canonical
correlation analysis of the variables was conducted to evaluate the multivariate relations between
the two sets of variables for the Competing Values Organizational Culture Now and Full Range
the Leadership Model specifically for Transformational Leadership behaviors. The full
canonical model was statistically significant the test of significance was run for all canonical
correlations and found to be significant with (Wilks’ Lambda = .535, F[9, 63.43] = 2.0640, p =
0.046). Therefore, 46.5% was the overall effect explained by the relationship of these two sets of
variables (Sherry & Henson, 2005). The 1-3 canonical correlation were significant (Wilks’
Lambda = .535, F[9, 63.43] = 2.0640, p = 0.046). The 2-3 function was tested (Wilks’
Lambda=.868, F[4,54] = 0.991, p = 0.420). The third was also tested (Wilks’ Lambda .952,
F[1,28] =1.4066, p = 0.246) respectively.
Canonical variates. In Figures 76 and 77, the Canonical Correlation Coefficients for the
first function was 0.6192, 0.2975 for the second, and 0.2187 for the third function. For the first
function, the Market Now (0.6885) was related to first function. For the second function, Clan
Now (0.8069) - Market Now (-0.6522) dimension was related. The third function was related to
Hierarchy Now (0.9129). Management by Exception Passive (0.9965) was related to the first
function, Management by Exception Active (0.6442) and Contingent Reward (0.6001) are
related to the second. Management by Exception Active (0.7291) and Contingent Reward (-
0.6466) are also related to the third function.

97
The squared structure coefficients indicate that 64.3 - 66.1% of the variation in U1 was
explained by the variation in V1, whereas only 26.9% of variation in U2 was explained by V2, and
16.3% of variation in U3 was explained by V3.
An Orthogonal Varimax rotation was performed and a comparison of rotated and un-
rotated structure. It appears that the Clan Now/Market Now and Contingent Reward have the
most effect on the first canonical function. Hierarchy Now/Market Now and Management by
Exception Passive have the effect on the second function. Hierarchy Now and Management by
Exception Active are related to the third function.
Table 75 provides a succinct summary of the interpreted meanings of each canonical
variate.
Table 75
Summary of Canonical Variate Interpretations
Canonical Variate Interpretation (Constructs)
U1 " Market Now "
U2 " Clan Now/Market Now "
U3 “Hierarchy Now "
V1 “Management by Exception Passive”
V2 “Management by Exception Active/Contingent Reward”
V3 “Management by Exception Active/Contingent Reward”
Table 76
Loadings for the Competing Values (Now) Canonical Variates
Variable
Canonical Variates
U1 U2 U3
Hierarchy (N) -.4060 .0410 .9129
Market (N) .6885 -.6522 .3172
Clan (N) -.1427 .8069 -.5732

98
Table 77
Loadings for the Transactional Canonical Variates
Variable
Canonical Variates
V1 V2 V 3
Contingent Reward -.4710 .6001 -.6466
Management by Exception
(Active)
.2313 .6442 .7291
Management by Exception
(Passive)
.9965 -.0042 -.0834
Table 78
Redundancy Analysis for the Competing Values (Now) Variables with the Transactional
Canonical Variates (V1 and V2)
Variable
Canonical Variates
V1 V2 V3
Hierarchy (N) -.2514 .0122 .1997
Market (N) .4263 -.1940 .0694
Clan (N) -.0883 .2401 -.1254
Table 79
Redundancy Analysis for the Transactional Variables with the Competing Values (Now)
Canonical Variates (U1 and U2)
Variable
Canonical Variates
U1 U2 U3
Contingent Reward -.2916 .1785 -.1414
Management by Exception
(Active)
.1432 .1916 .1595
Management by Exception
(Passive)
.6170 -.0012 -.0182
Redundancy analysis. Redundancy Analysis in Figures 78 and 79 revealed a relationship
between Market Now and Management by Exception Passive for the first function and
Management by Exception Active and Contingent Reward is related to Clan-Market for the
second function, Hierarchy is related to Management by Exception Active and Contingent
Reward for the third function.

99
CHAPTER V: DISCUSSION
The purpose of the proposed study was to empirically examine the relationship of culture
and managerial leadership based on the Competing Values Model, Grid and Group, and
Transformational/Transaction Leadership behaviors (Full Range Leadership Model) in an
organization. The significance and practical implications of the study results can have an impact
on the andragogy of organizational culture and managerial leadership for training and analysis
for organizations such as business and education. Furthermore, the study also helps identify areas
that need further research.
Businesses are expected to continue to increase what they spend on Leadership training
(Meinert, 2014). Subsequently, the significance and impact of the results of this study could be
more meaningful. A better understanding of the relationship of culture and managerial leadership
could assist in the development of new tools (as well as for improvement of existing tools) for
assessment and analysis of organizations. Further, this may be beneficial for the development of
curriculum for culture and managerial leadership training. Ultimately, these may be used to
create a learning organization “where people continually expand their capacity to create the
results they truly desire, where new and expansive patterns of thinking are nurtured, where
collective aspiration is set fee, and where people are continually learning how to learn together”
(Senge, 2006, p. 3). The results of the study could improve the long-term effectiveness of the
organization and assist in creating shared vision in the organization. Senge (2006) also discussed
the importance of understanding system archetypes in that it “starts an organization on the path
of putting the systems perspective into practice” (p. 94). From this perspective, the results could
elevate the understanding by employees regarding the different behaviors required from their
leaders in different situations (stability versus instability) in relation to the current culture of the

100
organization. Further research should be conducted to replicate this study to determine if the
findings are transferrable across different industry types and sizes and different geographical
locations. Further research should also be conducted to replicate this study in a stable
organization to compare the results in the midst of change and in stable situations.
Method Summary
The instruments used to collect the data to examine the relationship of the culture and
managerial leadership models are the Organizational Culture Assessment Instrument (OCAI),
(SGAT) Social Game Assessment Tool (modified), and the Multifactor Leadership
Questionnaire 5X (Rater form). The participants were a volunteer convenience sample from an
agricultural organization in the upper Midwest and likely represent the middle management level
of the organization. The data was collected via a web-based survey and analyzed with Stata
software for the relationship of the variables (correlation).
This study revealed a few important issues regarding the instruments used. First, the way
the data was collected with the OCAI limited a participant’s responses to a fixed sum of 100,
which inadvertently caused collinearity. Second, the instruments presented a few challenges for
the integration of the models. Specifically, the OCAI and SGAT represent ostensibly congruent
theoretical structures, yet the two instruments operationalized these in fairly dissimilar ways (see
Figure 3). Finally, Full Range Leadership Model identified the transformational and
transactional leadership behaviors which presented some issues since the factors were not always
consistently identified in the literature or the study findings. For example in this study, the
Transformational factors (Idealized Influence Attributed, Idealized Influence Behavior,
Individualized Consideration, Intellectual Stimulation, and Inspirational Motivation) were
strongly correlated to one another which may create a problem with discriminant validity. It was

101
not always clear if Laissez-Faire factor (not used as part of the model for this study) was part of
Transactional Leadership or a separate component since they were listed as both (Bass, 1996).
Further evidence of this found was this this study where the findings indicated that Contingent
Reward may also be a Transformational Leadership factor rather than Transactional which does
not align with the way the Full Range Leadership Model assigns the factors.
Discussion of Significant Findings Regarding the Proposed Theory Integration
The following is a discussion of the significant results of the study that provided support
for the development of the proposed theoretical model based on the integration of the theories of
Harris’s (2005) Grid and Group Theory, Cameron and Quinn’s (2011) Competing Values
Framework, and Avolio and Bass’s (2004) Multifactor Leadership Questionnaire 5X.
According to the proposed theoretical model (see figure 3) which was the basis of this
study, the culture typologies of Harris’ (2005) Grid and Group Theory (GG) should align with
Cameron and Quinn’s (2011) Competing Values Framework (CVF) [Corporate (GG) and
Hierarchy (CVF); Bureaucratic (GG) and Market (CVF); Individualist (GG) and Adhocracy
(CVF); Collectivist (GG) and Clan (CVF)]. In addition, Avolio and Bass’ (2004) Full Range
Leadership Transformational Leadership factors should align with Collectivist/Clan and he
Transactional Leadership factors should align with Bureaucratic/Market. A combination of
Transformational and Transactional behaviors was expected to be found in the
Corporate/Hierarchy and Individualist/Adhocracy with Transformational factors stronger in
Individualist/Adhocracy and Transactional factors stronger in Corporate/Hierarchy.
For this study, the Grid and Group Social Game Assessment Tool (SGAT) asked the
participants what (culture) they would prefer and the Competing Values Framework (CVF)
OCAI asks the participants first how they view the organization now, and then how they would
102
view it in 5 years (Preferred). Although it is expected that both will overlay well, the OCAI
“Preferred” results should better align with the Grid and Group Social Game results. The
Multifactor Leadership Questionnaire 5X asked how the leadership is viewed overall which
should align better with the OCAI Competing Values “Now” results.
The following is a discussion of the findings relevant to the proposed theoretical model
organized by analyzing and comparing the findings for each of the research questions.
Analysis of the Relationship of Competing Values and Grid and Group Models
The first question of the study was divided into two parts. The first part was to determine
the quantitative relationships among the dimensions identified by the Grid and Group Theory
and the Competing Values Framework (Preferred) as measured by the Social Game Assessment
Tool and Organizational Culture Assessment Instrument respectively for an organization. In the
theoretical model (Figure 3), Market and Hierarchy of the Competing Values Framework (CVF)
were expected to align with the Strong Grid of the Grid and Group Theory.
The study results found a positive correlation of CVF Hierarchy Preferred and Market
Preferred to Grid. There was also a strong negative correlation of Grid to Clan Preferred which is
a Weak Grid in the theoretical model. The Canonical Correlation demonstrated that Grid strongly
predicted Clan/Market Preferred dimension and a moderate prediction of Group for Hierarchy
Preferred in the second function. We would expect a stronger relationship between Group and
Adhocracy with Canonical Correlation, which could be a collinearity issue. There was some
positive correlation to Adhocracy Preferred and Group and which was not explained by this
model.
The next part of the first question of the study is to determine the quantitative
relationships among the dimensions identified by the Grid and Group Theory and the Competing
103
Values Framework (Now) as measured by the Social Game Assessment Tool and Organizational
Culture Assessment Instrument respectively for an organization. The relationship of the
Competing Values Now was expected to correlate with the model since there was not a
significant difference between the frequencies of culture typologies for each set of data.
However, it was expected to align better with the Preferred that matched the way the questions
were asked to the participants.
The results found that Grid was positively related to Hierarchy Now and Market Now and
strongly negatively correlated to Clan Now. Group was positively correlated to Adhocracy Now
which again was an unexpected finding. Canonical Correlation indicated that Grid statistically
predicted Clan Now/Market Now dimension and Group predicted Clan Now. Overall, appears to
be a definite correspondence between the Market/Clan dimension of Competing Values (Now)
and Grid and between Clan Now and Group.
Analysis of the data supported a relationship between the Hierarchy and Market
dimension of CVF and Grid and a negative correlation to Clan. The Group also predicted Clan.
These results of question one of the study confirm that there is a relationship between the culture
types of the Social Game Grid and Group Model (Harris, 2005) and the Competing Values
Framework (Cameron & Quinn, 2011) as anticipated by the model. The strongest relationship
was to the Grid and relationships to Market and Hierarchy and a negative relationship to Clan.
The unexpected result was that Group was positively correlated to Adhocracy (Adhocracy was
identified by the model as weak group/weak grid dimension) which was not explained by the
model. However, this result could be due to the limitation of the forced response of the
instrument. Further research should be conducted to determine if Adhocracy is positively
correlated with group across organizations in the midst of change and in stable situations. Further

104
research should also be conducted on different levels of analysis to determine if the Adhocracy
connection to group is consistent across all levels.
Implications for adult education. A strong group is regarded as strong social
incorporations and the interest of the group is prioritized over individuals (Harris, 2005). In this
type of culture, it would be important for individuals in the organization to learn that there is a
strong social incorporation in the strong group/weak grid (Clan) and there are few rules and
successful leaders cultivate trust and remind others of the group goals. It is expected that
decision making is shared among all levels of the organization. For example, input on scheduling
training would likely be a shared among all levels. In the strong group/strong grid (Hierarchy)
there is still group cohesion and there are strong rules and hierarchy is valued (Harris, 2005).
Implications for business/organizational analysis. The strong Grid forces of the Grid
and Group model are aligned with the stability and control forces of the Hierarchy and Market
archetypes. The Competing Values Market (strong Grid/weak Group) is related to the
performance of the organization where statistics are measured and valued. In this type of
organization, reward for performance is often based on sales volume. The Grid is negatively
correlated to the Competing Values Clan which is characterized as a close knit group or like a
family. For a clan organization, it is important that employees understand that there is not much
separation between work and social.
Analysis of the Relationship of Grid and Group and Full Range Leadership Model
The second question of the study is to determine the quantitative relationships among the
dimensions identified by the Full Range Leadership Model and the Grid and Group Theory as
measured by the Multifactor Leadership Questionnaire 5X Instrument (Rater form) and the
Social Game Assessment Tool respectively. According to Avolio and Bass (2004), the factors

105
for Transformational Leadership include: Idealized Influence Attributed, Idealized Influence
Behavior, Individualized Consideration, Intellectual Stimulation, and Inspirational Motivation.
The Factors for Transactional Leadership include: Contingent Reward, Management by
Exception Active, and Management by Exception Passive. In the theoretical model, Group
would be expected to align with Transformational Leadership and Grid with Transactional
Leadership factors. A combination of Transformational and Transactional behaviors was
expected to be found in the Corporate (strong Group/strong Grid) and Individualist (weak
Group/strong Grid) dimensions with Transformational factors stronger in Individualist (weak
Group/strong Grid) and Transactional factors stronger in Corporate (strong Group/strong Grid).
A redundancy analysis of the combined factors for Transformational and Transactional
leadership found the expected results that Grid predicted Transactional Leadership and Group
predicted Transformational Leadership. For the individual managerial leadership behaviors,
Redundancy analysis and Pearson correlation indicated a fairly significant relationship between
the Group and Intellectual Stimulation dimension. However, theoretically it should also align
with the Weak Grid/Weak Group culture type (Individualist) which is entrepreneurial. The
expected finding of Individualized Consideration and Inspirational Motivation alignment was not
a direct finding in the analysis. There was a significant negative correlation between Group and
Full Range Leadership Model Management by Exception Passive behavior associated with
Transactional Leadership. Redundancy Analysis also indicated that Group predicted
Management by Exception Passive. Grid predicted Management by Exception Active and mildly
predicted Idealized Influenced Attributed.
The integration of the Full Range Leadership Model and the Grid and Group theory
provide support for a quantitative relationship between culture and leadership as measured by

106
these instruments. The analysis supported the theoretical model as the Grid positively predicted
Transactional Leadership and Group predicted Transformational Leadership. Management by
Exception Passive negatively correlated with Group and Grid predicted Management by
Exception Active which what would be expected for these Transactional factors. Further
research should be conducted to determine if there are differences in the relationship of these
theories in a non-profit versus for profit organizations. Further research should also be
conduction prior to and following a merger or acquisition of an organization of differing
dominant culture types to learn more about the culture types before and after a significant
organizational change. In addition, this research should be replicated in institutions of higher
education to learn more about leadership at the student organization level, faculty senate, middle
management, and senior management levels.
Implications for adult education. It is important for the purposed of organizational
training that the employees understand the different leadership and culture types for an effective
organization. In a strong Grid organization, there is very little autonomy and rules are what
govern what people do (Harris, 2005). In this culture, centralized power and authority are
effective which aligns with the Management by Exception Active of the Transactional
Leadership. In a weak group culture, there is minimal pressure to accept group goals (Harris,
2005) which aligns well with the Transactional management behavior of Management by
Exception Passive where the leader only intervenes to make corrections (Antonakis et al., 2003).
This is opposed to the Strong Group/weak Grid of the Clan Culture where decentralized decision
making is valued and there is strong allegiance to the organization (Harris, 2005). In a strong
group organization, employers are likely to along with a process if they believed it was in the
best interest of the organization.

107
Implications for business/organizational analysis. The effective supportive and
coaching type of leadership of the strong group (Harris, 2005) aligns with the Transformational
Leadership and may be necessary leadership behaviors in changing environment. This
information may be important to organizations going through a merger or acquisition. The
supportive type of leadership behavior may also coincide with findings of the critical leadership
behaviors of problem solving and obstacle elimination in a crisis situation (Peterson & Van
Fleet, 2008) in the sense that leadership would provide support-including problem solving for
situations.
In the analysis, Group was related to the Intellectual Stimulation which theoretically
aligned with the Strong Group/Weak Grid culture type (Collectivist) in that it is a behavior of
Transformational Leadership. As organizations move through the organization growth cycle, the
organization is more entrepreneurial when the organization is created or has a high rate of
growth which aligns with the intellectual stimulation of the Full Range Leadership Model.
Analysis of the Relationship of Competing Values and Full Range Leadership Model
The third question of the study was divided into two parts. The first part was to determine
the quantitative relationship among the dimensions identified by the Full Range Leadership
Model and the Competing Values Framework (Preferred) as measured by the Multifactor
Leadership Questionnaire 5X Rater Instrument and the Organizational Culture Assessment
Instrument respectively. It was expected that there would be a relationship of the Competing
Values Preferred results and the Transformational and Transactional factors of the Full Range
Leadership Model. (However, it was expected that the Competing Value Now in the next part of
question three would better align.)
108
For the Preferred results, there was a negative relationship of Adhocracy Preferred and
Transactional Leadership. For the individual managerial leadership behaviors, the Management
by Exception Active was mildly negatively correlated to Market Preferred and Adhocracy
Preferred.
Redundancy Analysis found that Clan Preferred/Market Preferred dimension predicted
Transactional Leadership, and Hierarchy predicted Transformational Leadership. For the
individual Transformational managerial leadership behaviors, Redundancy analysis indicated
that Hierarchy/Clan Preferred predicted Intellectual Stimulation. The rotated variates indicated
the influence was a result of Clan Preferred. For the individual managerial leadership
transactional behaviors, redundancy analysis found that Market/Clan Preferred dimension
predicted Management by Exception Active.
Analysis of the next part of question three is to determine the quantitative relationship
among the dimensions identified by the Full Range Leadership Model and the Competing Values
Framework (Now) as measured by the Multifactor Leadership Questionnaire 5X Rater
Instrument and the Organizational Culture Assessment Instrument respectively. The Now results
of the Competing Values Framework and the Full Range Leadership are expected to align more
similarly than the Preferred results since the surveys asked the participants how they feel the
culture/leadership is now.
The results were very consistent to what was predicted by the theoretical model. Clan
Now was positively associated with the Transformational combined factors. Market Now was
negatively correlated to combined Transformational factors. Clan Now was positively correlated
with Transformational Leadership and Market Now was a negatively correlated with
Transformational Leadership.

109
Further analysis of the individual factors for Transformation managerial leadership
factors found that Adhocracy Now was positively correlated with Intellectual Stimulation, Clan
Now positively was correlated to Idealized Influence Attribute, Intellectual Stimulation, and
Individualized Consideration. Market Now was negatively correlated with the same factors of
Transformational Leadership factors of Idealized Influence Attributed, Individualized
Consideration, and Intellectual Stimulation. For the individual Transactional managerial
leadership behaviors, Management by Exception Passive was negatively correlated to Adhocracy
now and positively correlated with Market Now.
Redundancy analysis indicated that the Clan/Market dimension predicted
Transformational Leadership. For the individual transformational managerial leadership
behaviors, redundancy analysis indicated a Market Now/Clan Now dimension also strongly
predicted Intellectual Stimulation, Idealized Influence Attributed, and Individualized
Consideration. For the individual Transactional Managerial behaviors, Market Now predicted
Management by Exception Passive, Clan/Market Now dimension predicted Management by
Exception Active and Contingent Reward, and Hierarchy predicted Management by Exception
Active and Contingent Reward.
The results supported the relationship of the Competing Values (Now) and the Full
Range Leadership Model. The one surprising finding was Market Now being negatively
correlated to Contingent Reward and Contingent Reward was negatively correlated with
Management by Exception Passive. However, Market Now was negatively correlated and Clan
Now was positively correlated with the combined factors associated with transformational
Leadership. In addition, the data supported the relationship with Individualized Consideration
but not the Inspirational Motivation as proposed theoretically. The data also supported the

110
alignment with Clan to the Transformational Leadership behaviors of Idealized Influence
Attribute, Intellectual Stimulation, and Individualized Consideration and Market negatively
correlated with these same factors. Further research should be conducted to determine the
relationship of Market Culture in different types if institutions undergoing change to determine if
this “sales” type of culture is different in profit versus not for profit where the expectations for
performance may be tied to different types of goals. In addition, further research should be
conducted for different levels in the organizations. The middle management level may have a
different view of the Market Culture and Contingent Reward behavior than the employees that
work for them.
Implications for adult education. For organizational education, the Clan culture values
Human Resources and training and the Market values productivity and efficiency and a
preference for shorter time lines and prefers more directive leadership (Quinn, 1991). It is
important for the organization and the leader to understand that in a Market type of culture, a
leader with a long-term vision may not have buy-in from the organization. The Clan type culture
will have more tolerance in the organization and will be more flexible and prefers a more
supportive type of leader (Quinn, 1991). These premises are supported by this study in that the
Transformational Leadership behaviors (supportive type) aligns better with the Clan type of
culture and the Transactional management behaviors (directive style) is a better fit for the Market
Culture.
Implications for business/organizational analysis. The integration of the Full Range
Leadership model and Competing Values Framework theories had expected findings. The Clan
Now directly aligned with Transformational leadership. The Adhocracy aligned with the
Transformational Leadership factor of Intellectual Stimulation which is described as creative and
111
entrepreneurial stimulation of the follower. This leadership attribute aligns well with the
innovative and entrepreneur leader type described for the Adhocracy culture of the Competing
Values Framework (Cameron & Quinn, 2011).
Management by Exception Passive is related to Adhocracy Now Culture type. The
Management by Exception Passive aligns with the model in that it was expected to have some
overlap of Transactional and Transformational behaviors. Theoretically, the coach and mentor
style of the Individualized Consideration aligns with the Clan culture type. The Clan Culture is
on the flexible discretion dimension of the Competing Values Framework. The flexible organic
culture is a theoretical alignment of the transformational leadership which is effective in an
unstable environment (Bass, 1996). This premise is also supported by Kotter (1988) where
leadership is effective in unstable times and managerial behaviors are effective in stable times.
The organization being studied is in a state of change and these results would be expected in this
environment.
For the individual Transactional managerial leadership behaviors, Management by
Exception Passive was theoretically related to Market Now which was also confirmed by the
results. The Transactional behavior of Contingent Reward is theoretically related to the Market
culture type and is regarded as rewards in exchange for performance type of behavior. However,
the data indicated a negative relationship between Market and Contingent Reward which was an
unexpected finding according to the theoretical model. The One explanation for this is that Graen
and Ulh-Bien (1995) pointed out that a Leader Member Exchange is at the level of transactional
leadership until a strong relationship built on trust evolves and then the Leader Member
Exchange becomes Transformational. In the situation of this organization, the leader is a long
term leader that spent time at each of the locations and likely build trust in the organization.

112
Another explanation could be that in a growing organization building new facilities, there is
likely pressure to perform in sales. This could lead to a negative feeling towards Contingent
Reward if sales goals are not met and the rewards are not realized. If the employee feels the
reward is inequitable, this scenario could result in a negative (feelings) correlation of Contingent
Reward to the Market Culture type. Further research should be conducted in organizations to
determine if a trusted leader has the same results of an untrusting leader in a market culture.
Additional research that includes aspects of equity theory may provide an explanation for this
finding. Based on this finding (as previously suggested), further research should also be
conducted to determine if Contingent Reward is negatively correlated with Transactional
leadership across other organizations such as for profit or non-profit and educational and
business institutions.
Conclusion
Although there are numerous studies and articles written on Management, Leadership,
and Organizational Culture, the definitions of these topics still appears to be vague. The culture
of an organization has a profound effect on the operations and effectiveness of an organization
yet to describe it becomes more challenging. Culture may in fact be a feeling of our surroundings
rather than something we can see or describe. It also seems that the effectiveness of managerial
leadership and behaviors depend on the culture of an organization. Leadership can change a
culture over time, but the leader needs to be well aware of the culture before implementing any
changes unless there is a crisis situation, then the culture is more willing to change due to the
crisis. Often times when there is a managerial leadership change, the leader will sit back for
some time to get a sense of the culture prior to begin planning for the future which may be wise
for the longevity and success of the leader.

113
The Grid and Group model developed by Douglas (2007/1970) and adapted for schools
by Harris (2005) has anthropological roots. The Competing Values Framework model refined by
Cameron and Quinn (2011) is based on business effectiveness. The Full Range Leadership
Model (Avolio & Bass, 2004) explains managerial leadership behaviors. Although the culture
models have different origins, the data collected supported the alignment of the models and
provides evidence to support the integration of these culture theories. As a result, these findings
support the interchangeable use of these culture instruments in this organization. The managerial
leadership behaviors also overlay and align with both culture models. The diverse origins of the
integrated theories provided a new perspective for viewing and determining organizational
culture dimensions and the relationship to managerial leadership behaviors in an organization.
The significance of the study is that the results can be added to the existing body of
knowledge of organizational culture and managerial leadership in an organization for analysis
and learning organizations. As previously discussed, leadership and culture are often viewed
separately. The results from this particular organization imply that there is a strong integrated
relationship between organizational culture and managerial leadership in an organization that
should be considered for future theory development and research. The information gained can
also be incorporated into future research of the unexpected results of this study as well as future
research on different types of organizations and different levels of analysis of an institution. In
addition, the study could provide further insight into the behaviors of managers and leaders and
how they align with the current research.
According to the frequency tables, the Clan-Market was the dominant CVF culture
dimension for this organization and the “Preferred” culture and the “Now” culture are congruent.
A congruent culture is a more effective organization (Cameron & Quinn, 2011). In this particular

114
study, the leader type of behaviors aligned with the transformational leadership (Clan Culture
and Group culture types) and the managerial type of leadership behaviors align with the
transactional leadership (Grid Culture and Market Culture types). Different leadership behaviors
are necessary for different situations and are more effective in different culture types. The right
leader is the leader that is compatible with the right culture of the organization. It is important to
note that the culture of an organization will dictate which leadership style (in the short-term) is
preferred based on the situation. Culture is more difficult to change than the leader. Even if the
leader’s strategy seems to be a great strategy and the best approach, if it does not align with the
culture then the leader will not be effective and may not even last in the organization.
Peter Drucker1 was spot on when he said, “Culture eats strategy for breakfast.”
1 There is no known citation for this quotation, however Peter Drucker is widely acknowledged as the original
source.

115
REFERENCES
Allik, J., & Realo, A. (2004). Individualism-collectivism and social capital. Journal of Cross-
Cultural Psychology, 35(1), 29-49. doi:10.1177/0022022103260381
Alvesson, M. (1990). On the popularity of organizational culture. Acta Sociologica, 33(1), 31-
49.
Antonakis, J., Avolio, B. J., & Sivasubramaniam (2003). Context and leadership: An
examination of the nine-factor full-range leadership theory using the multifactor
leadership questionnaire. The Leadership Quarterly, 14(3), 261-295.
Antonakis, J., & House, R. J. (2014). Instrumental leadership: Measurement and extension of
transformational-transactional leadership theory. The Leadership Quarterly, 25(4), 746-
771. doi:10.1016/j.leaqua.2014.04.005
Avolio, B. J., & Bass, B. M. (1995). Individual consideration viewed at multiple levels of
analysis: A multi-level framework for examining the diffusion of transformational
leadership. The Leadership Quarterly, 6(2), 199-218. doi:10.1016/1048-9843(95)90035-
7
Avolio, B. J., & Bass, B. M. (2004). Multifactor leadership questionnaire: Manual and sample
set (3rd ed.). Mind Gardens. Retrieved from mindgardens.com
Balken, J. M. (1998). Cultural software. Retrieved from http://yupnet.org/balkin
Bass, B. M. (1985). Leadership: Good, better, best. Organizational Dynamics, 13(3), 26-40.
Bass, B. (1996). New paradigm of leadership: An inquiry into transformational leadership.
Alexandria, Va.: U.S. Army Research Institute for the Behavioral and Social Sciences.
Bass, B. M., & Avolio, B. J. (1993). Transformational leadership and organizational culture.
Public Administration Quarterly, 17(1), 112-121.

116
Bass, B. M., Avolio, B. J., Jung, D. I., & Berson, Y. (2003). Predicting unit performance by
assessing transformational and transactional leadership. Journal of Applied Psychology,
88(2), 207-218. doi:10.1037/0021-9010.88.2.207
Batteau, A. W. (2000). Negations and ambiguities in the cultures of organization. American
Anthropologist, 102(4), 726-740. doi:10.1525/aa.2000.102.4.726
Burns, J. M. (2010). Leadership. New York, NY: Harper Collins. (Original work published in
1978).
Cahnman, W. J. (1962). Culture, civilization, and social change. The Sociological Quarterly,
3(2), 93-106.
Cameron, K.S., & Freeman, S. J. (1991). Cultural congruence, strength, and type: Relationships
to effectiveness. Research in Organizational Change and Development, 5, 23-58.
Cameron, K., & Quinn, R. (1999). Diagnosing and changing organizational culture: Based on
the competing values framework. Reading, MA: Addison-Wesley.
Cameron, K., & Quinn, R. (2011). Diagnosing and changing organizational culture: Based on
the competing values framework. San Francisco, CA: Jossey-Bass.
Cameron, K.S., Quinn, R. E., Degraff, J., & Thakor, A. V. (2006). Competing values
leadership: Creating value in organizations. Northhampton, MA: Edward Elgar
Publishing.
Carlyle, T. (1840) Heroes and hero worship. Champaign, IL: Project Gutenberg.
Chandler, A. D., Jr, (2000/1962). Strategy and Structure: Chapters in the History of the
American Industrial Enterprise. Cambridge, MA: MIT Press.
Chemers, M., M. (1997). An integrative theory of leadership. Mahwah, NJ: Lawrence Erlbaum
Associates.

117
Colbert, A. E., Judge, T. A., Choi, D., & Wang, G. (2012). Assessing the trait theory of
leadership using self and observer ratings of personality: The mediating role of
contributions to group success. The Leadership Quarterly, 23(4), 670-685.
doi:10.1016/j.leaqua.2012.03.004
Creswell, J. W. (2015). Planning and conducting, and evaluating quantitative and qualitative
research, (5th ed.). Boston, MA: Pearson.
Dattalo, P. (2014). A demonstration of canonical correlation analysis with orthogonal rotation to
facilitate interpretation. Unpublished manuscript, School of Social Work, Virginia
Commonwealth University, Richmond, Virginia.
Deal, T., & Kennedy, R. E. (1999). The new corporate cultures: Revitalizing the workplace
after downsizing, merger, and reengineering. New York, NY: Persues Book Publishing.
Deal, T., & Kennedy, R. E. (1982). Corporate cultures: The rites and rituals of corporate life.
New York, NY: Persues Book Publishing.
Deal, T. E., & Peterson, K. D. (1990). The principles role in shaping school culture.
Washington, D.C.: U.S. Department of Education, Office of Educational Research and
Improvement.
Dillman, D. A., Smyth, J. D, & Christian, M. L. (2008). Internet, mail, and mixed-mode
surveys: The tailored designs method. Hoboken, NJ: John, Wiley & Sons.
Dinh, J., Lord, R., Gardner, W., Meuser, J., Liden, R. C., & Hu, J. (2014). Leadership theory
and research in the new millennium: Current theoretical trends and changing
perspectives. Leadership Quarterly, 25(1), 36-62.
Douglas, M. (2007). Natural symbols. New York: Routledge. (Original work published in
1970).

118
Douglas, M. (2011). In the active voice. New York: Taylor & Francis. (Original work published
in 1982).
Douglas, M. (1986). How institutions think. Syracuse, NY: Syracuse University Press.
Durkheim, E. (1933/1947). The division of labor in society. Translated by George Simpson.
Glencoe, IL: Free Press.
Earley, P. C., & Gibson, C. B. (1998). Taking stock in our progress on individualism-
collectivism: 100 years of solidarity and community. Journal of Management, 24(3),
265-304.
Form, W. H. (1975). The social construction of anomie: A four-nation study of industrial
workers. American Journal of Sociology, 80(5), 1165-1191.
Garson, G. D. (2015). GLM Multivariate, MANOVA, and Canonical Correlation. Asheboro,
NC: Statistical Associates Publishers.
Goleman, D. (2000). Leadership that gets results. Harvard Business Review, 78 (2), 78-90.
Graen, G. B., & Ulh-Bien, M. (1995) Relationship-based approach to leadership: development
of leader-member exchange (LMX) theory of leadership over 25 years: Applying a
multi-level multi-domain perspective. Leadership Quarterly, 6(2), 219-247.
Harris, E. L. (2005). Key strategies to improve schools: How to apply them contextually.
Lanham, MD: Rowman and Littlefield Education.
Hartnell, C.A., & Walumbwa, F. O. (2011). Transformational leadership and organizational
culture: Toward integrating a multilevel framework. In N. M. Ashkanasy, C. P. M.
Wilderom & M.F. Peterson (Eds.), Handbook of Organizational Culture and Climate,
2nd edition, (225 - 248). Thousand Oaks, CA: Sage Publications.

119
Heritage, B., Pollock, C., & Roberts, L. (2014). Validation of the organizational culture
assessment instrument. PLoS One, 9(3). doi:10.1371/journal.pone.0092879
Hernandez, M., Eberly, M. B., Avolio, B. J., & Johnson, M. D. (2011). The loci and
mechanisms of leadership: Exploring a more comprehensive view of leadership theory.
The Leadership Quarterly, 22(6), 1165-1185. doi:10.1016/j.leaqua.2011.09.009
Hill, B. (2016). Unpublished analysis of Grid and Group, personal communication, July 9,
2016.
Hofstede, G., Hofstede, G. J., & Minkov, M. (2010). Cultures and organizations: Software of
the mind, (3rd ed.). New York, NY: McGraw-Hill.
Hubbard, G. P., & O’Brien, A. P. (2015). Economics, (5th Ed.). Boston, MA: Pearson.
Hunt, J., & Dodge, G. E. (2000). Leadership deja vu all over again. The Leadership Quarterly
Review of Leadership, 11 (4), 435-458.
Hunter, S. T., Bedell-Avers, K. E., & Mumford, M. D. (2007). The typical leadership study:
Assumptions, implications, and potential remedies. The Leadership Quarterly, 18(5),
435-446. doi:10.1016/j.leaqua.2007.07.001
Jenner, R. (2000). Globalization, cultural symbols, and group consciousness: Culture as an
adaptive complex system. World Futures, 56(1), 21-39.
doi:10.1080/02604027.2000.9972792
Jones, A. M. (2005). The anthropology of leadership: Culture and corporate leadership in the
American south. Leadership, 1(3), 259-278.
Katzenbach, J. R., & Smith, D. K. (1993). The discipline of teams. Harvard Business Review,
71(2), 111-120.

120
Killick, E. (2009). Ashéninka amity: A study of social relations in an Amazonian society. The
Journal of the Royal Anthropological Institute, 15(4), 701-718.
Kotter, J., P. (1988). The leadership factor. New York, NY: The Free Press.
Kotter, J., P. (1990). A force for change: How leadership differs from management. New York,
NY: The Free Press.
Kotter, J., P. (1999). John P. Kotter on what leaders really do. United States: Harvard Business
Review Book.
Kroeber, A.L., & Kluckhohn, C. (1952). Culture: A critical review of concepts and definitions.
Cambridge, MA: The Museum.
Kouzes, J. M., & Posner, B. Z. (2007). The leadership challenge, (4th ed.). San Francisco, CA:
Jossey-Bass.
Kuper, A. (1985). Durkheim's theory of primitive kinship. The British Journal of Sociology,
36(2), 224-237.
Lewellen, T. C. (1993). Individualism and hierarchy: A grid/group analysis of American
political culture. PoLAR: Political and Legal Anthropology Review, 16(3), 39-48.
doi:10.1525/pol.1993.16.3.39
Lockhart, C. (2001). Using grid-group theory to explain distinctive Japanese political
institutions. East Asia: An International Quarterly, 19(3), 51-83.
Lomax, R. G. & Hahs-Vaughn, D. L. (2012). An introduction to statistical concepts. (3rd ed.).
New York, NY: Routledge/Taylor & Francis.
Lowe, K. B., Kroeck, K. G., & Sivasubramaniam, N. (1996). Effectiveness correlates of
transformational and transactional leadership: A meta-analytic review of the MLQ

121
literature. The Leadership Quarterly, 7(3), 385-425. doi:10.1016/S1048-
9843(96)90027-2
Mamadouh, V. D. (1997). Political culture: A typology grounded on cultural theory.
GeoJournal, 43(1), 17-25.
Mamadouh, V. D. (1999). Grid-group cultural theory: an introduction. GeoJournal, 47(3), 395-
409.
McCleskey, J. A. (2014). Situational, transformational, and transactional leadership and
leadership development. Journal of Business Studies Quarterly, 5(4), 117-130.
McGregor, D. M. (1957). The human side of enterprise. In J. M. Shafritz and J. S. Ott (Eds.),
Classics of Organization Theory, 5th edition (pp. 179-184). Belmont, CA: Wadsworth
Group/Thompson Learning.
Meinert, D. (2014, August). Leadership development spending is up. HR Magazine, 59 (8), 14.
Michel, J. W., Lyons, B. D., & Cho, J. (2011). Is the full-range model of leadership really a full-
range model of effective leader behavior. Journal of Leadership & Organizational
Studies, 18(4), 493 –507. doi:10.1177/1548051810377764
Morrill, C. (2008). Culture and organization theory. ANNALS of the American Academy of
Political and Social Science, 619(1), 15-40. doi:10.1177/0002716208320241
Northouse, P. G. (2007). Leadership theory and practice, (4th ed.). Thousand Oaks, CA: Sage.
Osborn, R. N., Hunt, J. G., & Jausch, L. R. (2002). Toward a contextual theory of leadership.
The Leadership Quarterly, 13(6), 797-837.
Ouchi, W. G. (1980). Markets, bureaucracies, and clans. Administrative Science Quarterly,
25(1). 129-141.

122
Peterson, R. A. (1979). Revitalizing the culture concept. Annual Review of Sociology, 5, 137-
166.
Peterson, C. M., & Peterson, T. O. (2015). Educating student managerial leaders: What critical
behaviors should be developed? Journal of Educational Issues, 1(1). 135-150.
doi:10.5296/jei.v1i1.7612
Peterson, T. O., Beard, J. W., & Van Fleet, D. D. (2012). The impact of situational factors on
information system (IS) managerial leader behaviors: What information system
employees want. Journal of Business & Leadership: Research, Practice and Teaching,
8, 54-68
Peterson, T. O., & Peterson, C. M. (2012). What managerial leadership behaviors do student
managerial leaders need? An empirical study of student organizational members.
Journal of Leadership Education, 11(1), 102-120.
Peterson, T. O., & Van Fleet, D. D. (2008). A Tale of two situations: An empirical study of
behavior by not-for-profit managerial leaders, Public Performance & Management
Review, 31(4), 503-516. doi:10.2753/PMR1530-9576310401
Porter, L. W., & McLaughlin, G. B. (2006). Leadership and organizational context: Like the
weather? Leadership Quarterly, 17(6), 559-576.
Quinn, R. E. (1991). Beyond rational management: Mastering the paradoxes and competing
demands of high performance. San Francisco, CA: Jossey-Bass.
Quinn, R. E., & Cameron, K. (1983). Organizational life cycles and shifting criteria of
effectiveness: Some preliminary evidence. Management Science, 29(1), 33-51.
doi:10.1287/mnsc.29.1.33

123
Quinn, R. E., & Rohrbaugh, J (1981). A Competing values approach to organizational
effectiveness. Public Productivity Review, 5(2), 122-140. doi:10.2307/3380029
Quinn, R. E., & Rohrbaugh, J. (1983). A spatial model of effectiveness criteria: Towards a
competing values approach to organizational analysis. Management Science, 29(3), 363-
377.
Ritzer, G. (2010). Contemporary social theory and its classical roots: The basics, (3rd ed.). New
York, NY: McGraw-Hill.
Ritzer, G. (2011). Sociological theory, (8th ed.). New York, NY: McGraw-Hill.
Ritzer G., & Stepnisky, J. (2013). Contemporary sociological theory and its classical roots: The
basics, (4 ed.). New York, NY: McGraw-Hill.
Robbins, S. P., & Coulter, M. (2014). Management, (12th ed.). Boston, MA: Pearson.
Salzman, P. C. (2001). Understanding Culture: An introduction to anthropological theory.
Long Grove, IL: Waveland Press.
Sarros, J. C., Gray, J., & Densten, I. L. (2002). Leadership and its impact on organizational
culture. Journal of International Business Studies, 10(2), 1-26.
Schein, E. H. (1985). Organizational culture and leadership, (4th ed.). San Francisco, CA:
Jossey-Bass.
Schein, E. H. (2010). Organizational culture and leadership, (4th ed.). San Francisco, CA:
Jossey-Bass.
Selznick, P. (1948). Foundations of the theory of organization. American Sociological Review,
13(1), 25-35.
Senge, P. M. (2006). The fifth discipline: The art and practice of the learning organization.
New York NY: Doubleday.

124
Sherry, A., & Henson, R. K. (2005). Conducting and interpreting canonical correlation analysis
in personality research: A user-friendly primer. Journal of Personality Assessment, 84(1),
37–48.
Smircich, L. (1983). Concepts of culture and organizational analysis. Administrative Science
Quarterly, 28(3), 339-358.
Stallard, M. L. (2014, December 1). Closing your company’s ‘leadership gap’. FoxBusiness.
Retrieved from http://www.foxbusiness.com/features/2014/12/01/closing-your-
companys-leadership-gap.html
Stevens, J. P. (2002). Applied multivariate statistics for the social sciences, (4th ed.). Mahwah,
NJ: Lawrence Erlbaum Associates.
Sumner, William G. (2007). Folkways: A study of the sociological importance of usages,
manners, customs, mores, and morals. New York, NY: Cosimo. (Original work
published in 1906).
Tejada, M. J., Scandura, T. A., & Pillia, R. (2001). The MLQ revisited: Psychometric properties
and recommendations, The Leadership Quarterly, 12(1), 31-52. doi:10.1016/S1048-
9843(01)00063-7
Trice, H. M., & Beyer, J. M. (1993). The cultures of work organizations. Englewood Cliffs, NJ:
Prentice-Hall.
Tsai, Y., Wu, S., & Chung, H. (2009). The exploration of relationship between organizational
culture and style of leadership. Service Systems and Service Management, 2009.
ICSSSM '09. 6th International Conference on, 585-590.
doi:10.1109/ICSSSM.2009.5174951
Tukey, J. W. (1977). Exploratory data analysis. Reading, MA: Addison-Wesley.

125
Turner, J. H. (2013). Contemporary sociological theory. Los Angeles, CA: Sage.
Turner, J. H., Beegley, L., & Powers, C. H. (2012). The emergence of sociological theory, (7th
ed.). Los Angeles, CA: Sage.
Tylor, E. B. (1871). Primitive culture. New York, NY: J. P. Putnam’s Sons.
Vecchio, R. P. (2007). Leadership: Understanding the dynamics of power and influence in
organizations, (2 ed.). Notre Dame, IN: University of Notre Dame Press.
Wildavsky, A. (1987). Choosing preferences by constructing institutions: A cultural theory of
preference formation. The American Political Science Review, 81(1), 3-22.
Wilkins, A. L., & Ouchi, W. G. (1983). Efficient cultures: Exploring the relationship between
culture and organizational performance. Administrative Science Quarterly, 28(3), 468-
481.
Yukl (1999). An evaluation of conceptual weaknesses in transformational and charismatic
leadership theories. Leadership Quarterly, 10(2), 285-305.
Yukl (2013). Leadership in organizations. Upper Saddle River, NJ: Prentice Hall.
Zahra, S. (2003). "The Practice of Management": Reflections on Peter F. Drucker's Landmark
Book. The Academy of Management Executive (1993-2005), 17(3), 16-23. Retrieved
from http://www.jstor.org/stable/4165976

126
APPENDIX A: INSTRUMENT MOCK UP
This appendix contains a mock-up of the online instrument used in this study. In this
mock-up, separate HTML pages are demarcated by dashed lines, and navigation buttons are
shown as grey rectangles.
Introduction
Thank you for considering taking this survey. The information gained from this research can help your organization
as you continue to move forward.
The first part of the survey is an Informed Consent for the survey. This part is long, but it is important that you have
all of the information you need to participate in the survey.
Click on NEXT below to take you to the Informed Consent.
NEXT
- - - - - - - - - - - - - - - - - - - - - - - - - - - - - - - - - - - - - - - - - - - - - - - - - - - - - - - - - - - - - - - - - - - - - - - - - - - - - - - -
Informed Consent to Participate in the Survey
Introduction and purpose of the research study
is working with Heidi Larson, a graduate student at NDSU, to conduct her graduate research study to
learn more about the dynamics of this organization.
Invitation to participate
Since you are a member of this organization, you are invited to participate. Your participation is not required and is
entirely your choice, and you may change your mind or quit participating at any time, with no penalty to you.
However, your assistance would be greatly appreciated in making this a meaningful study. The survey is only for
participants 18 years or older. If you are under 18, please do not participate and thank you for your time.
Explanation of survey and access to information
It should take about 25 minutes to complete the questions which are multiple choice or fill in a number.
Access to information
This study is anonymous. That means that no one, not even members of the research team, will know that the
information you give comes from you and there is no link to your identity. Once analyzed, the results will be shared
with your company in aggregate form meaning that just an overall summary of the entire organization will be
presented. No individual results will be presented.
Potential benefits and risks
It is not possible to identify all potential risks in research procedures, but we have taken reasonable safeguards to
minimize any known risks. These known risks include: loss of confidentiality or some of the questions could make
you feel uncomfortable. You are not expected to get any personal benefit from being in this study. Benefits to
others and the organization are likely to include advancement of knowledge of the relationship of elements in the
organization.

127
Contact information for questions or concerns
If you have any questions or concerns about this project, please contact me, Heidi Larson, Education Graduate
Student at [email protected], or 701.320.2298, or contact my adviser Dr. Brent Hill, at NDSU, 701.231.8011,
or the NDSU Human Research Protection Program toll-free at 1-855-800-6717 or by email at [email protected].
After reading the information above, choose from the following and click on NEXT below.
○ Yes, I would like to continue with the survey after reading the Informed Consent to the survey and I
am 18 years of age or older.
○ No, I am not interested in continuing with the survey, OR, I am under 18 years of age as of today.
NEXT
- - - - - - - - - - - - - - - - - - - - - - - - - - - - - - - - - - - - - - - - - - - - - - - - - - - - - - - - - - - - - - - - - - - - - - - - - - - - - - - -
Organizational Culture Assessment Instrument (OCAI) / Current Status
INSTRUCTIONS
Below there are six sets of statements about the culture of the organization. There is no "right" culture of an
organization. For each set, I would like you to think about the culture as it is right now, and using 100 points total,
assign each of the 4 statements in each set giving the highest points to the statement that is most like your
organization as it is right now. This is an example using types of food:
If I were to assign 4 types of my favorite foods and I was given the following statements:
1. Pizza
2. Hamburger
3. Salad
4. Broccoli
This is how I would assign the points. Since I really like pizza, somewhat like hamburger, seldom eat salad, and
rarely eat broccoli, I might choose to assign pizza 55 points, hamburger 23 points, salad 12 points, and broccoli 10
points as my favorite foods as of right now. Note that it is very important that the total points assigned to each of the
4 statements equal 100 points. So, 55 (pizza) + 23 (hamburger) + 12 (salad) + 10 (broccoli) = 100 total points.
Using this as an example, click on NEXT below to take you to the first set of statements, and assign each statement
points as to how you find the culture in your organization right now.
NEXT
- - - - - - - - - - - - - - - - - - - - - - - - - - - - - - - - - - - - - - - - - - - - - - - - - - - - - - - - - - - - - - - - - - - - - - - - - - - - - - - -
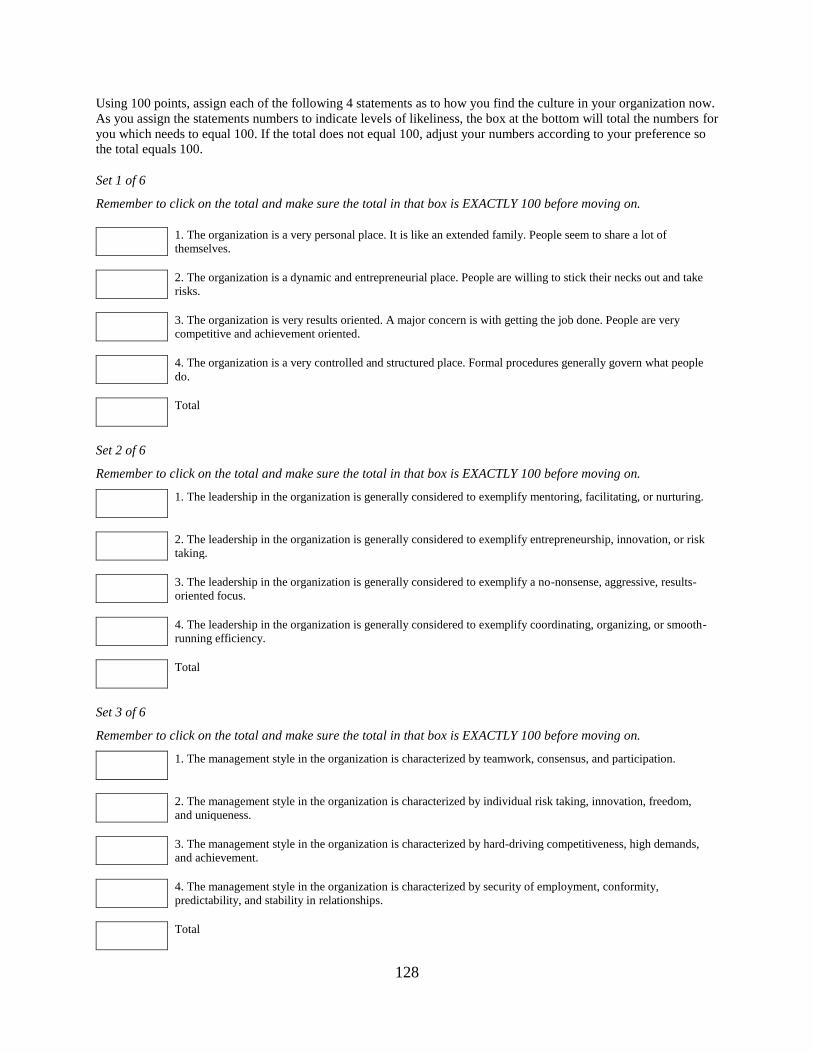
128
Using 100 points, assign each of the following 4 statements as to how you find the culture in your organization now.
As you assign the statements numbers to indicate levels of likeliness, the box at the bottom will total the numbers for
you which needs to equal 100. If the total does not equal 100, adjust your numbers according to your preference so
the total equals 100.
Set 1 of 6
Remember to click on the total and make sure the total in that box is EXACTLY 100 before moving on.
1. The organization is a very personal place. It is like an extended family. People seem to share a lot of
themselves.
2. The organization is a dynamic and entrepreneurial place. People are willing to stick their necks out and take
risks.
3. The organization is very results oriented. A major concern is with getting the job done. People are very
competitive and achievement oriented.
4. The organization is a very controlled and structured place. Formal procedures generally govern what people
do.
Total
Set 2 of 6
Remember to click on the total and make sure the total in that box is EXACTLY 100 before moving on.
1. The leadership in the organization is generally considered to exemplify mentoring, facilitating, or nurturing.
2. The leadership in the organization is generally considered to exemplify entrepreneurship, innovation, or risk
taking.
3. The leadership in the organization is generally considered to exemplify a no-nonsense, aggressive, results-
oriented focus.
4. The leadership in the organization is generally considered to exemplify coordinating, organizing, or smooth-
running efficiency.
Total
Set 3 of 6
Remember to click on the total and make sure the total in that box is EXACTLY 100 before moving on.
1. The management style in the organization is characterized by teamwork, consensus, and participation.
2. The management style in the organization is characterized by individual risk taking, innovation, freedom,
and uniqueness.
3. The management style in the organization is characterized by hard-driving competitiveness, high demands,
and achievement.
4. The management style in the organization is characterized by security of employment, conformity,
predictability, and stability in relationships.
Total
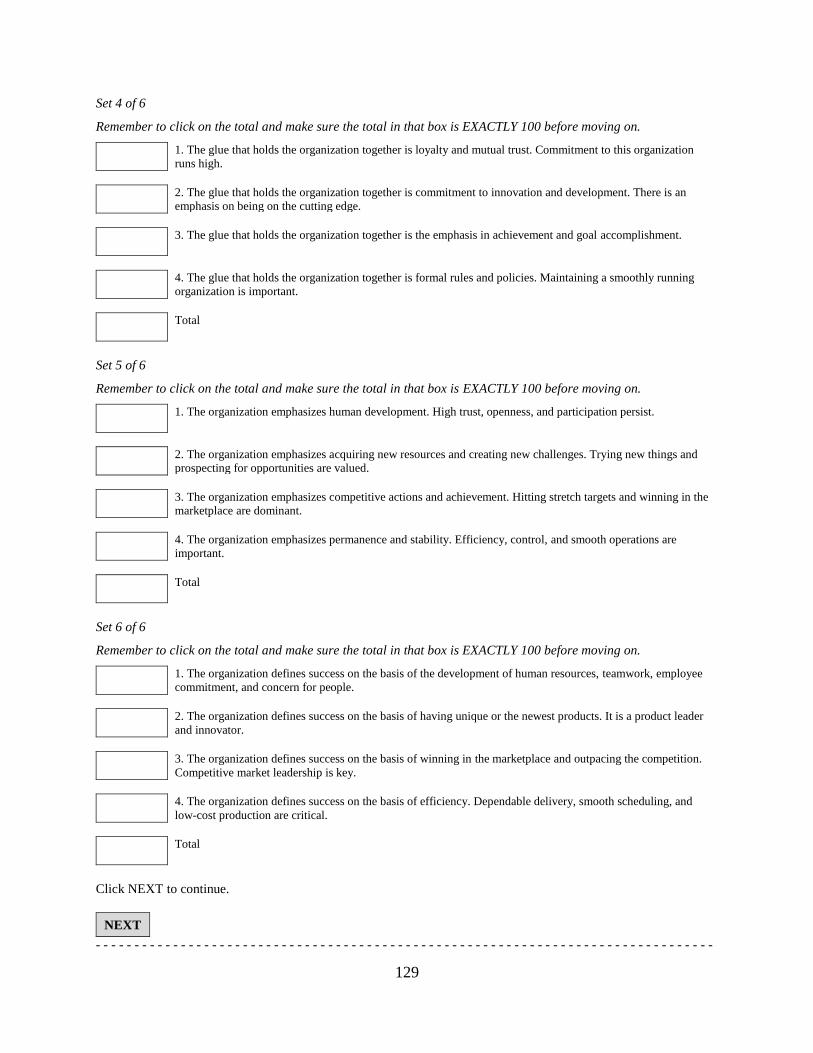
129
Set 4 of 6
Remember to click on the total and make sure the total in that box is EXACTLY 100 before moving on.
1. The glue that holds the organization together is loyalty and mutual trust. Commitment to this organization
runs high.
2. The glue that holds the organization together is commitment to innovation and development. There is an
emphasis on being on the cutting edge.
3. The glue that holds the organization together is the emphasis in achievement and goal accomplishment.
4. The glue that holds the organization together is formal rules and policies. Maintaining a smoothly running
organization is important.
Total
Set 5 of 6
Remember to click on the total and make sure the total in that box is EXACTLY 100 before moving on.
1. The organization emphasizes human development. High trust, openness, and participation persist.
2. The organization emphasizes acquiring new resources and creating new challenges. Trying new things and
prospecting for opportunities are valued.
3. The organization emphasizes competitive actions and achievement. Hitting stretch targets and winning in the
marketplace are dominant.
4. The organization emphasizes permanence and stability. Efficiency, control, and smooth operations are
important.
Total
Set 6 of 6
Remember to click on the total and make sure the total in that box is EXACTLY 100 before moving on.
1. The organization defines success on the basis of the development of human resources, teamwork, employee
commitment, and concern for people.
2. The organization defines success on the basis of having unique or the newest products. It is a product leader
and innovator.
3. The organization defines success on the basis of winning in the marketplace and outpacing the competition.
Competitive market leadership is key.
4. The organization defines success on the basis of efficiency. Dependable delivery, smooth scheduling, and
low-cost production are critical.
Total
Click NEXT to continue.
NEXT
- - - - - - - - - - - - - - - - - - - - - - - - - - - - - - - - - - - - - - - - - - - - - - - - - - - - - - - - - - - - - - - - - - - - - - - - - - - - - - - -

130
Organizational Culture Assessment Instrument (OCAI) / Preference
INSTRUCTIONS
In the following section, you will find the exact same set of questions. Except for this set, I would like you to think
about how you would like to see the culture in 5 years. Again, using 100 points total, assign each of the 4 statements
in each set. This is an example using types of food:
If I were to assign 4 types of my favorite foods as to how I would like them to be in 5 years:
1. Pizza
2. Hamburger
3. Salad
4. Broccoli
Even though I assigned pizza higher points for my favorite food now, I would now assign salad 65 points, broccoli
20 points, hamburger 8 points and pizza 7 points as to how I would like my favorite foods to be in 5 years. Again for
this section, the points will need to add up to 100 points total. So, 7 (pizza) + 8 (hamburger) + 65 (salad) + 20
(broccoli) = 100 total points.
Using this as an example, click on NEXT below to take you to the first set of statements, and assign each statement
points as to how you would like to see the culture in 5 years.
NEXT
- - - - - - - - - - - - - - - - - - - - - - - - - - - - - - - - - - - - - - - - - - - - - - - - - - - - - - - - - - - - - - - - - - - - - - - - - - - - - - - -
Again using 100 points, assign the following 4 statements as to how you would like the culture to be in5 years. If the
total is not at 100, adjust your numbers according to your preference so the total equals 100.
Set 1 of 6
Remember to click on the total and make sure the total in that box is EXACTLY 100 before moving on.
1. The organization is a very personal place. It is like an extended family. People seem to share a lot of
themselves.
2. The organization is a dynamic and entrepreneurial place. People are willing to stick their necks out and take
risks.
3. The organization is very results oriented. A major concern is with getting the job done. People are very
competitive and achievement oriented.
4. The organization is a very controlled and structured place. Formal procedures generally govern what people
do.
Total

131
Set 2 of 6
Remember to click on the total and make sure the total in that box is EXACTLY 100 before moving on.
1. The leadership in the organization is generally considered to exemplify mentoring, facilitating, or nurturing.
2. The leadership in the organization is generally considered to exemplify entrepreneurship, innovation, or risk
taking.
3. The leadership in the organization is generally considered to exemplify a no-nonsense, aggressive, results-
oriented focus.
4. The leadership in the organization is generally considered to exemplify coordinating, organizing, or smooth-
running efficiency.
Total
Set 3 of 6
Remember to click on the total and make sure the total in that box is EXACTLY 100 before moving on.
1. The management style in the organization is characterized by teamwork, consensus, and participation.
2. The management style in the organization is characterized by individual risk taking, innovation, freedom,
and uniqueness.
3. The management style in the organization is characterized by hard-driving competitiveness, high demands,
and achievement.
4. The management style in the organization is characterized by security of employment, conformity,
predictability, and stability in relationships.
Total
Set 4 of 6
Remember to click on the total and make sure the total in that box is EXACTLY 100 before moving on.
1. The glue that holds the organization together is loyalty and mutual trust. Commitment to this organization
runs high.
2. The glue that holds the organization together is commitment to innovation and development. There is an
emphasis on being on the cutting edge.
3. The glue that holds the organization together is the emphasis in achievement and goal accomplishment.
4. The glue that holds the organization together is formal rules and policies. Maintaining a smoothly running
organization is important.
Total

132
Set 5 of 6
Remember to click on the total and make sure the total in that box is EXACTLY 100 before moving on.
1. The organization emphasizes human development. High trust, openness, and participation persist.
2. The organization emphasizes acquiring new resources and creating new challenges. Trying new things and
prospecting for opportunities are valued.
3. The organization emphasizes competitive actions and achievement. Hitting stretch targets and winning in the
marketplace are dominant.
4. The organization emphasizes permanence and stability. Efficiency, control, and smooth operations are
important.
Total
Set 6 of 6
Remember to click on the total and make sure the total in that box is EXACTLY 100 before moving on.
1. The organization defines success on the basis of the development of human resources, teamwork, employee
commitment, and concern for people.
2. The organization defines success on the basis of having unique or the newest products. It is a product leader
and innovator.
3. The organization defines success on the basis of winning in the marketplace and outpacing the competition.
Competitive market leadership is key.
4. The organization defines success on the basis of efficiency. Dependable delivery, smooth scheduling, and
low-cost production are critical.
Total
We will now be moving on to the next part. Click NEXT to continue.
NEXT
- - - - - - - - - - - - - - - - - - - - - - - - - - - - - - - - - - - - - - - - - - - - - - - - - - - - - - - - - - - - - - - - - - - - - - - - - - - - - - - -
Multifactor Leadership Questionnaire (MLQ) (NOTE: Permission was given to print only five of the survey questions. As an example, the Leadership
behavior associated with the survey question is in blue print following the question.) INSTRUCTIONS
The following statements have to do with the overall leadership in the organization. When thinking about the
leadership of the organization, rate each statement accordingly.
Response key:
1 = Not at all
2 = Once in a while
3 = Sometimes
4 = Fairly often
5 = Frequently if not always

133
The Overall Leadership... 1 2 3 4 5
Provides me with assistance in exchange for my efforts (Contingent Reward) ○ ○ ○ ○ ○
Re-examines critical assumptions to question whether they are appropriate (Intellectual
Stimulation) ○ ○ ○ ○ ○
Fails to interfere until problems become serious (Management by Exception Passive) ○ ○ ○ ○ ○
Focuses attention on irregularities, mistakes, exceptions, and deviations from standards ○ ○ ○ ○ ○
Avoids getting involved when important issues arise ○ ○ ○ ○ ○
Talks about his/her most important values and beliefs (Idealized Influence) ○ ○ ○ ○ ○
Is absent when needed ○ ○ ○ ○ ○
Seeks differing perspectives when solving problems ○ ○ ○ ○ ○
Talks optimistically about the future (Inspirational Motivation) ○ ○ ○ ○ ○
Instills pride in me for being associated with him/her ○ ○ ○ ○ ○
Discusses in specific terms who is responsible for achieving performance targets ○ ○ ○ ○ ○
Waits for things to go wrong before taking action ○ ○ ○ ○ ○
Talks enthusiastically about what needs to be accomplished ○ ○ ○ ○ ○
Specifies the importance of having a strong sense of purpose ○ ○ ○ ○ ○
Spends time teaching and coaching ○ ○ ○ ○ ○
Makes clear what one can expect to receive when performance goals are achieved ○ ○ ○ ○ ○
Shows that he/she is a firm believer in "If it ain't broke, don't fix it." ○ ○ ○ ○ ○
Goes beyond self-interest for the good of the group ○ ○ ○ ○ ○
Treats me as an individual rather than just as a member of a group ○ ○ ○ ○ ○
Demonstrates that problems must become chronic before taking action ○ ○ ○ ○ ○
Acts in ways that builds my respect ○ ○ ○ ○ ○
Concentrates his/her full attention on dealing with mistakes, complaints, and failures ○ ○ ○ ○ ○
Considers the moral and ethical consequences of decisions ○ ○ ○ ○ ○
Keeps track of all mistakes ○ ○ ○ ○ ○
Displays a sense of power and confidence ○ ○ ○ ○ ○
Articulates a compelling vision of the future ○ ○ ○ ○ ○
Directs my attention toward failures to meet standards ○ ○ ○ ○ ○
Avoids making decisions ○ ○ ○ ○ ○
Considers me as having different needs, abilities, and aspirations from others ○ ○ ○ ○ ○
Gets me to look at problems from many different angles ○ ○ ○ ○ ○
Helps me to develop my strengths ○ ○ ○ ○ ○
Suggests new ways of looking at how to complete assignments ○ ○ ○ ○ ○
Delays responding to urgent questions ○ ○ ○ ○ ○
Emphasizes the importance of having a collective sense of mission ○ ○ ○ ○ ○
Expresses satisfaction when I meet expectations ○ ○ ○ ○ ○
Expresses confidence that goals will be achieved ○ ○ ○ ○ ○
Is effective in meeting my job-related needs ○ ○ ○ ○ ○
Uses methods of leadership that are satisfying ○ ○ ○ ○ ○
Gets me to do more than I expected to do ○ ○ ○ ○ ○
Is effective in representing me to higher authority ○ ○ ○ ○ ○
Works with me in a satisfactory way ○ ○ ○ ○ ○
Heightens my desire to succeed ○ ○ ○ ○ ○
Is effective in meeting organizational requirements ○ ○ ○ ○ ○
Increases my willingness to try harder ○ ○ ○ ○ ○
leads a group that is effective ○ ○ ○ ○ ○
Click NEXT to continue.

134
NEXT
- - - - - - - - - - - - - - - - - - - - - - - - - - - - - - - - - - - - - - - - - - - - - - - - - - - - - - - - - - - - - - - - - - - - - - - - - - - - - - - -
Social Games Assessment Tool
This next section has two sets of questions.
Set 1 of 2
Please answer the following questions as to your preferred work preference. These questions are asking what you
would prefer and not how it currently is.
Response key:
1 = Very Strongly Disagree
2 = Strongly Disagree
3 = Disagree
4 = Somewhat Disagree
5 = Somewhat Agree
6 = Agree
7 = Strongly Agree
8 = Very strongly Agree
Items 1 2 3 4 5 6 7 8
I prefer a work atmosphere where authority is shared rather than a structure where it is
centralized (decision making occurs in the head office). ○ ○ ○ ○ ○ ○ ○ ○
I prefer a work atmosphere where my role(s) is non-specialized/no explicit job
description. ○ ○ ○ ○ ○ ○ ○ ○
I prefer a work atmosphere where work and labor activities are self-directed rather than
no autonomy. ○ ○ ○ ○ ○ ○ ○ ○
I prefer a work atmosphere where individuals are encouraged to take ownership rather
than being discouraged to participate in decisions. ○ ○ ○ ○ ○ ○ ○ ○
I prefer a work atmosphere where tools are individually chosen rather than allocated by
administration. ○ ○ ○ ○ ○ ○ ○ ○
I prefer an atmosphere where there is emphasis on individualized rather than non-
personalized. ○ ○ ○ ○ ○ ○ ○ ○
I am motivated by intrinsic/self-defined interests rather than extrinsic or institutional
group rewards. ○ ○ ○ ○ ○ ○ ○ ○
I prefer a work atmosphere where hiring decisions are more controlled by all levels
rather than controlled only at the administrative level. ○ ○ ○ ○ ○ ○ ○ ○
I prefer a work atmosphere where schedules are determined through group negotiation
rather than organizational rules/routines. ○ ○ ○ ○ ○ ○ ○ ○
I prefer a work atmosphere where rules and procedures are few rather than numerous. ○ ○ ○ ○ ○ ○ ○ ○
Click NEXT to continue.
NEXT
- - - - - - - - - - - - - - - - - - - - - - - - - - - - - - - - - - - - - - - - - - - - - - - - - - - - - - - - - - - - - - - - - - - - - - - - - - - - - - - -

135
Set 2 of 2
Please answer the following questions as to your preferred work preference. These questions are asking what you
would prefer and not how it currently is.
Items 1 2 3 4 5 6 7 8
I prefer a work atmosphere where work activities are initiated/planned by individual
working alone rather than collaboratively working together. ○ ○ ○ ○ ○ ○ ○ ○
I prefer a work atmosphere where work and after work socialization are separate rather
than incorporated activities. ○ ○ ○ ○ ○ ○ ○ ○
I prefer a work atmosphere where rewards benefit the individual rather than everyone. ○ ○ ○ ○ ○ ○ ○ ○
I prefer a work atmosphere where work is planned around individual goals/interests
rather than group goals/interests. ○ ○ ○ ○ ○ ○ ○ ○
I prefer a work atmosphere where performance is evaluated according to individual
goals/priorities, and criteria rather than group goals/priorities, and criteria. ○ ○ ○ ○ ○ ○ ○ ○
I prefer an atmosphere where employees work in isolation towards goals and objectives
rather than collaboratively towards goals and objectives. ○ ○ ○ ○ ○ ○ ○ ○
I prefer a work atmosphere where goals are generated individually rather than in
collaboratively in a group. ○ ○ ○ ○ ○ ○ ○ ○
I prefer a work atmosphere where communication flows primarily through individuals
and informally rather than corporate formal networks. ○ ○ ○ ○ ○ ○ ○ ○
I prefer a work atmosphere where workers have no allegiance/loyalty to the
organization rather than full allegiance/loyalty to the organization. ○ ○ ○ ○ ○ ○ ○ ○
I prefer a work atmosphere where responsibilities are ambiguous and fragmented with
no accountability rather than clear responsibility with much accountability. ○ ○ ○ ○ ○ ○ ○ ○
Click NEXT to continue.
NEXT
- - - - - - - - - - - - - - - - - - - - - - - - - - - - - - - - - - - - - - - - - - - - - - - - - - - - - - - - - - - - - - - - - - - - - - - - - - - - - - - -
Demographics
Before we conclude this survey, we would like to learn a little bit about you.
What is your gender?
○ Male ○ Female
What is your race?
○ White/Caucasian ○ African American ○ Hispanic ○ Asian
○ Native American ○ Pacific Islander ○ Other
How long have you been employed with this organization?
What is the highest level of education you have completed?
○ Less than High School ○ High School / GED
○ Some College ○ 2-year College Degree
○ 4-year College Degree ○ Master’s Degree
○ Doctoral Degree ○ Professional Degree (JD, MD)

136
What is your age as of today?
What best describes your employment status?
○ Full-time ○ Part-time
○ Full-time seasonal (40 or more hours per week) ○ Part-time seasonal (less than 40 hours/week)
Thank you! Your time is appreciated and your participation will help make this a meaningful study.
Click NEXT to finish.
NEXT

137
APPENDIX B: IRB APPROVAL DOCUMENT FROM NDSU

138
APPENDIX C: PERMISSION TO USE MLQ INSTRUMENT