the relevance of technical analysis; a dutch approach
TRANSCRIPT
7/29/2019 The relevance of Technical Analysis; a Dutch approach
http://slidepdf.com/reader/full/the-relevance-of-technical-analysis-a-dutch-approach 1/25
WhatistherelevanceofusingTechnicalAnalysiswheninvestingin
theAEX-index?
T o m S t r e n g
V r i j e U n i v e r s i t e i t A m s t e r d a m
P r e m a s t e r B u s i n e s s A d m i n i s t r a t i o n
F i n a n c i a l M a n a g e m e n t
S t u d e n t n u m b e r : 2 5 1 8 7 3 3
D a t e : J u n e 1 1 , 2 0 1 3
S u p e r v i s o r : m r . X i a o y u S h e n
S e c o n d r e a d e r : m r . N o r m a n S e e g e r
TherelevanceofTechnicalAnalysis
7/29/2019 The relevance of Technical Analysis; a Dutch approach
http://slidepdf.com/reader/full/the-relevance-of-technical-analysis-a-dutch-approach 2/25
THERELEVANCEOFTECHNICAL ANALYSIS,VRIJEUNIVERSITEIT AMSTERDAM
2
Index
Management summary 3
Introduction 4
Chapter 1: Statistical analysis 6
§ 1.1 Trend-indicators 6
§ 1.1.1 Simple Moving Average 6
§ 1.1.2 Moving Average Convergence Divergence (MACD) 7
§ 1.1.3 Bollinger Bands 8
§ 1.2 Oscillators 9
§ 1.2.1 Relative Strength Index (RSI) 9
§ 1.2.2 Stochastics 11
§ 1.3 Volume-indicators 12
§ 1.3.1 On Balance Volume (OBV) 12
§ 1.3.2 Money Flow Index (MFI) 13
Chapter 2: Calculation of the returns per indicator 15
§ 2.1 Set-up of the return calculations 15
§ 2.2 The number of buy- and sell signals given 16
§ 2.3 Returns per indicator 17
§ 2.4 Average returns 20
Chapter 3: Returns per indicator compared to scientific findings 22
Conclusion 24
References and appendix 25

7/29/2019 The relevance of Technical Analysis; a Dutch approach
http://slidepdf.com/reader/full/the-relevance-of-technical-analysis-a-dutch-approach 3/25
THERELEVANCEOFTECHNICAL ANALYSIS,VRIJEUNIVERSITEIT AMSTERDAM
3
Management summary
In the last five years investors, whether private or institutional, had to deal with hard economic times.
During the banking crisis, which started in 2008, and the European debt crisis in 2011 many investorsmade losses and lost their confidence in the financial markets. They started to look for a more rational
analysis on which they could base their investment decisions: technical analysis. Because of this,
technical analysis became more and more important. But the question is: what is the predictive power
of technical analysis and does technical analysis really add value to an investment, in other words:
what is the relevance of technical analysis?
In this thesis I focused on statistical analysis, the statistical part of technical analysis that works with
statistical indicators. These indicators can be divided in three groups: trend-indicators, oscillators and
volume-indicators. Each of these groups has several types of indicators. To determine the relevance of
technical analysis, I calculated these indicators and the returns that an investor could have made from
2008 to 2013 when he or she followed the given buy- and sell signals, thereby focusing on the Dutch
AEX-index and it’s three biggest funds listed on it: ING Bank, Royal Dutch Shell and Unilever.
For each of those funds and the AEX-index I calculated the following indicators and their returns:
the 20-days Moving Average, 100-days Moving average, 200-days Moving Average, 20-days Moving
Average versus 200-days Moving Average, Moving Average Convergence Divergence, Bollinger
Bands, Relative Strength Index, Stochastics and Money Flow Index. For five of these nine indicators
the average return is negative. Also the average return for each of the three groups of indicators is
negative, which leads to a negative average return over all indicators and over all the four investment
possibilities of - €6,81 per one share or indextracker.
Although these returns are negative, this doesn’t implicate that technical analysis is irrelevant. We
have to keep in mind that last five years the Dutch economy declined, thereby leading to declines on
the Dutch financial markets. Despite this, and according to empirical findings from historical research,
the graphs of the calculated indicators certainly consist incremental information and show patterns that
predict a certain upward, downward or sideway trend in the future. When we look at the calculated
returns, we conclude that technical analysis doesn’t necessarily lead to excess returns. But when the
economy recovers and when an investor not only follows one indicator, but instead uses a variety of
indicators, then technical analysis can certainly add value to your investment and is therefore
considered relevant. This finding is confirmed by the returns per indicator I calculated in this thesis
and also by the graphs of the indicators. These graphs can be seen, together with the data, in the four
digital Excel documents, which are attachments of this thesis.
7/29/2019 The relevance of Technical Analysis; a Dutch approach
http://slidepdf.com/reader/full/the-relevance-of-technical-analysis-a-dutch-approach 4/25
THERELEVANCEOFTECHNICAL ANALYSIS,VRIJEUNIVERSITEIT AMSTERDAM
4
Introduction
It’s 2013: 5 years after the worldwide banking crisis erupted. The banking crisis showed that complex
and risky financial products are creators of uncertainty and can lead to a crisis in the worldwidefinancial system. In 2010/2011, after several bankruptcies of major companies like Lehman Brothers
in the United States and Fortis Bank in the Netherlands, the financial markets were slightly recovering.
But another crisis began to rise in Europe: the debt crisis. Countries like Greece, Iceland, Ireland,
Spain, Italy, Portugal and recently Cyprus were, and most of them are still, in big financial troubles
because of their large amounts of debt. Trust in the financial markets dropped again to a historically
low level.
The European debt crisis is still not over, so the trust in financial markets is still very low. Most
investors, whether private or institutional, made (big) losses during banking crisis in 2008/2009 and
some of them still experience these kinds of losses, because of the continuing European debt crisis.
These two crises lead to sharp falls in share prices and worldwide indices. And not only private, risk-
seeking investors invested in these types of products, but also financial institutions like banks.
Because these losses are still in the mind of the investors, investors are very careful to start a new
investment (again). The low level of trust took away their guide on which they could base their
investment decisions.
The last decade private investors mainly used two different types for analyzing the financial markets,
which served as a guide for their investment decisions. The first is fundamental analysis in which the
profitability, solvability, competitiveness, the competence of management etc. of several listed
companies in several sectors are studied. This method tries to determine the fundamental value of a
company. The other way to analyze financial markets is technical analysis and this thesis will be
focused on this type of analysis.
Technical analysis seems to be an upcoming method in the past decade. To get back a certain level of
trust and certainty many investors started using technical analysis. The main reason why many
investors started using technical analysis is because technical analysis is a way of analysis that
statistically tries to search for connections between several variables and the development of the share
price. In the opinion of the investors this method seems to be less sensitive for subjective components
and irrational behavior in the financial markets. But is technical analysis really a good guide for
private investors? Does it give a good prediction of the development of share prices in the future?
In my thesis I am going to focus on the AEX-index, the most important and biggest share-index in the
Netherlands, and the 3 biggest companies listed on it: ING Bank, Royal Dutch Shell and Unilever.

7/29/2019 The relevance of Technical Analysis; a Dutch approach
http://slidepdf.com/reader/full/the-relevance-of-technical-analysis-a-dutch-approach 5/25
THERELEVANCEOFTECHNICAL ANALYSIS,VRIJEUNIVERSITEIT AMSTERDAM
5
This leads to the following central question of my thesis: What is the relevance of the use of
Technical Analysis when investing in the AEX?
How am I going to do my research?
Technical analysis consists of two different types: chartreading and statistical analysis. Chartreading is
also called visual analyzing or ‘graph reading.’ By investigating graphs of share prices, technical
analysts discover several recurring patterns in these share prices. The second part of technical
analysis, and also most important for determining the relevance, is statistical analysis. That is why I
will only focus on statistical analysis in this thesis.
For this statistical analysis, I performed my own statistical analysis by taking a look at the historical
market prices of the AEX and the 3 funds ING, Shell and Unilever from the last 5 years and
comparing these two several existing types of technical indicators that provide buy- and sell signals.
The period I am going to analyze is from April 2008 to the end of March 2013. I take this period
because then I capture both the financial crisis in 2008 and the European debt crisis in 2011. After that
I am going to compare these prices with the following types of statistical indicators to determine their
predictive power and hence, the general predictive power of technical analysis for the AEX:
• Trend indicators: the Simple Moving Average, the Moving Average Convergence Divergence
and the Bollinger Bands
• Oscillators: Relative Strength Index and Stochastics
• Volume indicators: the On Balance Volume and the Money Flow Index
In chapter 1 I am going to describe the goal of these indicators and how to use them. After that I am
going to compare these indicators with the AEX market prices of the last 5 years. I am also going to
compare these indicators with the daily share prices of the 3 biggest companies listed on the AEX are:
Unilever, Royal Dutch Shell and ING.
To determine the predictive power of these indicators in the last 5 years I simulated a trading strategy.
Based on the calculated indicators in chapter 1, I calculated the returns for each indicator that an
investor could make if he or she exactly followed the buy- and sell signals given by these indicators.
The returns will be showed and compared with each other in chapter 2.
After that I will shortly discuss in chapter 3 the empirical findings of some important historical studies
on the predictive power of technical analysis. Finally, by comparing these findings with the calculated
returns per indicator I can answer the central question of my thesis:
What is the relevance of the use of Technical Analysis when investing in the AEX?
7/29/2019 The relevance of Technical Analysis; a Dutch approach
http://slidepdf.com/reader/full/the-relevance-of-technical-analysis-a-dutch-approach 6/25
THERELEVANCEOFTECHNICAL ANALYSIS,VRIJEUNIVERSITEIT AMSTERDAM
6
Chapter 1: Statistical analysis
In this chapter I am going to describe the several types of indicators that are used in statistical analysis,
the first part of technical analysis. In statistical analysis, there are three groups in which statisticalindicators can be divided: trend-indicators, oscillators and volume-indicators. Each of those groups
has a number of indicators. I will describe these indicators and for each indicator I will discuss the
results of calculating for the AEX, ING, Royal Dutch Shell and Unilever. These calculations of these
indicators can all be found on the 1st
tab of each of the four Excel documents, which are an appendix
of this thesis.
§ 1.1 Trend indicators
The first group of statistical indicators is the trend-indicators. Trend indicators are indicators that show
the average development of the stand of an index or the share price of a single company.1
In this
paragraph the trend-following indicators Moving Average (MA) and Moving Average Convergence
Divergence (MACD) will be described.
§1.1.1 Simple Moving Average
The Simple Moving Average is a multiday-average of closing prices of an index or fund. A moving
average shows the trend of the closing price. The term of these moving averages can be different: there
is a short-term-, a medium-term and a long-term moving average. The share prices are from the period
April 2008 till March 2013, which is exactly 5 years. Based on the research of Brock, Lakonishock
and LeBaron (1992)2
I used a 20-day (=short-term), a 100-day (=medium-term) and a 200-day (=long-
term) moving average for the statistical analysis. These moving averages, which are abbreviated to
MA20, MA100 and MA200, were compared with the actual closing prices. The fourth moving
average indicator that is often used by investors is the indicator that compares the short-term MA20
with the long-term MA200. In each of the four Excel documents the results of the moving averages
are shown in the first graph on the second tab. For the moving averages there is a technical buy signal
when the line of the closing course breaks from below through the line of the MA and there is a
technical sell signal when the opposite occurs, i.e. when the closing course breaks from above through
the MA-line. For the MA20 versus MA200-indicator, a buy signal is given when the short-term MA20
breaks from below through the long-term MA200 and a sell signal is given when the short-term MA20
breaks from above through the long-term MA200.
1Murphy, J.J. (2008). Technical Analysis of the Financial Markets; a comprehensive guide to trading methods
and applications. New York, US: New York Institute of Finance, pp. 49 2Brock, W., Lakonishok, J., LeBaron, B. (1992). Simple technical trading rules and the stochastic properties of
2Brock, W., Lakonishok, J., LeBaron, B. (1992). Simple technical trading rules and the stochastic properties of
stock returns. Journal of Finance, Vol. 47, pp. 1731-1764
7/29/2019 The relevance of Technical Analysis; a Dutch approach
http://slidepdf.com/reader/full/the-relevance-of-technical-analysis-a-dutch-approach 7/25
THERELEVANCEOFTECHNICAL ANALYSIS,VRIJEUNIVERSITEIT AMSTERDAM
7
For the graph of the AEX you can see that from April 2008 till July 2009 the closing course is most of
the times under the lines of the three Moving Averages. This means that the daily closing course is
performing more badly than it’s moving averages. The banking crisis took place at that moment. In
July 2009 the closing course, when it was already above the MA100, breaks from below through the
MA20 and the long-term MA200. This indicates a buy signal. It is important to mention that the
arrows shown in the graph are all buy- and sell signals, only the ones who are visually the best to
see. From April 2010 to March 2011 the closing price and the MA’s stay close to each other. But at
the beginning of April 2011 the closing course breaks from above through the MA20 and the MA100,
and in May 2010 through the MA200. This indicates a sell signal and this period reflects the
consequences of the European debt crisis. The closing course shows a recovery in November 2011,
falls back in April 2012, but shows a buy signal at the end of June 2012 and after that the closing
course and the MA’s stay relatively stable.
The closing course and the MA’s of ING Bank first show a clear sell signal in May 2008. After that,
the course of ING falls sharply, because of the eruption of the banking crisis, from ± 25 euro to ± 3,50
euro in March 2009 (buy signal). After that, there is a sell signal in November 2009 and a buy signal
in July 2010. May 2011 shows a sell signal and more than a year later, in July 2012, there is a small
buy signal. This last period reflects the European debt crisis.
For Royal Dutch Shell the closing course stayed relatively stable over the last 5 years. It shows that
RDS is often seen as a defensive investment. The same as ING: there is a sell signal in May 2008
followed by a buy signal in March 2009 (banking crisis period). Then the course is relatively stable till
July 2011 (sell signal). Shortly after that there’s a buy signal again, but in august 2012 the course is
again going down which leads to a sell signal.
In the Moving Averages graph of Unilever you can also see the banking crisis (May 2008 till April
2009). After April 2009 the price of Unilever rises from ± 14 euros to ± 23 euros in July 2010, in
which there is a sell signal. In contrast to the AEX, ING and RDS, Unilever doesn’t show a sell signal
in the summer of 2011 (start of the European debt crisis), but instead it shows a buy signal. After that
the price of Unilever rises stable to a price of almost 32 euros at the end of March 2013.
§1.1.2 Moving Average Convergence Divergence
The Moving Average Convergence Divergence (MACD) is also a trend-indicator and is developed to
counter the lagging-effect of moving averages. The MACD consists of two lines: the MACD-line and
the triggerline (also called signal-line). The MACD-line is the difference between two exponential
moving averages (EMA’s): the 12-day EMA and the 26-day EMA. These are standard-values,
developed by the MACD-founder Gerald Appel.3
He developed the MACD in the 1960’s and stated
that when the MACD is positive, then the short-term moving average (EMA12) lies above the long-
3Appel, G. (2003). How to identify significant market turning points using the Moving Average Convergence
Divergence Inidicator or MACD. The Journal of Wealth Management, Vol. 6, pp. 27-36

7/29/2019 The relevance of Technical Analysis; a Dutch approach
http://slidepdf.com/reader/full/the-relevance-of-technical-analysis-a-dutch-approach 8/25

7/29/2019 The relevance of Technical Analysis; a Dutch approach
http://slidepdf.com/reader/full/the-relevance-of-technical-analysis-a-dutch-approach 9/25

7/29/2019 The relevance of Technical Analysis; a Dutch approach
http://slidepdf.com/reader/full/the-relevance-of-technical-analysis-a-dutch-approach 10/25
THERELEVANCEOFTECHNICAL ANALYSIS,VRIJEUNIVERSITEIT AMSTERDAM
10
becomes higher than 70 a sell signal is given and when the RSI becomes lower than 30 a buy signal is
given.6
The RSI is calculated as follows: RSI = 100 – (100/(1+RS))
where RS= Relative Strength = average share price increases / average share price declines
The average of the increases is an average of all the increases of the share price on a certain day,
compared to the share price on the previous day. The average of the decreases is an average of all the
declines of the share price on a certain day, compared to the share price on the previous day.
The Excel graphs of the RSI for the AEX and ING, RDS and Unilever are all on the 4th
tab of the
documents. The red lines in the graphs show the critical values of 70 and 30.
When looking at the RSI-graphs of AEX, ING, RDS and Unilever, we first see that RSI gives in
general more sell signals. This means that the AEX and the share prices of the 3 funds were too high
in the last years. You can see in the graphs that the goal of RSI is really to identify extreme share price
results. For the AEX it is important to see that the RSI in 2008 only gave a sell signal in April. In the
rest of 2008 and the first months of 2009 (banking crisis period) no sell signals were given. After that
several buy- and sell signals were given. Only in the period March 2011 to September 2011 there were
no sell signals given. And that is strange, because in that period the European debt crisis began.
If we look at the RSI-graph of ING we can see that ING is more volatile. There are more strong
movements of ING’s share price. Compared to the AEX, there are more buy signals in 2008 for ING.
Furthermore we see again that no sell signals were given in mid-2011.
If we look at the RSI-graphs of RDS and Unilever, which are defensive stocks, then we see that there
are several extreme movements. An example of a strong movement is the sharp fall at the end of
January 2013. We also see that the RSI for RDS only gave one sell signal in 2008 and we see that are
a bit more sell signals than buy signals were given. Those sell signals were given at a relatively regular
interval since March 2009.
This also applies to the RSI of Unilever. A bit more sell- than buy signals was given and there werefour sharp falls of the RSI in the last four months of 2012. The difference with the RSI of RDS is that
Unilever’s RSI gives a few sell signals, while RDS’ RSI-graph does not.
To conclude: the RSI didn’t give the correct signals when the banking crisis and the European debt
crisis began in 2008 and 2011. Therefore, buy or sell decisions can’t be mainly based on the RSI-
indicator. It is only a good indicator to identify extreme movements in the share price.
6Menkhoff, L., Taylor, M. (2007). The obstinate passion of foreign exchange professionals: Technical Analysis.
Journal of Economic Literature, Vol. 45, No. 4., pp. 936-972.

7/29/2019 The relevance of Technical Analysis; a Dutch approach
http://slidepdf.com/reader/full/the-relevance-of-technical-analysis-a-dutch-approach 11/25
THERELEVANCEOFTECHNICAL ANALYSIS,VRIJEUNIVERSITEIT AMSTERDAM
11
§ 1.2.2 Stochastics
The Stochastics-oscillator is based on the observation that when prices are rising, the latest price is
close to the highest price of a particular chosen period. When share prices are decreasing, then the
latest share price is somewhere in the lower part of the share price’s range. The Stochastics consists of
a few lines that fluctuate in a range from 0 to 100. The first line is the %K-line. This line measures the
relative position of the latest share price in a given period. A high outcome means that the latest share
price is close to the highest share price in the given period. Many technical analysts choose a period of
5 days. The %K-line is calculated as follows:
(latest closing price – lowest closing price of the previous 5 days) / (highest closing price of the
previous 5 days – lowest closing price of the previous 5 days)
Based on this K-line is the second line, the %D-line. This is a 3-day unweighted moving average of
the %K-line and this %D-line is called the Fast Stochastics. The Fast Stochastics reacts very quickly
on changes in share price. To avoid many false signals, the Slow Stochastics is added. This is an
average of the Fast Stochastics. The last line is the so-called Slow %D-line. It’s a 3-day moving
average of the Fast Stochastics and that’s why it is known as the Slow Stochastics. When both lines
are above 80, then the share is in the overbought-zone. The opposite is when both lines are below 20.
Then the share is in an oversold zone. According to the American technical analyst John J. Murphy,
the standard sell signal is given when in an overbought-zone the Fast Stochastics breaks from above
through the Slow Stochastics. A buy signal is given when the Fast Stochastics line breaks from below
through the Slow Stochastics in the oversold-zone.7
The Stochastics-graphs are on tab 5 of the Excel documents. Because the Stochastics are very volatile
and the period of 5 years is pretty long, I made the graphs very wide to have a better look at the buy
and sell moments. The yellow lines indicate the critical values of 80 and 20.
For the AEX-graph we can see that the Stochastic-lines are most of the times between 80 and 20.
When they are outside this range, they are mostly above 80. This indicates that the AEX-index is
overbought. We see that there are not very much, almost no, sell signals in 2008 and the first half of
2009. So the Stochastics actually misses the banking crisis. In this period both lines are often above80, but in this overbought-zone the Fast Stochastics (= the blue line) is never lower than the Slow
Stochastics (= red line). The first clear sell signal was given half July 2009, followed by a sell signal in
December 2009, September 2010, February and December 2011 and a weak sell signal in begin march
2013. Just like the RSI, two buy signals were given in June and July 2008, because Fast Stochastics
goes through the Slow Stochastics in the oversold-zone. After that there was a buy signal in February
2009 and that’s actually the only buy signal in the period from April 2008 till April 2013. We don’t
see buy signals in 2010 and that’s strange because 2010 is, compared to 2008/2009 and 2011, a
7Murphy, J.J. (2008). Technical Analysis of the Financial Markets; a comprehensive guide to trading methods
and applications. New York, US: New York Institute of Finance, pp. 246-249

7/29/2019 The relevance of Technical Analysis; a Dutch approach
http://slidepdf.com/reader/full/the-relevance-of-technical-analysis-a-dutch-approach 12/25
THERELEVANCEOFTECHNICAL ANALYSIS,VRIJEUNIVERSITEIT AMSTERDAM
12
relatively ‘good’ year for investors. The banking crisis was reduced in 2010 and the European debt
crisis had not yet begun. In the graph you can also see that 2011 was a very volatile year, but not much
sell signals and not even one buy signal is given that year.
We actually see the same in the Stochastic-graphs of ING, RDS and Unilever. 2011 is the most
volatile year, no sell signals were given in 2008 and 2011 and in the years between 2008 and 2011 no
buy signal was given.
Here we can conclude the same as we did for the RSI-indicator. Stochastics are a good indicator for
identifying extreme share price movements, but it didn’t give clear sell- or buy signals at the moments
when it was expected. This shows that oscillators are not very good predictors of the future course of
the share price, but instead are good identifiers of extreme share price movements.
§ 1.3 Volume-indicators
A third group of indicators is the group of volume-indicators. These indicators show the activity of
investors and the volume itself shows the force behind the direction in which the share price is
moving. I used two types of well-known and widely used volume-indicators: the On Balance Volume
(OBV) and the Money Flow Index.
§ 1.3.1 On Balance Volume (OBV)
The OBV is an important volume-indicator. It’s calculated by adding the volume of traded shares
today to the volume of yesterday, but only when the volume of today is higher than yesterday’s
volume. When this is not the case, then the volume of today is subtracted from yesterday’s OBV.8
Thus, the OBV-indicator is a cumulative volume. When this cumulative value is going up, then we are
in an upward market, a so-called ‘bull-market.’ A downward market is called a ‘bear-market.’ OBV
mainly shows the emotion of the investors. When share prices fall sharply then investors will, in panic,
liquidate their loss-making position by selling their shares massively. On the other hand, investors can
be very patient if their losses only rise slowly. So when there is a sharp fall or rise in the share price,
most investors won’t act rationally anymore but instead their actions will be more based on their emotions. This leads to many transactions and thus a high volume, which can lead to a change in the
trend of the share price. And because the direction of the OBV changes before the share price changes,
OBV is seen as a leading indicator.
Buy signals for the OBV are given at the moment that the OBV forms a new high, while the share
price is moving sideways. A sell signal is given when the OBV forms a new low, while the share price
is in a trading range.9
8
Sullivan, R., Timmermann, A., White, H. (1999). Data snooping, technical trading rule performance, and thebootstrap. The Journal of Finance, Vol. 54, No. 5, pp. 1647-16919Geels, H. (2011). Beleggen met technische analyse. Delft, the Netherlands: Keyword Info System, pp. 218-220

7/29/2019 The relevance of Technical Analysis; a Dutch approach
http://slidepdf.com/reader/full/the-relevance-of-technical-analysis-a-dutch-approach 13/25
THERELEVANCEOFTECHNICAL ANALYSIS,VRIJEUNIVERSITEIT AMSTERDAM
13
In the Excel documents the OBV-graphs are on tab 6. Below the OBV-graphs you can see a graph of
the closing price, because a buy- or sell signals depends on the development of the share price.
When we take a look at the OBV-graph of the AEX-index we see that the closing price was in a
downward trend from April 2008 till March 2009. In this period no sell- or buy signal was given. The
AEX roughly recovered in the period march 2009 till august 2009. In July 2009 a sell signal was
given, because the OBV reaches a new low, while the share price is going upwards. From September
2009 till July 2011 the share price moves sideways. In this period three buy signals are given
(indicated by the green arrow). Then there’s a short downward trend, which starts in July 2011. You
can see this by the sharp fall of the OBV. In September 2011 the share price started to move sideways
again and this led to two buy signals: one in September/October 2011 and the other in January 2013.
Actually the closing price for ING developed the last 5 years in the same way as the AEX-index. This
led to the fact that signals for ING are given at almost the same moments. The difference is that more
sell signals were given for ING as you can see.
The OBV and closing price of RDS and Unilever developed a bit different. Both were in a downward
trend from April 2008 till April 2009. For RDS, after that period, the share price rose relatively stable
for a long time till July 2011. But in this period the OBV reached some new low points, which is
indicated by the red arrows, which indicates a sell signal. After the small downward period in
July/august and the small upward period in the fall of 2011, the share price started to move sideways
in 2012 and this is still the case. In this period one buy signal was given.
The closing price of Unilever moves, compared to RDS, more sideways in the period January 2010 till
September 2011. This led to one buy signal. After September 2011, the share price moved upwards,
while the OBV set ± 6 new lows. This means that ± 6 sell signals were given.
When we look at the moments that buy- and sell signals were given, we have to conclude that most
buy signals were not followed by an increase in the share price and that most sell signals were not
followed by a decrease in the share price. So we have to conclude that the OBV is only a good
indicator to recognize changing trends.
§ 1.3.2 Money Flow Index (MFI)
The last indicator we describe is the Money Flow Index, abbreviated as MFI. The Money Flow Index
shows the power with which money goes in and out of a share. When much money goes in, then the
share price will increase. This volume-indicator is by most professional technical analysts seen as a
solution for the disadvantages of the OBV-indicator, because the MFI normalizes the values between 0
and 100. This implicates that buy- and sell signals don’t depend on the direction in which the share

7/29/2019 The relevance of Technical Analysis; a Dutch approach
http://slidepdf.com/reader/full/the-relevance-of-technical-analysis-a-dutch-approach 14/25
THERELEVANCEOFTECHNICAL ANALYSIS,VRIJEUNIVERSITEIT AMSTERDAM
14
price is moving and therefore it is easier for the MFI to determine the buy- and sell moments. There’s
a buy signal when the MFI goes below 30 and there is a sell signal when the MFI goes above 70.10
As you can see in the Excel-documents on tab 1 (the data) under ‘Money Flow Index’, you can see
that the Money Flow Index calculation is based on the so-called typical price. This typical price is
calculated, for each trading day, as follows: (highest price + lowest price + closing price) / 3.
When we multiply this typical price with the volume of that day, then we get the Raw Money Flow.
Then we divide this Raw Money Flow in the positive Money Flow MF+ (this is when the Raw Money
Flow of today is higher than the Raw Money Flow of yesterday) and the negative Money Flow MF-.
For both MF+ and MF- we calculate a 10-days moving average. And finally we can calculate the
Money Flow Index, which formula is as follows: MFI = 100- (100/(1+Money Ratio)),
where Money Ratio = (sum of 10-days MF+ / sum of 10-days MF-).
Because the MFI also normalizes values between 0 and 100, we can clearly see similarities with the
RSI-oscillator described in paragraph1.2.1. Here we also determine an overbought- and oversold zone.
Just as for the RSI-indicator, the overbought and oversold values for the MFI are also respectively 70
and 30. When the MFI is in the overbought zone, then we can say that too many shares are bought and
that the chance of taking profit grows. When the MFI is in the oversold zone, we can say that there is
too little turnover in the particular fund/share. So when the MFI goes above 70 a sell signal is given
and when it goes below 30 a buy signal is given. A sell signal is stronger when it makes a new high in
the overbought zone and a buy signal is stronger when it makes a new low in the oversold zone. The
main difference between the RSI and the MFI is that the RSI works with the closing course, while the
MFI works with the aforementioned typical price.
The graphs of the MFI are on the last tab of the Excel-documents. When we take a look at the four
MFI-graphs we can see that last years, for all four, much more sell signals than buy signals were
given. This implicates that the AEX and the shares of ING, RDS and Unilever where relatively many
times overbought in the last 5 years. The biggest sell signals were given in the last months of 2009 andin the period January 2011-oktober 2011. This last period reflects the European debt crisis, which
started in October 2011.
The buy signals were most of the time given at a moment that many investors already sold their
share(s), which led to a low share price. At these moments there is very little turnover in the fund.
Active investors recognize this and they are the first who started buying again.
10Geels, H. (2011). Beleggen met technische analyse. Delft, the Netherlands: Keyword Info System, pp. 220-
224

7/29/2019 The relevance of Technical Analysis; a Dutch approach
http://slidepdf.com/reader/full/the-relevance-of-technical-analysis-a-dutch-approach 15/25
THERELEVANCEOFTECHNICAL ANALYSIS,VRIJEUNIVERSITEIT AMSTERDAM
15
Chapter 2: Calculation of the returns per indicator
In the previous chapter I performed statistical analysis for the AEX and ING, Shell and Unilever. For
each of those four I calculated the several indicators. These can be divided in three groups: trend-indicators, oscillators and volume-indicators. After that I calculated all buy- and sell signals per
indicator for AEX, ING, Shell and Unilever. Based on all this buy- and sell signals I calculated the
returns per indicator, by following these signals. In this chapter I will discuss the calculated returns.
§ 2.1 Set-up of the return calculations
In total I calculated the returns for 9 indicators. 4 of these 9 indicators are Moving Average-indicators.
Together with the Moving Average Convergence Divergence (MACD) indicator and the Bollinger
Bands-indicator they form the group of trend-indicators. The returns of the oscillators consists the
return of the Relative Strength Index (RSI) indicator and the Stochastics-indicator. The 3rd
group of
indicators is the volume-indicators. This group consists of the On Balance Volume (OBV) indicator
and the Money Flow Index (MFI). It is important to mention here that I didn’t calculate the return for
the On Balance Volume (OBV) indicator. The reason for this is that the moment a buy-or sell signal is
given, strongly depends on the direction in which the closing price is moving. So buy and sell signals
do not only depend on the OBV-indicator itself, but also on the trend of the closing price. This makes
it complicated to determine the exact moment of a buy- or sell signal. Moreover, because a signal
depends on the trend of the closing price, relatively few buy- and sell signals are given. When
calculating the returns for this indicator, unreliable and irrelevant returns would arise.
Based on all the days at which a buy-or sell signal is given and the closing price on these days, I
calculated all the returns per indicator for AEX and for ING, Shell and Unilever. These returns are
calculated by simulating a trading strategy. This trading strategy is as follows:
An investor starts at the beginning of the analyzed period, which is at April 1, 2008 with 0 shares held.
The investor buys one share of ING, Shell or Unilever when a buy signal is given and he/she sells that
same share when a sell signal is given. For the AEX we assume that investors buy a tracker on the
AEX. A tracker is an investment product, which is a package of all shares listed on a certain index, in
this case the AEX-index. The value of the tracker is equal to the level of the AEX-index, because an
index is a sum of the per-share value of each fund listed on it. So for the AEX-index we assume that
an investor buys or sells a tracker on the AEX-index.
Just as for every other trading strategy, some assumptions have to when calculating the returns that
could have been made with each indicator. The assumptions I made for the simulation are as follows:

7/29/2019 The relevance of Technical Analysis; a Dutch approach
http://slidepdf.com/reader/full/the-relevance-of-technical-analysis-a-dutch-approach 16/25
7/29/2019 The relevance of Technical Analysis; a Dutch approach
http://slidepdf.com/reader/full/the-relevance-of-technical-analysis-a-dutch-approach 17/25
THERELEVANCEOFTECHNICAL ANALYSIS,VRIJEUNIVERSITEIT AMSTERDAM
17
We can see that all four Moving Average indicators have the same amount of buy and sell signals.
That is because the determination of buy- and sell signals implies that a buy signal is always followed
by a sell signal and a sell signal is always followed by a buy signal. The closing price can only break
once from below and once from above through the Moving Average-line.
For the Moving Averages we see that most signals were given for the short-term MA, the 20-days
MA. That’s because a MA with a shorter term lies closer to the line of the closing price and this leads
to more intersections and thus more buy-and sell signals. In contrast to the MA20 compared to closing
price we see that for the MA20 compared to the MA200 there are only 3, 4 or 6 buy- and sell signals
given in the last 5 years. These two MA’s almost never cross each other.
The Moving Average Convergence Divergence (MACD) and the Bollinger Bands are the two other
trend-indicators. We see for the MACD that the number of buy- and sell signals doesn’t differ very
much between AEX, ING, Shell and Unilever. This is also the case for the Bollinger Bands except that
Unilever showed significant more sell signals than buy signals. In general we see that for both MACD
and Bollinger Bands more sell- than buy signals were given in the last 5 years.
We see this difference even more obvious for the oscillators: the Relative Strength Index (RSI) and the
Stochastics. This implies that last years the funds and the AEX has been relatively more in the
overbought-zone (above 70 for RSI and above 80 for the Stochastics) than in the oversold-zone (below
30 for RSI and below 20 for Stochastics). This is caused mostly by the much downward corrections
for all 3 funds and the AEX-index in the period between the banking crisis in 2008/2009 and the
beginning of the European debt crisis in summer 2011.
We see the difference between the number of given buy- and sell signals the most for the volume-
indicators. Like I already mentioned at the end of chapter 1, the Money Flow Index gave much more
sell- than buy signals the last 5 years. The shares of the funds and the AEX were more in oversold-
zones than in overbought zones. That implies that there was too little turnover in the shares of the
funds and the AEX. Here you can see that in years of economic decline, which has been the case the
last 5 years, the volume of trading in shares and other financial products declines as well.
The other volume-indicator is the On Balance Volume-indicator. Although I didn’t calculate the return
for this indicator here we can also say, except for the AEX-index, that this indicator gave more sell-than buy signals. You can see this in the OBV-graphs on tab 6 of the Excel documents.
Finally, we see that the total amount of sell signals is for each of the four higher than the amount of
buy signals. You can see this as a clear reflection of the economic bad times from 2008 to 2013.
§ 2.3 Returns per indicator
In this paragraph I will discuss the calculated returns per indicator. Based on the assumptions
mentioned in paragraph 2.1, the simulation of the trading strategy led to the following returns per
indicator for AEX, ING, Shell and Unilever:

7/29/2019 The relevance of Technical Analysis; a Dutch approach
http://slidepdf.com/reader/full/the-relevance-of-technical-analysis-a-dutch-approach 18/25

7/29/2019 The relevance of Technical Analysis; a Dutch approach
http://slidepdf.com/reader/full/the-relevance-of-technical-analysis-a-dutch-approach 19/25
THERELEVANCEOFTECHNICAL ANALYSIS,VRIJEUNIVERSITEIT AMSTERDAM
19
- €0,26 per share. ING shows a big negative return of - €20,13 per share and for the AEX-index it leads
also to a big negative return of - €117,83. It should be mentioned here that this return for the AEX
looks very big, compared to the returns of the 3 funds. But because the AEX is an index, the value of
the AEX is also much higher than the 3 funds. Actually, compared to the initial value of each, ING
faces the biggest negative return in percentage when following the MACD-indicator. You can see this
by looking at ING’s closing price. At 1 April 2008 ING’s closing price is €24,93 and at 28 march
2013 it has fallen to €5,54. Overall, the MACD has a significant negative average return of - €33,92.
Bollinger Bands
The Bollinger Bands has negative returns for the AEX and ING of respectively - €6,72 and - €6,66 and
positive returns of €8,53 and €12,11 for Shell and Unilever. Here you see again the negative
development of the AEX and ING over the last 5 years and the less negative development of the more
stable funds Shell and Unilever. The average return is, in contrast to the MA20, the MA200 and the
MACD, positive: €1,82.
Relative Strength Index (RSI)
The RSI is the first of the two oscillators for which I calculated returns. The goal of the RSI is to
identify extreme movements in the share price. As I already said in paragraph 1.2.1, the RSI didn’t
give the correct signals when the banking crisis and the European debt crisis began in 2008 and 2011.
We can see that this leads to negative returns when looking at the returns of the RSI-indicator, and a
significant negative average return of - €31,76.
Stochastics
The other oscillator is the Stochastics. Here it is remarkable to see that the Stochastics, in contrast to
the RSI, leads to positive returns, besides a small negative return for ING. This difference can be
explained by looking at the volatility of the Stochastics. The Stochastics is relatively a more volatile
indicator than the RSI. This means that the Stochastics reacts more quickly on even a relatively small
price change. This ensures that buy- and sell signals are given a bit earlier by the Stochastics,compared to the RSI. Finally, this leads to a better average return of €22,85 for the Stochastics. This is
the highest average return of all indicators.
Money-Flow Index (MFI)
Following the Money-Flow Index leads to negative returns, except for Unilever. The negative returns
are mainly caused by the big difference between the amount of buy- and sell signals: only a few buy
signals were given, while sell signals have been given much more.
7/29/2019 The relevance of Technical Analysis; a Dutch approach
http://slidepdf.com/reader/full/the-relevance-of-technical-analysis-a-dutch-approach 20/25
THERELEVANCEOFTECHNICAL ANALYSIS,VRIJEUNIVERSITEIT AMSTERDAM
20
What would have been the best indicator to follow for each investment possibility?
If an investor only invested in an AEX-indextracker then following the Stochastics would have led to
the highest return, which is €93,13 per indextracker. When he or she only invested in ING, then the
100-days Moving Average led to the highest return, namely €1,52. Furthermore, the Bollinger Bands-
indicator generated the highest return of €8,53 for solely investing in Shell. Finally, the most
profitable indicator if an investor only invested in Unilever would have been the indicator that
compares the 200-days Moving Average with the 20-days Moving Average. This indicator generates a
return of €12,87 per share of Unilever.
Here we can conclude that there is not one indicator that generates the highest return for more than 1
investment possibility.
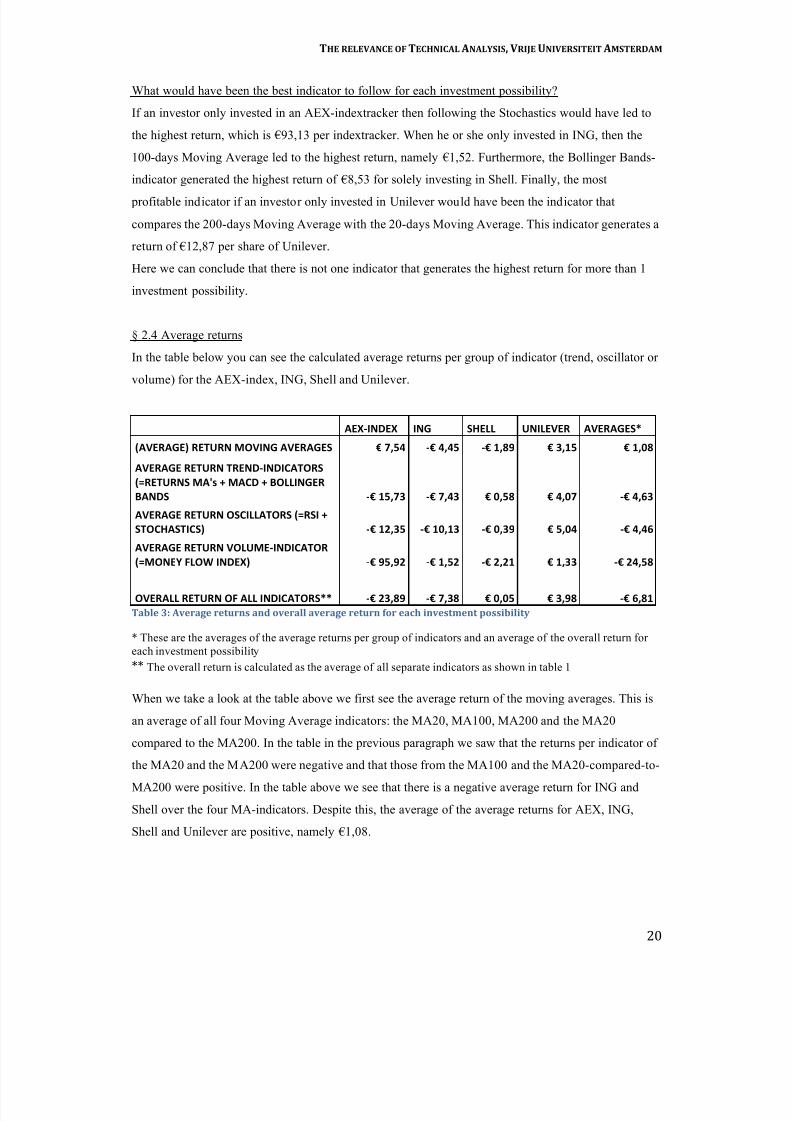
§ 2.4 Average returns
In the table below you can see the calculated average returns per group of indicator (trend, oscillator or
volume) for the AEX-index, ING, Shell and Unilever.
AEX-INDEX ING SHELL UNILEVER AVERAGES*
(AVERAGE)RETURNMOVINGAVERAGES €7,54 -€4,45 -€1,89 €3,15 €1,08
AVERAGERETURNTREND-INDICATORS
(=RETURNSMA's+MACD+BOLLINGER
BANDS -€15,73 -€7,43 €0,58 €4,07 -€4,63
AVERAGERETURNOSCILLATORS(=RSI+
STOCHASTICS) -€12,35 -€10,13 -€0,39 €5,04 -€4,46
AVERAGERETURNVOLUME-INDICATOR
(=MONEYFLOWINDEX) -€95,92 -€1,52 -€2,21 €1,33 -€24,58
OVERALLRETURNOFALLINDICATORS** -€23,89 -€7,38 €0,05 €3,98 -€6,81
Table3:Averagereturnsandoverallaveragereturnforeachinvestmentpossibility
* These are the averages of the average returns per group of indicators and an average of the overall return for
each investment possibility
**The overall return is calculated as the average of all separate indicators as shown in table 1
When we take a look at the table above we first see the average return of the moving averages. This is
an average of all four Moving Average indicators: the MA20, MA100, MA200 and the MA20
compared to the MA200. In the table in the previous paragraph we saw that the returns per indicator of
the MA20 and the MA200 were negative and that those from the MA100 and the MA20-compared-to-
MA200 were positive. In the table above we see that there is a negative average return for ING and
Shell over the four MA-indicators. Despite this, the average of the average returns for AEX, ING,
Shell and Unilever are positive, namely €1,08.

7/29/2019 The relevance of Technical Analysis; a Dutch approach
http://slidepdf.com/reader/full/the-relevance-of-technical-analysis-a-dutch-approach 21/25
THERELEVANCEOFTECHNICAL ANALYSIS,VRIJEUNIVERSITEIT AMSTERDAM
21
After that we look at the returns of the 3 different groups of indicators, starting with the average return
of the trend-indicators. This consists of the returns of the MA-indicators, the MACD-indicator and the
Bollinger Bands. We can see that the returns for this group are negative for AEX and ING and only
slightly positive for Shell. Unilever shows a significant positive average return for the trend-indicators
of €4,07. The average of the return of trend-indicator for all four investment possibilities is
- €4,63, caused by the big negative returns for AEX and ING.
Although the average of the return of oscillators for all four investment possibilities is a bit lower,
namely - €4,46, there are now three of the four investment possibilities who show a negative return.
Here also Shell shows a negative return. Only again Unilever shows a significant positive return of
€5,04 per share.
The third group of indicators is the group of volume-indicators. In my calculations this groups only
consists the money-flow-index indicator. This indicator gave a lot more sell- than buy signals and
most of all signals were given at wrong moments. This led to the negative returns for the AEX, ING
and Shell. Only Unilever shows a small positive return again of €1,33.
Finally, we look at the most important calculated returns: the overall return of all indicators per
investment possibility (= AEX, ING, Shell and Unilever). These overall return are an average of the
returns of all indicators, calculated separately for each of the four investment possibilities. We can see
that this overall return is negative for the AEX and ING, slightly positive for Shell and significantly
positive for Unilever. When we compare all the returns of these four investment possibilities to the
development of the stand of the AEX-index and the share prices of ING, Shell and Unilever in the last
5 years, then we have to conclude that each of those returns definitely reflects their development in the
last 5 years. The AEX-indicator dropped in the last 5 years and it’s negative return of - €23,89 reflects
this. ING felt sharply from €25 per share in 2008 to ± €5 per share at the end of March 2013. The big
negative return of - €7,38 per share of ING reflects this. The return of Shell, which is considered as a
stable fund, is positive. But, when compared to Unilever, in the last 5 years Shell felt more the
consequences of the two crises. This led to only a very small return of €0,05 per share of Shell.
Unilever is also considered to be a stable fund but performed better than Shell. This is confirmed bytheir return of €3,98 per share. So despite the two crises, Unilever performed well. Each of those four
overall returns exactly reflects the development of the four investment possibilities in the last 5 years.
So this shows that technical analysis and their returns are in this case a very good reflection of the
actual development of the AEX and the 3 funds. This definitely implies that technical analysis had a
significant amount of predictive power in the last 5 years for the Dutch financial markets.
7/29/2019 The relevance of Technical Analysis; a Dutch approach
http://slidepdf.com/reader/full/the-relevance-of-technical-analysis-a-dutch-approach 22/25
THERELEVANCEOFTECHNICAL ANALYSIS,VRIJEUNIVERSITEIT AMSTERDAM
22
Chapter 3: Returns per indicator compared to scientific findings
Different studies have been done on the predictive power and therefore the relevance of technical
analysis. We take a look at the empirical findings of some of these studies and compare their conclusions to the returns per indicator that I discussed in the previous chapter.
In their paper about the usefulness of moving averages Zhu and Zhou (2009) provided a theoretical
justification for investors to use the moving average indicator. The theoretical framework, which they
used in their research, offered a number of useful insights about technical analysis. First of all, they
concluded that technical analysis solves the problem about the amount of a new investment that a
technical trader has to invest in the stock market when he or she receives a buy signal. Second, it
shows how an investor might add value to his/her investment by using technical analysis. Especially
the moving average can add this value if the investor follows a fixed allocation rule which invests a
fixed amount of money into the stock market. Their third point is that when the true parameters of
their model are unknown, they find that the optimal generalized moving average is robust to model
specification and can even outperform the other optimal dynamic trading strategies substantially.11
The returns of the Moving Averages that I calculated do not fully confirm Zhu and Zhou’s empirical
findings. The calculated returns for the moving averages show that not all the four Moving Average-
indicators led to a positive return in the last 5 years. Although the average returns for the MA20 and
the MA200-indicators are negative, the returns confirm that the moving average can add value to an
investment when economic times are better.
Another important, and also recent, research is from Neely, Rapach, Tu and Zhou (May 2013). In their
working paper they describe the results of their scientific research, conducted on behalf of the Federal
Reserve Bank of St. Louis, on the role that technical indicators play in forecasting equity risk
premiums. They found that technical indicators exhibit statistically and economically significant
forecasting power for the monthly equity risk premium, clearly in line with that of well-known
macroeconomic variables from out of the literature. They also found that technical indicators, together
with macroeconomic variables, capture different types of relevant information for forecasting the
equity risk premium. And in particular that technical indicators better detect the typical decline in the
equity risk premium near business-cycle peaks. Finally, they demonstrated in their paper that
combining information from both technical indicators and macroeconomic variables leads to superior
equity premium risk forecasts and therefore offers substantial utility gains to investors.12
11Zhu, Y., Zhou, G. (2009). Technical analysis: an asset allocation perspective on the use of moving averages.
Journal of Financial Economics, Elsevier, Vol. 92, p. 519-54412 Neely, C.J., Rapach, D.E., Tu, J., Zhou, G. (2013). Forecasting the equity risk-premium; the role of technical
indicators. Federal Reserve Bank of St. Louis: Working paper series, p. 1- 26

7/29/2019 The relevance of Technical Analysis; a Dutch approach
http://slidepdf.com/reader/full/the-relevance-of-technical-analysis-a-dutch-approach 23/25
THERELEVANCEOFTECHNICAL ANALYSIS,VRIJEUNIVERSITEIT AMSTERDAM
23
We compare these findings to that of my statistical analysis. Therefore we have to look at the graphs
for each indicator. We can conclude from these graphs in general that these indicators do have a
certain amount of predictive power. But, as you can see in the return tables, for most of the indicators
this forecasting power didn’t led to positive returns. Although AEX and the 3 funds faced
economically bad times from 2008 to 2013, it should still be possible to generate a positive return, but
only if buy-and sell signals are given at a better moment. We have to conclude that most of the
calculated buy- and sell signals were given too late, thereby missing a part of a return what could have
been generated if these signals were given at an earlier moment.
Another important scientific research in the field of technical analysis is from Lo, Mamayski and
Wang (2000). In their paper about the foundations of technical analysis they concluded that certain
technical patterns, when applied to many stocks over many time periods, do provide incremental
information. In their opinion this does not necessarily imply that technical analysis can be used to
generate ‘excess’ trading profits. But it does raise the possibility that technical analysis can add value
to the investment process and is therefore considered relevant. This conclusion can also be derived
from the statistical analysis I conducted and the resulting returns per indicator.
Moreover, they also suggest that the methods they used in their research to evaluate the efficacy of
technical analysis, can be improved by using automated algorithms (which they used in their research)
and that traditional patterns such as the head-an-shoulders (= an other part of technical analysis that is
based on visual analysis of graphs), although sometimes effective, not need to be optimal. In particular
it may be possible in their opinion to determine optimal patterns for statistically detecting certain types
of phenomena (also called anomalies) in financial time series, for example, an optimal shape for
detecting stochastic volatility.13
This last part (detecting certain types of phenomena in financial time
series) is confirmed by the results of the statistical analysis, because when looking at the graphs of the
several indicators you can identify patterns. For example you can identify patterns of extreme
outcomes of the share price when looking at the graph of the Relative Strength Index.
To conclude: last 5 years AEX and the 3 funds all had to deal with economically hard times. Thiscaused the negative or small positive returns that I calculated based on the statistical analysis I
conducted. Despite these returns, when investors do not only use 1 indicator but instead use a variety
of indicators, then the various indicators show together that they can identify certain patterns and
phenomena’s in the development of the level of the AEX-index and the share prices of ING, Shell and
Unilever. With identifying these patterns and phenomena’s and keep on using a variety of indicators in
the future, investors who invest in the AEX-index should definitely be able to generate higher returns
when the European and the Dutch economy recovers.
13Lo, A.W., Mamayski, H., Wang, J. (2000). Foundations of technical analysis: computational algorithms,
statistical interference, and empirical implementation. The Journal of Finance, Vol. 55, p. 1705-1770
7/29/2019 The relevance of Technical Analysis; a Dutch approach
http://slidepdf.com/reader/full/the-relevance-of-technical-analysis-a-dutch-approach 24/25
THERELEVANCEOFTECHNICAL ANALYSIS,VRIJEUNIVERSITEIT AMSTERDAM
24
Conclusion
The statistical part of technical analysis consists of several types of statistical indicators. Depending on
the activity of the investor, technical analysis can be used in different ways and different degrees of complexity.
When looking at the development of share prices of ING, Shell and Unilever and the stand of the
AEX-index in the last five years, we have to conclude that they really felt the consequences of the
banking crisis and the European debt crisis. The Dutch financial markets were, in general, in a
downward trend. The overall returns, which are shown in §2.4, confirm this. When following all
indicators, an investor would have made negative returns of - €7,38 for ING, - €23,89 for the AEX-
index, and only a very small return for Shell of €0,05 per share. Only Unilever resulted in a significant
positive return of €3,98. All these returns reflect the development of the AEX-index and the shares of
ING, Shell and Unilever. This illustrates that it is very reasonable to assume that technical analysis
definitely has a certain amount of predictive power for the Dutch financial markets.
But then why are most of the calculated returns negative? The point here is that most of these negative
returns are mainly caused by the fact that most of the statistical indicators are lagging. This means that
buy signals are given when the share price has already moved a bit upwards and sell signals are given
when the share price has already moved a bit downwards. Because of this, investors already miss a
part of the profit they could have made. This disadvantage of these indicators led, in combination with
the economic bad times in the last five years, to the negative returns.
Does this show that technical analysis is irrelevant? No. We have to keep in mind that last five years
were bad years in Dutch economy and in the worldwide economy. Despite the struggling economy,
the graphs of the indicators and the calculation of the moments of the buy- and sell signals show that
these signals are most of the time correct. This means: after a buy signal there is indeed an increase in
the share price and after a sell signal there is most of the time indeed a decline in the share price. This
is confirmed by the empirical findings of Zhu and Zhou (2009), Neely, Rapach, Tu and Zhou (2013)
and Lo, Mamayski and Wang (2000). And despite the disappointing returns, statistical indicators are
still able to identify certain technical patterns that provide incremental information. This does not
necessarily imply that technical analysis can generate excess returns. But if an investor does not only
follow one indicator and instead uses a variety of indicators, then technical analysis could definitely
increase the possibility of adding value to an investment of the investor. This makes the use of
technical analysis for the AEX and in general the Dutch financial markets relevant, even in times of
economic crisis.
7/29/2019 The relevance of Technical Analysis; a Dutch approach
http://slidepdf.com/reader/full/the-relevance-of-technical-analysis-a-dutch-approach 25/25
THERELEVANCEOFTECHNICAL ANALYSIS,VRIJEUNIVERSITEIT AMSTERDAM
References
Appel, G. (2003). How to identify significant market turning points using the Moving Average Convergence
Divergence Inidicator or MACD. The Journal of Wealth Management, Vol. 6, p. 27-36
Blanchet-Scalliet, C., Diop, A., Gibson, R., Talay, D., Tanré, E. (2007). Technical Analysis compared to
mathematical models based methods under parameters mis-specification. Journal of Banking & Finance, Vol.
31, p. 1351-1373Bollinger, J. (2002). Using Bollinger Bands. Stocks & Commodities, Vol. 10:2, p. 47-51
Brock, W., Lakonishok, J., LeBaron, B. (1992). Simple technical trading rules and the stochastic properties of
stock returns. Journal of Finance, Vol. 47, p. 1731-1764
Chiarella, C., He, X., Hommes C. (2006). A dynamic analysis of moving average rules. Journal of Economic
Dynamics and Control, Vol. 30, p. 1729-1753
Detry, P., Gregoire, P. (2001). Other evidences of the predictive power of technical analysis: the moving average
rules on European indexes. University of Namur, Université Catholique de Louvain. Available at SSRN:
http://ssrn.com/abstract=269802
Friesen, G., Weller, P., Dunham, L. (2009). Price trends and patterns in Technical Analysis: A theoretical and
empirical examination. Journal of Banking & Finance, Vol. 33, p. 1089-1100 Geels, H. (2011). Beleggen met technische analyse. Delft, the Netherlands: Keyword Info System, p. 218-220
Geels, H. (2011). Beleggen met technische analyse. Delft, the Netherlands: Keyword Info System, p. 220-224
Gençay, R. (1998). The predictability of security returns with simple technical trading rules. Journal of Empirical Finance, Vol. 5, p. 347-359
Han, Y, Yang, K., Zhou, G. (2011). A new anomaly: the cross-sectional profitability of Technical Analysis.
Washington University of St. Louis, University of Colorado Denver and RGA Reinsurance Company. Available
at SSRN: http://ssrn.com/abstract=1656460, p. 1-8
Jegadeesh, N. (1990). Evidence of predictable behaviour of security returns. The Journal of Finance, Vol. 45, p.
881-898
Lo, A.W., Mamayski, H., Wang, J. (2000). Foundations of technical analysis: computational algorithms,
statistical interference, and empirical implementation. The Journal of Finance, Vol. 55, p. 1705-1770 Man-joe Leung, J., Tai-leung Chong, T. (2002). An empirical comparison of Moving Average Envelopes and
Bollinger Bands. The Chinese University of Hong Kong, p. 1-4
Menkhoff, L., Taylor, M. (2007). The obstinate passion of foreign exchange professionals: Technical Analysis.
Journal of Economic Literature, Vol. 45, No. 4., p. 936-972.
Murphy, J.J. (2008). Technical Analysis of the Financial Markets; a comprehensive guide to trading methods
and applications. New York, US: New York Institute of Finance, p. 49 Murphy, J.J. (2008). Technical Analysis of the Financial Markets; a comprehensive guide to trading methods
and applications. New York, US: New York Institute of Finance, p. 246-249
Neely, C.J., Rapach, D.E., Tu, J., Zhou, G. (2013). Forecasting the equity risk-premium; the role of technical
indicators. Federal Reserve Bank of St. Louis: Working paper series, p. 1- 26
Sullivan, R., Timmermann, A., White, H. (1999). Data snooping, technical trading rule performance, and the
bootstrap. The Journal of Finance, Vol. 54, No. 5, p. 1647-1691
Wong, W.K., Manzur, M., Chew, B.K. (2003). How regarding is Technical Analysis? Evidence from Singapore
Stock Market . Applied Financial Economics, p. 543-551
Zhu, Y., Zhou, G. (2009). Technical analysis: an asset allocation perspective on the use of moving averages.
Journal of Financial Economics, Elsevier, Vol. 92, p. 519-544
Appendix
The data and all the calculations of the returns per indicators for the AEX-index, ING, Royal Dutch
Shell and Unilever can be found in the attached digital Excel-documents. Each of those 4 documents
consists of:
• Worksheet 1: the data, the calculations of buy- and sell signals and returns
• Worksheets 2 – 7: graphs of all statistical indicators
• Worksheet 8: overview of the calculated return for the particular investment possibility (AEX-
index, ING, Royal Dutch Shell or Unilever