the renewable energy zones transmission planning process · the renewable energy zones transmission...
TRANSCRIPT

The Renewable Energy Zones Transmission Planning Process
Nathan Lee
National Renewable Energy Laboratory
5 June 2017

Agenda and learning objectives
1. What is the Renewable Energy Zones (REZ) Transmission
Planning process?
– Understand how the REZ process is different from traditional transmission
planning
– Understand the value of the REZ process to a power system
2. Steps for Implementing the REZ process
– Understand the real-world process for moving from planning to construction
3. Case Study: Texas Competitive Renewable Energy Zones (CREZ)
– Identify key lessons learned from successful REZ process implementation
4. Renewable Energy Data Explorer
– Tool that that can inform the REZ process
5. Questions and Discussion

1. WHAT IS THE RENEWABLE ENERGY
ZONES (REZ) TRANSMISSION
PLANNING PROCESS?

Example of a traditional approach: Cost-based
transmission expansion
Future demand is forecasted
Transmission company develops a plan for transmission upgrades and expansion
Expansion plan submitted to regulatory authority
Regulator reviews plan and decides what will be built or upgraded
Transmission company builds new facilities and recovers costs through network charges

Traditional approach: Implications for wind and solar
Timescale misalignment
Approximate Planning and construction time [years]
10-20 years
0 10 20
2-3 years
5-10 years
Image source: NREL PIX 19499
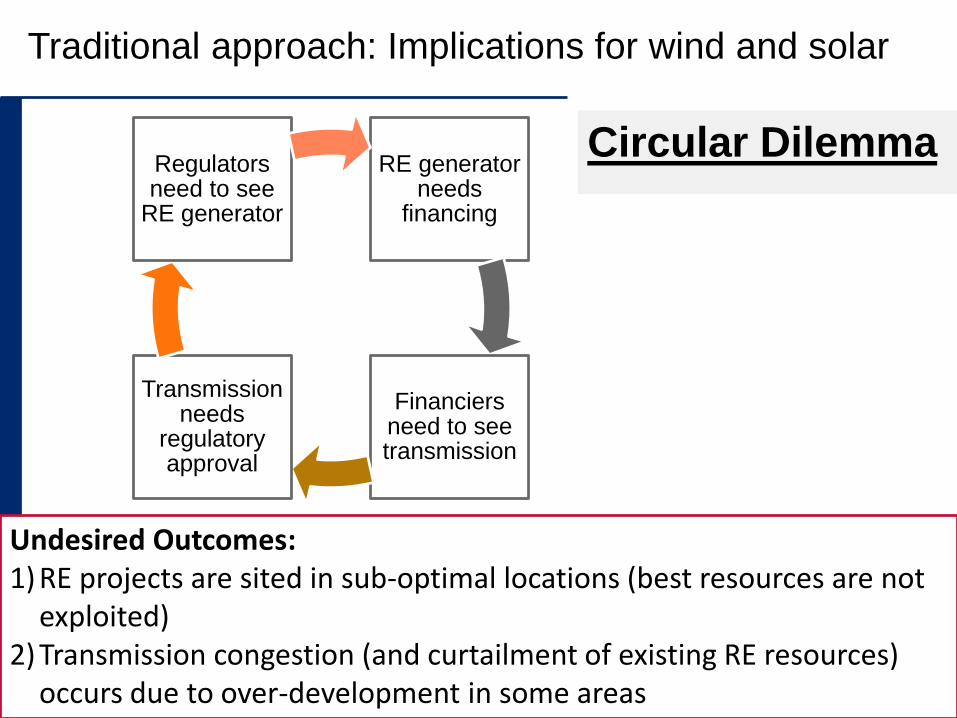
Undesired Outcomes:1) RE projects are sited in sub-optimal locations (best resources are not
exploited)2) Transmission congestion (and curtailment of existing RE resources)
occurs due to over-development in some areas
Traditional approach: Implications for wind and solar
RE generator needs
financing
Financiers need to see transmission
Transmission needs
regulatory approval
Regulators need to see
RE generator
Circular Dilemma

7
A different approach: Transmission planning to
enable clean energy
RE development follows transmission—so, why not direct transmission development and upgrades to the best RE resources (high capacity factor) areas?
o High capacity factors mean high utilization of transmission assets.
o RE projects with high capacity factors have lower cost per MWh.
o Most MWh for the amount of capital invested, for both generation and transmission.
7
Image source: NREL PIX 19499

8
The Renewable Energy Zone (REZ) process
A renewable energy zone (REZ) is a geographic area characterized by high-quality, abundant RE resources, suitable topography, and strong developer interest.
The REZ transmission planning process customizes transmission planning and approval for renewables.
Source: Hurlbut, D., Chernyakhovskiy, I., Cochran, J. (2016). Renewable Energy Zones: Delivering Clean Power to Meet Demand. NREL/FS-6A20-65988. 8

2. STEPS FOR IMPLEMENTING THE
REZ PROCESS

REZ process steps
Candidate Zones Assessment
Transmission Scenario Development
Final Transmission Plan Designation
Renewable Energy Assessment
Summary: Select areas with highest potentialOutput: Study Areas map and supply curves
Summary: Identify zones with highest probability of developmentOutput: Candidate Zone map and supply curves
Summary: Bundle candidate zones and conduct scenario analysesOutput: Costs, benefits, and operational impacts of each transmission scenario
Summary: Select transmission scenario according to pre-set criteriaOutput: Final transmission order
Transmission Enhancement
Program Design & Vision Statement

Step 1: Program design and vision statement
• What entities are authorized to conduct transmission
planning and development?
• Are there regulatory or institutional barriers?
Is REZ applicable?
• Are there well-concentrated RE
resources?
• Is there demand for RE development?
• Are RE projects bankable? Do
incentives align with REZ development
goals?
Who will lead the REZ process?

Step 2: Renewable energy assessment
Understanding the difference
between where you could
implement RE and where you
actually can implement RE
Understand the difference
between locations with high RE
resource and locations where an
RE technology actually can be
implemented
Source: NREL
Resources for
concentrating solar
power (CSP) for
the Southwestern
United States
of study areas
and exclusions

Step 3: Candidate zones assessment
• Input: Renewable energy
screening to clearly identify areas
for consideration
• Output: Prioritize areas based on
highest developer interest
Demonstrations of
Commitment: existing/pending
projects, lease agreements,
letters of credit, etc.
Areas with low commercial
interest are dropped from
consideration
• Final Results:
Designate areas for REZ
Generate stakeholder buy-in
and commercial interest

Step 4: Transmission scenario development
Main analytical questions:
• What is the best transmission plan for interconnecting the
zones?
• Network plan or high-voltage trunk lines?
• What additional actions are needed to maintain reliability
(e.g., ancillary services, contingency studies)?
Ultimate objective: identify “no regrets” options for
transmission expansion that are robust across several
scenarios, e.g.,
• Accelerated carbon reduction
• High/low natural gas prices
• Accelerated distributed generation and demand response

Steps 5 - 6: Designate zones, approve transmission plan
and enhance transmission system
Assuming each step is sufficiently
completed:
Zones are the best and most developable
areas, with demonstrated commercial
interest
Grid impacts are modeled and reasonably
known
Regulators have information necessary to
select and approve a transmission plan
Cost recovery authorized, construction
begins
Renewable energy is delivered at the
lowest possible cost

3. CASE STUDY: TEXAS CREZ

Context: Restructuring of the Texas power market
• Wholesale power market had been reformed and
restructured, with market opening in 2001
• Transmission ownership
separated from generation
ownership• Transmission owners were
financially indifferent to which
generators used their systems.
• Transmission remained
regulated• State decided cost recovery
based on whether new lines
were needed
• All transmission costs
socialized across all load
• Open access transmission
(Wind resource estimates developed by AWS
Truepower, LLC for windNavigator)

Wind responded — But too much
• First wave of wind power development was in West Texas
o 760 MW of installed wind power by 2002
o Only 400 MW of total transmission capability
• Operator-ordered curtailments degraded wind’s effective annual capacity factor
• Limited financial attractiveness for further wind development
Local line
congestion
Path congestion to
major load centers
Pre-CREZ
wind farms
in 2005
(sized by
MW capacity)
(GtG 2015)

19
Texas CREZ philosophy: Harnessing the power of
competition
Competitive market decides who actually builds wind projects
The raw potential of the wind resource exceeds the capacity of the new line
Transmission plan directs developer interest to the largest geographic concentrations of high-quality
wind resources with low investment risks
How does a system get to a transmission plan that drives competitive RE development?
19

20
Transmission planning with CREZ
Texas wind resource Study zones designated by system operator based on RE screening
Areas with 4,000 MW of potential
each, screened to identify 25 with
the highest productive potential.
First step: identify zones with a high concentration of high quality, easily developed RE potential. 20

21
Transmission planning with CREZ
Zones designated by regulators as REZs based on developer input
The transmission system was expanded to access these zones
Wind developers demonstrated financial interest only in certain zones.
2,400 line miles$7 billion (costs rolled into rate base)>18 GW wind interconnected
21

22
Did it work?: Improved capacity factors as a result of
CREZ
Zone
Year
sampled
Average
capacity factor
Old turbines(on line 2001-2002)
McCamey2003 26%
2014 30%
Conclusion: Older wind turbines performed better because of reduced
transmission congestion and less curtailment
New turbines(on line 2007-2013)
McCamey2014
35%
Panhandle 45%
Conclusion: New transmission opened up more productive wind areas
22
Source: Hurlbut, D. and Getman, D. (2015). “Greening the Grid: Implementing Renewable Energy Zones for Integrated Transmission and Generation Planning.” Webinar, December 1, 2015. http://greeningthegrid.org/trainings-1/webinars/gtg-implementing-renewable-energy-zones-integrated-transmission-generation-planning.

*12 months ending August 2015
Did it work?: Wind share of generation in Texas
34%
52%
12%
0% 2%
Coal Natural gas
Nuclear Wind
Other
34%
44%
11%
10%
1%
Coal Natural gas
Nuclear Wind
Other
2001 2015*

Applicability of CREZ model elsewhere
• Development follows transmission
– Intent of CREZ was to geographically direct new
development to where cost per MWh would be lowest
• Authority to order new transmission
construction comes before zone designation
– When analysis begins, question is “where” not
“whether”
– Analysis without authority is advisory
• REZ focus is on renewable technologies that
are already competitive

4. RENEWABLE ENERGY DATA EXPLORER

What is the RE Data Explorer (RED-E)?• No-cost, web-based tool for
energy resource exploration and decision-making
• Platform for exploring energy resource and other base and infrastructure data visually, and with targeted quantitative geospatial analysis functionality
• Tool that wraps complex spatial analysis techniques in an easy-to-use interface targeted at non-specialists
• Platform for distributing publicly available GIS data (many layers are downloadable)
Online at http://re-explorer.org26

THANK YOU!
Nathan Lee
NREL
Find out more at Greening the Grid
www. greeningthegrid.org