the report of her majesty’s chief inspector of education ... · hmci’s foreword this is...
TRANSCRIPT
Social care
The report of Her Majesty’s Chief Inspector of Education, Children’s Services and Skills 2016


Contents
HMCI’s foreword 5
Children’s social care in local authorities 11
Helping and protecting children 25
Experiences and progress of children looked after 36
Inspection and the future 59
Annex: Key statistics 61
Bibliography 65
1www.gov.uk/ofsted

Foster placements
Placed for adoption
Placement with parents
Living independently
Secure units
Children’s home
Other residential settings
Residential schools
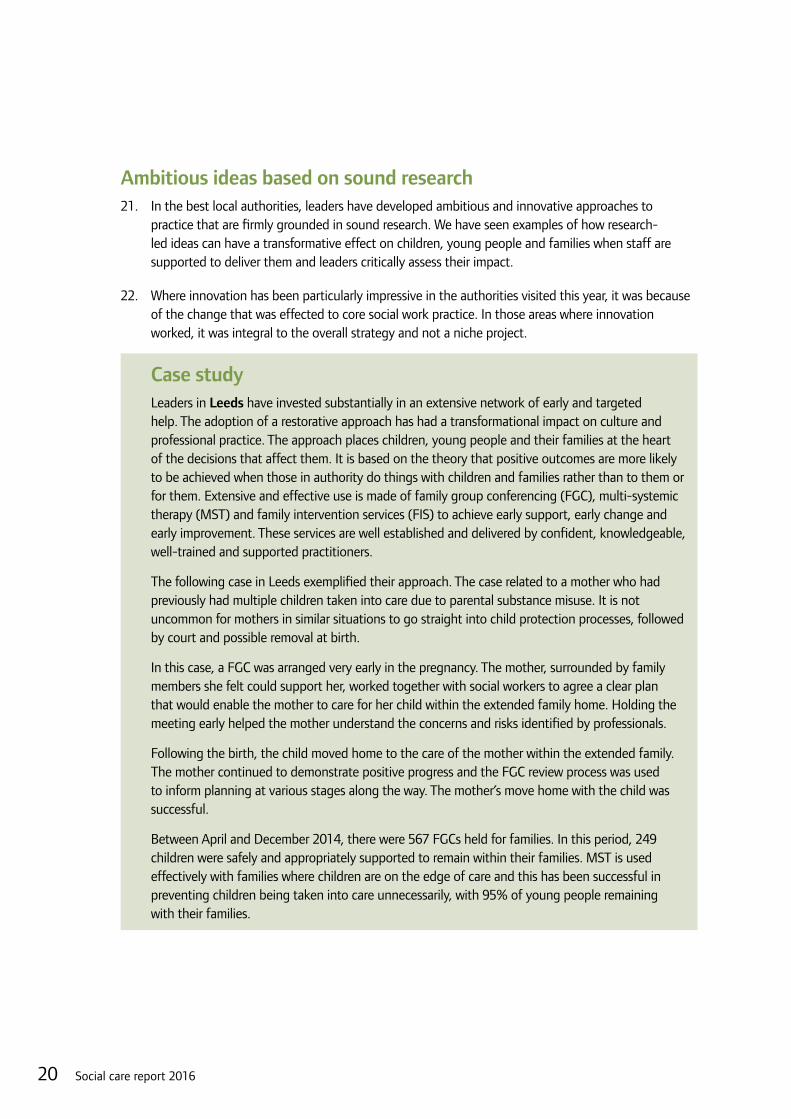
Other placement
50,000 children on child protection plans, of which; 5,000 have statements of SEN or education, health and care plans (EHC plans)i
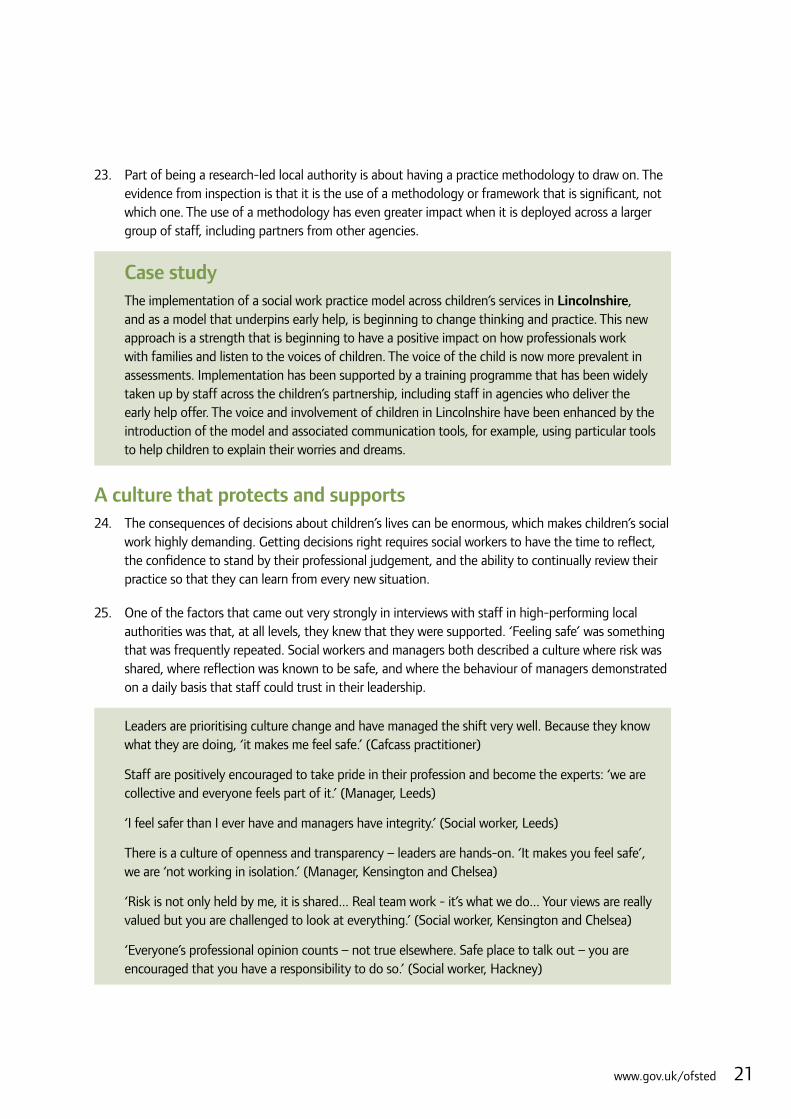
11.5 million children aged 0-17 in England. Of these children:
26,000 care leavers aged 19 to 21
Placements of children looked afteras at 31 March 2015
320,000children in need
of services to achieve or maintain a reasonable level
of health or development
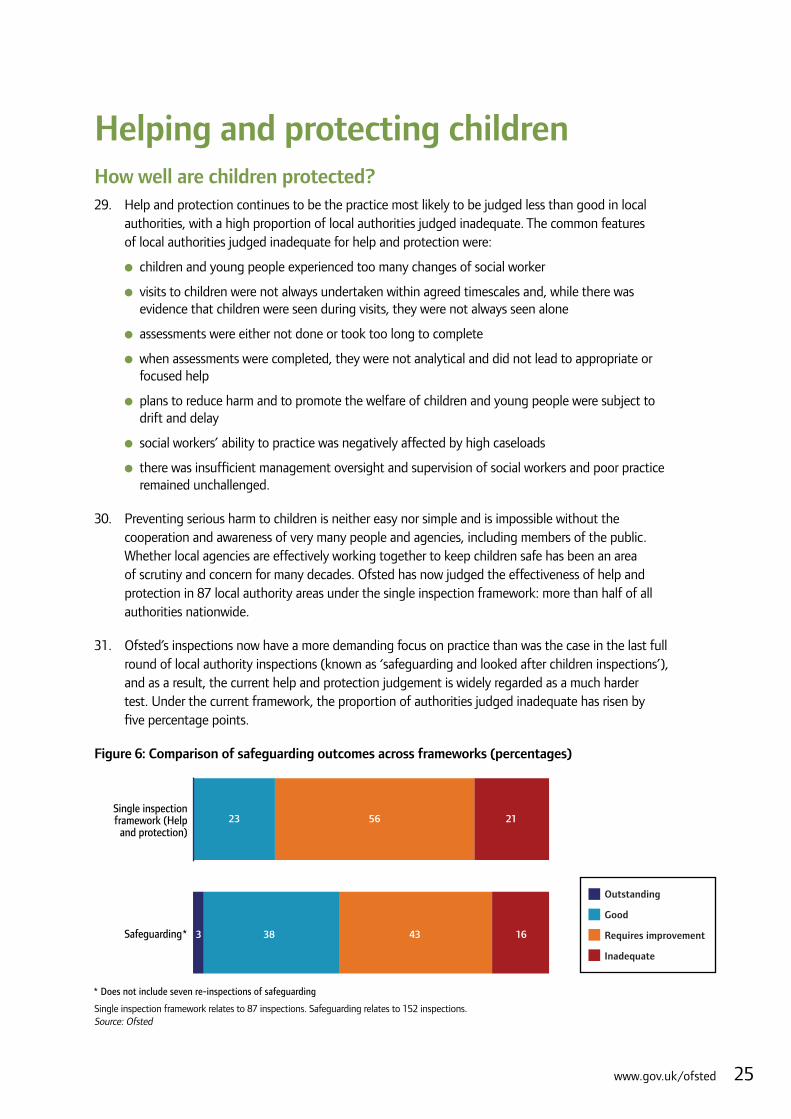
240,000children with an education
health and care plan(or statement of SEN)ii.
All disabled children areconsidered children in need.
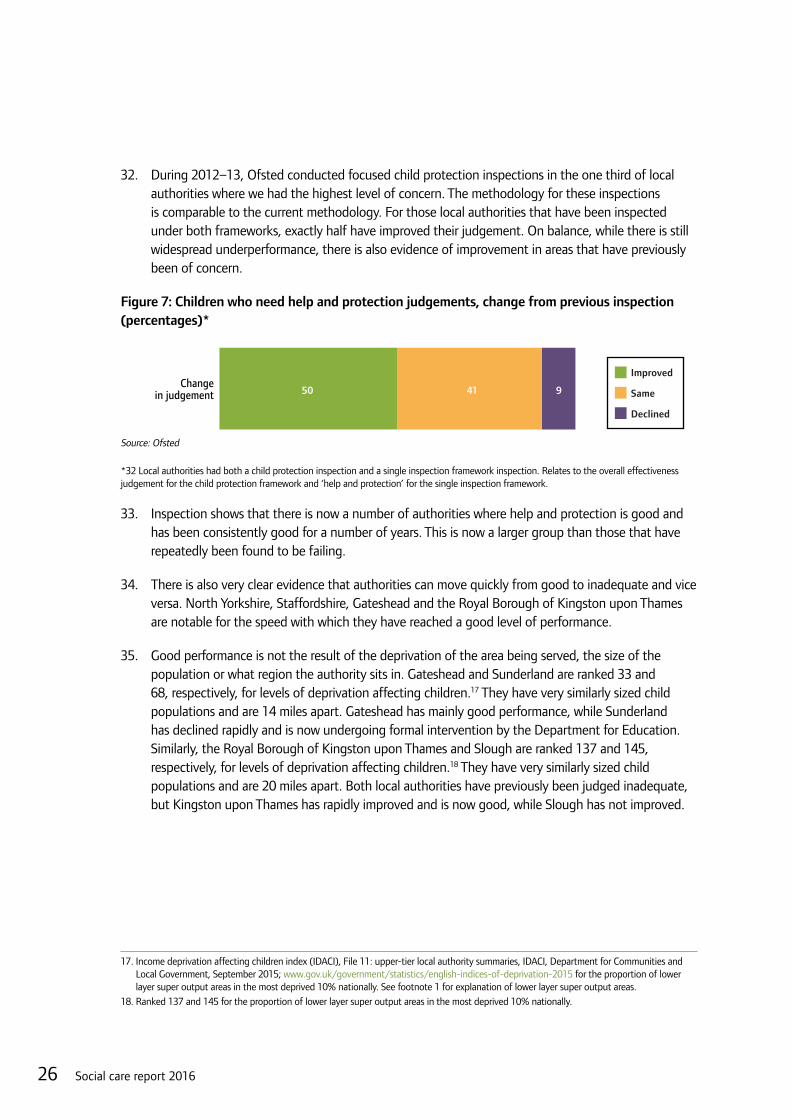
35,000 children assessed as bothchildren in need and children withan education health and care planiii
70,000 children looked afteriv, of which;10,000 have statements of SEN or education, health and care plans (EHC plans)v
Figure 1: Children and young people in England and the social care system
i Figure is an estimate as data is not available. Calculated using the same proportion as children in need.ii Figures for all children cover children in all schools (including independent schools and non-maintained special schools). This figure excludes
children in need, children on child protection plans and children looked after who have statements of SEN or education, health and care plans (EHC plans).
iii Excludes children in need who are also looked after. Only children who have been matched to the 2015 school census have been included.iv For the purposes of this chart, children looked after have not been included in the children in need cohort. These two cohorts receive services
under different sections of the legislation. v Children looked after continuously for at least 12 months as at 31 March 2015, excluding those children in respite care. Only children who have
been matched to 2015 school census data and aged four or above (at 31 March 2015) have been included.Annual Mid-year Population Estimates: 2014, Office for National Statistics; www.ons.gov.uk/peoplepopulationandcommunity/populationandmigration/populationestimates/bulletins/ annualmidyearpopulationestimates/2015-06-25 Outcomes for children looked after by LAs: 31 March 2015, Main tables: SFR11/2016, Tables 4a and 4b, Department for Education, March 2016; www.gov.uk/government/statistics/outcomes-for-children-looked-after-by-las-31-march-2015 Characteristics of children in need: 2014 to 2015, Main tables: SFR41/2015, Tab A1 & Tab A2, Department for Education, October 2015; www.gov.uk/government/statistics/characteristics-of-children-in-need-2014-to-2015 Children looked after in England including adoption: 2014 to 2015, National tables: SFR34/2015, Tab A1 & F1, Department for Education, October 2015; www.gov.uk/government/statistics/children-looked-after-in-england-including-adoption-2014-to-2015 Source: Ofsted
2 Social care report 2016
Ado
ptio
nO
ther
36Adoption
support agencies
27inspections
37Residential
family centres
23inspections
42Voluntary
adoption agencies
27inspections
11Holiday schemes for
disabled children
8inspections
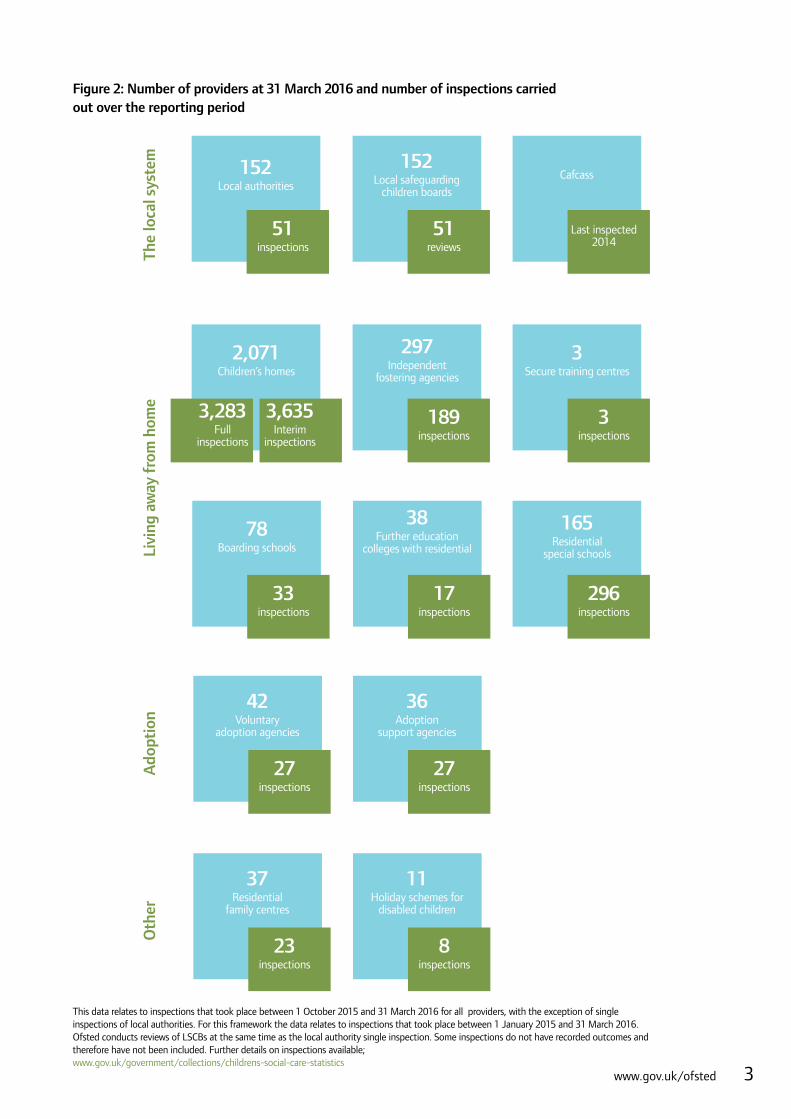
Figure 2: Number of providers at 31 March 2016 and number of inspections carried out over the reporting period
This data relates to inspections that took place between 1 October 2015 and 31 March 2016 for all providers, with the exception of single inspections of local authorities. For this framework the data relates to inspections that took place between 1 January 2015 and 31 March 2016. Ofsted conducts reviews of LSCBs at the same time as the local authority single inspection. Some inspections do not have recorded outcomes and therefore have not been included. Further details on inspections available; www.gov.uk/government/collections/childrens-social-care-statistics
The
loca
l sys
tem
Cafcass
Last inspected 2014
152Local safeguarding
children boards
51reviews
Livi
ng a
way
fro
m h
ome
33inspections
78Boarding schools
297Independent
fostering agencies
189inspections
3inspections
3Secure training centres
296inspections
165Residential
special schools
17inspections
38Further education
colleges with residential
152Local authorities
51inspections
2,071Children’s homes
3,635Interim
inspections
3,283Full
inspections
3www.gov.uk/ofsted

4 Social care report 2016

HMCI’s forewordThis is Ofsted’s third dedicated annual report on the state of children’s social care in England. The children who come to the attention of social care are the most vulnerable in our society. They deserve the highest standards, and yet there is still too much provision that is inadequate. Children’s needs must be assessed properly, and help when needed must be swift. When this does not happen, children are left exposed to harm. This report shows, however, that these children can be well served. When local authorities do this work well, children benefit from the help that is given.
By the end of March this year, a quarter of local authorities had been judged inadequate. Most of those authorities were inadequate for help and protection, the part of the system that assesses what the risks to children are and takes the action that is necessary. This remains one of the greatest challenges and one of the hardest things to get right. Where there are weaknesses in management oversight and high caseloads that lead to poor decision making or little work with families, children suffer.
However, these weaknesses can be overcome through grit and determination and with good leaders, who make the work easier to do well. Our inspectors have seen this across the country and we now know that:
●● inadequacy is not a function of size, deprivation or funding, but of the quality of leadership and management; change can happen where leaders are effective
●● there are many outstanding and dedicated professionals working with children; in strong authorities, they make a huge difference to children’s lives
●● once children are in the care system, they are often well cared for: it is children who have not entered the system because their needs have not been recognised, or whose support has been too superficial and ineffective, who need our attention.
Change can and should happen, regardless of contextWe have set high expectations with our single inspection framework for local authority children’s services and for the inspection and regulation of providers such as children’s homes. For the first time, we have seen outstanding provision in local authorities. There is also much provision that is good.
There will be those who say that areas that are failing are held back by their circumstances: they are too big or too deprived or have too little funding. Our inspections to date show that size is not an obstacle: Birmingham has consistently failed to improve, but Essex now provides good help and protection.
Neither is deprivation a cause of failure. We have analysed the relationship between the poverty in different areas and the inspection outcomes for those areas and there is no significant correlation between the two. Take two local authorities with similar contexts, the Royal Borough of Kingston upon Thames and Slough, which are both in the top 20 areas for low levels of deprivation, with almost the same number of children, only 20 miles apart. Both were found to be inadequate in 2011–12. Kingston is now one of the highest performing areas in the country while Slough is still failing.
Finally, failure is not because of lesser or greater funding; it’s about how local authorities use their funding. Some of the highest spending local authorities were also the weakest. Knowing what services to invest in is essential. In times of financial austerity, it is even more important to spend wisely.
5www.gov.uk/ofsted
The driving factor that makes change happen at a necessary pace is leadership, something I have said many times before. We have seen good leadership and management transform work with children, making sure children do not wait for help and support, ensuring that social workers have enough time to work with families, and knowing what skills and qualities the workforce needs to do the job really well.
I have commented before on the importance of local political leaders in tackling educational underperformance. Local political leadership is just as important, if not more so, in children’s social care. In the best-performing local authorities, we have seen local political leaders who have prioritised children’s services; provided a high level of support and scrutiny to senior managers and social workers; demonstrated the highest levels of ambition for children and young people in their area; and shown a willingness to take difficult decisions.
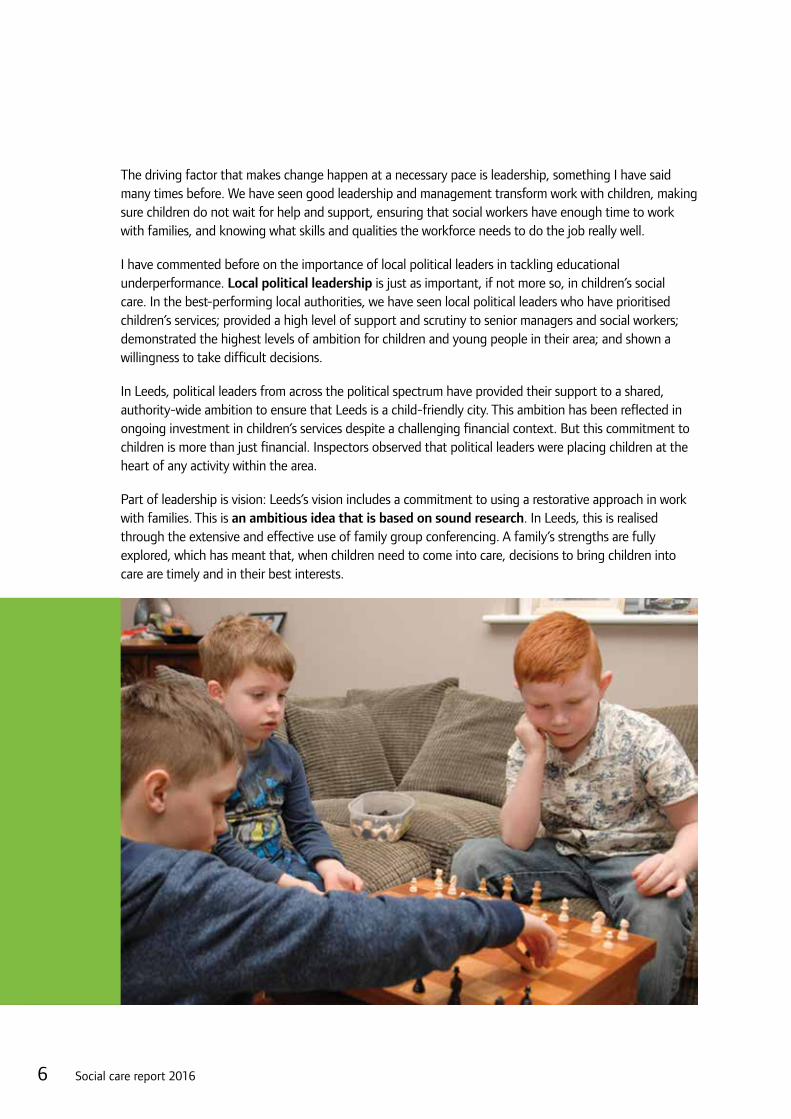
In Leeds, political leaders from across the political spectrum have provided their support to a shared, authority-wide ambition to ensure that Leeds is a child-friendly city. This ambition has been reflected in ongoing investment in children’s services despite a challenging financial context. But this commitment to children is more than just financial. Inspectors observed that political leaders were placing children at the heart of any activity within the area.
Part of leadership is vision: Leeds’s vision includes a commitment to using a restorative approach in work with families. This is an ambitious idea that is based on sound research. In Leeds, this is realised through the extensive and effective use of family group conferencing. A family’s strengths are fully explored, which has meant that, when children need to come into care, decisions to bring children into care are timely and in their best interests.
6 Social care report 2016
Good leadership is practical as well as visionary and so to do social care well, you need practice leaders who know what good practice looks like, both in principle and on the frontline.1 Practice leaders are experts in their field and use this knowledge and their strong relationships with social workers to strengthen practice. They set the tone from the top that others adopt and follow. ‘Practice weeks’ have been introduced in the tri-borough area of Westminster, Hammersmith and Fulham, and the Royal Borough of Kensington and Chelsea. Leaders spend a week discussing cases with social workers and observing practice. As a result, leaders know what is being done well on the frontline and what could improve.
Social workers also need enough time to devote to each child in their caseload. It is not surprising that where local authorities are providing a high standard of care and support, social workers have manageable workloads. The variation between local authorities in the numbers of children in need per children’s social worker is very wide, with a range of seven to 34.2 This year, we have found 14 local authorities where social workers’ caseloads were too high.
Leaders and managers must look after the people who look after childrenSocial work is an admirable profession, and there are outstanding individuals in every local authority area who are doing excellent work. However, too many individual social workers are pressing on in conditions that are unacceptable.
Social workers deal with complex, high-risk situations. It takes professionalism and expertise to make tough decisions and stand by them. A good social worker has to bear the weight of responsibility for both what they do, and what they decide not to do.
Social work demands a great deal from each individual social worker, but being responsible does not mean being alone. Owning a tough decision does not mean being forced to take that decision without a team around you. When social workers work for good leaders and managers, they work in an environment where they are fully supported. Because of the way that leaders and managers behave, staff feel confident. A culture of openness and transparency means that social workers feel more responsible, as well as more able to reflect.
Social workers need time to spend with the children and families on their case list. They need a place of work that makes it possible for them to exercise their profession at the highest level. They need managers who trust and challenge them in equal measure.
Equally, working in a children’s home or taking on the responsibility for being a parent or carer to a child who has had a traumatic start in life is an enormous role that deserves recognition. Yet, too often, we have seen these individuals not receiving all the support that they need or even basic information about the needs of the child. Without these fundamentals, they do not have the tools to ensure the child reaches their potential. Forty per cent of foster carers said they did not get the chance to find out important things about the child who was coming to live with them before they arrived.
1. ‘Practice leadership’ is not about a specific job role but describes a set of attributes that individuals can hold. It is the oversight of direct work with children and families by senior leaders. Practice leaders are those who have the day-to-day operational responsibility for all social work practice with families. They create the right environment for excellent practice and developing excellent practitioners.
2. Children’s social work workforce 2015, Main tables: SFR07/2016, Table 2, Department for Education, February 2016; www.gov.uk/government/statistics/childrens-social-work-workforce-2015.
7www.gov.uk/ofsted

In children’s homes, there was a very similar message: staff need the skills to deal with the particular needs of the children in their care. Better training opportunities and taking steps to keep the staff who have these skills would mean that children were better served.
Care can be good for childrenEverything we think and say about children’s social care has to be rooted in what is good for children, which is why it is important to ask a very basic question: do we damage children’s prospects of a full and successful life by placing them in care? It is likely that there are many who believe that we do.
It is right to be concerned about the high proportions of children looked after who do not gain five GCSEs at grades A* to C, including English and mathematics; who are not in education, employment or training as young adults; or whose emotional and mental health is not as it should be. Some of the children who do not reach good outcomes at first do so in the end, but in their own time. We should still be determined to see them do better in their lives than other children in similar positions have done in the past.
However, concern for their life chances should not be confused with thinking that care is the cause. These are children whose childhoods have not been like most other children’s. Some children live in families where there is violence, alcohol or drug abuse or unmanaged mental illness. It tells us little to only compare this group of children with children whose lives have been happy and secure. A better question to ask is whether those children who are looked after do well, or less well, than other children with difficult family circumstances. Children still living with their families that are supported by social workers can be compared with children looked after and when we do that comparison, we find that it is children looked after who make stronger progress educationally.3
The help and support given to children looked after by the people nearest them make a difference. Regardless of whether this is a foster family or a team in a children’s home, these children receive individual care, often of the highest order. Many foster carers do impressive things for the confidence and wellbeing of the children they welcome into their homes.
We are now confident that four out of five children’s homes do well for children and that this reflects what really matters for children. We inspect every home in the country annually and the proportion of good and outstanding children’s homes is now higher than the proportion of good and outstanding secondary schools.
While there are many local authorities that are inadequate for help and protection, the support that they give to children looked after is better. The majority of local authorities deliver either good or outstanding adoption services, and this reflects a pattern that has been established for many years.
No one would dispute the importance of a loving family for a child. However, there are times when it is not in the best interests of a child to live at home. In these circumstances, a high-quality and stable care placement, arising from an appropriate and timely decision about when a child becomes looked after, can be the best thing to happen to a child.
3. ‘Educational progress of looked after children’, The Rees Centre, 2015; http://reescentre.education.ox.ac.uk/research/educational-progress-of-looked-after-children.
8 Social care report 2016

We have reported on care leavers for the first time. Work with care leavers demands more focus and improvement. The evidence suggests that local authorities are not always sticking with care leavers for long enough to ensure that they find their place in the world. The support for them is too variable. Often, it lacks a tenacious, ambitious approach to support them to grow up, leave home, and find rewarding work and further education.
Social care professionals should be proud of the quality of care that so many children looked after now experience. The next challenge will be to make sure that those who sit on the boundaries of care, either because they need help and protection or because they are leaving care for adulthood, are as well served.
9www.gov.uk/ofsted

10 Social care report 2016

Children’s social care in local authoritiesContext1. The number of children who local authority children’s social care services work with continues to
grow for two main reasons.
2. First, there are more children in the population. As with all other services for children, including schools and children’s health provision, the demand for children’s social care services reflects a rise in the number of children. Between 2010 and 2014, the 0 to 17 population in England grew by around 550,000, an increase of 4.9%.4
3. Second, a higher proportion of children are becoming looked after or being placed on a child protection plan. The rate of children looked after has increased from 57 per 10,000 in 20105 to 60 per 10,000 in 2015.6 The proportion of children on child protection plans has gone up even more steeply, from 35 per 10,000 to 43 over the same time period.7 The prevalence of need has not risen: the number of children in need as a proportion of the total child population was roughly constant at the end of each of the last six years.8
4. Referrals to children’s social services from the public undergo peaks and troughs, often in response to tragic events that have drawn attention to risks to children. The referral rate was comparatively low in 2012–13, but rose sharply to a new high in 2013–14. This year, it is back to a level similar to past years.9 The number of referrals a local authority receives will vary depending on its size, ranging from two to over 1,600 per month.10 Two thirds of authorities receive between 100 and 500 referrals on average per month. The number of referrals received is within the context of many more people contacting the local authority for support, advice or queries about children’s well-being. For example, a local authority receiving 200 referrals each month may receive 1,000 contacts that do not lead to referrals. Each time a local authority is contacted, it will need to respond in some way, even if it is just to signpost the caller to other services.
5. Over the same period, local authority budgets have come under intense pressure, and as a result, some of the non-statutory services for children have reduced considerably. Over the spending review period, against the baseline in 2010–11, local authority spending on children’s centres and early years reduced by 38% or £538 million.11 Spending on youth services reduced by 53%, or £623 million.12, 13
4. Annual mid-year population estimates: 2010 to 2014, Office for National Statistics; www.ons.gov.uk/peoplepopulationandcommunity/populationandmigration/populationestimates/datasets/populationestimatesanalysistool.
5. Children looked after in England including adoption: 2013 to 2014, National tables: SFR36/2014, Tab A1, Department for Education, September 2014; www.gov.uk/government/statistics/children-looked-after-in-england-including-adoption--2.
6. Children looked after in England including adoption: 2014 to 2015, National tables: SFR34/2015, Tab A2, Department for Education, October 2015; www.gov.uk/government/statistics/children-looked-after-in-england-including-adoption-2014-to-2015.
7. Characteristics of children in need: 2013 to 2014, Main tables: SFR43/2014, Tab A2, Department for Education, October 2014; www.gov.uk/government/statistics/characteristics-of-children-in-need-2013-to-2014.
8. Characteristics of children in need: 2014 to 2015, Main tables: SFR41/2015, Tab A1, Department for Education, October 2015; www.gov.uk/government/statistics/characteristics-of-children-in-need-2014-to-2015.
9. Ibid.10. Ibid.11. Local authority interactive tool (LAIT), Department for Education, 10 May 2016; www.gov.uk/government/publications/local-authority-
interactive-tool-lait.12. LA and school expenditure: 2014 to 2015 financial year, December 2015, Department for Education; www.gov.uk/government/statistics/
schools-education-and-childrens-services-spending-2014-to-2015.13. LA and school expenditure: 2010 to 2011 financial year, January 2012, Department for Education; www.gov.uk/government/statistics/local-
authority-and-school-expenditure-on-education-childrens-services-and-social-care-2010-to-2011.
11www.gov.uk/ofsted
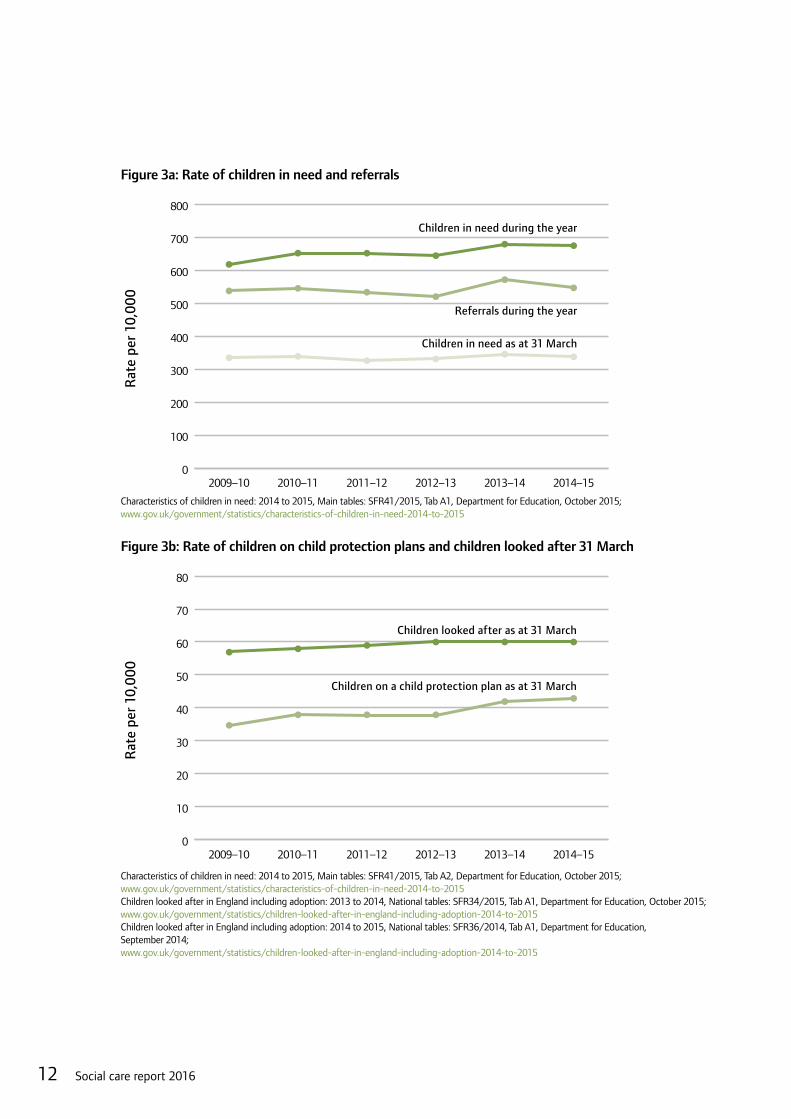
Figure 3a: Rate of children in need and referrals
0
100
200
300
400
500
600
700
800
2014–152013–142012–132011–122010–112009–10
Children in need duringthe year
Referrals during the year
Children in need 31 March
Children in need during the year
Referrals during the year
Children in need as at 31 March
Rat
e pe
r 10
,000
Characteristics of children in need: 2014 to 2015, Main tables: SFR41/2015, Tab A1, Department for Education, October 2015;www.gov.uk/government/statistics/characteristics-of-children-in-need-2014-to-2015
Figure 3b: Rate of children on child protection plans and children looked after 31 March
0
10
20
30
40
50
60
70
80
2014–152013–142012–132011–122010–112009–10
Non-Looked after children
Looked after children
Children in need
Children looked after as at 31 March
Children on a child protection plan as at 31 March
Rat
e pe
r 10
,000
Characteristics of children in need: 2014 to 2015, Main tables: SFR41/2015, Tab A2, Department for Education, October 2015; www.gov.uk/government/statistics/characteristics-of-children-in-need-2014-to-2015 Children looked after in England including adoption: 2013 to 2014, National tables: SFR34/2015, Tab A1, Department for Education, October 2015; www.gov.uk/government/statistics/children-looked-after-in-england-including-adoption-2014-to-2015 Children looked after in England including adoption: 2014 to 2015, National tables: SFR36/2014, Tab A1, Department for Education, September 2014; www.gov.uk/government/statistics/children-looked-after-in-england-including-adoption-2014-to-2015
12 Social care report 2016
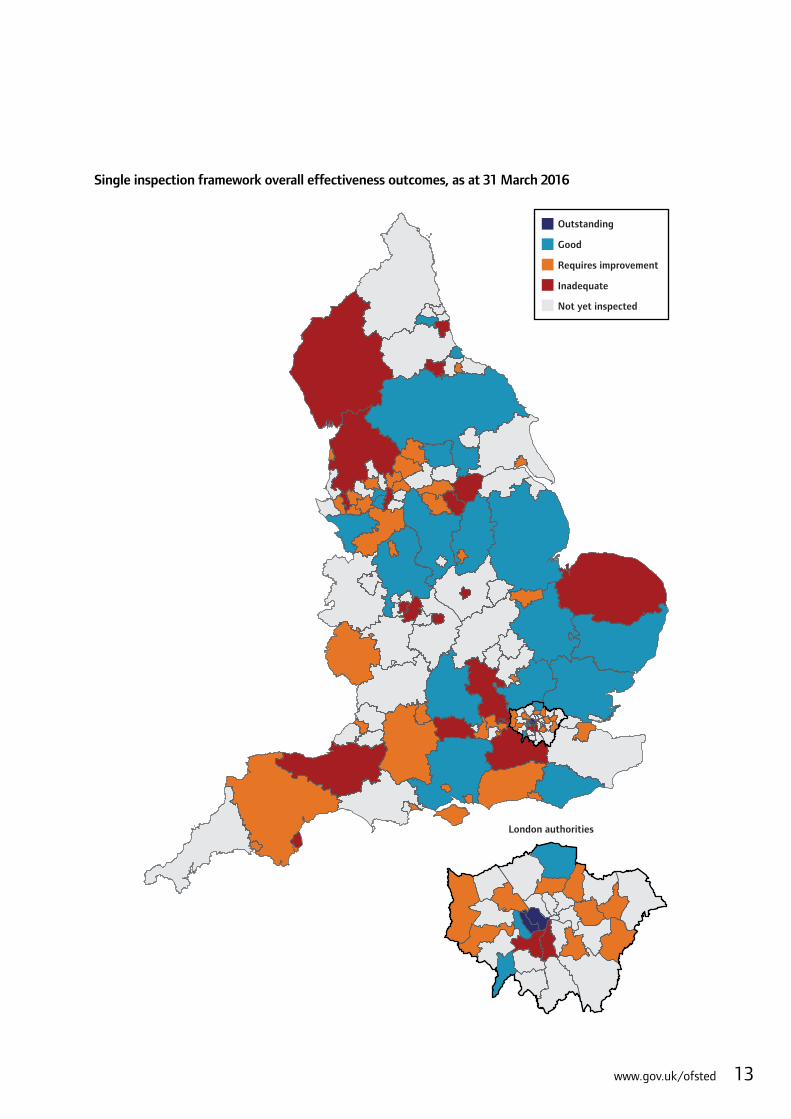
Single inspection framework overall effectiveness outcomes, as at 31 March 2016
Inadequate
Requires improvement
Good
Outstanding
Not yet inspected
London authorities
13www.gov.uk/ofsted
Our findings from inspection6. We have now inspected 57% of local authorities for their services for children in need of help and
protection, children looked after and care leavers under the single inspection framework.14
7. Our inspections this year show that, regardless of context, providing outstanding services is possible and that good is a standard that any local authority can achieve and maintain. In the Royal Borough of Kensington and Chelsea and in Westminster, leaders have demonstrated the substantial difference children’s social care services can make to the lives of children and young people. It is also possible for local authorities to get to good from a very low base. The Royal Borough of Kingston upon Thames was found to be inadequate for its help and protection of children as recently as July 2013. In 2015, it was judged good overall.
8. Our inspection of local authorities is demanding. Ofsted’s inspection framework makes clear that the identification of widespread or serious failure in the help, protection or care for children and young people always results in a judgement of inadequate and in 21 of 87 authorities we have inspected, we have found this to be the case. The number of local authorities with a judgement of inadequate should be of ongoing concern.
9. Twenty-three of 87 local authorities have been judged to be delivering good or outstanding services for children and young people. A much larger group of local authorities were judged to require improvement to be good (43 of 87). It should be understood that none of these local authorities was judged to be failing. These are local authorities that are not yet good because of the variability of their work with children and families. The key challenge for local authorities is to provide consistently effective core social work practice throughout the child’s journey. Twenty-five of the 43 local authorities were judged to be good in at least one aspect of their provision: most commonly this reflected the high quality of their adoption services.
10. The pattern of inspection outcomes suggests that it is not necessarily either greater affluence in the local area or a higher financial settlement for the local authority that drives performance. There is no significant correlation between the level of deprivation in a local authority and the inspection outcome.15
11. Higher performing local authorities spend their money more effectively, investing wisely in the best services and bringing costs down. The evidence from inspection suggests that investment in early help is associated with stronger outcomes for children. Local authorities that were effective in their investment strategies had clear systems in place to assess the impact of every initiative. Leaders in these local authorities made decisions to invest in, and reduce spending on, programmes based on what was shown to work. Because investment was linked to better outcomes, the more costly problems were prevented, freeing up resources for further investment. Some of the local authorities judged inadequate this year were among the highest spending.
14. The inspections of local authority services for children in need of help and protection, children looked after and care leavers began in November 2013. They are referred to as the ‘single inspection framework’ throughout this annual report.
15. The correlation between deprivation of a local areas and performance was -0.2.
14 Social care report 2016
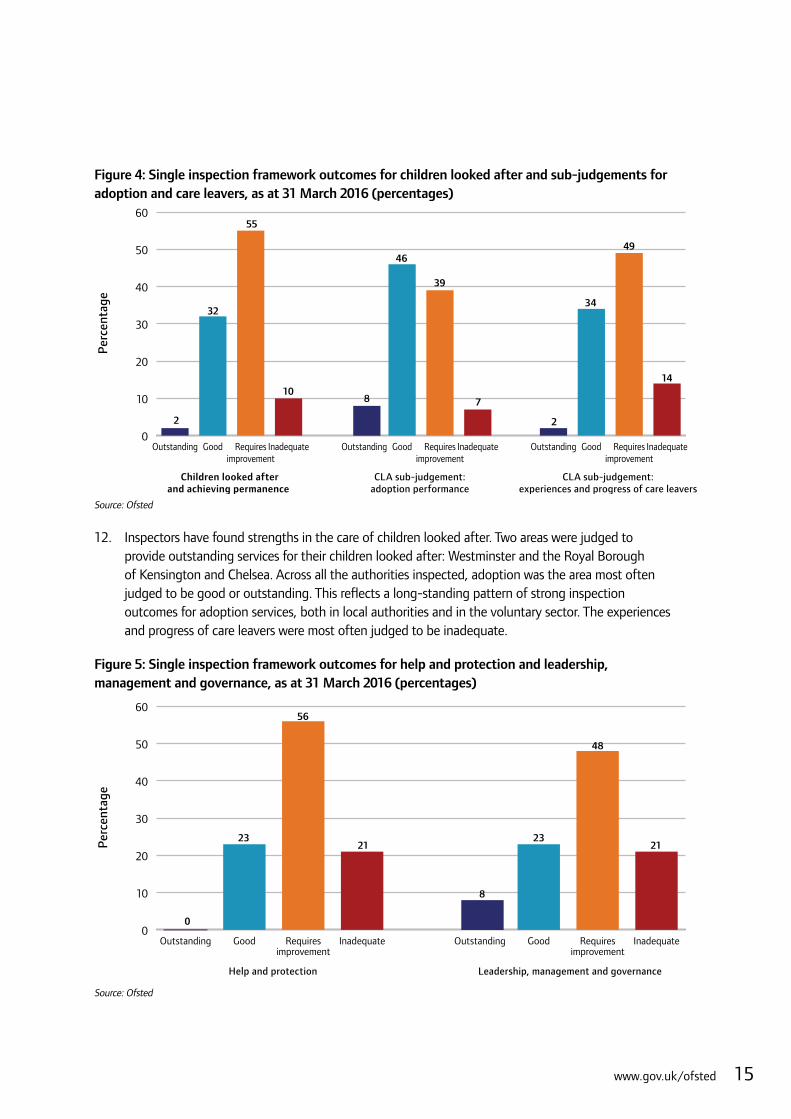
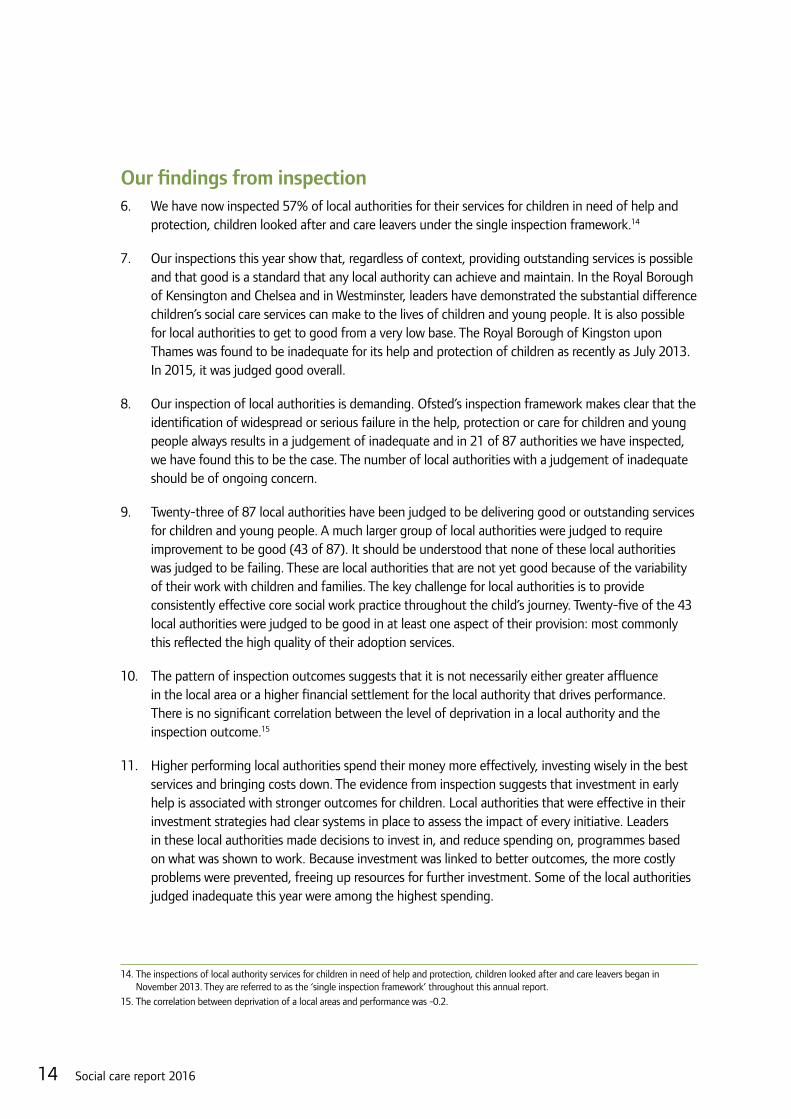
Figure 4: Single inspection framework outcomes for children looked after and sub-judgements for adoption and care leavers, as at 31 March 2016 (percentages)
0
10
20
30
40
50
60
InadequateRequiresimprovement
GoodOutstandingInadequateRequiresimprovement
GoodOutstandingInadequateRequiresimprovement
GoodOutstanding
Per
cent
age
8
46
39
7
34
49
14
22
32
55
CLA sub-judgement:adoption performance
Children looked afterand achieving permanence
CLA sub-judgement:experiences and progress of care leavers
10
Source: Ofsted
12. Inspectors have found strengths in the care of children looked after. Two areas were judged to provide outstanding services for their children looked after: Westminster and the Royal Borough of Kensington and Chelsea. Across all the authorities inspected, adoption was the area most often judged to be good or outstanding. This reflects a long-standing pattern of strong inspection outcomes for adoption services, both in local authorities and in the voluntary sector. The experiences and progress of care leavers were most often judged to be inadequate.
Figure 5: Single inspection framework outcomes for help and protection and leadership, management and governance, as at 31 March 2016 (percentages)
0
10
20
30
40
50
60
InadequateRequiresimprovement
GoodOutstandingInadequateRequiresimprovement
GoodOutstanding
Per
cent
age
8
23
48
21
0
23
56
Leadership, management and governanceHelp and protection
21
Source: Ofsted
15www.gov.uk/ofsted
13. Help and protection remains the most challenging service to get right and, as yet, no local authority has demonstrated outstanding practice. Of all the services delivered by social care in a local authority, help and protection needs the closest scrutiny and strongest partnership working to get right. Therefore, weaknesses in leadership and management are more likely to impact directly on help and protection than any other aspect of provision. Some of the areas that are not yet outstanding overall are outstanding for leadership and management: Cheshire West and Chester; Hampshire; Hammersmith and Fulham; Leeds; and Trafford. Some of these areas have made notable improvements to practice in recent years.
Leadership14. Inspection evidence shows that it is the quality of leadership in a local authority that makes all the
difference. Outstanding leadership is about creating the organisational systems and culture that enable social work to flourish. Evidence from inspections suggests that there are some key factors that help create the necessary environment for social workers to perform well:
●● local political and corporate leadership
●● practice leaders who know and model what good practice looks like
●● ambitious ideas based on sound research
●● a culture that protects and supports
●● manageable workloads.
15. With seven of 87 local authorities found to be outstanding for leadership, management and governance, and a further 20 of 87 found to be good, there are clear lessons to be learned in how to successfully improve practice in local authorities.
Local political and corporate leadership16. In the best local authorities, we have seen local political leaders who have:
●● prioritised children’s services
●● provided a high level of support and scrutiny to senior managers and social workers
●● demonstrated the highest levels of ambition for children and young people in their area
●● shown a willingness to take difficult decisions and support ambitious proposals for service improvement.
17. Political leaders should have the highest level of ambition for children looked after. Corporate parenting is the local authority’s legal and moral duty to provide children looked after with the kind of support that any good parent would provide for their own children. This means enhancing a child’s quality of life as well as simply keeping them safe. In order to raise ambition for children looked after, elected members and senior leaders must act like ‘pushy parents’, working hard to ensure the best for children looked after through asking the question, ‘is this good enough for my child?’
16 Social care report 2016
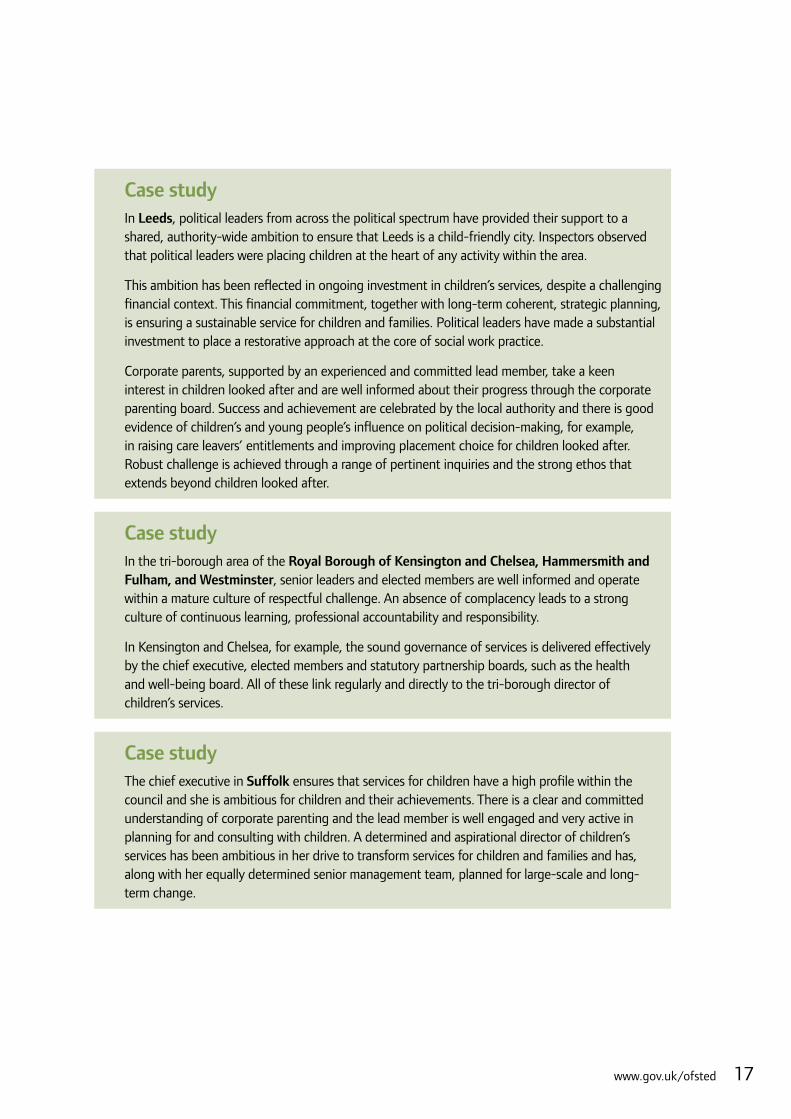
Case studyIn Leeds, political leaders from across the political spectrum have provided their support to a shared, authority-wide ambition to ensure that Leeds is a child-friendly city. Inspectors observed that political leaders were placing children at the heart of any activity within the area.
This ambition has been reflected in ongoing investment in children’s services, despite a challenging financial context. This financial commitment, together with long-term coherent, strategic planning, is ensuring a sustainable service for children and families. Political leaders have made a substantial investment to place a restorative approach at the core of social work practice.
Corporate parents, supported by an experienced and committed lead member, take a keen interest in children looked after and are well informed about their progress through the corporate parenting board. Success and achievement are celebrated by the local authority and there is good evidence of children’s and young people’s influence on political decision-making, for example, in raising care leavers’ entitlements and improving placement choice for children looked after. Robust challenge is achieved through a range of pertinent inquiries and the strong ethos that extends beyond children looked after.
Case studyIn the tri-borough area of the Royal Borough of Kensington and Chelsea, Hammersmith and Fulham, and Westminster, senior leaders and elected members are well informed and operate within a mature culture of respectful challenge. An absence of complacency leads to a strong culture of continuous learning, professional accountability and responsibility.
In Kensington and Chelsea, for example, the sound governance of services is delivered effectively by the chief executive, elected members and statutory partnership boards, such as the health and well-being board. All of these link regularly and directly to the tri-borough director of children’s services.
Case studyThe chief executive in Suffolk ensures that services for children have a high profile within the council and she is ambitious for children and their achievements. There is a clear and committed understanding of corporate parenting and the lead member is well engaged and very active in planning for and consulting with children. A determined and aspirational director of children’s services has been ambitious in her drive to transform services for children and families and has, along with her equally determined senior management team, planned for large-scale and long-term change.
17www.gov.uk/ofsted

Practice leadership18. Practice leaders know what good practice looks like, both in principle and on the frontline.16
This understanding is based in practice experience and firmly grounded in sound research. This enables them to develop ambitious ideas for delivering outstanding services and gives them credibility to lead.
19. As well as being experts in effective practice, practice leaders need to have the right skills to build a culture in which ambition and passion for achieving the very best for all children are shared by all in the local authority. Staff and managers in authorities with outstanding leadership and management stress the importance of practice leaders who are visible and accessible. Practice leaders know their staff well, know the families they work with well and are experts in their field. As one social worker remarked, ‘they make it their business to know about all children’.
20. Good practice leaders can create a culture of learning that provides social workers with high support and high challenge. In order for social workers to be able to genuinely reflect on their work and identify ways to make things better, they need both the time and the confidence to do this. Practice leaders can create a culture that questions, evaluates and reflects, but it is only successful where staff have enough time to engage because their workloads are manageable and where they feel secure enough in their positions to drop their defences and be open about areas for improvement.
16. ‘Practice leadership’ is not about a specific job role but describes a set of attributes that individuals can hold. Practice leadership is the oversight of direct work with children and families by senior leaders. Practice leaders are those who have the day-to-day operational responsibility for all social work practice with families. They create the right environment for excellent practice and developing excellent practitioners.
18 Social care report 2016

Case studyIn the tri-borough area of the Royal Borough of Kensington and Chelsea, Hammersmith and Fulham, and Westminster, practice leaders have developed and implemented the Focus on Practice model of social work effectively. This places a high value on relationship building between children and their social workers to deliver services that are consistently excellent.
This innovative project has been well thought through and is well resourced. It includes a comprehensive and accredited training programme, with skills coaching from trained specialist practitioners. The model has been fully accepted and implemented across the workforce.
Practice leaders maintain a strong understanding of what is happening on the frontline. A comprehensive suite of concise and consistent performance reports means that managers and leaders are knowledgeable and well informed about their service’s performance against key indicators. ‘Practice weeks’ have been introduced, where leaders spend a week discussing cases with social workers and observing practice and, as a result, leaders know what is being done well and what could improve.
This knowledge of the frontline enables practice leaders to understand the workforce fully and to ensure that practice standards are rigorously maintained. Very low caseloads and career development through training and promotion opportunities attracts, then retains, high-quality social workers. This skilled and well-trained staff group is then able to deliver the highly innovative and aspirational Focus on Practice outcomes, making the tri-borough a place where social workers want to work.
Case studyBuilding on its innovative academy programme to support the development of newly qualified social workers, Hertfordshire has introduced a leadership academy programme for senior social work practitioners and team managers. The programme was designed to address the challenge of recruiting frontline managers and to help experienced practitioners who are moving up to management roles to do so with the confidence and skills they need. It is now in its third year of operation.
Participants receive a range of teaching, mentoring and action learning focused specifically on leadership and management of children’s social work. Nearly all of the resources needed have been drawn from in-house, with very limited additional costs.
Participants have had a positive influence on strategy and at the frontline, helping embed a deliberate shift from compliance-based practice to a more motivational approach to working with families, which is at the heart of the authority’s new Family Safeguarding model of social work.
The leadership academy and the academy programme for social workers have played a vital role in helping the authority recruit and retain experienced professionals, reduce caseloads, keep vacancies and agency staffing costs to exceptionally low levels for the region and deliver consistently good services for children.
19www.gov.uk/ofsted
Ambitious ideas based on sound research21. In the best local authorities, leaders have developed ambitious and innovative approaches to
practice that are firmly grounded in sound research. We have seen examples of how research-led ideas can have a transformative effect on children, young people and families when staff are supported to deliver them and leaders critically assess their impact.
22. Where innovation has been particularly impressive in the authorities visited this year, it was because of the change that was effected to core social work practice. In those areas where innovation worked, it was integral to the overall strategy and not a niche project.
Case studyLeaders in Leeds have invested substantially in an extensive network of early and targeted help. The adoption of a restorative approach has had a transformational impact on culture and professional practice. The approach places children, young people and their families at the heart of the decisions that affect them. It is based on the theory that positive outcomes are more likely to be achieved when those in authority do things with children and families rather than to them or for them. Extensive and effective use is made of family group conferencing (FGC), multi-systemic therapy (MST) and family intervention services (FIS) to achieve early support, early change and early improvement. These services are well established and delivered by confident, knowledgeable, well-trained and supported practitioners.
The following case in Leeds exemplified their approach. The case related to a mother who had previously had multiple children taken into care due to parental substance misuse. It is not uncommon for mothers in similar situations to go straight into child protection processes, followed by court and possible removal at birth.
In this case, a FGC was arranged very early in the pregnancy. The mother, surrounded by family members she felt could support her, worked together with social workers to agree a clear plan that would enable the mother to care for her child within the extended family home. Holding the meeting early helped the mother understand the concerns and risks identified by professionals.
Following the birth, the child moved home to the care of the mother within the extended family. The mother continued to demonstrate positive progress and the FGC review process was used to inform planning at various stages along the way. The mother’s move home with the child was successful.
Between April and December 2014, there were 567 FGCs held for families. In this period, 249 children were safely and appropriately supported to remain within their families. MST is used effectively with families where children are on the edge of care and this has been successful in preventing children being taken into care unnecessarily, with 95% of young people remaining with their families.
20 Social care report 2016
23. Part of being a research-led local authority is about having a practice methodology to draw on. The evidence from inspection is that it is the use of a methodology or framework that is significant, not which one. The use of a methodology has even greater impact when it is deployed across a larger group of staff, including partners from other agencies.
Case studyThe implementation of a social work practice model across children’s services in Lincolnshire, and as a model that underpins early help, is beginning to change thinking and practice. This new approach is a strength that is beginning to have a positive impact on how professionals work with families and listen to the voices of children. The voice of the child is now more prevalent in assessments. Implementation has been supported by a training programme that has been widely taken up by staff across the children’s partnership, including staff in agencies who deliver the early help offer. The voice and involvement of children in Lincolnshire have been enhanced by the introduction of the model and associated communication tools, for example, using particular tools to help children to explain their worries and dreams.
A culture that protects and supports24. The consequences of decisions about children’s lives can be enormous, which makes children’s social
work highly demanding. Getting decisions right requires social workers to have the time to reflect, the confidence to stand by their professional judgement, and the ability to continually review their practice so that they can learn from every new situation.
25. One of the factors that came out very strongly in interviews with staff in high-performing local authorities was that, at all levels, they knew that they were supported. ‘Feeling safe’ was something that was frequently repeated. Social workers and managers both described a culture where risk was shared, where reflection was known to be safe, and where the behaviour of managers demonstrated on a daily basis that staff could trust in their leadership.
Leaders are prioritising culture change and have managed the shift very well. Because they know what they are doing, ‘it makes me feel safe.’ (Cafcass practitioner)
Staff are positively encouraged to take pride in their profession and become the experts: ‘we are collective and everyone feels part of it.’ (Manager, Leeds)
‘I feel safer than I ever have and managers have integrity.’ (Social worker, Leeds)
There is a culture of openness and transparency – leaders are hands-on. ‘It makes you feel safe’, we are ‘not working in isolation.’ (Manager, Kensington and Chelsea)
‘Risk is not only held by me, it is shared... Real team work - it’s what we do... Your views are really valued but you are challenged to look at everything.’ (Social worker, Kensington and Chelsea)
‘Everyone’s professional opinion counts – not true elsewhere. Safe place to talk out – you are encouraged that you have a responsibility to do so.’ (Social worker, Hackney)
21www.gov.uk/ofsted

Manageable workloads26. For social workers to be able to practice to a high standard, they need sufficient time to devote to
working directly with children and families. Where good work with children and families is common practice, social workers have manageable caseloads. In our inspections of local authorities this year, we observed 14 local authorities where social workers had high caseloads. We are seeing evidence of high caseloads being tackled, and in some areas performance is demonstrably improving as a result.
Case studyFollowing an inadequate judgement, leaders in the Royal Borough of Kingston upon Thames took action to reduce social worker caseloads. Management oversight, supervision and direction had significantly improved in the previous year and staff were well engaged in service development. Staff recruitment and stability had improved.
With manageable workloads, social work visits to children were regular, purposeful and child-centred. Social workers were able to be imaginative and resourceful in working with children. Children were listened to and understood, and their views were used to inform assessment and planning. Children and families who need help and support received effective and timely services.
Case studySomerset County Council, judged inadequate by Ofsted twice in two years, has recognised the importance of reducing the workloads of its social workers. A total of 44 permanent new social workers have been recruited, as well as 26 new graduate social workers. The caseloads have been reduced by close to one third, from an average of 20.5 in May 2015 per social worker to an average of 14 and the turnover rate in social workers has dropped from 20 to 14%.
Multi-agency working27. To create the organisational systems and culture that enable social work to flourish, all of the
partners and agencies that provide services for children or young people must work together effectively.
28. Within local authority areas, well-developed partnerships share information well and analyse this information effectively. This informs the development of priorities and leads to actions that improve frontline practice. Where they are working well, local safeguarding children boards (LSCBs) are helping to facilitate this multi-agency working. However, our reviews of LSCBs have shown that around one in five is failing to meet their statutory obligations and provide this necessary oversight and challenge.
22 Social care report 2016

Case studyInspectors found that, under the leadership of a strong independent chair, Hertfordshire LSCB has engaged leaders at the highest level across the partnership in promoting children’s safety, and has a strong influence on commissioning across public services. The LSCB’s independent chair has developed a culture of openness, scrutiny and challenge. The culture permeates the board’s work, both internally and across the partnership. This outstanding partnership working has enabled the board to respond to emerging safeguarding issues and develop strategic responses that positively impact on practice with children and their families.
For example, a letter from the chair to the director of children’s services in June 2015 holds the local authority to account for its performance in relation to children in need, including disabled children. This robust challenge was well founded in case review findings and it set out in specific terms where improvement was needed. The letter prompted a review by the local authority of a sample of children’s cases and an action plan, which the board has accepted, to improve scrutiny of and support for practice in this area.
Case studyInspectors found that Thurrock LSCB has developed clear collective ownership of safeguarding, with all partners positively engaged in action and reflection to support children, young people and their families. The board is chaired well by an influential chair who both supports and challenges partners. Accountability is high.
To gauge understanding and risk to children online, the LSCB started a series of roadshows called ‘walk online’ in 2014. These covered the broadest range of risks to children and young people, including child sexual exploitation, grooming, sexting, missing, cyber bullying, female genital mutilation and ‘Prevent’ from a child’s perspective. Initially offered to Years 5 and 6 pupils, they were extended to Years 10 and 11 pupils at the request of the Youth Cabinet. Fourteen thousand children and young people have attended, and impact has been shown through changed behaviours such as amending privacy settings. Walk online demonstrates a creative and comprehensive understanding of risks to children and young people. This outstanding piece of practice demonstrates a strong partnership approach led by the LSCB, between education, parents and the specialist police knowledge from the child exploitation online service.
23www.gov.uk/ofsted
24 Social care report 2016
Helping and protecting childrenHow well are children protected?29. Help and protection continues to be the practice most likely to be judged less than good in local
authorities, with a high proportion of local authorities judged inadequate. The common features of local authorities judged inadequate for help and protection were:
●● children and young people experienced too many changes of social worker
●● visits to children were not always undertaken within agreed timescales and, while there was evidence that children were seen during visits, they were not always seen alone
●● assessments were either not done or took too long to complete
●● when assessments were completed, they were not analytical and did not lead to appropriate or focused help
●● plans to reduce harm and to promote the welfare of children and young people were subject to drift and delay
●● social workers’ ability to practice was negatively affected by high caseloads
●● there was insufficient management oversight and supervision of social workers and poor practice remained unchallenged.
30. Preventing serious harm to children is neither easy nor simple and is impossible without the cooperation and awareness of very many people and agencies, including members of the public. Whether local agencies are effectively working together to keep children safe has been an area of scrutiny and concern for many decades. Ofsted has now judged the effectiveness of help and protection in 87 local authority areas under the single inspection framework: more than half of all authorities nationwide.
31. Ofsted’s inspections now have a more demanding focus on practice than was the case in the last full round of local authority inspections (known as ‘safeguarding and looked after children inspections’), and as a result, the current help and protection judgement is widely regarded as a much harder test. Under the current framework, the proportion of authorities judged inadequate has risen by five percentage points.
Figure 6: Comparison of safeguarding outcomes across frameworks (percentages)
Safeguarding*
Single inspectionframework (Help
and protection)
* Does not include seven re-inspections of safeguarding
Inadequate
Requires improvement
Good
Outstanding
23 56 21
3 38 43 16
Single inspection framework relates to 87 inspections. Safeguarding relates to 152 inspections.Source: Ofsted
25www.gov.uk/ofsted
32. During 2012–13, Ofsted conducted focused child protection inspections in the one third of local authorities where we had the highest level of concern. The methodology for these inspections is comparable to the current methodology. For those local authorities that have been inspected under both frameworks, exactly half have improved their judgement. On balance, while there is still widespread underperformance, there is also evidence of improvement in areas that have previously been of concern.
Figure 7: Children who need help and protection judgements, change from previous inspection (percentages)*
Changein judgement
Declined
Same
Improved
50 41 9
Source: Ofsted
*32 Local authorities had both a child protection inspection and a single inspection framework inspection. Relates to the overall effectiveness judgement for the child protection framework and ‘help and protection’ for the single inspection framework.
33. Inspection shows that there is now a number of authorities where help and protection is good and has been consistently good for a number of years. This is now a larger group than those that have repeatedly been found to be failing.
34. There is also very clear evidence that authorities can move quickly from good to inadequate and vice versa. North Yorkshire, Staffordshire, Gateshead and the Royal Borough of Kingston upon Thames are notable for the speed with which they have reached a good level of performance.
35. Good performance is not the result of the deprivation of the area being served, the size of the population or what region the authority sits in. Gateshead and Sunderland are ranked 33 and 68, respectively, for levels of deprivation affecting children.17 They have very similarly sized child populations and are 14 miles apart. Gateshead has mainly good performance, while Sunderland has declined rapidly and is now undergoing formal intervention by the Department for Education. Similarly, the Royal Borough of Kingston upon Thames and Slough are ranked 137 and 145, respectively, for levels of deprivation affecting children.18 They have very similarly sized child populations and are 20 miles apart. Both local authorities have previously been judged inadequate, but Kingston upon Thames has rapidly improved and is now good, while Slough has not improved.
17. Income deprivation affecting children index (IDACI), File 11: upper-tier local authority summaries, IDACI, Department for Communities and Local Government, September 2015; www.gov.uk/government/statistics/english-indices-of-deprivation-2015 for the proportion of lower layer super output areas in the most deprived 10% nationally. See footnote 1 for explanation of lower layer super output areas.
18. Ranked 137 and 145 for the proportion of lower layer super output areas in the most deprived 10% nationally.
26 Social care report 2016

36. There is no shortage of good practice to learn from. Fifty-one of 152 local authorities were good or outstanding at their last inspection, in relation to their safeguarding judgement, if inspections prior to the introduction of the single inspection framework are taken into account, and there is good performance in every region.
Case studyServices in Salford for children and young people in need of help and protection were found to have improved to good at their last inspection. This is the result of effective partnerships with other agencies, such as police, schools and health, at a strategic and an operational level and a collective determination to improve services. Well-coordinated multi-agency help extends to preventative services and raising awareness on a range of risks, including child sexual exploitation, gang involvement and radicalisation. Children in Salford benefit from help that is improving outcomes for many.
This effective multi-agency approach is exemplified in ‘The Bridge’, the multi-agency safeguarding hub, where a wide range of agencies are represented and information is shared to ensure a timely and appropriate response to the needs of children. Daily multi-agency meetings to review referrals are well attended by children’s social care teams, the police, health, drug and alcohol and mental health teams, probation, domestic abuse team and community safety workers, which means that information is shared in good time and actions agreed and coordinated across agencies.
Interventions to protect and support children and their families are proportionate and can reduce the risk of problems escalating. For example, early help outreach workers based in the team are able to respond immediately to concerns about children whose cases do not meet the threshold for a child protection response. When a dentist made a referral to The Bridge about an eight-year-old girl who had dental problems and had missed several appointments, checks showed that there had been previous concerns about neglect by the parents. Although the case did not meet the threshold for a child protection intervention, it required a response, so an outreach worker visited the family the same day. A sensitive and skilled approach meant the mother agreed to the worker arranging a visit to the dentist and beginning some work in the home, as home conditions were beginning to deteriorate. Early intervention to support the child meant that her health needs were met, the home environment addressed, parenting support provided and the outreach worker could monitor progress and refer to a social worker if necessary.
27www.gov.uk/ofsted
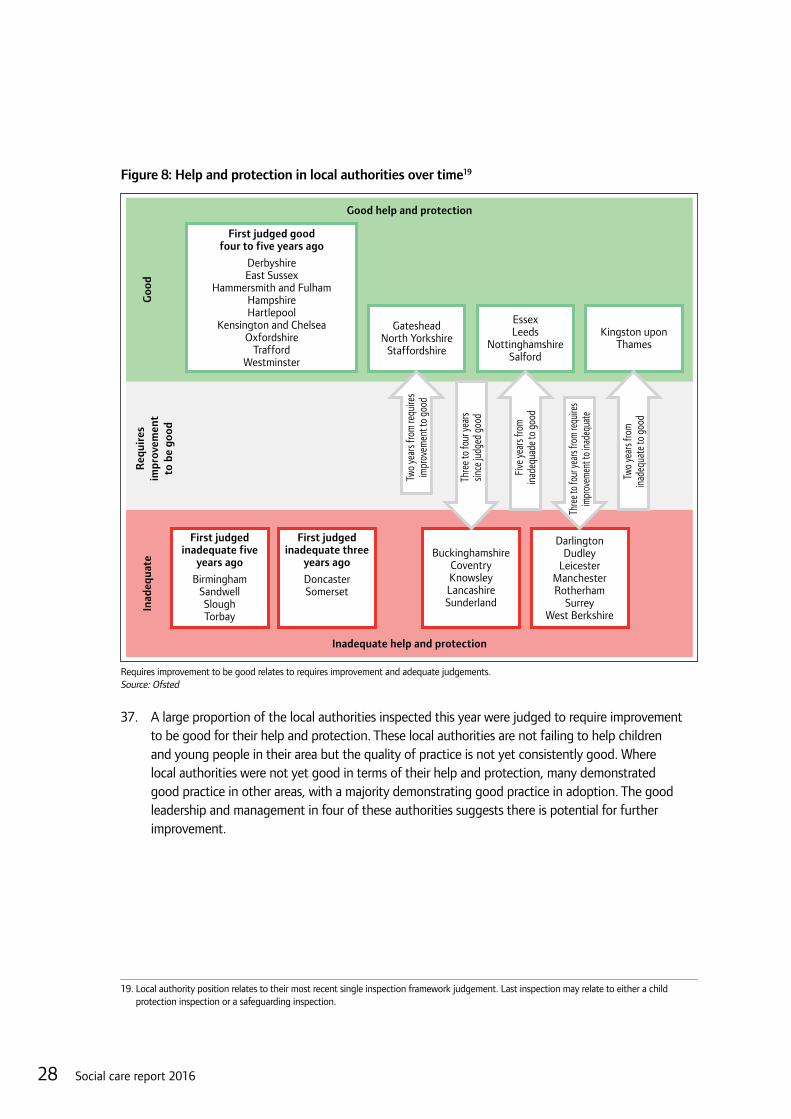
Figure 8: Help and protection in local authorities over time19
Goo
dR
equi
res
impr
ovem
ent
to b
e go
od
Good help and protection
Inadequate help and protection
Inad
equa
te
First judged goodfour to five years ago
DerbyshireEast Sussex
Hammersmith and FulhamHampshireHartlepool
Kensington and ChelseaOxfordshire
TraffordWestminster
First judgedinadequate three
years ago
DoncasterSomerset
BuckinghamshireCoventryKnowsleyLancashireSunderland
First judgedinadequate five
years ago
BirminghamSandwellSloughTorbay
GatesheadNorth Yorkshire
Staffordshire
Kingston uponThames
EssexLeeds
NottinghamshireSalford
DarlingtonDudley
LeicesterManchesterRotherham
SurreyWest Berkshire
Two
year
s fro
m re
quire
sim
prov
emen
t to
good
Thre
e to
four
year
ssin
ce ju
dged
goo
d
Two
year
s fro
min
adeq
uate
to g
ood
Five
year
s fro
min
adeq
uade
to g
ood
Thre
e to f
our y
ears
from
requ
ires
impr
ovem
ent t
o ina
dequ
ate
Requires improvement to be good relates to requires improvement and adequate judgements.Source: Ofsted
37. A large proportion of the local authorities inspected this year were judged to require improvement to be good for their help and protection. These local authorities are not failing to help children and young people in their area but the quality of practice is not yet consistently good. Where local authorities were not yet good in terms of their help and protection, many demonstrated good practice in other areas, with a majority demonstrating good practice in adoption. The good leadership and management in four of these authorities suggests there is potential for further improvement.
19. Local authority position relates to their most recent single inspection framework judgement. Last inspection may relate to either a child protection inspection or a safeguarding inspection.
28 Social care report 2016

Figure 9: Local authorities judged requires improvement to be good for help and protection, other judgements between 1 March 2015 and 31 March 2016 (percentages)
Leadership,management
and governance
CLA sub-judgement:experiences
and progressof care leavers
CLA sub-judgement:adoption
performance
Children lookedafter and achieving
permanence
Inadequate
Requires improvement
Good
Outstanding35 57 9
61 30 9
26 61 13
17 74 9
Relates to 23 inspections.Source: Ofsted
Protecting older children38. Public consciousness and, to a lesser extent, the social care sector have tended to focus on the help
and protection of society’s youngest children.
39. In recent years, we have become increasingly aware of the intense pressures older children face in modern society and the impact of child sexual exploitation, gangs and radicalisation, which are risks in the community that disproportionately affect older children. While the total number of children on child protection plans has increased by 16% since 201120, the corresponding number of children over the age of 16 on plans has increased by 54%.21
40. Ofsted’s report ‘Ages of concern’ highlighted the high proportion of older children that have been the subject of a serious case review.22 Analysis of serious case reviews showed that agencies had focused on the young person’s challenging behaviour, rather than trying to understand the causes of the behaviour and the need for support. Analysis also showed that young people were treated as adults rather than being considered as children. Research has demonstrated that professionals have sometimes prioritised younger children and have misunderstood the nature of the risks that older children face. Older children have been wrongly viewed as more resilient than younger children and perceived to be freely making ‘life choices’ rather than being subject to harm.23
20. Characteristics of children in need: 2010 to 2011, Main tables: OSR26/2011, Table 25, Department for Education, November 2011; www.gov.uk/government/statistics/characteristics-of-children-in-need-in-england-financial-year-2010-to-2011-final-figures.
21. Characteristics of children in need: 2014 to 2015, Main tables: SFR41/2015, Tab A4, Department for Education, October 2015; www.gov.uk/government/statistics/characteristics-of-children-in-need-2014-to-2015.
22. Ages of concern: learning lessons from serious case reviews’, Ofsted, 2011; www.gov.uk/government/publications/learning-lessons-from-serious-case-reviews.
23. ‘That difficult age: developing a more effective response to risks in adolescence’, Research in Practice, 2014; www.rip.org.uk/news-and-views/latest-news/evidence-scope-risks-in-adolescence.
29www.gov.uk/ofsted

41. Older children are still children, even if they sometimes look and sound like adults. There are challenges in ensuring that the often complex needs of these children are met by a system that was designed to protect and meet the needs of younger children, and more specifically, protect children from abuse within the family. There is no right answer to the question of whether they should be supported using the same methods as for younger children or different methods. Different professionals will have different views. Ofsted does not have a preferred response. In some cases, a child protection plan may be an appropriate response but, in other circumstances, there are other ways of bringing agencies together to help and protect older children. What is important is that they are equally well protected and cared for, and the evidence suggests this is not always the case.
Figure 10: Age change of children on child protection plans between 2013–14 and 2014–15
Per
cent
age
chan
ge
-4
-2
0
2
4
6
8
10
12
14
16
18
16 and over10–155–91–4Under 1Unborn
4
-2
1 3
6
16
Characteristics of children in need: 2014 to 2015, Main tables: SFR41/2015, Tab A5, Department for Education, October 2015;www.gov.uk/government/statistics/characteristics-of-children-in-need-2014-to-2015Characteristics of children in need: 2013 to 2014, Main tables: SFR43/2014, Tab A5, Department for Education, October 2014;www.gov.uk/government/statistics/characteristics-of-children-in-need-2013-to-2014
42. Responses to adolescents’ needs must be age appropriate, recognise the sources of risks and not make assumptions about adolescent behaviour. As we said in our thematic inspection of child sexual exploitation,24 local strategies and plans should be informed by the opinions and experiences of older children.
Protecting those at risk of child sexual exploitation43. Child sexual exploitation can affect any child, irrespective of age, gender or ethnicity. To date, the
majority of children identified as being at risk of sexual exploitation have been older children but this is an ever changing picture. We have previously described the challenges faced by the system in responding to child sexual exploitation and have criticised local authorities for not sufficiently prioritising the issue.25
24. ‘The sexual exploitation of children: it couldn’t happen here, could it?’, Ofsted, 2014; www.gov.uk/government/publications/sexual-exploitation-of-children-ofsted-thematic-report.
25. Ibid.
30 Social care report 2016

44. The evidence from our inspections of local authorities over the past year suggests that there has been a significant improvement in the response to child sexual exploitation. The majority of local authorities inspected are now prioritising this issue. We have observed better examples of effective multi-agency forums at an operational and strategic level to plan and coordinate responses to child sexual exploitation. Children’s social care cannot tackle this alone: the most effective examples are those where all agencies, including the police, education, health, youth services, housing, children’s social care and the wider local authority (such as parks and licensing) work closely together. As a consequence, information is effectively shared, including information on those missing and absent from school, so that children at risk are identified at an early stage.
45. The recent joint area targeted area inspections of local authorities, the police and health, probation and youth offending services are further enhancing our understanding of responses to children who go missing and those at risk of child sexual exploitation. Those areas that are most effective ensure that a team of professionals around the child coordinates its responses to meet the differing needs of the child and their family, and understands and addresses external factors that increase risk, such as the school or peer environment.
Case studyChildren and young people at risk of exploitation in Hackney have workers who are respectful and appropriately persistent in keeping in contact, even when young people are reluctant to engage. There is a multi-agency group that will go to considerable lengths to understand the young person’s experiences, their background and, most of all, their sense of identity. A shared multi-agency understanding of the local context in terms of the risks young people face supports frontline workers to assess and manage risk well. Young people’s experience of multi-agency working is based on a thorough and shared understanding of their specific needs around culture, religion, sexuality, gender and age. Workers go to great lengths to ensure that children and their families have the services that meet need. Robust holistic assessments mean that factors at home that are resulting in young people going missing are understood and addressed as are external risk factors such as risks in the local neighbourhood. Young people engage well with professionals because decisions about when actions happen and who does them are made with their involvement. As a result, risk is reduced in many cases. Young people particularly appreciate the flexible and creative approach. For example, young people’s confidence is built by engaging them in activities they enjoy and by participating in the development of services for others who have similar experiences.
46. While there has been a change for the better overall, it is still the case that the pace of progress in responding to child sexual exploitation is variable and that, in some local authority areas, children at risk are not identified or not identified early enough. This means that children in different areas across the country are receiving significantly different responses to need. It also remains the case that in some agencies and areas, child sexual exploitation is not sufficiently understood, recognised or addressed.
31www.gov.uk/ofsted
47. As the Children’s Commissioner’s report of February 2015 found, strong strategies to tackle child sexual exploitation do not always lead to effective frontline practice.26 From inspection, we know that even where strategies are in place, it can take time for these to embed and impact on frontline practice. Responses to children missing from home, care and school remain a concern. There are still too many local authorities that do not understand the reasons why children go missing and how to prevent it in future. One of the mechanisms to improve this is return interviews, but there are still too many local authorities where return interviews do not take place or are not timely. This is a particular concern for children placed out of the authority. Not all areas are sharing information effectively, for example making the links between children missing and absent from school and the risk of child sexual exploitation.
48. In those areas that are working to reduce risk, the importance of involving and engaging the community, including parents, carers, children and young people, to raise awareness of child sexual exploitation is understood. Evidence from inspection has shown the effectiveness of working with the business community, transport, housing and parks in raising awareness and increasing identification of risk. Information and intelligence from local communities can result in timely action by the police to disrupt and deter perpetrators.
49. There is increasing awareness of peer-on-peer abuse. Some local areas are already investing resources in data analysts to map relationships between young people known to be at risk, or to pose a risk, of sexual exploitation. This means that networks of young people can be better understood, and additional young people who may be at risk identified. Agencies can then intervene earlier to prevent abuse or reduce risk. In addition, schools where there may be particular concerns about sexual exploitation can be offered specialist support to ensure that risk is minimised.
50. Where local areas are really making a difference, they are recognising that child sexual exploitation has links with a whole other range of issues that impact on the safety and well-being of children. They are recognising the different forms that exploitation can take, such as organised trafficking and peer-on-peer abuse, but they are also seeing the links to gangs and online grooming, as well as the experiences of domestic abuse and neglect within the family home. By developing strategies and approaches that address vulnerability for children across a range of domains, such as domestic abuse, neglect and child sexual exploitation, local agencies are better able to target resources to meet need and respond more effectively
Protecting unaccompanied asylum-seeking children51. Following a trend of decreasing numbers of unaccompanied asylum-seeking children looked after
since 2009, when the figure peaked at 3,880, there was a sharp increase of 30% between 2014 and 2015.27 As at 31 March 2015, there were 2,630 unaccompanied asylum-seeking children looked after, of whom the majority were over the age of 16. Of the 15,270 children looked after over the age of 16 at 31 March 2015, 1,970 (13%) were unaccompanied asylum-seeking children.28
26. ‘If it’s not better, it’s not the end: inquiry into child sexual exploitation in gangs and groups: one year on’, Children’s Commissioner, 2015; www.childrenscommissioner.gov.uk/publications/“if-it’s-not-better-it’s-not-end”-inquiry-child-sexual-exploitation-gangs-and-groups-0.
27. Children looked after in England including adoption: 2014 to 2015, National tables: SFR34/2015, Tab A3, Department for Education, October 2015; www.gov.uk/government/statistics/children-looked-after-in-england-including-adoption-2014-to-2015.
28. Ibid.
32 Social care report 2016
52. Inspectors commented on provision for unaccompanied asylum seeking children in over a quarter of inspections. Most references are positive about the level and quality of support provided. Good work is characterised by:
●● access to specialist support from workers who have good knowledge of legal rights and processes
●● effective matching to suitable, high-quality accommodation
●● tailored, creative packages of support for children that address their cultural, religious, learning and social needs, carefully based on robust assessments.
53. As the number of unaccompanied asylum-seeking children grows, Ofsted will continue to look closely at the experiences and progress of these children and whether they are being protected. This will include trying to better understand what good practice looks like in relation to children who arrive as unaccompanied asylum-seeking children and later disappear.
Protecting disabled children54. Our 2012 thematic survey report on protecting disabled children found that those who were also
identified as children in need often had unidentified child protection needs.29 The majority of local safeguarding children boards (LSCBs) and local authorities were not robustly assessing the quality of work to protect disabled children.
55. Since the publication of the report the proportion of disabled children who are subject to a plan has not changed significantly. Added to this, there is significant variation between local authorities in the proportion of children subject to child protection plans. Eleven local authorities have 9% or more of disabled children who are subject to a child protection plan, whereas some local authorities have consistently had none or a low proportion.
56. This variation in practice across local authorities suggests that some areas continue to insufficiently prioritise the protection of disabled children. A review of LSCBs’ annual reports shows that only a small proportion provided any analysis to understand the low numbers of disabled children on child protection plans and there is no inspection evidence to suggest that local authorities and LSCBs are consistently analysing this disparity.
57. In local authorities where those children are well protected, at-risk disabled children are identified effectively. They have specialist services and plans put into place. Where required, input from specialist health representatives is sought to ensure effective sharing of information and robust decision making. Good inter-agency working is an essential feature. Innovative approaches to communicating with disabled children are important in ensuring that the voice of the child is captured.
29. ‘Protecting disabled children: thematic inspection’, Ofsted, 2012; www.gov.uk/government/publications/protecting-disabled-children-thematic-inspection.
33www.gov.uk/ofsted

34 Social care report 2016

58. Many disabled children have access to good-quality services such as short breaks and residential special schools. Where practice is effective, children and staff work together to identify risk and devise strategies to reduce or manage that risk. Skilful communication with disabled children is important in ensuring that their voice is captured in plans and day-to-day practice.
Case studyAt William Henry Smith School, pupils work in partnership with staff to create their individual behaviour support plans. At the heart of all plans is how pupils want staff to support them in times of crisis. Consequently, the behaviour of individuals significantly improves. One student commented, ‘I have got a lot better with my behaviour from coming here.’ Pupils feel that staff really understand them and they feel that their views are highly respected. One student said, ‘All staff are nice, they understand and listen to you here.’ One member of staff commented, ‘We recognise and value young people here. We promote expression. We help young people to express their feelings any way they can.’
59. The protection of disabled children will be a focus for Ofsted in the coming year and we will be considering what steps we can take to better understand why practice varies so widely.
35www.gov.uk/ofsted
Experiences and progress of children looked afterChildren looked after60. Children looked after are served by many types of organisation, some of which are inspected or
regulated, but in different ways, and some that are not inspected or regulated. There are many different professionals and carers who work with children looked after and who are committed to making a difference to these children’s lives.
61. Seventy-five per cent of children looked after live with foster carers.30 Ofsted does not register or inspect individual foster carers. However, we do inspect the organisations that recruit and support foster carers, including local authorities and independent fostering agencies. Of those children in foster homes, 67% live in local authority placements and 33% in placements with independent fostering agencies.31
62. Eight per cent of children looked after are in children’s homes: around 6,000 across England at any given time.32 Children’s homes are a major area of public expenditure. Each year, the expenditure on this important service is around £1 billion.33 Because the children in these homes are often children with the most complex needs, scrutiny is very high. Ofsted inspects every children’s home in the country twice a year, as required by regulation, even those that are good or outstanding and have been for some time.
63. Seventeen per cent of children who ceased being looked after this year were adopted, around 5,300 children.34 There was a 26% increase in children adopted between 2013 and 2014 and a further 5% increase this year. However, there may be a reduction in the numbers of children adopted in the year to come. The number of children looked after who were placed for adoption, which is the step that comes before an adoption is finalised, has fallen. Placements for adoption had risen each year from 2011 to 2014, but decreased this year by 15%.35
64. The services supporting adoption make a complex picture. Local authorities are responsible for every aspect of adoption, including planning for adoption from the earliest stages once the decision has been made that a child becomes looked after. Voluntary adoption agencies also provide some of the same services as local authorities: identifying and recruiting adopters, placing children and providing
30. ‘Children looked after placements as at 31 March 2015’, Ofsted, published 10 May 2016, www.gov.uk/government/statistics/children-looked-after-placements-as-at-31-march-2015.
31. Fostering in England 1 April 2014 to 31 March 2015, Ofsted, December 2015, www.gov.uk/government/statistics/fostering-in-england-1-april-2014-to-31-march-2015.
32. Ibid.33. Department for Education: Children’s residential care review to transform lives: www.gov.uk/government/news/childrens-residential-care-
review-to-transform-lives.34. Children looked after in England including adoption: 2014 to 2015, National tables: SFR34/2015, Tab D1, Department for Education,
October 2015; www.gov.uk/government/statistics/children-looked-after-in-england-including-adoption-2014-to-2015.35. Ibid.
36 Social care report 2016
aftercare. Adoption support agencies provide support services before, during and after adoption, including with adults, but do not place children or recruit adopters. Ninety-one per cent of children looked after placed for adoption were living with local authority adopters and 9% were living with voluntary adoption agency adopters.36
65. A further 5% of children looked after were placed with their parents and over 34% of children who ceased being looked after during the year returned home to live with their parents or relatives.37
66. An increasing number of children looked after are ceasing being looked after through a special guardianship order (SGO),38 with a 173% increase in the number of SGOs between 2010 and 2015. A total of 3,520 children ceased being looked after through an SGO in 2015. The proportion of children ceasing being looked after through an SGO has risen from 5% in 2010 to 11% in 2015.39, 40
Our findings from inspection67. Our inspections of independent fostering agencies this year have found 85% of providers to be
good or outstanding, with only 1% of agencies found to be inadequate. Similarly, while we do not make a separate judgement on fostering services as part of our single inspections, our evidence shows a largely positive picture of the support that foster carers receive from local authorities, with several outstanding examples of high-quality, innovative work. As with independent fostering agencies, however, there is a small minority of local authorities who are failing to provide consistently the quality of training and support that all foster carers should expect and deserve.
68. In April 2015, we introduced a new inspection framework for children’s homes. The framework focuses on the overall experiences and progress of children living in the home, with particular focus on how well children and young people are helped and protected and the impact and effectiveness of leaders and managers.
69. Since the introduction of the new framework, children’s homes have responded well to the new focus. This year, the proportion of good or outstanding homes has jumped by an unprecedented nine percentage points. Since 2008, Ofsted has twice re-focused inspection of children’s homes and increased the level of challenge. In the context of this increasing challenge, the proportion of good or outstanding homes has risen from 60% to 79% as at 31 March: an increase of 19 percentage points.41
36. Source: Department for Education.37. Children looked after in England including adoption: 2014 to 2015, National tables: SFR34/2015, Tab A2 & D1, Department for Education,
October 2015; www.gov.uk/government/statistics/children-looked-after-in-england-including-adoption-2014-to-2015.38. Special guardianship provides legal permanence for those children for whom adoption is not appropriate. Unlike adoption, the order does
not end the legal relationship between the child and his/her birth parents.39. Children looked after in England including adoption: 2014 to 2015, National tables: SFR34/2015, Tab D1, Department for Education,
October 2015; www.gov.uk/government/statistics/children-looked-after-in-england-including-adoption-2014-to-2015.40. Children looked after in England including adoption: 2013 to 2014, National tables: SFR36/2014, Tab D1, Department for Education,
September 2014; www.gov.uk/government/statistics/children-looked-after-in-england-including-adoption--2.41. For legal reasons, some residential special schools and independent schools must also register as children’s homes. The outcomes for these
97 children’s homes are not included here.
37www.gov.uk/ofsted

Figure 11: Percentage of children’s homes with good or better inspection outcomes as at 31 March
Per
cent
age
good
or
bett
er
0
20
40
60
80
100
201620152014201320122011201020092008
Introductionof newinspectionframework
Revision ofinspectionframework
65 6068 74
8072 73 70
79
Source: Ofsted
70. For the 5,330 children looked after who were adopted during the year, or those who may need adoption in the future, there is also a clear pattern of strong performance.
71. Adoption remains the most positively judged area of social care practice in local authorities. Where practice is good, social workers are tenacious about finding and supporting the right family, with high quality and timely preparation and work with the courts.
Figure 12: Single inspection framework adoption outcomes for local authorities, as at 31 March 2016 (percentages)
Adoptionsupport agencies
Voluntaryadoption agencies
SIF CLAsub-judgement:
adoptionperformance
Inadequate
Requires improvement
Good
Outstanding
8 46 39 7
41 52 7
48 48 4
Number of inspections in brackets
Source: Ofsted
72. Both adoption support agencies and voluntary adoption agencies are frequently judged outstanding. As a result, children subject to adoption proceedings and adopters are likely to experience more consistently good practice than in most other parts of the sector.
Adoptionsupport agencies
Voluntaryadoption agencies
SIF CLAsub-judgement:
adoptionperformance
Inadequate
Requires improvement
Good
Outstanding
8 46 39 7
41 52 7
48 48 4
Number of inspections in brackets
38 Social care report 2016

Figure 13: Inspection outcomes for adoption services, as at 31 March 2016 (percentages)
Adoptionsupport agencies
Voluntaryadoption agencies
SIF CLAsub-judgement:
adoptionperformance
Inadequate
Requires improvement
Good
Outstanding
8 46 39 7
41 52 7
48 48 4
Number of inspections in brackets
Source: Ofsted
73. This year, we asked children and young people to tell us what they thought was good about their children’s home or foster home and what could be better. Three thousand, two hundred and seventy-one children and young people responded, and commonly, what these children wanted was to:
●● feel safe and protected
●● have a sense of belonging and being put first
●● have fun things to do and good food to eat
●● have independence and responsibility.
Feel safe and protected
‘I feel cared for properly and I feel like I fit in. I feel at home and I know it is safe where I am.’12- to 15-year-old
‘Staff can keep me safe and that I can speak to them about my thoughts and feelings that I have. I can also trust them.’ Child under age 11
74. A very large majority of children looked after were brought into care because the environment they were in was not safe, either because they were actively in danger of abuse or because neglect meant that their basic physical or psychological needs were persistently not being met. It is important we understand whether they feel safe when they have become looked after.
75. Ninety-two per cent of children in homes said they felt safe all of the time inside their home and 99% felt safe all or most of the time. What children told us about their experience of children’s homes was also positive, but there was a sizeable minority who did not always feel safe (34%) and a small but still important minority who didn’t feel safe most of the time (10%).
39www.gov.uk/ofsted
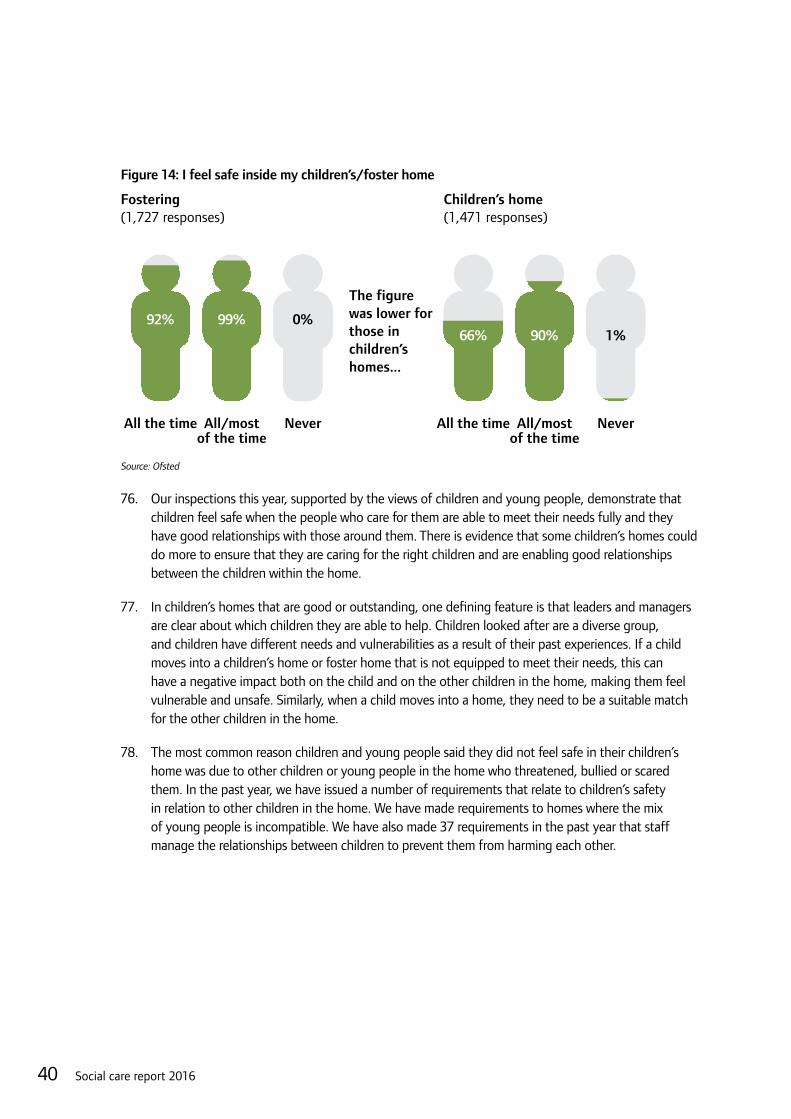
Figure 14: I feel safe inside my children’s/foster home
All the time All/mostof the time
Never All the time All/mostof the time
Never
92% 99% 0%66% 90% 1%
Fostering(1,727 responses)
Children’s home(1,471 responses)
The figurewas lower forthose inchildren’shomes...
Source: Ofsted
76. Our inspections this year, supported by the views of children and young people, demonstrate that children feel safe when the people who care for them are able to meet their needs fully and they have good relationships with those around them. There is evidence that some children’s homes could do more to ensure that they are caring for the right children and are enabling good relationships between the children within the home.
77. In children’s homes that are good or outstanding, one defining feature is that leaders and managers are clear about which children they are able to help. Children looked after are a diverse group, and children have different needs and vulnerabilities as a result of their past experiences. If a child moves into a children’s home or foster home that is not equipped to meet their needs, this can have a negative impact both on the child and on the other children in the home, making them feel vulnerable and unsafe. Similarly, when a child moves into a home, they need to be a suitable match for the other children in the home.
78. The most common reason children and young people said they did not feel safe in their children’s home was due to other children or young people in the home who threatened, bullied or scared them. In the past year, we have issued a number of requirements that relate to children’s safety in relation to other children in the home. We have made requirements to homes where the mix of young people is incompatible. We have also made 37 requirements in the past year that staff manage the relationships between children to prevent them from harming each other.
40 Social care report 2016

79. Nine per cent of children being fostered and 12% of children in children’s homes did not feel safe outside their home most of the time.42 One of the most unsafe situations for children in either a foster or children’s home is if they have gone missing.
80. In 2014–15, there was a 19% increase in the number of children (5,055) reported as missing from foster care, and nearly a third more missing incidents involving children in foster care. This may reflect improved reporting from previous years but this significant increase clearly demonstrates that the high risks associated with going missing are not restricted to children living in residential care. Data is also collected as part of our children’s home inspections and, although the data is experimental, children’s homes reported over 2,500 children going missing since their last full inspection during 2015–16.43
81. Our inspections this year found that, above all else, the most vital component for success in responding to children going missing was strong relationships between professionals, carers and children. Adults responsible for the care of children must be persistent, proactive and nurturing in responding to incidents of children going missing. Where practice seen on inspection was good, clear protocols for agencies were in place and followed consistently. When children went missing, adults were extremely proactive in trying to locate the young person in order to return them to the home quickly and ensure that they were safe. Detailed knowledge of the young person and their social networks meant, professionals and carers knew where to search and could be proactive in locating young people.
‘I am rarely missing here. Before I moved here, I used to be missing all the time.’
16-year-old to inspector on inspection
82. One of the areas of practice that some children’s homes should improve is the use of risk assessments for children at risk of going missing. Where risk assessments were done well, they were individualised and well monitored. As a result, staff were aware of what was likely to trigger a missing episode for each child and could mitigate these factors.
83. The most effective practice in local authorities showed excellent multi-agency communication, including with local police. There was no delay in young people having the opportunity to speak to an independent person on their return home and these interviews provided important information that influenced action taken to keep children safe. Children’s homes rely on being told the content of every return home interview, something that does not always occur.
42. ‘Social care questionnaires 2015: what children, young people and adults told Ofsted’, 2015, Ofsted; www.gov.uk/government/publications/social-care-questionnaires-2015-what-children-young-people-and-adults-told-ofsted.
43. Source: Ofsted.
41www.gov.uk/ofsted
Have a sense of belonging and being put first
‘I have lived here a long time and it is my home… Staff try really hard to help us and they do their best for us. They don’t give up on us.’ 16- to 17-year-old
‘They love and care for me all of the time and they are always there to help me with anything. They are very caring and I am accepted not just by my foster carers but the whole of the family. It is just like I am blood related to them except for obviously the social worker visits or LAC reviews that remind you that they are my foster parents and not my actual parents. I have been with my carers for 9 years and have been looked after with such love and care.’ 16- to 17-year-old
‘I know it isn’t my family home but I feel comfortable here like I can walk around in my pyjamas.’16- to 17-year-old
84. Sometimes, children can feel like they belong somewhere immediately. It is more likely that a sense of belonging takes time. For many children, their time prior to becoming looked after is very unstable. When care works well, it provides a stability that allows children to bond with the people who care for them and relax in the knowledge that the people who care for them are committed for the long term. The other factor that allows children to create bonds is continuity in their relationships. High turnover in the group of professionals working with a child undermines this ability, whether through a lack of continuity in the child’s social worker or frequent changes of staff in a children’s home. Sometimes, continuity is provided outside the bounds of the system: a placement may be classed as having ceased, but the child’s former carer may continue to offer support informally. The value of this connection cannot be underestimated.
85. While moving placement can be a positive choice for children in some cases, overall, the evidence shows a direct relationship between instability and the ability of children to achieve educationally. Children who move less often are much more likely to achieve educationally than children who experience excessive placement moves. Similarly, all children, including children looked after, can be negatively affected by moving school.44
44. ‘Between the cracks: Exploring in-year admissions in schools in England’, RSA Action and Research Centre, 2013; www.thersa.org/discover/publications-and-articles/reports/between-the-cracks.
42 Social care report 2016
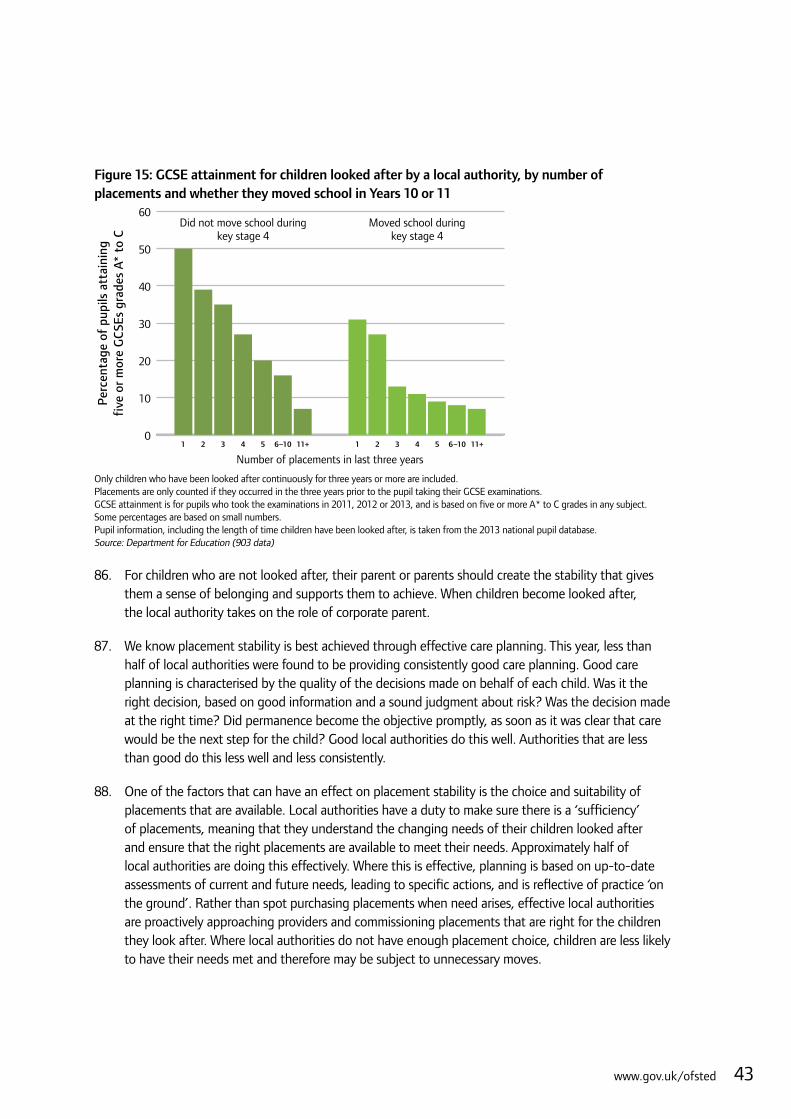
Figure 15: GCSE attainment for children looked after by a local authority, by number of placements and whether they moved school in Years 10 or 11
Per
cent
age
of p
upils
att
aini
ngfi
ve o
r m
ore
GC
SEs
grad
es A
* to
C
0
10
20
30
40
50
60Moved school during
key stage 4Did not move school during
key stage 4
Number of placements in last three years1 2 3 4 5 6–10 11+ 1 2 3 4 5 6–10 11+
Only children who have been looked after continuously for three years or more are included.Placements are only counted if they occurred in the three years prior to the pupil taking their GCSE examinations.GCSE attainment is for pupils who took the examinations in 2011, 2012 or 2013, and is based on five or more A* to C grades in any subject.Some percentages are based on small numbers.Pupil information, including the length of time children have been looked after, is taken from the 2013 national pupil database.Source: Department for Education (903 data)
86. For children who are not looked after, their parent or parents should create the stability that gives them a sense of belonging and supports them to achieve. When children become looked after, the local authority takes on the role of corporate parent.
87. We know placement stability is best achieved through effective care planning. This year, less than half of local authorities were found to be providing consistently good care planning. Good care planning is characterised by the quality of the decisions made on behalf of each child. Was it the right decision, based on good information and a sound judgment about risk? Was the decision made at the right time? Did permanence become the objective promptly, as soon as it was clear that care would be the next step for the child? Good local authorities do this well. Authorities that are less than good do this less well and less consistently.
88. One of the factors that can have an effect on placement stability is the choice and suitability of placements that are available. Local authorities have a duty to make sure there is a ‘sufficiency’ of placements, meaning that they understand the changing needs of their children looked after and ensure that the right placements are available to meet their needs. Approximately half of local authorities are doing this effectively. Where this is effective, planning is based on up-to-date assessments of current and future needs, leading to specific actions, and is reflective of practice ‘on the ground’. Rather than spot purchasing placements when need arises, effective local authorities are proactively approaching providers and commissioning placements that are right for the children they look after. Where local authorities do not have enough placement choice, children are less likely to have their needs met and therefore may be subject to unnecessary moves.
43www.gov.uk/ofsted

89. There are significant differences in the likelihood of children being subject to multiple moves before achieving permanence, depending on their age when they come into care and the route that is then considered for them.45 For those children where a children’s home becomes their long-term home, this raises a question of whether local authorities are considering children’s homes as a viable permanence option at an early enough stage.
Permanence outcome Percentage of children undergoing multiple placement moves before achieving permanence
Adoption 16%
Special guardianship order 9%
Long-term fostering 18%
Return home (younger cohort) 18%
Return home (older cohort) 39%
Residential care 50%
Residential care (disabled children) 14%
90. While individual children may have different experiences, there are patterns we can see in children’s journeys towards permanence depending on their age and the time they first enter care. For example, as children get older, they are increasingly less likely to be adopted or subject to a special guardianship order and are more likely to achieve permanence through long-term fostering, returning home or in a children’s home. Practitioners should understand the needs of each child and pursue the permanence option that will best meet those needs.
45. A child is considered to have had multiple moves if they have had three or more moves during their period being looked after.
44 Social care report 2016
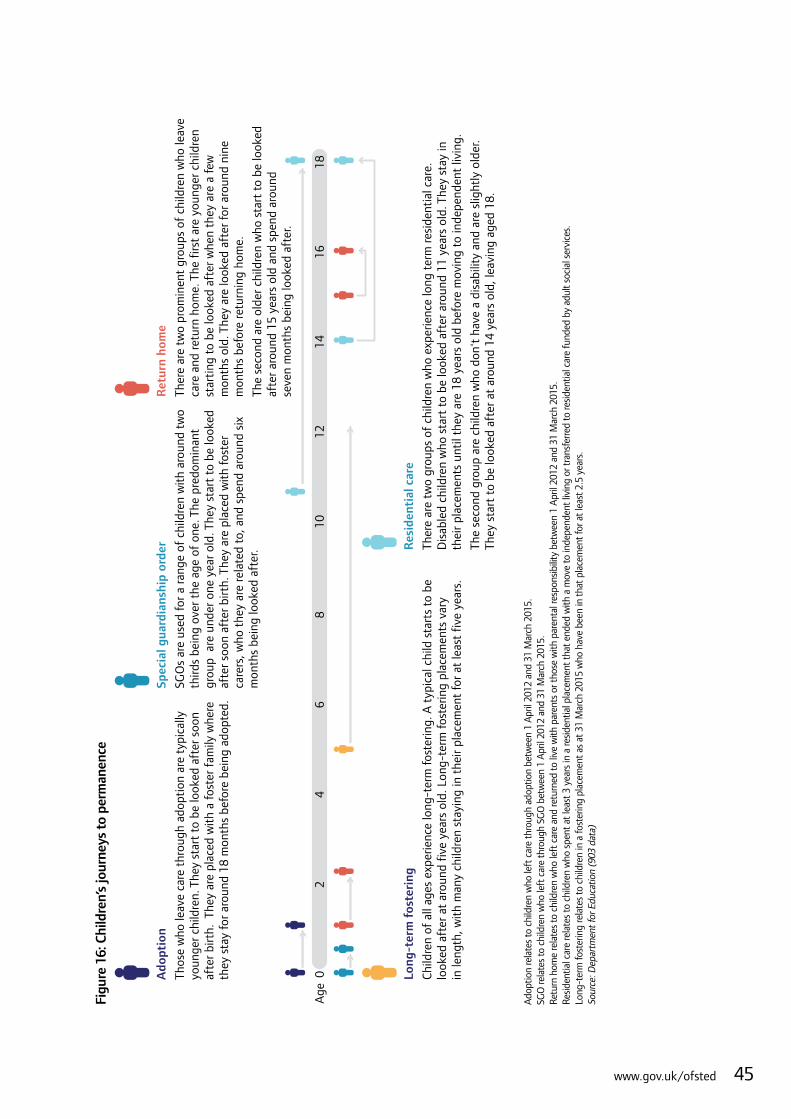
Figu
re 1
6: C
hild
ren’
s jo
urne
ys t
o pe
rman
ence
Ado
ptio
n
Thos
e w
ho le
ave
care
thr
ough
ado
ptio
n ar
e ty
pica
llyyo
unge
r ch
ildre
n. T
hey
star
t to
be
look
ed a
fter
soo
naf
ter
birt
h. T
hey
are
plac
ed w
ith
a fo
ster
fam
ily w
here
they
sta
y fo
r ar
ound
18
mon
ths
befo
re b
eing
ado
pted
.
Spec
ial g
uard
ians
hip
orde
r
SGO
s ar
e us
ed fo
r a
rang
e of
chi
ldre
n w
ith
arou
nd t
wo
third
s be
ing
over
the
age
of
one.
The
pre
dom
inan
tgr
oup
are
und
er o
ne y
ear
old.
The
y st
art
to b
e lo
oked
afte
r so
on a
fter
birt
h. T
hey
are
plac
ed w
ith
fost
erca
rers
, who
the
y ar
e re
late
d to
, and
spe
nd a
roun
d si
xm
onth
s be
ing
look
ed a
fter
.
Long
-ter
m f
oste
ring
Child
ren
of a
ll ag
es e
xper
ienc
e lo
ng-t
erm
fost
erin
g. A
typ
ical
chi
ld s
tart
s to
be
look
ed a
fter
at
arou
nd f
ive
year
s ol
d. L
ong-
term
fost
erin
g pl
acem
ents
var
yin
leng
th, w
ith
man
y ch
ildre
n st
ayin
g in
the
ir pl
acem
ent
for
at le
ast
five
year
s.
Res
iden
tial
car
e
Ther
e ar
e tw
o gr
oups
of
child
ren
who
exp
erie
nce
long
ter
m re
side
ntia
l car
e.D
isab
led
child
ren
who
sta
rt t
o be
look
ed a
fter
aro
und
11 y
ears
old
. The
y st
ay in
thei
r pl
acem
ents
unt
il th
ey a
re 1
8 ye
ars
old
befo
re m
ovin
g to
inde
pend
ent
livin
g.
The
seco
nd g
roup
are
chi
ldre
n w
ho d
on't
hav
e a
disa
bilit
y an
d ar
e sl
ight
ly o
lder
.Th
ey s
tart
to
be lo
oked
aft
er a
t ar
ound
14
year
s ol
d, le
avin
g ag
ed 1
8.
Age
02
46
810
1214
1618
Ret
urn
hom
e
Ther
e ar
e tw
o pr
omin
ent
grou
ps o
f ch
ildre
n w
ho le
ave
care
and
retu
rn h
ome.
The
firs
t ar
e yo
unge
r ch
ildre
nst
arti
ng t
o be
look
ed a
fter
whe
n th
ey a
re a
few
mon
ths
old.
The
y ar
e lo
oked
aft
er fo
r ar
ound
nin
em
onth
s be
fore
retu
rnin
g ho
me.
The
seco
nd a
re o
lder
chi
ldre
n w
ho s
tart
to
be lo
oked
afte
r ar
ound
15
year
s ol
d an
d sp
end
arou
ndse
ven
mon
ths
bein
g lo
oked
aft
er.
Ado
ptio
n re
late
s to
chi
ldre
n w
ho le
ft c
are
thro
ugh
adop
tion
betw
een
1 A
pril
2012
and
31
Mar
ch 2
015.
SGO
rela
tes
to c
hild
ren
who
left
car
e th
roug
h SG
O b
etw
een
1 A
pril
2012
and
31
Mar
ch 2
015.
Retu
rn h
ome
rela
tes
to c
hild
ren
who
left
car
e an
d re
turn
ed to
live
with
par
ents
or t
hose
with
par
enta
l res
pons
ibili
ty b
etw
een
1 A
pril
2012
and
31
Mar
ch 2
015.
Resid
entia
l car
e re
late
s to
chi
ldre
n w
ho s
pent
at l
east
3 y
ears
in a
resid
entia
l pla
cem
ent t
hat e
nded
with
a m
ove
to in
depe
nden
t liv
ing
or tr
ansf
erre
d to
resid
entia
l car
e fu
nded
by
adul
t soc
ial s
ervi
ces.
Long
-ter
m fo
ster
ing
rela
tes
to c
hild
ren
in a
fost
erin
g pl
acem
ent a
s at
31
Mar
ch 2
015
who
hav
e be
en in
that
pla
cem
ent f
or a
t lea
st 2
.5 y
ears
.So
urce
: Dep
artm
ent f
or E
duca
tion
(903
dat
a)
45www.gov.uk/ofsted

91. The fundamental characteristics of good leadership apply in all services and across all areas of practice. The best leaders and managers are reflective and promote effective, research-based practice. High-quality training is in place for carers, helping to increase children’s stability and sense of belonging. Matching is inclusive and family finding is persistent and effectively planned. Crucially, leaders provide strong oversight of practice and children’s progress, reducing delay and ensuring that timely, effective support is in place as long as it is needed. In the best local authorities and agencies, the recruitment of carers is based on accurate analysis of need, supported by good collaborative work with key partners across the sector.
Case studySecuring permanence through adoption is a high priority in Lincolnshire, with adoption considered very early in the planning process for all children. The local authority tracks effectively children’s plans, and there is purposeful drive to achieve timely outcomes for children to live with adopters.
There are excellent examples of potential links made between prospective adopters and children during their assessment, resulting in approvals and matches considered at the same panel. The number of children waiting longer than the expected timescale to be matched with adopters is very low and these children are closely monitored by senior managers to ensure that they do not experience drift and delay.
There is effective recruitment of adopters, with specific recruitment campaigns targeting adopters with the right skills, such as those able to care for brothers and sisters and older children. A family finder coordinator, who is integral to effectively monitoring and securing matches for children, actively supports close links with the East Midlands Consortium, voluntary adoption agencies and the National Adoption Register to progress timely wider searches for adopters for children. Social workers prepare excellent life story books for children placed for adoption.
92. Children and families can benefit from appropriate support, irrespective of the permanence option. Adoption support is typically where the best practice is observed on inspection. Where adoption support is effective, children and families do not experience delays in accessing or receiving help. For adopters, support equips them with theory and supportive strategies to respond effectively to the child. This reduces stress in relationships and supports stability. When it is in their interests, children are supported to retain contact with their families.
46 Social care report 2016

Case studyIn Brighton and Hove, the strong commitment and active engagement of senior leaders from a wide range of agencies has made a significant, positive difference to the quality and extent of adoption support.
A strategic steering group (including representatives from health, education, youth services, early years, early help, educational psychology, adoptive parents and voluntary agencies) has been central to building a culture of city-wide responsibility for adoption support rather than it being viewed as predominantly the concern and responsibility of the local authority adoption service.
The group has focused strongly on developing an ‘attachment-friendly’ Brighton and Hove, where professionals can identify and respond swiftly and appropriately to meet adopted children’s additional needs. The city’s approach is underpinned by a support framework that is easily accessible and available to adopted children, adoptive parents and prospective adopters.
An increasing number of adopters have benefited from attending a ‘safe base’ therapeutic, attachment-based parenting programme. Life story workshops for adopters focus on sensitive and timely support that helps children to build trusting and enduring attachments to their adoptive parents.
Specific attention has been paid to targeting educational support for adopted children, including effective promotion of the pupil premium, available to children with adoption support needs. Well-attended workshops to assist children’s transitions into primary and secondary schools offer an attachment-based alternative to the more traditional behaviour-based models of managing children’s difficulties at school.
The adoption support website offers comprehensive information, highlighting a range of services from early years to post-16 education, and is easily navigable. There are links for gay and lesbian adopters and minority ethnic adopters, which are particularly important in light of the broader diversity of adoptive parents in the city than elsewhere in England.
93. Work to help children looked after develop a sense of identity is important in helping children understand and make sense of their life histories. While we have seen some very good examples of excellent life story work, it is generally much more likely to be undertaken – and to be of high quality – for younger children, and especially so for those children whose plan is adoption.
Case studyIn Peterborough, the quality of life story work observed by inspectors was excellent. A dedicated life story worker, operating across both looked after teams, ensures that every child who has a plan for permanence has a carefully considered and well-crafted life story book. This enables children to develop an understanding of their history and the reasons for their permanent separation from their birth families, at a pace that suits them.
47www.gov.uk/ofsted

94. There is some evidence that the overall level of scrutiny and priority given to plans for children’s futures is not consistently strong across all permanence options. For example, our inspection evidence indicates that the typical quality of assessment and planning for support to children on special guardianship orders is weaker than it usually is for fostering and adoption. Overall, oversight of special guardianship practice, including monitoring by independent reviewing officers (IROs), lacks the necessary rigour. Our inspection findings are supported by the government’s recent review of practice around SGOs,46 which acknowledges improved performance but highlights the need for more robust assessments of potential special guardians, particularly around their capability to care for the child until adulthood.
Have fun things to do and good food to eat
‘We do fun stuff, we play good games. I feel safe, we bake cakes and biscuits, we get good food and are looked after well.’ Child under 11 years old
‘i like living with them because i now have two more Brothers, and a little dog. we go on lots of days out and holidays on an airoplane and a caravan. I go to Cubs and Basketball.’ 7- to 11-year-old child
95. For a significant proportion of children looked after who responded to our survey, what mattered most to them was the food they ate and the activities they did. Their responses are a reminder that children looked after have the same interests and priorities as any other children. Our surveys made clear that there were many children for whom becoming looked after meant experiencing things for the first time that other children may take for granted, such as being provided with regular, nutritious meals, having a pet or going on holiday.
96. One issue previously raised by groups within the sector47 is that many foster carers do not feel that the level of delegated authority they experience is sufficient to look after children effectively. This may mean that foster carers undergo lengthy and complex negotiations with local authorities to get permission for children to go on school trips or to stay overnight at their friend’s house. Inspectors have commented positively on the delegation of authority in 11 local authorities. For example, in Cheshire West and Chester, arrangements for delegated powers are clearly negotiated on a case-by-case basis and commensurate with children’s care plans, age and needs. As a result, children benefit from a more ‘normal’ experience, negotiating with carers in the same way their peers do with their families and sharing the same experiences. We have recommended improvements to the management of the delegation of authority in six local authorities.
46. ‘Special guardianship review’, Department for Education, 2015; www.gov.uk/government/consultations/special-guardianship-review.47. ‘Long-term foster care in England, Wales and Northern Ireland’, The Fostering Network, 2014 (subscription only);
www.thefosteringnetwork.org.uk/media-release/2014/strengthen-long-term-fostering-provide-stability-children-report-urges.
48 Social care report 2016

Have independence and responsibility as you leave care
‘My foster carers give me the ability to become independent and they support my autonomy at all points. …i have been able to mature and grow in my own way with the support and comforting words.’ 16- to 17-year-old
‘Staff listen to me and make me feel important…. I have learnt lots of independence skills which will help me when I’m older and leave care, I do my own washing and ironing and have learnt to cook some meals, I budget my money well as I like to save for designer clothes.’ 12- to 15-year-old
97. For any young person, the transition to adulthood and increasing independence can be difficult, but for children looked after, leaving care can be particularly daunting. Young people who do not receive the appropriate help and support can feel lonely and isolated, having lost the sense of belonging that their care has provided them with. In some areas, young people have told us they were not given enough help to get ready to leave care.
Figure 17: Staff/my foster carers help me to learn about the things I will need when I’m an adult
All the time All/mostof the time
Never All the time All/mostof the time
Never
73% 89% 2%64% 85% 3%
Children’s home(1,156 responses)
Fostering(839 responses)
Source: Ofsted
98. Around a third of local authorities have been judged to be providing good support overall for care leavers. In a larger group of authorities – the majority of inspections since April 2015 – inspectors have reported positively on local authorities’ work to keep in touch with care leavers. Approximately half of local authorities have been able to generate a good level of awareness among care leavers of their legal entitlements.
99. Some young people make a deliberate choice not to remain in contact with the local authority after leaving care. However, the proportion of care leavers up to the age of 21 who are not in contact with any local authority is currently at 13%. This represents 3,390 young people who are not receiving any support and whose current whereabouts and situation are completely unknown.48
48. Children looked after in England including adoption: 2014 to 2015, National tables: SFR34/2015, Tab F1, Department for Education, October 2015; www.gov.uk/government/statistics/children-looked-after-in-england-including-adoption-2014-to-2015.
49www.gov.uk/ofsted

100. While contact and awareness of legal entitlements is improving, what is not as strong is the preparation and planning local authorities do for children’s futures. Plans should map out a care leaver’s current and future needs in terms of health and development, education, training and employment, contact with parents, wider family and friends and support in managing their money. Planning for the future for children looked after and care leavers continues to be a serious weakness, with nearly two thirds of inspections having resulted in recommendations to improve the quality of pathway plans. Where plans are effective, they include clear, specific actions to drive progress for young people, are relevant to the individual young person and are updated and reviewed with rigour.
101. In 2015, 60% of all young people aged 19 to 21 in the UK were living with a parent or carer,49 compared with only 16% of care leavers aged 19 to 21 in England.50 Given this stark contrast, ensuring that young people are able to remain with their carers beyond the age of 18, where this is legally possible, is an important aspect of local authorities taking young people’s wishes and needs into account.
102. ‘Staying put’ opportunities are not yet consistently robust and nearly a quarter of local authorities should do more to provide such opportunities for care leavers. There were 1,790 young people aged 18 and still living with their foster carers in 2014–15 under ‘staying put’ arrangements. This was an increase of 2% from the previous year.51 Staying put is about providing greater care and support in foster care for those who need it during the transition to adulthood. All care leavers need access to the same level of care and support to enable them to make this transition well, in whatever way it is provided.
103. Where care leavers move into independent accommodation, there is a requirement that it be ‘suitable’. Eighty per cent of care leavers were in suitable accommodation. Whether ‘suitability’ is sufficiently well defined to meet a common-sense understanding of what is suitable has been questioned by the National Audit Office. In the best local authorities, there are productive partnerships with housing colleagues and a range of supported accommodation providers, and young people’s wishes are taken into account. In some local authorities, practice is unacceptably poor. In Sunderland, inspectors found that four care leavers were known to have been homeless in a single six-month period.
49. Office of National Statistics: Young adults living with their parents 1996-2015 available: www.ons.gov.uk/peoplepopulationandcommunity/birthsdeathsandmarriages/families/datasets/youngadultslivingwiththeirparents.
50. Department for Education statistics: Children looked after, including adoption as at 31 March 2015 available: www.gov.uk/government/statistics/children-looked-after-in-england-including-adoption-2014-to-2015.
51. ‘Fostering in England 1 April 2014 to 31 March 2015’, Ofsted, 2015; www.gov.uk/government/statistics/fostering-in-england-1-april-2014-to-31-march-2015.
50 Social care report 2016
Case studyIn Trafford, care leavers receive an exceptionally high-quality service from the local authority and partner agencies, which has been sustained over time and has delivered many benefits for care leavers. Care leavers are highly satisfied with the level of service they receive and engagement with care leavers is very good. Personal advisers and senior managers proactively engage with and listen to what young people say, and then act on it.
The service knows where all its care leavers are and has appropriate levels of contact with each individual based on their personal needs and pathway planning. A strong feature is the persistence and commitment of staff to support young people and get the best for them. Corporate parents have ensured that there are a wide range and choice of suitable accommodation options for young people at all stages of readiness for independence, with 100% of care leavers reporting that they feel safe and that they live in suitable accommodation. Multi-agency team working is completely embedded and the children looked after nurses provide good support and advice, information and signposting for young people post-16 and care leavers. Access to and intervention by child and adolescent mental health services (CAMHS) is good, with support going up to age 18.
Be healthy and happy
‘My main hope is that she is happy, healthy and fulfilled.’
‘I would like my children to be healthy and happy. I would like them to have a group of good friends. I would like them to have the confidence to pursue whatever they wish in their lives and be adaptable to change… I want them to know that they have a supportive family and a home with me whenever they need it. I’d like them to be independent, resilient and determined.’
Parents of school-age children 52
104. Children looked after and care leavers are much more likely to experience mental health difficulties than other children, with 37% being assessed as having a score for emotional well-being that gives cause for concern.53 However, our inspections have found that, when planning services, local authorities do not always take the mental health needs of children looked after and care leavers into account. The emotional well-being of children is not simply about ensuring specialist support for those who need access to CAMHS. It is about ensuring that all children have a positive sense of well-being that enables them to thrive at home and in school. All partners involved in caring for a child have an important role to play in providing this support.
52. We spoke to our Parents Panel, a virtual panel of parents of school-age children, to understand what they want for their children, most of whom are not children looked after. Their responses were not surprising: parents want their children to be healthy and happy, and make good progress in education so that they can go on to employment that suits them.
53. Children looked after in England including adoption: 2014 to 2015, National tables: SFR34/2015, Tab I5a, Department for Education, October 2015; www.gov.uk/government/statistics/children-looked-after-in-england-including-adoption-2014-to-2015.
51www.gov.uk/ofsted

105. Schools and virtual school headteachers should play a role in supporting the emotional well-being of children looked after. We have observed a number of examples where pupil premium funding has been used creatively to support children’s emotional well-being and, in doing so, promotes progress at school.
In Medway, pupil premium and additional funding were appropriately focused on enhancing the educational attainment of children looked after. Very specific help was provided to support the development of self-confidence and emotional and mental resilience through, for example, counselling, play therapy and additional music lessons. The head of the virtual school effectively oversaw the targeting of this resource.
106. For those children looked after who do need the specialist support of CAMHS, the quality and timeliness of health support continue to be problematic in many areas. Shortfalls in the availability of effective CAMHS were observed in one third of local authority areas, leading to excessive delays.
107. In those authorities that provide the strongest provision, there is a clear awareness of local needs and good planning. Referral pathways are clear. There is more likely to be swift access to services from specialist professionals who are, in some areas, part of integrated services for children looked after. Where the quality of pathway planning is high, inspectors have reported on effective multi-agency work to prioritise and respond to the mental health needs of care leavers.
108. Specialist help is often harder to access for children looked after living at distance from home. Delays in receiving CAMHS support have been attributed to lack of local capacity, poor liaison between different local authorities and clinical commissioning groups, as well as lengthy disputes about funding. The NSPCC has recommended54 that serious consideration should be given to establishing a national tariff for CAMHS assessments of children looked after so that charges are the same in all parts of the country.
109. Since the issuing of new guidance55 in March 2015 by the Department of Health, there has been no discernible trend of improvement. The move away in the guidance from the ‘tiered approach’, which is especially problematic for care leavers, and the flexibility about the age of transition for care leavers are both positive steps. Progress will depend, however, on how it is implemented in different areas. Ofsted will continue to review this issue, as well as the broader issue of the emotional well-being of children looked after. If warranted, we will consider making it a focus for in depth work in the future, for example through a joint targeted area inspection with our partner inspectorates.
54. ‘Achieving emotional wellbeing for looked after children – a whole-systems approach’, NSPCC, 2015; www.nspcc.org.uk/services-and-resources/research-and-resources/2015/achieving-emotional-wellbeing-looked-after-children-whole-system-approach.
55. ‘Future in mind: promoting, protecting and improving our children and young people’s mental health and wellbeing’, Department for Health, 2015; www.gov.uk/government/publications/improving-mental-health-services-for-young-people.
52 Social care report 2016

Progress in education and employment
‘I would hope they achieve their full potential at school and be fully supported and challenged to achieve their potential and goals.’
‘I would like my son to be a happy, well-rounded individual, with an interest in the world around him. Educationally, I would like him to have enjoyed school and possibly further or higher education, and to gained the skills, knowledge and confidence to pursue whatever life choices he wishes to make.’
‘My daughter is adopted from the UK care system. I am conscious that I want the opportunities and aspirations for her that she, and all children, deserve but which circumstances of birth could potentially have denied to her. All looked after children, adopted or in foster care, have additional needs. In my opinion, meeting these needs first is crucial to enabling them to enjoy and benefit from educational opportunities and parental aspirations.’
Parents of school-age children
110. A very high proportion of children looked after have special educational needs.56 In 2015, 61% of children looked after had a special educational need compared with 50% of children in need and 16% of all children.57 Forty per cent of children looked after attend provision outside the mainstream, whether a special school, pupil referral unit or alternative provision.58 For those with and without special educational needs, their past experiences often have an ongoing impact on their ability to focus on the business of learning. For many children, achieving emotional steadiness is an essential first step before they can learn. Education is not separate, therefore, from work to improve children’s emotional well-being.
111. In 2015, 14% of children in key stage 4 who had been looked after for one year or more achieved five GCSEs at grades A* to C, including English and mathematics.59 In Hackney, the proportion was nearly three times higher, at 34.6%, and has been consistently high over a number of years.60 This suggests that considerably more could be done nationally to enable these children to reach their full potential.
112. While more could be done while children are looked after, new evidence from research this year makes it clear that it is not being looked after that is the cause of educational underperformance. Comparing children looked after with children in need, rather than with all children, shows that the former make better progress at school. This is particularly true of children who are looked after for longer and for those who entered care earlier.61 Children looked after are also less likely to be absent from school and are less likely to be permanently excluded.
56. Children looked after continuously for at least 12 months.57. Outcomes for children looked after by LAs: 31 March 2015, Main text: SFR11/2016, Table 4a, Department for Education, March 2016;
www.gov.uk/government/statistics/outcomes-for-children-looked-after-by-las-31-march-2015.58. ‘Educational progress of looked after children’, The Rees Centre, 2015; http://reescentre.education.ox.ac.uk/research/educational-progress-
of-looked-after-children.59. Outcomes for children looked after by LAs: 31 March 2015, Main text: SFR11/2016, Table LA3, Department for Education, March 2016;
www.gov.uk/government/statistics/outcomes-for-children-looked-after-by-las-31-march-2015.60. Ibid.61. ‘Educational progress of looked after children’, The Rees Centre, 2015; http://reescentre.education.ox.ac.uk/research/educational-progress-
of-looked-after-children.
53www.gov.uk/ofsted

Figure 18: Expected level of progress for children looked after, children in need and non-children looked after
Making the expected level of progress in mathematics at key stage 4
0
10
20
30
40
50
60
70
80
2014/152013/142012/132011/122010/11
Children who are not looked after
Children looked after
Children in need
Children in need
Children looked after
Children who are not looked after
Per
cent
age
Outcomes for children looked after by LAs: 31 March 2015, Main tables: SFR11/2016, Table 3, Department for Education, March 2016; www.gov.uk/government/statistics/outcomes-for-children-looked-after-by-las-31-march-2015
Making the expected level of progress in English at key stage 4
0
10
20
30
40
50
60
70
80
2014/152013/142012/132011/122010/11
Children who are not looked after
Children looked after
Children in need
Children in need
Children looked after
Children who are not looked after
Per
cent
age
Outcomes for children looked after by LAs: 31 March 2015, Main tables: SFR11/2016, Table 3, Department for Education, March 2016; www.gov.uk/government/statistics/outcomes-for-children-looked-after-by-las-31-march-2015
54 Social care report 2016

113. Given their experiences prior to becoming looked after, it may take children looked after longer to complete their studies and achieve the GCSE benchmark. While there is data on the number of young people who achieve their GCSEs at the age of 19, it is not yet possible to identify the numbers of children looked after that this applies to.
114. The attainment of the GCSE benchmark by children looked after is rising, but only for those without special educational needs or disabilities. Robust oversight and challenge is needed to further improve the progress of all children looked after, including those with special educational needs or disabilities. Virtual school headteachers should be leading this oversight and challenge within local authorities. In a significant majority of the local authorities inspected under the single inspection this year, inspectors commented positively on the contribution of virtual school headteachers.
Figure 19: Percentage of children with five GCSEs A* to C, including English and mathematics, by special educational need and disabilities (SEN and disability)
0
10
20
30
40
2012/132011/122010/112009/10
Children looked after with no statement of SEN and disabilities
Children looked after with a Statemstatement of SEN and disabilities
All children with a statement of SEN and disabilities
Children looked after with a statement of SEN and disabilities
Children looked after with no statement of SEN and disabilities
All children with a statement of SEN and disabilities
Per
cent
age
Children looked after continuously for 12 months. GCSE and equivalent attainment by pupil characteristics: 2014; National and local authority tables: SFR06/2015, Table 2c, Department for Education, January 2015; www.gov.uk/government/statistics/gcse-and-equivalent-attainment-by-pupil-characteristics-2014Source: Department for Education (903 data)
115. Where practice is strong, virtual headteachers play an important role in improving attendance, preventing exclusions and improving the educational progress and attainment of children looked after. To achieve this, virtual headteachers have:
●● expected better than local rates of progress for each child every year
●● worked collaboratively with key partners, including schools, social workers and health professionals
●● tracked closely the educational progress of children looked after, which has led to appropriate, bespoke intervention and support where necessary
●● ensured that personal education plans (PEPs) are effective and driving improvement in attainment
●● used the pupil premium imaginatively to promote progress
●● supported carers and designated teachers, including providing training where necessary.
55www.gov.uk/ofsted

116. An area for improvement is the planning for children’s education, particularly the quality of PEPs, which was found to be inconsistent in nearly half of local authorities. Too often, PEPs were not up to date and lacked SMART (specific, measurable, achievable, relevant, time-bound) targets that supported learners to make good progress. Most importantly, plans were not consistently ambitious for children. Where PEPs were good, for example in Enfield, target setting accurately reflected the student’s individual needs and potential. The plans, which were also clearly informed by the child’s views, contributed to better achievement.
117. In the year ending March 2015, around 50% of care leavers aged between 19 and 21 were in education, employment and training compared with 85% of all children.62 In addition to the short- and long-term implications for the young person, there is a cost to the economy. The lifetime cost of all current 19-year-old care leavers not being in education, employment or training (NEET) would be around £240 million. Raising participation in education, employment and training for care leavers to the level of other 19-year-olds would add £150 million to the economy.63
118. Having a high proportion of care leavers who are NEET is not an inevitable by-product of their experiences: Seventy-eight per cent of care leavers in Salford are in education, employment or training, only seven percentage points below the national level for all young people.64 While parity with other young people whose lives were not affected by abuse or neglect may not be achievable for all children, it is entirely realistic to look for more local authorities to deliver to the level of the best.
Figure 20: Care leavers aged 19 to 21 by activity status 2014–15
Herefordshire
Sunderland
Stoke-on-Trent
England
Brighton and Hove
North Yorkshire
Salford
In education,employment ortraining (EET)
Not in education,employment ortraining (NEET)
Activity not known
78 22
60 39 1
59 38 3
48 39 13
32 53 15
25 20 55
16 5 79
Children looked after in England including adoption: 2014 to 2015, Local authority tables: SFR34/2015, Tab LAF1a/b/c, Department for Education, October 2015; www.gov.uk/government/statistics/children-looked-after-in-england-including-adoption-2014-to-2015
62. Children looked after in England including adoption: 2014 to 2015, National tables: SFR34/2015, Tab F1, Department for Education, October 2015; www.gov.uk/government/statistics/children-looked-after-in-england-including-adoption-2014-to-2015.
63. ‘Care leavers’ transition to adulthood’, National Audit Office, 2015; www.nao.org.uk/report/care-leavers-transitions-to-adulthood.64. Children looked after in England including adoption: 2014 to 2015, National tables: SFR34/2015, Tab F1, Department for Education,
October 2015; www.gov.uk/government/statistics/children-looked-after-in-england-including-adoption-2014-to-2015.
56 Social care report 2016
119. Five per cent of care leavers aged 19 were in higher education in 2013–14 compared with around 33% of all 19-year-olds.65 For care leavers in some local authorities, taking a place at university may mean that they lose the accommodation provided for them by the local authority. Not having somewhere to live outside of term time can act as a significant deterrent for a care leaver who might otherwise pursue at place at university.
120. Where local authorities are supporting care leavers in education, employment and training:
●● there are established partnerships across the local authority and beyond to provide training and employment opportunities
●● there is tenacious, ambitious multi-agency support, particularly for those young people who had long-standing difficulties in engaging with education, employment and training
●● there is robust monitoring of progress.
Leadership in children’s homes121. For very good reasons, children’s homes are not a visible part of the neighbourhoods they are
situated in. Unlike a school, nursery or doctor’s surgery, very few people will have ever visited one. As a result, public perception of what children’s homes are like may not match the reality. Most children’s homes are very small: 87% of all homes can accommodate between one and six children. Either three beds (20%) or four beds (21%) are the most common sizes for active homes. The distinction between a children’s home and a foster placement, in terms of the experience of the child, can sometimes be hard to make.
122. As homes are small, the relationships between children and the people who look after them are likely to be very personal. Most children’s homes only employ between seven and 12 staff, working on a rota basis providing round-the-clock, year-round care.66 It continues to be the case that some homes are not yet good due to the high turnover in managers and staff within the home. As we comment elsewhere in this report, stability is very important to all children, but particularly to children looked after who may be struggling with the impact of loss and turbulence throughout their childhood. In the period April 2014 to March 2016, 22% of children’s homes had a change of manager.67 The appointment of a new manager can be positive but change inevitably brings uncertainty and can be unsettling for children. Children’s homes inspected since June 2015, the period for which there is data, have had an average of 3.2 staff leave in the period prior to inspection.68
65. Children looked after in England including adoption: 2014 to 2015, National tables: SFR34/2015, Tab F1, Department for Education, October 2015; www.gov.uk/government/statistics/children-looked-after-in-england-including-adoption-2014-to-2015.
66. This excludes children’s homes that are secure or are residential special schools.67. Ofsted internal data.68. Ofsted data available, as part of the full inspection of children’s homes, only for the period June 2015 to March 2016.
57www.gov.uk/ofsted
123. Many children’s homes are operated by a larger organisation, which may be a local authority, health authority, charitable trust or private company. Apart from local authorities, Ofsted does not inspect these organisations, but the leadership they provide does contribute to the quality of the home. Good leaders and managers are clear about which children they are able to help, and practice is underpinned by what works well. Care planning is effective so that the needs of children and young people are met. Staff are supported through training and supervision. Leaders and managers have created a culture of high aspirations. They know the strengths and weaknesses of the home, are monitoring effectively and are continually looking for ways to improve the care provided.
124. Effective managers need to have the skills and knowledge to understand and meet the needs of the children they are caring for, as well as the skills needed to manage the home. By April 2017, all existing children’s home managers will need to have achieved, or be working towards, a level 5 diploma in Leadership for Residential Care or equivalent. In data compiled from the homes inspected between June 2015 and March 2016, only 53% of registered managers currently hold the necessary qualification.69
125. One of the most frequent requirements made on inspection relates to managers ensuring that they have enough staff with appropriate experience, skills and qualifications.70 As of April 2016, all care staff within children’s homes need to hold, or be working towards, a level 3 diploma or equivalent. The data from homes inspected between June 2015 and March 2016 shows that approximately 61% of the workforce hold this level of qualification.71
126. Some managers report that they find it difficult to recruit staff with the necessary qualities, experience and qualification to carry out the role effectively. Staff within the residential sector are paid on average only slightly above the minimum wage and the work has not historically been given status or sufficient regard. Successive attempts to improve this have not, to date, made enough impact.72
127. One of the reasons that the children’s homes sector has improved has been that much of the provision that was unacceptably poor is no longer operating. Of those homes found to be inadequate over the past year, 84% improved quickly and at their next inspection, usually within 16 weeks, they were found to require improvement to be good or better. A further 6% resigned in the two months following their inadequate judgement and one home was cancelled by Ofsted. As many as 50% of the homes that have resigned in the past year have done so following an inadequate judgement.
69. This data is collected from each children’s home at its inspection. The data does not take account of those working towards a qualification. Managers have two years to complete the qualification from the start of their employment as a manager. In some circumstances, the regulations allow for employers to give managers additional time to complete the qualification, for example if they work part time.
70. Providers regulated by Ofsted, including children’s homes, are required to meet regulations set by government. Where they fail to do so, Ofsted sets ‘requirements’ telling the provider explicitly which regulation they are not meeting and what they need to do to improve.
71. This data is collected from each children’s home at its inspection. The data does not take account of those working towards a qualification. Residential care workers have two years to complete the qualification from the start of their employment. In some circumstances, the regulations allow for employers to give residential care workers additional time to complete the qualification, for example, if they work part time.
72. ‘A census of the children’s homes workforce: research report’, Department for Education, 2015; www.gov.uk/government/publications/childrens-homes-workforce-census.
58 Social care report 2016

Inspection and the future128. Ofsted remains committed to using the power and influence of inspection to improve the lives of
children and young people, especially those who are disadvantaged and vulnerable. We continue to work with colleagues from across the social care sector to strengthen our inspections and ensure that inspection is focused where we can make the most difference.
129. This year, we have started a programme of joint targeted area inspections (JTAIs) carried out by Ofsted jointly with colleagues from the Care Quality Commission, Her Majesty’s Inspectorate of Constabulary and Her Majesty’s Inspectorate of Probation. In consultation with the sector, we developed JTAIs in response to a need identified by the ‘Munro review of child protection’73 and government’s ‘Tackling child sexual exploitation’ paper.74 JTAIs evaluate how effectively agencies from across a local authority work together to protect children and reflect the fact that effective joint working at all levels, across all partners, is essential.
130. JTAIs include a ‘deep dive’ investigation of children and young people’s experiences in relation to a particular topic. Our first theme for the inspections is child sexual exploitation and children missing from home, care or education. We are inspecting a total of five local areas before September. We have selected a balance of areas where we may have concerns and areas where we have information to suggest there is effective practice in place. We have now completed our first three JTAIs. Following the completion of inspections on a topic, a thematic overview report will be published on the findings, which will include evidence of effective practice for other areas to learn from. We have been consulting with the sector to ensure that we focus on the most important emerging concerns or issues of interest. Starting in September, our second theme for JTAIs will be domestic abuse.
131. This year, we have also started a new form of inspection jointly with the Care Quality Commission to see how effectively local areas are fulfilling their responsibilities for children and young people with special educational needs or disabilities. The inspections focus on how areas are working together to identify and meet needs.
132. We are now consulting on the development of a common inspection framework for the inspection of different social care settings.75 The aim of this work is to provide comparable and consistent reports across a wide range of settings that will ensure that inspections focus on the progress and experiences of children, wherever they live or receive help. It is proposed that the common inspection framework covers: children’s homes, including secure children’s homes; residential family centres; adoption support agencies; voluntary adoption agencies; independent fostering agencies; residential holiday schemes for disabled children; boarding schools; residential special schools; and residential provision in further education colleges.
73. ‘Munro review of child protection: final report – a child-centred system’, Department for Education, 2011; www.gov.uk/government/publications/munro-review-of-child-protection-final-report-a-child-centred-system.
74. ‘Tackling child sexual exploitation’, Home Office, 2015; www.gov.uk/government/publications/tackling-child-sexual-exploitation--2.75. ‘Future of social care inspection’, 2016, Ofsted; www.gov.uk/government/consultations/future-of-social-care-inspection.
59www.gov.uk/ofsted

133. Our consultation includes our plans for inspecting local authorities from 2018 onwards. We will complete the current programme of inspections of all local authorities under the single inspection framework by December 2017. The inspections will provide the most comprehensive baseline assessment of children’s services to date and will serve as an effective platform for the transition to a more proportionate inspection programme from 2018.76
134. We propose to continue with our arrangements for monitoring inadequate local authorities published in May 2016. For authorities that require improvement to be good, we will introduce a new inspection delivered over a shorter period than the four-week single inspection. Good and outstanding authorities will receive an inspection that is shorter still, in recognition of their good practice in delivering help, protection and care to children and evidence that they know and understand their service well. It is intended that these new inspections will be complemented by small modular inspections to help local authorities improve to good or better or maintain their good performance. We will continue our JTAIs in a sample of local authority areas so that we continue to highlight the importance of effective multi-agency arrangements to keep children safe. We are currently consulting on the principles of this new programme.77 We will work closely with the sector over the coming 18 months to ensure that frontline experience informs the arrangements and that these integrate effectively with sector-led self- and peer-assessment programmes.
76. Monitoring local authority children’s services judged inadequate: guidance for inspectors, Ofsted, www.gov.uk/government/publications/monitoring-local-authority-childrens-services-judged-inadequate-guidance-for-inspectors.
77. ‘Future of social care inspection’, 2016, Ofsted; www.gov.uk/government/consultations/future-of-social-care-inspection.
60 Social care report 2016
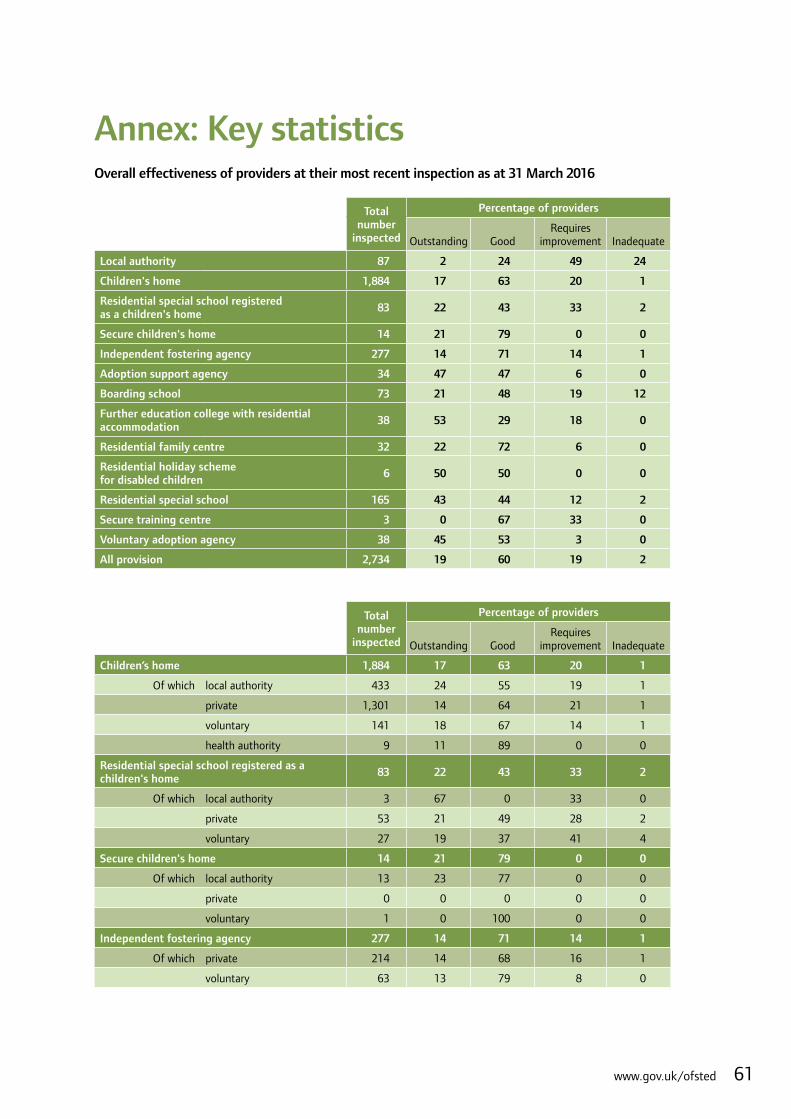
Annex: Key statisticsOverall effectiveness of providers at their most recent inspection as at 31 March 2016
Total number
inspected
Percentage of providers
Outstanding
Good
Requires improvement
Inadequate
Local authority 87 2 24 49 24
Children's home 1,884 17 63 20 1
Residential special school registered as a children's home 83 22 43 33 2
Secure children's home 14 21 79 0 0
Independent fostering agency 277 14 71 14 1
Adoption support agency 34 47 47 6 0
Boarding school 73 21 48 19 12
Further education college with residential accommodation 38 53 29 18 0
Residential family centre 32 22 72 6 0
Residential holiday scheme for disabled children 6 50 50 0 0
Residential special school 165 43 44 12 2
Secure training centre 3 0 67 33 0
Voluntary adoption agency 38 45 53 3 0
All provision 2,734 19 60 19 2
Total number
inspected
Percentage of providers
Outstanding
Good
Requires improvement
Inadequate
Children’s home 1,884 17 63 20 1
Of which local authority 433 24 55 19 1
private 1,301 14 64 21 1
voluntary 141 18 67 14 1
health authority 9 11 89 0 0
Residential special school registered as a children's home 83 22 43 33 2
Of which local authority 3 67 0 33 0
private 53 21 49 28 2
voluntary 27 19 37 41 4
Secure children's home 14 21 79 0 0
Of which local authority 13 23 77 0 0
private 0 0 0 0 0
voluntary 1 0 100 0 0
Independent fostering agency 277 14 71 14 1
Of which private 214 14 68 16 1
voluntary 63 13 79 8 0
61www.gov.uk/ofsted
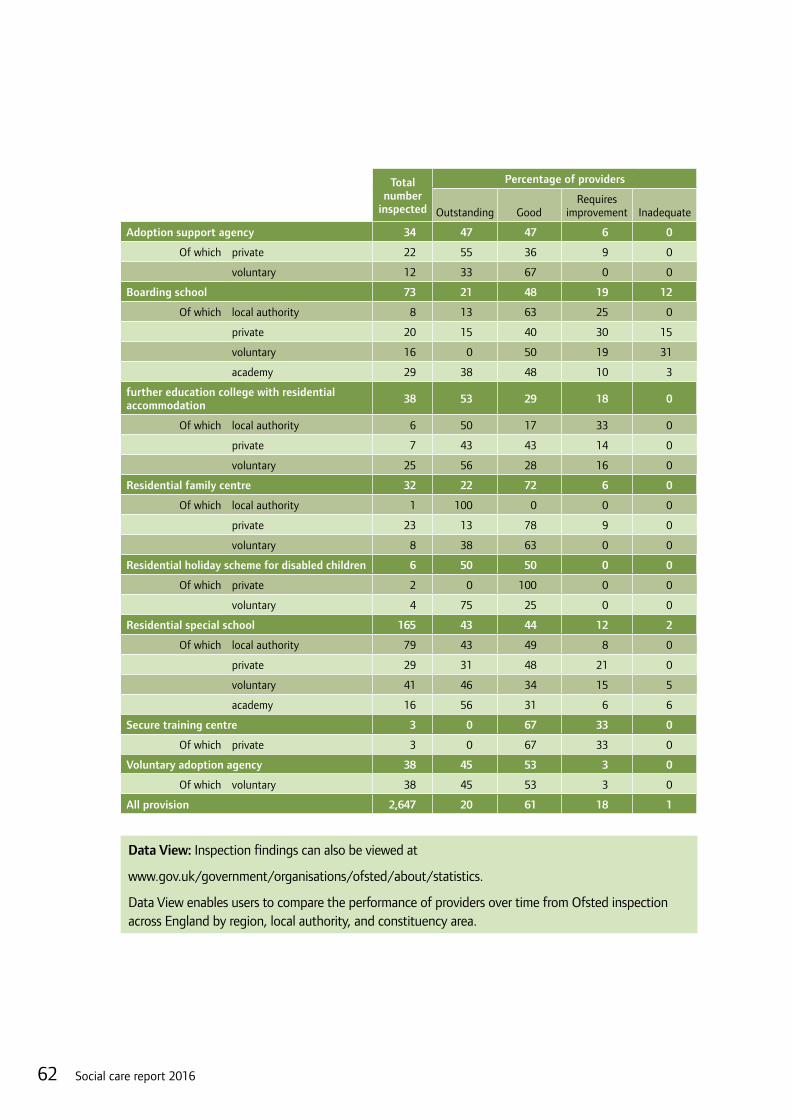
Total number
inspected
Percentage of providers
Outstanding
Good
Requires improvement
Inadequate
Adoption support agency 34 47 47 6 0
Of which private 22 55 36 9 0
voluntary 12 33 67 0 0
Boarding school 73 21 48 19 12
Of which local authority 8 13 63 25 0
private 20 15 40 30 15
voluntary 16 0 50 19 31
academy 29 38 48 10 3
further education college with residential accommodation 38 53 29 18 0
Of which local authority 6 50 17 33 0
private 7 43 43 14 0
voluntary 25 56 28 16 0
Residential family centre 32 22 72 6 0
Of which local authority 1 100 0 0 0
private 23 13 78 9 0
voluntary 8 38 63 0 0
Residential holiday scheme for disabled children 6 50 50 0 0
Of which private 2 0 100 0 0
voluntary 4 75 25 0 0
Residential special school 165 43 44 12 2
Of which local authority 79 43 49 8 0
private 29 31 48 21 0
voluntary 41 46 34 15 5
academy 16 56 31 6 6
Secure training centre 3 0 67 33 0
Of which private 3 0 67 33 0
Voluntary adoption agency 38 45 53 3 0
Of which voluntary 38 45 53 3 0
All provision 2,647 20 61 18 1
Data View: Inspection findings can also be viewed at
www.gov.uk/government/organisations/ofsted/about/statistics.
Data View enables users to compare the performance of providers over time from Ofsted inspection across England by region, local authority, and constituency area.
62 Social care report 2016

Overall effectiveness of providers inspected between 1 October 2014 and 31 March 2016 and local authorities inspected between 1 January 2015 and 31 March 2016
Total number
inspected
Percentage of providers
Outstanding
Good
Requires improvement
Inadequate
Local authority 51 4 24 43 29
Children's home 3,119 16 57 21 6
Residential special school registered as a children's home 144 19 43 26 13
Secure children's home 20 15 75 10 0
Independent fostering agency 189 15 68 13 4
Adoption support agency 27 48 48 4 0
Boarding school 33 21 42 27 9
Further education college with residential accommodation 17 53 24 24 0
Residential family centre 23 17 74 9 0
Residential holiday scheme for disabled children 8 38 63 0 0
Residential special school 296 43 43 11 3
Secure training centre 3 0 33 33 33
Voluntary adoption agency 27 41 52 7 0
All provision 3,957 18 56 20 6
Total number
inspected
Percentage of providers
Outstanding
Good
Requires improvement
Inadequate
Children’s home 3,119 16 57 21 6
Of which local authority 745 23 52 19 6
private 2,135 13 59 22 6
voluntary 224 16 59 21 3
health authority 15 7 87 7 0
Residential special school registered as a children's home 144 19 43 26 13
Of which local authority 5 40 20 20 20
private 89 19 49 25 7
voluntary 50 16 34 28 22
Secure children's home 20 15 75 10 0
Of which local authority 17 18 76 6 0
private 0 0 0 0 0
voluntary 3 0 67 33 0
Independent fostering agency 189 15 68 13 4
Of which private 144 15 65 15 5
voluntary 45 16 76 7 2
63www.gov.uk/ofsted
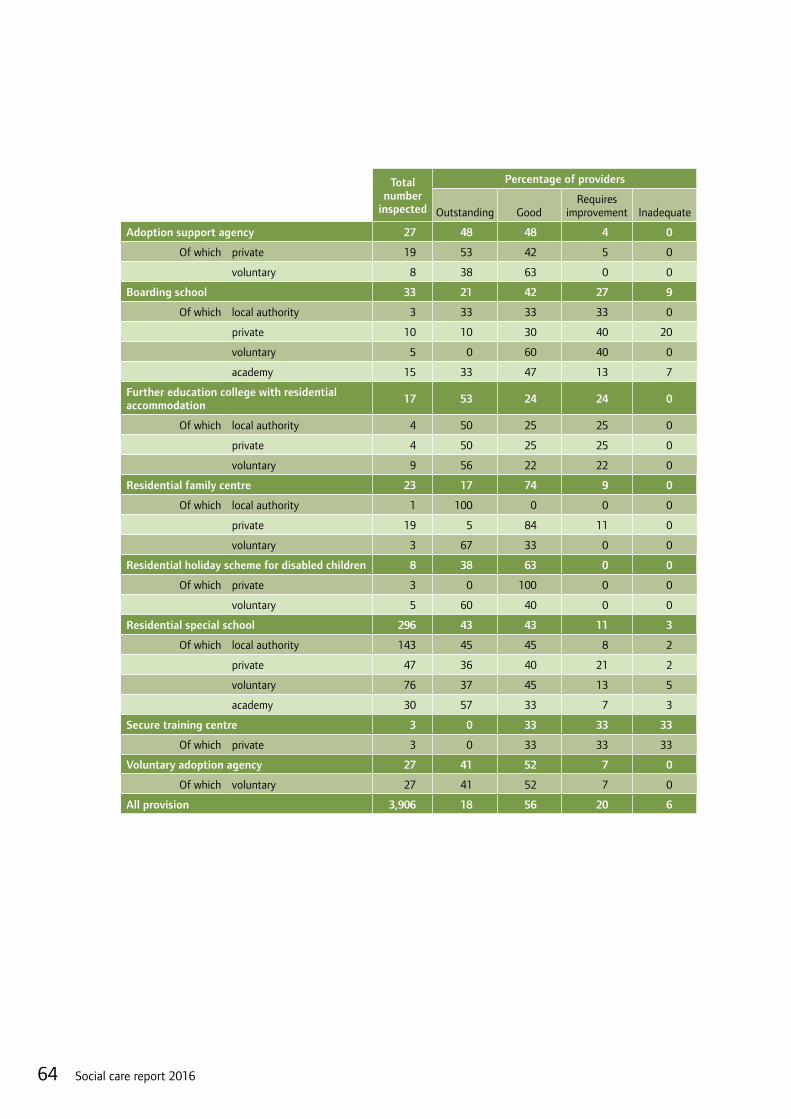
Total number
inspected
Percentage of providers
Outstanding
Good
Requires improvement
Inadequate
Adoption support agency 27 48 48 4 0
Of which private 19 53 42 5 0
voluntary 8 38 63 0 0
Boarding school 33 21 42 27 9
Of which local authority 3 33 33 33 0
private 10 10 30 40 20
voluntary 5 0 60 40 0
academy 15 33 47 13 7
Further education college with residential accommodation 17 53 24 24 0
Of which local authority 4 50 25 25 0
private 4 50 25 25 0
voluntary 9 56 22 22 0
Residential family centre 23 17 74 9 0
Of which local authority 1 100 0 0 0
private 19 5 84 11 0
voluntary 3 67 33 0 0
Residential holiday scheme for disabled children 8 38 63 0 0
Of which private 3 0 100 0 0
voluntary 5 60 40 0 0
Residential special school 296 43 43 11 3
Of which local authority 143 45 45 8 2
private 47 36 40 21 2
voluntary 76 37 45 13 5
academy 30 57 33 7 3
Secure training centre 3 0 33 33 33
Of which private 3 0 33 33 33
Voluntary adoption agency 27 41 52 7 0
Of which voluntary 27 41 52 7 0
All provision 3,906 18 56 20 6
64 Social care report 2016

BibliographySocial care‘Social care questionnaires 2015: what children, young people and adults told Ofsted’, Ofsted, 2015; www.gov.uk/government/publications/social-care-questionnaires-2015-what-children-young-people-and-adults-told-ofsted
‘The quality of assessment for children in need of help’, Ofsted, 2015; www.gov.uk/government/publications/children-in-need-and-child-protection-quality-of-early-help-and-social-work-assessments
‘Early help: whose responsibility?’, Ofsted, 2015; www.gov.uk/government/publications/early-help-whose-responsibility
‘Joining the dots… Effective leadership of children’s services’, Ofsted, 2015; www.gov.uk/government/publications/effective-leadership-of-childrens-services-joining-the-dots
‘The sexual exploitation of children: it couldn’t happen here, could it?’, Ofsted, 2014; www.gov.uk/government/publications/sexual-exploitation-of-children-ofsted-thematic-report
‘Protecting disabled children: thematic inspection’, Ofsted, 2012; www.gov.uk/government/publications/protecting-disabled-children-thematic-inspection
‘Ages of concern: learning lessons from serious case reviews’, Ofsted, 2011; www.gov.uk/government/publications/learning-lessons-from-serious-case-reviews
‘The voice of the child: learning lessons from serious case reviews’, Ofsted, 2011; www.gov.uk/government/publications/listening-to-children-in-serious-case-reviews
Education‘Welfare and duty of care in Armed Forces initial training’, Ofsted, 2016; www.gov.uk/government/publications/welfare-and-duty-of-care-in-armed-forces-initial-training-2016
‘Moving forward?: How well the education and skills sector is preparing young people with high needs for adult life’, Ofsted, 2016; www.gov.uk/government/publications/preparing-learners-with-high-needs-for-adult-life
‘Alternative provision: the findings from Ofsted’s three-year survey of schools’ use of off-site alternative provision’, Ofsted, 2016; www.gov.uk/government/publications/alternative-school-provision-findings-of-a-three-year-survey
‘Apprenticeships: developing skills for future prosperity’, Ofsted, 2015; www.gov.uk/government/publications/apprenticeships-developing-skills-for-future-prosperity
‘Key stage 3: the wasted years?’, Ofsted, 2015; www.gov.uk/government/publications/key-stage-3-the-wasted-years
65www.gov.uk/ofsted

The Office for Standards in Education, Children’s Services and Skills (Ofsted) regulates and inspects to achieve excellence in the care of children and young people, and in education and skills for learners of all ages. It regulates and inspects childcare and children’s social care, and inspects the Children and Family Court Advisory and Support Service (Cafcass), schools, colleges, initial teacher training, further education and skills, adult and community learning, and education and training in prisons and other secure establishments. It assesses council children’s services, and inspects services for children looked after, safeguarding and child protection.
If you would like a copy of this document in a different format, such as large print or Braille, please telephone 0300 123 1231, or email [email protected].
You may reuse this information (not including logos) free of charge in any format or medium, under the terms of the Open Government Licence. To view this licence, visit www.nationalarchives.gov.uk/doc/open-government-licence, write to the Information Policy Team, The National Archives, Kew, London TW9 4DU, or email: [email protected].
This publication is available at www.gov.uk/government/organisations/ofsted.
Interested in our work? You can subscribe to our monthly newsletter for more information and updates: http://eepurl.com/iTrDn.
Piccadilly Gate Store Street Manchester M1 2WD
T: 0300 123 1231 Textphone: 0161 618 8524 E: [email protected] W: www.gov.uk/ofsted
No. 160037
© Crown copyright 2016