the report states - stecf - european commission · advanced copy pending sec number commission...
TRANSCRIPT
ADVANCED COPY pending SEC number
COMMISSION STAFF WORKING PAPER
23rd REPORT OF THE SCIENTIFIC, TECHNICAL AND ECONOMIC
COMMITTEE FOR FISHERIES (Second Plenary Meeting)
Barza d’Ispra, 6-10 November 2006
This report does not necessarily reflect the view of the European Commission and in no way anticipates the Commission’s future policy in this area

1
CONTENTS
1 INTRODUCTION................................................................................................1
2 LIST OF PARTICIPANTS....................................................................................2
3 TERMS OF REFERENCE....................................................................................3 3.1 INITIAL TERMS OF REFERENCE................................................................................ 3
3.1.1 Information From The Commission And 2007 Planning................................... 3 3.1.2 Fisheries Conservation..................................................................................... 3 3.1.3 Fisheries Economics......................................................................................... 4 3.1.4 DATA COLLECTION REGULATION................................................................... 4
3.2 ADDITIONAL TERMS OF REFERENCE......................................................................... 5 3.2.1 Hake Northern stock: .......................................................................................5 3.2.2 Hake Southern stock ( VIIIc and IXa): .............................................................. 5 3.2.3 Anchovy in Bay of Biscay (Subarea VIII): ........................................................ 5 3.2.4 Anglerfish (Div. VIIIc IXa): ................................................................................ 5 3.2.5 North Sea cod (ICES areas IV, VIId and IIIa):................................................... 6 3.2.6 Norway lobster (ICES areas IV, VI and VIIa):................................................... 6 3.2.7 Whitefish selectivity in the Norway lobster fishery:......................................... 6 3.2.8 Long term management of Haddock in the North Sea: .................................... 6 3.2.9 Celtic Sea herring (Division VIIj) ....................................................................... 6 3.2.10 North Sea plaice: .............................................................................................. 6 3.2.11 Grey seal diet composition and fish consumption in the North Sea:................ 7 3.2.12 Deep sea stocks: .............................................................................................. 7 3.2.13 Norway lobster in Bay of Biscay-Division VIII a,b (Nephrops Area N): ............ 7 3.2.14 Celtic sea cod (Division VIIe-k): ........................................................................ 7 3.2.15 Irish sea sole:................................................................................................... 8 3.2.16 Herring in Divisions VI a(South) and VIIb,c:..................................................... 8 3.2.17 Fishing effort regime in the North Sea cod recovery plan:................................ 8
4 INFORMATION FROM THE COMMISSION AND 2007 PLANNING .........................9 4.1 APPOINTMENT OF NEW STECF................................................................................ 9 4.2 RULES OF PROCEDURE ........................................................................................ 10
4.2.1 Voting .............................................................................................................10 4.2.2 Independence.................................................................................................10 4.2.3 Stakeholders ..................................................................................................10 4.2.4 Subgroups ......................................................................................................10 4.2.5 Data ...............................................................................................................11 4.2.6 Next Step........................................................................................................11
5 CONSERVATION ISSUES .................................................................................12 5.1 REVIEW OF SCIENTIFIC ADVICE ............................................................................. 12
5.1.1 STECF sub-group for stock reviews ...............................................................12 5.1.2 STECF opinion................................................................................................12
5.2 SPECIFIC STOCKS AND FISHERIES.......................................................................... 12 5.2.1 Anglerfish (Div. VIIIc IXa) ...............................................................................12 5.2.2 Celtic Sea Herring ..........................................................................................14 5.2.3 North Sea cod (ICES areas IV, VIId and IIIa)..................................................23 5.2.4 Celtic sea cod .................................................................................................26 5.2.5 cod catches in 70-99mm trawlers operating in the Eastern Channel ............27 5.2.6 Deep sea fisheries..........................................................................................28 5.2.7 Long term management of haddock in the North Sea ....................................30 5.2.8 Hake Northern stock: .....................................................................................30 5.2.9 Hake Southern stock (VIIIc and IXa) ..............................................................31 5.2.10 Herring VIa south and VIIbc...........................................................................31 5.2.11 Irish Sea sole..................................................................................................32 5.2.12 North Sea plaice: ............................................................................................33 5.2.13 Norway lobster (ICES areas IV,VI and VIIa)...................................................44 5.2.14 Norway lobster in Bay of Biscay-Division VIII a,b (Nephrops Area N): ..........50

5.2.15 Whitefish selectivity in the Norway lobster fishery........................................51
5.3 FISHING EFFORT MANAGEMENT ............................................................................. 54 5.3.1 Background....................................................................................................54 5.3.2 STECF opinion................................................................................................54
5.4 GREY SEAL DIET COMPOSITION AND FISH CONSUMPTION IN THE NORTH SEA ................. 57 5.5 ELECTRIC PULSE TRAWLING .................................................................................. 58 5.6 MIXED FISHERIES ............................................................................................... 59
5.6.1 Background....................................................................................................59 5.6.2 STECF opinion................................................................................................60
5.7 DEEP SEA GILLNET ............................................................................................. 62 5.7.1 STECF recommendations ...............................................................................62
5.8 DISCARDS FROM COMMUNITY VESSELS .................................................................. 65 6 FISHERIES ECONOMICS .................................................................................67
6.1 PROCESSING OF ECONOMIC DATA .......................................................................... 67 6.1.1 Evaluation of latest call for economic data ....................................................67 6.1.2 STECF recommendations ...............................................................................67
6.2 FUTURE UTILISATION OF ECONOMIC DATA................................................................ 68 6.2.1 Annual Economic Report (AER) ......................................................................68 6.2.2 Economic Interpretation of ACFM Advice (EIAA) ............................................69
6.3 CURRENT ECONOMIC STATUS OF EU FLEETS ........................................................... 70 6.4 WORK PROGRAMME 2007 .................................................................................... 71
7 INTEGRATED ANALYSES ................................................................................73 7.1 MATCHING FLEET CAPACITY TO FISHING OPPORTUNITIES............................................. 73
7.1.1 Background....................................................................................................73 7.1.2 STECF Comments and Recommendations.....................................................73
7.2 IMPACT ASSESSMENT OF LONG-TERM MANAGEMENT PLANS FOR SOLE AND PLAICE ......... 75 7.2.1 Terms of reference..........................................................................................75 7.2.2 STECF COMMENTS........................................................................................76 7.2.3 Conclusions and Recommendations ..............................................................76
7.3 BAY OF BISCAY ANCHOVY .................................................................................... 78 7.3.1 Catch levels for recovery of stock...................................................................78 7.3.2 Economic effects of fishery closure ................................................................78 7.3.3 STECF Recommendation................................................................................78
8 IMPLEMENTATION AND REVISION OF DATA COLLECTION REGULATION ........79 8.1 EVALUATION OF 2005 NATIONAL DATA COLLECTION PROGRAMS.................................. 79 8.2 REVISION OF THE DATA COLLECTION REGULATION TO TAKE INTO ACCOUNT THE ECOSYSTEM APPROACH..................................................................................................................... 80
8.2.1 Stecf Comments And Recommendations........................................................82 9 OTHER MATTERS...........................................................................................84
9.1 STECF PARTICIPATION IN WORKING GROUP MEETINGS OF THE ACFA......................... 84 9.2 COMMENTS ON RECENTLY PUBLISHED HEADLINE ARTICLES ........................................ 84 9.3 MEETINGS IN 2007............................................................................................. 85
ANNEX 1 ECONOMIC ANALYSIS OF THE FRENCH ANCHOVY FISHIERS IN THE BAY OF BISCAY. ...........................................................................................................87
ANNEX 2 THE SELECTIVE PERFORMANCE OF A 95MM CODEND WITH A 120MM SQUARE MESH PANEL IN THE NORTH SEA MIXED NEPHROPS/WHITEFISH TRAWL FISHERY ...............................................................................................................88
ANNEX 3 A REPORT OF TRIALS UNDERTAKEN WITH THE SWEDISH GRID AND SQUARE MESH CODEND IN THE ENGLISH (FARN DEEPS) NEPHROPS FISHERY DURING WINTER 2005/06 .....................................................................................89
ANNEX 4 SELECTIVE PROPERTIES OF THE CUTAWAY TRAWL AND SEVERAL OTHER COMMERCIAL TRAWLS USED IN THE FARNE DEEPS NORTH SEA NEPHROPS FISHERY ...............................................................................................................90

ANNEX 5 REDUCING DISCARDS (PART B): A REPORT ON RECENT WORK WITH FISHERS TO IMPROVE THE EFFICACY OF SQUARE MESH PANELS IN THE FARN DEEPS NEPHROPS FISHERY, NORTH SEA..............................................................91
ANNEX 6 TECHNICAL CONSERVATION AND THE IRISH SEA NEPHROPS FISHERIES.............................................................................................................................92
ANNEX 7 CALCULATIONS OF HARVEST RATIO BASED ON ACFM APPROACH USING LANDINGS /...........................................................................................................93
ANNEX 8 SCIENCE BEHIND INCENTIVISING WHITEFISH SELECTIVITY IN SMALL MESHED FISHERIES IN COD RECOVERY ZONE – REVISED ESTIMATES BASED ON OCT 2006 SELECTIVITY DATA...............................................................................94
ANNEX 9 HARVEST RATES FOR NEPHROPS ..........................................................95

1
1 INTRODUCTION
STECF met at the Casa Don Guanella in Barza d’Ispra (Italy) from 6 to 10 November 2006.
The Chairman of the STECF, Dr John Casey, opened the plenary session at 15:30. The terms of reference for the meeting were reviewed and the meeting agenda
agreed. The session was managed through alternation of Plenary and working group meetings.
The meeting closed at 18:00h on 10 November.

2
2 LIST OF PARTICIPANTS
Members of the STECF:
Bertignac, Michel (Rapporteur) Cardinale, Massimiliano (Rapporteur) Casey, John (Chairman & rapportuer)) Di Natale, Antonio (Vice chairman) Farina, Antonio Celso (Rapporteur) Gustavvson, Tore (Vice chairman) Van Hoof, Luc Kuikka, Sakari Lokkegaard, Jørgen Messina, Gaetano Munch-Petersen Sten (Rapporteur) Perraudeau, Yves (Rapporteur) Petrakis, George Raetz, Hans-Joachim (Rapporteur) Somarakis, Stylianos (Rapporteur) Vanhee, Willy (Rapporteur) Van Hoof, Luc Virtanen, Jarno (Rapporteur) Invited experts
Joel Vigneau (Rapporteur) Maurice Clark (Rapporteur) Sarah Kraak (Rapporteur) Gerjan Piet (Rapporteur) Nick Bailey (Rapporteur) Jesper Anderson (Rapporteur) Kuzebski, Emil
European Commission DG-FISHERIES AND MARITIME AFFAIRS
Biagi, Franco Lindebo, Erik
European Commission DG-JOINT RESEARCH CENTRE (JRC)
Doerner, Hendrik Hoelker, Franz

3
3 TERMS OF REFERENCE
The terms of reference included both issues that had been prepared a month in advance and those more urgent matters that were announced shortly before the meeting.
3.1 INITIAL TERMS OF REFERENCE
3.1.1 Information From The Commission And 2007 Planning
The Commission will inform STECF of progress on issues concerning the framework for scientific advice in 2007 and afterwards. The issues concerned will include:
1. nomination of new STECF
2. mandate for the STECF November 2006 – November 2007: tasks, organisation, subgroup coordinators, planning 2006/2007.
3. Rules of procedures of the STECF
3.1.2 Fisheries Conservation
3.1.2.1 review the scientific advice on stocks of Community interest Based on the report prepared during the SGRST-SGECA meeting of October 23-27, STECF should update the stock status report prepared in November 2005 using the most recent scientific information. The STECF should take into account the most recent scientific advice from the ICES-ACFM and scientific committees of relevant Regional Fisheries Organizations as well scientific papers published in peer-review journals if considered adequate for the completion of the advice.
3.1.2.2 electric pulse trawling Point 14 of Annex III of the Council Regulation (EC) No 51/2006, fixing the fishing opportunities for 2006, indicates that the use of beam trawl using electrical current shall be allowed under conditions established by the Commission in the light of advice from STECF. The Commission requested a preliminary advice to ICES.
STECF is requested to evaluate and comment as adequate the ICES advice on pulse trawl electric fishing underlining the possible short and long-term biological and economic consequences of using this fishing method and, in particular, whether its use would be
1. compatible with a sustainable exploitation of the target resources as well as with environmental conservation concerns ( both no-target species and bottom communities), and
2. economically feasible from both a fisheries and an individual vessel perspective.
STECF is also requested to identify the conditions for a fishery monitoring system with a view to collect possible missing information.
3.1.2.3 Mixed fisheries and fishing effort regime in recovery and management plans
STECF should deliver an opinion based on the work done by subgroup SGRST-06-01/04/05 (13-17 March, 5-9 June, 9-13 October 2006) which compiled recent data on demersal mixed fisheries, identified stocks, areas and fleets where there are significant mixed catches. The reports on management of fishing effort and on mixed fisheries are on:

Page 4 STECF plenary meeting November 2006
3.1.2.4 Sustainable balance between fishing capacity and fishing opportunities Each Member State shall submit its annual report on its efforts during the year 2005 to achieve a sustainable balance between fishing capacity and fishing opportunities to the Commission by 30 April 2006. The Commission, on the basis of the data in the Community Fleet Register and information contained in the Member States’ annual reports, shall prepare a summary annual report and present it to the Scientific Technical and Economic Committee for Fisheries and to the Committee for Fisheries and Aquaculture. The STECF should comment on this report.
3.1.2.5 Deep Sea Gillnet Fisheries STECF should deliver an opinion based on the work done by subgroup ADHOC-06-03 (11-14 July).The deepwater gillnet fisheries that take place in Europe were identified. Fisheries catching the following species were considered; hake, monkfish, deepwater sharks and deepwater crabs. The fisheries were defined according to gear characteristics, spatial and bathymetric distributions. The available information on each fishery is presented. Available information on selectivity and soak time experiments are presented. All relevant legislation is summarised and the management measures relevant to each fishery, presented in each case. The report contains recommendations on how these fisheries should be managed.
3.1.2.6 Plaice and sole long-term management (impact assessment) The SCEGA-SGRST-06-05 subgroup (26-29 September) was requested to asses the impact of the Commission’s proposal for a Council Regulation “establishing a management plan for fisheries exploiting stocks of plaice and sole in the North Sea” . A second meeting may take place before the STECF November plenary. STECF should deliver an opinion based on the work of the subgroup.
3.1.2.7 discarding in EU. The Commission is in an intensive process of considering the options regarding a policy on discards and the Commissioner intends to make Communication on the issue soon. In order to have a more informed basis for the preparation of the communication and the consultations involved STECF was asked to provide an overview of the extent, character and causes of the problem. A data call wass issued through the Data Collection Regulation and the STECF's subgroup for research needs met on 9-12 October 2006 to analyse it. Their report is on:
3.1.3 Fisheries Economics STECF should deliver an opinion based on the outcome of the subgroup for economic affairs (SGECA)'s SGECA-06-02/04 meetings of May 15-18 and October 23-27. In particular they should
1. review the conclusions on the economic performance of EU fishing fleets, 2. determine whether SGECA's proposals for updating the assessment early in
2007 as more data becomes available. 3. review SGECA's proposal for producing an assessment in subsequent years.
3.1.4 DATA COLLECTION REGULATION
3.1.4.1 revision of the Data Collection Regulation to take into account the ecosystem approach
STECF should deliver an opinion based on the work done by subgroup SGRN-06-01(19-23 June) which followed the previous SGRN in the recommendation that two types of indicator are needed to support the environmental integration process, indicators of the state of the marine environment and indicators of the pressure that affects state. The aim was to select those indicators for which there is sufficient scientific justification and that can be quantified based on existing monitoring programmes, if needed after a slight modification or expansion. The state indicators

STECF Plenary Meeting November 2005 Page 5
should cover a broad range of ecosystem features and the pressure indicators should cover the most important aspects of how fishing impacts the ecosystem. The WG adopted most of the indicators recommended by the previous SGRN but slightly rephrased some of them to make them compatible with other work in the field and in scientific literature.
The state indicators selected were: (1) Conservation status of vulnerable fishes according to IUCN decline criterion, (2) Abundance of marine mammals, reptiles or seabirds (knowledge of this is not needed as an indicator, but as a vital part of understanding the effect of by-catch), (3) Mean weight and mean maximum length of fish assemblage, (4) Proportion of sensitive habitats impacted, (5) Abundance of sensitive benthos species, (6) Age and size at maturation of commercial fish species. The associated pressure indicators were (7) Spatial and temporal distribution of fishing effort, (8) Catch and discard rates; this includes rates for marine mammals, reptiles or seabirds. We propose using by-catch mortality per population as an appropriate (pressure) indicator.
3.1.4.2 Evaluation of technical reports for 2005 STECF should deliver an opinion based on the outcome of the SGRN-06-02 meeting of July 3-7.
3.2 ADDITIONAL TERMS OF REFERENCE These were given to the STECF on 6 November.
3.2.1 Hake Northern stock: STECF is requested to 1. advise whether the SSB projection for 2006 may be considered a precise and
accurate estimate of the actual quantities of mature fish in the sea 2. advise whether the SSB equal to or greater than 140000 tonnes, which is the
objective of the northern hake recovery plan, may be considered attained for two consecutive years
3.2.2 Hake Southern stock ( VIIIc and IXa): STECF if requested to 1. evaluate which projections of the ICES advice are in line with the recovery plan 2. evaluate whether and how the use of average recruitment instead of the last two
years recruitment estimates may have affect the evaluation of the status of the stock
3.2.3 Anchovy in Bay of Biscay (Subarea VIII): STECF is requested to 1. advise whether any catch level below 8000 tonnes in 2007 may be compatible
with the recovery of the stock 2. investigate socio-economic consequences of closing anchovy fishery according to
different scenarios (first half of 2007, full year 2007, limited closure in the first half and full closure in the second half of 2007)
3.2.4 Anglerfish (Div. VIIIc IXa): STECF is requested to 1. evaluate the appropriateness of the methodology used by ICES-ACFM in the
assessment with respect to the characteristics of anglerfish and anglerfish fishery;

Page 6 STECF plenary meeting November 2006
2. advise whether the estimated increase in F is compatible with the assumed reduction in trawlers fishing effort due to the implementation of the Southern hake and Norway lobster recovery plan;
3. advise whether the trend in F of megrim stocks in the same area can be assumed as indication of trends in F for the trawl component of the anglerfish catch;
4. advise whether the analysis undertaken is robust enough to justify the advice calling for zero catches or setting up of a recovery plan;
5. advise whether and how the recovery plan for southern hake and Norway lobster could be complemented to accommodate the need for anglerfish stock recovery
3.2.5 North Sea cod (ICES areas IV, VIId and IIIa): STECF is requested to 1. advise what TAC level would best corresponds to a limit of total removals in 2007
of 35000 tonnes 2. determine the TAC as well as the corresponding proportionate change in fishing
mortality that correspond to the application of the cod recovery plan in 2007 3. evaluate and comment as adequate possible changes, over the last years, in
partitioning fishing mortality among the main fleets that are under the effort management system in the North Sea
3.2.6 Norway lobster (ICES areas IV, VI and VIIa): STECF is requested to 1. evaluate the consistency and reliability of the approaches used by ICES ACFM to
provide catch advice for Norway lobster stocks assessed with underwater television and compare this with the approach proposed by STECF in 2005 and used by the ICES North Sea demersal working group
2. identify the justifications for divergent opinions between the two approaches abovementioned
3. investigate appropriate catch options in the light of available data for the different Norway lobster Management Areas
3.2.7 Whitefish selectivity in the Norway lobster fishery: STECF is requested to 1. advise on the selectivity effect on catches of Norway lobster, cod, haddock and
whithing of a 5 metre square mesh panel inserted in various topside positions 5-19 metres from the codend of fishing gear in the 70-99 mm gear category
2. advise on what would the effect of the adoption of such measures be on the projected biomass(es) for the stocks abovementioned.
3.2.8 Long term management of Haddock in the North Sea: STECF is requested to 1. evaluate and comment as adequate the ICES advice on the long term
management for this stock
3.2.9 Celtic Sea herring (Division VIIj) STECF is requested to
1. evaluate and comment as adequate the proposal of recovery plan for this stock as elaborated by the Irish Marine Institute in close cooperation with fishing industry
3.2.10 North Sea plaice: STECF is requested to

STECF Plenary Meeting November 2005 Page 7
1. evaluate the scientific basis, the appropriateness and comment as adequate the
revised catch figures where the discard estimates in 2000-2003 have almost doubled
2. evaluate the effect of the revised catch figures on the historic assessment and short term prediction in terms of SSB, F and recruitment
3. advise whether and how the knowledge of discard figures in this fishery may be validated and complemented with discard data collection underway in cooperation with the Dutch fishing industry
4. advise on which causes may have determined the redistribution of the beam-trawl fleet which seems now operate closer to the shore and to investigate which effect could be expected both for flatfish and other than flatfish stocks
5. advise whether the scientific basis supposing a northward redistribution of the plaice stock is sound enough and may be confirmed. Comment as adequate its possible implication on the current management framework
6. advise whether the management measures of the cod recovery plan and, in particular, the fishing effort regime established therein may have affected the fishing mortality on North Sea plaice stock
7. advise whether the one-to-one link between the precautionary TACs for turbot, brill, dab and flounder and the analytical TAC for plaice and sole is justified on the basis of mixed fisheries considerations and need to rebuilding plaice and sole stocks;
8. investigate whether the abovementioned one-to-one link between TACs of different flatfish stocks may have determined an increase of discards for turbot, brill, dab and flounder
3.2.11 Grey seal diet composition and fish consumption in the North Sea: Commission services have been informed about a recently published report on the diet composition of NS grey seals that has been produced in a DEFRA-funded research conducted by the SMRU (University of St. Andrews). STECF is requested to: 1. evaluate and comment as adequate this report and to highlight whether and how
the results of this research may have a bearing on the STECF’s advice on North Sea fish stocks
3.2.12 Deep sea stocks: STECF is requested to 1. advice on possible management measures other than closed areas to protect the
spawning stocks of blue ling 2. indicate the level of association between the scabbard and deep-sea sharks as
well as whether there are operational criteria to distinguish between fbisheries exploiting these resources both type of stocks
3. evaluate the consequences of prohibiting deep-sea gillnetting on deep sea stocks and, in particular, on deep sea sharks
3.2.13 Norway lobster in Bay of Biscay-Division VIII a,b (Nephrops Area N): STECF is requested to 1. indicate whether a likely increase of 20% in 2007 catch opportunities with
respect to the recent level of 3600 tonnes is compatible with a sustainable exploitation of the stock and may be justified on the basis of latest development of the fishing gear selectivity for Nephrops and hake
2. advise whether a possible increase of catch may have negative consequences on the recovery of hake
3.2.14 Celtic sea cod (Division VIIe-k): STECF is requested to

Page 8 STECF plenary meeting November 2006
1. advise whether and how much the closed areas may have contributed to reduce the overall fishing mortality
3.2.15 Irish sea sole: STECF is requested to 1. advise whether the strength of recruitment on the basis of most recent surveys
may be considered higher than what assumed in the ICES advice and if this may have a bearing on the setting of TAC and target of fishing mortality
3.2.16 Herring in Divisions VI a(South) and VIIb,c: STECF is requested to 1. provide, on the basis of information received, a preliminary evaluation of an
outline of a possible management plan
3.2.17 Fishing effort regime in the North Sea cod recovery plan: STECF is requested to 1. evaluate whether the cod catches in 70-99mm trawlers operating in the Eastern
English Channel is negligible and any limitation of their fishing activity is not going to deliver an important reduction in cod fishing mortalit

9
4 INFORMATION FROM THE COMMISSION AND 2007 PLANNING
4.1 APPOINTMENT OF NEW STECF Franco Biagi (DG-FISH) reported that the appointment of the new STECF will be concluded during the first quarter of 2007 and, anyhow, before the April plenary session.
The original plan had been to finalise the selection of STECF members before the November 2006 plenary session. But the Commission services have been forced to delay this because the list of suitable candidates, as established on the basis of the call for expression of interest FISH/2004/AMI (Field 5), was not considered sufficient to ensure an adequate thematic and geographic coverage.
This occurred notwithstanding the wide publicity given to the call (OJ, DG-Fish web-site, STECF web site, STECF meetings, meetings with Directors of national Institutes, etc) and the fact that the Field 5 of the call for expression of interest was not dedicated to STECF membership alone but also to other experts needed to deliver scientific advice. The call, in fact, aimed to elicit applications from a wide range of disciplines and different research institutions, including Universities, without limiting the search of experts to fishery research Institutes closely related to fisheries national administrations.
Notwithstanding the substantial number of additional applications arriving in 2006 and the high quality of most applicants, no expert of some Member States with fisheries interests was included in the list of suitable candidates. There is no obligation to have an STECF member per EU Member States with fishery interests. However it can help to include those with a good local knowledge of national data collection programmes so that this data can be used most effectively.
Experts at the STECF plenary session were invited to make publicity to the call for expression of interest with a view to receiving, before the end of 2006, additional applications of recognized high quality scientists. Applications received beyond this date, though suitable for the selection of experts, cannot be considered for STECF membership.
STECF was reminded that members should not be specialists on a very narrow discipline but instead they should ensure a broad knowledge of fisheries and fisheries management related issues (economic and biological aspects) as well as of marine ecology and marine conservation disciplines. Qualifications are indicated in Article 3 of the Commission Decision establishing the STECF.
The selection of candidates should take into consideration the strategic role of the STECF as established in Article 33 of the basic regulation (Council regulation (EC)No 2371/2002) as well as of the suitable mix of disciplines needed to allow the STECF to fulfil its tasks and, in particular, its advisory role for what concern Commission’s obligation to undertake “impact assessment” during the decision making process.
In particular, the new challenge of implementing the ecosystem approach to fisheries management require that environmental considerations are fully integrated into the scientific advice for management decisions (impacts of fisheries on ecosystems, environmental aspects of fishing technology including habitat impacts, discards and impacts on non-target species). Moreover, the global requirement for impact assessments, which includes also environmental impacts, makes economic and social considerations mandatory for practically most fisheries management decisions.
Changes in emphasis on management tools such as increased use of protected areas and effort management requires new types of advice and adequate composition of the STECF.

Page 10 STECF plenary meeting November 2006
STECF was recalled that the selection of suitable candidates should allow producing a principal list of STECF members as well as a reserve list of suitable candidates for possible replacements.
4.2 RULES OF PROCEDURE STECF was recalled that Article 11 of the Commission Decision establishing the STECF requires that STECF shall adopt, with the approval of the Commission, its rules of procedure.
With a view to progress on this issue Mr Biagi had prepared a preliminary draft rules of procedure that were first discussed for further improvements at the STECF Bureau that met on 29 June, 2006. The meeting was attended by John Casey (STECF chairman), Antonio di Natale (STECF vice-chairman), Tore Gustavsson (STECF vice-chairman), Franco Biagi (DG-FISH), Iain Shepherd and Hendrik Doerner (DG-JRC, STECF secretariat).
This draft rules of procedures was based on rules for similar committees advising the Commission on issues such as public health. The Bureau examined the text line by line. Some of the text confirmed existing practices but a number of concepts were new. The main issues discussed were voting, independence and the role of stakeholders.
4.2.1 Voting
Rules for voting, both in meetings and by correspondence, were discussed and precise rules formulated. Although minority opinions are allowed, the Bureau agreed that, wherever possible, consensus should be aimed for. But not at the expense of providing opinions that are vague or ambiguous.
4.2.2 Independence
Similar procedures to those used in other scientific committee were agreed. Members should declare their interests in general terms at the beginning of each year and on specific topics dealt with in particular meetings. Looking at what is done in other Committees it seems that “relevant interests” are interpreted differently by individual scientists. Having engaged in a scientific assessment of a given species would be considered an interest by some. The Committee has to decide whether the degree of interest in a particular topic warrants exclusion from the meeting, refraining from discussion, ineligibility to act as rapporteur or chairman or abstention from voting. The Bureau felt that the process should be transparent but not create too high a bureaucratic overload.
4.2.3 Stakeholders
There has been considerable interest from the fishing industry and environmental lobbyists in attending STECF meetings as observers. So far this has not hindered the work of STECF. Chairmen who had been sceptical beforehand were now rather enthusiastic. The Bureau felt that in general, STECF meetings should remain restricted to full members and invited experts. However, open invitations should be extended to any interested parties by the Commission, if the Commission and the STECF decide that a wider participation would be mutually beneficial to all likely participants.
4.2.4 Subgroups
The new rules state that STECF subgroups should include at least two full STECF members. Many meetings held up to now have not respected this rule and, with the increasing number of meetings expected in the future, this might place a considerable burden on STECF Members. Nevertheless the Bureau felt that the rule should be retained.

STECF Plenary Meeting November 2005 Page 11
4.2.5 Data
The Bureau was unable to make definite recommendations on data policy because it very much depends on the outcome of ongoing discussions on the revision of the Data Collection Regulation. It is expected that less-aggregated data should be made available in the future than is the case today.
4.2.6 Next Step DG-FISH will distribute a revised version of the guidelines. This will then be circulated to the STECF for further comments.

12
5 CONSERVATION ISSUES
5.1 REVIEW OF SCIENTIFIC ADVICE
5.1.1 STECF sub-group for stock reviews A subgroup of the STECF met between 23 and 27 October 2006 to review scientific advice for 2007.
The subgroup analysed all the 300 stocks of Community interest including those in third countries and international waters other than those from deep water or the Baltic already analysed in June 2006. The subgroup described each stock with a species name, a fishing area, a fleet segment (gear type, number of vessels), economic importance. It quantified the EU catch when this information were available. It then described the management system and the stock status. The subgroup then commented on the management assessments and advice provided by the management bodies concerned.
In general it found the management advice offered by the relevant bodies sound but had some reservations and concerns regarding suggestions to remove TACs on anglers in Vb VI, XII ,XIV, non-enforcement of TACs on North east arctic cod, late closure of sandeel fishery, raising of Fpa for North Sea plaice and lack of observed effort reductions for Western Channel plaice. It warned about the consistency of management measures of cod and haddock in VIb, Using the approach recommended in 2005 it provided indications of expected landings for those nephrops stocks assessed by underwater television.
It remarked on the need for a regional fisheries organisation in the South West Atlantic, underlined the need for close collaboration between Greece and Turkey for European anchovy in the Aegean. It emphasised the provision of better data to GFCM-SAC-SCSA for stocks such as sardines in the strait of Sicily and wondered whether management measures for red mullet in the Northern Alboran sea had been implemented. It shared concerns with ICCAT about the bluefin tuna stock, suggesting additional data collection and enforcement measures. It regretted the replacement of a moratorium for FADs for bigeye tuna by seasonal or area closures and EU TAC limits for Portuguese dogfish in the North east Atlantic being set above ICES recommendations
5.1.2 STECF opinion STECF endorsed the report of the sub-group.
5.2 SPECIFIC STOCKS AND FISHERIES
5.2.1 Anglerfish (Div. VIIIc IXa) STECF was requested to advise on three issues. The STECF response to each request is presented below. 1) Evaluate the appropriateness of the methodology used by ICES-ACFM in the
assessment with respect to the characteristics of anglerfish and anglerfish fishery Anglerfish species (Lophius piscatorius and L. budegassa) are usually landed and recorded together in the landings statistics and the two species are managed under a common TAC. Both anglerfish species are slow-growing with late maturation (age 7 for males and even higher for females).
Age based assessment for each species separately is not available due to the lack of an age length key time series. Management advice is based on a combined species assessment using the ASPIC stock production model. Production models analyse trends of total biomass and do not account for any changes in the population

STECF Plenary Meeting November 2005 Page 13
structure that may have occurred recently. The production model provide estimates of stock biomass and fishing mortality to their respective maximum sustainable yield (MSY).The BMSY and FMSY points were used by ICES advice as proxies for precautionary reference points and can be used as a lower boundary for the biomass and an upper boundary for F. The MSY reference points must be used in relative terms as F and SSB ratios on their respective MSY. Production models do not estimate recruitment, therefore, recruitment failure may not be detected using production models.
STECF considers that methodology used by ICES for the assessment of anglerfish in Divisions VIIIc and IXa is consistent with the information available and current knowledge for these stocks. 2) Advise whether the estimated increase in F is compatible with the assumed
reduction in trawler fishing effort due to the implementation of the Southern hake and Norway lobster recovery plan
The information relating to the reduction in trawler fishing effort in ICES Divisions VIIIc and IXa is incomplete. The STECF-SGRST Expert WG on fishing effort management (STECF SGRST 06-01 in relation to the Review of Annex IIB of Regulation 51/2006 in the context of the recovery plan for Southern hake and Nephrops (Regulation 2166/2005) did not received fishing effort data from Spain for ICES divisions VIIIc and IXa. Effort trends and landings compositions of the derogations defined in Council Regulation 51/2006 Annex IIB are given based on Portuguese data only.
In the absence of full information on fishing effort reduction, STECF is unable to give any advice on the request.
3) Advise whether the trend in F of megrim stocks in the same area can be assumed
as indication of trends in F for the trawl component of the anglerfish catch Southern stocks of megrim and anglerfish are distributed in the same geographical area. Both stocks are exploited in a mixed demersal fishery. Megrim is fished exclusively by trawl, while anglerfish is fished by trawl and artisanal gillnets in similar proportions (~50 %).
For these species, neither the aggregation level in the time-space scale nor their relationship with preferential habitats is known. Spatial data on the distribution of fishing effort are also lacking. A significant component of the fishing effort could be directed to specific target species in certain grounds of the distribution area depending on the season, fishing ground location and specific vessel preferences. Consequently, the impact on F of megrim and anglerfish stocks could show largely diverging trends.
Given the above concerns and an overall lack of appropriate information, STECF is unable to determine whether the trends in F for megrim in Divisions VIIIc and IXa are indicative of the likely trends in fishing mortality on anglerfish in the same divisions.
4) Advise whether the analysis undertaken is robust enough to justify the advice
calling for zero catches or setting up of a recovery plan
ICES advice is based on an assessment which is only considered indicative of stock trends but cannot be used as an absolute measure of stock status. ICES advice on anglerfish is consistent with the current knowledge of the status of the stock. However, STECF notes that ICES advice of F equal to zero in 2007 is incompatible with the advice for hake and Nephrops, which are taken in the same fisheries. The existing recovery plan for hake and Nephrops may benefit the status of the anglerfish stocks.
5) Advise whether and how the recovery plan for southern hake and Norway lobster
could be complemented to accommodate the need for anglerfish stock recovery

Page 14 STECF plenary meeting November 2006
ICES has not fully evaluated the recovery plan for southern hake and Iberian Nephrops stocks in relation to the precautionary approach. However, ICES recommends a stronger reduction in F to rebuild these stocks. STECF agrees with ICES and notes that a stringent reduction in fishing effort is required to achieve the aim of the recovery plan.
STECF notes that a reduction in fishing effort in the artisanal fishery and the mixed trawl fisheries is a potential option to achieve the ICES objectives, taking into account that there is a limited extent for use of additional technical measures on anglerfish in the area. However, in the context of the mixed fisheries, and given the uncertainties in the recent assessments of the stocks of all major stocks involved (hake, Norway lobster and anglerfish), STECF is unable to recommend additional complementary measures to accommodate the need for anglerfish stock recovery.
5.2.2 Celtic Sea Herring
5.2.2.1 Background The herring fisheries to the south of Ireland in the Celtic Sea and in Division VIIj exploit autumn and winter spawning components. For the purpose of stock assessment and management, these areas have been combined since 1982. The management unit covers all of Divisions VIIg,h,j and k and the southern part of Division VIIa. The TAC is divided between Ireland, UK, France, Germany and the Netherlands. About 86% is allocated to Ireland and in recent seasons only Ireland has prosecuted the fishery.
A committee manages the Irish quota and implements measures in addition to the EU regulations. The committee has a series of objectives relating to the maintenance of high yield and a consideration to rebuild the stock if necessary to achieve this. The Committee has the following objectives:
1. To build the stock to a level whereby it can sustain annual catches of around 20 000 t.
2. In the event of the stock falling below the level at which these catches can be sustained the Committee will take appropriate rebuilding measures.
3. To introduce measures to prevent landings of small and juvenile herring, including closed areas and/or appropriate time closures.
4. To ensure that all landings of herring should contain at least 50% of individual fish above 23 cm.
5. To maintain, and if necessary expand the spawning box closures in time and area.
6. To ensure that adequate scientific resources are available to assess the state of the stock.
7. To participate in the collection of data and to play an active part in the stock assessment procedure.
5.2.2.2 ICES advice for 2007 The current level of SSB is uncertain, but may be below Bpa and possibly even below Blim. There is no short-term forecast on which to base catch advice for 2007. However, given the risk to the stock indicated by weak recent recruitment, no fishing should be allowed until a rebuilding plan is in place. Such a plan should include closed areas to protect recruitment and further reductions in the catches.
5.2.2.3 Commission Proposal In 2006, the European Commission produced a proposal on setting fishing opportunities in 2007. This herring stock is classified as being “outside safe biological limits”. The Commission announced its intention to manage such stocks such that they are brought within safe biological limits, whilst ensuring continuation of fishing opportunities in 2007.

STECF Plenary Meeting November 2005 Page 15
For this stock, the Commission proposed that a TAC for 2007 be set to bring the stock within safe biological limits, but not entailing more than a ± 15% fluctuation in TAC from year to year. However the Commission noted that the TAC shall in no case be set at a level that will lead to an increase in F or a decrease in SSB, even if this results in a greater than 15% reduction in TAC.
5.2.2.4 Rationale for a rebuilding plan The Celtic Sea herring stock is subject to wide fluctuations in recruitment. The failure of the 2001 year class brought the stock to a level as low as the previous occasion when the stock collapsed. Subsequent recruitments appear stronger, though the small number of year classes in the fishery in recent years means that recruitment failure has a greater effect on estimated SSB than in more long lived stocks.
It is difficult to measure recruitment in this stock. The most recent year class for which a reliable estimate (more than one observation) exists, is that of 2002. Because of this, and the wide fluctuation in recruitment, no short term forecast is possible. Therefore there is no basis to ascertain if the TAC set for next year will increase F or reduce SSB.
In the absence of any forecast, the Irish Marine Institute has produced simulations of the stock in the future, under a variety of scenarios of TAC for 2007.
5.2.2.5 Rebuilding plan Under the terms of these simulations, Ireland proposes the following preliminary rebuilding plan.
5.2.2.5.1 Reduction in TAC Stepwise reduction in TAC by 15% each year until the stock can reliably be shown to have recovered. For 2007, a TAC of 9,350 t would be set. This would be reduced to 7,948 t in 2008 and 6,755 t in 2009.
5.2.2.5.2 Closed areas It is known that Sub-division VIIaS is an important area for recruits. It was closed from 2001 to 2003. It is proposed to close this area again, indefinitely. A small fishery, for vessels < 15 m using single trawls, will be permitted up to a maximum catch of 757 t in 2007, being 8% of the Irish quota. This small fishery will facilitate the monitoring of the strength of recruitment in the stock, by way of intensive sampling. However if more than 50% of the catch is composed of fish < 23 cm (~ 3 year old fish) then the fishery will be closed (subject to point 4 of the local management plan).
5.2.2.5.3 Recruitment monitoring survey In order to improve the predictive power of the assessment of the stock, the Irish Marine Institute will implement a survey to measure recruitment to the stock. This will be achieved by undertaking a MIK net survey for 1 year olds (pre-recruits) and an inshore trawl survey for 2-year olds (recruits). It is expected that this survey will begin to improve our ability to measure recruitment in about 5 years.
5.2.2.5.4 Power of acoustic survey to detect stock recovery The current tuning series is an acoustic survey, over 3-6 year olds only. Thus it is of no use to predict recruitment. It suffers from a time lag, such that it has no predictive power. However it is expected that the survey could detect increases in the stock above a certain threshold. The Irish Marine Institute will conduct simulations to determine, the levels of biomass required to be detected by the acoustic survey in order to have an accepted probability that the SSB (as measured by the survey) is above Bpa.
Page 16 STECF plenary meeting November 2006
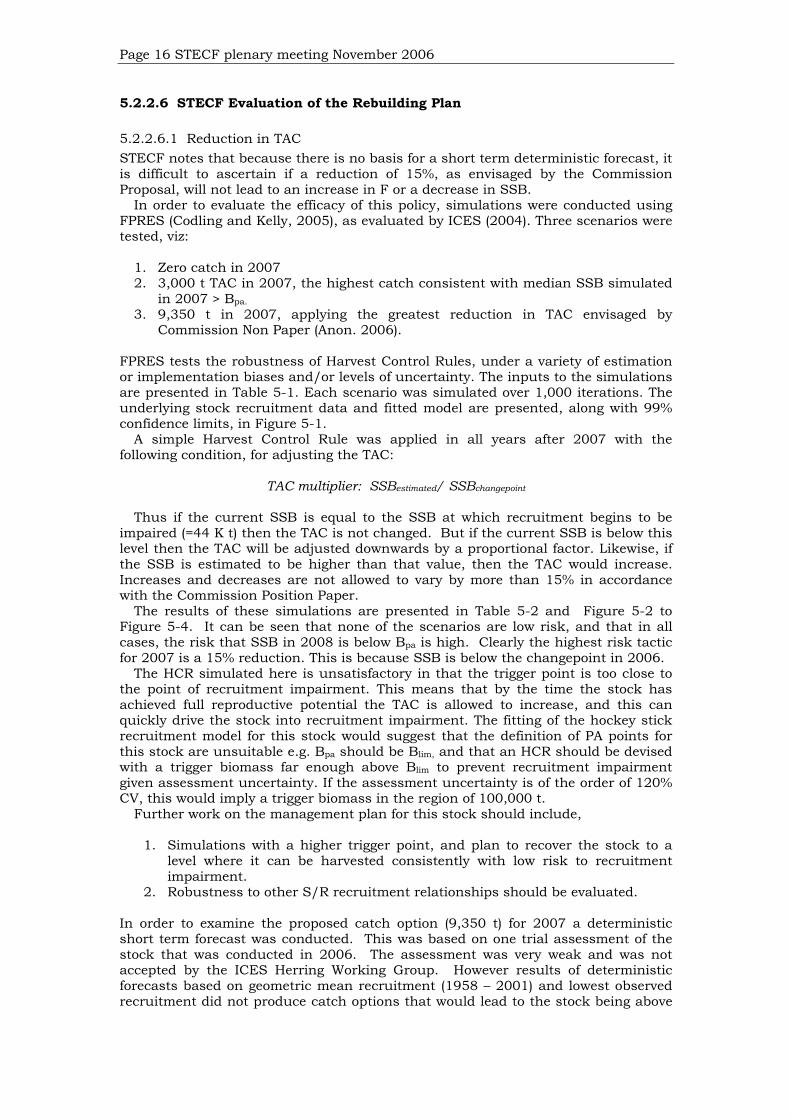
5.2.2.6 STECF Evaluation of the Rebuilding Plan
5.2.2.6.1 Reduction in TAC STECF notes that because there is no basis for a short term deterministic forecast, it is difficult to ascertain if a reduction of 15%, as envisaged by the Commission Proposal, will not lead to an increase in F or a decrease in SSB.
In order to evaluate the efficacy of this policy, simulations were conducted using FPRES (Codling and Kelly, 2005), as evaluated by ICES (2004). Three scenarios were tested, viz:
1. Zero catch in 2007 2. 3,000 t TAC in 2007, the highest catch consistent with median SSB simulated
in 2007 > Bpa. 3. 9,350 t in 2007, applying the greatest reduction in TAC envisaged by
Commission Non Paper (Anon. 2006). FPRES tests the robustness of Harvest Control Rules, under a variety of estimation or implementation biases and/or levels of uncertainty. The inputs to the simulations are presented in Table 5-1. Each scenario was simulated over 1,000 iterations. The underlying stock recruitment data and fitted model are presented, along with 99% confidence limits, in Figure 5-1.
A simple Harvest Control Rule was applied in all years after 2007 with the following condition, for adjusting the TAC:
TAC multiplier: SSBestimated/ SSBchangepoint
Thus if the current SSB is equal to the SSB at which recruitment begins to be impaired (=44 K t) then the TAC is not changed. But if the current SSB is below this level then the TAC will be adjusted downwards by a proportional factor. Likewise, if the SSB is estimated to be higher than that value, then the TAC would increase. Increases and decreases are not allowed to vary by more than 15% in accordance with the Commission Position Paper.
The results of these simulations are presented in Table 5-2 and Figure 5-2 to Figure 5-4. It can be seen that none of the scenarios are low risk, and that in all cases, the risk that SSB in 2008 is below Bpa is high. Clearly the highest risk tactic for 2007 is a 15% reduction. This is because SSB is below the changepoint in 2006.
The HCR simulated here is unsatisfactory in that the trigger point is too close to the point of recruitment impairment. This means that by the time the stock has achieved full reproductive potential the TAC is allowed to increase, and this can quickly drive the stock into recruitment impairment. The fitting of the hockey stick recruitment model for this stock would suggest that the definition of PA points for this stock are unsuitable e.g. Bpa should be Blim, and that an HCR should be devised with a trigger biomass far enough above Blim to prevent recruitment impairment given assessment uncertainty. If the assessment uncertainty is of the order of 120% CV, this would imply a trigger biomass in the region of 100,000 t.
Further work on the management plan for this stock should include,
1. Simulations with a higher trigger point, and plan to recover the stock to a level where it can be harvested consistently with low risk to recruitment impairment.
2. Robustness to other S/R recruitment relationships should be evaluated. In order to examine the proposed catch option (9,350 t) for 2007 a deterministic short term forecast was conducted. This was based on one trial assessment of the stock that was conducted in 2006. The assessment was very weak and was not accepted by the ICES Herring Working Group. However results of deterministic forecasts based on geometric mean recruitment (1958 – 2001) and lowest observed recruitment did not produce catch options that would lead to the stock being above

STECF Plenary Meeting November 2005 Page 17
Bpa in 2008. Only a forecast based on high recruitment predicted recovery to above Bpa in 2008.
STECF notes that the catch envisaged in the preliminary recovery plan is a high risk strategy. It is acknowledged that there are no low risk strategies available at present that would bring the stock to Bpa in 2008, including a zero catch in 2007.
STECF also notes that the aim of the local management plan to rebuild the stock such that it can sustain annual catches of 20,000 t is not attainable. This is because the current threshold (~44 k t) will not allow the stock to reach a level of productivity consistent with catches of 20,000 t in the long term
5.2.2.6.2 Closed areas It is known that the VIIaS Sub-division is the most important spawning ground for the stock and an important nursery ground. In recent year much of the fishing effort has concentrated in this area, as other grounds have not had the same concentrations of fish. Therefore it is to be expected that closing it would afford protection to the stock. Though it is expected that closure would result in protection of the spawning beds, it cannot be demonstrated that any benefit would accrue to the stock, in the absence of a stock recruitment relationship and being aware environmental variables. However the closure would surely benefit recruits and reduce F on incoming year classes. Therefore STECF endorses this measure.
The small-scale fishery of no more than 757 t in 2007 will result in F on recruits and adults. As an extreme example, if all the fish caught in such a fishery were small recruits as observed in the 2006 Q1 fishery (mean weight = 0.066 kg), this would equate to an F of 0.03 or 3% of geometric mean recruitment (1958-2001). This catch would equate to an F of 0.13 or 12% of the lowest observed recruitment (2003). Using the same age structure and mean weights as observed in the 2006 fishery suggests an F on recruits of 0.02 and on all ages of 0.07.
STECF considers that the catch proposed in the recovery plan, for the closed area, is likely to result in small overall fishing mortalities on recruits, whilst affording protection to the overall stock. Such a small scale fishery will also provide fishery dependent data which will help the future assessment of the stock.
STECF also considers that confining the fishery in the closed box to a small quota for small vessels would prevent effort being exerted by the large efficient pelagic vessels that target the stock.
STECF points out that closing this box is not an alternative to other management measures, but an additional measure.
Preliminary yield per recruit simulations suggest that a fishery in the closed box would produce lower yield per recruit than the general fishery. However a fishery in the box displays Fmax = 0.3 and F0.1=0.21) than the current general fishery (Fmax undefined and F0.1 = 0.23). This suggests that an open fishery on these small fish would be undesirable.

Page 18 STECF plenary meeting November 2006
Figure 5-1 Celtic Sea Herring. Stock recruit relationship, 1958-2001, with fitted segmented regression using Julio’s algorithm. 95% confidence limits are displayed.
5.2.2.6.3 Recruitment monitoring survey It is considered necessary to improve the estimation of recruitment. The current (2006) assessment relies on only observation of the most recent recruitment (2003 year class), and there is no information on the incoming year classes of 2004 or 2005. It is not clear if the MIK net survey will adequately select 1-year olds, though it is expected that the trawl survey will select 2-year olds. There is also the concern that the low stock size, contagious distribution of larvae and small herring and the protracted spawning period may all lead to very noisy estimates of abundance.
However if the estimates are reasonably precise then by the 2009 assessment year there will be four fishery independent estimates of incoming year classes (2004 – 2007 cohorts), to supplement the fishery dependent data. Each subsequent assessment will have available to it an additional year class independently estimated.
5.2.2.6.4 Power of acoustic survey to detect stock recovery STECF was unable to evaluate this matter at this time.
5.2.2.7 Conclusions The absence of predictive power will not be improved until at least 2009. Therefore, advice in the next three years will have a weak basis.
STECF notes that the plan to reduce the TAC by 15% next year is a high risk strategy. However the other scenarios also have a risk that is above what is considered precautionary. Even a zero catch option is not low risk. Looking at the

STECF Plenary Meeting November 2005 Page 19
fishery in a deterministic framework suggests that only consistent good recruitment would lead to recovery. However STECF is aware that the recruitment fluctuates widely from year to year and that this makes short term forecasts unreliable.
STECF welcomes the increased research effort to support future predictions and acknowledges that in the intervening years, there will be great uncertainty. Table 5-1 Parameters of the FPRES simulations for Celtic Sea herring Parameter Initial population 2006 recruits 2006 Geometric mean 1958-2001 = 447, 318 millions recruits + 1, 2006 Recruits, degraded by F and M Change point 44,446 t Stock/recruit Segmented regression Minimisation of S/R Julio’s Algorithm (2001) CV around population estimate 20% CV around catch weight 20% CV around stock weight 20% CV around maturity ogive 20% CV around natural mortality 20% Proportion of F before spawning 0.551 Proportion of M before spawning 0.5 Discarding 0% CV SSB estimation 120% Bias in SSB estimation ~ 15% underestimation Slope of segmented S/R relationship upward limb 9.66 Bpa 44,000 t (=B low probability of low recruitment) Blim 26,000 t (=Bloss) Table 5-2 Summary of outcomes of FPRES simulations for Celtic Sea herring TAC 2007 0 t 3,000 t 9,350 t Basis Closure Lowest catch⏐median SSB2007>Bpa 15% Rule, as per Cion. Doc. Risk SSB2007 < Bpa 30 34 50 Med. Yield at 10,000 t
9 9 10 Med. Yield at 6,000 t 6 6 7 % risk 2008, <Bpa 20-44 30-60 52-84 % risk 2010, <Bpa 5-84 8-88 20-96 SSB 2008, ‘000’s t 42-50 40-48 38-44 SSB 2010, ‘000’s t 25-60 25-56 25-44

Page 20 STECF plenary meeting November 2006
Figure 5-2 Celtic Sea Herring. Results of simulations of HCR, with a catch in 2007 of 9,350 t. (a) Average percentage risk of SSB falling below Bpa at any time during the simulated period. Each solid point represents a single TAC (target catch). The dotted line represents the risk with zero bias and noise. The dashed line represents the 5% risk level. (b) Median yield and year of the simulation for a variety TACs. The dashed line represents the 5% risk level. (d) SSB levels for each year of the simulation for a variety of TACs.

STECF Plenary Meeting November 2005 Page 21
Figure 5-3 Celtic Sea Herring. Results of simulations of HCR, with a catch in 2007 of 0 t. (a) Average percentage risk of SSB falling below Bpa at any time during the simulated period. Each solid point represents a single TAC (target catch). The dotted line represents the risk with zero bias and noise. The dashed line represents the 5% risk level. (b) Median yield and year of the simulation for a variety TACs. The dashed line represents the 5% risk level. (d) SSB levels for each year of the simulation for a variety of TACs.

Page 22 STECF plenary meeting November 2006
Figure 5-4 Celtic Sea Herring. Results of simulations of HCR, with a catch in 2007 of 3,000 t. (a) Average percentage risk of SSB falling below Bpa at any time during the simulated period. Each solid point represents a single TAC (target catch). The dotted line represents the risk with zero bias and noise. The dashed line represents the 5% risk level. (b) Median yield and year of the simulation for a variety TACs. The dashed line represents the 5% risk level. (d) SSB levels for each year of the simulation for a variety of TACs.
STECF Plenary Meeting November 2005 Page 23
5.2.2.8 References Anon. 2006. Comm Non paper Codling, E. and Kelly, C.J. 2006. ICES. 2004. SGMAS Julios, 2001.
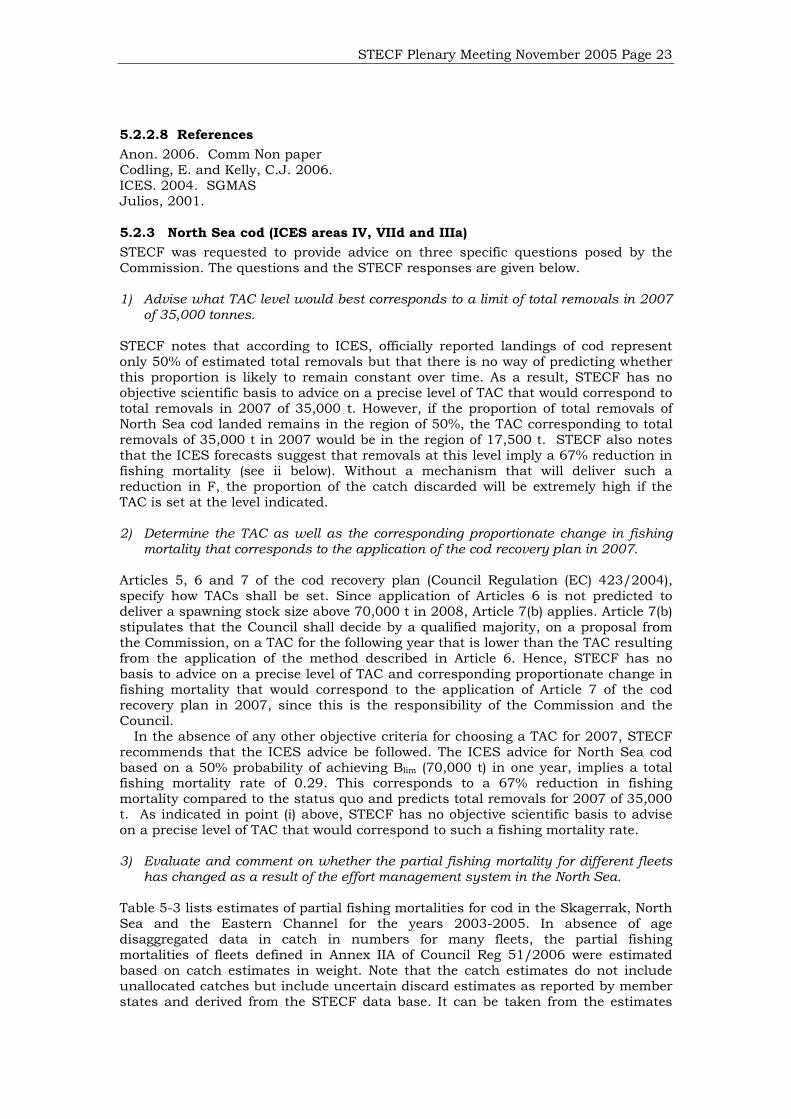
5.2.3 North Sea cod (ICES areas IV, VIId and IIIa) STECF was requested to provide advice on three specific questions posed by the Commission. The questions and the STECF responses are given below. 1) Advise what TAC level would best corresponds to a limit of total removals in 2007
of 35,000 tonnes. STECF notes that according to ICES, officially reported landings of cod represent only 50% of estimated total removals but that there is no way of predicting whether this proportion is likely to remain constant over time. As a result, STECF has no objective scientific basis to advice on a precise level of TAC that would correspond to total removals in 2007 of 35,000 t. However, if the proportion of total removals of North Sea cod landed remains in the region of 50%, the TAC corresponding to total removals of 35,000 t in 2007 would be in the region of 17,500 t. STECF also notes that the ICES forecasts suggest that removals at this level imply a 67% reduction in fishing mortality (see ii below). Without a mechanism that will deliver such a reduction in F, the proportion of the catch discarded will be extremely high if the TAC is set at the level indicated. 2) Determine the TAC as well as the corresponding proportionate change in fishing
mortality that corresponds to the application of the cod recovery plan in 2007. Articles 5, 6 and 7 of the cod recovery plan (Council Regulation (EC) 423/2004), specify how TACs shall be set. Since application of Articles 6 is not predicted to deliver a spawning stock size above 70,000 t in 2008, Article 7(b) applies. Article 7(b) stipulates that the Council shall decide by a qualified majority, on a proposal from the Commission, on a TAC for the following year that is lower than the TAC resulting from the application of the method described in Article 6. Hence, STECF has no basis to advice on a precise level of TAC and corresponding proportionate change in fishing mortality that would correspond to the application of Article 7 of the cod recovery plan in 2007, since this is the responsibility of the Commission and the Council.
In the absence of any other objective criteria for choosing a TAC for 2007, STECF recommends that the ICES advice be followed. The ICES advice for North Sea cod based on a 50% probability of achieving Blim (70,000 t) in one year, implies a total fishing mortality rate of 0.29. This corresponds to a 67% reduction in fishing mortality compared to the status quo and predicts total removals for 2007 of 35,000 t. As indicated in point (i) above, STECF has no objective scientific basis to advise on a precise level of TAC that would correspond to such a fishing mortality rate.
3) Evaluate and comment on whether the partial fishing mortality for different fleets
has changed as a result of the effort management system in the North Sea. Table 5-3 lists estimates of partial fishing mortalities for cod in the Skagerrak, North Sea and the Eastern Channel for the years 2003-2005. In absence of age disaggregated data in catch in numbers for many fleets, the partial fishing mortalities of fleets defined in Annex IIA of Council Reg 51/2006 were estimated based on catch estimates in weight. Note that the catch estimates do not include unallocated catches but include uncertain discard estimates as reported by member states and derived from the STECF data base. It can be taken from the estimates

Page 24 STECF plenary meeting November 2006
that the trawled gears other than beams of mesh size ≥120mm contributed most to the cod fishing mortality. Also beam trawls of uncertain mesh sizes (mainly 80-89mm) and trawled gears except beams of mesh size 70-89mm, 90-99mm, 100-119 mm and gill nets 110-219mm contributed substantial proportions to the estimated fishing mortalities. Fleets using trawled gears assigned to the special conditions of relative landings of less than 5% of cod (Article 8.1.c) or less than 5% of each cod, plaice and sole (Article 8.1.d) of all species’ landings in 2002 are assessed to having contributed very low partial fishing mortalities.
In summary, the partial fishing mortality for different fleets over the years 2003 –2005 appears to have remained relatively constant and that any changes to fishing mortality arising as a result of the effort management regime in the North Sea cannot be detected.

STECF Plenary Meeting November 2005 Page 25
Table 5-3 Cod landings, discards and catch estimates (t) and partial fishing mortalities 2003-2005 based on relative catch contributions in weight for various fleets (regulated gear groups including special conditions) by management areas (Skagerrak, North Sea and Eastern Channel) defined in Annex IIA of Council Reg 51/2006. Note that the catch estimates do not include unallocated catches but include uncertain discard estimates as reported by member states and derived from the STECF database. Fishing mortality over ages 2-4 and non-EU landings are adopted from the ICES 2006 (ACFM report). SPECIES YEAR REG_GEAR SPECON REG_AREA LANDINGS DISCARDS CATCH F2-4 = 1.001COD 2003 4ai none 2b 25 0 25 0.001COD 2003 4aii IIA81d 2b 455 378 833 0.025COD 2003 4aii none 2b1 134 134 0.004COD 2003 4aii none 2b23 1809 1128 2937 0.088COD 2003 4aiii IIA81d 2b23 18 18 0.001COD 2003 4aiii none 2b1 1772 155 1927 0.058COD 2003 4aiii none 2b23 291 228 519 0.016COD 2003 4aiv IIA81c 2b 35 3 38 0.001COD 2003 4aiv IIA81d 2b 77 9 86 0.003COD 2003 4aiv none 2b 428 40 468 0.014COD 2003 4av IIA81c 2b 27 3 30 0.001COD 2003 4av IIA81d 2b 351 28 379 0.011COD 2003 4av none 2b 10575 909 11484 0.343COD 2003 4bi none 2b12 3783 148 3931 0.117COD 2003 4bi none 2b3 50 50 0.001COD 2003 4bii none 2b12 2 2 0.000COD 2003 4biii IIA81c 2b12 41 0 41 0.001COD 2003 4biii none 2b12 11 11 0.000COD 2003 4biv IIA81c 2b12 27 0 27 0.001COD 2003 4biv IIA81e 2b12 15 15 0.000COD 2003 4biv none 2b12 129 129 0.004COD 2003 4ci none 2b 149 149 0.004COD 2003 4cii none 2b 3381 4 3385 0.101COD 2003 4ciii none 2b 35 35 0.001COD 2003 4d IIA81g 2b12 36 36 0.001COD 2003 4d IIA81g 2b3 126 126 0.004COD 2003 4d none 2b 377 377 0.011COD 2003 4e none 2b 217 217 0.006COD 2003 none none 2b 1387 1387 0.041COD 2003 non EU 4711 4711 0.141sum 30474 3033 33507 1.000
SPECIES YEAR REG_GEAR SPECON REG_AREA LANDINGS DISCARDS F2-4 = 0.910COD 2004 4ai none 2b 8 0 8 0.000COD 2004 4aii IIA81d 2b 334 140 474 0.013COD 2004 4aii none 2b1 24 579 603 0.016COD 2004 4aii none 2b23 1219 498 1717 0.046COD 2004 4aiii IIA81d 2b23 19 6 25 0.001COD 2004 4aiii none 2b1 1982 1819 3801 0.102COD 2004 4aiii none 2b23 282 124 406 0.011COD 2004 4aiv IIA81c 2b 36 5 41 0.001COD 2004 4aiv IIA81d 2b 42 7 49 0.001COD 2004 4aiv none 2b 408 60 468 0.013COD 2004 4av IIA81c 2b 59 14 73 0.002COD 2004 4av IIA81d 2b 331 70 401 0.011COD 2004 4av none 2b 9574 1743 11317 0.303COD 2004 4bi none 2b12 3402 1395 4797 0.128COD 2004 4bi none 2b3 44 5 49 0.001COD 2004 4bii none 2b12 4 4 0.000COD 2004 4biii IIA81c 2b12 26 0 26 0.001COD 2004 4biii none 2b12 8 8 0.000COD 2004 4biv IIA81c 2b12 25 25 0.001COD 2004 4biv IIA81e 2b12 20 20 0.001COD 2004 4biv none 2b12 177 177 0.005COD 2004 4ci none 2b 131 0 131 0.004COD 2004 4cii none 2b 3877 2 3879 0.104COD 2004 4ciii IIA81f 2b2 6 6 0.000COD 2004 4ciii none 2b 40 40 0.001COD 2004 4d IIA81g 2b12 27 27 0.001COD 2004 4d IIA81g 2b3 85 85 0.002COD 2004 4d none 2b 273 273 0.007COD 2004 4e none 2b 110 110 0.003COD 2004 none none 2b 1567 42 1609 0.043COD 2004 non EU 3338 3338 0.098sum 27478 6509 33987 0.920

Page 26 STECF plenary meeting November 2006
SPECIES YEAR REG_GEAR SPECON REG_AREA LANDINGS DISCARDS CATCH F2-4 = 0.859COD 2005 4ai none 2b 2 2 0.000COD 2005 4aii IIA81d 2b 267 179 446 0.012COD 2005 4aii none 2b1 6 6 0.000COD 2005 4aii none 2b23 1378 824 2202 0.060COD 2005 4aiii IIA81a 2b1 622 622 0.017COD 2005 4aiii IIA81a 2b23 1 1 0.000COD 2005 4aiii IIA81d 2b23 25 25 0.001COD 2005 4aiii none 2b1 1007 910 1917 0.052COD 2005 4aiii none 2b23 221 147 368 0.010COD 2005 4aiv IIA81a 2b1 172 172 0.005COD 2005 4aiv IIA81a 2b23 11 11 0.000COD 2005 4aiv IIA81c 2b 40 13 53 0.001COD 2005 4aiv IIA81d 2b 53 16 69 0.002COD 2005 4aiv none 2b 711 347 1058 0.029COD 2005 4av IIA81a 2b1 415 415 0.011COD 2005 4av IIA81a 2b23 1102 1102 0.030COD 2005 4av IIA81c 2b 98 13 111 0.003COD 2005 4av IIA81d 2b 430 52 482 0.013COD 2005 4av none 2b 8690 973 9663 0.264COD 2005 4bi none 2b12 3213 327 3540 0.097COD 2005 4bi none 2b3 49 49 0.001COD 2005 4biii IIA81c 2b12 25 25 0.001COD 2005 4biii none 2b12 7 7 0.000COD 2005 4biv IIA81c 2b12 92 92 0.003COD 2005 4biv IIA81e 2b12 14 14 0.000COD 2005 4biv none 2b12 103 103 0.003COD 2005 4ci none 2b 149 149 0.004COD 2005 4cii none 2b 4229 15 4244 0.116COD 2005 4ciii none 2b 56 56 0.002COD 2005 4d IIA81g 2b12 8 8 0.000COD 2005 4d IIA81g 2b3 66 66 0.002COD 2005 4d none 2b 104 104 0.003COD 2005 4e none 2b 96 96 0.003COD 2005 none none 2b 1207 109 1316 0.036COD 2005 non EU 2886 2886 0.092sum 27555 3925 31480 0.873
5.2.4 Celtic sea cod STECF was requested to 1) Advise whether and how much the closed areas may have contributed to reduce
the overall fishing mortality
In 2005 and 2006, three rectangles in the Celtic Sea were temporally closed for fishing though derogation were allowed for some vessels. Available information indicates that fishing effort historically deployed in the 3 closed rectangles was mostly diverted in 2005 to other métiers or to other grounds outside the Celtic Sea. Some of the redeployed effort has been devoted to the gadoids metier in the rest of the Celtic Sea, targeting whiting and haddock, where LPUE for cod is expected to be much lower than in the closed rectangles. However, changes in fishing grounds and or métiers already occurred in 2004; the diversion of effort away from the closed rectangles is not solely a result of the box closure.
VMS data for French, Belgian, and UK (E+W) vessels has showed that overall the box closure has been respected by the fleets of these nations both in 2005 and in 2006. There is some evidence of reduced LPUE for UK otter trawlers, but little evidence of a reduction of LPUE for UK beam trawlers and netters, which together account for a substantial component of the UK cod catch.
It has not yet been possible to quantify the impact of the area closure on the fishing mortality at the stock level. The most recent assessment of the stock indicates a slight decline in F in 2005 compare to the year before the closure was implemented. However, the decrease of the overall effort of the fleets in the Celtic Sea, and especially in the Gadoids métier, together with the box closure, may have had a positive impact on the Celtic Sea Cod stock, but may also increase pressure on other stocks. To ensure that the current area closure in the Celtic Sea provides a substantial reduction in fishing mortality exerted on the Celtic Sea Cod stock, this regulation should be accompanied by measures to ensure that fishing effort and catches of cod do not increase outside the closed area areas or in other periods.

STECF Plenary Meeting November 2005 Page 27
5.2.5 cod catches in 70-99mm trawlers operating in the Eastern Channel STECF was requested to 2) Evaluate whether the cod catches in 70-99mm trawlers operating in the Eastern
Channel is negligible and whether any limitation of their fishing activity is likely to deliver an important reduction in cod fishing mortality.
Relevant fleet specific effort and catch for trawlers fishing in the Eastern Channel on 70-89 and 90-99 mm data were aggregated and listed in Table 5-4 and Table 5-5. Effort of this fleet has significantly increased during 2000 to 2002. Since 2002, the nominal effort deployed increased by 18%. The great majority of the fleet used the smaller mesh size group on 70-89mm, while the fleets of 90-99mm contributed only less the 10% of the effort deployed. In 2005, the latter trawler fleet using 90-99mm has seen a major drop in effort by more than 50% compared to 2004.
Catch compositions of the trawlers operating in the Eastern Channel are listed in Table 5-5 and illustrated in Figure 5-6. There are almost no discard estimates available. Both mesh categories of 70-89mm and 90-99mm are mainly landing whiting, plaice, sole and cod. As seen in the effort trends, the great majority of landings can be attributed to the smaller meshed category 70-89mm, while the landings of the 90-99mm are minor and decreasing. During 2003-2005, the aggregated weight of the landed cod of both fleets varied among 470 and 690 t.
STECF is unable to estimate the cod catches of the trawler fleets 70-99mm in the Eastern Channel due to a lack of discard estimates. STECF therefore cannot comment on the contribution of the cod catches including discards of that fleet to the fishing mortality of cod. STECF notes that this trawler fleet contributes only a minor part to the officially reported landings of cod in the Skagerrak, North Sea and Eastern Channel in the order of 2%. However, STECF notes that about 50% of the overall cod landings from the Eastern Channel are landed by the trawlers 70-99mm. Table 5-4 Aggregated trend in effort (kW*days at sea) of trawlers fishing in the Eastern Channel using 70-89mm (4aii) and 90-99mm (4aiii) mesh size, 2000-2005. REG GEAR REG AREA SPECON 2000 2001 2002 2003 2004 2005 rel. change to 2002 4aii 7d IIA81f4 6251873 8341176 10607448 11238002 11963581 12547186 0.184aiii 7d IIA81f4 618767 613940 1037886 923816 1097753 515724 -0.5sum 6870640 8955116 11645334 12161818 13061334 13062910 0.12 Table 5-5 Landings (t) and discards (t) by derogation and species, 2003-2005 (from left to right). Note that discard data are only available for some species and gears so the lack of discard information for a given species/gear in the graphs means no information rather than zero discards. REG_GEAR SPECON REG_AREA SPECIES 2003 L 2003 D 2004 L 2004 D 2005 L 2005 D4aii IIA81f4 7d ANF 11 9 114aii IIA81f4 7d COD 628 444 5504aii IIA81f4 7d HAD 4 0 54aii IIA81f4 7d HKE 1 1 24aii IIA81f4 7d NEP 04aii IIA81f4 7d PLE 955 1039 392 9644aii IIA81f4 7d POK 0 0 14aii IIA81f4 7d SOL 348 326 3034aii IIA81f4 7d WHG 5241 4343 42174aiii IIA81f4 7d ANF 2 3 14aiii IIA81f4 7d COD 60 23 144aiii IIA81f4 7d HAD 0 0 04aiii IIA81f4 7d HKE 0 04aiii IIA81f4 7d PLE 72 75 144aiii IIA81f4 7d POK 0 0 04aiii IIA81f4 7d SOL 21 19 74aiii IIA81f4 7d WHG 324 151 42

Page 28 STECF plenary meeting November 2006
0
2000000
4000000
6000000
8000000
10000000
12000000
14000000
2000 2001 2002 2003 2004 2005
kW*d
ays
at s
ea
4aiii4aii
Figure 5-5 Aggregated trend in effort of trawlers fishing in the Eastern Channel using 70-89mm (4aii) and 90-99mm (4aiii) mesh size, 2000-2005.
ANF COD HAD HKE NEP PLE POK SOL WHG
0
2000
4000
6000
LAN
DIN
GS
and
DIS
CA
RD
S (t)
2003-2005LandingsDiscards
4.a.ii 7d
ANF COD HAD HKE NEP PLE POK SOL WHG
0
100
200
300
400
LAN
DIN
GS
and
DIS
CA
RD
S (t)
2003-2005LandingsDiscards
4.a.iii 7d
Figure 5-6 Landings (t) and discards (t) by derogation and species, 2003-2005 (from left to right). Note that discard data are only available for some species and gears so the lack of discard information for a given species/gear in the graphs means no information rather than zero discards.
5.2.6 Deep sea fisheries STECF was asked three specific questions regarding deep sea fisheries. The questions and STECF responses were as follows: 1) Advise on possible management measures other than closed areas to protect the
spawning stocks of blue ling The ICES advice is that there should be no directed fisheries, and that measures be taken to reduce by-catch to the lowest possible levels. ICES also advises that closed areas to protect spawners should be maintained and expanded. STECF considers that closed areas are required as measures to protect spawning stocks of blue ling. The areas where blue ling are known to spawn were described by ICES in 2004.

STECF Plenary Meeting November 2005 Page 29
STECF considers that closed areas are of the highest priority for protection of blue ling, because this species forms aggregations at spawning time. STECF considers that there is no guarantee that general reductions in nominal fishing effort would increase the protection of spawning blue ling and that spawning area closures are likely to be the most effective management measure for their protection. 2) Indicate the level of association between the black scabbard and deep-sea sharks
as wells as whether there are operational criteria to distinguish between fisheries exploiting these resources.
Deep-water sharks and black scabbard fish are caught in several fisheries together, both as target and by-catch. Table 5-6 presents the operational criteria to distinguish the main fisheries exploiting these resources. The strength of the association between them in each fishery is also indicated.
It can be seen that there is a strong association between the two groups in mixed trawl fisheries and in deepwater freezer artisanal dropline and artisanal longline fisheries. Only weak associations are expected in the tanglenet fisheries for anglerfish. This is because this gear is expected not to retain black scabbard in large quantities, though it does retain sharks. If the anglerfish tanglenet fishery is restricted to depths of less than 600 m, then the catch of either black scabbard or shark would be very low. There is a strong association in the orange roughy fisheries, but the catch of both is usually low. This is because these directed fisheries have short tow duration and target schools of orange roughy.
Table 5-6 also shows the main indicators of the fisheries taking these species. These indicators are the gear vessel type, ICES Sub-area and country. Table 5-6 Main fisheries catching black scabbard and deepwater shark and the strength of the association between them in each fishery Gear Trawl Trawl Autoline Longline Dropline Tanglenet* Target species
Mixed deepwater
Orange roughy
Ling and tusk
Deepwater shark
Black scabbard Anglerfish
Area Vb, VI, VII and XII VII, VIII
II, IV, Vb, VI and VII
VI, VII, VIII, XII and IX IX, Madeira
IVa, VI and VII
D. shark High Medium Low High Medium Medium B. scabbard High Low - - High Low Association Strong Negligible None None Strong Weak
Comments
Shark catch lower due to greater depletion
Neither species is important in this fishery
Upper slope fishery, small by-catch of small sharks.
Black scabbard not selected by this type of gear, in these areas
Actual shark by-catch may be low, but not well documented
Scabbard catch likely only with abandoned gear
Countries
France, Spain, Ireland, UK
France, Ireland Norway
Germany, UK Portugal
Spain, UK, Germany
* This fishery is currently banned (See Section XXX). 3) Evaluate the consequences of prohibiting deep-sea gillnetting on deep-sea stocks
and in particular, on deep-sea sharks. STECF has recommended that gillnetting ban be maintained in depths of greater than 600 m (see section 5.7), in the northeast Atlantic. This is expected to reduce mortality on deepwater stocks, and in particular deepwater sharks. Deepwater stocks, including sharks, are distributed in depths mainly from 400 m. A complete ban on gillnetting in waters of 400 m and deeper would have a greater benefit, but it was felt that 600 m is acceptable because it will minimise the catch of the main deepwater sharks, whose distribution is almost all from 600 m deeper.

Page 30 STECF plenary meeting November 2006
5.2.7 Long term management of haddock in the North Sea 1) STECF is requested to evaluate and comment on the ICES advice on the long-term
management for this stock. The request to ICES for advice on the long-term management of haddock was made by the European Union and Norway. ICES provided its advice on a revised approach to long term management for haddock immediately prior to the STECF meeting. ICES evaluated options through simulation studies basing its conclusions on the likely risk of candidate management approaches leading to the stock biomass falling below Blim. A technical Annex was included with the advice and STECF was also able to examine an ICES Working Paper1 giving fuller details of the approach used. STECF notes that the development of the evaluation approach involved discussions at ICES Methods WG (WGMG) and WGNSSK.
The ICES advice was as follows:
“The evaluation of the options and methods to provide improved stability in TACs indicates that a target fishing mortality of 0.3 with a 15% limit on inter-annual variation in TACs leads to a low risk to Blim
(around 5%). Increasing the target fishing mortality above 0.3 leads to an increased risk.”
STECF considers the ICES advice on long term management for this stock is consistent with the objectives to avoid a high risk of depletion of the stock outside safe biological limits and for improving the stability in TACs. STECF notes that increasing the target fishing mortality above 0.3 leads to an increased risk. STECF draws attention, however, to the possibility that simulated outcomes may reflect the favourable starting position and suggests that further simulations should be performed as the stock develops into the future so that a more comprehensive view of risk can be built up. STECF also notes that the analysis involved a limited range of candidate plans and that improvements in performance may be achieved with others that better accommodate the recruitment pattern and biology of this species. In view of these observations, STECF recommends that the plan should be formally reviewed in 2009. To allow for adequate consultation with stakeholders and managers on any modifications, implementation issues and implied risks, preparatory work towards the review should be started in 2008.
The above advice is in relation to biological considerations only. STECF considers that an impact assessment involving socio and economic factors should also be performed.
5.2.8 Hake Northern stock: STECF was asked to: 1) advise whether the SSB projection for 2006 may be considered a precise and
accurate estimate of the actual quantities of mature fish in the sea 2) advise whether the SSB equal to or greater than 140000 tonnes, which is the
objective of the northern hake recovery plan, may be considered attained for two consecutive years
STECF notes that the absolute values for F and SSB from the current assessment are uncertain, primarily because of problems with growth and ageing of hake. STECF therefore considers that the SSB projection for 2006 cannot be considered as a precise and accurate estimate of the actual quantities of mature fish in the sea. However, STECF considers that, given that no retrospective pattern is observed either in F or in SSB, estimated by the current assessment, the SSB level of 140,000 t (the objective of the northern hake recovery plan) can be considered as having been attained for two consecutive years (2005 and 2006).
1 Needle, C.L., 2006. Revised FLR-based evaluation of candidate harvest control rules for North Sea haddock. Working Paper for the ICES Advisory Committee for Fisheries Management, Copenhagen. October 2006.

STECF Plenary Meeting November 2005 Page 31
STECF further notes that from the recovery plan, it is not clear to which years the two consecutive years should apply.
5.2.9 Hake Southern stock (VIIIc and IXa) STECF was requested to: 1) evaluate which projections of the ICES advice are in line with the recovery plan 2) evaluate whether and how the use of average recruitment instead of the last two
years recruitment estimates may have affect the evaluation of the status of the stock
Southern hake is annually assessed by the WGHMM. ICES considered the assessment in 2006 as indicative for trends. ICES also considered that the absolute values are thought to be too uncertain to provide a basis for a short-term forecast. Uncertainties are related to a variety of reasons: including uncertainty about growth rate and age, stock identity and migration, the extent of discarding, and year-to-year variation in the performance of the scientific surveys. There are no long-term management reference points for the southern hake stock apart from those contained in the recovery plan.
The state of the Southern hake stock is considered by ICES as having reduced reproductive capacity and as being harvested unsustainably. ICES indicated that SSB is considered to be well below Blim, and there is no signal of a recent reduction in F. Although the present F is not precisely known, it is likely to be far above 0.27, the aim of the recovery plan.
STECF agrees with the ICES advice but in the absence of any reliable projections, is unable to quantify any catch level that is in line with the recovery plan objectives. Despite the fact that the recruiting year classes 2004 and 2005 appear to be strong, STECF notes that discarding of hake is considerable, and a large fraction of the discard consists of younger ages. STECF also notes that the precision of the estimates year classes 2004 and 2005 is very low and that ICES advises the estimates must be considered with caution. Under these circumstances, STECF considers that given the current perception of SSB and F, the potential use of the high recruitment estimates in the last two years does not affect the current perception of the status of the stock.
5.2.10 Herring VIa south and VIIbc STECF was asked to 1) Provide, on the basis of information received, a preliminary evaluation of an outline
of a possible management plan. The current ICES advice is that the catch regime that is in place since 2000 does not appear to have rebuilt the stock. ICES advised that no further fishing be allowed unless a rebuilding plan is in place. One element of the plan should be a further reduction in catch.
In 2006, the European Commission produced a proposal on setting fishing opportunities in 2007. This herring stock is classified as being “outside safe biological limits”. The Commission announced its intention to manage such stocks such that they are brought within safe biological limits, whilst ensuring continuation of fishing opportunities in 2007.
For this stock, the Commission proposed that a TAC for 2007 be set to bring the stock within safe biological limits, but not entailing more than a ± 15% fluctuation in TAC from year to year.
However the Commission noted that the TAC shall in no case be set at a level that will lead to an increase in F or a decrease in SSB, even if this results in a greater than 15% reduction in TAC.
No recovery plan has been fully prepared for this stock at present. However a local management committee has produced a management plan aim for the Irish

Page 32 STECF plenary meeting November 2006
fishery, which takes all of the stock. This plan is the basis of the recovery plan being developed. The details are as follows.
1. To rebuild this stock to above the Bpa level of 110 000 t. 2. In the event of the stock remaining below this level, additional conservation
measures will need to be implemented. 3. In the longer term it is the policy of the committee to further rebuild the
stock to the level at which it can sustain annual catches of around 25 000 t. 4. Implement a closed season from March to October. 5. Regulate effort further through boat quotas allocated on a weekly basis in the
open season. Paying attention to this outline STECF makes some comments on this framework as a basis of a recovery plan.
5.2.10.1 Rebuilding the stock to Bpa. Bpa is estimated as 1.4* Blim (Blim = lowest reliably estimated SSB). It is considered that this is a very high target biomass and at current stock productivity is not going to be attainable. Two abnormally high year classes (1981 and 1985) built this stock to a record high level in the late 1980’s. In the time series available (1970 to present) no other high stock sizes were ever observed. However in order to move to a precautionary region, reductions in catch are required.
5.2.10.2 Additional conservation measures. As a preliminary step, a 15% reduction in TAC should be instituted for 2007. In 2007 a further acoustic survey will be available, meaning that 9 surveys will be available for tuning and 6 surveys of the current series will be available. It is expected that the information basis will improve therefore.
STECF notes that the 15% reduction in TAC will not in itself lead the to recover to within the currently set reference points. However it is the lowest catch that is consistent with the Commission position.
5.2.10.3 Attaining annual catches of 25,000 t. STECF does not consider that this is attainable at current stock productivity.
5.2.10.4 General comments STECF is aware that there are two separate spawning components in this stock are, autumn and spring spawners. The big year classes of the 1980’s were autumn spawners, but at present the spring spawners are more dominant. The peak spawning wave of these spring spawners does not always coincide with the acoustic survey. Furthermore the fishery is often closed by the time the spring spawners appear on the north coast of Ireland. Thus both the fishery independent and dependent data often do not have these fish well represented. This leads to inconsistencies in the catch at age matrix from year to year.
STECF is also aware that in 2005, Council increased the TAC to 15,400 t, from 14,000 t. This increase was on the basis that the 2005 acoustic survey estimate was higher than previous years. STECF strongly states that individual acoustic surveys cannot be used in this way to frame management advice. As noted above, they are subject to large inter-annual variability. As the time series extends, catchability (of the entire series) in the assessment will cope with these variations.
STECF states that the TAC for 2007 should be reduced compared to 2006 and no further increases in TAC are acceptable if the aims of the outline management plan are to be achieved.
5.2.11 Irish Sea sole STECF is requested to

STECF Plenary Meeting November 2005 Page 33
1) Advise whether the strength of recruitment on the basis of most recent survey, may be considered higher than what assumed in the ICES advice and if this may have a bearing on the setting of TAC and target of fishing mortality.
STECF notes that the terminal population estimates at all ages of Irish Sea sole are primarily determined by the estimates of relative numbers at age from two UK beam trawl surveys. At the time of the 2006 ICES assessment ,the results of the survey were not available and the strength of the 2004 year-class was assumed to be the geometric mean over the period 1995-2004. In previous assessments, a GM from a longer time period was used for the estimate of the most recent recruitment. The assumed recruitment of the 2004 year-class from the short term GM is substantially lower (25% less) than the longer term GM. However, the 2006 survey estimates were available to STECF and they confirm that the strength of the 2004 year-class is in line with the short-term GM estimate that was used for the 2007 predictions.
While the assumption of a higher recruitment estimate for the 2004 year-class would have implications for the predicted catch of sole in 2007, STECF concludes that the ICES assumption for the strength of the 2004 year-class was appropriate and there is no reason to revise the 2007 ICES advice for Irish Sea sole.
5.2.12 North Sea plaice: STECF was asked eight specific questions regarding the ICES advice for North Sea plaice. The questions and STECF responses are as follows:
5.2.12.1 Change in discard estimates in 2002-2003 1) Evaluate the appropriateness of the scientific basis for estimating discards and
comment on the revised catch figures for North Sea plaice for which the discard estimates in 2000-2003 have almost doubled
2) Evaluate the effect of the revised catch figures on the historic assessment and short-term prediction in terms of SSB, F, and recruitment
The North Sea plaice stock assessment, annually carried out by the ICES WGNSSK, has only since 2004 incorporated discard estimates. The derivation of these estimates has evolved over the years 2004-2006 (described below).
5.2.12.1.1 Discard numbers at age time series: 1. WGNSSK 2004. For the years 1957-1998 these were derived through modelling,
based on mean lengths from survey and back-calculation data and selection and sorting ogives (ICES CM 2005/ACFM:07 Appendix 1); this was done because for these years no adequate discard observations are available. For the years 1999-2003 these were derived from the Dutch sampling program raised with the ratio of total international landings numbers to total landings numbers over sampled trips.
2. WGNSSK 2005. For 1957-1999 these were derived in the same way as in WGNSSK 2004. For 1999-2004 they were derived from the Dutch and the UK sampling programs. Discards at age from the Dutch and UK sampling programs were raised by effort ratio (based on hp * days at sea for the Dutch fleets, and on trips for the U.K. fleets). Discards at age for the other fleets were calculated as a weighted average of the Dutch and UK discards at age and raised to the proportion in landings in tonnes.
3. WGNSSK 2006. Similar procedures were followed as in WGNSSK 2005, except: (1) Whereas WGNSSK 2005 removed discards for which no UK age information was available from the raising procedure, WGNSSK 2006 used a combined Dutch-UK ALK for these fish. This resulted in higher discard estimates compared to the estimates used in WGNSSK 2005. The WGNSSK 2006 estimates are thought to be more realistic, because WGNSSK 2005 excluded some discarded fish. (2) Discards from the UK sampling program were raised by effort ratio in terms of days at sea (instead of trips). This was done because raising by trips resulted in discard numbers that seemed unrealistically high; raising by days at

Page 34 STECF plenary meeting November 2006
sea made them lower. The Table 5-7 and Table 5-8 below give the discard numbers at age that were used by WGNSSK 2006 and 2005 respectively.
Table 5-7 Discard numbers at age used by WGNSSK 2006 Age 1 Age 2 Age 3 Age 4 Age 5 Age 6 Age
7 Age 8
Age 9
Age 10
1999 28442 51985 49623 2952 227 18 0 5 0 9 2000 123198 204959 73709 70451 3133 86 31 13 9 36 2001 32086 379672 191174 64616 49703 64 29 0 0 0 2002 421199 365495 188049 34600 4125 17015 8 0 0 306 2003 70665 647148 62397 132331 4699 188 818 0 0 20 2004 219311 191410 114685 3703 2031 365 4 12 0 8 2005 94995 304707 31954 15422 3545 2659 30 7 31 0 Table 5-8 Discard numbers at age used by WGNSSK 2005 Age 1 Age 2 Age 3 Age 4 Age 5 Age
6 Age 7
Age 8
Age 9
Age 10
1999 29826 54539 44355 944 62 15 0 6 0 10 2000 102360 187611 47757 52789 463 48 23 10 0 0 2001 29888 391400 207084 64719 50227 95 0 0 0 0 2002 378412 249340 105875 22125 1490 1913 8 0 0 0 2003 93927 734877 49605 19664 3424 114 677 0 0 0 2004 269002 180183 125884 2885 1863 1732 0 0 0 0 2005
5.2.12.1.2 Discard weights at age time series: 1. WGNSSK 2004. For 1957-1998 these were derived through the same modelling
as used for the numbers at age, and using a length-weight relationship. For 1999-2003 these were derived from the Dutch sampling program.
2. WGNSSK 2005. The estimates from WGNSSK 2004 were used. For the additional data year 2004, discard weights at age were derived through the modelling, because the estimates from the sampling seemed too variable.
3. WGNSSK 2006. For the whole time series 1957-2005 they were derived through the modelling, which reduced variability in the estimates of the most recent years (see Figure 5-7). This also resulted in higher weights at age in some of the recent years (e.g. 2003, see Figure 5-7). Using these higher weights at age explains the major part of the difference in total discards (in tonnes) as estimated in WGNSSK 2006 compared to WGNSSK 2005.

STECF Plenary Meeting November 2005 Page 35
0
0.05
0.1
0.15
0.2
0.25
0.3
1957
1962
1967
1972
1977
1982
1987
1992
1997
2002
year
wei
ght (
kg)
Figure 5-7 Discard weights at age over time, for ages 1-5. Red lines from WGNSSK 2006, black lines from WGNSSK 2005. The lines for ages 3 and 5 are bold, to make it easier to distinguish these lines from those for age 4. STECF does not make a judgment as to which raising procedure is preferable, nor whether the modelling is correct. STECF notes that the revision of the discard weights at age has no impact on the historic assessment and short term prediction which is the basis of the ACFM advice (because they are not used in the calculations). However, the revision of the discard numbers at age does. In order to show the sensitivity to assumptions on discard raising, STECF ran an alternative assessment and short term prediction. Results are presented of a North Sea plaice stock assessment and prediction that is run with the discard numbers at age (and discard weights at age) used in WGNSSK 2005, supplemented with discard numbers for the year 2005 as derived for WGNSSK 2006. These results are compared with the ones from WGNSSK 2006 and accepted by ACFM 2006. The settings used in the stock assessment and the short term forecast are the same.

Page 36 STECF plenary meeting November 2006
1957 1968 1979 1990 2001
thou
sand
s
010
0000
2500
00
landings and discards
1960 1980 2000
0.0
0.4
0.8
F
fbar 2 - 6fbar landings 2-6fbar discards 2-3
Fishing mortality
1957 1968 1979 1990 2001
Recruitment
NA
020
0000
040
0000
0
1960 1980 2000
020
0000
4000
00
SSB
Year
tonn
es
Figure 5-8 Summary results of the North Sea plaice stock assessment of WGNSSK 2006 accepted by ACFM 2006. First panel: black = discards, white = landings. Recruitment is numbers at age 1.

STECF Plenary Meeting November 2005 Page 37
1957 1968 1979 1990 2001
thou
sand
s
010
0000
2500
00
landings and discards
1960 1980 2000
0.0
0.4
0.8
F
fbar 2 - 6fbar landings 2-6fbar discards 2-3
Fishing mortality
1957 1968 1979 1990 2001
Recruitment
NA
020
0000
040
0000
0
1960 1980 2000
020
0000
4000
00
SSB
Year
tonn
es
Figure 5-9 Summary results of the alternative North Sea plaice stock assessment with discards estimates from WGNSSK 2005 (supplemented for the year 2005 with estimates as derived for WGNSSK 2006). First panel: black = discards, white = landings. Recruitment is numbers at age 1. Table 5-9 Summary results of the North Sea plaice stock assessment of WGNSSK 2006 accepted by ACFM 2006. recruitment ssb catch landings discards fbar2-
6 fbar disc2-
3 fbar hc2-
6 Y/
1957 457973 274205 78410 70563 7847 0.27 0.12 0.22 0.26 1958 698110 288540 88133 73354 14779 0.32 0.19 0.24 0.25 1959 863385 296824 109031 79300 29731 0.37 0.24 0.24 0.27 1960 757297 308163 116918 87541 29377 0.37 0.23 0.27 0.28 1961 860573 321353 118234 85984 32250 0.35 0.27 0.24 0.27 1962 589152 372862 124958 87472 37486 0.39 0.29 0.25 0.23 1963 688361 370371 148014 107118 40896 0.42 0.36 0.27 0.29 1964 2231479 363074 147059 110540 36519 0.47 0.32 0.30 0.30 1965 694564 344009 139747 97143 42604 0.39 0.25 0.28 0.28 1966 586765 361543 166589 101834 64755 0.40 0.34 0.24 0.28 1967 401281 416553 162737 108819 53918 0.43 0.32 0.25 0.26 1968 434257 402506 139259 111534 27725 0.34 0.22 0.21 0.28 1969 648830 377412 142708 121651 21057 0.34 0.17 0.25 0.32

Page 38 STECF plenary meeting November 2006
recruitment ssb catch landings discards fbar2-6
fbar disc2-3
fbar hc2-6
Y/
1970 650536 333907 159877 130342 29535 0.48 0.28 0.35 0.39 1971 410215 316303 136807 113944 22863 0.38 0.22 0.29 0.36 1972 366523 319002 142308 122843 19465 0.41 0.19 0.33 0.39 1973 1311561 268640 143826 130429 13397 0.47 0.13 0.41 0.49 1974 1132162 278523 157277 112540 44737 0.49 0.20 0.41 0.40 1975 864263 292919 194672 108536 86136 0.56 0.43 0.37 0.37 1976 692030 310580 166515 113670 52845 0.42 0.27 0.30 0.37 1977 985840 316356 176300 119188 57112 0.51 0.31 0.34 0.38 1978 908601 302477 159285 113984 45301 0.47 0.23 0.36 0.38 1979 890114 295506 212501 145347 67154 0.68 0.36 0.49 0.49 1980 1127636 269737 170782 139951 30831 0.56 0.16 0.50 0.52 1981 871004 258216 172144 139747 32397 0.55 0.16 0.48 0.54 1982 2035523 259703 203863 154547 49316 0.61 0.22 0.52 0.60 1983 1305294 309919 217660 144038 73622 0.60 0.26 0.49 0.46 1984 1257091 322526 226102 156147 69955 0.58 0.28 0.43 0.48 1985 1850544 343791 220424 159838 60586 0.53 0.23 0.43 0.46 1986 4747578 368065 296260 165347 130913 0.65 0.34 0.48 0.45 1987 1929110 445526 342796 153670 189126 0.69 0.51 0.48 0.34 1988 1774162 392444 310444 154475 155969 0.68 0.52 0.41 0.39 1989 1184971 414796 276128 169818 106310 0.62 0.47 0.39 0.41 1990 1035975 378509 228218 156240 71978 0.58 0.39 0.39 0.41 1991 910226 340757 229063 148004 81059 0.68 0.47 0.45 0.43 1992 772165 273487 182887 125190 57697 0.67 0.40 0.45 0.46 1993 524548 238907 151999 117113 34886 0.64 0.28 0.50 0.49 1994 442017 207874 134218 110392 23826 0.63 0.25 0.53 0.53 1995 1158562 186469 120215 98356 21859 0.66 0.21 0.57 0.53 1996 1215952 179635 133861 81673 52188 0.71 0.35 0.56 0.45 1997 1926329 186132 179759 83048 96711 0.87 0.73 0.57 0.45 1998 607418 205668 174711 71534 103177 0.86 0.77 0.44 0.35 1999 819387 155093 94978 80662 14316 0.48 0.10 0.43 0.52 2000 1301974 228710 135002 81148 53854 0.53 0.32 0.34 0.35 2001 763592 276865 182750 81963 100787 0.71 0.59 0.32 0.30 2002 1929171 243394 180652 70217 110435 0.76 0.69 0.36 0.29 2003 488754 246132 181302 66502 114800 0.80 0.56 0.38 0.27 2004 880836 182637 116551 61436 55115 0.54 0.53 0.31 0.34 2005 579514 193408 104080 55700 48380 0.52 0.55 0.26 0.29 2006 194051

STECF Plenary Meeting November 2005 Page 39
Table 5-10 summary results of the alternative North Sea plaice stock assessment with discards estimates from WGNSSK 2005 (supplemented for the year 2005 with estimates as derived for WGNSSK 2006).
recruitment ssb catch landings discards fbar2-6 fbar disc2-3 fbar hc2-6 Y/ssb1957 457973 274205 78463 70563 7900 0.27 0.12 0.22 0.261958 698110 288540 88254 73354 14900 0.32 0.19 0.24 0.251959 863385 296824 109261 79300 29961 0.37 0.24 0.24 0.271960 757297 308163 117183 87541 29642 0.37 0.23 0.27 0.281961 860573 321353 118415 85984 32431 0.35 0.27 0.24 0.271962 589152 372862 125208 87472 37736 0.39 0.29 0.25 0.231963 688361 370371 148391 107118 41273 0.42 0.36 0.27 0.291964 2231479 363074 147411 110540 36871 0.47 0.32 0.3 0.31965 694564 344009 139871 97143 42728 0.39 0.25 0.28 0.281966 586764 361543 167319 101834 65485 0.4 0.34 0.24 0.281967 401280 416553 162978 108819 54159 0.43 0.32 0.25 0.261968 434257 402506 139524 111534 27990 0.34 0.22 0.21 0.281969 648830 377412 142845 121651 21194 0.34 0.17 0.25 0.321970 650536 333907 160862 130342 30520 0.48 0.28 0.35 0.391971 410215 316303 136974 113944 23030 0.38 0.22 0.29 0.361972 366523 319002 142514 122843 19671 0.41 0.19 0.33 0.391973 1311560 268640 143837 130429 13408 0.47 0.13 0.41 0.491974 1132160 278523 157807 112540 45267 0.49 0.2 0.41 0.41975 864261 292918 195345 108536 86809 0.56 0.43 0.37 0.371976 692027 310579 167002 113670 53332 0.42 0.27 0.3 0.371977 985825 316354 176761 119188 57573 0.51 0.31 0.34 0.381978 908596 302474 159800 113984 45816 0.47 0.23 0.36 0.381979 890103 295501 213422 145347 68075 0.68 0.36 0.49 0.491980 1127620 269727 171134 139951 31183 0.56 0.16 0.5 0.521981 870983 258204 172481 139747 32734 0.55 0.16 0.48 0.541982 2035462 259685 204492 154547 49945 0.61 0.22 0.52 0.61983 1305269 309894 217986 144038 73948 0.6 0.26 0.49 0.461984 1257081 322492 226669 156147 70522 0.58 0.28 0.43 0.481985 1850485 343738 220730 159838 60892 0.53 0.23 0.43 0.471986 4747517 368011 296385 165347 131038 0.65 0.34 0.48 0.451987 1929028 445461 343163 153670 189493 0.69 0.51 0.48 0.341988 1774126 392370 311835 154475 157360 0.68 0.52 0.41 0.391989 1184921 414704 277466 169818 107648 0.62 0.47 0.39 0.411990 1035956 378398 228595 156240 72355 0.58 0.39 0.39 0.411991 910220 340669 229560 148004 81556 0.68 0.47 0.45 0.431992 772146 273402 183370 125190 58180 0.67 0.4 0.45 0.461993 524537 238790 152233 117113 35120 0.64 0.28 0.5 0.491994 441941 207782 134392 110392 24000 0.63 0.25 0.53 0.531995 1158174 186354 120450 98356 22094 0.66 0.21 0.57 0.531996 1209051 179543 133796 81673 52123 0.72 0.35 0.56 0.451997 1868626 185652 179957 83048 96909 0.87 0.74 0.57 0.451998 572958 202840 174948 71534 103414 0.88 0.79 0.45 0.351999 803206 148287 95051 80662 14389 0.49 0.11 0.44 0.542000 1029222 215616 112784 81148 31636 0.49 0.26 0.35 0.382001 605953 256876 149430 81963 67467 0.79 0.75 0.33 0.322002 1986993 198483 134718 70217 64501 0.69 0.59 0.4 0.352003 494173 217343 133961 66502 67459 0.68 0.56 0.41 0.312004 910724 181462 120150 61436 58714 0.56 0.54 0.31 0.342005 558211 188772 104080 55700 48380 0.54 0.58 0.26 0.32006 185747
STECF notes that in the recent years, the SSBs estimated by the alternative assessment with the WGNSSK 2005 discard estimates are lower, while the F estimates are slightly higher than the respective results from the accepted 2006 assessment. In other words: the state of the stock is estimated to be slightly worse with the alternative assessment than with the accepted one. This result is as expected: with higher catch at age numbers as input data (WGNSSK 2006), the virtual population that is reconstructed by XSA must have higher respective abundances at these ages, from which these higher catches are taken.

Page 40 STECF plenary meeting November 2006
STECF considers that, because the population reconstructed with the lower discard numbers of WGNSSK 2005 is estimated to have lower abundances of the younger age groups, it is expected that forward projection of this population will give lower SSB predictions in the short term. Indeed, results show that with the alternative forecast, the advice based on the precautionary approach (the landings that can be taken in 2007 such that SSB in 2008 is above Bpa = 230 kilotonnes) would be just above 20 kilotonnes, instead of the 32 kilotonnes of the accepted advice by ACFM 2006. Also, with each F value for 2007, the SSB that is predicted to remain in 2008 is lower for the alternative assessment than for the accepted assessment. Table 5-11 Short term forecast for North Sea plaice as accepted by ACFM 2006 based on WGNSSK 2006 discards. In bold red are options not consistent with the precautionary approach (PA).
rationale Landings 2007
Basis F total (2007)
F H Cons (2007)
F disc (2007)
Disc (2007)
Catch (2007)
SSB (2008)
Zero catch
0.0 F=0 0.0 0.0 0.0 0.0 0.0 294
6 Fsq*0.1 0.05 0.03 0.05 6 12 282 25 Fsq*0.45 0.23 0.13 0.21 24 50 243 28 Fsq*0.5 0.26 0.14 0.23 27 54 238 32 Fsq*0.58 0.30 0.16 0.27 30 62 230 50 Fsq*1.0 0.52 0.28 0.46 47 97 194 54 Fsq*1.1 0.57 0.31 0.51 50 105 187 57 TACsq=Fsq*1.19 0.62 0.33 0.55 53 111 180
Status quo
60 Fsq*1.25 0.65 0.35 0.57 55 115 176 Table 5-12 Short term forecast for the alternative North Sea plaice stock assessment with discards estimates from WGNSSK 2005 (supplemented for the year 2005 with estimates as derived for WGNSSK 2006). In bold red are options not consistent with the PA. rationale Landings
2007 Basis F
total (2007)
F H Cons (2007)
F disc (2007)
Disc (2007)
Catch (2007)
SSB (2008)
Zero catch
0.0 F=0 0.0 0.0 0.0 0.0 0.0 272
6 Fsq*0.1 0.05 0.03 0.05 5 11 260 19 Fsq*0.33 0.18 0.10 0.17 16 35 235 25 Fsq*0.45 0.24 0.13 0.23 21 46 223 27 Fsq*0.5 0.27 0.15 0.26 23 51 218 49 Fsq*1.0 0.54 0.30 0.51 41 90 176 53 Fsq*1.1 0.59 0.33 0.56 44 97 169
Status quo
58 Fsq*1.25 0.68 0.37 0.64 48 106 159
5.2.12.1.3 Conclusion STECF points out that the outcome of the stock assessment is sensitive to the assumptions made to derive the discard numbers at age. The outcome of the short term forecast, and therefore also the advice given by ACFM, is even more sensitive to these assumptions.
The exercise of comparing the two alternative assessments and short term forecasts illustrates the problem of uncertainty in discard estimates, resulting in high uncertainty of the advice.
5.2.12.2 Improving discarding knowledge 3) Advise whether and how the knowledge of discard figures in this fishery may be
validated and complemented with discard data collection underway in corporation with the Dutch fishing industry.

STECF Plenary Meeting November 2005 Page 41
In 2004 the Dutch industry started an own discard sampling program, sampling plaice discards and since 2006 also cod discards. This program has a much higher sampling level than the program that is carried out by IMARES, but unfortunately this sampling program collects no length or age information.
These data have been analyzed by IMARES for various purposes. In a comparison it was shown that the estimates resulting from these data are very similar to the ones from IMARES’ own discard sampling program, and that the higher level of sampling results in small confidence intervals (Grift et al. 2005). Evidently, the industry’s sampling results in accurate and reliable data. STECF notes that the estimates from the industry’s sampling program validate the estimates from IMARES’ own discard program.
IMARES has evaluated the industry’s sampling program (Grift et al. 20052), and some of the conclusions are:
1. For the industry’s sampling program, the number of samples per week-trip (2) is low in comparison to typical research sampling (35-40). Since the variation among samples within week-trips is negligible in comparison to that between week-trips, the set-up of a low number of samples taken over a large number of week-trips is statistically preferable. Practical considerations (staff and transport limitations) so far made this statistical preferred set-up unfeasible for the IMARES surveys.
2. The wide coverage of the industry’s sampling program enables for the first time an analysis of spatial and temporal patterns in the discarding process. The observed spatial and temporal pattern displays a large variation in discard percentage. Knowledge of these spatial and temporal patterns might therefore lead to a better judgement of the overall magnitude of the discarding process.
3. Monitoring of the discarding process requires sufficient spatial and temporal coverage and adequate detail in the measurements (e.g. length composition). The industry’s sampling covers the spatial and temporal variation, while typical research sampling yields the required level of detail and ensures the quality of the data. The spatial-temporal pattern of the sampling program determines the estimated discard percentage that is used in the stock assessment models. Therefore, it is important to pay attention that the sampling is representative. The combination of both sampling programs will achieve an adequate result.
It may be desirable to process the information from the industry’s program to make it suitable for use in the stock assessment model. However, this requires that length measurements be carried out on the sampled discards and that length measurements of the landings are taken or that the landings by market category of the sampled vessel are made available. Only then a suitable procedure can be developed to estimate the age composition of the discards. This requirement has been communicated to the Dutch Fish Product Board (through the report by Grift et al. 2005). It should be noted that even if the fishing industry would start carrying out length measurements right now, the first full data year that includes these data would be 2007. These data would become available for stock assessments in 2008.
5.2.12.3 Redistribution of effort 4) Advise on which causes may have determined the redistribution of the beam-trawl
fleet which seems now operate closer to the shore and to investigate which effect could be expected both for flatfish and other than flatfish stocks.
2 Grift, R.E., Dekker, W., van Keeken, O., Kraak, S.B.M., van Marlen, B., Pastoors, M., Poos, J.J., Quirijns, F., Rijnsdorp, A.D., Tulp, I. 2005. Evaluation of management measures for a sustainable plaice fishery in the North Sea. RIVO report C019/05, 90 pages.

Page 42 STECF plenary meeting November 2006
IMARES has carried out a study (Quirijns and Rijnsdorp, in preparation) that concluded: • It is likely that the observed changes in distribution of the fleet are related to the
decreased TACs as well as to the decreased ratio between plaice and sole quota. Whether the decrease in the allowed days at sea has contributed to the shift in distribution of the fleet remains uncertain because there are several confounding factors such as available quota, days at sea, fuel prices and mesh size used.
• Due to the shift in the spatial distribution of both the fleet and under-sized plaice to deeper water, fishing pressure on under-sized plaice has increased. The effect of the shift of the fleet has not yet been separated from the effect of the shift of the juvenile plaice. Fishing pressure on marketable plaice and sole decreased over the period 1995-2005 which is caused by a decrease in total fishing effort (mainly through decommissioning).
STECF notes that the effort information collated by the SGRST WG on Effort Management indicates that since 2000 there has not been a substantial decrease in total fishing effort expressed as kW days at sea by the international beam trawl fleet. 5) Advise whether the scientific basis supposing a northward redistribution of the
plaice stock is sound enough and may be confirmed. Comment as adequate its possible implication on the current management framework
STECF confirms that some indication of a northward redistribution of the plaice stock is provided by the observation that in the northern and central North Sea Dutch LPUE appears to increase from 1999 onwards, but to decrease from 2002 onwards in the southern North Sea (Figure 5-10) and also by the observation that the BTS-Tridens survey covering the northern and central North Sea seems to estimate higher abundances than the BTS-Isis survey covering the southern North Sea (WGNSSK 2006). Such redistribution may result from the decreased fishing effort in the Northern North Sea. However, STECF recommends that information available from research surveys be evaluated further. STECF stresses that such redistribution does not make the stock assessment less reliable, because the tuning fleets cover the whole stock’s distribution area.
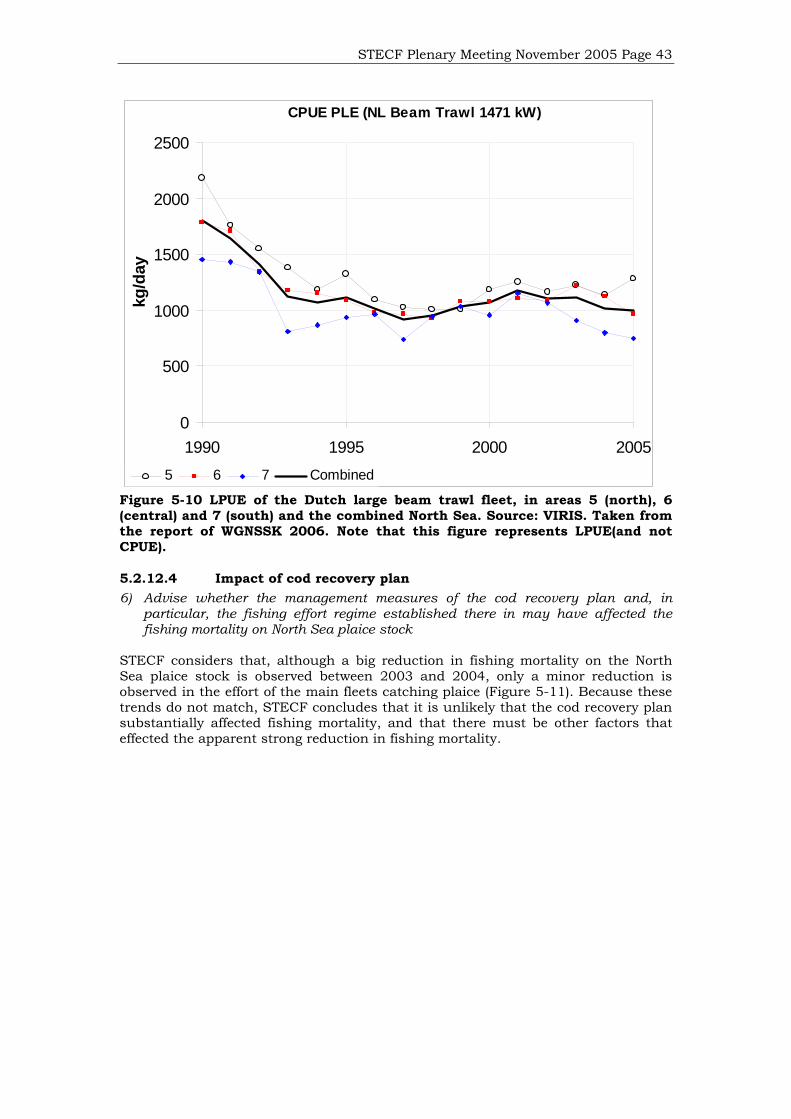
STECF Plenary Meeting November 2005 Page 43
CPUE PLE (NL Beam Trawl 1471 kW)
0
500
1000
1500
2000
2500
1990 1995 2000 2005
kg/d
ay
5 6 7 Combined
Figure 5-10 LPUE of the Dutch large beam trawl fleet, in areas 5 (north), 6 (central) and 7 (south) and the combined North Sea. Source: VIRIS. Taken from the report of WGNSSK 2006. Note that this figure represents LPUE(and not CPUE).
5.2.12.4 Impact of cod recovery plan 6) Advise whether the management measures of the cod recovery plan and, in
particular, the fishing effort regime established there in may have affected the fishing mortality on North Sea plaice stock
STECF considers that, although a big reduction in fishing mortality on the North Sea plaice stock is observed between 2003 and 2004, only a minor reduction is observed in the effort of the main fleets catching plaice (Figure 5-11). Because these trends do not match, STECF concludes that it is unlikely that the cod recovery plan substantially affected fishing mortality, and that there must be other factors that effected the apparent strong reduction in fishing mortality.
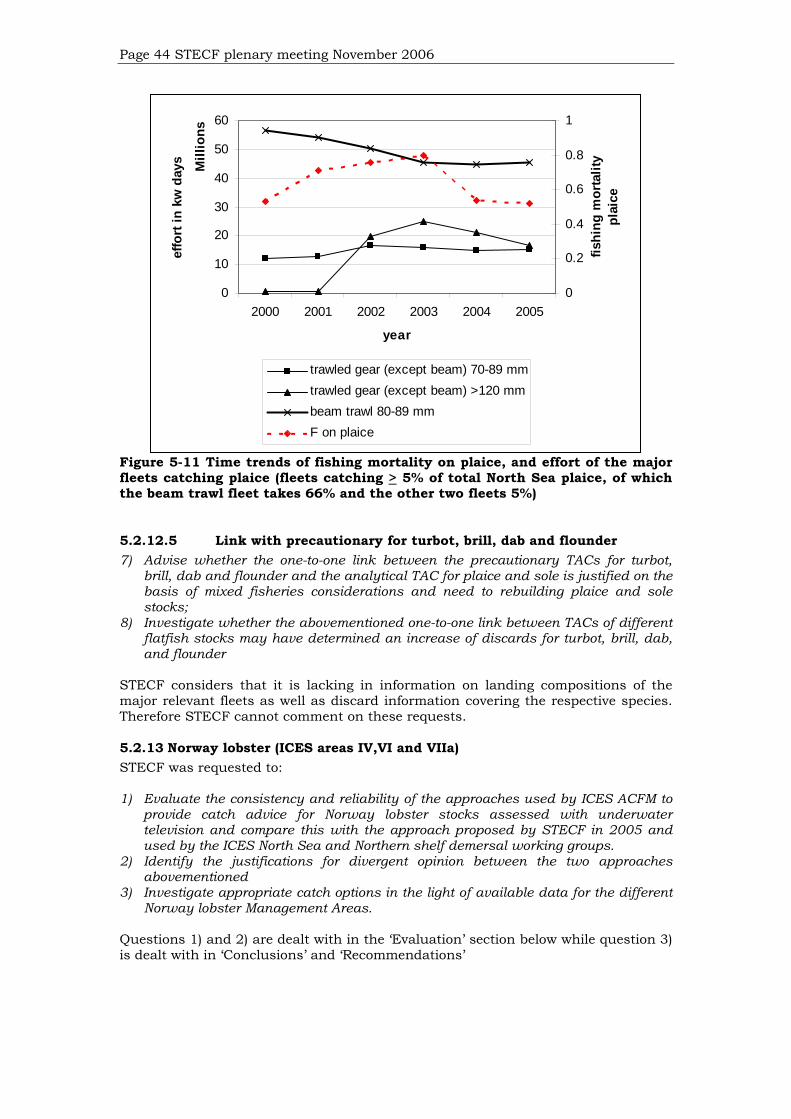
Page 44 STECF plenary meeting November 2006
0
10
20
30
40
50
60
2000 2001 2002 2003 2004 2005
Mill
ions
year
effo
rt in
kw
day
s
0
0.2
0.4
0.6
0.8
1
fishi
ng m
orta
lity
plai
ce
trawled gear (except beam) 70-89 mmtrawled gear (except beam) >120 mmbeam trawl 80-89 mmF on plaice
Figure 5-11 Time trends of fishing mortality on plaice, and effort of the major fleets catching plaice (fleets catching > 5% of total North Sea plaice, of which the beam trawl fleet takes 66% and the other two fleets 5%)
5.2.12.5 Link with precautionary for turbot, brill, dab and flounder 7) Advise whether the one-to-one link between the precautionary TACs for turbot,
brill, dab and flounder and the analytical TAC for plaice and sole is justified on the basis of mixed fisheries considerations and need to rebuilding plaice and sole stocks;
8) Investigate whether the abovementioned one-to-one link between TACs of different flatfish stocks may have determined an increase of discards for turbot, brill, dab, and flounder
STECF considers that it is lacking in information on landing compositions of the major relevant fleets as well as discard information covering the respective species. Therefore STECF cannot comment on these requests.
5.2.13 Norway lobster (ICES areas IV,VI and VIIa) STECF was requested to: 1) Evaluate the consistency and reliability of the approaches used by ICES ACFM to
provide catch advice for Norway lobster stocks assessed with underwater television and compare this with the approach proposed by STECF in 2005 and used by the ICES North Sea and Northern shelf demersal working groups.
2) Identify the justifications for divergent opinion between the two approaches abovementioned
3) Investigate appropriate catch options in the light of available data for the different Norway lobster Management Areas.
Questions 1) and 2) are dealt with in the ‘Evaluation’ section below while question 3) is dealt with in ‘Conclusions’ and ‘Recommendations’

STECF Plenary Meeting November 2005 Page 45
5.2.13.1 Background Underwater television surveys have been used to assess a number of Nephrops stocks for several years. One of the recent questions has been how to make use of the TV survey data to provide catch advice. STECF was asked at its 2005 autumn plenary meeting to advise on a sustainable approach for harvesting Nephrops and suggested the application of a harvest rate to the TV abundance data equivalent to an F0.1 mortality derived from a combined sex LCA- in general this was around 20%. TAC outcomes for Nephrops in ICES area IV and VI for 2006 were based on this approach (with a lower rate of 10% applied at the Fladen Ground). STECF also pointed out that the method should be accompanied by strict effort control and that Functional Units should be managed separately.
During 2006 an ICES Workshop on Nephrops (WKNEPH 2006)3 considered the approach and suggested that it represented a useful way forward. The method was applied by WGNSDS4 and WGNSSK5 to the most recent TV data for several Nephrops Functional Units in ICES areas IV, VI and VII. Predicted landings based on applying the F0.1 method to TV abundance data was calculated for Moray Firth (FU9), Farn Deeps (FU6), Firth of Forth (FU8), North Minch (FU11), South Minch (FU12), Firth of Clyde (FU13) and Irish Sea west (FU15). For the Fladen Ground (FU 7) the F0.1 method was also applied but a lower rate of 10% was suggested for reasons outlined in the conclusions section below.
5.2.13.2 Evaluation In considering the Working Groups’ assessments, ACFM agreed with the state of the stocks indicated by the TV data but did not accept the WGs approach used to provide advice on landings. ACFM stated for a number of stocks that “deriving target rates from an analytical framework and applying it to survey indices are among other things very sensitive to the assumption of the length-based model and the assumption that survey indices are an absolute measure of biomass.” Instead the general approach preferred by ACFM was to make use of a harvest ratio based on the historical observations from the fishery expressed as landings/TV biomass ratio (this approach also assumes an absolute measure of abundance). ACFM recognised the problem of recent high levels of under-reporting and made efforts to base the harvest ratio calculation on the period before 2000.
In principle, such an approach is reasonable and straightforward and could be applied where a time series of reliable landings and biomass data are available for a fishery in steady state equilibrium. STECF is, however, concerned that there are a number of circumstances where the application of the method yields a reference harvest ratio that is inappropriate for giving catch advice based on recent biomass; these include, inter alia:
1. Where there are biased landings arising from under-reporting 2. Where a fishery is developing and does not operate over the whole area
surveyed by TV 3. Where only a short TV series is available, especially if this is during a period
of under-reporting 4. Where the fishery is not experiencing steady state conditions and is affected
by weather and market conditions
In considering the stocks for which TV data are available it is apparent that some fall into one or more of the categories above rendering the landings based harvest
3 ICES (WKNEPH) 2006. Report of the Workshop on Nephrops Stocks (WKNEPH) ICES CM 2006/ACFM:12. Ref. RMC, FTC, LRC 4 ICES- WGNSDS 2006. Report of theWorking Group on the Assessment of Northern Shelf Demersal Stocks (WGNSDS) ICES CM 2006/ ACFM:30 5 ICES-WGNSSK 2006. Report of the Working Group on the Assessment of the Demersal Stocks in the North Sea and Skagerrak (WGNSSK). ICES CM 2006/ACFM:09

Page 46 STECF plenary meeting November 2006
rate approach suspect. For all the stocks, under-reporting has been suspected for many years although the problem appears to have been more acute since the late 1990s. The ICES WGs have repeatedly drawn attention to this problem. Notwithstanding this, the Firth of Forth, Moray Firth, North Minch, South Minch and Firth of Clyde have reasonably extensive periods of landings from earlier in the 1990s and TV surveys available for the same period. On the other hand the Farn Deeps and Irish Sea west have much shorter TV survey series (particularly the latter) during which under-reporting has been a major problem. For this reason, an historic landings based harvest rate approach is not suitable. The Fladen Ground is also seriously affected by under-reporting in recent years (anecdotal information suggests true landings around 30% higher than reported) but is also affected by a different feature during the 1990s. Unlike the previous fisheries described which have been exploited for at least 50 years, the Fladen Ground is a much newer one and when the TV survey began was in the early stages of development. Figure 5-12 shows the spatial expansion of fishing effort of the <100mm mesh nets since 1997 – effort has progressively spread to the north and east of the ground. The TV survey has covered the whole ground since it began in 1992. Thus, low harvest rates in the early years simply reflect the fact the fishery was not exploiting all of the available resource. To assume low harvest rates based on these landings would not be appropriate for the current fishery which now covers most of the ground. In fact, it is unclear how ACFM arrived at conclusions for the Farn Deeps and Fladen and for Irish Sea no catch advice was given (only an effort figure averaged for three years and based on data which excluded under 10m effort)
An evaluation of the approach used by ACFM was carried out for the five stocks identified above as having data consistent with producing a reliable ratio (Firth of Forth, Moray Firth, North Minch, South Minch and Firth of Clyde). This draws attention to a number of technical issues and implied decisions and compares harvest ratios with F0.1 derived harvest rate values.
5.2.13.2.1 Biomass estimates used in generating ratio: In calculating the reference harvest ratios, ACFM used a time series of approximate biomass estimates based on TV survey abundance multiplied by individual weights derived from very limited trawl samples collected during the TV surveys in the early 1990s (for a number of years these biomass estimates were included in the ICES WGNSSD report but owing to their approximate nature WGNSSK decided they should not be included in its 2006 report). ACFM subsequently applied the derived harvest ratios to recent biomass estimates obtained from multiplying TV survey abundance by individual weights from more extensive commercial catch sampling (considered to give a more representative indication of size composition). In most cases the inconsistency in approach gives rise to a lower harvest ratio than would be obtained by applying actual observations of commercial catch weights obtained throughout the time series. STECF computed the relevant weights based on commercial catch (discards+landings) and included these in its evaluation.
5.2.13.2.2 Use of the upper 95% confidence interval estimate of biomass to obtain a harvest rate:
The design of the underwater television surveys for these stocks permits confidence intervals to be attached to the estimates. In calculating harvest ratios in its reference period, ACFM has used the upper 95% bound of the biomass. The landings are assumed accurate. This approach results in the lowest harvest rate obtainable from the statistical outcome from the survey and is dependent on the variability in the survey. To predict future landings, ACFM has then applied this ratio not to the recent upper 95% bound of biomass, but instead to the recent estimate of mean biomass. This somewhat inconsistent approach is automatically very precautionary and generates relatively low catches. STECF considers that a more appropriate approach would have been to calculate harvest ratios based on the estimate of the mean biomass and to then apply this to the mean estimate in recent years. In order to give some indication of the statistical uncertainty the 95% confidence interval of

STECF Plenary Meeting November 2005 Page 47
the recent estimate could then be provided. For comparison STECF calculated harvest ratios using the mean estimates of biomass in the period prior to 2000 and applied them to mean biomass estimates in the catch projections.
5.2.13.2.3 Adoption of a single harvest ratio: STECF notes that ACFM applied a single harvest ratio value (15%) across the stocks evaluated here whereas examination shows some marked variability between them.
5.2.13.2.4 Comparison of estimated harvest ratios using different approaches: The table below provides a summary of harvest ratios obtained from the approaches discussed above compared with harvest rates produced by the STECF ’05 approach. It can be seen that the original calculations by ACFM producing values in the region of 15-16% are generally lower than when the same approach is used with biomasses corrected with individual weights from commercial catches obtained throughout the time series. The average rate is increased to 17%. Average harvest ratios of just below 21% are obtained when the ACFM approach is modified by basing calculations on the mean biomass estimate. Common to each of these is marked variability in harvest ratio between Functional Units. STECF observes that the average results for the modified ACFM approach are very similar to the average removals harvest rate generated using the STECF approach based on F0.1. Strictly speaking this is not a comparison of the same things since the STECF approach is a harvest rate applicable to total removals from the population including discards – in providing advice for landings from this method, an adjustment is made to take out the discard component. The equivalent STECF landings harvest rate (right hand column) is about 2% less than the removals based harvest rate and is in fact a little less than the ACFM approach based on mean biomass estimates. Annex 7 includes more detailed information on the weights, biomasses and landings used in constructing Table 5-13. Table 5-13 showing a) In the 3 left-hand columns, harvest ratios derived from using different approaches for five Norway lobster Functional Units where UTV and landings data were available in the pre-2000 period. b) In the 2 right-hand columns, harvest rates predicted by the STECF ’05 approach. Numbers in parenthesis indicate mean values in the columns above.
ACFM ACFM ACFM STECF '05 STECForiginal (correct (Modified) & WGs F0.1 & WGs F0.1
wts) removals landingsNorth Minch 21.5 22.7 26.1 21 19.4South Minch 10.3 10.3 12.6 21 19.5Clyde 14 18.8 23.5 21 18.2
(15.3) (17.2) (20.7) (21) (19)
Firth of Forth 20.3 22.3 27.4 21 17.8Moray Firth 12 11.75 14.2 19.4 18.3
(16.1) (17.0) (20.8) (20.2) (18)
5.2.13.3 Conclusions STECF concludes that under appropriate circumstances and with adequate and
reliable information, basing future landings on historic harvest rate performance is a reasonable approach. In the absence of such information, however, application of the historic harvest rate approach is inappropriate. STECF remains of the view that the approach recommended at its 2005 plenary using a harvest rate based on a fairly conservative target F (F0.1) from Y/R principles is consistent with a sustainable long term approach for Norway lobster and provides a means of giving landings advice, which is particularly valuable when reliable fishery data are sparse.

Page 48 STECF plenary meeting November 2006
Discussion (eg in ICES WKNEPH and WGNSDS) about the sensitivity of a combined sex length based assessment approach to derive the estimates of F0.1 for use as a harvest rate, led to a simulation study (Dobby and Bailey, 20066 – see Annex 9) which was presented as a working paper at WGNSSK. In simulations of the implied F obtained when the harvest rate was fixed at 20%, the resulting F was between F0.1 and Fmax under all situations simulated and in most situations, was close to F0.1. STECF suggests that functional unit-specific specific simulations reflecting local population or fishery characteristics could be performed to further investigate the performance of the approach.
STECF concludes that the approach to predict future landings based on F0.1
presented by the ICES WGs is appropriate for the Nephrops functional units in the Firth of Forth, Moray Firth, North Minch, South Minch and Firth of Clyde. For these stocks, the discussion above suggests that use of the modified ACFM approach would give very similar results. For the Farn Deeps and Irish Sea, STECF considers that the same approach is appropriate as in these cases limitations in the quality and reliability of fishery data preclude other approaches at the present time.
STECF supports the view of ICES that for the Fladen Ground a more cautious approach is required owing to the following features of this stock:
• The stock exhibits a comparatively low density (number m-2). The very large stock size arises from its widespread distribution over a large area.
• There is more limited biological data available for this stock on which to base the yield curve calculations
• The fishery is a comparatively recent one (developed mainly in the 1990s) and recruitment dynamics are less well known. The use of the STECF target based on Y/R principles assumes that recruitment is fairly constant, but this is not known and it is considered prudent to move steadily towards the longer term target.
STECF suggests that the rate of 10% proposed by WGNSSK should be applied. This strikes a balance between ACFM’s advice of 7.5% which would yield landings close to the current reported landings - known to be under-reported for several years and the STECF (F0.1) based harvest rate of around 18% predicted for this stock which would be likely to lead to increases in effort. STECF suggests that this harvest rate could be reviewed regularly and adjusted adaptively in the light of new data and greater understanding of the stock dynamics and potential.
For all of the stocks discussed here and covered by the TV surveys, STECF notes that the recent introduction of UK buyers and sellers legislation is expected to lead to significant improvements in the quality of fishery statistics. Once a time series of improved landings data are available a more comprehensive evaluation of harvest rates will be possible.
5.2.13.4 STECF Recommendations STECF recommends that for most stocks in ICES Sub-area IV assessed by UTV, the approach STECF suggested in 2005 (and adopted by WGNSSK) provides a method of obtaining landings consistent with a long term sustainable approach. For the Fladen Ground a 10% harvest rate is recommended. The estimated landings for 2007 that correspond to each of the functional units considered here is given below. Firth of Forth 2019 tonnes Farn Deeps 4301 Moray Firth 3119 Fladen Ground 14392
6 Dobby, H. and N. Bailey, 2006. Harvest rates for Nephrops. Working Document for the ICES Working Group on the Assessment of Demersal Stocks in the North Sea and Skagerrak, 5 – 14 September, 2006.

STECF Plenary Meeting November 2005 Page 49
STECF notes that there are additional Nephrops functional units in Sub-area IV that are not surveyed by UTV.
STECF recommends that for stocks in ICES Division VIa assessed by UTV, the approach STECF suggested in 2005 (and adopted by WGNSDS) provides a method of obtaining landings consistent with a long term sustainable approach. The estimated landings for 2007 that correspond to each of the functional units considered here is given below. North Minch 4498 tonnes South Minch 10116 Firth of Clyde 5271 STECF notes that there are additional areas such as sea lochs in Division VIa that are not surveyed by UTV.
STECF recommends that for the western Irish Sea stock in ICES area VIIa assessed by UTV, the approach STECF suggested in 2005 (and adopted by WGNSDS7) provides a method of obtaining landings consistent with a long term sustainable approach. The estimated landings for 2007 that corresponds to this functional unit is16748 tonnes.
STECF notes that there are additional Functional Units in the remainder of Division VII that are not surveyed by UTV or in the case of Arran Ground has a survey indicative of trends.
STECF also reiterates its recommendation made last year that Nephrops-directed fishing effort should not be allowed to increase and that Functional Units need to be managed separately to ensure that exploitation is appropriate for the size of each spatially separated resource.
STECF recommends that proportional increases in catch opportunities arising from direct abundance observations in Functional Units where quantitative information (from TV surveys or other types of assessment), should not be applied to adjacent Functional Units or ICES Areas (eg ICES Area IIIa) which do not have such quantitative information.
7 R.Scott, M.Armstrong, N.Bailey, R.Briggs, J.Elson, 2006. Re-Assessment of Nephrops in the Irish Sea : Management Area J. Report of sub-group meeting of WGNSDS (Lowestoft 1-2 August) to address specific issues raised by RGNSDS 2006 regarding the assessment of Nephrops in the Irish Sea.

Page 50 STECF plenary meeting November 2006
-4 -2 0 2 4
56
58
60
62
E6 E7 E8 E9 F0 F1 F2 F3
39
40
41
42
43
44
45
46
47
48
49
50
51
52
53
2000
1000
500
300
200
100
0
-4 -2 0 2 4
56
58
60
62
E6 E7 E8 E9 F0 F1 F2 F3
39
40
41
42
43
44
45
46
47
48
49
50
51
52
53
2000
1000
500
300
200
100
0
-4 -2 0 2 4
56
58
60
62
E6 E7 E8 E9 F0 F1 F2 F3
39
40
41
42
43
44
45
46
47
48
49
50
51
52
53
2000
1000
500
300
200
100
0
-4 -2 0 2 4
56
58
60
62
E6 E7 E8 E9 F0 F1 F2 F3
39
40
41
42
43
44
45
46
47
48
49
50
51
52
53
2000
1000
500
300
200
100
0
-4 -2 0 2 4
56
58
60
62
E6 E7 E8 E9 F0 F1 F2 F3
39
40
41
42
43
44
45
46
47
48
49
50
51
52
53
2000
1000
500
300
200
100
0
-4 -2 0 2 4
56
58
60
62
E6 E7 E8 E9 F0 F1 F2 F3
39
40
41
42
43
44
45
46
47
48
49
50
51
52
53
2000
1000
500
300
200
100
0
-4 -2 0 2 4
56
58
60
62
E6 E7 E8 E9 F0 F1 F2 F3
39
40
41
42
43
44
45
46
47
48
49
50
51
52
53
2000
1000
500
300
200
100
0
-4 -2 0 2 4
56
58
60
62
E6 E7 E8 E9 F0 F1 F2 F3
39
40
41
42
43
44
45
46
47
48
49
50
51
52
53
2000
1000
500
300
200
100
0
-4 -2 0 2 4
56
58
60
62
E6 E7 E8 E9 F0 F1 F2 F3
39
40
41
42
43
44
45
46
47
48
49
50
51
52
53
2000
1000
500
300
200
100
0
1997 1998 1999
2000
2003
20022001
2004 2005
-4 -2 0 2 4
56
58
60
62
E6 E7 E8 E9 F0 F1 F2 F3
39
40
41
42
43
44
45
46
47
48
49
50
51
52
53
2000
1000
500
300
200
100
0
-4 -2 0 2 4
56
58
60
62
E6 E7 E8 E9 F0 F1 F2 F3
39
40
41
42
43
44
45
46
47
48
49
50
51
52
53
2000
1000
500
300
200
100
0
-4 -2 0 2 4
56
58
60
62
E6 E7 E8 E9 F0 F1 F2 F3
39
40
41
42
43
44
45
46
47
48
49
50
51
52
53
2000
1000
500
300
200
100
0
-4 -2 0 2 4
56
58
60
62
E6 E7 E8 E9 F0 F1 F2 F3
39
40
41
42
43
44
45
46
47
48
49
50
51
52
53
2000
1000
500
300
200
100
0
-4 -2 0 2 4
56
58
60
62
E6 E7 E8 E9 F0 F1 F2 F3
39
40
41
42
43
44
45
46
47
48
49
50
51
52
53
2000
1000
500
300
200
100
0
-4 -2 0 2 4
56
58
60
62
E6 E7 E8 E9 F0 F1 F2 F3
39
40
41
42
43
44
45
46
47
48
49
50
51
52
53
2000
1000
500
300
200
100
0
-4 -2 0 2 4
56
58
60
62
E6 E7 E8 E9 F0 F1 F2 F3
39
40
41
42
43
44
45
46
47
48
49
50
51
52
53
2000
1000
500
300
200
100
0
-4 -2 0 2 4
56
58
60
62
E6 E7 E8 E9 F0 F1 F2 F3
39
40
41
42
43
44
45
46
47
48
49
50
51
52
53
2000
1000
500
300
200
100
0
-4 -2 0 2 4
56
58
60
62
E6 E7 E8 E9 F0 F1 F2 F3
39
40
41
42
43
44
45
46
47
48
49
50
51
52
53
2000
1000
500
300
200
100
0
1997 1998 1999
2000
2003
20022001
2004 2005
Figure 5-12 Changes in <100mm mesh effort (days absent per stat square) to north and east of Scotland, 1997-2005. Dashed outline shows location of Fladen Ground
5.2.14 Norway lobster in Bay of Biscay-Division VIII a,b (Nephrops Area N): STECF was requested to 1) Indicate whether a likely increase of 20% in 2007 catch opportunities with respect
to the recent level of 3600 tonnes is compatible with a sustainable exploitation of the stock and may be justified on the basis of latest development of the fishing gear selectivity for Nephrops and hake
2) Advise whether a possible increase of catch may have negative consequences on the recovery of hake
ICES recommended not to increase catches (in fact landings) in 2007 over the recent level of 3,600 t (2003-2005) until the strengths of the recent year-classes have been confirmed. STECF notes that assessments suggest recent improvements in SSB and recruitment. STECF notes that there are indications of a likely increase of 20% in 2007 landings at F status quo if the strength of recent improvement in recruitment is confirmed. STECF considers therefore that maintenance of status-quo F, is likely to lead to an increase in catches in 2007 that will in turn lead to increased discarding of Nephrops unless landings opportunities are increased above the recent level. Such an increase may still be justified with sustainable exploitation and be compatible with the management plan for hake so long as effort is not allowed to increase. However, STECF notes that any increase in landings opportunities in 2007 may have the undesirable effect of attracting additional effort into the fishery and this would not be compatible with the management plan for hake.

STECF Plenary Meeting November 2005 Page 51
STECF also notes the latest development of the fishing gear selectivity for Nephrops and hake and welcomes this as an important step. STECF considers, however, that given the likely selectivity of Nephrops in 70mm nets (compared with that described in larger meshes - item 2.xv), the improvement may not be sufficient to avoid significant catches of the incoming strong cohorts of Nephrops, if such strong cohorts are confirmed.
STECF notes that a status quo F for this fishery is consistent with the recovery plan of hake but that maintenance of this level of F is dependent on carefully controlling effort
5.2.15 Whitefish selectivity in the Norway lobster fishery STECF was requested to 1) Advise on the selectivity effect on catches of Norway lobster, cod, haddock and
whiting of a 5 metre square mesh panel inserted in various topside positions 4-18 metres from the codend of fishing gear in the 70-99mm gear category.
This question is a follow up to earlier questions to STECF (from North Sea RAC and UK authorities) asking for evaluations of the benefits of proposed modifications to 70-99mm gear. STECF’s previous response was that observations of selectivity made during sea-trials were required before such questions could be adequately answered.
STECF was provided with a report of recent fishing gear trials made by FRS Marine Laboratory during a commercial fishing vessel charter. A copy of the report can be found in Annex 2. The trials investigated 3 different net configurations including two of those described in the question to STECF. One gear had the panel at 13-18m from the codend, while a second had the panel positioned at 4-9 m from the codend. In both cases the square mesh panel was of 120mm knotless mesh size and the mesh in the codend was 95mm. The EU standard gear with 80mm mesh provided the third option. STECF notes that these trials used the ‘selectivity’ (twin trawl) methodology (rather than comparative fishing approach) fishing each test net alongside a small meshed control net. Furthermore, STECF notes that in most cases there were sufficient successful hauls to allow statistical analysis of the selectivities of different species by the different gears and that significant results were obtained in some cases.
The main outcomes were as follow.:
1. Nephrops – there was no significant loss of Nephrops from any of the gears 2. In the EU Standard gear, all whttefish above about 20cm length were
retained 3. In the modified gear with square mesh panel at13-18m from the codend, all
the cod were retained and 50% of the haddock and whiting escaped at lengths of 38cm and 32cm respectively
4. In the modified gear with square mesh panel at 4-9m from the codend, 50% of cod escaped at a length of 31cm while 100% is retained at around 45cm. For haddock & whiting the increase in selectivity is very marked with about 50% escaping at a length just above 45cm.
STECF concludes that the findings from this work are robust and that the gear with the square mesh panel close to the codend allows cod to escape. The finding was statistically significant. Retention of other fish species is markedly reduced but Nephrops are not affected. STECF notes that given that the relatively high survival rate of gadoids passing through gears of this type (>90% survival), the release of fish is potentially beneficial. The effects of implementing the net with a square mesh panel at 4-9m from the codend on stock biomass is investigated below.
Additional documentation was provided to STECF describing several other pieces of gear work conducted by UK laboratories. Short abstracts of these submissions are provided below.
Page 52 STECF plenary meeting November 2006
5.2.15.1 Swedish Grid trials in the Farn Deeps fishery. (Document supplied by CEFAS -see Annex 3) A catch comparison method was used on a commercial vessel to assess the potential of a Swedish grid and square mesh codend in reducing fish bycatch, in particular cod, in the Farn Deeps Nephrops fishery (England). Catches from a standard trawl with a diamond mesh codend, currently used in the fishery, were compared with a trawl with a Swedish grid and with a trawl with a Swedish grid and square mesh codend. The trawl with the grid and diamond mesh codend caught no cod of marketable size and fewer large whiting, plaice and haddock than the standard trawl. However, the trawl also caught twice the number of small cod and more haddock (and more Nephrops) than the standard trawl. The trawl with grid and square mesh codend caught less cod, haddock and whiting in all length classes, but Nephrops catches were around half that of the standard trawl. The latter result provides observations that support the whitefish selection results in the FRS trial, but the gear does not retain Nephrops so effectively.
5.2.15.2 Cutaway trawl: (Document supplied by CEFAS – see Annex 4) This work investigated a design of Nephrops trawl (the cutaway trawl), tested in the Farne Deeps fishery of the North Sea, which reduced by-catches of whiting by 50% (across the length range), without any loss of Nephrops. The cutaway trawl could therefore potentially be used to reduce discarding of whiting in certain fisheries. Several comparisons were made between the cutaway trawl and three designs of commercial trawl in use in Nephrops fisheries. Biological and economic comparisons were also made. Vessel size (length and engine power) did not affect the selectivity parameters obtained with the cutaway trawl, when the sea trials were repeated on vessels ranging from 9.9m LOA (150 hp) to 21m LOA (650 hp). The work tentatively suggests that there may be a reduction in the catch of small cod but this is not statistically significant and there were few cod caught. Length dependent separation for cod has not been observed in other trials of horizontal separator panels.
5.2.15.3 Improving the effectiveness of square mesh panels: (Document supplied by CEFAS – see Annex 5) This work involves making modifications to square mesh panel material and colouring and should be seen as a work in progress moving towards more effective designs.
5.2.15.4 Improving selectivity in the Irish Sea Nephrops fishery: (Notes supplied by AFBI – see Annex 6) The Irish Sea Nephrops fishery predominantly uses single net or twin-rig otter trawls of low headline height (< 1.5 m) and the same mesh size (70-79mm) throughout with a mandatory square mesh size panel of 80mm mesh, or a similar net of 80-99 mm mesh (mainly twin-rig vessels). Vessels using these gears specifically target Nephrops and contribute approximately 90% of the total UK Nephrops landings (2000-2005) from the Irish Sea. Low headline trawls such as those used in the Irish Sea tend to reduce gadoid catches. A number of devices have been suggested for use in the Irish Sea to further improve selectivity and although studies have examined a range of devices most experience a loss of some Nephrops. Swedish Grids provide good separation of whitefish in stocks in Division IIIa where Nephrops are large, however it is likely that a significant proportion of the Nephrops catch would escape in Irish Sea fisheries where Nephrops are small. The Northern Ireland industry is investigating appropriate selective gear alternatives for the Irish Sea under FIFG funded projects. One year of trials has been completed and further studies are planned for 2007.
STECF notes that the various initiatives and trials summarised above make varying contributions to the selectivity of whitefish, particularly haddock and whiting, although most of them do not appear to enhance the release of cod to any great extent. Trials in western North Sea fisheries using the Swedish grid suggested that while larger cod were released, small ones were retained. STECF was unable to comment further on the efficacy of these additional developments or to investigate

STECF Plenary Meeting November 2005 Page 53
what contribution their implementation might make to the development of whitefish stock biomasses.
5.2.15.5 Impact on biomass 2) advise on what would the effect of the adoption of such measures be on the
projected biomass(es) for the stocks abovementioned. STECF was able to consider the effect of the adoption of the gear with a 5m square mesh panel positioned at 4-9 metres from the codend by conducting deterministic forecasts using a spreadsheet tool. Projected biomass, yields and discard rates were computed for cod and haddock under 2 different scenarios as follows:
– new gear applied from 2007 to Scottish vessels using under 100mm mesh gear
– new gear applied from 2007 to international vessels using under 100mm mesh gear
In order to make the prediction, the latest cod and haddock assessment data from the 2006 WGNSSK report were input to provide a starting point and fleet information from the most recent (2006) report of SGRST input to permit the calculation of partial Fs for different North Sea fleet components. This material provided data to the end of 2005 and is taken as a baseline against which comparisons of the effects of the new gear are made. In 2006, a 15% effort reduction was imposed and a multiplier was applied to take account of this.
Fuller details of the approach and main results are given in Annex 8. The projected biomasses of cod and haddock under the two scenarios described are shown in Figure 5-13. Cod – new gear Scottish vessels only Haddock – new gear Scottish vessels only
% change in cod stock from baseline
0.0
5.0
10.0
15.0
20.0
2005 2006 2007 2008 2010 2012 2014
% c
hang
e in
bio
mas
s
TSB SSB
% change in haddock stock from baseline
0.0
5.0
10.0
15.0
20.0
2005 2006 2007 2008 2010 2012 2014
% c
hang
e in
Bio
mas
s
TSB SSB
Cod – new gear all International fleet Haddock – new gear all International fleet
% change in cod stock from baseline
0.0
5.0
10.0
15.0
20.0
2005 2006 2007 2008 2010 2012 2014
% c
hang
e in
bio
mas
s
TSB SSB
% change in haddock stock from baseline
0.0
5.0
10.0
15.0
20.0
2005 2006 2007 2008 2010 2012 2014
% c
hang
e in
Bio
mas
s
TSB SSB
Figure 5-13 projected biomass of cod and haddock STECF concludes that the implementation of the improved selectivity gear with the square mesh panel at 4-9m from the codend will lead to modest medium term increases in both SSB and TSB of cod and haddock. STECF also notes that since Scotland contributes only part of the cod catch, greater benefits to cod biomass accrue from the implementation of this gear across all the 70-99mm vessels in the

Page 54 STECF plenary meeting November 2006
International fleet (17% increase in SSB compared to 5% increase for implementation in Scotland only). On the other hand for haddock there is little difference between the two implementations since Scotland accounts for most of the haddock anyway.
STECF also draws attention to the marked reductions in discarding of cod (up to 50%) and haddock (up to 85%) in these smaller mesh gears following introduction of the new gear configuration and notes that in the medium term there is some increase in yield to the larger mesh fleets in the North Sea for both species. On the other hand, the new gear configuration also significantly reduces the yield of haddock in the short term and there is no subsequent recovery of yield in the medium to long term for the small mesh gears with the new gear configuration.
Temporal restrictions prevented analysis of whiting data but given the similar increases in escapement shown in the selectivity trials by whiting and haddock, STECF is of the opinion that similar improvements in reductions of discards and longer term losses in whiting yield would be likely to be experienced by vessels using the modified gears. In view of the likely losses of haddock and whiting from these small mesh fisheries, STECF considers that an economic study of the implications of implementing the gear measure would be informative.
5.3 FISHING EFFORT MANAGEMENT
5.3.1 Background STECF notes that the SGRST on fishing effort management during its three meetings in the course of 2006 (Barza d’Ispra, Italy, during 13-17 March and 5-9 June; Lisbon, Portugal 9-13 October) and through correspondence compiled relevant fishing effort and catch information including discards with regard to fleet specific effort management measures associated to the recovery or long term management plans of specific stocks. The specific terms of references were: 1) Review of the current systems for the management of fishing effort and, where
applicable, fleet capacity: a. Annex IIa of Regulation 51/2006 in the context of the cod recovery plan
(Regulation 423/2004); b. Annex IIb of Regulation 51/2006 in the context of the recovery plan for
Southern hake and Nephrops (Regulation 2166/2005); c. Annex IIc of Regulation 51/2006 in the context of the recovery of Western
Channel sole. d. Regulation 388/2006 in the context of management of Bay of Biscay sole. e. Regulation 1415/2004 in the context of protection of sensitive resources in
the western waters. The reviews should include: 1) A synopsis of the biological state of the relevant resources, including an
assessment of the proportion by which fishing mortality needs to be reduced in order to conform to (i) precautionary criteria; (ii) maximum sustainable yield; (iii) the relevant long-term management arrangement.
2) Details of historic effort deployed in each fishery, disaggregated by gear type and by Member State, for the longest available time-series.
3) Details of historic catches and discards made in each fishery, disaggregated by age, by gear type and by Member State, for the longest available time-series.
4) Relevant information concerning the development of the efficiency of fishing operations ("technological creep").
5.3.2 STECF opinion STECF generally endorses the findings and data aggregations summarised in the last SGRST meeting report. However, STECF amended the reviews of the biological

STECF Plenary Meeting November 2005 Page 55
state of the relevant resources in accordance with most recent ICES deliberations regarding exploitation rates associated with high long term yields. While SGRST in the absence of a scientifically proposed Fmsy value interpreted Fmax as an appropriate proxy and provided required reductions in fishing mortality. For the stocks examined in the SGRST report, STECF in keeping with ICES, interpreted Fmax as the upper limit of a range of fishing mortalities associated with high long term yields between F0.1 and Fmax. As a result STECF has revised the recommendations relating to the status of the relevant resources accordingly. For the stock of sole in the Western Channel, F0.1 is advised as a point estimate for fishing mortality associated with high long-term yield.
STECF notes that
• the effort, landings and discards by derogations (fleets by gear groups, mesh size and special derogations) are inconsistently aggregated and reported by member states. Implications regarding interpretations are explained under the specific reviews of the SGRST reports.
• sampling of catch at sea including discards is expensive and difficult. This means that sampling coverage tends to be rather limited, and estimates of discards are subject to high uncertainty. This is true of all the discard data used, and in some cases the discard estimates presented represent the first attempt to use the discard data from some fisheries in an advisory context. Where the coverage is considered adequate to estimate the overall catch compositions of specific fleets these are presented, but they are intended only to provide an approximate indication of fleet catch compositions.
• A major source of uncertainty in determining the current state of many stocks is uncertainty in estimates of total catch. This could be addressed by closer cooperation between the industry and science including wider sampling coverage through observer trips. However STECF recommends that any such attempts to improve information on total catches should not lead to parallel data sources or evaluation processes.
• for most of the analyses considered by SGRST, age-disaggregated data are not necessary. It would considerably simplify any similar future data compilation and analysis if only age-aggregated data were requested.
STECF recommends that
• the task of European fleet specific data compilations of nominal effort and catch be better institutionalised and conducted on a routine basis. The revision of the Data Collection Regulation should provide the essential parameters of the fleet specific catch and effort regulations to allow their evaluations.
• national data provisions should include those parameters defined in Annex IIA-IIC of Council Reg. 51/2006 to allow their review. Most countries were unable to aggregate their vessels and catch and effort data according to specified criteria, i.e. multi rigging, sorting or escapement devices or/and in-season management plans. This requires the direct involvement of the national control and enforcement institutions in the provision of such data. Deficiencies in the current database are given in the section ‘general considerations’ of the SGRST report.
STECF responses regarding the review of Annex IIA of Regulation 51/2006 in the context of the cod recovery plan (Regulation 423/2004):
• Despite the uncertainties in the most recent assessment, STECF agrees with the ICES advice that F of the cod stock in the Kattegat should be reduced to zero in order to conform to precautionary criteria. In the absence of defined reference points, STECF is unable to quantify the proportion by which the

Page 56 STECF plenary meeting November 2006
fishing mortality needs to be reduced to conform to FMSY. No long term management references are defined apart from the cod recovery plan.
• STECF agrees with the ICES advice that F of the cod stock in the Skagerrak, North Sea and Eastern Channel should be reduced to zero in order to conform to precautionary criteria. The minimum reduction by which the fishing mortality of the cod stock in the Skagerrak, North Sea and Eastern Channel needs to be reduced to conform to FMSY or its proxy is estimated to approximately 77%. The joint EU-Norway agreement provides a long term management target. Based on the available scientific indications STECF concludes that a stringent reduction in fishing mortality of more than 50% is required to conform to the long term management.
• STECF agrees with the ICES advice that F of the cod stock West of Scotland should be reduced to zero in order to conform to precautionary criteria. STECF is unable to precisely quantify the proportion by which the fishing mortality of the cod stock West of Scotland needs to be reduced to conform to FMSY, given the uncertainties in the most recent assessment. Based on the available scientific indications STECF-SGRST concludes that a stringent reduction in fishing mortality is required to conform to FMSY. No long term management references are defined apart from the cod recovery plan.
• STECF agrees with the ICES advice that F of the cod stock in the Irish Sea should be reduced to zero in order to conform to precautionary criteria. The minimum reduction in fishing mortality consistent with FMSY or its proxy is estimated to amount to 70%. No long term management references are defined apart from the cod recovery plan.
• STECF notes a high consistency between recent effort data submissions and historic effort data submissions to the STECF subgroups on cod recovery reviews in 2005 for most countries but recognises consistently higher efforts being reported from France, UK-Scotland, and Ireland in certain areas. Trends in nominal effort by derogations as defined in Council Reg. 51/2006 Annex IIA are given in the report.
• STECF notes a high constancy in catch compositions for many derogations during 2003-2005. Catch compositions by derogations as defined in Council Reg. 51/2006 Annex IIA are given in the SGRST report.
• STECF notes that SGRST analysed and discussed 4 proposed derogations by France (3) and UK (1). A Danish proposal for gill and trammel nets was officially withdrawn.
STECF responses regarding the review of Annex IIB of Regulation 51/2006 in the context of the recovery plan for Southern hake and Nephrops (Regulation 2166/2005)
• STECF agrees with the ICES advice that F of the southern hake stock should be reduced to zero in order to conform to precautionary criteria. In the absence of defined reference points, STECF is unable to quantify the proportion by which the fishing mortality needs to be reduced to conform to FMSY. No long term management references are defined apart from the hake recovery plan.
• In the absence of defined reference points, STECF is unable to quantify the proportion by which the fishing mortality of the functional units of southern Nephrops needs to be reduced to conform to precautionary criteria, MSY and long term management criteria. STECF notes that the recovery plan of such Nephrops stocks is closely linked to the recovery of the Southern hake stock. There is no long term management agreement.
• STECF was unable to fully review the requested parameters due to data constraints. Effort trends and landings compositions of the derogations defined in Council Reg. 51/2006 Annex IIB are given based on Portuguese data only. Specific problems related to the management of fishing effort in

STECF Plenary Meeting November 2005 Page 57
the context of the recovery of Southern hake and Nephrops are discussed in the SGRST report.
STECF responses regarding the review of Annex IIC of Regulation 51/2006 in the context of the recovery of Western Channel sole (proposal COM (2003) 819 final)
• STECF quantifies the proportion by which the fishing mortality of the stock of Western Channel sole needs to be reduced in order to conform to precautionary criteria to approximately 60%. The reduction in fishing mortality consistent with MSY or its proxy (F0.1) amounts to 75%. There is no long-term management agreement.
• Trends in nominal effort by derogations as defined in Council Reg. 51/2006 Annex IIC are given. Most effort is deployed by fleets other than those subject to effort derogations.
• Catch compositions by derogations as defined in Council Reg. 51/2006 Annex IIC are given. STECF notes a high constancy in catch compositions of regulated derogations during 2003-2005. There are significant sole landings by other fleets other than those subject to effort derogations.
STECF responses regarding the review of Council Regulation 388/2006 in the context of management of Bay of Biscay sole
• STECF quantifies the proportion by which the fishing mortality of the stock of Bay of Biscay sole needs to be reduced in order to conform to precautionary criteria to approximately 11%. The minimum reduction in fishing mortality consistent with MSY or its proxy amounts to 55%. The long term management plan does not define a target fishing mortality but defines an annual reduction of 10% if SSB<Bpa.
• STECF did not receive adequate effort or catch data to review Council Reg. 388/2006 in the context of management of Bay of Biscay sole.
STECF responses regarding the review of Council Regulation 1415/2004 in the context of protection of sensitive resources in the western waters
• STECF was unable to separate the effort directed to sensitive species from the overall effort for deepwater species (covered by Council Reg. 2347/2002), scallops, edible and spider crabs. As an initial step towards the requested evaluation, SGRST in its report presents effort trends by country and year for all aggregated effort deployed by the demersal gears, except dredges and traps. These gears (otter trawl, seine, gill net and longline) are considered potentially contributing to the catch of the relevant species not explicitly defined as deep sea species. For scallop and crab fisheries, dredges and trap nominal effort values are listed separately.
• STECF notes that the boundaries of the area southwest of Ireland defined as biologically sensitive (Council Reg. 1954/2003, Article 6) are inconsistent with the geographical resolution of the effort records in the national official logbook statistics, which is by statistical rectangle. Without access to VMS (vessel monitoring system) data STECF is unable to identify and estimate the requested effort values for the biological sensitive area.
5.4 GREY SEAL DIET COMPOSITION AND FISH CONSUMPTION IN THE NORTH SEA
The Commission services were informed about a recently published report on the diet composition of NS grey seals that has been produced in a DEFRA-funded research conducted by the SMRU (University of St. Andrews).
STECF was requested to:
Page 58 STECF plenary meeting November 2006
1) Evaluate and comment as adequate this report and to highlight whether and how the results of this research may have a bearing on the STECF’s advice on North Sea fish stocks
STECF was unable to adequately address this request and has provided no response.
5.5 ELECTRIC PULSE TRAWLING
1) STECF is requested to evaluate and comment on the ICES advice on pulse trawl electric fishing underlining the possible short and long-term biological and economic consequences of using this fishing method and, in particular, whether its use would be
i. compatible with a sustainable exploitation of the target resources as well as with environmental conservation concerns ( both no-target species and bottom communities), and
ii. economically feasible from both a fisheries and an individual vessel perspective.
2) STECF is also requested to identify the conditions for a fishery monitoring system with a view to collect possible missing information.
ICES was unable to draw definitive conclusions due to the equivocal nature of the data, in particular the catch at length for plaice and sole and direct trawl mortality estimates of benthic species. There is evidence that cod suffered from spinal damage due to exposure to the pulse, which is of major concern. This type of damage is regularly observed in freshwater species where this technology has been utilised for many decades.
STECF notes that in the “Invited overview: conclusions from a review of electrofishing and it harmful effects on fishing” (Review in Fish Biology and Fisheries 13: 445-453, 2003), a synthesis of literature on electrofishing and its harmful effects, it was concluded that spinal injuries and associated haemorrhages have been documented in over 50% of the cases.
ICES concluded that there are indications that the gear could inflict increased mortality on target and non-target species that contact the gear but are not retained. ICES also concluded that the pulse trawl has some preferable attributes compared to the standard beam trawl with tickler chains but that the potential for inflicting an increased unaccounted mortality on target and non-target species requires additional experiments before final conclusions could be drawn on the likely overall ecosystem effects of this gear.
STECF is of the opinion that although the use of electric pulse trawl fishing in open sea results in a reduction of fuel consumption and a reduction in swept area, there are a number of wider ecological issues that need to be resolved.
STECF notes that two data sets were available for determining the wider stock implications, one from research vessel trials and one from commercial trails. Both data sets providing different conclusions on a number of issues and hence in total remain inconclusive.
STECF notes that, while the removal of the tickler chains does reduce the mechanical stress exerted on the seabed (simply by reducing the cumulative removal of sediment), this does not involve an equivalent reduction in trawl path mortality. Research showed that there was a reduction in trawl path mortality for some species and an increase for others but the statistical significance for both was marginal. Using the pulse trawl, the reduction in catches of benthic invertebrates is high (51%) but the overall catch efficiency is less than 10% and for almost half the species encountered, less than 5%.
STECF also notes that from catch at length data for plaice and sole the research vessel trails showed a 16% reduction in plaice catches across all length classes; whilst the commercial trials showed no significant reduction in catches of plaice below MLS but a 35% reduction in catches above the MLS. By contrast, the research vessel data collected using the electrical pulse trawl showed that for sole the

STECF Plenary Meeting November 2005 Page 59
probability of capture increased with length and that higher catch rates were obtained for fish larger than ~25cm in length. Conversely, the commercial trials failed to show any significant length dependency for sole with a ~25% reduction in catches across all length classes.” It is therefore not possible to conclude that there was “a better selectivity for sole” as noted in the EU proposal in the Commission non-paper. However, selectivity for plaice seemed to be better. Similarly there was little evidence to suggest that the use of beam trawl, using pulse trawl resulted in “an improved catch quality”.
A major concern of STECF relates to the potential impact on vertebrate species. There is information to suggest that the stimulus being used may be capable of damaging (spinal breakage and internal haemorrhaging) fish species. A number of cod retained in the pulse gear were noted to have suffered from snapped spines - this was not observed in the standard gear. The frequency of the pulse is known to be above the threshold that induces tetanus and the induction of strong muscle stimulus is likely to be the cause of the spinal injuries and therefore STECF recommends that trawl in its current form should not be promoted at a commercial level.
Furthermore STECF is of the opinion that the pulse shape and frequency are the key components of the pulse and are responsible for such damage, yet no provision is made for controlling these parameters. The EU proposal (Commission non-paper) recommends a pulse voltage of 15 volt, however it is not clear what exactly is meant by this voltage. If it is the “average voltage” or a maximum value. Pulse amplitude, frequency and pulse duration should also be clearly specified. In addition, the non-uniform nature of the field and the pulse shape should be taken into consideration in defining the operational criteria. The information presented in the Commission non-paper is not sufficient to assess possible damage to fish. Therefore STECF recommends that the ‘precise 3D distribution of the field in the area of the electrodes needs to be described’, so that tank experiments can be conducted in order to evaluate the effect of fish position, orientation and length relative to the electrodes. STECF stresses that an evaluation of this information is needed before any derogation to use this method of fishing can be granted.
Taken into account in particular the unknown effect of pulse trawl fisheries on non target species and the potential impact on vertebrates and invertebrate species, STECF concludes that although the development of this technology should not be halted, there are a number of issues that need to be resolved before any derogation can be granted.
STECF was not in a position to evaluate the economically feasibility from both a fisheries and an individual vessel perspective.
5.6 MIXED FISHERIES
5.6.1 Background STECF notes that the SGRST on mixed fisheries in 2006 (Lisbon, Portugal, 9-13 October) addressed various specific questions pertaining to a temporary change from a TAC dominated management regime to a pure fishing effort management regime in the Kattegat within a pilot project and related potential consequences. The specific terms of references were:
Priority 1: 1. What is the current level of fishing effort (including boats <10m)? 2. What is the relation between nominal fishing effort and fishing mortality at
present? 3. How has it evolved over the last decade taking into account technical creep? 4. How many days of fishing per month would correspond to the existing cod
recovery objectives and TACs and quotas for demersal stocks applying to the whole fleet under a pure effort management regime?
5. What are the different options for an implementation scheme that will ensure cod recovery?

Page 60 STECF plenary meeting November 2006
6. Do we need closed periods/areas to support the objectives of sustainable stock management and cod recovery?
7. What are the discard rates at present? Priority 2 1. What are indicators and reference points to monitor the effects of the scheme
on the stocks? 2. How do fishing activities change under a pure effort management system
compared to the current system including discarding? (distinguish short-, medium- and long-term)
Questions in relation to the profitability of the fisheries sector: 3) Priority 1
a. How has the profitability of the catching sector fishing on demersal stocks in the Kattegat evolved over the last decade?
b. How have market prices evolved over the last decade? c. What is the degree of interdependency of the auxiliary sector (e.g.
processing industry, harbour facilities) with the demersal fishery in the Kattegat?
4) Priority 2 d. What are indicators and reference points to monitor the effects of the
scheme on the catching sector? e. What is the relation to the rest of the fleet? f. How does profitability change under a pure effort management system
compared to the current system? (distinguish short-, medium- and long-term)
5.6.2 STECF opinion STECF generally endorses the fleet specific effort quantifications and catch compositions provided by the SGRST and notes that the data are consistent with the figures given in the report on fishing effort management regarding the management area of the Kattegat. STECF notes that SGRST provides in its report, proposals and detailed discussions with regard to priority 2 questions, asking for potential indicators and reference points to monitor the effects of the scheme on the stocks and how fishing activities change under a pure effort management system compared to the current system including discarding. STECF notes that SGRST did not address any ToR related to the profitability of the fisheries sector due to lack of expertise available during the meeting.
STECF responses regarding specific questions of priority 1:
5.6.2.1 Question 1: What is the current level of fishing effort (including boats <10m)?
The Danish and Swedish demersal fisheries in 2005 deployed 4.4 million kW days. Since 2000, the total demersal effort by Denmark and Sweden decreased by about 40%. Fleet specific nominal effort data are given in Tables 2.1.1 and 2.1.2 in the SGRST report on mixed fisheries for Denmark and Sweden, respectively, and in the Table 3.2.2.2.1 in the SGRST report on fishing effort management. STECF notes that the Kattegat represents a rather small management area and that the regulation by days at sea may result in imprecise effort estimates because boats may leave or enter the area during an individual day (mainly for Skagerrak). STECF thereby notes that effort data are uncertain and should be interpreted with caution. In the effort data used for this report this means that a vessel is assigned a specific area based on the largest proportion of the catch of that day in each area.

STECF Plenary Meeting November 2005 Page 61
5.6.2.2 Question 2: What is the relation between nominal fishing effort and fishing mortality at present?
There are uncertainties in the recent assessments and fishing mortality estimates are lacking. Furthermore, there is not necessarily a direct relation between effective and nominal effort. Therefore, STECF is not able to estimate the relation between nominal effort and fishing mortality at present. In order to evaluate the partial contribution to the fishing mortalities by fleet their partial contribution to total landings are indicated in the SGRST report (Tables 2.2.1 and 2.2.2 for Denmark and Sweden, respectively). In 2003-2005, trawlers with mesh size greater than 90mm accounted for the following proportions of the total landings of cod (68%), plaice (53%), sole (34%) and Nephrops (80%).
5.6.2.3 Question 3: How has it evolved over the last decade taking into account technical creep?
STECF does not support the opinion of SGRST concluding on a likely small technical creep due to the advanced age of the majority of the fishing vessels. There is no further information provided on the issue of technological creeping.
5.6.2.4 Question 4: How many days of fishing per month would correspond to the existing cod recovery objectives and TACs and quotas for demersal stocks applying to the whole fleet under a pure effort management regime?
STECF agrees with ACFM advice that there should be no fishing on this stock in 2007. However, STECF is not unable to estimate a TAC or the corresponding number of fishing days per month that would correspond to Article 7 of the cod recovery plan. Because of the exceptional circumstances i.e. SSB is predicted to remain below Blim in 2008 even with no fishery in 2007, the setting of the TAC for 2007 is the responsibility of the Commission and the Council.
5.6.2.5 Question 5: What are the different options for an implementation scheme that will ensure cod recovery?
As the relationship between the nominal effort and fishing mortalities cannot be predicted, the initial level of total effort should be a stringent reduction on the 2005 estimate of effort. In order to support cod recovery, STECF recommends to take into consideration the seasonal variability in cod catch rates and to promote more selective gears. To secure successful implementation of an effort based management system, it is considered important that system performance is monitored and evaluated in real time so that changes can be introduced in an adaptive management process. In addition to annual catch statistics obtained through sales slips and logbooks; ‘real time’ data could be collected from reference vessels within each fleet segment participating in the effort management project. Vessels participating in the pilot project could be equipped with VMS or AIS and electronic logbooks to facilitate ‘real time’ data collection. In order to obtain more fishery independent data on biomass and distribution of the major species, it would be desirable to increase the coverage of surveys undertaken in the Kattegat (IBTS Q1 and Q3, and national coastal surveys).
5.6.2.6 Question 6: Do we need closed periods/areas to support the objectives of sustainable stock management and cod recovery?
Cod is a quite mobile species, which implies that closed seasons would need to be long and areas wide in order to be effective. To avoid unwanted effects in adjacent areas through relocation of effort, closed seasons and areas would need to be designed as supplementary measures to effort regulations rather than standing alone. STECF notes that the location and timing of spawning aggregation of cod in the Kattegat is well known.

Page 62 STECF plenary meeting November 2006
5.6.2.7 Question 7: What are the discard rates at present? The Kattegat discard estimates are based on Swedish discard data only. Discard data is available for trawl fisheries with mesh sizes equal to or larger than 90mm. This is the major gear category used in the Kattegat (over 70% of total nominal effort in 2005). Main target species for this fleet segment are Nephrops, cod, plaice and sole. The gear category as a whole is effectively a mixed Nephrops/fish fishery, though individual fishing operations can target particular species quite effectively. In addition to the more specialized Nephrops vessels, the segment also includes vessels fishing for cod, plaice and sole. Landings of cod from this gear category constituted 72% of all cod landings, 97 % of Nephrops landings, 43% of plaice landings, and 39% of sole landings in 2005. Discard rates in weight (Fig. 2.7.1) are estimated for cod (23-43%), plaice (~40%), and Nephrops (30-40%).
5.7 DEEP SEA GILLNET Deepwater fisheries developed in Community waters in the late 1980s and early 1990s. Research work focused on description of fisheries, biology of the species caught and assessments of the state of these stocks. Most of this work took place in the mid and late 1990s. In addition there were a number of studies investigating the effects of lost and abandoned gillnets in European fisheries, though these did not specifically cover deepwater fisheries. It became clear that no information existed on gillnet fisheries for deep-water species. In response to this, a research consortium from UK, Ireland and Norway conducted a study called DEEPNET to investigate fixed net fisheries for deepwater species in the NE Atlantic.
Based, largely, on the results of DEEPNET, Council Regulation 51/2006 Annex III, Paragraph 8 introduced a ban on gillnetting in waters deeper than 200 m in 2006. This regulation stipulated that Community vessels should not deploy gillnets, entangling nets or trammel nets at any position where the charted depth is greater than 200 m in ICES Divisions VIa, VIb, VIIb, VIIc, VIIj and VIIk and ICES Sub-area XII east of 270 W. This ban only applies until the end of 2006. NEAFC also introduced these measures on a complimentary basis in the NEAFC Regulatory Area. The NEAFC ban is indefinite, pending adoption of agreed management measures.
A derogation from Council Regulation 51/2006 was introduced in June 2006, allowing for the reopening of targeted gillnet fishing for hake (941/2006) in the above ICES Sub-areas and Divisions, in waters of charted depths less than 600 m.
This meeting was convened by the Commission in order to review the information available on gillnet fisheries in depths of more than 200 m, to define these fisheries and to propose management measures.
The group had the following terms of reference: 1) Identify the fisheries that use trammel nets, entangling nets and bottom-set
gillnets in waters in the ICES statistical areas that have a charted depth of greater than 200 metres, describing their seasonal and spatial distribution, the characteristics and selectivity of the gears used, the species targeted, the major by-catch species, and estimates of discard rates.
2) Suggest appropriate descriptors that would allow the different fisheries to be reliably delimited, with a view to applying appropriate management measures to each of them.
3) Recommend measures to regulate each of the fisheries identified, taking into account the difficulties of monitoring and control, notably to ensure good selectivity, to avoid excessive soak-times and to ensure that lost or abandoned nets can be quickly retrieved.
4) To assess the possible consequences of introducing the new regulatory measures, such as the diversion of effort to other fisheries.
5.7.1 STECF recommendations STECF adopts the report of the Ad hoc Working Group and endorses the recommendations presented. The main points of these recommendations are

STECF Plenary Meeting November 2005 Page 63
presented below. The main parameters identifying these fisheries are presented in Table 5-14.
The main recommendations regarding individual species are outlined in Table 5-15. The main recommendations are to maintain the closure of shark gillnetting, and to permit hake and monk netting in waters shallower than 600 m. The 600 m depth limit is best to avoid the main deepwater shark species being caught. STECF does not consider that gillnet fisheries for crabs should be allowed. Instead crabs can be targeted by pots in a very selective manner. The recommended soak time for monkfish (72 h) should be examined by conducting further experiments in the future.
STECF was aware of new information from the NWWRAC that suggests that 120 mm mesh size could indeed select smaller hake than 100 mm mesh nets. This is contrary to what is to be expected from such studies. However, STECF was not able to fully evaluate these studies, but instead recommends that the Commission refer the matter to ICES for consideration at the ICES/FAO Working Group on Fish Behaviour and Fishing Behaviour.
STECF was also aware of a study of the socio-economic implications of implementing the ban on gillnets in 2006 (Franquesa and Moruelo, 2006)8 This report contained much detailed information and STECF was unable to fully evaluate it at present.
8 Franquesa, R., and Mourelo, A. 2006. Assessment of the new regulation socio-economic impact on community fishing vessels of static deep sea gillnets. Barcelona: Universitat de Barcelona. Unpublished report. 32 pp.

Page 64 STECF plenary meeting November 2006
Table 5-14 Descriptors of the fishery. This table is based on the Working Group’s judgment of the characteristics of these fisheries. Note that crab gillnetting does not have any unique descriptors. Fishery Hake (Merluccius
merluccius) Monkfish (Lophius
spp.)
Deepwater Shark (Centrophorus squamosus &
Centroscymnus coelolepis)
Crab (Chaceon affinis)
Gear Type Gillnet Tangle Net
Gillnet/Tanglenet Hybrid
Tangle Net
Name Volanta Rasco Jata - Regulation Mesh Size (mm)
120mm 250mm 220mm 220mm
Observed Mesh Size (mm)
100mm/120mm 280mm 160mm 280mm
No. of Vessels 43 (18 both monkfish & hake)
9 (18 both monkfish & hake)
2 (4 both monkfish and shark)
??
Net Height (no. of meshes deep)
100 (12m) 13 (3.64m)
40 (6.4m) 13 (3.64m)
Hanging Ratio (Er)
0.5 0.33 0.45 0.33
Fleet Lengths (No of Nets x length of Fleets per vessel
25-50 nets (1.5-2.5km) 6-10 fleets
150-450 nets (7-22.5km)
9-14 fleets
130-180 nets (6.5-9km) 3-10 fleets
??
Approximate Total Gear Length per vessel
(~20-25km) (~100-200km)
(~25-100km) ??
Soak Time (hours)
12-24 72-96 72-96 ??
Net Construction (Floatation)
Floats placed at 1.5m spacings (32
floats per net)
No floats on
headline
No floats on headline No floats on
headline
Depth Range (m)
100-600 100-800 800-1600 600-1200
ICES Sub-area IVa, VII, VIII, IXa IIa, IVa,b, VI, VII,
VIII
VI, VII, VIII, IX, X, XII
IVa, Vb, VI, VII, VIII, XII
Catch Composition
~70% hake ~70% Monkfish
~90% shark ~75% crab
General recommendations for the management of deep-sea gillnet fisheries (see Anon. 2006 for more information) are as follows:
1. Permit system for all vessels participating 2. Recording and reporting of gear parameters to be mandatory. 3. Gear to be certified by competent authorities 4. Gears to be adequately marked and using unique identifiers. 5. Vessels allowed only small differences on gear embarked and disembarked. 6. Vessels to attend gear at all times. 7. Unattended gears will be deemed lost or abandoned and subject to removal
by authorities 8. Facilities to be made available onshore for disposal of old nets.

STECF Plenary Meeting November 2005 Page 65
In addition, STECF notes that the regulation should be extended to cover ICES Division IVa and Sub-areas VIII, IX, X and Madeira in order to avoid shifting of effort to these areas. STECF notes the movement of effort on sharks to West Africa. It is likely that the West African shark populations are linked with those in the ICES area and this may have detrimental effects on shark populations in this region. It is therefore recommended consideration be given to extend the regulation to west Africa, at least until further information on fishing practices and population status is available. Table 5-15 Specific recommendations of STECF on the management of deep-sea gillnet fisheries.
Hake Monkfish Deepwater shark
Deepwater crabs
Overall Reopen
Reopen, subject to depth, soak time and length restrictions*
Maintain closure
No target fishery
Net type Gillnet Tangle net - - Mes size 120 mm > 250 mm - -
Depth < 100 meshes deep < 15 meshes deep - -
Hanging ratio 0.5 0.33 - - Floatation Yes No - -
Fleet length < 2.5km in length < 10km in length - -
Gear length < 25 km < 100 km * - - Soak time < 24 hours < 72 hours - - Depth 200-600m. Depths 200-600m - - Shark by-catch NA
Shark By-catch < 5% by weight. - -
* subject to research and observer trip data
5.8 DISCARDS FROM COMMUNITY VESSELS The STECF Sub-group SGRST on Discarding by EU fleets met in Brussels, from October 9th to the 12th, 2006, with the following Terms of Reference: 1) compile an overview of discards from Community vessels in the Mediterranean
and the North East Atlantic (all ICES areas) by fleet, stock and quarter. The overview should provide estimates of the total amounts and amounts relative to total catches. Information should be provided on basis of both weight and numbers. The overview should cover the period 2003-2005.
2) provide examples of different discard patterns such as discarding due to MLS regulations, to above-quota catches in mixed fisheries, high grading and discarding due to poor quality. To the extent possible provide information on the relative importance of the various causes for discards in the fisheries covered in a. These examples should include examples of length frequencies of discards relative to landings.
3) provide information on any qualifiers regarding data availability, data representatively and data coverage which is important for the interpretation of the overview. For fleets where estimates as described in (a) cannot be made the reasons should be stated.
STECF appreciates the work done during the meeting and notes that several issues in the data call and submission were encountered before and during the meeting including difficulties to upload the data into the JRC database, late data submission

Page 66 STECF plenary meeting November 2006
by some MS, inconsistencies in the different codifications. As a consequence, there are limitations in the output of the meeting with regards to the terms of reference and only two sets of results were presented:
• discards ratios relative to total catch (ToR a) • examples of length distributions as a aid to analyse the causes for discards
(ToR b). STECF draws the attention on the fact that high discards ratios may represent a small overall volume of discards and, conversely, low ratios is not equivalent to low volume of discards. Therefore, STECF considers that the estimated discard ratios for different fleets are unlikely to indicate, their absolute level of discarding. Furthermore, STECF notes that the precisions of the estimates of discard ratios are poor due to the small numbers of discard samples and inconsistent data processing.
STECF supports the recommendations made by the SGRN WG and wishes to emphasise the following:
• the lessons learned during this exercise should be used to ensure that the problems encountered are not repeated in future. Particular problems encountered were that the data call was not precisely specified leading to the provision of unsuitable data, communication between those parties involved in the provision of data was inadequate, there were shortfalls in data provision and it uploading data to the database was problematic. As a result the meeting proved to be too short.
• the importance of setting up the discard atlas as proposed by the February 2006 report of the discard atlas steering group to get a comprehensive overview of discarding which could help to inform future decisions on sampling strategies under the DCR.
• The development of indicators for monitoring the ecosystem effects of fishing require that there is a need to extend the list of species beyond those listed in appendix XII of the current DCR to include other species – both commercial and non-commercial – to be chosen on a case by case basis.
• For the Mediterranean discard estimates should be derived at the GFCM_GSA level, rather than the Division level proposed by the SGRN WG. STECF suggests that summary information on discards should be presented for three separate areas namely Western, Central and Eastern Mediterranean.

67
6 FISHERIES ECONOMICS
6.1 PROCESSING OF ECONOMIC DATA
6.1.1 Evaluation of latest call for economic data The Scientific, Technical and Economic Committee for Fisheries (STECF) Subgroup for Economic Affairs (SGECA) met on two occasions from 15 - 18 of May and 23-27 October, 2006 to analyse the first call for information under the Data Collection Regulation (DCR), to analyse the data submitted by the Member States (MS) under the DCR and to carry out the Economic Interpretation of the ACFM Advice.
The data currently available for analysis during the SCEGA meeting was very heterogeneous in terms of completeness - coverage of fleet segments, variables and years. In the current report a brief assessment of EU fleets and a statistical overview is presented for ten countries for which 2005 data was available at the meeting. Statistical data on several other countries is also presented, for which data on earlier years was submitted.
In Table 6-1 below an overview of the data as available at the time of the meeting is presented. Not all MS were represented at the meeting, which further affected the elaboration of an analysis on those countries. Consequently, the analysis was limited to those fishing fleets for which experts from the relevant MS were present during the meeting. Table 6-1 Data available at the meeting by MS
Costs and earnings data submitted Belgium 2002-04 Cyprus 2005 Denmark 2002-2005 Finland 2002-05 France 2002-04 Germany 2004 fragmentary Greece 2004-05 Italy 2002-05 Latvia 2002-05 Lithuania 2002-05 Netherlands 2002-05 Poland 2004 fragmentary Sweden 2002-05 UK 2004-05
The JRC data management system was not yet fully operational at the time of the meeting. As the uploading system failed manual preparations of some of the data had to be undertaken. The economic analysis remains very brief and there has been extremely little time to review and cross-check the available data.
6.1.2 STECF recommendations 1. This was the first time that the new procedure had been tested in earnest and
several improvements were proposed. Based on the work of the SGECA May and October meeting STECF recommends the following:
2. Member States to report active and partially active segments separately and to justify the threshold used for their definition in their Technical Reports. The Subgroup recommended that a study on threshold values of economic activity be undertaken in order to arrive at a harmonisation of approach within the EU. Such a study might include the rules for inclusion in the Community Register.
3. JRC should compile information on the thresholds used in the MS when dealing with data on regularly active, non-regularly active and non-active fleets.

Page 68 STECF plenary meeting November 2006
4. JRC should organise a training course to get the staff from the MS acquainted with the software used to upload the data.
5. MS should be encouraged to provide an expert when their data needs to be analyzed.
6. A study is required to develop methods for estimation of regional data in countries whose fleets operate in several of the large geographic areas (North Sea, Baltic, Atlantic, Mediterranean and distant waters).
6.2 FUTURE UTILISATION OF ECONOMIC DATA STECF notes that producing an annual report on economic performance (AER) and using the same data for economic interpretation of ACFM advice in the EIAA model provides a challenge to timing. Whereas for some MS delivering data in early autumn is a possibility, others need up to the end of the year to be able to submit a comprehensive data set. This of course affects the cycle of production of annual reports and analyses.
First of all STECF comments that the need for three types of analysis exists and therefore it is recommended the analysis to undertaken with the available data for:
1) the production of an annual report on the performance of European fishing fleets
2) the analysis of the effects of proposed annual fisheries management measures such as TAC and Quota for the Atlantic and effort allocations for the Mediterranean
3) ad hoc evaluation (ex ante and ex post) of other proposed management measures.
Of course, in order to allow for these analyses, the availability of data is of prime importance. Noting the prevailing calendar for management decisions it would be desirable to have all relevant data available for analysis practically at the same time as for example the ACFM advice is produced. In addition producing relevant data entails also scientific research to clarify the real data content and its reflection of the basic realities.
STECF recommends that a dynamic website, which will allow the user to generate tailor-made reports on the performance of fleets by country, maritime area or by gear type is developed.
It should be noted that data as submitted under the DCR are already at an aggregated level. Consequently, the published AER and the proposed web site will contain only data at an aggregated level in line with the basic requirements of confidentiality.
However, it should be noted that in order to fulfil the need for ad hoc analysis and impact assessments of proposed fisheries management measures, there is a need to have the data set needed for the analysis available at any given period in time. As concerns impact assessments a suitable methodology should be developed.
6.2.1 Annual Economic Report (AER) This was the first time for the analysis and annual report to be produced by the STECF-SGECA working group and the first occasion to test procedures put in place under the DCR and to analyze data, which had been submitted by the MS to JRC. The currently produced report builds on the Annual Economic Report on ‘Economic performance of selected European fishing fleets’ as was prepared in 2005 under EC contract FISH/2005/12. It was a continuation of three Concerted Actions, which produced similar reports over the period 1996-2004. The methodology applied was refined over the years and had in the past resulted in a highly efficient and effective process.
The existing process resulted in the production of an annual economic report (AER) providing performance statistics on selected European fishing fleets presented in national chapters, and one annual analysis of the effects on economic

STECF Plenary Meeting November 2005 Page 69
performance of the same selected fishing fleets of the advice on TAC and quota as provided in the ICES ACFM advice.
With the implementation of the Data Collection Regulation and the ensuing availability of data coupled with the desire of the Commission to strengthen the role of the STECF in providing economic advice, a rather radical change to the position and set up on the previously produced annual economic analysis was realized. With data under the DCR having a broader coverage of fleets and fisheries, in principle, the new system of analysis would allow for a more complete coverage and a more standardised description of the EU fleet.
STECF subscribes to the need to have an Annual Economic Report, presenting current state and performance and trends in development of the fishing fleets of Europe. However, for many countries the annual fisheries data are not publishable other than by the end of the following year. While acknowledging these difficulties STECF recommends that the AER should be produced during the first quarter of the next year (hence the 2006 data to be available for analysis by January 2008).
As for the annual economic report (AER), as it stands at this moment the annual report provides an overview by fishery and country of the performance of the fleet. It is recommended to continue with the production of this publication in future. The report should in addition also provide an analysis of main trends and developments in European Fisheries.
It is extremely useful to analyse key economic parameters such as fuel price and decommissioning vessels over the entirety of the EU fishing fleet through trend analysis using time series. In order make the time series longer, it would be useful to link the data set as collected under DCR to the data base as developed by the Concerted Action, going back as far as 1998. This does not cover the EU fleet in its entirety and uses a different segmentation. But, noting the importance of the issue, STECF recommends that available expertise available to implement such an analysis.
6.2.2 Economic Interpretation of ACFM Advice (EIAA) Noting availability of data it is observed that the EIAA model (to be run in October each year) is not able to be run with a full data set for that particular year. Since the EIAA model uses a three-year average it is possible that for those countries for which data are only available for earlier time periods the model to be run with older data.
In addition, concerning the timing of the exercise, with a call for data in September, there is a need to stipulate a clear procedure on data preparation in order to have the data ready for analysis for the October meeting. For countries that are unable to produce relevant data, estimates should be made preferably based on a suitable model.
As for coverage of the analysis it is recommended to have the current October analysis (of the effect of ICES ACFM advice based proposed management measures (TAC)) to be extended to proposed management measures to other geographical areas such as the Mediterranean and the Black Sea. This would call for the selection of an appropriate set of analytical tools next to the EIAA model. Special topics
Apart from the EIAA analyses, there is wide need for different kinds of economic analyses of the fisheries. Especially, there is an obligation for impact analysis of various management decisions. To be able to answer the questions there is a need to develop frameworks and platforms to prepare these economic analyses efficiently.
In general there is a need to have data available for analysis by fleets and fisheries but also by country and by maritime area. In addition, when it comes to the analysis of concrete proposals or issues specific data by gear and fishery are required. The basis for these data sets can be found in the AER; additional data needs to be gathered in relation to the analysis at hand.
Concerning predictions on economic developments in fisheries, other then the impact assessment of management measures at the level of effort regulations and TAC, currently only measures based on ICES predictions are undertaken on a

Page 70 STECF plenary meeting November 2006
regular basis. In future, it is recommended, both supply and demand considerations should be incorporated into the forecasting models and analyses.
6.3 CURRENT ECONOMIC STATUS OF EU FLEETS It is recommended, in order to have available an assessment of the current performance of fishing fleets, to have SGECA reconvene early 2007 to finalise the analysis with a complete data set. Hence the current report should not be made public because of weak coverage of the European Fishing Fleet and the fact that the current data set has not yet been cross checked with all member states. This underlines the fact that it is necessary to have all MS be represented by experts at this exercise.
It is recommended that all MS will have an expert, responsible for data collection, present at this meeting to allow for the analysis of the data.
Based on the available data it was possible to run the EIAA model to predict effects of the proposed TAC levels as per the ACFM advice for several fleet segments of Denmark, Finland, the Netherlands, Sweden, UK and Lithuania. In the table below the results of the model runs are presented.
Considering the partiality of the analysis STECF finds it not relevant to endorse the conclusions of the analysis to a general European Fisheries Level.
The potential economic impact of two sets of TAC proposals for 2007 is evaluated using the net operating profit as indicator based on the following criteria:
1. Single species TACs. As far as possible, TACs for 2007 were taken directly from the ICES advice for single species exploitation boundaries. These were used to demonstrate the economic performance of the fishing fleets in 2007 relative to the 2003-2005 baseline run if TACs were set according to the single species advice and ignoring any interactions between stocks and fisheries.
2. Management plan taking into account the provisions for stock recovery agreed by the Council.
3. TACs set in line with ICES’ mixed fishery advice. This scenario was undertaken to evaluate the economic performance of the fleets when the interactions between stocks and fisheries are taken into consideration. This represents a worst-case scenario, since it implies zero catch for a large number of demersal stocks that are caught in mixed fisheries. For example, for the North Sea mixed demersal fisheries, the ICES advice states. As the mixed species advice result in worse economic performance than the two other scenarios, these results are not presented.
This left two scenarios:
The selected economic indicator is the operating profit margin defined as the net profit relative to the value of landings. Theoretically, net profit relative to the value of the invested capital would be a more appropriate measure, but because of the uncertainty about the estimated value of the invested capital it is concluded that this economic indicator is not so useful. The net profit is defined as the value of landings minus all costs. If the net profit is negative the operating profit margin is negative. Table 6-2 Summary Economic impact of two scenarios for 2007 Segment Single species Management plan
Operating Profit Margin Impact
Operating Profit Margin Impact
Denmark Pelagic Trawl and Seine 12 – 24 m -21.7% W -19.5% W Pelagic Trawl and Seine 24 – 40 m -42.1% W -41.8% W Pelagic Trawl and Seine ≥ 40 m -13.2% L -12.0% L Demersal Trawl and Seine 12 – 24 m -28.0% W -23.9% W Finland

STECF Plenary Meeting November 2005 Page 71
Pelagic Trawl and Seine 12 – 24 m 13.0% I 12.8% I
Pelagic Trawl and Seine 24 – 40 m 18.2% I 18.1% I Netherlands Beam trawlers 12 – 24 m -4.6% L -3.8% L Beam trawlers 24 – 40 m -25.0% W -23.7% W Beam trawlers ≥ 40 m -20.4% L -18.9% L Pelagic Trawl and Seine ≥ 40 m -9.6% W -3.7% W Sweden Passive Gears < 12 m 41.7% L 40.7% L Demersal Trawl and Seine 12 – 24 m 11.7% L 10.7% L Pelagic trawl and seine 24 – 40 m 13.9% I 14.2% I Pelagic trawl and seine ≥ 40 m 27.7% H 28.0% H UK Beam trawlers 24 - 40 m 0.6% L 1.0% L Demersal Trawl and Seine 12 - 24 m -52.8% - -52.1% - Lithuania Demersal Trawl and Seine 24 – 40 m 22.2% - W ‘Worsened’ Segment was making losses, losses now greater I Improved Segment was making losses, losses now smaller or even profits L Lower Segment was making profits, profits now lower. H higher Segment was making profits, profits now higher ‘– No significant change. The general picture for the selected segments is that they are expected to be performing very poorly in economic terms. There may be some uncertainty related to projections because of the change of data provision procedure compared to earlier years, but for Denmark, Finland and the Netherlands the data are consistent over time and considered reliable, while the data for the other countries may gain from a further check of reliability.
6.4 WORK PROGRAMME 2007 STECF recommends the following work programme for the inclusion of socio-economic issues:
1. AER subgroup meeting January/February production of annual economic report for 2005
2. Working group to examine the two reports as commissioned under the DCR the first on the definition of Capital costs in fisheries, the second on the concept of Full Time Equivalents in fisheries. Meeting scheduled for January/February
3. Meeting on threshold values of the level of economic activity (active and partially active segments) leading to a harmonisation of the approach within the EU.
4. EIAA meeting on ACFM advice October 5. Meeting to evaluate the Baltic cod management plan in Q1 2007 6. Meeting for the development of a common methodology for assessing balance
between stocks and fishing capacity. 7. Establish task force for selection of appropriate bioeconomic models for the
Mediterranean 8. Joint biology and economic meeting on key parameters in bio-economic
evaluation models In general STECF continues to promote the collaboration of biologists and economists in the evaluation of management measures. STECF stresses that the

Page 72 STECF plenary meeting November 2006
meetings can only assess research results and make recommendations to internationalize the applications. Basic research is necessary in order to bring the issues forward.

73
7 INTEGRATED ANALYSES
7.1 MATCHING FLEET CAPACITY TO FISHING OPPORTUNITIES
7.1.1 Background Article 14 of Council Regulation (EC) No 2371/20029 and Article 12 of Commission Regulation (EC) No 1438/200410 require Member States to submit to the Commission, before 1 May each year, a report on their efforts during the previous year to achieve a sustainable balance between fleet capacity and available fishing opportunities. On the basis of these reports and the data in the Community Fishing Fleet Register11, the Commission produced for the year 2005, a summary12 which was presented to the ‘Scientific Technical and Economic Committee for Fisheries’ (STECF) and the ‘Committee for Fisheries and Aquaculture’. This report presents the considered opinion of the STECF on the Commission’s Summary Report.
7.1.2 STECF Comments and Recommendations STECF notes that the Commission’s report is presented in two main parts; one describing the rules governing the management of capacity and the information that member states are required to submit to the Commission, and a second describing the development of Member States’ fleet capacities during 2005.
STECF is of the opinion that the aim of achieving a balance between fishing capacity and resource availability is crucial for the long-term viability of the EU fleets. Continued over-capacity and over capitalisation will tend to maintain over-exploitation, which is likely to result in unviable fisheries.
STECF notes that because of delays in submission of national reports by some member states and in inconsistencies in submissions, a common assessment of the Member States’ reports was problematic and the Commission faced serious difficulties to respect its deadline (31 July 2006) for the submission of summary report to the STECF and the Committee for Fisheries and Aquaculture. Nevertheless, compared to those for 2004, the quality of the reports submitted by Member States has improved. Some Member States provided very detailed reports, whose content exceeded the information they were obliged to provide. However, other Member States did not respect the submission deadline or the annual report format and content established in Article 13 of Commission Regulation (EC) No 1438/2003. Member States also emphasised in their reports the implementation of the national fleet management regime, but the assessment of the balance between fishing fleet capacity and available fishing opportunities is more complete than in previous reports.
For the mainland fleet, according to the Community Fleet Register the overall capacity of the Community fleet of the EU-15 Member States was reduced by 115,000 GT and 491,000 kW over the three-year period 2003 – 2005. This represents a net reduction of 6.17 % of the tonnage and 7.16 % of the power of the EU-15 fleet over two years. The net reduction during 2005 was of approximately 50,000 GT, correspond to 23,000 GT in 2004. STECF notes that these reductions appear to be relatively small, considering the high levels of fishing pressure in most Community fisheries, particularly for demersal species.
9 Council Regulation (EC) No 2371/2002 (OJ L 358 of 31 December 2002, p.59 -80) 10 Commission Regulation (EC) No 1438/2004 (OJ L 204 of 13 August 2004, p.21-28) 11 Commission Regulation (EC) No 26/2004 (OJ L 5 of 9 January 2004, p.25-35) 12 Annual Report from the Commission to the Council and the European Parliament on Member States’ effort during 2005 to achieve a sustainable balance between fishing capacity and fishing opportunities.

Page 74 STECF plenary meeting November 2006
In the new Member States, starting from 1 May 2004, fleet capacity has been reduced by 41,000 GT and 101,000 kW, which represents a reduction of 18 % in tonnage and 18 % in power for their fleets compared to their fishing capacity on the accession date.
During 2003, 2004 and 2005 approximately 132,000 GT and 427,000 kW were withdrawn from the EU fleet with public aid, which means that this capacity cannot be replaced. Of this capacity withdrawn with public aid, the overwhelming majority (112,000 GT and 373,000 kW) came from the EU-15 Member States. The capacity withdrawn by the New Member States with public aid since 1 May 2004 was 20,000 GT and 54,000 kW.
For the outermost regions, the fleet registered in the Spanish and Portuguese outermost regions has significantly reduced both in terms of tonnage and power. For the French overseas departments there has been a slight decrease in the total number of vessels and their tonnage and an increase in power.
While the reported reductions in GT and kW represent an attempt to achieve a balance between fishing capacity and available fishing opportunities, reductions in physical capacity alone, are insufficient to achieve this objective. Not only are the reported reductions rather trivial, compared to the existing imbalance between fishing opportunities and fleet capacity, to achieve such a balance, there is a need to reduce the EU fleet’s capacity (ability) to catch fish, and not simply its physical capacity. In this context, STECF notes that the Commission’s report indicates that the majority of Member States fishing effort reduction schemes have generally led to good results and helped to achieve a balance between fishing capacity and fishing opportunities. However, while effort reduction schemes may have delivered reductions in deployed fishing effort for some member states’ fleets, there is little evidence that such schemes have delivered the reductions in exploitation rates required for many stocks.
STECF notes that the regulation concerning replacement capacity (page 4, paragraph 2a of the Commissions report) may not achieve its desired objective. While entry of capacity into the fleet of a Member State has to be compensated by the previous exit of at least the same amount of capacity, there is scope for the replacement vessel to achieve higher fishing capacity through increased bollard pull due to an alternative configuration of engine, main drive shaft and propeller. STECF recommends that consideration be given to the inclusion of an amendment to the regulation to include an additional clause to address this issue.
STECF notes that the capacity for some member states is still being reported as a combination of GT and GRT and that reported capacity changes may not reflect the true changes in capacity of member states’ fleets. Without a common unit for tonnage it is difficult to judge whether the reported changes are meaningful.
STECF notes that the information included in member States Reports is not homogeneous. STECF suggests that a standardised form be prepared for circulation to Member States ahead of the production of their annual reports.
A current overriding objective arising from the Johannesburg Summit on Sustainble Development is to achieve exploitation rates that are consistent with Maximum Sustainable Yield (Fmsy) by 2015. In principle this can be achieved with the existing EU fleet capacity, provided it is deployed in such a way that results in the desired level of fishing mortality. It is how the capacity is deployed that will influence the exploitation rate, and not the physical capacity itself. Hence, taken in isolation, the EU capacity management rules are rather a blunt instrument, which in principle may work against the objectives of fishery managers. Depending on the objectives of the managers, the decisions they take and the degree of compliance with those decisions, the desired balance between exploitation rates and resource availability could be achieved by a large capacity fleet being deployed for a small amount of time or a smaller fleet for a longer amount of time.
STECF therefore recommends that fishery managers agree a common set of objectives for those EU fleets that can be managed independently. Fisheries scientists and economists will then be able to evaluate the effects of different management measures that are designed to achieve those objectives and advise on the biological and economic consequences of such measures.

STECF Plenary Meeting November 2005 Page 75
7.2 IMPACT ASSESSMENT OF LONG-TERM MANAGEMENT PLANS FOR SOLE AND PLAICE
A working group, SGECA-SGRST-06-05, met in Brussels 26-29 September 2006 to perform impact assessment of the proposed management plan for sole and plaice in the North Sea. The working group consisted of biologists, economists and social scientists. Furthermore observers were represented at the meeting. This report represents the first attempt by an STECF WG to adopt an integrated biological, economic and social evaluation of a proposed management plan for flatfish. STECF reviewed the report of the meeting noting the considerable amount of work undertaken by the participants in attempting to address the following terms of reference.
7.2.1 Terms of reference 1. For each Member State, what is the economic and social baseline situation
for the fishing fleets, onshore industries and communities that depend on fisheries for plaice and sole (e.g. size, turnover, employment in 2005)?
2. What is the baseline situation in biological and environmental terms of the fishery (state of the stocks concerned, discards, impact on wider marine environment, etc)?
3. Given expected stock recoveries under the long term proposal, for each Member State, what economic impacts (e.g. costs, revenues) can be expected during:
a. the first 1-3 years, b. after 5, 10 and 15 years,
compared with continuing to fish at current mortality rates (“no policy change”), in the catching sector and onshore sector?
4. Given expected stock recoveries under the long term proposal, for each Member State, what social impacts (e.g. employment) can be expected during:
a. the first 1-3 years, b. after 5, 10 and 15 years,
compared with continuing to fish at current mortality rates (“no policy change”), in the catching sector and onshore sector?
5. Given expected stock recoveries under the long term proposal, what biological and environmental impacts (e.g. sea bed, other species) can be expected during:
a. the first 1-3 years, b. after 5, 10 and 15 years,
compared with continuing to fish at current mortality rates (“no policy change”)?
6. Estimate future evolution of prices and evaluate the effects of price elasticities for future sole and plaice landings, to enable us to answer question 3.
7. What potential spillover effects on other fisheries can be anticipated? How could such effects alter the fishing industry, from economic, social, biological and environmental perspectives?
8. What economic or social incentives would be needed to persuade fishers to leave the industry early?
9. As a robustness test (taking into consideration the various sources of uncertainty), assess the economic, social, biological and environmental consequences of plausible alternative exploitation patterns that might arise due to the implementation of management measures.
10. Evaluate the economic, social, biological and environmental consequences of not reducing fishing effort in years when the biomass of sole is forecast to be above BPA.
11. Identify any needs for long term data collection from the sector in support of future impact assessments or for monitoring purpose

Page 76 STECF plenary meeting November 2006
7.2.2 STECF COMMENTS
7.2.2.1 Approach and methods A major aim of the meeting was to evaluate the potential economic performance of the major EU fleets if the proposed management plan were to be implemented. The group attempted to describe the potential changes by expressing the results predicted under the management plan relative to a baseline scenario of status quo fishing mortality. Two economic models were used to investigate the economic consequences of the flatfish management plan: 1) the EIAA-model previously used by STECF and 2) the LEI-model.
The models differ in approach, particularly with respect to the way in which fishing effort, expressed as days at sea and hence variable costs are estimated. The EIAA model provides an evaluation of the predicted economic performance for the all of the main EU fishing fleets and derives its input primarily from the results of a biological prediction model on the potential development of yield and SSB, given changes in fishing mortality. Its results are primarily driven by the projected landings by each fleet partitioned according to average species compositions and an estimated amount of effort required to take the predicted landings. The LEI model is an integrated predictive model with biological consequences of management in each year, carried forward in the projection into subsequent years. However, the model provides results only for Dutch beam trawlers >24 metres overall length.
7.2.2.2 Model Results STECF notes the medium- to long-term results obtained in terms of economic performance of the fleets are in conflict. The EIAA-model indicates that
1. for vessels using beam trawl and restricted by the reduction in allowed effort, the management plan is considered to have a substantial negative economic impact compared to a continuation of status quo fishing mortality.
2. for vessels using gear types other than beam trawl, a minor positive effect is expected.
The major implication that can be drawn from the results of the LEI-model, which only covers Dutch beam trawlers above 24 metres, is that the management plan will have a significant positive impact on the level of gross cash flow compared the baseline situation of status quo F.
The short-term economic implications for the Dutch beam trawl fleet >24m overall length are similar for both models.
7.2.3 Conclusions and Recommendations In reviewing the report, STECF had considerable difficulty reconciling the major differences in model results. As a result at present, STECF is unable to determine whether either of the model results represents a plausible outcome in terms of economic performance. STECF is of the opinion that there are a number of issues for which further investigation and clarification is required, before any confidence can be attached to either of the model results.
STECF is aware that the analysis was made under severe time pressure and believes that the working group should be given the opportunity to revisit some of their calculations. STECF suggests that the following specific issues need to be addressed by the working group:
1. To clarify whether the implied effects of the management plan for the different fleet segments that exploit flatfish is correctly specified in the evaluation models. STECF strongly suspects that the effort reduction regime was incorrectly implemented in the EIAA evaluation since it appears that annual effort reductions of 10% were applied even after the target Fs of F=0.3

STECF Plenary Meeting November 2005 Page 77
for plaice and F=0.2 for sole were reached. Such a mis-specification could account for the discrepancies in the results from the different models.
2. To evaluate the effects of different stock recruit relationships on model output.
3. To increase the time span for biological model output, to include at least two full life cycles of flatfish (at least 20 years), in order to investigate the full potential impact of changes in recruitment and consequently the long term equilibrium.
4. To clarify and describe the links between the biological model and the economic model and the differences between the LEI model and the EIAA model. In particular:
a. the link between fishing mortality and effort in both models. b. the relationship between cpue and biomass (stock-catch flexibility).
This assumption is important also for determining how catches, and hence TACs are predicted in the current biological (population dynamics) model, as a function of fishing effort and fishing mortality.
c. the algorithms for estimating costs in both models.
5. It would be informative to undertake an evaluation of the economic impacts in the case of recruitment failure and link it to the probability of recruitment failure as assessed in the biological model.
6. It would also be informative to evaluate the relationship between fishing activity and days at sea. In the North Sea it has been shown (Casini et al., 200513) that the fish density decreases or increases with decreasing or increasing stock size (fish stay in the same area but their density increases or decreases). So it may be reasonable to assume a linear relationship between catch and fishing activity. However for the purposes of management rules, effort is calculated as days at sea which includes time to arrive at the fishing grounds. The relationship between catch and effort will therefore depend on fishermen’s behaviour as well as stock density.
7. Further evaluate the impact of fleet size on the economic impacts of the management scheme. It would be informative to investigate the outcome in terms of economic performance for cases where capacity removal forms part of the overall management plan in addition to a restriction on fishing activity.
8. If possible, to evaluate the possibility for all fleets that exploit plaice and sole, to compensate their catches with species other than flatfishes.
9. Explain the differences in economic consequences for different fleets. Given the above concerns and the suggestions for clarification, STECF strongly recommends that the results contained in the report of the SGECA-SGRST 06-01 meeting held in Brussels from 26-29 September 2006, should be not taken as a plausible indication of the likely outcome on the future economic performance of European fishing fleets under the proposed flatfish management plan. In particular the results of this evaluation should not be used until the discrepancies in the results can be reconciled and clearly explained.
In order to address the points outlined above and provide a definitive evaluation of the flatfish management plan, STECF suggests that a meeting of no less than 5 days should be convened. The meeting participants will require sufficient notification of the timing of the meeting in order to adequately prepare.
STECF recommends that if possible, for this evaluation, an integrated bio-economic full-feedback simulation model be used.
STECF notes that the WG did not have access to appropriate sociological data to facilitate a sociological analysis of the flatfish management plan. However, since
13 Ref. Casini, M., Cardinale, M., Hjelm, J. and Vitale, F. and (2005). Trends in biomass and related changes in spatial distribution of demersal fish species in Kattegat and Skagerrak, eastern North Sea. ICES Journal of Marine Science, 62: 671-682.

Page 78 STECF plenary meeting November 2006
these issues form part of the TOR, the Commission should strive to ensure that sufficient resources to complete the required analysis are made available.
7.3 BAY OF BISCAY ANCHOVY
7.3.1 Catch levels for recovery of stock STECF was requested to advise 1) whether any catch level below 8000 t in 2007 may be compatible with the
recovery of the stock. Based on the most recent estimates of SSB, the stock is currently considered as suffering from reduced reproductive capacity. SSB in spring 2006 was estimated to be about Blim. Low recruitment since 2001 and almost complete recruitment failure of the 2004 year-class are the primary causes of the stock collapse. This led to the closure of the fishery in July 2005. A provisional TAC of 5000 t, not to be fished before the 1st of March, was initially set by the Council for 2006 but the fishery was again closed in July 2006 because of the low 2006 SSB and 2005 recruitment estimates obtained for May 2006. The 2005 year-class appears to be slightly stronger than 2004 but is still amongst the lowest in the time-series.
The conclusion of the STECF-SGMOS on Anchovy in the Bay of Biscay, Ispra 14-16 June 2006, was that, with the current stock situation, maximum protection of the remaining spawning population is required. No alternative management measures short of closure should be considered at this time. The recommendation of the STECF-SGMOS and subsequent ICES advice in October 2006 was that the fishery for anchovy in the Bay of Biscay should remain closed and should, at the earliest, be considered for opening if the acoustic and egg surveys in May-June 2007 demonstrate a strong 2006 year-class.
7.3.2 Economic effects of fishery closure STECF has received a short economic analysis of the French anchovy fishery in the Bay of Biscay in relation to the effects of the fishery closure. This is appended to the report as Annex 1.
STECF notes the analysis shows a high short-term price flexibility for anchovy which has partially offset the negative economic effects for the local French fleet of the reduced catch possibilities in 2005 and 2006.
As no information is available from the Spanish fleet it is not possible for the STECF to draw any firm conclusion as asked by the Commission
7.3.3 STECF Recommendation STECF agrees with the STECF-SGMOS conclusion and the ICES advice and recommends a zero TAC for at least the first half of 2007. The fishery for anchovy in the Bay of Biscay should be reopened in 2007 only if the results of the 2007 Spring surveys indicate that the Spawning Stock Biomass in 2007 is above Blim (21,000 t). If so, fishing opportunities for the second half of 2007 and the first half of 2008 could be evaluated in June 2007 as a function of stock size in May 2007, precautionary levels for biomass in 2008 (Bpa: 33,000 t) and different scenarios for recruitment in 2007 (based on the Table produced during the STECF Plenary in November 2005).
STECF therefore is unable to reliably quantify whether there is any non-zero catch level for 2007 below 8000 t that is compatible with the recovery of the stock of anchovy in the Bay of Biscay, until the results of the 2007 spring surveys become available.

79
8 IMPLEMENTATION AND REVISION OF DATA COLLECTION REGULATION
8.1 EVALUATION OF 2005 NATIONAL DATA COLLECTION PROGRAMS
STECF reviewed the SGRN report on “Evaluation of 2005 National data collection programs undertaken under Commission regulation (EC) NO 1639/2001”. “STECF noted the recommendation by the subgroup on the need for a dedicated web site for presenting sampling and other technical procedures in connection with data collection and that a meeting be convened under the auspices of STECF-SGRN to facilitate its design. This meeting should not focus on presenting new information, but focus on the way existing information is presented. Therefore, only a small group of experts would be necessary, i.e. the Chairman of the PGCCDBS, the SGRN chairman, JRC expert(s) and if necessary a few other specialists.
STECF suggests that the meeting be held after the meeting of the ICES PGCCDBS and before the next STECF Plenary, i.e. in March 2007.
The suggested ToRs for the meeting are as follows:
1. Specify the structure of an Internet website entirely devoted to the DCR, including all the relevant information already available on the JRC website.
2. Develop web pages allowing access to descriptions of the sampling procedures and the statistical methodologies developed for each of the parameters required under the framework of the DCR
3. Establish country specific web pages to gather all relevant information concerning the sampling procedures and the statistical methodologies as suggested by ICES PGCCDBS (2007).
4. Consider the possibility to track all the amendments made to the methodologies in order to be able to connect a DCR implementation year with the ad hoc information.
5. Specify the content for an international webpage summarising all information by country.
STECF notes that the absence of a reliable source of comprehensive landings statistics for Mediterranean fisheries is problematic for the specification of sampling activities in the framework of the DCR and needs to be addressed. While FAO landings statistics database is widely used as a reference, the large discrepancies between officially reported statistics to FAO and those reported under the DCR prevent their use in the Mediterranean. It is highly desirable for the provision of reliable assessments and advice that representative statistics on catch and effort for fisheries in the Mediterranean are readily accessible. STECF suggests that the appropriate forum to address this is the GFCM.
STECF notes the increasing need for international fleet-disaggregated (and/or metier) fishery data and that it is not addressed as such in the current FAO landings statistics database.
STECF considered the point raised that on some occasions, sampled data has been used for enforcement or regulatory purposes, leading to a withdrawal of co-operation and thus non compliance with the requirements of the DCR. STECF agrees with SGRN and stresses that these data should only be used for scientific purposes and that MS should ensure that primary data are dealt with in a confidential way (article 9, 1639/2001) but that aggregate data should be accessible to all interested parties.
SGRN recommended that data summaries in connection with ICES assessments be compiled in such a way that allows for more efficient quality evaluation. STECF

Page 80 STECF plenary meeting November 2006
wishes to receive convenient (or manageable) feedback on the appropriateness of data collected under the DCR for stock assessment and management plan evaluations from advisory bodies so that it can give advice, specifically to each considered MS, on which data should be collected and to which sampling effort. Furthermore, STECF also recommends that other regional (international) fishery organisations (e.g. GFCM, ICCAT, NAFO) consider providing such feedback.
STECF shares the concerns of SGRN that the increasing importance given to the quality of the data collected in the framework of the new DCR goes together with the search of clear and objective criteria for their evaluation. SGRN must continue to have high objectives of impartiality and equitability in the evaluation of DCR achievements.
STECF supports the workshop planned in 2007 on raising procedures for discards as proposed by ICES PGCCBS and agreed by SGRN, and stresses the importance that this workshop be opened for experts from other regional fishery organisations.
8.2 REVISION OF THE DATA COLLECTION REGULATION TO TAKE INTO ACCOUNT THE ECOSYSTEM APPROACH
STECF reviewed the report of the SGRN 06-01 working group on development of indicators for monitoring under the Ecosystem approach to Fisheries management.
The report points out that the group followed the previous SGRN in the recommendation that two types of indicators are needed to support the environmental integration process, indicators of the state of the marine environment and indicators of the pressure that affects state. Our aim was to select those indicators for which there is sufficient scientific justification and that can be quantified based on existing monitoring programmes, if needed after a slight modification or expansion. The state indicators should cover a broad range of ecosystem features and the pressure indicators should cover the most important aspects of how fishing impacts the ecosystem. The SGRN 06-01WG adopted most of the indicators recommended by the previous SGRN but slightly rephrased some of them to make them compatible with other work in the field and in scientific literature.
The state indicators selected by the SGRN 06-01 WG were: (1) Conservation status of vulnerable fishes according to IUCN decline criterion, (2) Abundance of marine mammals, reptiles or seabirds (knowledge of this is not needed as an indicator, but as a vital part of understanding the effect of by-catch), (3) Mean weight and mean maximum length of fish assemblage, (4) Proportion of sensitive habitats impacted, (5) Abundance of sensitive benthos species, (6) Age and size at maturation of commercial fish species. The associated pressure indicators were (7) Spatial and temporal distribution of fishing effort, (8) Catch and discard rates; this includes rates for marine mammals, reptiles or seabirds. We propose using by-catch mortality per population as an appropriate (pressure) indicator.
For each of these indicators we identified, as far as possible, the data requirements and for each of the RAC regions the data availability. Based on this we developed a decision scheme for the prioritisation and incremental implementation of the data needs that need to be collected as part of the DCR.

STECF Plenary Meeting November 2005 Page 81
Is available information adequate
Do we know what we need to quantify
indicator ?
Pilot projectFund research
initiative
Literature
Expertise
Yes
No
Yes
No
Quantify indicators
Available data from DCR or
otherwise
Prioritize based on costs versus relevance/
immediate need
Recommend Timepathfor data collection (and possibly inclusion DCR)
Figure 8-1Decision scheme SGRN recommends that:
• Indicators 1 and 3 can be made operational immediately as the data required are already collected by at least one monitoring programme in most regions. An issue to be considered is the applicability of these indicators in species-poor circumstances (e.g. offshore Baltic Sea).
• Indicator 6 can be made operational in some regions and for some species. In several more cases the data are being collected but there are issues of the amount of data required, that need to be considered. Moreover collection of these data as part of DCR is mandatory on a tri-annual basis even though in practice it is often collected annually. This needs to become annual.
• Three sources of data are needed to make indicator 7 operational: fleet capacity, effort based on logbooks and VMS. Most of these data exist or are already part of DCR but there are issues of availability, reliability and consistency that need to be dealt with before this indicator can be made operational. In addition, further consideration needs to be given to ways to include the small-vessel fisheries not well covered by DCR at present.
• Indicator 8 requires two sources of data: logbooks and data from observer trips. For these sources there are issues of respectively reliability and representivity that need to be dealt with before they can be made operational. This is needed for all parts of the catch, including seabirds, mammals and reptiles.
• Indicator 2 requires a further data source to Indicator 8: background population levels for species of mammals, birds and reptiles caught in fishing operations. In many cases, this data exists and is being collected regularly, but not under DCR. This data needs to be collated. We do not propose that this is carried out wholly under DCR, but suggest that DG Fish needs to work with other parts of the European Commission to help make this information available.
• For indicators 4 and 5 more research is needed to further develop them as it was felt that there was insufficient scientific justification or it was unclear what data are already being collected and available. Guidance for these research initiatives is provided.

Page 82 STECF plenary meeting November 2006
8.2.1 Stecf Comments And Recommendations STECF acknowledges the important contribution made by the participants in the SGRN WGs on the development of indicators for monitoring under the Ecosystem approach to Fisheries management and agrees with the majority of the groups conclusions and recommendations. However a number of concerns were expressed by the STECF particularly regarding Indicators 1 and 2 above. The STECF opinion on these and other issues are given below.
8.2.1.1 Indicator (1) STECF notes that the indicator suggested for “Conservation status of vulnerable fishes according to IUCN decline criterion” was the “threat indicator” first developed by Dulvy et al (2006). This indicator was evaluated in the INDENT project as a potential indicator for the status of the non-assessed species. There was concern within STECF pertaining to the use of IUCN criteria and how these affect the proposed indicator.
This was explored by considering the example in Dulvy et al (2006)14. This example was based on 23 species (both assessed and non-assessed) of the North Sea fish assemblage. These species were considered representative of the breadth of morphology, life histories, ecology, and taxonomic diversity of the larger bottom-dwelling fishes sampled on the English groundfish survey in the North Sea.
The example showed that in the North Sea, the overall abundance of the suite of species declined by ~34%. This relatively modest decline may not reflect the actual threat to individual species. The composite threat indicator suggests that, on average, all species were threatened from the late 1990s onwards.
Dulvy et al (2006) note that when considering any of the threat categories separately it was observed that trends in the proportion of the (critically endangered) species are weak and highly variable, and an indicator based solely on the highest decline threshold may be unreliable or uninformative. Instead they suggest that the trends in each of the three threat categories be used to interpret the composite indicator, rather than be used as indicators.
Pertaining to the use of IUCN criteria15 to characterize the change over time of species in the assemblage STECF notes that IUCN criteria were developed for the classification of threat to terrestrial species and marine mammals and may not be suitable for fish or other marine species that are subject to human exploitation. This was the subject of an IUCN Workshop held in 199916 and not all issues regarding classification of marine populations were resolved. In particular, the criterion to have a certain decline of the population over a 3-generation period raises several concerns. First, natural fluctuations in recruitment in most of fish species often exceed 30% which is the threshold used by IUCN to define vulnerable populations in the absence of a known or suspected threat. In such cases observed reductions of the population might be linked to natural fluctuations in population numbers rather than as a result of any specific threat or threats. This is particularly relevant for short living species. Moreover, MSY of fish species often corresponds to about 30-40% (Hilborn et al., 2006) of the virgin biomass (corresponding to a 70% to 60% decline) and thus optimal exploitation of fish species is in conflict with some IUCN criteria. Given the above concerns STECF recommends that the classification of
14 Dulvy 15 IUCN. (2001). IUCN Red List Categories and Criteria: Version 3.1. IUCN Species
Survival Commission. IUCN, Gland, Switzerland and Cambridge, UK. II + 30 pp. Standards and Petitions Working Group. 2006. Guidelines for Using the IUCN Red List Categories and
Criteria: Version 6.1. Prepared by the Standards and Petitions Working Group for the IUCN SSC Biodiversity Assessments Sub-Committee in July 2006. 60 pp.
16 Mace, G.M. (ed.), 1999. The IUCN Criteria Review: Report of the Marine Workshop. Tokyo, January 16-17, 1999. IUCN-SSC: 23 pp.

STECF Plenary Meeting November 2005 Page 83
marine organisms according to current IUCN criteria is inappropriate and that informative criteria for the classification of marine organisms should be developed.
However, the suggested threat indicator is merely a composite of several categories with a specific rate of decline. The actual choice of the boundaries of these categories will probably not affect the outcome of the indicator. Moreover, considering that all the existing monitoring programs on which this indicator can be based commenced well after the pristine situation, constant exploitation of the species involved at e.g. FMSY would not result in any of the fish being categorized as vulnerable or otherwise.
The fact that this indicator is based on an assemblage of several species ascertains that it will not be affected too much by natural fluctuations of any of the species separately.
STECF recommends that the terminology used in the INDENT project for this indicator be adopted namely “Relative abundance of a set of populations that are not regularly assessed but which are decreasing in number” This has the advantage that it removes the term “vulnerable” form the indicator label thereby avoiding any confusion regarding its definition and any association with the definition used by the IUCN.
STECF notes that the use of an indicator based on changes in the assemblage can be quantified with the data from existing monitoring programs. However, existing monitoring programmes may not be adequate to quantify single species indicators of species with low abundance.
8.2.1.2 Indicator (2) A very recent IUCN paper on Cetaceans (2006) appears quite questionable in terms of methodological approach to attribute a particular status to certain species or populations or subpopulations and even to define them. Reliable estimates of the abundance of marine mammals and marine reptiles are scarce. In addition, while data on the incidental by-catch of marine mammals are available for some populations, the impact of by-catch cannot be reliably quantifies because of the uncertainty regarding the overall population size. On the other hand, most marine mammals and reptiles are slow growing, have a high age-at-maturity, and are particularly vulnerable to fishing. Population productivity is low, with low fecundity and a protracted gestation period. In the light of this, risk of depletion is high even with a low level of by-catch mortality and thus estimates of population size are crucial to assess the impact of by-catch on these species.
8.2.1.3 Indicators (7) and (8) SGRN recommended that data necessary to quantify the pressure indicators should be available per metier and they suggested to adopt the table developed by the STECF sub-group on fleet segmentation (EC 2006) for the definition of the métiers. However, there was some concern within The SGRN WG and in STECF as to the appropriateness of this table for use as part of an EAFM. This mainly applied to the sub-division at level 5 where target species or species groups were used instead of e.g. mesh-size as suggested in some of the RCM reports. STECF reiterates this concern of using the sub-divisions at level 5 but also acknowledges that it is necessary to use a consistent definition of métiers and the used definition is probably the best that is currently available.

STECF Plenary Meeting November 6-10 2006
9 OTHER MATTERS
9.1 STECF PARTICIPATION IN WORKING GROUP MEETINGS OF THE ACFA
Every year ACFA organises 12 meetings, respectively by 4 fields : fisheries resources, aquaculture, markets, generals questions. Since 2001 STECF members (biologist and/or economist) have participated at these meetings : Michael Keatinge (biologist) and Yves Perraudeau (economist and coordinator for the actions of the Scientific Comittee within ACFA). John Casey also attended an additional meeting of the ACFA on MSY at the request of the Commission.
Since the begining of 2006 the STECF’members have participated, in Brussels, at the following 4 working groups of the ACFA :
- 25 January 2006 group 1 (resources) - 15 February 2006 group 3 (markets) - 23 February 2006 group 4 (general affairs) - 30 March 2006 group 2 (aquaculture) - 27 April 2006 group 1 (resources) - 07 June 2006 group 4 (general affairs) - 15 June with 2 (aquaculture) - 26 June with 3 (markets) - 15 September group 1 (resources) - 10 October group 3 (markets) - 17 October group 4 (general affairs) - 14 November with the group 2 (aquaculture).
9.2 COMMENTS ON RECENTLY PUBLISHED HEADLINE ARTICLES Two recent papers published in scientific journals concerning the negative impact of fisheries on the marine environment have received much exposure in the media. The impact of this exposure on public opinion and stakeholders could influence the management of EU fisheries. Because of this possible impact, STECF, in its role as an independent advisory body, has a number of remarks on the content of these papers.
The first paper by Worm et al.17 forecasts a full collapse for all taxa currently fished in the next 40-years and has been cited by most of the media as a clear example of the calamitous impacts of fisheries. STECF agrees with many of the conclusions of this paper. However the finding that 29% of currently fished taxa are collapsed (catches below 10% of historic value) and 65% have collapsed at some stage over the past 50 years is surprising and should be checked. This will be difficult because in this paper, and particularly in the section related to large marine ecosystems, the separate impact of fishing on fisheries, species and taxa are not always clearly distinguished
The second paper entitled “The status and distribution of cetaceans in the Black Sea and Mediterranean Sea. IUCN” (Reeves R. & Notarbartolo di Sciara G., compilers and editors. 2006. Centre for Mediterranean Cooperation, Malaga, Spain. 137 pp.) reports the proceedings of a meeting held in Monaco in March 2006, organised by ACCOBAM and CMS. The meeting was given much media coverage.
STECF is concerned that the conclusions of the subset of the scientific community present at this meeting might be interpreted as representing the consensus view of the whole community. Those present cited each others’ papers and included some
17 Worm et al., 2006 – Impacts of biodiversity loss on Ocean ecosystem services. Science, 314: 787-790

STECF Plenary Meeting November 2005 Page 85
grey literature but did not take into account two significant STECF reports18, which have recently reviewed scientific knowledge on marine mammals and their interaction with fisheries.
In these reports STECF had underlined the weakness of methods used to assess cetacean populations and underlined the unreliability of the derived population estimates. However the IUCN/ACCOBAMS group appear to have applied these population levels uncritically and used anecdotal information to infer declining trends. Several species have thereby been classified as having a high risk of extinction in the wild. Furthermore the group have defined sub-populations in the Mediterranean without the necessary scientific evidence.
Thus “Strait of Gibraltar sub-population” Orcinus orca is considered Critically Endangered (CR), “Mediterranean sub-populations” of Physeter macrocephalus and Delphinus delphis, are both considered as Endangered (EN) and two other “Mediterranean sub-populations” (Tursiops truncatus and Stenella coeruleoalba are considered Vulnerable (VU).
STECF is seriously concerned about the methodology used to assess the status of all the Mediterranean cetaceans. Distribution maps are biased. Several previous studies done by other research groups and Institutions have not been examined or even taken into account19. Data from one single small island in NE Adriatic Sea) have been considered as representative for the entire Mediterranean Sea. Fisheries data from GFCM and FAO regional projects have not been taken into account – the only fisheries data coming from participants to the meeting, personal communications and unpublished reports. The report states that the classification is mostly “based on concerns about degradation, loss of fragmentation of the habitat” and on “prey depletion due to overfishing”, even if these concepts have been not properly quantified.
On the other hand STECF shares the classification of the the three cetacean subspecies in the Black Sea (Phocaena phocaena relicta, Delphinus delphis ponticus and Tursiops truncates ponticus) as Endangered (EN) both because of the deteriorated environmental situation and because ofto specific and deliberate killing of cetaceans in that area.
STECF appreciates greatly the valuable role played so far by IUCN for the conservation of many endangered species and it is well aware of the important role that such Organization may play in enlightening the conservation status of protected or threatened species. Nonetheless, STECF would underlines that poorly steered initiatives, such the one under examination, may undermine the scientific credibility of the Organization and mislead public opinion and stakeholders.
Due to the likely implication of the IUCN categories on many international Agreements including EU Directives and Regulations STECF considers advisable to convene a dedicated WG in 2007 so that a more extensive scientific scrutiny could be undertaken.
9.3 MEETINGS IN 2007 The STECF timetable for 2007 is normally fixed at a meeting of the Bureau (chairman, vice-chairmen and Commission) in January 2007 but a preliminary list of events has been drawn up (Table 9-1) Table 9-1 preliminary timetable for 2007 meetings meeting date STECF Bureau January 2007 18 SEC(2002)376, 3 April 2002, WG on Incidental Catches of small Cetaceans (Bruxelles, 10-14 December 2001) and SEC(2002)1134, 22 October 2002, WG on Incidental Catches of Small Cetaceans (Bruxelles, 11-14 June 2002). 19 The Meeting did not considered the most extensive study carried out in the NW Mediterranean Sea by NURC since 1999 to 2006 (on-going), including a very comprehensive GIS Mediterranean data bank on cetacean created at the Centre, the Italian Project Cetacea (1978-1985), the previous studies conducted by the first CIESM WG on Marine Mammals (1979-1985) an many relevant papers published by various Authors.
Page 86 STECF plenary meeting November 2006
SGECA-06-03 : DCR - economic parameters 15-19 January
SCEGA-SGRST: Baltic cod impact assessment January-February
SGRN DCR- web site 12-16 February SGMOS Oversea fisheries before April SGRN change in timing of scientific advice
before April or in April plenary
SGRST Evaluation of closed areas before April or in April plenary
SGRST-SCEGA: Skagerrak/Kattegat fishing effort Bio+Economics ??
SGRN-06-05 : List of surveys (DCR) 1st quarter STECF PLEN-07-01 April STECF PLEN or by correspondance: Baltic and pelagic stocks June
STECF-SGRN evaluation of national 2006 technical report from DCR 2-6 July,
ADHOC In year assessment of Anchovy end June - beginning July
SCEGA-SGRST Stock status review and economic performance of EU fleets
October after ICES advice
STECF PLEN November SGRN Evaluation of DC national programmes in 2008 3-7 December,

STECF Plenary Meeting November 6-10 2006
ANNEX 1 ECONOMIC ANALYSIS OF THE FRENCH ANCHOVY FISHIERS IN THE BAY OF BISCAY.

STECF Plenary Meeting November 6-10 2006
ANNEX 2 THE SELECTIVE PERFORMANCE OF A 95MM CODEND WITH A 120MM SQUARE MESH PANEL IN THE NORTH SEA MIXED NEPHROPS/WHITEFISH TRAWL FISHERY
STECF Plenary Meeting November 6-10 2006
ANNEX 3 A REPORT OF TRIALS UNDERTAKEN WITH THE SWEDISH GRID AND SQUARE MESH CODEND IN THE ENGLISH (FARN DEEPS) NEPHROPS FISHERY DURING WINTER 2005/06

STECF Plenary Meeting November 6-10 2006
ANNEX 4 SELECTIVE PROPERTIES OF THE CUTAWAY TRAWL AND SEVERAL OTHER COMMERCIAL TRAWLS USED IN THE FARNE DEEPS NORTH SEA NEPHROPS FISHERY

STECF Plenary Meeting November 6-10 2006
ANNEX 5 REDUCING DISCARDS (PART B): A REPORT ON RECENT WORK WITH FISHERS TO IMPROVE THE EFFICACY OF SQUARE MESH PANELS IN THE FARN DEEPS NEPHROPS FISHERY, NORTH SEA

STECF Plenary Meeting November 6-10 2006
ANNEX 6 TECHNICAL CONSERVATION AND THE IRISH SEA NEPHROPS FISHERIES

STECF Plenary Meeting November 6-10 2006
ANNEX 7 CALCULATIONS OF HARVEST RATIO BASED ON ACFM APPROACH USING LANDINGS /

STECF Plenary Meeting November 6-10 2006
ANNEX 8 SCIENCE BEHIND INCENTIVISING WHITEFISH SELECTIVITY IN SMALL MESHED FISHERIES IN COD RECOVERY ZONE – REVISED ESTIMATES BASED ON OCT 2006 SELECTIVITY DATA

STECF Plenary Meeting November 6-10 2006
ANNEX 9 HARVEST RATES FOR NEPHROPS