the reproductive biology of steelhead (oncorhynchus...
TRANSCRIPT

The Reproductive Biology of Steelhead (Oncorhynchus mykiss) inthe Bridge and Seton Rivers, As Determined by Radio Telemetry
1996/97 and 1998/99
Prepared for:
The Ministry of Environment, Lands & ParksFisheries Branch, Southern Interior Region
1259 Dalhousie Dr.Kamloops, BC
V2C 5Z5
Prepared by:
Stacy Webb, Robert Bison, Al Caverly and Jim Renn

i
Abstract
The 1996/97 and 1998/99 studies of the spawning migrations of Bridge andSeton River steelhead were part of a larger study investigating the migrationbehaviour and stock composition of interior Fraser River steelhead. Steelheadwere radio-tagged in the fall of 1996 and 1998 in the Lower Fraser River and inthe winter/spring of 1997 and 1999 in the Middle Fraser River. Tagging effort wasconcentrated at the Seton/Fraser River confluence during the winter/springcaptures, specifically to study Bridge and Seton River steelhead. A total of 15steelhead were tracked during the 1997 spawning season and 18 steelhead weretracked during the 1999 spawning season in the Bridge and Seton watersheds.Immigration into the Seton and Bridge Rivers started around the middle of Apriland finished during the second week of May. Immigration into the Bridge andSeton Rivers in 1999 occurred primarily during the last two weeks of April.Spawning in the Bridge and Seton watersheds in 1997 started during the secondweek of May and ended around the middle of June. Spawning in the Bridge andSeton watersheds in 1999 occurred a little earlier, starting during the secondweek of April and finishing during the first week of June. Spawning in the Setonwatershed occurred primarily in the Cayoosh Creek compensation channel. Thelower reaches of the Bridge River were not well utilized by spawning radio-tagged steelhead in 1997 or 1999. In addition to studying the spring migrationbehaviours of Bridge River steelhead in 1999, escapement abundance wasestimated using area-under-the-curve and maximum likelihood techniques. A 5.8km long survey area in the Bridge River, upstream of the Bridge/Yalakomconfluence was selected to count holding and spawning steelhead on a weeklybasis. The parameters of observer efficiency, survey life, and proportion ofspawners in the counting area relative to the entire watershed were estimated inthe field. The 1999 escapement estimates ranged from 369 to 422 depending onthe method used. The best estimate was considered to be 369. Precisionestimates indicated that it was highly likely the population exceeded 200spawners.
Acknowledgements
The authors would like to thank Rena Vandenbos at RL&L Environmental Consultantsfor Seton River temperature data, Paul Higgins at BC Hydro for Bridge Rivertemperature data, and Lynne Campo at Water Survey Canada for water flow data.

ii
Table of Contents
Abstract ........................................................................................................................ iAcknowledgements ...................................................................................................... iTable of Contents ........................................................................................................ iiList of Figures ............................................................................................................ iiiList of Tables.............................................................................................................. iiiList of Appendices...................................................................................................... iii
1 Background................................................................................................................. 11.1 Study Objectives ................................................................................................. 11.2 Study Area .......................................................................................................... 11.3 Existing Information ........................................................................................... 4
2 Methods ...................................................................................................................... 42.1 Fish Capture ........................................................................................................ 42.2 Telemetry ............................................................................................................ 52.3 Escapement Estimation....................................................................................... 5
3 Results......................................................................................................................... 73.1 1997 Results........................................................................................................ 7
3.1.1 Fall Deployment.............................................................................................. 73.1.2 Overwintering ................................................................................................. 83.1.3 Winter and Spring Deployment ...................................................................... 83.1.4 Upstream Migrations ...................................................................................... 83.1.5 Spawning Distributions................................................................................. 103.1.6 Downstream Migration ................................................................................. 13
3.2 1999 Results...................................................................................................... 133.2.1 Fall Deployment............................................................................................ 133.2.2 Overwintering ............................................................................................... 133.2.3 Winter and Spring Deployment .................................................................... 153.2.4 Upstream Migrations .................................................................................... 153.2.5 Spawning Distributions................................................................................. 163.2.6 Downstream Migration ................................................................................. 193.2.7 Escapement Estimation................................................................................. 20
4 Discussion................................................................................................................. 234.1 Overwintering Distribution............................................................................... 234.2 Upstream Movement Patterns........................................................................... 234.3 Spawning Distribution ...................................................................................... 244.4 Kelts .................................................................................................................. 254.5 Escapement Estimation .................................................................................... 26
References ................................................................................................................. 27Appendices ................................................................................................................ 28

iii
List of Figures
Figure 1. The Bridge and Seton River steelhead telemetry study area.. ........................... 3Figure 2. The overwintering locations for 1996 fall radio-tagged Bridge and Seton
watershed steelhead and 1997 winter/spring radio-tagging locations. ....................... 9Figure 3. The steelhead spawning distribution in the Bridge and Seton watersheds
based on 1997 telemetry data.................................................................................... 11Figure 4. The 1997 spawning locations of radio-tagged Bridge River steelhead and
Bridge River mean daily water temperatures (at 26.4 km)....................................... 12Figure 5. The overwintering locations for fall 1998 radio-tagged Bridge and Seton
watershed steelhead and 1999 winter/spring tagging locations................................ 14Figure 6. The cummulative number of radio-tagged steelhead (percent) entering the
Bridge River in the spring of 1999 and the mean daily water temperature of theBridge River taken 20 km upstream of the Bridge/Fraser River confluence(downstream of the Bridge/Yalakom confluence). ................................................... 15
Figure 7. The spawning distribution of Bridge and Seton River steelhead in 1999. ...... 17Figure 8. The spawning locations of radio-tagged Bridge River steelhead in 1999 and
the mean daily water temperature of the Bridge River. ............................................ 19Figure 9. Profiles of instantaneous counts using the trapezoidal approximation (a), 3
variations of the normal arrival time model and the beta arrival time model (b ...... 21Figure 10. Chi-square probability graphs for total escapement using the normal arrival
time model under three observation error assumptions and the beta arrival timemodel......................................................................................................................... 22
List of Tables
Table 1. The 1997 spawning locations and dates for 8 Bridge and Seton River steelhead.................................................................................................................................... 10
Table 2. The 1997 spawning locations and dates for Bridge and Seton steelhead inwhich there is uncertainty in location and/or dates................................................... 12
Table 3. The spawning locations and dates for Bridge and Seton steelhead in 1999. .... 18Table 4. 1999 Spawning locations and times for Bridge and Seton steelhead in which
there is uncertainty in the location and/or time......................................................... 18Table 5. Escapement estimates and confidence limits..................................................... 22Table 6. Parameter estimates based on direct field estimates and parameter search
routines (MLE methods). .......................................................................................... 22
List of Appendices
Appendix I 1996/97 capture location, biological information, and natal streamAppendix II 1998/99 capture location, biological information and natal stream.Appendix III Stream flow vs. 1997 spawning radio-tagged steelhead movement.Appendix IV Stream flow vs. 1999 spawning radio-tagged steelhead movement.Appendix V Movement graphs of 1997 Bridge and Seton River radio-tagged steelhead.Appendix VI Movement graphs of 1999 Bridge and Seton River radio-tagged steelhead.Appendix VII Escapement estimation data.

1
1 Background
1.1 Study Objectives
The 1997 and 1999 studies of the spawning migrations of Bridge and Seton Riversteelhead were part of a larger study investigating the migration behaviour and stockcomposition of interior Fraser River steelhead.
The objectives of the 1997 and 1999 Bridge and Seton River telemetry studies were tounderstand the timing of spring migrations, to determine the geographic distribution ofspawning, and to estimate spawning population abundance.
1.2 Study Area
The Fraser is the largest river system that is completely contained within the province ofBritish Columbia. The basin is divisible into four subregions based on climate andtopography. These subregions are the upper Fraser (from its source to Willow River nearPrince George), the middle Fraser (from the Willow River to the Fraser Canyon), theThompson system, and the lower Fraser (from the Fraser Canyon to the sea). The FraserCanyon is a major barrier to fish and many of the anadromous fish species in the lowerFraser are absent above the canyon (McPhail and Carveth 1992). Where the Bridge andSeton rivers enter the middle Fraser River, it is classified as a 9th order river (Figure 1).The middle Fraser River flows through the warm and dry Ponderosa Pine biogeoclimaticzone and is the migration corridor and habitat of six anadromous fish species and 25freshwater species (McPhail and Carveth 1992).
In it’s natural condition, the mainstem Bridge River is a 6th order tributary of the FraserRiver. It joins the Fraser River 337 km upstream of the Fraser River mouth at anelevation of 220 m above sea level. The watershed is located in the Southern InteriorEcoprovince and drains the eastern slope of the Pacific Coast Mountains. The area of thewatershed is 4735+ km2 and includes five large subdrainages: the upper Bridge watersheditself, the Yalakom, Tyaughton, Gun and Hurley/Cadwallader subdrainages.
Two hydroelectric dams are located along the mainstem Bridge River. Terzaghi Dam,built in 1956, is the furthest downstream dam. It is located 40 km upstream of theBridge/Fraser confluence. Except when periodic spills occur, Terzaghi Dam diverts theentire flow of the Bridge River. The upstream distribution of anadromous and adfluvialfish is limited to reaches downstream of the dam. The Bridge River channel is dry for adistance of about four kilometers downstream of the dam. The channel is recharged to asmall degree by groundwater and some small tributaries until it joins the Yalakom River.From this point onward, there are no other large tributaries that contribute stream flow tothe Bridge River, therefore almost all of the water that reaches the Fraser River nowcomes from 1 of the 5 large subdrainges (Yalakom) in the watershed. The other fourdrainages are diverted south, into the Seton watershed. The lower Bridge River presentlydrains an area of 1014 km2 or 21% of the natural watershed area.

2
The seasonal hydrology of the Bridge watershed is snow-melt driven. Stream flows areat a maximum in the spring, usually peaking in June or July. Downstream of TerzaghiDam, the Yalakom River has a mean maximum flow of 11.5 m3/s in June and a meanannual flow of 4.11 m3/s (eight years of WSC records from 1983 to 1990). This shouldclosely resemble the hydrology of the Bridge River mainstem downstream of TerzaghiDam although Water Survey Canada records are not available for this section of theBridge River.
The Seton River is also a 6th order tributary of the Fraser River. It enters the Fraser River329 km upstream of the Fraser River mouth at an elevation of 200 m. Two largeoligotrophic lakes are located along the mainstem: Seton and Anderson lakes. Thewatershed area is 1915 km2 and contains two major subdrainages: Cayoosh and Gates.There are 2 dams in the Seton watershed but unlike dams on the Bridge River, they donot disrupt the upstream migration of fish. A dam located at the outlet of the lower lake(Seton Lake) contains a fish ladder. A dam on Cayoosh Creek, which could block fishpassage, is located at a waterfall that has always been a natural fish barrier. The flow ofwater downstream of both of these structures is diverted away from the natural channelsfor hydroelectric power generation, although some water is maintained in both CayooshCreek and Seton River. In Cayoosh, the power generation facility is a run-of-the-rivertype and therefore the flows in Cayoosh Creek typically follow a natural hydrographwhen hydroelectric water licence quantities are exceeded.
The hydrology of the Seton watershed is also snowmelt driven. Peak flows typicallyoccur in June. The Seton River, as measured at the hydrometric station near Lillooet, hasa mean maximum flow of 46.3 m3/s in June and a mean annual flow of 23.2 m3/s. Theseflow measurements are not reflective of the natural condition of the watershed as theyinclude the flow of water from the majority of the Bridge River watershed.

3
Figure 1. The Bridge and Seton River steelhead telemetry study area. Arrows point to referencekilometers upstream of the Fraser River, with zero occurring at the confluence of the Seton andFraser River and the Bridge and Fraser River.
Fraser River
BridgeRiver
Yalakom River
Cayoosh Cr.
Seton Lake
Anderson Lake
Carpenter Lake
Seton River
BCHydroTailrace
Antoine Cr.
Michelmoon Cr.
Hell Cr.
Yankee Cr.
Camoo Cr.
Applespring Cr.
Moon Cr.
5 0 5 Kilometers
25
27.528.7
30.8
21.9
1711.8
3

4
1.3 Existing Information
Bridge and Seton River steelhead (Oncorhynchus mykiss) are part of a larger geographicand life history grouping referred to as interior Fraser summer steelhead. Their migrationtiming is similar to the better known Thompson River steelhead, another interior Frasersub-group. Bridge and Seton River steelhead enter the Fraser River in the fall, overwinterin the Fraser mainstem, and begin ascent of their natal spawning tributaries in late Apriland early May (Renn et al. 2001, Hebden 1981).
Hebden (1981) described the abundance and distribution of Bridge River steelhead basedon helicopter surveys, snorkel surveys and angling. He concluded that less than 200steelhead spawn in the Bridge each year, with most spawning occurring in the section ofthe Bridge River that is upstream of the Yalakom River confluence.
Hebden (1981) reported that the capture of steelhead in Seton River near the CayooshCreek confluence indicated that both the Seton River and Cayoosh Creek were probablespawning habitats. Hebden also reported the presence of large rainbow trout in Gates andPortage Creeks, but concluded that these were adfluvial trout and not anadromoussteelhead.
Steelhead migration into the Bridge and Seton rivers was first studied in 1996 (Baxterand Roome, unpublished data). Fourteen steelhead were radio-tagged at the confluence ofthe Fraser and Seton rivers and monitored for the duration of their spring migrations inand out of spawning tributaries. Two of the fish remained in the Seton watershed for ashort period but later, entered the Bridge River to spawn. It is believed 10 of the fishspawned in the Bridge watershed in either the Bridge or Yalakom Rivers. Three fishmigrated up the Fraser and spawned in the Chilcotin Watershed and one fish is believedto have died shortly after radio tagging (Baxter and Roome, unpublished data).
Steelhead spawning above the Seton dam has never been documented (McGregor, pers.com. 1999) although steelhead have passed through the fishway and have been capturedin the power canal during trash-rack maintenance (Hebden, pers. com. 1999). Radio-tagged steelhead were not detected above the Seton dam in the 1996/97 or 1998/99studies.
2 Methods
2.1 Fish Capture
Radio-tagged steelhead used as a part of the Bridge River steelhead telemetry study wereinitially captured in the lower Fraser River for the interior Fraser River steelheadtelemetry study. In the fall of 1996, steelhead were captured for radio tagging using atangle net, beach seine, angling and a 24-hour gill net fishery. In the fall of 1998, thesame methods were employed to capture steelhead with a couple of exceptions: a gill netwas not used to capture and radio tag steelhead and a fish wheel was added to the group

5
of “selective” fishing gear types. Steelhead assessed as being in vigorous condition wereanaesthetised with clove oil and fitted with a LOTEK model MCFT-3A or 3B, 3-voltdigitally encoded tag. All steelhead captured were also bio-sampled and marked with aflorescent orange floy tag containing an identification number and a toll free telephonenumber to contact ministry personnel (Renn et al. 2001).
Radio tags applied in the late winter/early spring period were applied entirely by anglingin several known overwintering locations. Due to cold water conditions at this time ofyear, no anaesthetic was used (Renn et al. 2001).
2.2 Telemetry
Tracking of radio-tagged steelhead was conducted using a combination of aerial, groundand fixed telemetry stations. In all cases a Lotek SRX 400 receiver using ether a W5,W16, W17 or W30 E-prom in conjunction with a 2 or 4 element Yagi antenna was used.The fall movement of radio-tagged steelhead was monitored primarily through the use offixed telemetry stations along the mainstem Fraser River. Overwintering locations weredetermined via aerial tracking. The upstream migration period, spawning distributionand residency times were determined using a combination of aerial and ground telemetry.The timing of immigration and emigration from the Bridge River in 1999 was determinedby a fixed telemetry station at the confluence of the Bridge and Fraser Rivers.Emigration timing from the lower Fraser River was monitored by a fixed telemetrystation at Hope. Details of fixed station telemetry operation, aerial telemetry and ground-tracking methodologies may be found in Renn et al. 2001.
2.3 Escapement Estimation
Estimation of abundance was based on periodic counts conducted while steelhead were inspawning areas (Hilborn et al. 1999). Spawners were counted in a 5.8 km section of theBridge River from Yankee Creek to the confluence with the Yalakom River. Thislocation was optimal for counting because of the extremely clear water conditionsthroughout the spawning season. Spawning and holding steelhead were counted duringstream walks. Surveys were conducted at a frequency of about one per week in order tocapture the shape of the escapement curve (Hill 1997). Survey life was defined as thetotal time that a fish spent in the survey area and was estimated using radio telemetry.Fish visibility (observer efficiency) was estimated as the proportion of radio-tagged tonon radio-tagged steelhead observed during stream walk counts (radio-tagged steelheadwere marked externally with spaghetti tags). Bridge River steelhead also spawndownstream of the counting area and in the Yalakom River, but the proportion ofspawners that can be seen in these reaches is usually very low due to poor water clarityand higher flows. Therefore, the proportion of steelhead in the counting area relative tothe entire watershed was estimated by the distribution of radio-tagged steelhead.

6
The trapezoidal approximation and four variations of a maximum likelihood method wereused to calculate the escapement estimate (Hilborn et al.1999). The trapezoidal andmaximum likelihood methods were modified to incorporate an expansion factor toaccount for spawners outside the counting area. The trapezoidal method was modified as
where E is the escapement in the entire watershed, AUC is the area under the curve, s issurvey life, v is a correction for observer efficiency, and Rw/Rc is the ratio of the numberof radio-tagged steelhead in the watershed relative the number of radio-tagged steelheadin the counting area.
Similarly for the maximum likelihood method, the arrival time model for fish entering thecounting area was modified by including the correction for fish distribution as
where At is the cumulative number of arrivals, m is the mean date of arrival into thecounting area, and σm is the standard deviation of date of arrival. The cumulative numberof deaths (or emigrants as is the case with iteroparous steelhead) was similarly modifiedas
and the total number alive in the counting area is
Survey life (s) is included in the arrival model to offset the timing of cumulative deathsrelative to the timing of cumulative arrivals. The arrival and death model providedeterministic predictions about the number of fish in the counting area on any given day.
The predicted number of fish counted by an observer on a particular day t is assumed tobe proportional to the number of fish alive in the counting area (Nt) scaled by observerefficiency (v):
=
c
w
RRv
sAUCE
^
dimiRREA
t
i dmw
ct ∫
=
−−
=
02
2
2)(exp
21
σπσ
dimiRRED
t
i dmw
ct ∫
=
−−
=
02
2
2)(exp
21
σπσ
.ttt DAN −=

7
As in Hilborn et al. (1999), we assumed deterministic dynamics in the process model andwe assumed that all error was in the observation model. Three variations includednormal arrival time models assuming observation error in fish counts was either normallydistributed, lognormally distributed and distributed in a pseudo-Poisson manner. Afourth variation included an arrival time model based on the beta distribution with theassumption that observation error in fish counts was distributed in a pseudo-Poissonmanner.
Methods for calculating likelihoods were as described by Hilborn et al. (1999) with anadded likelihood component for uncertainty in fish distribution outside the counting area.Uncertainty in fish distribution was incorporated by including a likelihood componentbased on the binomial distribution as:
where Rc is the number of radio-tagged steelhead in the counting area, Rw is the numberof radio-tagged steelhead in the watershed including those in the counting area, and p isthe sampled proportion in the counting area. The total likelihood was therefore
Maximum likelihood estimates of escapements were computed for each of the arrivaltime model variations by searching over the two parameters of the arrival time modelwhich are the mean day of arrival (m) and the standard deviation on mean day of arrival(σm) as well as the survey life (s), observer efficiency (v), and radio tags in counting area(Rc).
Methods for calculating confidence bounds were as described by Hilborn et al (1999)using the method of likelihood profile.
3 Results
3.1 1997 Results
3.1.1 Fall Deployment
Two of the 125 steelhead that were captured and radio-tagged in the lower Fraser Riverin the fall of 1996 were Bridge River steelhead. Both of the fish were captured by anglingnear Chilliwack (Appendix 1).
cwc RRR
c
wwc pp
RR
pRRL −−
= )1(},|{
).,|(),|(),|()|( pRRLvvLssLCxLL wcvstotal σσ=
.tt vNC =

8
3.1.2 Overwintering
Results from helicopter surveys conducted on January 24th, 29th and March 10th wereconsidered to represent the overwintering distribution of steelhead that were radio-taggedwhile migrating through the lower Fraser River in the fall. Both steelhead overwinteredbetween Lytton and Lillooet. One steelhead was located approximately 12 kilometersupstream of the Stein River and the other was immediately downstream of Texas Creek(Figure 2).
3.1.3 Winter and Spring Deployment
Radio tags were deployed at the confluence of the Seton and Fraser Rivers during thespring and winter of 1997, specifically to study Bridge River steelhead. All winter andspring tagged fish were captured by angling. Twenty-one steelhead were tagged at theSeton/Fraser River confluence, one steelhead was tagged at the Seton hydro tailrace,three steelhead were tagged in the Bridge River, and four steelhead were tagged at theThompson/Fraser confluence (Figure 2, Appendix 1). Eight of the 21 steelhead capturedat the Seton/Fraser confluence did not spawn in the Seton or Bridge watersheds. Onesteelhead captured at the Seton/Fraser confluence was re-captured one week later, also atthe Seton/Fraser River confluence (See Appendix 1).
3.1.4 Upstream Migrations
Fixed stations were not present at the mouth of the Bridge or Seton Rivers during the1996/97 telemetry study. Mobile tracking occurred on April 9th and 23rd, but did notoccur on a daily basis until May 7th. Due to these factors, the date of entry into thespawning tributaries was not detected for the majority of the radio-tagged steelhead.Average daily rates of movement were calculated from the total distance travelled ineither upstream or downstream directions prior to the start of the spawning residency,divided by the total number of migration days.
The upstream migration start date was detected for one female and two male BridgeRiver steelhead. One male steelhead entered the Bridge River on May 7th and travelled anaverage rate of 3.12 km/day, while the other male entered the Bridge River on May 10th
and travelled an average rate of 2.22 km/day. The female steelhead entered the BridgeRiver on May 11th and travelled an average rate of 1.45 km/day.

9
#
#
10 0 10 Kilometers
Winter/SpringTagging LocationsOverwintering Locations for FallTagged Steelhead
Fraser River
Thompson River
Nicola River
Bonaparte River
Deadman River
Bridge River
Yalakom River
Texas Creek
Stein River
Nahatlatch River
Cayoosh Creek
Figure 2. The overwintering locations for 1996 fall radio-tagged Bridge and Seton watershed steelheadand 1997 winter/spring radio-tagging locations.

10
The male steelhead that entered the Bridge River on May 7th was extremely mobile,travelling 90.5 km over 29 days before spawning in the Yalakom, 28.5 km upstream ofthe Bridge/Fraser River confluence. The other male entered and exited the Bridge Riveron May 9th before entering the river again on May 10th. At this time it was trackedmoving steadily upstream over a period of 9 days to its spawning location 19 kilometersupstream of the Bridge/Fraser River confluence. The female steelhead moved upstream ata steady rate for a period of 20 days, with no recorded diversions or backtracking, beforespawning in the Bridge River 29 km upstream of the Bridge/Fraser River confluence.
The Cayoosh Creek and Yalakom River steelhead entered the spawning tributaries afterthe first marked increase in discharge around the middle of May (Appendix 3). Both ofthe Yalakom spawning steelhead entered the Yalakom River on May 21st, before thesecond increase in water discharge. The movement of the Cayoosh spawning steelheadinto Cayoosh Creek on May 27th coincided with the second major increase in water flow.
3.1.5 Spawning Distributions
In the spring of 1997, 31 radio-tagged steelhead were located during mobile tracking ofthe Bridge and Seton watersheds. Analysis of the telemetry data concluded that 13steelhead spawned in the Bridge watershed and two steelhead spawned in the Setonwatershed (Figure 3, Appendix 5). The spawning period and location were defined by arelatively stationary period at or near the upstream extent of movement, followed by adownstream movement out of the system or death. The 13 Bridge watershed steelheadlikely spawned in the following locations: three downstream of the Bridge/Yalakomconfluence, three near the Bridge/Yalakom confluence, five upstream of theBridge/Yalakom confluence, and two in the Yalakom River. One Seton watershedsteelhead is believed to have spawned in Seton River and the other in Cayoosh Creek.The likely spawning location and dates were determined for eight radio-tagged steelheadtrout (Table 1). There was some uncertainty as to the exact spawning location or time forthe remaining seven steelhead (Table 2). For steelhead in which there was uncertainty inthe spawning residency, the range of locations and/or dates were given.
Table 1. The 1997 spawning locations and dates for 8 Bridge and Seton River steelhead.
Radio-tag Sex
SpawningLocation
(Stream km)Dates at Spawning
Location Description
209 female 25.5 - 27.7 May 11 - 13 Bridge - 0.5 - 2.7 km u/s Br/Yal confl251 male 28.5 June 5 - 12 Yalakom - 3.5 km u/s Br/Yal confl430 male 30 - 30.6 May 19 - 28 Bridge - 5 - 5.6 km u/s of Br/Yal confl706 female 25.5 - 26 June 11 - 15 Bridge - 0.5 - 1 km u/s of Br/Yal confl719 male 4.0 - 5.0 May 31 - June 6 Cayoosh - 1 - 2 km u/s Cay/Set confl831 female 29 May 31 - June 1 Bridge - 4 km u/s of Br/Yal confl
1317 female 22.8 - 23 June 5 - 7 Bridge - 22.8 - 23 km u/s Br/Frsr confl1319 female 10.5 May 12-14 Bridge - 10.5 km u/s Br/Frsr confl

11
#
#
#
#
#
#
#
#
#
#
#
#
#
#
#
#
#
#
#
#
#
5 0 5 Kilometers
Fraser River
BridgeRiver
YalakomRiver
Cayoosh Cr.
Seton Lake
Anderson Lake
Carpenter Lake
Seton River
BCHydroTailrace
Antoine Cr.
Michelmoon Cr.
Hell Cr.
Yankee Cr.
Camoo Cr.
Applespring Cr.
Moon Cr.
Fall tagged steelheadWinter/Spring tagged steelhead
Figure 3. The steelhead spawning distribution in the Bridge and Seton watersheds based on 1997telemetry data. Circles represent individual spawning locations.

12
Table 2. The 1997 spawning locations and dates for Bridge and Seton steelhead in which there isuncertainty in location and/or dates.
Radio-tag Sex
SpawningLocation
(Stream km)Dates at Spawning
Location Description
204 male 19 - 19.2 May 19 - June 18 Bridge - 19 - 19.2 km u/s Br/Frsr confl214 female 31 - 33.1 May 23 - June 18 Bridge - 6 - 8.1 km u/s Br/Yal confl217 male 23 - 26 May 14 - June 16 Bridge - near Br/Yal confl408 female 0.5 - 3 June 1 - 9 Bridge - 0.5 - 3 km u/s Br/Frsr confl1316 male 26 - 27.7 May 21 - June 1 Yalakom - 1 - 2.7 km u/s Br/Yal confl1331 female 3 - 3.5 May 19 - 23 Seton - 3 - 3.5 km u/s Set/Frsr confl1380 male 25 May 7 - 14 Bridge - Br/Yal confl
One steelhead was tagged in the Bridge River on May 8th downstream of theBridge/Yalakom River confluence. This fish appears to have reacted badly to radio-tagging and was only tracked on a few occasions moving downstream in the Bridge River(Appendix 5).
The remaining fifteen radio-tagged steelhead that were tracked via mobile telemetry donot appear to have spawned in the Bridge or Seton watersheds. Nine are considered tohave spawned in a Fraser River tributary upstream of the Nahatlatch River, possibly atthe Bridge/Fraser confluence. Five fish were tracked on only one or a few occasionsbefore disappearing (two immediately after tagging at the Seton/Fraser confluence andthree in the Bridge River between the Bridge River mouth and Camoo Creek) and onesteelhead may have died or regurgitated its tag.
Figure 4. The 1997 spawning locations of radio-tagged Bridge River steelhead and Bridge River meandaily water temperatures (at 26.4 km). Only Bridge River steelhead listed in Table 1 are in thefigure. Spawning locations were determined from mobile telemetry data.
0
5
10
15
20
25
30
35
1-M
ay
8-M
ay
15-M
ay
22-M
ay
29-M
ay
5-Ju
n
12-J
un
Date (1997)
Brid
ge R
iver
str
eam
kilo
met
ers
0
2
4
6
8
10
12
14
Brid
ge R
iver
tem
pera
ture
(Cel
cius
)

13
The telemetry data suggests spawning in the Bridge and Seton watersheds started aroundMay 7th and ended as late as June 15th. The mean spawning date in the Bridge watershed,based on the seven Bridge steelhead for which both a defined spawning location and datewas determined, was May 28th (n = 7, SE = 4.83). During this time, the mean daily watertemperature in the Bridge River was greater than 9°C (Figure 4).
The average spawning residency in the Bridge and Seton watersheds in 1997, based onthe eight steelhead for which there was some certainty to the spawning location and time,was 5.13 days (SE = 1.03). Spawning residencies ranged from 2 to 10 days.
3.1.6 Downstream Migration
At the completion of spawning, some steelhead began a rapid downstream migration outof their spawning tributaries, eventually returning to the ocean. Kelting fish moverapidly and were difficult to detect with mobile telemetry. Downstream migration rateswere calculated by dividing the kilometers travelled downstream in the Bridge or Setonwatershed by the number of travel days. The date radio-tagged steelhead exited theBridge or Seton watersheds was determined for only 2 Bridge River steelhead. Theirdownstream migration rates were 7.25 and 11.5 km/day.
Only seven of the 15 steelhead (47%) that were tracked in the Bridge and Setonwatersheds appear to have survived spawning and emigrated out of their tributarysystems in 1997. Six of the eight females (75%) that were tracked spawning in the Bridgeand Seton watersheds exited their natal streams. However, only one of the seven males(14.3 %) survived spawning and emigrated out of the Bridge River. It is assumed theremaining six male and two female steelhead died in the Bridge and Seton watersheds.
3.2 1999 Results
3.2.1 Fall Deployment
Eight of the 105 steelhead that were captured and radio-tagged while migrating throughthe lower Fraser River in the fall of 1998 were Bridge or Seton watershed fish: four of thesteelhead were captured by angling, two were captured in a fishwheel, and one wascaptured in a tangle net (Appendix 2).
3.2.2 Overwintering
Fall radio-tagged steelhead that eventually entered the Bridge or Seton Rivers over-wintered in the Fraser River upstream of the Nahatlatch/Fraser River confluence (Figure5). Four of the fall radio-tagged steelhead overwintered near Texas Creek, twooverwintered near Lytton, one overwintered downstream of the Seton/Fraser confluence,and one overwintered between the Lillooet bridges.

14
#
#
#
#
#
#
#
10 0 10 Kilometers
Yalakom River
Bridge River
Cayoosh Creek
Texas Creek
Stein River
Fraser River
Nahatlatch River
Nicola River
Thompson River
Bonaparte River
Deadman River
Winter/Spring Tagging LocationsOverwintering Locations for FallTagged Steelhead
Figure 5. The overwintering locations for fall 1998 radio-tagged Bridge and Seton watershed steelheadand 1999 winter/spring tagging locations.

15
3.2.3 Winter and Spring Deployment
Radio tags were deployed at the confluence of the Seton and Fraser Rivers during thespring and winter of 1999, specifically to study Bridge River steelhead. All spring radio-tagged fish were captured by angling. Thirteen steelhead were captured and radio-taggedin the winter/spring at the Seton/Fraser confluence and two steelhead were tagged in thespring at the confluence of the Bridge and Yalakom Rivers (Figure 5, Appendix 2). Fourof the 13 steelhead captured at the Seton/Fraser River confluence did not spawn in theSeton or Bridge watersheds. The capture location and date of one steelhead is unknown,but is thought to be a spring radio-tagged fish.
3.2.4 Upstream Migrations
The fixed station at the Bridge/Fraser River confluence recorded 13 radio-taggedsteelhead entering the Bridge River. Two more steelhead were radio-tagged in the BridgeRiver during their upstream migrations.
Steelhead started entering the Bridge River on April 1st, continuing until May 14th. Themajority of steelhead moved into the Bridge River during the two-week period fromApril 14th to April 26th (mean = April 20th, SE = 2.86) (Figure 6).
Figure 6. The cumulative number of radio-tagged steelhead (percent) entering the Bridge River in thespring of 1999 and the mean daily water temperature of the Bridge River taken 20 kmupstream of the Bridge/Fraser River confluence (downstream of the Bridge/Yalakomconfluence).
0102030405060708090
100
1-A
pr
8-A
pr
15-A
pr
22-A
pr
29-A
pr
6-M
ay
13-M
ay
Date (1999)
Tota
l ste
elhe
ad (%
)
0.00
2.00
4.00
6.00
8.00
10.00
Tem
pera
ture
(Cel
cius
)
Steelhead
Bridge R. temp.

16
On April 15th the mean daily water temperatures in the Bridge River rose above 7°C. Thiscoincides with the start of the peak immigration period. Temperatures in the Seton Riverremained between 6°C and 7°C for most of the spring immigration period.
In general, steelhead migrate slowly upstream to their spawning locations. Average dailyrates of movement were determined for the 13 Bridge River steelhead in which there wasconfidence in both the date ascent of the Bridge River began and the date spawningbegan. The average daily rates of movement were calculated from the total distancetravelled in either upstream or downstream directions prior to the start of the spawningresidency, divided by the total number of migration days. The average rate of upstreammovement by steelhead in the Bridge watershed in 1999 was 1.39 km/day (n = 13, SE =0.17). Upstream migration rates ranged from 0.48 to 2.78 km/day.
The first marked increase in discharge in Cayoosh Creek and the Yalakom River did notoccur until the last week of May in 1999. As a result, both the Yalakom and Cayooshspawning steelhead entered the spawning tributaries prior to the onset of freshet(Appendix 4).
3.2.5 Spawning Distributions
Analysis of the telemetry data concludes that 18 (fourteen females, four males) of the 28radio-tagged steelhead that held near the mouths of the Seton and Bridge Rivers in thespring of 1999 spawned in those watersheds. The spawning period and location weredefined by a relatively stationary period at or near the upstream extent of movement,followed by a downstream movement out of the system or death. Fifteen steelheadspawned in the Bridge watershed and three steelhead spawned in the Seton watershed(Figure 7, Appendix 6). The 15 Bridge watershed steelhead are believed to have spawnedin the following locations: one in the Yalakom River, seven in the Bridge River above theBridge/Yalakom confluence, and seven in the Bridge River downstream of theBridge/Yalakom confluence. All three Seton watershed steelhead spawned in theCayoosh Creek compensation channel (near the West Kootenay Power powerhouse site).The spawning locations and dates were determined for 12 radio-tagged steelhead trout(Table 3). There was some uncertainty as to the exact spawning locations or dates for sixradio-tagged fish (Table 4). For steelhead where there was uncertainty in the spawningresidency, the range of locations and/or dates is shown.
The remaining ten steelhead that were tracked near the Bridge/Fraser and Seton/Fraserconfluence's during the spring of 1999 did not spawn in those watersheds. The fixedtelemetry station at the Bridge/Fraser confluence recorded five steelhead that held nearthe mouth of the Bridge River for a period of time during the spawning period. Two ofthese steelhead were recorded moving upstream of the Chilcotin River in the Fraser, twowere recorded entering the Chilcotin River, and the other steelhead was last detected inthe Fraser River upstream of the Bridge/Fraser confluence. Two other fish held at theBridge/Fraser confluence throughout the spring (April 2nd – May 9th and April 2nd – June19th) and are believed to have spawned in or near the mouth of the Bridge River. The laststeelhead captured and radio-tagged at the Seton/Fraser confluence was detected for the

17
#
#
#
#
#
#
#
#
#
##
##
#
#
#
#
#
Fraser River
BridgeRiver
Yalakom River
Cayoosh Cr.
Seton Lake
Anderson Lake
Carpenter Lake
Seton River
BCHydroTailrace
Antoine Cr.
Michelmoon Cr.
Hell Cr.
Yankee Cr.
Camoo Cr.
Applespring Cr.
Moon Cr.
5 0 5 Kilometers
Fall tagged steelheadWinter/Spring tagged steelhead - Seton/FraserSpring tagged steelhead - Bridge/Yalakom
Legend
Figure 7. The spawning distribution of Bridge and Seton River steelhead in 1999. Circles representindividual spawning locations.

18
final time, on an April 30th flight, in the Fraser River downstream of Lillooet. Onesteelhead was detected on April 7th at the Seton/Cayoosh confluence and was not detectedin the Seton or Bridge Rivers again. The radio tagging location of one steelhead wasunknown, but it was detected only once at the Bridge/Yalakom confluence.
Table 3. The spawning locations and dates for Bridge and Seton steelhead in 1999.
Radio-tag Sex
SpawningLocation
(Stream km)Dates at Spawning
Location Description
1251 Female 28.4 – 28.9 May 26 – May 31 Bridge – 3.4-3.9 km u/s Br/Yal confl.1254 Female 25.2 May 4 – May 11 Bridge – 0.2 km u/s Br/Yal confl.1543 Female 34.5 May 26 – May 28 Bridge – 9.5 km u/s Br/Yal confl.1589 Female 34 May 16 – May 19 Yalakom – 9 km u/s Br/Yal confl.1880 Female 27.2 May 19 – May 28 Bridge – 2.2 km u/s Br/Yal confl.1892 Female 16.3 May 16 – May 18 Bridge – 0.7 km below Camoo Crk.1893 Female 23.6 May 29 – June 2 Bridge – 1.4 km d/s Br/Yal confl.1894 Female 5.0 May 13 – May 16 Cayoosh – 2 km u/s Cay/Set confl.1896 Female 20 April 12 – 14 Bridge – 5 km d/s Br/Yal confl.1897 Male 20.5 May 16 – May 18 Bridge – 4.5 km d/s Br/Yal confl.1899 Female 4.8 – 5 May 14 – May 20 Bridge – 4.8-5 km u/s Br/Frasr confl.2061 Female 4.7 May 25 – June 4 Cayoosh – compensation channel
Table 4. 1999 Spawning locations and times for Bridge and Seton steelhead in which there is uncertaintyin the location and/or time.
Radio-tag Sex
SpawningLocation
(Stream km)Dates at Spawning
Location Description
1274 Male 25 – 29.3 April 25 – June 11 Bridge – 0-4.3 km u/s Br/Yal confl.1592 Female 34.5 – 35 May 20 – May 21 Bridge – 9.5-10 km u/s Br/Yal confl.1895 Male 4.7 May 2 – June 11 Cayoosh – compensation channel1898 Male 14.5 – 20.5 May 14 - 29 Bridge – 14.5–20.5 km u/s Br/Frsr confl2059 Female 15.5 – 19.5 April 26 – May 2 Bridge – 15.5-19.5 u/s Br/Frasr confl2084 Female 33 – 34 May 9 – June 11 Bridge – 8-9 km u/s Br/Yal confl.
Spawning in the Bridge and Seton watersheds appears to have started as early as April12th and ended as late as June 4th. Most of the spawning activity in the Bridge watershed,based on the 10 Bridge steelhead for which both a defined spawning location and datewas determined, occurred during the last two weeks of May (mean = May 16th, SE =4.37). This coincides with a two week period in the Bridge River in which mean dailywater temperatures were 8°C or warmer (Figure 8).

19
Figure 8. The spawning locations of radio-tagged Bridge River steelhead in 1999 and the mean dailywater temperature of the Bridge River. The solid line represents the mean daily watertemperature of the Bridge River taken at 26.4 km (upstream of the Bridge/Yalakomconfluence) and the slashed line represents the mean daily water temperature of the BridgeRiver taken at 20 km (downstream of the Bridge/Yalakom confluence).
The average spawning residency in the Bridge and Seton watersheds in 1999, based onthe 12 steelhead in the study in which there was some certainty to the spawning locationand time, was 5.58 days (SE = 0.82). Spawning residencies ranged from 3 to 11 days.Visual observations of untagged fish between the Bridge/Yalakom River confluence andYankee Creek suggest a residency on individual redds of only one to two days. However,if steelhead are selecting two or three redds in close proximity, the average totalspawning residency is similar. The spawning activity in the Bridge River upstream of theBridge/Yalakom confluence may also be largely nocturnal due to the extremely low andclear water conditions.
3.2.6 Downstream Migration
At the completion of spawning, some steelhead began a rapid downstream migration outof their spawning tributaries, eventually returning to the ocean. Downstream migrationrates were calculated by dividing the downstream kilometers travelled in the Bridge andSeton watersheds by the number of travel days. The fixed station at the mouth of theBridge River recorded the departure of radio-tagged steelhead from the Bridge River intothe Fraser River. The average downstream migration rate in the Bridge watershed was10.66 km/day (SE = 1.44, n = 11). The furthest distance a Seton watershed radio-taggedsteelhead had to emigrate to reach the Fraser River was five kilometers.
0
5
10
15
20
25
30
35
40
1-A
pr
8-A
pr
15-A
pr
22-A
pr
29-A
pr
6-M
ay
13-M
ay
20-M
ay
27-M
ay
3-Ju
n
10-J
un
Date (1999)
Brid
ge R
iver
stre
am k
ilom
eter
s
0
2
4
6
8
10
12
14
Brid
ge R
iver
tem
pera
ture
(Cel
cius
)

20
Thirteen of the 18 radio-tagged steelhead (72%) appear to have survived spawning andemigrated out of the Bridge and Seton Rivers into the Fraser River. This is very similar tothe 71% of tracked steelhead that emigrated out of the Nicola watershed in 1999 (Webbet al. 2000). Only four male steelhead were tracked in the Bridge and Seton watersheds,but two (50%) of them did not enter the Fraser River and are presumed to have died inthe watersheds. Of the 14 female steelhead that were tracked in the Bridge and Setonwatersheds, three (21.4%) did not kelt into the Fraser River and are presumed to havedied in the watersheds. All four of the Bridge River steelhead that died within thewatershed did so in the Bridge River upstream of the Bridge/Yalakom confluence.
3.2.7 Escapement Estimation
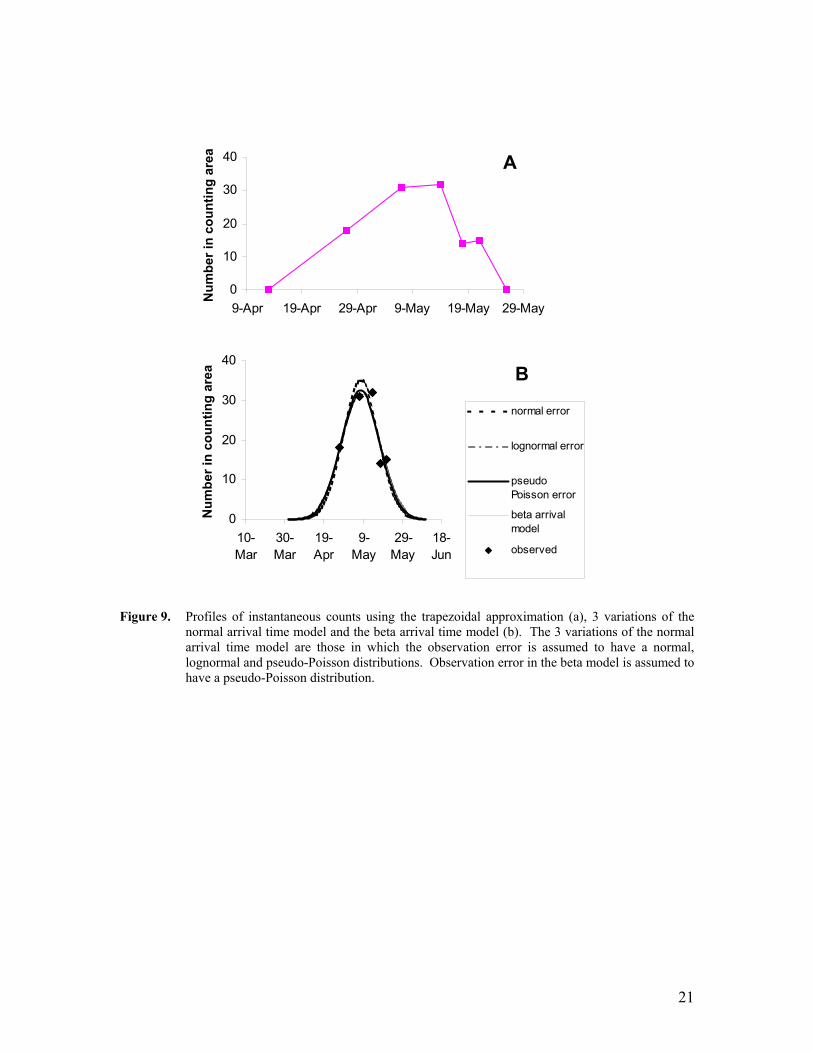
Five fish counts within the section of the Bridge River from the Bridge/Yalakomconfluence upstream to Yankee Creek were completed between April 27th and May 21,1999. The shape of the escapement curves (or trapezoid) was consistent with previousobservations of steelhead spawning timing in 1997 and as reported previously by Baxterand Roome (1996) and Hebden (1981). The fish count data also corroborated with thetiming and movement patterns of radio-tagged steelhead in the 1999 study. The fish countdata did not include zero or near zero counts on either extreme of the run timing whichintroduces uncertainty in the computed AUC by the trapezoid method. Points on eitherextreme were estimated by linear extrapolation in order to complete the trapezoid (Fig.9). In such cases, estimation of the run timing curve using an arrival time model ispreferred (Hilborn et al. 1999).
Maximum likelihood escapement estimates (MLE) for steelhead in the Bridge watershedranging from 369 to 420 spawners. These estimates were lower but similar to theestimate of 422 based on the trapezoidal method. The normal arrival model assumingpseudo-Poisson observation error was considered the best of the maximum likelihoodmethods by Hilborn et al. (1999). The MLE from this model was 369 spawners (Table5).
The field estimates of observer efficiency (v), survey life (Rt) and proportion of spawnersin the counting area (Rc/Rw) were based on few data. Observer efficiency was estimatedto be 0.40 (SE=0.13) based on 4 observations. Survey life was estimated to be 9.6 days(SE=1.2 days) based on 5 radio-tagged steelhead. The proportion of spawners in thecounting area was 7/15 (0.47) based on radio tag distribution (Table 6).
Uncertainty in the various MLE's were generally similar (Fig. 10). The lower 95%confidence limit ranged from 205 to 230 depending on the method used. The upper 95%confidence limit was more varied ranging from 530 to 700. Expressed as a percentage ofthe MLE, the lower 95% confidence limits ranged from out 42-49% of the MLE. Theupper 95% confidence limits were more varied ranging from 31-67% of the MLE.
21
Figure 9. Profiles of instantaneous counts using the trapezoidal approximation (a), 3 variations of thenormal arrival time model and the beta arrival time model (b). The 3 variations of the normalarrival time model are those in which the observation error is assumed to have a normal,lognormal and pseudo-Poisson distributions. Observation error in the beta model is assumed tohave a pseudo-Poisson distribution.
0
10
20
30
40
9-Apr 19-Apr 29-Apr 9-May 19-May 29-May
Num
ber i
n co
untin
g ar
ea A
0
10
20
30
40
10-Mar
30-Mar
19-Apr
9-May
29-May
18-Jun
Num
ber i
n co
untin
g ar
ea
normal error
lognormal error
pseudoPoisson error
beta arrivalmodel
observed
B

22
Figure 10. Chi-square probability graphs for total escapement using the normal arrival time model underthree observation error assumptions and the beta arrival time model. Confidence bounds canbe found by drawing a horizontal line at the desired probability level on the y-axis and findingthe two points that intersect the probability graph.
Table 5. Escapement estimates and confidence limits.
Method Escapementestimate
Lower 95%confidencelimit
Upper 95%confidencelimit
Trapezoidal 422 n/a n/aNormal entry and normally distributed error 420 230 700Normal entry and lognormally distributed error 377 220 550Normal entry and pseudo-poisson error 369 210 580Beta entry and pseudo-poisson error 406 205 530
Table 6. Parameter estimates based on direct field estimates and parameter search routines (MLEmethods).
Method Mean day ofarrival(alpha)
Standarddeviation onmean day ofarrival(beta)
Residencytime (Rt)
Observerefficiency(v)
Number ofradio tags incountingarea (Rc)givenRwa=15 andp=0.47.
Trapezoidal - - 9.6a 0.40a 7Normal entry and normally distributed error 49.7 8.4 9.6 0.40 7.0Normal entry and lognormally distributed error 49.7 9.5 9.6 0.43 7.3Normal entry and pseudo-poisson error 49.6 9.2 9.6 0.43 7.4Beta entry and pseudo-poisson error 4.7b 6.4b 9.6 0.43 6.5aDirect field estimatesbParameters of the beta distribution, not comparable to parameters of the normal entry models.
0
0.2
0.4
0.6
0.8
1
0 250 500 750 1000
Escapement
Chi
-squ
are
prob
abili
ty normal error
pseudo-poissonerrorbeta model
lognormal error

23
4 Discussion
4.1 Overwintering Distribution
On a large geographic scale, Bridge and Seton River steelhead congregate for the winterin the middle Fraser River, showing a general affinity for their spawning tributaries.However, within the middle Fraser River, the distribution of radio tags suggests thesesteelhead are quite dispersed. They don’t show an attraction to clear water confluencesand they aren’t particularly concentrated near the Seton River mouth where there is a mixof both Seton and Bridge River water. None of the 1996 or 1998 fall radio-taggedsteelhead were recorded overwintering at the Seton/Fraser River confluence.
Based on results from the winter and spring tagging at the Seton/Fraser River confluence,it appears a number of Chilcotin steelhead overwinter in the middle Fraser River. TheBridge River rapids, located just upstream of the Bridge/Fraser River confluence, mayhave been impassable for these fish at the time of upstream migration, forcing them tooverwinter near Lillooet until water levels and temperatures rose in the spring.
4.2 Upstream Movement Patterns
In the spring of 1997, frequent mobile tracking did not occur until after May 7th and fixedstations were not present at the mouth of the Bridge or Seton Rivers. Therefore, theimmigration date was missed for the majority of the radio-tagged steelhead. Six of the 15radio-tagged steelhead entered the Bridge or Seton Rivers during the second week ofMay. The other nine radio-tagged steelhead are believed to have entered the Bridge andSeton Rivers during the last two weeks of April.
In the spring of 1999, the majority of the radio-tagged steelhead entered the Bridge andSeton Rivers during the last two weeks of April. April 15th, 1999, was the date that theaverage daily water temperatures in the Bridge River rose above 7oC. This coincides withthe start of the peak immigration period. Average daily temperatures in the Seton Riverremained between 6°C and 7°C for most of the spring immigration period. Water flowdata for the Bridge River is not available from Water Survey Canada, therefore, noobservations can be made on a possible correlation between immigration and freshet.
The first major increase in water discharge in the Yalakom River and Cayoosh Creekoccurred around the middle of May in 1997. Cayoosh and Yalakom steelhead entered thespawning tributaries shortly after the initial increase in flows (Appendix 3). In the springof 1999, freshet did not begin in the Yalakom River or Cayoosh Creek until the finalweek of May. The Yalakom spawning steelhead entered the Yalakom River at the start ofMay and kelted as the water discharge began to increase. Two Cayoosh spawningsteelhead entered Cayoosh Creek before the major freshet event. The movement of thethird Cayoosh spawning steelhead into Cayoosh Creek coincides with the first majorincrease in water discharge (Appendix 4).

24
During both the 1997 and 1999 spawning migrations, mobile telemetry data shows thatradio-tagged steelhead held at the Bridge/Yalakom confluence before moving upstreamin the Bridge River. Steelhead may have hesitated before moving into the Bridge Riverupstream of the Bridge/Yalakom confluence due to the low, clear water conditions.Radio-tagged steelhead were not detected holding at the confluence's of larger spawningtributaries in the Nicola River telemetry study. Steelhead in the Nicola telemetry studyhowever were observed, holding near the confluence's of small tributaries until adequatewater levels were achieved during freshet (Webb et al. 2000).
4.3 Spawning Distribution
Of the 15 radio-tagged steelhead that were tracked during the 1997 Bridge and SetonRiver telemetry study, two (13%) spawned in the Seton watershed and 13 (87%)steelhead spawned in the Bridge watershed. Analysis of the tracking data suggests oneSeton watershed steelhead spawned in the Seton River mainstem and the other steelheadspawned in Cayoosh Creek. The tracking data shows that some Bridge watershedsteelhead spawned in the lower reaches of the Bridge River, but the majority of the 13Bridge watershed steelhead spawned within five kilometers of the Bridge/Yalakomconfluence.
In the 1999 telemetry study of the Bridge and Seton watersheds, three (17%) of the 18radio-tagged steelhead spawned in the Seton watershed and 15 (83%) radio-taggedsteelhead spawned in the Bridge watershed. All three Seton watershed steelhead spawnedin Cayoosh Creek: either in or upstream of the compensation channel. Only one out of 15radio-tagged Bridge watershed steelhead spawned in the Yalakom River. Seven steelheadspawned in the Bridge mainstem above the Yalakom confluence and the remaining sevensteelhead spawned below the Yalakom River. Spawning activity was not as clumpedaround the Bridge/Yalakom confluence in 1999 as in 1997, however the lower reaches ofthe Bridge River were still not well utilized.
There appears to be a relationship between capture location, timing of entrance into anatal stream and spawning location. Both of the 1996 fall tagged steelhead that spawnedin the Bridge River did so above the Bridge/Yalakom River confluence (Figure 3). Six ofthe seven 1998 fall tagged steelhead that spawned in the Bridge watershed did so abovethe Bridge/Yalakom confluence (Figure 7). During the 1997 spawning season, almost allof the Bridge watershed steelhead that were captured at the Seton/Fraser confluence inMarch and April spawned above the Bridge/Yalakom confluence. All of the steelheadthat were captured in February 1997 at the Seton/Fraser confluence or theThompson/Fraser confluence spawned in the Bridge River below the Bridge/Yalakomconfluence. During the 1999 spawning season, spring radio-tagged steelhead that werecaptured at the Seton/Fraser River confluence spawned only below the Bridge/Yalakomconfluence in the Bridge River (Figure 7).
All of the radio-tagged steelhead in the 1996 BC Hydro telemetry study were tagged atthe Seton/Fraser confluence in March and April. The telemetry data suggested that radio-tagged Bridge River steelhead spawned both above and below the Bridge/Yalakom Riverconfluence (Baxter and Roome, unpublished data).

25
The reason for the apparent relationship between capture and spawning location in the1996/97 and 1998/99 Bridge River studies is unknown. It has not been observed in otherinterior Fraser steelhead rivers. One possible explanation why fall radio-tagged fishappear to spawn further up in the Bridge River than winter tagged fish may be due to acorrelation between angling susceptibility and reduced fitness from angling recaptures.
During the 1996/97 and 1998/99 studies, fall tagged fish overwintered in the FraserRiver, but none were recorded overwintering near the Seton/Fraser confluence (Figures 2and 6). The majority of the winter/spring tagged steelhead were caught at the mouth ofthe Seton River from February through to April, and there is a high probability theyoverwintered there. Unlike most streams in Region 3, the Fraser River upstream ofLytton is exempt from the January 1st to June 30th spring angling closure. Steelhead thatoverwintered at the Seton/Fraser confluence would have been susceptible to anglingrecaptures throughout the winter, possibly causing a reduction in fitness that resulted inshorter upstream migrations in the Bridge River.
In early March of 1999, when a lot of the spring radio tagging took place, some of the fallradio-tagged steelhead were detected at the Seton/Fraser confluence. In the early spring,steelhead may hold at the mouth of the Seton River for a few days as they migrateupstream in the Fraser River towards spawning tributary streams. Steelhead captured atthe Seton/Fraser River confluence in March and April may not have overwintered at themouth of the Seton River, but were migrating up the Fraser River when they were radio-tagged. This may explain why steelhead captured in March and April 1997 at theSeton/Fraser confluence spawned further upstream in the Bridge River than steelheadcaptured in February. It is also possible that a small proportion of the Bridge run willhold in Seton water for the winter and, by chance, none of the fall tagged steelhead haveoverwintered there.
4.4 Kelts
In 1997, only eight (50%) of the 16 steelhead that were tracked in the Bridge and Setonwatersheds appear to have survived spawning and emigrated out of the tributary systems.The spawning survival rate was higher in 1999, with thirteen (72%) of the 18 steelheadmigrating out of the Bridge and Seton watersheds into the Fraser River. The highernumber of mortalities within the spawning tributaries in 1997 can be attributed to thehigher proportion of tagged males in the 1996/97 study over the 1998/99 study. Spawningappears to be more arduous on male steelhead than female steelhead. Telemetry datashows the average male steelhead spends more time in the spawning tributaries thanfemale steelhead and suggests many male fish spawned in more than one location.
The water in the Bridge River above the Yalakom River experiences unnaturally lowflows as a result of Terzhagi dam and is very clear and low. These conditions appear toadd stress to spawning steelhead or make them much more vulnerable to predators, as themortality rate in this section of stream is much higher than average for radio-tagged

26
steelhead. Steelhead were considered mortalities or tag regurgitations if they were trackedmoving upstream or remained stationary for a prolonged period of time, and weren’tdetected kelting. In 1997, telemetry data shows three (60%) of the five radio-taggedsteelhead that are believed to have spawned in the Bridge River above the Yalakom Riverwere mortalities. The 1999 telemetry data shows four (57%) of the seven radio-taggedsteelhead that spawned in the Bridge River above the Yalakom River were mortalities.
4.5 Escapement Estimation
The escapement estimates for the 1999 spawning population are the first appraisals ofabundance based entirely based on quantitative estimation techniques and empirical data.Previously, Hebden (1981) reported that the Bridge population did not exceed 200spawners in the spring of 1980 and that most of the spawning was concentrated in theBridge River upstream of the Yalakom confluence. Our findings in 1997 and 1999indicate the spawning distributions are not as concentrated to the upper reach. Bothstudies suggest that the Bridge population is characteristically in the order of a fewhundred spawners.
Precision estimates, expressed as 95% confidence limits, were generally in the order of40-50% of the MLE's. Considering how limited that data were, the results seemencouraging. Increased sample sizes or incorporation of prior likelihoods by repeatingstudies on fish distribution, observer efficiency and survey life could reduce uncertaintyin future assessments if management objectives warrant more precise estimation. In thisassessment, we can say with confidence that the spawning population likely exceeded200 spawners. Such an appraisal is useful for managing to conservation and biodiversityobjectives.

27
References
Baxter, J. and R. Roome. 1997. Reproductive biology of steelhead (Oncorhynchusmykiss) in the Bridge and Seton Rivers, 1997. Unpubl. report prepared for BCHydro, Kamloops, BC. 40 p.
Everest, F.H. 1973. Ecology and management of summer steelhead in the Rogue River.Oregon State Game Commission, Fish. Res. Rep. No.7. 48 pp.
Hagen, J. 2000. Personal communications. Fisheries Biologist, British ColumbiaConservation Foundation, Kamloops.
Hebden, B. 1981. West Fraser Steelhead Program. BC Ministry of Environment, Fish &Wildlife Branch. Unpublished MS. 27 pp.
Hebden, B. 1999. Personal communication. Environmental Biologist, Power SupplyOperations, BC Hydro, Kamloops.
Higgins, P. 1999. Fisheries Biologist, Strategic Operations, BC Hydro, Burnaby.
Hilborn, R, B.G. Bue, and S. Sharr. 1999. Estimating spawning escapements fromperiodic counts: a comparison of methods. Can. J. Fish. Aquat. Sci. 56:888-896.
Hill, R.A. 1997. Optimising aerial count frequency for the Area-under-the-Curve methodof estimating escapement. North Am. J. Fish. Mgmt. 17:461-466.
McGregor, I. 1999. Personal communication. Fisheries Branch Section Head, Ministry ofEnvironment, Lands and Parks, Kamloops.
Moore, D.C. and W.R. Olmsted. 1985. An ecological study of steelhead trout (Salmogairdneri) reproduction in Deadman River, BC, 1984. Prepared for Dept. Fish.Oceans and Ministry of Environment, Vancouver, by W.R. Olmsted andAssociates, Inc. 43pp. + append.
Renn, J.R., R.G. Bison, J. Hagen and T.C. Nelson. 2001. Migration characteristics andstock composition of interior Fraser steelhead as determined by radio telemetry,1996-1999. Rept. Prep. for BC Ministry of Environment and Lands, Kamloops.
Webb, S.L., R.G. Bison and J.R. Renn. 2000. The Reproductive Biology of Steelhead(Oncorhynchus mykiss) in the Nicola River as Determined by Radio Telemetry.Ministry of Environment and Lands, Kamloops, BC.

28
Appendices

Appendix I. Capture location, biological information and natal stream for 1997 Bridge and Seton watershed radio-tagged steelhead.
Radio-tag Capture Location Method Date Sex Length (cm) Girth (cm) Spawning Stream Comments204 Thompson/Fraser confl. angling 06-Feb-97 male 995 480 Bridge209 Seton/Fraser confl. angling 04-Mar-97 female 830 405 Bridge214 Seton/Fraser confl. angling 16-Apr-97 female 650 325 Bridge217 Seton/Fraser confl. angling 16-Apr-97 male 810 375 Bridge408 Seton/Fraser confl. angling 04-Mar-97 female 880 420 Bridge430 Seton/Fraser confl. angling 04-Mar-97 male 875 415 Bridge706 Chilliwack - Henderson's angling 16-Oct-96 female 710 372 Bridge831 Chilliwack - Bowman's Bar angling 30-Sep-96 female 805 390 Bridge1317 Seton/Fraser confluence angling 28-Feb-97 female 860 420 Bridge1319 Seton/Fraser confluence angling 27-Feb-97 female 870 420 Bridge1380 Seton power outflow angling 05-Mar-97 male 870 450 Bridge251 Seton/Fraser confl. angling 22-Apr-97 male 660 315 Yalakom1316 Seton/Fraser confluence angling 04-Mar-97 male 680 315 Yalakom719 Thompson/Fraser confl. angling 19-Feb-97 male 920 440 Cayoosh1331 Seton/Fraser confluence angling 19-Feb-97 female 670 327 Seton203 Seton/Fraser confluence angling 27-Feb-97 female Fraser u/s Nahatlatch206 Bridge - 300 m u/s Fraser angling 02-May-97 female 785 380 Fraser u/s Nahatlatch Possibly spawned Seton/Fraser confl.210 Seton/Fraser confluence angling 22-Apr-97 Fraser u/s Nahatlatch Recapture. 1st Capture 16-Apr-97230 Seton/Fraser confl. angling 04-Mar-97 male 880 400 Fraser u/s Nahatlatch Possibly spawned Bridge/Fraser confl.480 Seton/Fraser confluence angling 04-Mar-97 male Fraser u/s Nahatlatch720 Seton/Fraser confluence angling 17-Apr-97 Fraser u/s Nahatlatch Possibly spawned Bridge/Fraser confl.756 Seton/Fraser confluence angling 17-Apr-97 Fraser u/s Nahatlatch1318 Seton/Fraser confluence angling 05-Mar-97 Fraser u/s Nahatlatch1328 Seton/Fraser confluence angling 28-Feb-97 female 780 360 Fraser u/s Nahatlatch Possibly spawned Bridge/Fraser confl.401 Thompson/Fraser confl. angling 13-Feb-97 male 780 370 N/A Disappeared after tagging405 Bridge River angling 05-May-97 unknown N/A Disappeared after tagging431 Thompson/Fraser confl. angling 05-Feb-97 male 995 440 N/A Disappeared after tagging717 Seton/Fraser confluence angling 17-Apr-97 N/A Disappeared after tagging1058 Bridge - d/s Br/Yal confl. angling 08-May-97 female 820 420 N/A Reacted badly to tagging1308 Seton/Fraser confluence angling 22-Apr-97 N/A Disappeared after tagging1379 Seton/Fraser confluence angling 22-Apr-97 male 895 410 N/A Regurgitated tag or died

Appendix II. Capture location, biological information and natal stream for 1999 radio tagged steelhead.
Radio-tag Capture Location Method Date Sex Length (cm) Girth (cm) Spawning Stream Comments1251 Bridge/Yalakom confl. angling 21-May-99 female 660 310 Bridge1254 Yale Fishwheel fishwheel 10-Oct-98 female 766 370 Bridge1274 Agassiz Bridge angling 9-Oct-98 male 870 440 Bridge1543 Annacis Island tangle net 23-Oct-98 female 780 410 Bridge1592 Agassiz Bridge angling 23-Oct-98 female 741 356 Bridge1880 Bridge/Yalakom confl. angling 6-May-99 female 820 385 Bridge1892 Seton/Fraser confl. angling 12-Mar-99 female 780 420 Bridge1893 Seton/Fraser confl. angling 25-Mar-99 female 760 375 Bridge1896 Seton/Fraser confl. angling 7-Mar-99 female 680 360 Bridge1897 Seton/Fraser confl. angling 7-Mar-99 male 760 405 Bridge1898 Seton/Fraser confl. angling 7-Mar-99 male 820 410 Bridge1899 Seton/Fraser confl. angling 28-Mar-99 female 765 380 Bridge2059 Yale Fishwheel fishwheel 14-Oct-98 female 863 410 Bridge2084 Chilliwack angling 16-Oct-98 female 730 395 Bridge1589 Agassiz Bridge angling 5-Nov-98 female 660 320 Yalakom1894 Seton/Fraser confl. angling 21-Mar-99 female 815 440 Cayoosh1895 Seton/Fraser confl. angling 22-Mar-99 male 935 445 Cayoosh2061 Yale Fishwheel fishwheel 16-Oct-98 female 773 385 Cayoosh18100 Seton/Fraser confl. angling 30-Mar-99 female 810 380 N/A Disappeared after tagging1886 unknown N/A Disappeared after tagging.1253 Yale Fishwheel fishwheel 10-Oct-98 male 897 444 Fraser - u/s Bridge1242 Yale Fishwheel fishwheel 15-Oct-98 male 893 416 Fraser – Bridge area Possibly spawned Bridge/Fraser confl.1890 Seton/Fraser confl. angling 5-Mar-99 female 710 330 Fraser – Bridge area Possibly spawned Bridge/Fraser confl.1574 Agassiz Bridge angling 31-Oct-98 male 870 450 Chilcotin1871 Seton/Fraser confl. angling 23-Feb-99 male 830 410 Chilcotin1891 Seton/Fraser confl. angling 6-Mar-99 female 750 380 Fraser u/s Chilcotin2057 Yale Fishwheel fishwheel 15-Oct-98 male 808 401 Fraser u/s Chilcotin18101 Seton/Fraser confl. angling 17-Apr-99 male 860 430 Fraser d/s Lillooet

Appendix III. Stream flow vs. steelhead movement for 1997 spawning radio-tagged steelhead.
Radio Tag: 251Sex: Male
0510152025303540
9-Apr
16-Apr
23-Apr
30-Apr
7-May
14-May
21-May
28-May
4-Jun
11-Jun
18-Jun
Date (1997)
Stee
lhea
d m
ovem
ent
(stre
am k
ilom
eter
s)
0
5
10
15
20
25
30
Yala
kom
Riv
er D
isch
arge
(m
3/s)
Bridge River Yalakom RiverBridgeRiver Radio Tag: 1316
Sex: Male
0
510
15
20
2530
35
40
9-Apr
16-Apr
23-Apr
30-Apr
7-May
14-May
21-May
28-May
4-Jun
11-Jun
18-Jun
Date (1997)
Stee
lhea
d m
ovem
ent
(stre
am k
ilom
eter
s)
0
5
10
15
20
25
30
Yala
kom
Riv
er
Disc
harg
e (m
3/s)
Bridge RiverYalakom River
Bridge River
Radio Tag: 719Sex: Male
0
2
4
6
8
10
9-Apr
16-Apr
23-Apr
30-Apr
7-May
14-May
21-May
28-May
4-Jun
11-Jun
18-Jun
Date (1997)
Stee
lhea
d m
ovem
ent
(stre
am k
ilom
eter
s)
0
20
40
60
80
100
120
Cayo
osh
Cree
k Di
scha
rge
(m3/
s)
Seton River
Cayoosh Creek Seton River

Appendix IV. Stream flow vs. steelhead movement for 1999 spawning radio-tagged steelhead.
Radio Tag: 2061Sex: Female
0
2
4
6
8
10
2-Apr
9-Apr
16-Apr
23-Apr
30-Apr
7-May
14-May
21-May
28-May
4-Jun
11-Jun
Date (1999)
Stee
lhea
d m
ovem
ent
(stre
am k
ilom
eter
s)
0
20
40
60
80
100
120
Cayo
osh
Cree
k Di
scha
rge
(m3/
s)Cayoosh Creek
Bridge RiverBridgeRiver
Radio Tag: 1894Sex: Female
0
2
4
6
8
10
2-Apr
9-Apr
16-Apr
23-Apr
30-Apr
7-May
14-May
21-May
28-May
4-Jun
11-Jun
Date (1999)
Stee
lhea
d m
ovem
ent
(stre
am k
ilom
eter
s)
0
20
40
60
80
100
120
Cay
oosh
Cre
ek
Dis
char
ge (m
3/s)
CayooshCreek
Bridge River Bridge River
Radio Tag: 1589Sex: Female
0
5
10
15
20
25
30
35
40
2-Apr
9-Apr
16-Apr
23-Apr
30-Apr
7-May
14-May
21-May
28-May
4-Jun
11-Jun
Date (1999)
Stee
lhea
d m
ovem
ent
(stre
am k
ilom
eter
s)
0
5
10
15
20
25
30
Yala
kom
Riv
er
Disc
harg
e (m
3/s)
Yalakom River
Bridge River Bridge River
Radio Tag: 1895Sex: Male
0
2
4
6
8
10
2-Apr
9-Apr
16-Apr
23-Apr
30-Apr
7-May
14-May
21-May
28-May
4-Jun
11-Jun
Date (1999)
Stee
lhea
d m
ovem
ent
(stre
am k
ilom
eter
s)
0
20
40
60
80
100
120
Cayo
osh
Cree
k Di
scha
rge
(m3/
s)
Cayoosh Creek
Seton River

Appendix V. Movement graphs of 1997 Bridge and Seton River radio-tagged steelhead
Radio-Tag: 204Sex: Male
0510152025303540
9-Apr
16-Apr
23-Apr
30-Apr
7-May
14-May
21-May
28-May
4-Jun
11-Jun
18-Jun
Date (1997)
Brid
ge R
iver
St
ream
kilo
met
ers
Radio-Tag: 209Sex: Female
0510152025303540
9-Apr
16-Apr
23-Apr
30-Apr
7-May
14-May
21-May
28-May
4-Jun
11-Jun
18-Jun
Date (1997)
Brid
ge R
iver
St
ream
kilo
met
ers
Radio-Tag: 214Sex: Female
0510152025303540
9-Apr
16-Apr
23-Apr
30-Apr
7-May
14-May
21-May
28-May
4-Jun
11-Jun
18-Jun
Date (1997)
Brid
ge R
iver
Stre
am k
ilom
eter
s
Radio-Tag: 217Sex: Male
0510152025303540
9-Apr
16-Apr
23-Apr
30-Apr
7-May
14-May
21-May
28-May
4-Jun
11-Jun
18-Jun
Date (1997)
Brid
ge R
iver
St
ream
kilo
met
ers

Appendix V. Movement graphs of 1997 Bridge and Seton River radio-tagged steelhead
Radio-Tag: 408Sex: Female
0510152025303540
9-Apr
16-Apr
23-Apr
30-Apr
7-May
14-May
21-May
28-May
4-Jun
11-Jun
18-Jun
Date (1997)
Brid
ge R
iver
St
ream
kilo
met
ers
Radio-Tag: 251Sex: Male
0510152025303540
9-Apr
16-Apr
23-Apr
30-Apr
7-May
14-May
21-May
28-May
4-Jun
11-Jun
18-Jun
Date (1997)
Brid
ge R
iver
St
ream
kilo
met
ers Yalakom River
Radio-Tag: 430Sex: Male
0510152025303540
9-Apr
16-Apr
23-Apr
30-Apr
7-May
14-May
21-May
28-May
4-Jun
11-Jun
18-Jun
Date (1997)
Brid
ge R
iver
St
ream
kilo
met
ers
Radio-Tag: 706Sex: Female
0510152025303540
9-Apr
16-Apr
23-Apr
30-Apr
7-May
14-May
21-May
28-May
4-Jun
11-Jun
18-Jun
Date (1997)
Brid
ge R
iver
St
ream
kilo
met
ers

Appendix V. Movement graphs of 1997 Bridge and Seton River radio-tagged steelhead
Radio-Tag: 831Sex: Female
0510152025303540
9-Apr
16-Apr
23-Apr
30-Apr
7-May
14-May
21-May
28-May
4-Jun
11-Jun
18-Jun
Date (1997)
Brid
ge R
iver
St
ream
kilo
met
ers
Radio-Tag: 1316Sex: Male
0510152025303540
9-Apr
16-Apr
23-Apr
30-Apr
7-May
14-May
21-May
28-May
4-Jun
11-Jun
18-Jun
Date (1997)
Brid
ge R
iver
St
ream
kilo
met
ers Yalakom River
Radio-Tag: 1317Sex: Female
0510152025303540
9-Apr
16-Apr
23-Apr
30-Apr
7-May
14-May
21-May
28-May
4-Jun
11-Jun
18-Jun
Date (1997)
Brid
ge R
iver
St
ream
kilo
met
ers
Radio-Tag: 1319Sex: Female
0510152025303540
9-Apr
16-Apr
23-Apr
30-Apr
7-May
14-May
21-May
28-May
4-Jun
11-Jun
18-Jun
Date (1997)
Brid
ge R
iver
St
ream
kilo
met
ers

Appendix V. Movement graphs of 1997 Bridge and Seton River radio-tagged steelhead
The upstream kilometers for steelhead 719 and 1331 are from the mouth of the Seton River. The upstream kilometers for all other steelhead are from the mouthof the Bridge River. Steelhead 1058 appears to have reacted badly to tagging.
Radio-Tag: 1380Sex: Male
0510152025303540
9-Apr
16-Apr
23-Apr
30-Apr
7-May
14-May
21-May
28-May
4-Jun
11-Jun
18-Jun
Date (1997)
Brid
ge R
iver
St
ream
kilo
met
ers
Radio-Tag: 1058Sex: Female
0510152025303540
9-Apr
16-Apr
23-Apr
30-Apr
7-May
14-May
21-May
28-May
4-Jun
11-Jun
18-Jun
Date (1997)
Brid
ge R
iver
St
ream
kilo
met
ers
Radio-Tag: 719Sex: Male
0
2
4
6
8
10
9-Apr
16-Apr
23-Apr
30-Apr
7-May
14-May
21-May
28-May
4-Jun
11-Jun
18-Jun
Date (1997)
Set
on R
iver
St
ream
kilo
met
ers
Cayoosh Creek
Radio-Tag: 1331Sex: Female
0
2
4
6
8
10
9-Apr
16-Apr
23-Apr
30-Apr
7-May
14-May
21-May
28-May
4-Jun
11-Jun
18-Jun
Date (1997)
Seto
n Ri
ver
Stre
am k
ilom
eter
s

Appendix VI. Movement graphs of 1999 Bridge and Seton River radio-tagged steelhead
Radio-Tag: 1251Sex: Female
0510152025303540
2-Apr
9-Apr
16-Apr
23-Apr
30-Apr
7-May
14-May
21-May
28-May
4-Jun
11-Jun
Date (1999)
Brid
ge R
iver
St
ream
kilo
met
ers
Radio-Tag: 1254Sex: Female
0510152025303540
2-Apr
9-Apr
16-Apr
23-Apr
30-Apr
7-May
14-May
21-May
28-May
4-Jun
11-Jun
Date (1999)
Brid
ge R
iver
St
ream
kilo
met
ers
Radio-Tag: 1274Sex: Male
0510152025303540
2-Apr
9-Apr
16-Apr
23-Apr
30-Apr
7-May
14-May
21-May
28-May
4-Jun
11-Jun
Date (1999)
Brid
ge R
iver
St
ream
kilo
met
ers
Radio-Tag: 1543Sex: Female
0510152025303540
2-Apr
9-Apr
16-Apr
23-Apr
30-Apr
7-May
14-May
21-May
28-May
4-Jun
11-Jun
Date (1999)
Brid
ge R
iver
St
ream
kilo
met
ers

Appendix VI. Movement graphs of 1999 Bridge and Seton River radio-tagged steelhead
Radio-Tag: 1589Sex: Female
0510152025303540
2-Apr
9-Apr
16-Apr
23-Apr
30-Apr
7-May
14-May
21-May
28-May
4-Jun
11-Jun
Date (1999)
Brid
ge R
iver
St
ream
kilo
met
ers
Yalakom River
Radio-Tag: 1592Sex: Female
0510152025303540
2-Apr
9-Apr
16-Apr
23-Apr
30-Apr
7-May
14-May
21-May
28-May
4-Jun
11-Jun
Date (1999)
Brid
ge R
iver
St
ream
kilo
met
ers
Radio-Tag: 1880Sex: Female
0510152025303540
2-Apr
9-Apr
16-Apr
23-Apr
30-Apr
7-May
14-May
21-May
28-May
4-Jun
11-Jun
Date (1999)
Brid
ge R
iver
St
ream
kilo
met
ers
Radio-Tag: 1892Sex: Female
0510152025303540
2-Apr
9-Apr
16-Apr
23-Apr
30-Apr
7-May
14-May
21-May
28-May
4-Jun
11-Jun
Date (1999)
Brid
ge R
iver
St
ream
kilo
met
ers

Appendix VI. Movement graphs of 1999 Bridge and Seton River radio-tagged steelhead
Radio-Tag: 1893Sex: Female
0510152025303540
2-Apr
9-Apr
16-Apr
23-Apr
30-Apr
7-May
14-May
21-May
28-May
4-Jun
11-Jun
Date (1999)
Brid
ge R
iver
St
ream
kilo
met
ers
Radio-Tag: 1896Sex: Female
0510152025303540
2-Apr
9-Apr
16-Apr
23-Apr
30-Apr
7-May
14-May
21-May
28-May
4-Jun
11-Jun
Date (1999)
Brid
ge R
iver
St
ream
kilo
met
ers
Radio-Tag: 1897Sex: Male
0510152025303540
2-Apr
9-Apr
16-Apr
23-Apr
30-Apr
7-May
14-May
21-May
28-May
4-Jun
11-Jun
Date (1999)
Brid
ge R
iver
St
ream
kilo
met
ers
Radio-Tag: 1898Sex: Male
0510152025303540
2-Apr
9-Apr
16-Apr
23-Apr
30-Apr
7-May
14-May
21-May
28-May
4-Jun
11-Jun
Date (1999)
Brid
ge R
iver
St
ream
kilo
met
ers

Appendix VI. Movement graphs of 1999 Bridge and Seton River radio-tagged steelhead
Radio-Tag: 1899Sex: Female
0510152025303540
2-Apr
9-Apr
16-Apr
23-Apr
30-Apr
7-May
14-May
21-May
28-May
4-Jun
11-Jun
Date (1999)
Brid
ge R
iver
St
ream
kilo
met
ers
Radio-Tag: 2059Sex: Female
0510152025303540
2-Apr
9-Apr
16-Apr
23-Apr
30-Apr
7-May
14-May
21-May
28-May
4-Jun
11-Jun
Date (1999)
Brid
ge R
iver
St
ream
kilo
met
ers
Radio-Tag: 2084Sex: Female
0510152025303540
2-Apr
9-Apr
16-Apr
23-Apr
30-Apr
7-May
14-May
21-May
28-May
4-Jun
11-Jun
Date (1999)
Brid
ge R
iver
St
ream
kilo
met
ers
Radio-Tag: 1894Sex: Female
0
2
4
6
8
10
2-Apr
9-Apr
16-Apr
23-Apr
30-Apr
7-May
14-May
21-May
28-May
4-Jun
11-Jun
Date (1999)
Seto
n Ri
ver
Stre
am k
ilom
eter
s
CayooshCreek

Appendix VI. Movement graphs of 1999 Bridge and Seton River radio-tagged steelhead
The upstream kilometers for steelhead 1894, 1895, and 2061 are from the mouth of the Seton River. The upstream kilometers for all other steelhead are from themouth of the Bridge River.
Radio-Tag: 1895Sex: Male
0
2
4
6
8
10
2-Apr
9-Apr
16-Apr
23-Apr
30-Apr
7-May
14-May
21-May
28-May
4-Jun
11-Jun
Date (1999)
Seto
n Ri
ver
Stre
am k
ilom
eter
s
Cayoosh Creek
Radio-Tag: 2061Sex: Female
0
2
4
6
8
10
2-Apr
9-Apr
16-Apr
23-Apr
30-Apr
7-May
14-May
21-May
28-May
4-Jun
11-Jun
Date (1999)
Seto
n Ri
ver
Stre
am k
ilom
eter
s
Cayoosh Creek

Appendix VII. Escapment Estimation Data
Appendix VII(i). Periodic count data.Date Day Number of spawners
observed27-Apr-99 44 187-May-99 54 3114-May-99 61 3218-May-99 65 1421-May-99 68 15
Appendix VII(ii). Survey life data.n Days1 122 123 64 85 10
Appendix VII(iii). Observer efficiency data (v).Radio tags present Radio tags
observedv
2 2 15 2 0.42 0 03 1 0.333333333