the republic of sudan · 2020-01-19 · enhancing implementation of national forest programme...
TRANSCRIPT
1
The Republic of Sudan
Forest National Corporation (FNC)
Forest Reference Level (FRL)
Submission to the UNFCCC
January 2020
2
ACKNOWLEDGEMENTS
The Forest Reference Level presented in this document has been developed by the Ministry of
Agriculture, Forests National Corporation (FNC), through partnership between the FNC (REDD+
PMU) and FAO. The Financial support was provided by the Forest Carbon Partnership Facility
(a trust fund of the World Bank), while technical support was provided by the Food and
Agriculture Organization of the United Nations. Furthermore, Considerable technical contribution
provided by the Remote Sensing and Seismology Authority (RSA) and National FERL technical
team (Annex 5).
The Government of the Sudan acknowledges the technical support provided by FAO and the
financial support provided by the World Bank for the preparation of this first subnational Forest
Reference Emission Level (FREL) to be submitted to the UNFCCC.
We acknowledge also the technical contributions from the RSSA, FNC, HECNER, national
experts from Academic, Research and other related institutions
3
ACRONYMS/ABBREVIATIONS
AD Activity Data
A/R Afforestation and reforestation
AGB Above-ground biomass
BGB Below-ground biomass
BUR Biennial Update Report
CO2e Carbon Dioxide equivalent
FAO Food and Agriculture Organization of United Nation
FNC Forests National Corporation
FREL Forest Reference Emission Level
FRL Forest Reference Level
GDP Gross domestic product
GHG Green House Gas
GLCN Global land cover network
ha Hectare
HECNER Higher Council for Environment and Natural Resources
INC Initial National Communication
IPCC Intergovernmental Panel on Climate Change
LUCF Land use change and forestry
LULUCF Land use land use change and forestry
NDCs National determined contribution
NFI National Forest Inventory
NFMA National Monitoring and Assessment
NWFP Non woody forest products
4
OBIA Object base image analysis
REDD+
RSSA
Reducing Emissions from Deforestation and forest Degradation; and the role of conservation, sustainable management of forests, and
enhancement of forest carbon stocks
Remote Sensing and Seismology Authority
SLC Scan Lune Corrector
SNC Second National Communication
SU Sampling Unit
t.C Tonnes of Carbon
TNC Third National Communication
UNFCCC United Nations Framework Convention on Climate Change

5
Contents
ACKNOWLEDGEMENTS .......................................................................................................................... 2
ACRONYMS/ABBREVIATIONS ............................................................................................................... 3
LIST OF TABLES ........................................................................................................................................ 7
LIST OF FIGURES ...................................................................................................................................... 8
SUMMARY .................................................................................................................................................. 9
1. INTRODUCTION .............................................................................................................................. 11
1. SCALE ................................................................................................................................................ 13
2. SCOPE: ACTIVITIES, POOLS AND GASES INCLUDED ............................................................. 16
2.1. REDD+ activities in the FREL/FRL ........................................................................................... 16
2.2. Carbon pools in the FRL ............................................................................................................. 19
2.3. Gases in the FRL ......................................................................................................................... 20
3. FOREST DEFINITION / DEFINITIONS USED ............................................................................... 20
4. CONSISTENCY WITH GHG INVENTORY REPORTING ............................................................ 20
5. INFORMATION USED FOR FREL CONSTRUCTION .................................................................. 21
5.1. Activity Data for Deforestation: ................................................................................................. 21
5.1.1. Methodology and data used ................................................................................................ 21
5.1.2. Development of land cover maps of 2006, 2010, 2014 and 2018 ........................................... 22
5.1.2.1. Image acquisition ............................................................................................................ 22
5.1.2.2. Image segmentation and land cover interpretation ......................................................... 22
5.1.2.3. Preparation of forest maps .............................................................................................. 23
5.1.3. Results forest area change detection ................................................................................... 24
5.2. Activity Data for Enhancement of Forest Carbon Stocks ........................................................... 29
5.3. Emission factors for deforestation .............................................................................................. 32
5.3.1. Description of NFI .............................................................................................................. 32
5.3.2. Stratification ........................................................................................................................ 33
5.3.4. Analysis of collected NFI data ............................................................................................ 36
5.3.5. Results and proposed emission factors ............................................................................... 38
5.4. Removal factor for enhancement of forest carbon stocks ........................................................... 39

6
6. DETAILS ON NATIONAL CIRCUMSTANCES ............................................................................. 40
7. PROPOSED FRL ................................................................................................................................ 42
8. HISTORICAL PERIOD CONSIDERED ........................................................................................... 43
9. ADJUSTMENT FOR NATIONAL CIRCUMSTANCES .................................................................. 44
10. UPDATING FREQUENCY ........................................................................................................... 44
11. FUTURE IMPROVEMENTS......................................................................................................... 45
11.1. Improvement of Activity Data ................................................................................................ 45
11.2. Improvement of Emission Factors .......................................................................................... 45
11.3. Inclusion of other REDD+ Activities ...................................................................................... 46
11.4. Inclusion of forest Fires .......................................................................................................... 46
12. REFERENCES ............................................................................................................................... 48
13. ANNEXES: ..................................................................................................................................... 50

7
LIST OF TABLES
TABLE 1 SUDAN’S FREL/FRL COMPLIANCE WITH THE RELEVANT UNFCCC DECISIONS 9
TABLE 2 :GHGS EMISSIONS/REMOVAL ESTIMATES OF THE LUCF IN SUDAN FOR YEARS 1995
AND 2000 IN GG 16
TABLE 3 RELEVANCE OF THE PROPOSED FREL/FRL REDD+ ACTIVITIES TO THE
IMPLEMENTATION OF THE NATIONAL REDD+ STRATEGY 18
TABLE 4 POOLS INCLUDED IN THE FRL SUBMISSION 19
TABLE 5: LAND COVER CLASSES 23
TABLE 6. AREAS (IN HECTARES) OF AGGREGATED CHANGE CLASSES 25
TABLE 7 : ACCUMULATED A/R AREAS OVER THE REFERENCE PERIOD (2006-2018) IN HA
ACCUMULATED 30
TABLE 8 DESCRIPTION OF THE STRATA 34
TABLE 9 SAMPLE UNITS, THEIR DISTRIBUTION AND ACTUAL MEASUREMENTS 35
TABLE 10 EMISSION FACTORS FOR DEFORESTATION 39
TABLE 11 EMISSION FACTORS DATA USED IN THE ESTIMATION OF CARBON REMOVALS 40
TABLE 12. SUDAN’S PROPOSED SUBNATIONAL FRL 43
8
LIST OF FIGURES
FIGURE 1 SUDAN NATIONAL TERRITORY WITH THE STATES BOUNDARIES
BOUNDARIES WITH 12
FIGURE 2. TWO SUGGESTED SUB-NATIONAL FOREST REFERENCE LEVELS 14
FIGURE 3. AREA OF THE SUB-NATIONAL FREL/FRL AND FOREST COVER IN THE
AREA OF FREL/FRL 15
FIGURE 4 SINNAR CHANGE MAP FROM 2006 TO 2018 26
FIGURE 5 BLUE NILE CHANGE MAP FROM 2006 TO 2018 27
FIGURE 6 GEDARIF CHANGE MAP FROM 2006 TO 2018 28
FIGURE 7 THE MAP WITH THE RESULTED FIVE STRATA AND THEIR
CORRESPONDING AREAS 34
FIGURE 8 : MAP OF ALL SAMPLES OF THE NFI AFTER THE INTENSIFICATION: 36
9
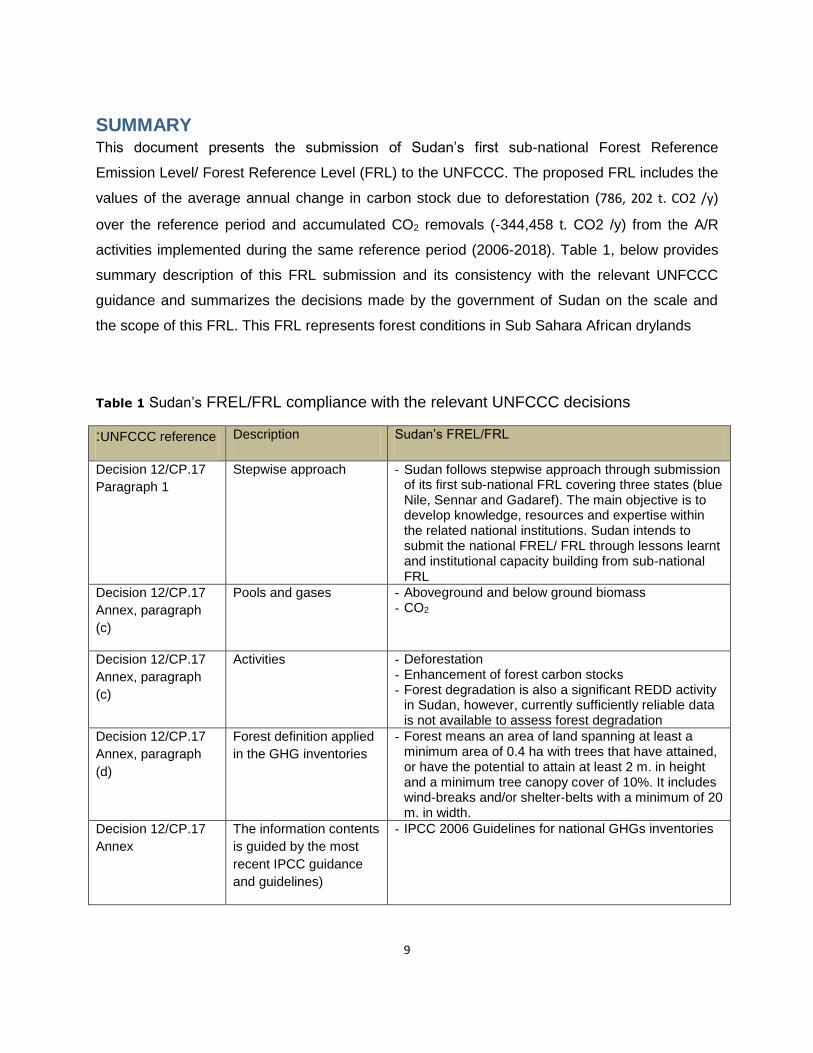
SUMMARY This document presents the submission of Sudan’s first sub-national Forest Reference
Emission Level/ Forest Reference Level (FRL) to the UNFCCC. The proposed FRL includes the
values of the average annual change in carbon stock due to deforestation (786, 202 t. CO2 /y)
over the reference period and accumulated CO2 removals (-344,458 t. CO2 /y) from the A/R
activities implemented during the same reference period (2006-2018). Table 1, below provides
summary description of this FRL submission and its consistency with the relevant UNFCCC
guidance and summarizes the decisions made by the government of Sudan on the scale and
the scope of this FRL. This FRL represents forest conditions in Sub Sahara African drylands
Table 1 Sudan’s FREL/FRL compliance with the relevant UNFCCC decisions
:UNFCCC reference Description Sudan’s FREL/FRL
Decision 12/CP.17
Paragraph 1
Stepwise approach - Sudan follows stepwise approach through submission of its first sub-national FRL covering three states (blue Nile, Sennar and Gadaref). The main objective is to develop knowledge, resources and expertise within the related national institutions. Sudan intends to submit the national FREL/ FRL through lessons learnt and institutional capacity building from sub-national FRL
Decision 12/CP.17
Annex, paragraph
(c)
Pools and gases - Aboveground and below ground biomass - CO2
Decision 12/CP.17
Annex, paragraph
(c)
Activities - Deforestation - Enhancement of forest carbon stocks - Forest degradation is also a significant REDD activity
in Sudan, however, currently sufficiently reliable data is not available to assess forest degradation
Decision 12/CP.17
Annex, paragraph
(d)
Forest definition applied
in the GHG inventories
- Forest means an area of land spanning at least a minimum area of 0.4 ha with trees that have attained, or have the potential to attain at least 2 m. in height and a minimum tree canopy cover of 10%. It includes wind-breaks and/or shelter-belts with a minimum of 20 m. in width.
Decision 12/CP.17
Annex
The information contents
is guided by the most
recent IPCC guidance
and guidelines)
- IPCC 2006 Guidelines for national GHGs inventories
10
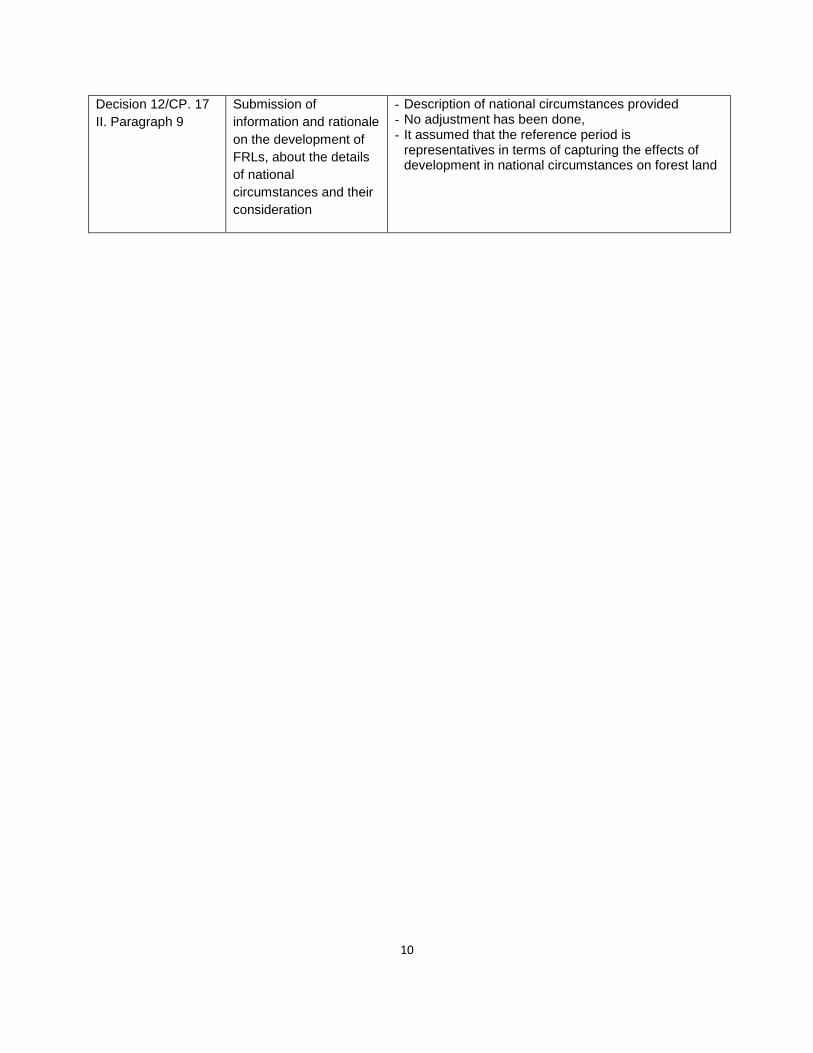
Decision 12/CP. 17
II. Paragraph 9
Submission of
information and rationale
on the development of
FRLs, about the details
of national
circumstances and their
consideration
- Description of national circumstances provided - No adjustment has been done, - It assumed that the reference period is
representatives in terms of capturing the effects of development in national circumstances on forest land

11
1. INTRODUCTION
Sudan is submitting its Forest Reference Level (FREL/FRL) in response to the invitation of the
Conference of Parties to the UNFCCC, issued in paragraph 13 of decision 12.CP/16 and the
request in paragraph 71(b) of decision 1.CP/16, for developing countries to develop and submit,
on a voluntary basis, FREL/FRL, for consideration by the UNFCCC. This submission is intended
for technical assessment in the context of results-based payments for reducing emissions from
deforestation and forest degradation and the role of conservation, sustainable management of
forests and enhancement of forest carbon stocks in developing countries (REDD+) under
UNFCCC. Sudan also considers the development of the FREL/FRL as very important for
enhancing implementation of national forest programme including REDD+ strategy and for
contributing to the global climate change mitigation and adaptation objectives through
preparation and implementation of NDCs.
Sudan is a country with a highly diverse vegetation cover and ecological zones where, the
rainfall varies from zero in the northern desert to more than 1,200 mm in the High Rainfall
Woodland Savannah in the south-western portion of the country. Five distinct ecological zones
representing biomes with different ecological conditions and different vegetation cover, desert,
semi-desert, woodland Savanah, flood region and montane vegetation.
Located in North Eastern Africa, The Republic of Sudan (RoS) is bound by Egypt, The Red Sea,
Eretria, Ethiopia, Republic of South Sudan (RSS), Central African Republic, Chad and Libya
(Figure 1). The total area1* is 1, 886,068 km². The highest point in the country is Jebel Marra;
3,024 meters above sea level (m a.s.l.). The lowest is the Red Sea; 0.0 m a.s.l. The most salient
geographical features are the Nubian and Bayuda Deserts in the north, the Nile Valley, Jebel
Marra, Nuba, Ingessena & Red Sea Hills. The Blue Nile originates in the Ethiopian Highlands.
The White Nile runs from the Equatorial Lakes. The two rivers unite at Khartoum and with their
tributaries form the River Nile which runs north to the Mediterranean Sea (Figure 1). The
vegetation can be divided into seven principal types which in general follow the isohyets and
form consecutive series from north to south: 1. Desert; 2. Semi-Desert; 3. Acacia Short Grass
Scrub; 4. Acacia Tall Grass Scrub; 5. Broad-leaved Woodlands & Forests; 6. Swamps
(permanent swamps, seasonally inundated land), 7. Grassland and Mountain Meadow.
1 en.wikipedia-org/wiki/Sudan#Government_and_politics

12
Sudan’s forests cover is about 10.3% of its total land surface, with an estimated annual rate of
deforestation of about 174,400 ha, or about 0.8% (FAO 2015). Forests have been facing
encroachment by agriculture, urbanization, and unsustainable wood fuel extraction for several
decades. The lack of integrated land use plans and coordination across institutions has resulted
in the uncontrolled land use changes and conversion of vast forest tracts into agricultural areas
over the past 40 years.
Figure 1 Sudan national territory with the States boundaries
boundaries with
13
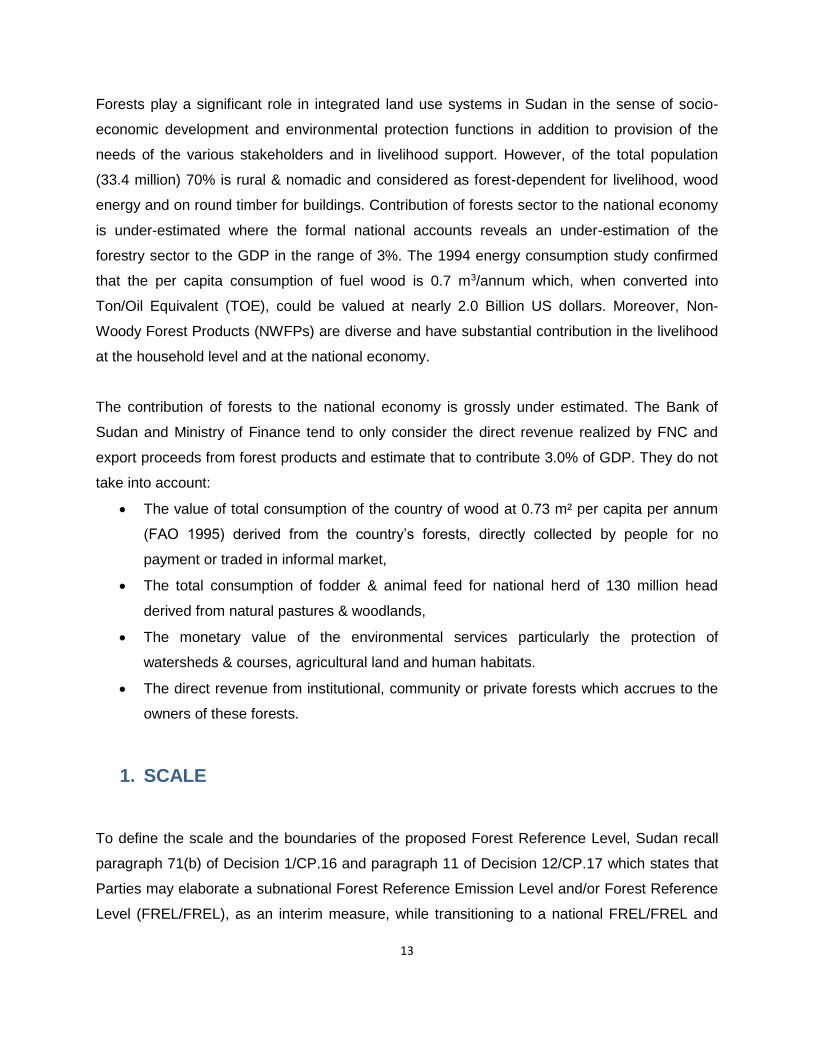
Forests play a significant role in integrated land use systems in Sudan in the sense of socio-
economic development and environmental protection functions in addition to provision of the
needs of the various stakeholders and in livelihood support. However, of the total population
(33.4 million) 70% is rural & nomadic and considered as forest-dependent for livelihood, wood
energy and on round timber for buildings. Contribution of forests sector to the national economy
is under-estimated where the formal national accounts reveals an under-estimation of the
forestry sector to the GDP in the range of 3%. The 1994 energy consumption study confirmed
that the per capita consumption of fuel wood is 0.7 m3/annum which, when converted into
Ton/Oil Equivalent (TOE), could be valued at nearly 2.0 Billion US dollars. Moreover, Non-
Woody Forest Products (NWFPs) are diverse and have substantial contribution in the livelihood
at the household level and at the national economy.
The contribution of forests to the national economy is grossly under estimated. The Bank of
Sudan and Ministry of Finance tend to only consider the direct revenue realized by FNC and
export proceeds from forest products and estimate that to contribute 3.0% of GDP. They do not
take into account:
The value of total consumption of the country of wood at 0.73 m² per capita per annum
(FAO 1995) derived from the country’s forests, directly collected by people for no
payment or traded in informal market,
The total consumption of fodder & animal feed for national herd of 130 million head
derived from natural pastures & woodlands,
The monetary value of the environmental services particularly the protection of
watersheds & courses, agricultural land and human habitats.
The direct revenue from institutional, community or private forests which accrues to the
owners of these forests.
1. SCALE
To define the scale and the boundaries of the proposed Forest Reference Level, Sudan recall
paragraph 71(b) of Decision 1/CP.16 and paragraph 11 of Decision 12/CP.17 which states that
Parties may elaborate a subnational Forest Reference Emission Level and/or Forest Reference
Level (FREL/FREL), as an interim measure, while transitioning to a national FREL/FREL and
14
also recalling paragraph 10 of Decision 12/CP.17 in which the Conference of the Parties (CP)
agreed that a step-wise approach to national FREL/FRL development may be useful, enabling
Parties to improve their FREL/FRL by incorporating better data, improved methodologies and,
where appropriate, additional pools, noting the importance of adequate and predictable support
as referenced to by Decision 1/CP.16, paragraph 71.
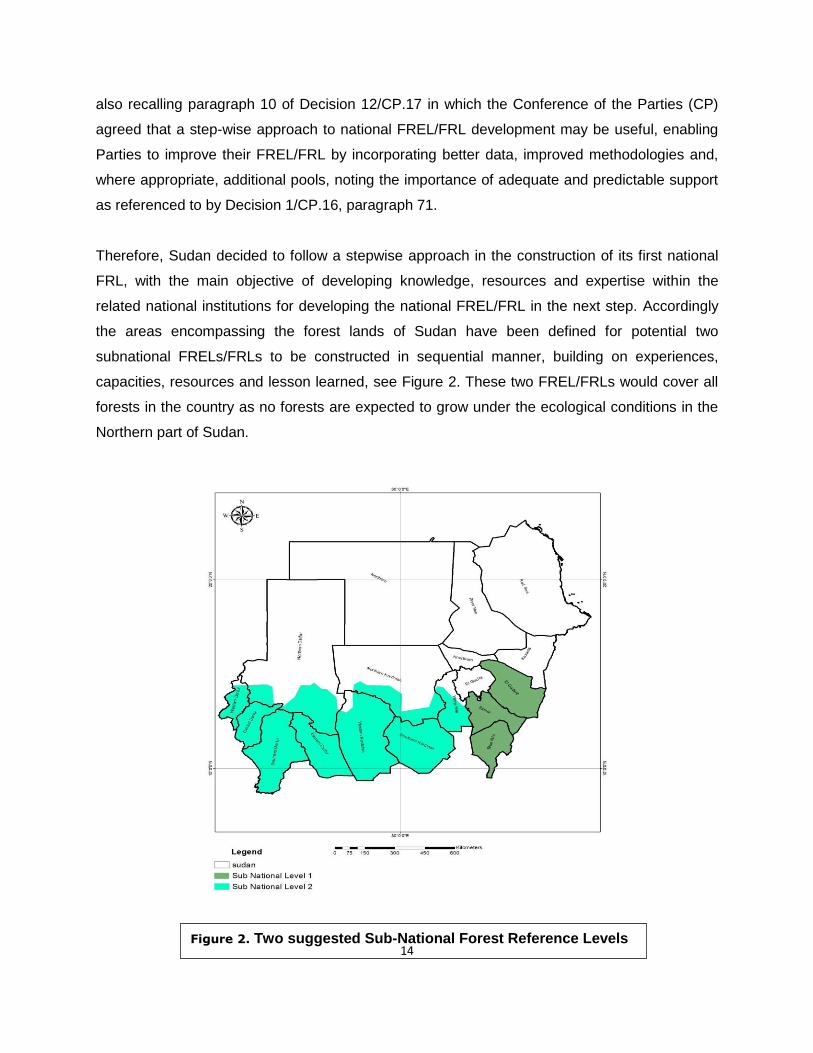
Therefore, Sudan decided to follow a stepwise approach in the construction of its first national
FRL, with the main objective of developing knowledge, resources and expertise within the
related national institutions for developing the national FREL/FRL in the next step. Accordingly
the areas encompassing the forest lands of Sudan have been defined for potential two
subnational FRELs/FRLs to be constructed in sequential manner, building on experiences,
capacities, resources and lesson learned, see Figure 2. These two FREL/FRLs would cover all
forests in the country as no forests are expected to grow under the ecological conditions in the
Northern part of Sudan.
Figure 2. Two suggested Sub-National Forest Reference Levels
15
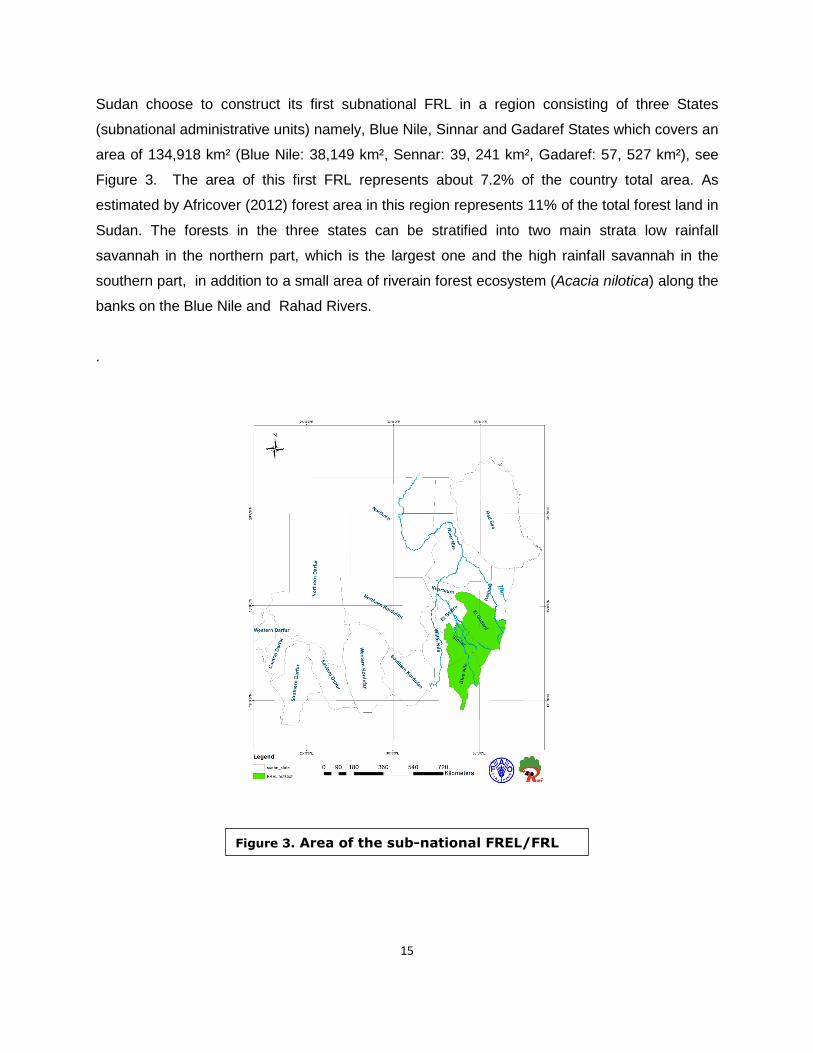
Sudan choose to construct its first subnational FRL in a region consisting of three States
(subnational administrative units) namely, Blue Nile, Sinnar and Gadaref States which covers an
area of 134,918 km² (Blue Nile: 38,149 km², Sennar: 39, 241 km², Gadaref: 57, 527 km²), see
Figure 3. The area of this first FRL represents about 7.2% of the country total area. As
estimated by Africover (2012) forest area in this region represents 11% of the total forest land in
Sudan. The forests in the three states can be stratified into two main strata low rainfall
savannah in the northern part, which is the largest one and the high rainfall savannah in the
southern part, in addition to a small area of riverain forest ecosystem (Acacia nilotica) along the
banks on the Blue Nile and Rahad Rivers.
.
Figure 3. Area of the sub-national FREL/FRL
16
2. SCOPE: ACTIVITIES, POOLS AND GASES INCLUDED
In line with the stepwise approach, Sudan decided to define a limited scope, however, in line
with the UNFCCC requirements. The aim is to test application of methods and tools, improve
data, then to scale up by adding activities, pools and gases over time. The UNFCCC have not
defined specific activities, pools or gases that are mandatory to be included in the FREL/FRL,
however, decision 12CP.17 requires parties to include in their FREL/FRL significant pools and
gases, and activities listed in decision 1/CP.16, paragraph 70, and to justify omission of any
significant pool, activity.
2.1. REDD+ activities in the FREL/FRL
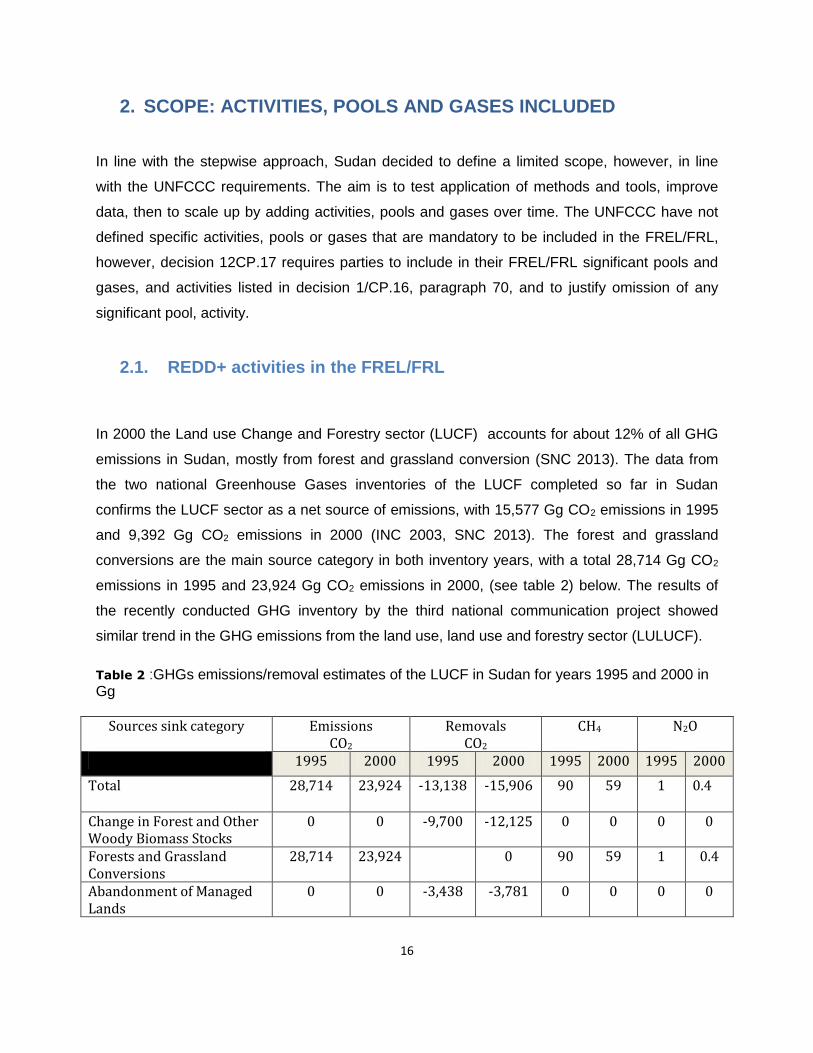
In 2000 the Land use Change and Forestry sector (LUCF) accounts for about 12% of all GHG
emissions in Sudan, mostly from forest and grassland conversion (SNC 2013). The data from
the two national Greenhouse Gases inventories of the LUCF completed so far in Sudan
confirms the LUCF sector as a net source of emissions, with 15,577 Gg CO2 emissions in 1995
and 9,392 Gg CO2 emissions in 2000 (INC 2003, SNC 2013). The forest and grassland
conversions are the main source category in both inventory years, with a total 28,714 Gg CO2
emissions in 1995 and 23,924 Gg CO2 emissions in 2000, (see table 2) below. The results of
the recently conducted GHG inventory by the third national communication project showed
similar trend in the GHG emissions from the land use, land use and forestry sector (LULUCF).
Table 2 :GHGs emissions/removal estimates of the LUCF in Sudan for years 1995 and 2000 in Gg
Sources sink category Emissions CO2
Removals CO2
CH4 N2O
1995 2000 1995 2000 1995 2000 1995 2000
Total 28,714 23,924 -13,138 -15,906 90 59 1 0.4
Change in Forest and Other Woody Biomass Stocks
0 0 -9,700 -12,125 0 0 0 0
Forests and Grassland Conversions
28,714 23,924 0 90 59 1 0.4
Abandonment of Managed Lands
0 0 -3,438 -3,781 0 0 0 0
17
The SNC 2013 further indicated that the category conversion of forests and grasslands
accounts for all CO2e emissions from the LUCF sector. This is mostly due to the deforestation
and degradation of forests associated with unsustainable biomass extraction in rural areas. In
Sudan mechanized farming is also known as a main driver of forest and grass lands conversion.
Energy consumption rank second in the causes of deforestation and forest degradation,
biomass energy represents a main source of energy especially in rural Sudan, contributing
about 60% of the national energy demand. In addition, there are other factors contributing to
deforestation and forest degradation such as over grazing, needs for construction materials,
forest fires etc (DoDD, 2018). The selected sub-national FRL states (Blue Nile, Sennar,
Gadaref) are also indicated as a hotspot area for deforestation, in which about 50% of all
mechanized framing area is located and has been the main source of biomass energy supply
for several decades to the major urban areas in central Sudan including the capital city i.e.
Khartoum State (DoDD, 2018). The region also hosts large portion of Sudan’s animal resources
and suffers from overgrazing (DoDD, 2018). Therefore, the vast areas of the mechanized
framing are degraded or being degraded as a result of mal-cultivation practices and large areas
of which was left abandoned. These degraded farm lands represent a large potential for
afforestation and reforestation programme and the government has a policy in place to convert
10% of mechanized farming lands into forests. In terms of data availability to support the
preparation of first subnational FREL and the inclusion of these two REDD+ activities
(deforestation and enhancement of forest carbon stocks), this region has better data sources on
deforestation, A/R areas, mechanized farming and other forest management related data
compared to the other regions delineated for preparation of the other subnational FREL(s) in
Sudan. Although forest degradation is a significant REDD+ activity in Sudan, however, currently
there is no data suitable for assessing and estimating the effect of forest degradation on the
carbon stock, as this requires well established and repeated NFI data.
Based on the above assessment, Sudan decided that the most appropriate two2 REDD+
activities to be included in the first subnational FREL in the region encompassing the three state
of Gedarif, Sinnar and Blue Nile are:
- Reducing emission from deforestation
2 Reducing emissions from forest degradation in case there possible to conduct assessment of the change in forest
carbon stock over the selected reference period for deforestation.

18
- Enhancement of forest carbon stocks
The inclusion of these two activities is also consistent with the national REDD+ strategy, as they
support the achievement of a number of REDD+ objectives and activities indicated in the
national REDD+ strategy (see table 3 below). The REDD+ programme is currently working on
developing emission reduction programmes in the same region to initiate the implementation
phase of REDD+ in Sudan.
Table 3 Relevance of the proposed FREL/FRL REDD+ activities to the implementation of the National REDD+ Strategy
Objectives in the national REDD+ strategy
REDD+ activities included in the FREL/FRL
Enhance agricultural productivity and avail alternative income generating sources for rural communities and promotion of application of research, technologies, targeted financing and institutional reforms.
Adopt environmentally-friendly energy policies that promote renewable energy and energy efficiency in production and use including improved firewood & charcoal stoves and conversion of wood into charcoal.
Support of private sector investment in production and dissemination of solar cook stoves, investment in ethanol, biogas digesters and biogas cookers.
Increase production of firewood and charcoal from sustainably managed forest plantations
Promote sustainable fuelwood (Firewood & Charcoal) production, consumption and usage
Improve Policy towards refugees to address their humanitarian needs and guard against deforestation and land degradation
Reducing emission from deforestation
Restoration of degraded (forest, grazing and farming) landscapes.
Carbon sequestration through restoration, avoided deforestation and conservation of biodiversity
Gum Arabic restocking and rehabilitation of the gum belt for carbon sequestration, climate resilience
Gums other than gum Arabic– resins production and commercialization
Develop and implement master plan for tree-
Enhancement of forest carbon stocks
19
planting in major human settlements, agricultural holdings, highways and rail roads
Establishment of shelterbelts, wind-Breaks and woodlots in mechanized rainfed schemes
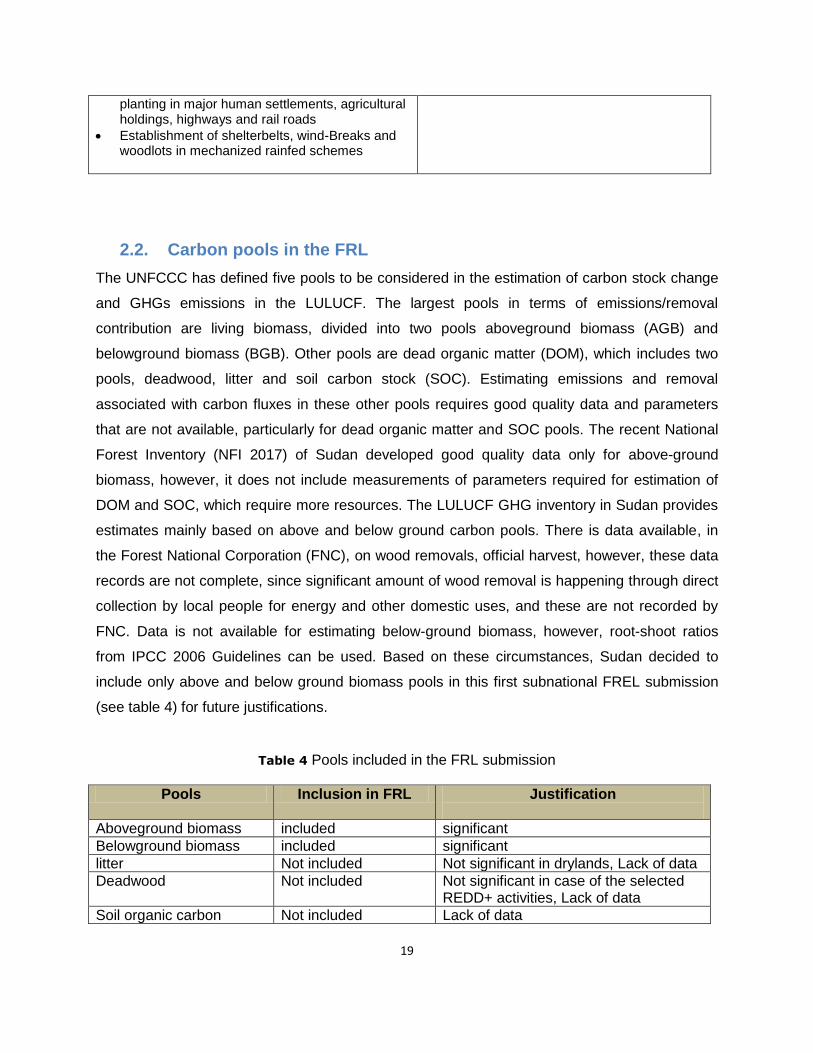
2.2. Carbon pools in the FRL
The UNFCCC has defined five pools to be considered in the estimation of carbon stock change
and GHGs emissions in the LULUCF. The largest pools in terms of emissions/removal
contribution are living biomass, divided into two pools aboveground biomass (AGB) and
belowground biomass (BGB). Other pools are dead organic matter (DOM), which includes two
pools, deadwood, litter and soil carbon stock (SOC). Estimating emissions and removal
associated with carbon fluxes in these other pools requires good quality data and parameters
that are not available, particularly for dead organic matter and SOC pools. The recent National
Forest Inventory (NFI 2017) of Sudan developed good quality data only for above-ground
biomass, however, it does not include measurements of parameters required for estimation of
DOM and SOC, which require more resources. The LULUCF GHG inventory in Sudan provides
estimates mainly based on above and below ground carbon pools. There is data available, in
the Forest National Corporation (FNC), on wood removals, official harvest, however, these data
records are not complete, since significant amount of wood removal is happening through direct
collection by local people for energy and other domestic uses, and these are not recorded by
FNC. Data is not available for estimating below-ground biomass, however, root-shoot ratios
from IPCC 2006 Guidelines can be used. Based on these circumstances, Sudan decided to
include only above and below ground biomass pools in this first subnational FREL submission
(see table 4) for future justifications.
Table 4 Pools included in the FRL submission
Pools Inclusion in FRL Justification
Aboveground biomass included significant
Belowground biomass included significant
litter Not included Not significant in drylands, Lack of data
Deadwood Not included Not significant in case of the selected REDD+ activities, Lack of data
Soil organic carbon Not included Lack of data

20
2.3. Gases in the FRL
CO2 is the only gas included in this first sub-national FREL estimation by Sudan. Because
currently there is no reliable data to include other activities, pools and to estimate other gases.
CO2 is also the main gas estimated in SNC and the GHGs inventory of the forthcoming Third
National Communication (TNC) of Sudan. Following a stepwise approach provides a good
opportunity to develop capacities, data collection and resources necessary for improving the
FREL/FRL submission overtime.
3. FOREST DEFINITION / DEFINITIONS USED
Sudan's national forest definition defines forest as an area of land spanning at least a minimum
area of 0.4 ha with trees that have attained, or have the potential to attain at least 2 m. in height
and a minimum tree canopy cover of 10%. It includes wind-breaks and/or shelter-belts with a
minimum of 20 m. in width"
This forest definition was used in the recent national forest inventory (NFI 2017). This definition
is different from the one used in GHGs inventory published in the Sudan Second National
Commination (SNC 2013), however, it will be used in the GHG inventory to be reported in the
TNC and Sudan’s first Biennial Update Report (BUR), to be submitted in 2020.
The forest definition has been developed recently to take into consideration the new situation in
the forest resources after the separation of South Sudan (2011) with one third of the country
total area and about 60% of the forest resources. This situation raised the need for a definition
that enhances and maximizes the protection and production functions of the remaining forest
resources. The new definition also responds to climate change challenges and the role the
forest resources in Sudan are envisioned to play in meeting Sudan’s obligations under the
UNFCCC and Paris Agreement.
4. CONSISTENCY WITH GHG INVENTORY REPORTING
Sudan submitted its Second National Communication (SNC) in 2013 and currently is embarking
on the preparation of the third national communication (TNC) and the first biennial update report
(BUR) both are expected to be submitted to the UNFCCC secretariat in 2020. This FRL
submission is not consistent with the GHGs inventory reported in the SNC, as it is based on the
21
2006 IPCC Guidelines while the GHGs inventory of the SNC was based on the 1996 IPCC
Guidelines. However, this is consistent with the recently completed GHGs inventory prepared
under the current project of the TNC, in which the 2006 IPCC Guidelines were applied for the
first time in Sudan. The recent GHG inventory and its update will be published in the TNC and
first BUR in late 2020.
5. INFORMATION USED FOR FREL CONSTRUCTION
5.1. Activity Data for Deforestation:
Historically, the targeted region of the three states was subjected to large scale mechanised
agriculture since early 1980s, where forest areas have been cleared of tree cover at a rapid
pace and the land was subject to cultivation for a number of years after which they lost
productivity and are now degraded and oftentimes abandoned (DoD, 2018). Commercial
mechanized agricultural activities are concentrated in the dry savannah in this region where, the
mechanization of rain-fed agriculture was initiated by the British in the region (Gadaref) in 1944
and continues up to now on clay soil by the government and private sector. In the late 1970s,
about 2.2 million hectares of land had been allocated for mechanized farming, and about
420,000 hectares more had been occupied without official demarcation. However, today,
mechanized agriculture occupies a large area of the clay plains in the high rainfall savannah belt
estimated to be 6.5 million hectares, extending from the Butana plains in the east to Southern
Kordofan in central Sudan (DoD 2018). The largest proportion (48%) of mechanized farming in
Sudan was found to be in this region of the subnational FREL/FRL, which also represents a
high potential for implementation of the REDD+ activities of Enhancement of carbon stock
through afforestation and reforestation, by the communities, private sector and the government.
5.1.1. Methodology and data used
Land cover maps of EL Gadarif, Sinnar and BlueNile states were developed for the years of
2006, 2010, 2014 and 2018 to estimate forest area based on the national forest definition (as
described above) and the areas of forest remaining as forest, other land converted to forest and
forest converted to other land for three time periods (i.e., 2006 to 2010, 2010 to 2014 and 2014
22
to 2018). The maps were developed using the same methods and same classification system.
Based on the availability, there were some differences in the selection of satellite imagery used
to develop the maps. In the following sections, land cover mapping processes are described,
followed by the description of steps to generate the activity data.
5.1.2. Development of land cover maps of 2006, 2010, 2014 and 2018
For the creation of individual landcover map Global Land Cover Network (FAO/GLCN) approach
was followed (GLCN/FAO) (http://www.fao.org/geospatial/projects/detail/en/c/1035672). Each
single image (e.g. 2006, 2010, 2014 and 2018) was processed, interpreted, validated using
available very high resolution images from Bing map in Qgis and Google earth. The reason of
using GLCN approach was because country was familiar with this methodology since the
development of national landcover map 2011 (Africover, 2012).
5.1.2.1. Image acquisition
For land cover mapping of 2010, 2014 and 2018 Landsat images of 30-meter spatial resolution
were used. Due to data gaps caused by the Scan Line Corrector (SLC) failure, Landsat 7
images could not be used for 2006 land cover mapping, instead Aster 15-meter spatial
resolution images were used. The images were downloaded from United State Geological
Survey (USGS) www.usgs.gov/landsat. In the dry and wet seasons, with maximum cloud cover of
30%. Aster images were already combined on the website, the bands used for Landsat 7 were 4, 3, 2, and
for Landsat 8 the bands were 5, 4, 3 The list of satellite imagery used for land cover mapping of
different years are provided in ANNEX 1
5.1.2.2. Image segmentation and land cover interpretation
Object-based image analysis (OBIA) approach was used to create image objects defined by
spectral, textural and border properties. The resulted vector layer of objects (i.e., image
segments) represent regions with similar pixel values with respect to some characteristic or
computed property such as colour, intensity or texture and pattern. Segmentation process was
run, using eCognition, aiming at a minimum mapping unit (MMU) of 0.4 hectares (ha). Objects
23
smaller than 0.4 ha were merged to comply with the defined requirements for MMU. Then
overlapping areas were corrected and the layer was made ready for interpretation.
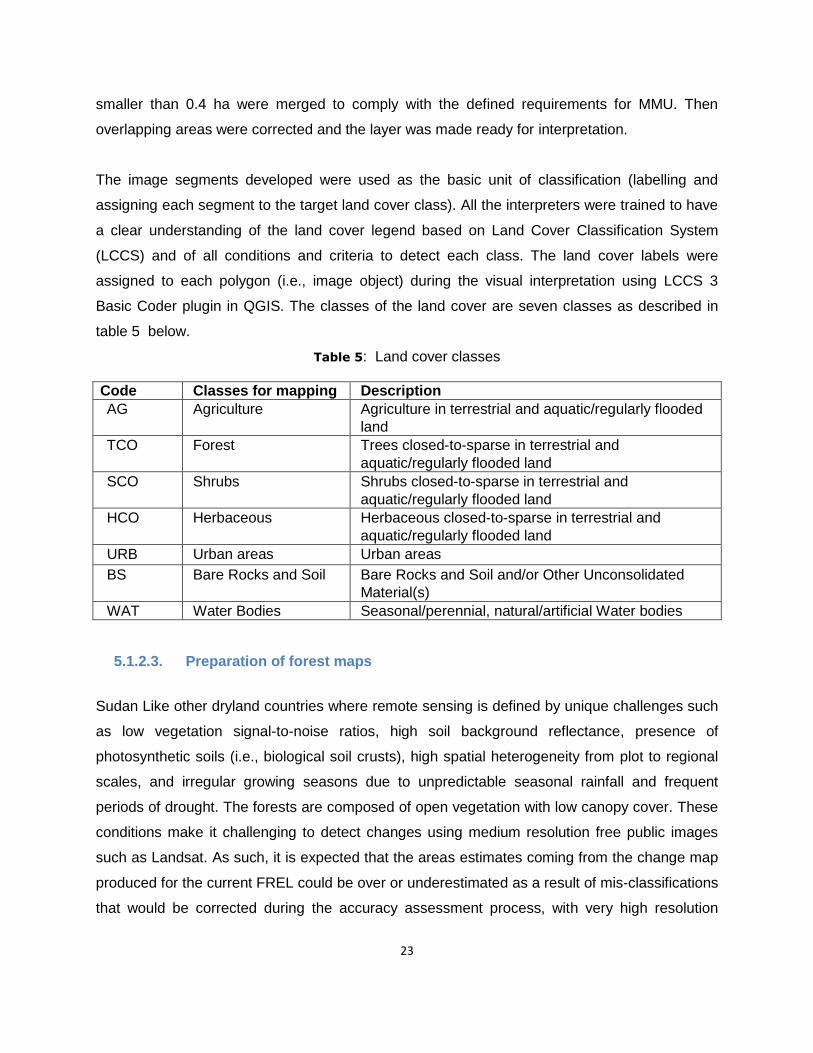
The image segments developed were used as the basic unit of classification (labelling and
assigning each segment to the target land cover class). All the interpreters were trained to have
a clear understanding of the land cover legend based on Land Cover Classification System
(LCCS) and of all conditions and criteria to detect each class. The land cover labels were
assigned to each polygon (i.e., image object) during the visual interpretation using LCCS 3
Basic Coder plugin in QGIS. The classes of the land cover are seven classes as described in
table 5 below.
Table 5: Land cover classes
Code Classes for mapping Description
AG Agriculture Agriculture in terrestrial and aquatic/regularly flooded
land
TCO Forest Trees closed-to-sparse in terrestrial and
aquatic/regularly flooded land
SCO Shrubs Shrubs closed-to-sparse in terrestrial and
aquatic/regularly flooded land
HCO Herbaceous Herbaceous closed-to-sparse in terrestrial and
aquatic/regularly flooded land
URB Urban areas Urban areas
BS Bare Rocks and Soil Bare Rocks and Soil and/or Other Unconsolidated
Material(s)
WAT Water Bodies Seasonal/perennial, natural/artificial Water bodies
5.1.2.3. Preparation of forest maps
Sudan Like other dryland countries where remote sensing is defined by unique challenges such
as low vegetation signal-to-noise ratios, high soil background reflectance, presence of
photosynthetic soils (i.e., biological soil crusts), high spatial heterogeneity from plot to regional
scales, and irregular growing seasons due to unpredictable seasonal rainfall and frequent
periods of drought. The forests are composed of open vegetation with low canopy cover. These
conditions make it challenging to detect changes using medium resolution free public images
such as Landsat. As such, it is expected that the areas estimates coming from the change map
produced for the current FREL could be over or underestimated as a result of mis-classifications
that would be corrected during the accuracy assessment process, with very high resolution
24
imagery available through public databases (Google Earth, Here Maps, Bing Maps) for
visualization.
As a consequence, it is very likely that the area estimation coming from a stratified design, such
as the one that will be implemented for the accuracy assessment, gives different numbers from
the map areas. The figures provided in the current report will probably be modified when the
areas from the accuracy assessment are finalized.
Forest maps for different years were produced, based on Sudan’s new forest definition (see
section 4 above), where the forest and shrub classes (i.e., TCO and SCO) were merged as a
forest class (F) and the other classes were merged to non-forest class (NF).
*TCO and SCO classes were aggregated in to forest, while other classes were
aggregated in to non-forest.
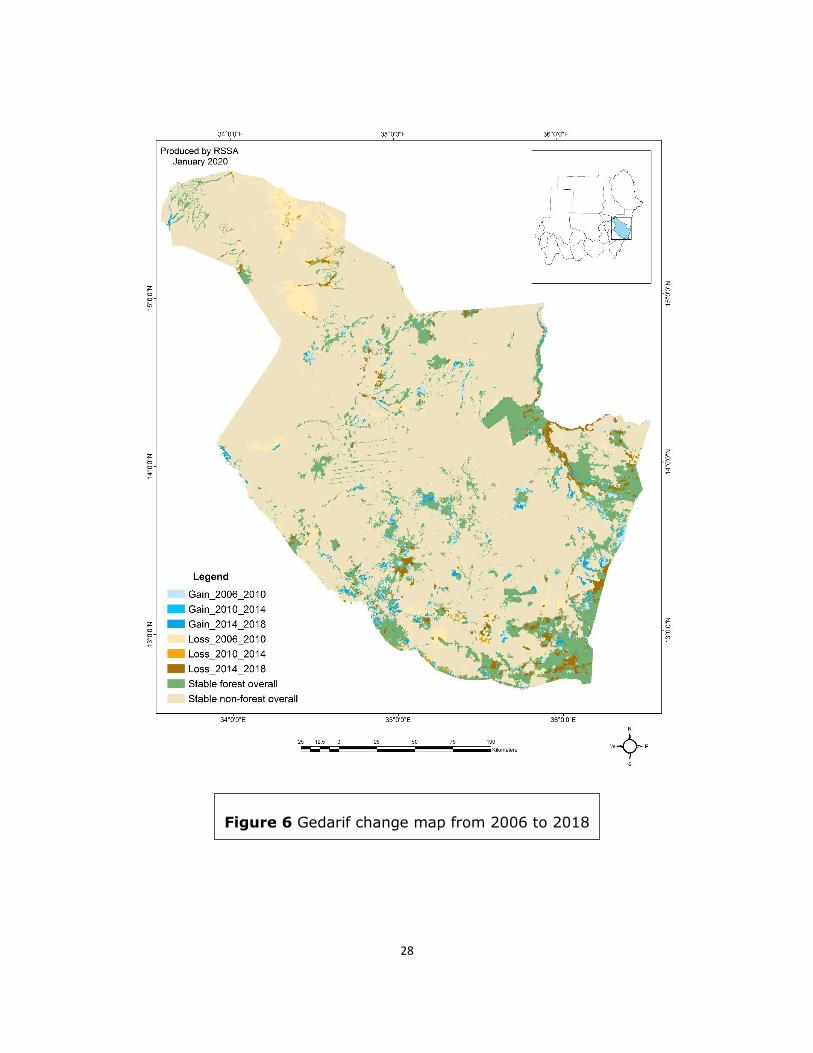
5.1.3. Results forest area change detection
The forest maps of 2006, 2010, 2014 and 2018 were overlaid to obtain a change map in which
each polygon contains:
- Forest / non-forest class in 2006
- Forest / non-forest class in 2010
- Forest / non-forest class in 2014
- Forest / non-forest class in 2018
- Area in hectares (ha)
- State name (in which the polygon is located)
These classes were aggregated into stable forest overall, stable non-forest overall, loss (forest
converted to non-forest) for 3 periods and gain (non-forest converted to forest, mostly natural
regeneration of trees on abandoned agriculture lands or shifting cultivation areas) for 3 periods.
Polygon with loss or gain in only one time period was classified as loss or gain in that time
period. Polygons with no change were classified as stable. The remaining polygons had both
loss and gain. Depending on the land cover status in 2018, these polygons were classified as
either stable forest overall (forest in 2018) or stable non-forest overall (non-forest in 2018).
25
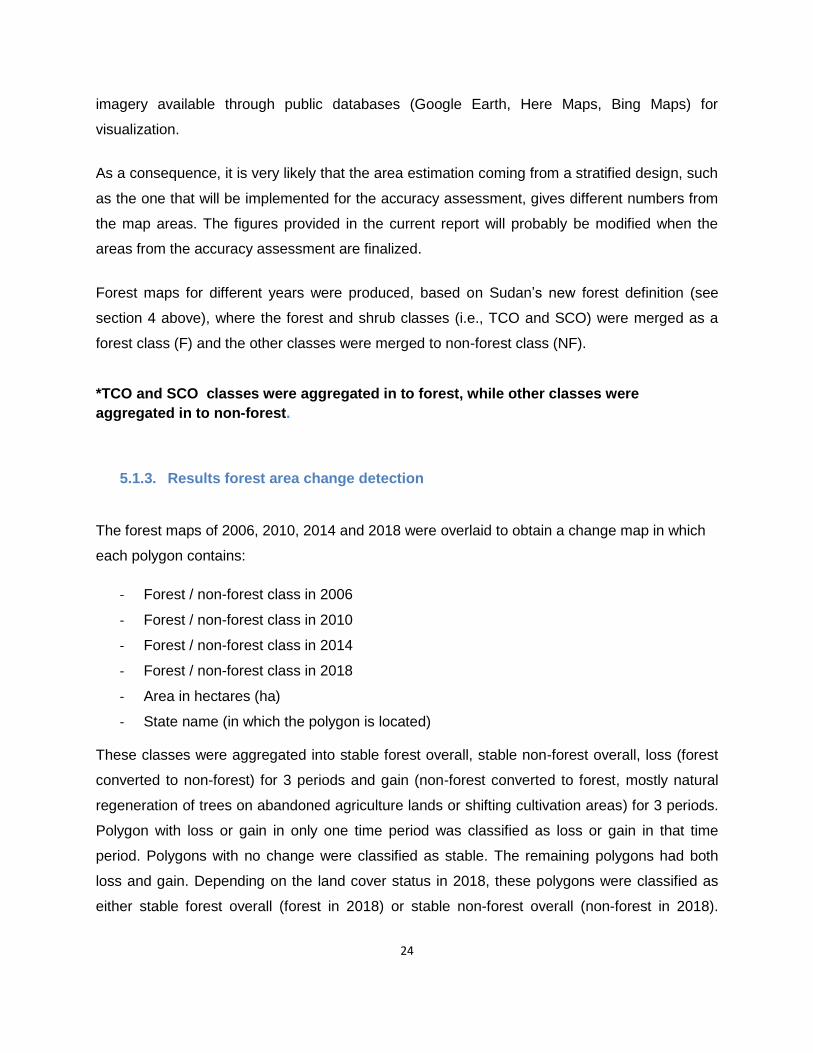
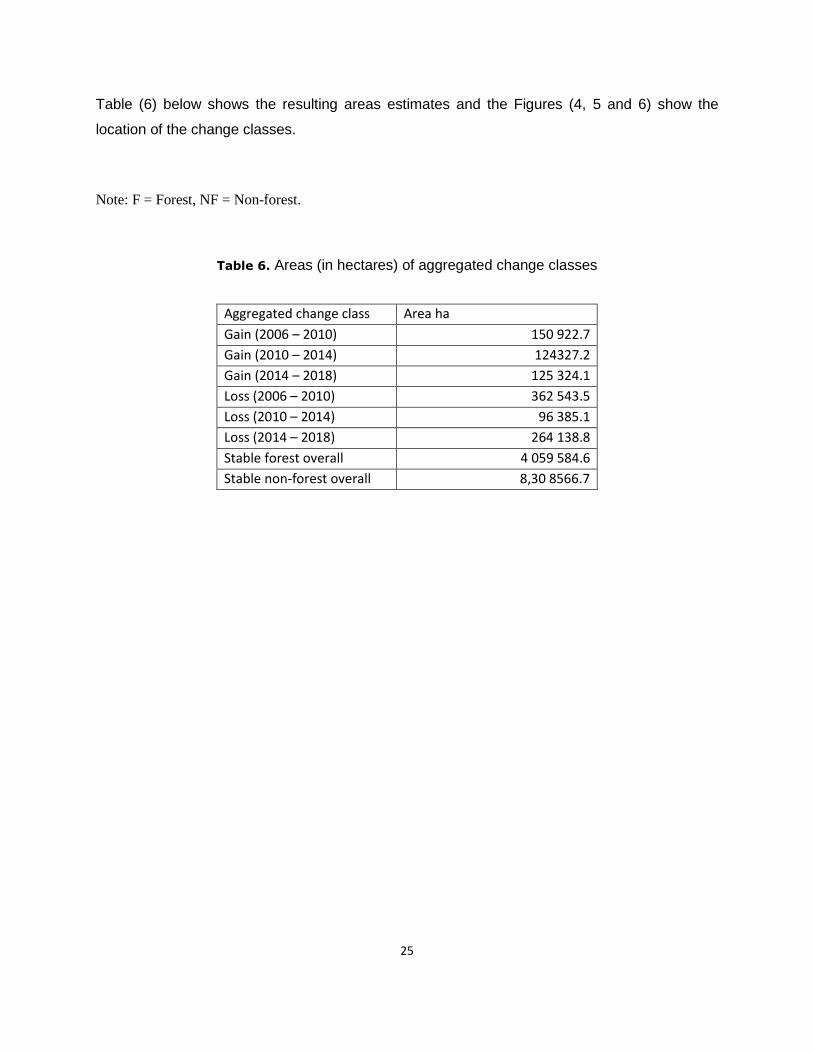
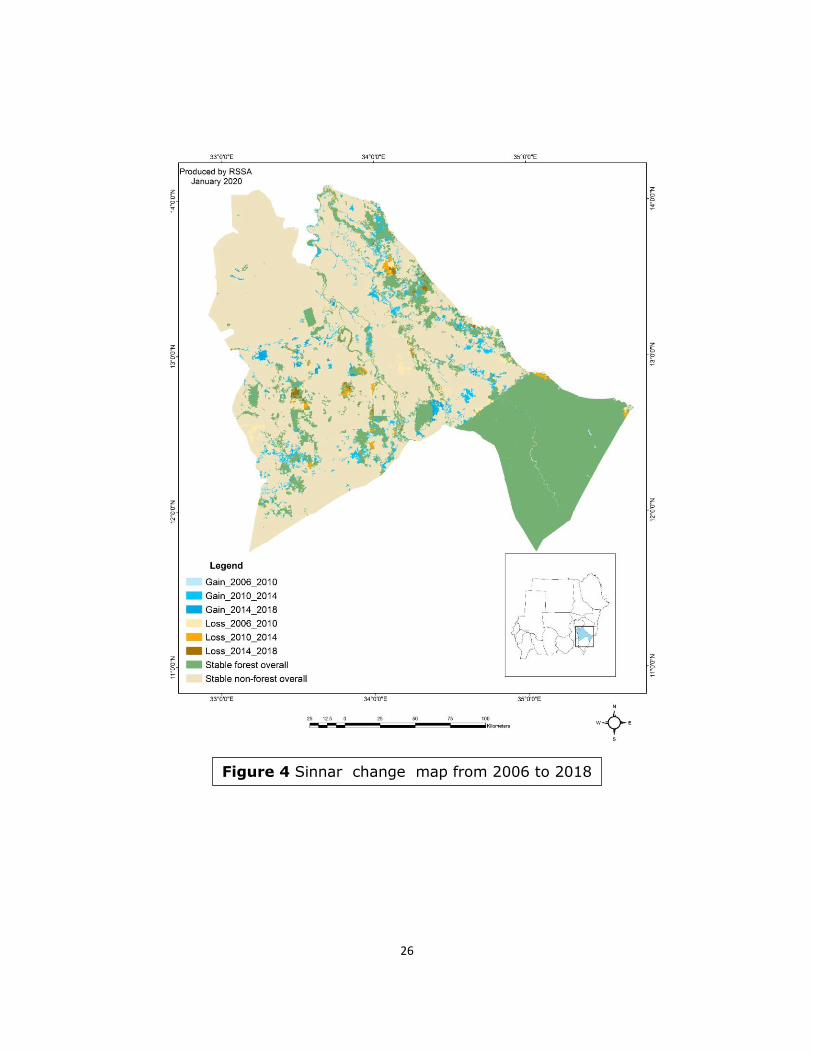
Table (6) below shows the resulting areas estimates and the Figures (4, 5 and 6) show the
location of the change classes.
Note: F = Forest, NF = Non-forest.
Table 6. Areas (in hectares) of aggregated change classes
Aggregated change class Area ha
Gain (2006 – 2010) 150 922.7
Gain (2010 – 2014) 124327.2
Gain (2014 – 2018) 125 324.1
Loss (2006 – 2010) 362 543.5
Loss (2010 – 2014) 96 385.1
Loss (2014 – 2018) 264 138.8
Stable forest overall 4 059 584.6
Stable non-forest overall 8,30 8566.7
26
Figure 4 Sinnar change map from 2006 to 2018
27
Figure 5 Blue Nile change map from 2006 to 2018
28
Figure 6 Gedarif change map from 2006 to 2018

29
5.2. Activity Data for Enhancement of Forest Carbon Stocks:
In Sudan, afforestation occurs on land that was not forest before, such as cropland, abandoned
lands, etc, while reforestation occurs inside reserve forests in areas that was cleared of their
tree cover through deforestation and forest degradation human related activities and the cleared
forest areas cannot regenerate naturally without human intervention, because of various
reasons including the continuation of the same activities that causes their clearance. Therefore,
implementation of enhancement activities of Afforestation and Reforestation (A/R) are a result of
planting of trees through seeds, seedlings and related land preparation. Enhancement or forest
gains associated with forestland remining forestland, in Sudan such as natural forests (falls
under protection provisions on the Forest Act), are not included in this FRL. Enhancement on
forestland remaining forestland in Sudan is mainly a result of natural regeneration on
abandonment mechanized agriculture lands and/or recovery of areas subjected to shifting
cultivation, which is a common practice in many parts of the country.
Data for Enhancement of forest carbon stocks through A/R activities is obtained from the Forest
National Corporation (FNC) offices at the three states where the subnational FRL is established.
The A/R data is recorded annually for FNC official annual A/R programme which is implemented
inside forest reserves, in addition to afforestation on agriculture schemes (cropland) in
collaboration with farmers. Such afforestation is supported by forest Act (2002) which stipulates
that 10% and 5% of the rainfed and the irrigated agriculture farms respectively are to be
allocated to forest plantations. This is in addition to FNC records on afforestation activities by
the local communities in the area, which is also supported by FNC in terms of seeds, seedlings
and extension services. The available records (ANNEX 2) cover the period 2000-2018, with few
gaps in some years such as 2000, 2002, 2003 in Sinnar state, and year 2000 in Gedarif state.
However, for the selected reference period (2006-2018) data is available.
Sudan estimated the A/R part of its FRL as the accumulated removals from the A/R activities
during the reference period. All land areas, in the three states, planted in years 2000 to 2018
was taken into account as they represent A/R areas < 20 years old, which according to the
IPCC fall under the category of land converted to forestland. Then, the FRL was estimated from
the accumulated A/R areas during the reference period (2006-2018), as an example, the A/R
removals in year 2006 is calculated as the accumulated in A/R areas in years 2000 to 2006. The
average of the annual removals (the FRL) on the accumulated A/R areas in year 2006-2018
30
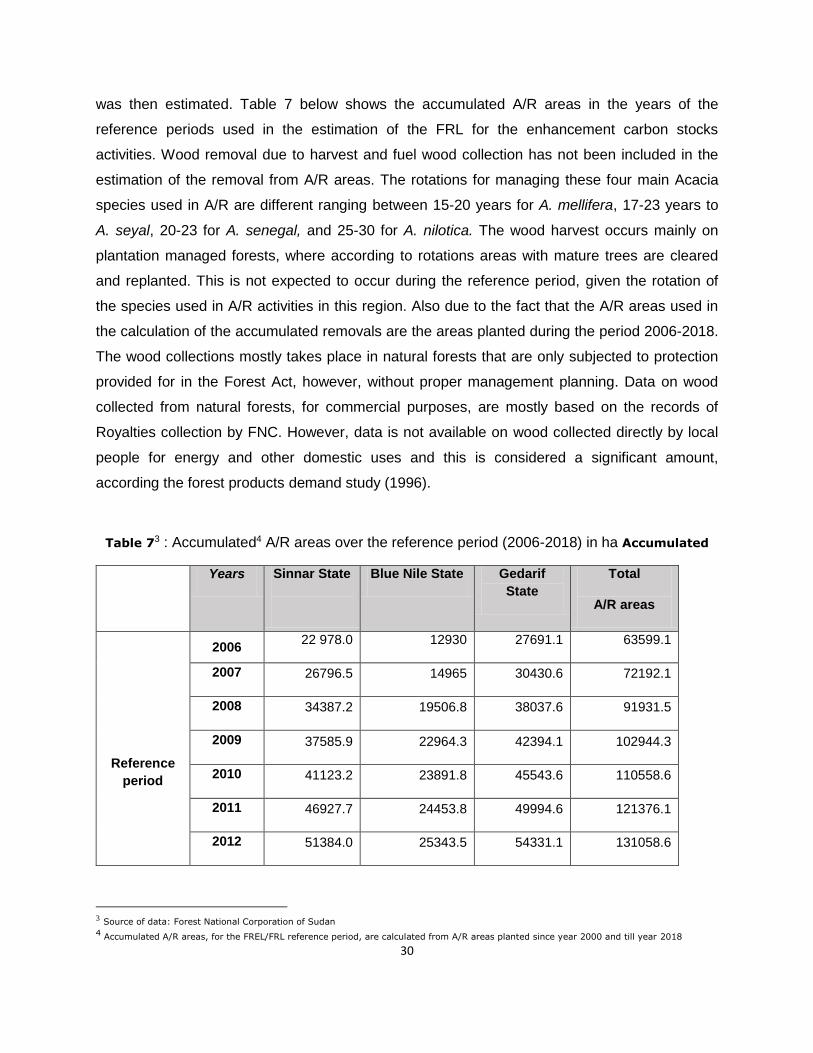
was then estimated. Table 7 below shows the accumulated A/R areas in the years of the
reference periods used in the estimation of the FRL for the enhancement carbon stocks
activities. Wood removal due to harvest and fuel wood collection has not been included in the
estimation of the removal from A/R areas. The rotations for managing these four main Acacia
species used in A/R are different ranging between 15-20 years for A. mellifera, 17-23 years to
A. seyal, 20-23 for A. senegal, and 25-30 for A. nilotica. The wood harvest occurs mainly on
plantation managed forests, where according to rotations areas with mature trees are cleared
and replanted. This is not expected to occur during the reference period, given the rotation of
the species used in A/R activities in this region. Also due to the fact that the A/R areas used in
the calculation of the accumulated removals are the areas planted during the period 2006-2018.
The wood collections mostly takes place in natural forests that are only subjected to protection
provided for in the Forest Act, however, without proper management planning. Data on wood
collected from natural forests, for commercial purposes, are mostly based on the records of
Royalties collection by FNC. However, data is not available on wood collected directly by local
people for energy and other domestic uses and this is considered a significant amount,
according the forest products demand study (1996).
Table 73 : Accumulated4 A/R areas over the reference period (2006-2018) in ha Accumulated
Years Sinnar State
Blue Nile State Gedarif
State
Total
A/R areas
Reference
period
2006 22 978.0 12930 27691.1 63599.1
2007 26796.5 14965 30430.6 72192.1
2008 34387.2 19506.8 38037.6 91931.5
2009 37585.9 22964.3 42394.1 102944.3
2010 41123.2 23891.8 45543.6 110558.6
2011 46927.7 24453.8 49994.6 121376.1
2012 51384.0 25343.5 54331.1 131058.6
3 Source of data: Forest National Corporation of Sudan 4 Accumulated A/R areas, for the FREL/FRL reference period, are calculated from A/R areas planted since year 2000 and till year 2018
31
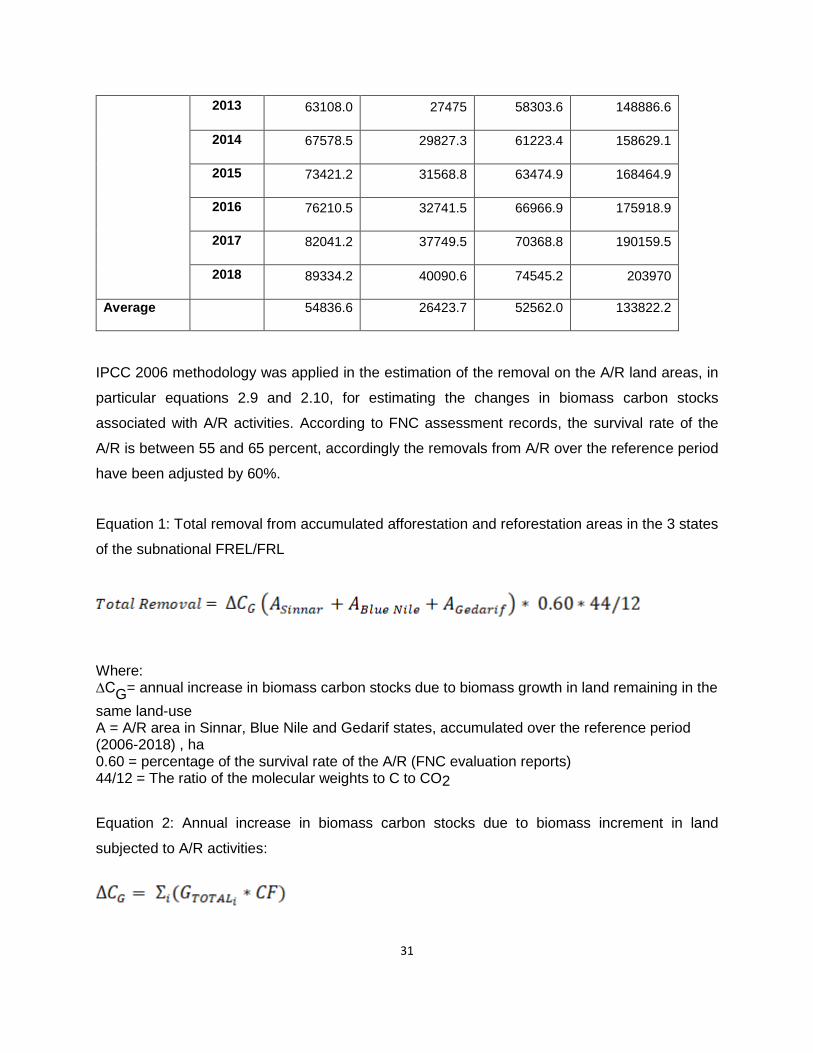
2013 63108.0 27475 58303.6 148886.6
2014 67578.5 29827.3 61223.4 158629.1
2015 73421.2 31568.8 63474.9 168464.9
2016 76210.5 32741.5 66966.9 175918.9
2017 82041.2 37749.5 70368.8 190159.5
2018 89334.2 40090.6 74545.2 203970
Average 54836.6 26423.7 52562.0 133822.2
IPCC 2006 methodology was applied in the estimation of the removal on the A/R land areas, in
particular equations 2.9 and 2.10, for estimating the changes in biomass carbon stocks
associated with A/R activities. According to FNC assessment records, the survival rate of the
A/R is between 55 and 65 percent, accordingly the removals from A/R over the reference period
have been adjusted by 60%.
Equation 1: Total removal from accumulated afforestation and reforestation areas in the 3 states
of the subnational FREL/FRL
Where: ∆CG= annual increase in biomass carbon stocks due to biomass growth in land remaining in the
same land-use A = A/R area in Sinnar, Blue Nile and Gedarif states, accumulated over the reference period (2006-2018) , ha 0.60 = percentage of the survival rate of the A/R (FNC evaluation reports) 44/12 = The ratio of the molecular weights to C to CO2
Equation 2: Annual increase in biomass carbon stocks due to biomass increment in land
subjected to A/R activities:
32
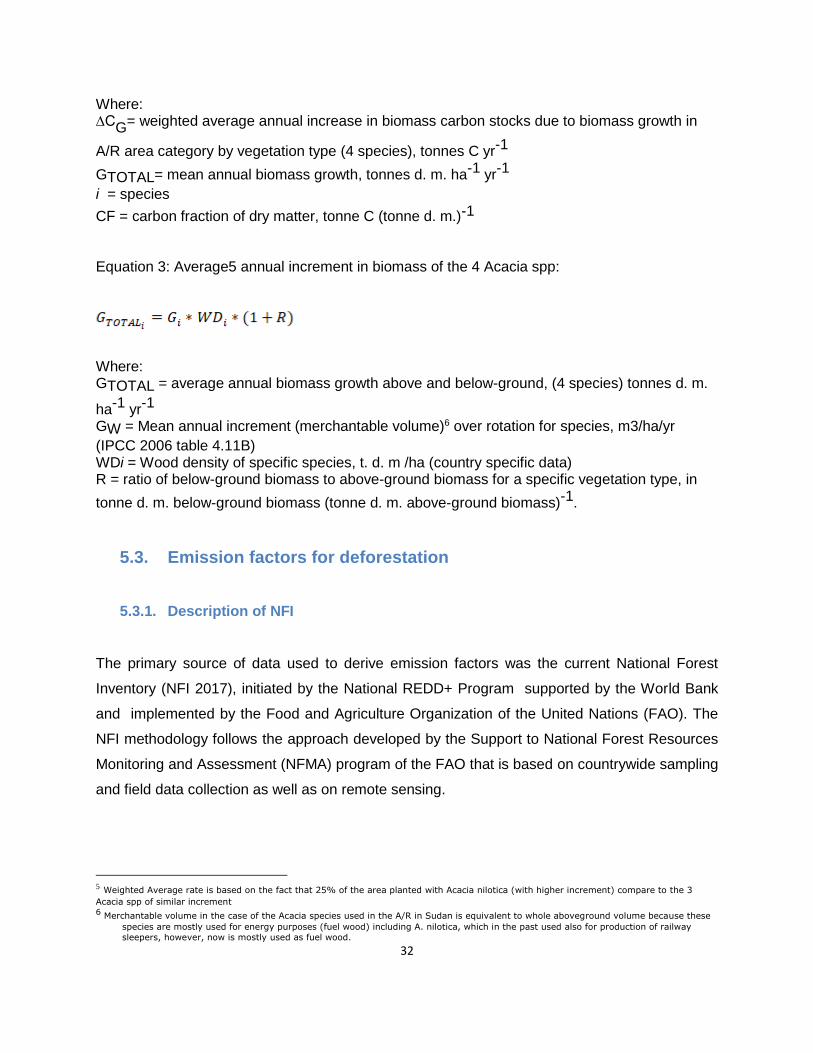
Where: ∆CG= weighted average annual increase in biomass carbon stocks due to biomass growth in
A/R area category by vegetation type (4 species), tonnes C yr-1
GTOTAL= mean annual biomass growth, tonnes d. m. ha-1 yr-1
i = species
CF = carbon fraction of dry matter, tonne C (tonne d. m.)-1
Equation 3: Average5 annual increment in biomass of the 4 Acacia spp:
Where: GTOTAL = average annual biomass growth above and below-ground, (4 species) tonnes d. m.
ha-1 yr-1 GW = Mean annual increment (merchantable volume)6 over rotation for species, m3/ha/yr
(IPCC 2006 table 4.11B)
WDi = Wood density of specific species, t. d. m /ha (country specific data) R = ratio of below-ground biomass to above-ground biomass for a specific vegetation type, in
tonne d. m. below-ground biomass (tonne d. m. above-ground biomass)-1.
5.3. Emission factors for deforestation
5.3.1. Description of NFI
The primary source of data used to derive emission factors was the current National Forest
Inventory (NFI 2017), initiated by the National REDD+ Program supported by the World Bank
and implemented by the Food and Agriculture Organization of the United Nations (FAO). The
NFI methodology follows the approach developed by the Support to National Forest Resources
Monitoring and Assessment (NFMA) program of the FAO that is based on countrywide sampling
and field data collection as well as on remote sensing.
5 Weighted Average rate is based on the fact that 25% of the area planted with Acacia nilotica (with higher increment) compare to the 3
Acacia spp of similar increment 6 Merchantable volume in the case of the Acacia species used in the A/R in Sudan is equivalent to whole aboveground volume because these
species are mostly used for energy purposes (fuel wood) including A. nilotica, which in the past used also for production of railway
sleepers, however, now is mostly used as fuel wood.

33
5.3.2. Stratification
Different maps and dataset have been used to create not-overlapping strata in the GIS
environment. The base map is the Aridity zones from CGIAR-CSI to derive the main zones in
the country (according to precipitation and evapotranspiration factors). The aridity zones map
elaborated by CGIAR-CSI7 (in the context of land suitability analysis to delineate CDM-AR
suitable areas8) was used to capture the main country landscapes, characterized by a climate
that ranges from hyper-arid in the north to tropical wet-and dry in the far southwest.
Methodology is well documented in Zomer et al., 2006, 2007 and 2008. A further division of the
second strata was possible applying Africover 2000 and Harrison and Jackson (1958) maps. To
the resulting four strata, a separate fifth strata was assigned to the main rivers and selected
streams. To make a sharp division between semi-arid zone and savanna Harrison and Jackson
(1958) and Africover (2000) have been overlaid and a manual editing (splitting) of the original
strata carried out. Another refinement of the third stratum regards the Xeric Woodland ecoregion
(according to WWF) on the west, analysed and drafted using very high resolution images
(VHRI). As regard the river layer, a separate shapefile has been used and database with rivers
names completed with the knowledge of the colleagues in the field where buffer of 1.5 km has
been created. The river (polyline) shapefile has been rasterized and polygonised to be erased
from the buffer layer, in order to mask out water. The final result has been integrated in the
original layer and dissolve has been applied, after removing sliver polygons in the fifth strata.
The resulting map used for stratification is shown in Figure 7 and description of the Strata and
corresponding areas are found in Table 8 and Annex 4.
.
7 http://www.cgiar-csi.org/data/global-aridity-and-pet-database 8 The CDM allows for a small percentage of emission reduction credits to come from reforestation and afforestation (CDM-AR).

34
Table 8 Description of the Strata
Stratum Description Area (ha) Area (%)
I The stratum that mostly comprised Deserts 67,327,512 36
II The stratum characterized by semi-desert ecosystems (e.g. few Acacia trees and thorny bushes and zerophytes)
38,802,725 21
III The stratum indicated as ‘Low rainfall woodland Savannah’ by Harrison and Jackson (1958)
35,695,771 19
IV This stratum includes semi-arid, dry sub-humid, humid aridity zones. Forest and Woodland vegetation is mostly found here.
42,743,777 23
V
This stratum includes rivers and streams. It is probably the most heterogeneous since it is the stratum where human activities are dominated and patch of vegetation (natural and not) found as riverine vegetation. This layer cross all the latitudes of the country.
2,438,969 1
5.3.3. Sampling Design
The sampling design adopted for the NFMA in Sudan was systematic. Sampling units selected
at the intersection of every degree of the latitude longitude grid. The number of sampling units
(SU) or tracts to be surveyed is determined by the required statistical reliability of the data, the
Figure 7 The map with the resulted five strata and their corresponding
areas

35
available financial and human resources for the assessment, and with a view to enabling
periodic monitoring. Sample units (SU) were allocated to each stratum according to their
vegetation density as shown in table 9 and figure 8 below. Based on FREL/FRL team
recommendations, sample intensification has been done in strata 3 and 4 where most of the
forest lands is located, 732 new samples were added in the areas between the original sample
units. The NFI team made a plan based on available resources and location forest lands, to
visit 968 SUs out of 1755 SUs. The plan focuses mostly on strata 4 and 3, it does not include
strata 1 (desert) and includes only 23 SUs in strata 2 (mostly grass crop, bare lands). Each SU
has an area of 1 km2 and is composed of 4 plots (with cumulative plot area of 2 ha), see
ANNEX 3. Out of the 968 planned SU, 784 accessible ones containing a total of 3,132 sample
plots were visited. About 42,217 trees and 1800 stumps were recorded and analyzed, and 9
field crews had surveyed a cumulative area of 1,461.51 ha in 22 months.
Table 9 Sample Units, their distribution and actual measurements
Strata Area in Km Intervals in m Number of
Sample
Units (SUs)
Planned and
actual number of
SUs visited
1 676741.6 Base Line 80,000 107 0
Survey Line 80,000
2
389852.79 Base Line 80,000 123 23
Survey Line 40,000
3a 359723.1 Base Line 40,000 431 161
3b Survey Line 20,000
4a 431459. Base Line 20,000 1065 755
4b Survey Line 20,000
5 28292.3 Random 29 29
Total 1755 968 Planned
784 Actual
184 Inaccessible
36
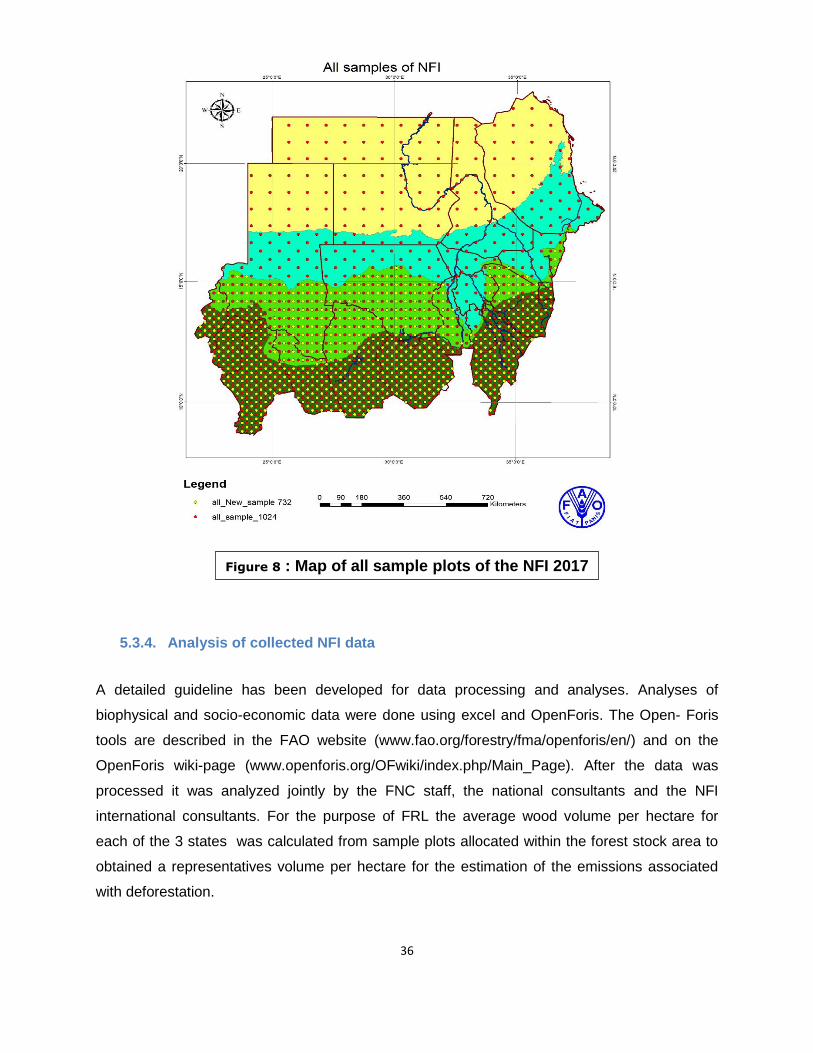
5.3.4. Analysis of collected NFI data
A detailed guideline has been developed for data processing and analyses. Analyses of
biophysical and socio-economic data were done using excel and OpenForis. The Open- Foris
tools are described in the FAO website (www.fao.org/forestry/fma/openforis/en/) and on the
OpenForis wiki-page (www.openforis.org/OFwiki/index.php/Main_Page). After the data was
processed it was analyzed jointly by the FNC staff, the national consultants and the NFI
international consultants. For the purpose of FRL the average wood volume per hectare for
each of the 3 states was calculated from sample plots allocated within the forest stock area to
obtained a representatives volume per hectare for the estimation of the emissions associated
with deforestation.
Figure 8 : Map of all sample plots of the NFI 2017

37
Tree density, Basal area and Regeneration count: The number of stems, basal area per ha and regeneration count were computed using standard
procedures.
Volume:
The tree volumes have been divided into commercial volume and gross volume according to
measured commercial height and total height of trees (NFI field manual).
The Gross Tree Volume has been calculated as:
V=Dbh²/4*π²*Htot*ff
Where
Dbh = Tree Diameter at breast height
Htot = Tree total Height
Π = 3.1416
Ff = Default form factor
The Commercial Tree stem Volume has been calculated as:
V=Dbh²/4*π²*Htot*ff
Where
Dbh = Tree Diameter et breast height
Htot = Tree bole Height
Π = 3.1416
ff = Default form factor
Form Factors: Values in table below are based on expert judgment depending on regional and
national studies, the NFI team and experts decided on the form factors values to be used as
related to LUCS as follow:
TYPE Form factors
Trees Branches Stumps
Forest 0.5 0. 5 0.45
Other woodland 0.50 0. 5 0.45
Other land 0.45 0. 5 0.40
Inland water 0.45 0. 5 0.40

38
5.3.5. Results and proposed emission factors
Sudan applies methods of the IPCC 2006 guideline for estimation of the emission factors for
deforestation in the three states of the FRL. In particular equation 2.15 of Chapter two, with
country-specific data of stock density (V/ha) in the initial land use obtained from the NFI 2017
and country specific data on wood density, in addition to the IPCC 2006 default data for root
shoot ratio (section 4.5, table 4.4). Carbon stocks in biomass immediately after conversion
(BAFTER) are assumed to be zero, since the land is cleared of all vegetation before it is turned
into other land uses, in the case of this region the change is mostly to annual crops cultivation.
Therefore, change in biomass of annual crops, in subsequent years, is also considered zero
because carbon gains in biomass from annual growth are offset by losses from harvesting, and
there is no good quality data available to estimate soil carbon stock in general in Sudan
including this region.
Equation 1: Average change in biomass carbon stock on forestland converted to other land use
Where:
∆CB= change in carbon stocks in biomass on land converted to other land-use category, in
tonnes C /ha
∆CG= annual increase in carbon stocks in biomass due to growth on land converted to another
land-use category, in tonnes C yr-1
∆CCONVERSION = initial change in carbon stocks in biomass on land converted to other land-
use category, in tonnes C/ha
∆CL = annual decrease in biomass carbon stocks due to losses from harvesting, fuel wood
gathering and disturbances on land converted to other land-use category, in tonnes C/ha
(assumed equal to zero)
Equation 2: Initial carbon stock on forest land after conversion to another land use

39
Where:
∆CCONVERSION = initial change in biomass carbon stocks on land converted to another land
category, tonnes C/ha
BAFTERi = biomass stocks on land type i immediately after the conversion, tonnes d.m/ ha
(assumed equal zero)
BBEFOREi = biomass stocks on land type i before the conversion, tonnes d.m/ ha-1
VAG = above ground biomass m3 /ha
WD= wood density t. d. m /ha
CF = carbon fraction of dry matter, tonne C (tonnes d.m.)-1
i = species
Table 10 Emission factors for deforestation
: States Average
growing volume
Wood9 density
Root-shoot Ratio
Carbon Fraction of dry matter
Carbon stock
Emission Factor
m 3 / ha t. d.m/m3 R t C / ha t CO2 / ha
Bule Nile 11.9 0.7 0.56 0.47 6.1 22.4
Gendarif 2.9 0.7 0.56 0.47 1.5 5.5
Sinnar 9.2 0.7 0.56 0.47 4.7 17.3
5.4. Removal factor for enhancement of forest carbon stocks:
In the estimation of the removals associated with the carbon stocks enhancement activities,
Sudan applied country specific wood density values and default IPCC 2006 data for root-shoot
ratio (section 4.5, table 4.4) and IPCC data on mean annual increment (section 4.5, table 4.11B)
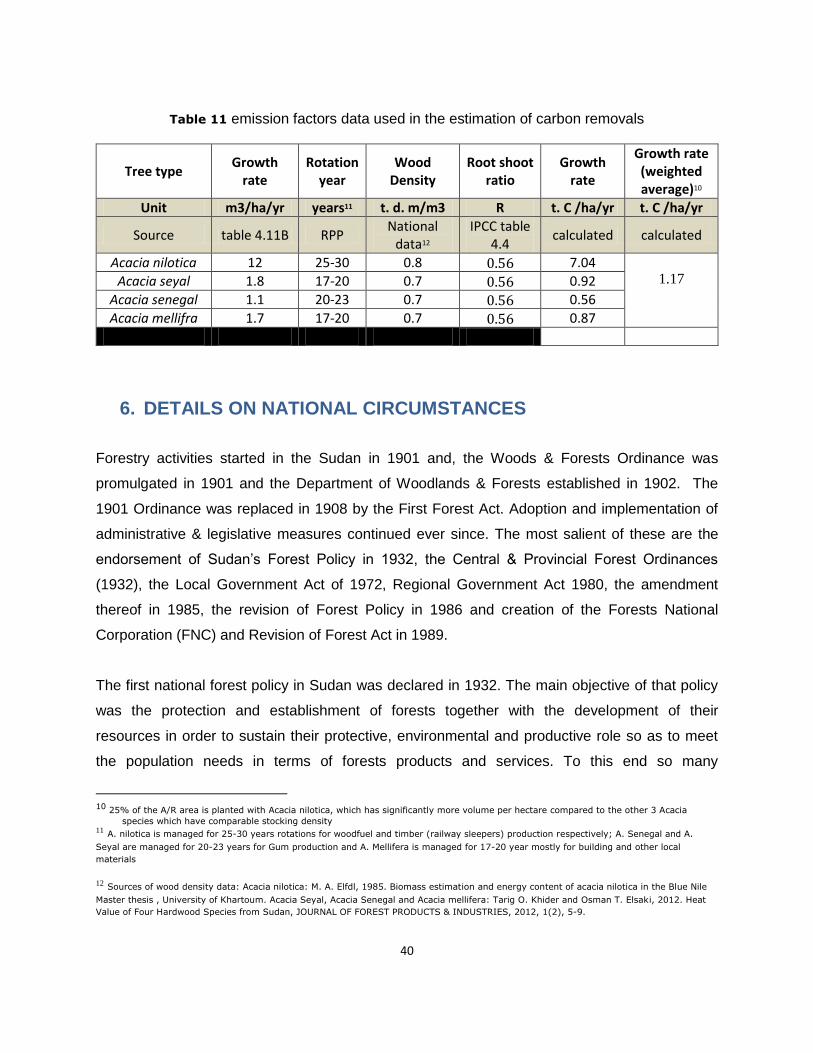
for the four species used in A/R. Table 11 shows the emission factors data used in the
estimation of carbon removals in A/R activities.
9 Average wood density of eleven dominant species see ANNEX 4
40
Table 11 emission factors data used in the estimation of carbon removals
Tree type Growth
rate Rotation
year Wood
Density Root shoot
ratio Growth
rate
Growth rate (weighted average)10
Unit m3/ha/yr years11 t. d. m/m3 R t. C /ha/yr t. C /ha/yr
Source table 4.11B RPP National
data12 IPCC table
4.4 calculated calculated
Acacia nilotica 12 25-30 0.8 0.56 7.04
1.17
Acacia seyal 1.8 17-20 0.7 0.56 0.92
Acacia senegal 1.1 20-23 0.7 0.56 0.56
Acacia mellifra 1.7 17-20 0.7 0.56 0.87
6. DETAILS ON NATIONAL CIRCUMSTANCES
Forestry activities started in the Sudan in 1901 and, the Woods & Forests Ordinance was
promulgated in 1901 and the Department of Woodlands & Forests established in 1902. The
1901 Ordinance was replaced in 1908 by the First Forest Act. Adoption and implementation of
administrative & legislative measures continued ever since. The most salient of these are the
endorsement of Sudan’s Forest Policy in 1932, the Central & Provincial Forest Ordinances
(1932), the Local Government Act of 1972, Regional Government Act 1980, the amendment
thereof in 1985, the revision of Forest Policy in 1986 and creation of the Forests National
Corporation (FNC) and Revision of Forest Act in 1989.
The first national forest policy in Sudan was declared in 1932. The main objective of that policy
was the protection and establishment of forests together with the development of their
resources in order to sustain their protective, environmental and productive role so as to meet
the population needs in terms of forests products and services. To this end so many
10 25% of the A/R area is planted with Acacia nilotica, which has significantly more volume per hectare compared to the other 3 Acacia
species which have comparable stocking density 11 A. nilotica is managed for 25-30 years rotations for woodfuel and timber (railway sleepers) production respectively; A. Senegal and A.
Seyal are managed for 20-23 years for Gum production and A. Mellifera is managed for 17-20 year mostly for building and other local
materials
12 Sources of wood density data: Acacia nilotica: M. A. Elfdl, 1985. Biomass estimation and energy content of acacia nilotica in the Blue Nile
Master thesis , University of Khartoum. Acacia Seyal, Acacia Senegal and Acacia mellifera: Tarig O. Khider and Osman T. Elsaki, 2012. Heat
Value of Four Hardwood Species from Sudan, JOURNAL OF FOREST PRODUCTS & INDUSTRIES, 2012, 1(2), 5-9.
41
approaches and scientific techniques and administrative procedures have been followed in
order to assign responsibilities to central and state level institutions regarding the management
of forest resources.
The 1932 Forest Policy was reviewed in (1986) and the new policy encourages forest
reservation and conservation and community and private sector participation in forestry
development and management. The Forest Policy 1986 also responded to the new concepts
and approaches of forest managements, which emphasis environmental protection, popular
participation and multiple purposes forest management. The 1986 forest policy recognizes new
forms of forest tenure including private, community, and institutional forests. Sets a target of
20% of the area of the country as forest reserves. It stresses the role of forests in environmental
protection by creating new obligations in semi-mechanized farming or irrigated area to maintain
or establish green belts. It emphasizes the role of public participation and community integration
in afforestation and sustainable management of forests. It also recognizes the role of research
in forest development and emphasizes the role of forest extension.
The current forest act is the Forests and Renewable Natural Resources Act 2002. It promotes
an intersectoral approach to natural resources management involving forests, range and
pasture and agriculture. The act supports agroforestry and includes a requirement for 5% of
irrigated agricultural land to be planted with trees and 10% of rainfed agricultural land to be
planted with trees. The Act recognises three categories of forest ownership – private,
community and institutional but places all types of registered forests under the technical
supervision of the FNC. It recognises the role of the native administration and traditional leaders
and local communities and it recognises the multiple uses of trees and forests and usufruct
rights of communities living around forest reserves.
Sudan 2006 National Forest policy Statement, developed through technical support of FAO, is
the recent update of Sudan's Forestry Policy1986. The 2006 policy statement, made important
changes in forest development and management. As it incorporates objectives of poverty
reduction and amelioration of physical environment and combating desertification. Other policies
forest related include Water Policy, Forest Outlook, Sudan’s Commitment to Social
Development and Population Policy.
42
The Comprehensive National Strategies (CNS 1992 – 2002 and 2003 - 2027) are both
concerned with the importance of forestry in environmental conservation and as a source of
goods and services for the country and local communities. The CNS supported an increase in
forest cover, range and nature reserves to an area equivalent to 25% of Sudan area. Since
1992, Sudan also put in place several strategies, policies and programmes aimed at sustainable
development including the forest sector. These include:
The National Comprehensive Strategy (1992 – 2002 & 2003-2027)
The Natural Resources Strategy (2003-2027)
Sudan's Forest Products Strategy (2003- 2027)
National Action Plan to combat Desertification (2003),
Sudan Intended Nationally Determined Contribution (2015)
National Biodiversity Strategy and Action Plan (2001, 2017),
National Adaptation Plan (NAP 2016)
It can be concluded that the conservation and enhancement of the forest cover is a priority of
the Government of Sudan as stated in the constitution and Forest & Environmental and related
policies where, FNC and other related institutions obliged to work and achieve forest land area
and tree cover of 20% percent of the total country area by 2027.
7. PROPOSED FRL
Sudan’s first subnational FRL is constructed based on two main significant REDD+ activities,
Deforestation and Enhancement of Forest Carbon Stocks. The selected historical reference
period of 2006 – 2018, considered representative of the effect of relevant policies and
development in national circumstances on forest land including implementation of A/R activities.
2006 IPCC Guidelines for national GHGs inventory, with country specific data on changes in
forest stock from NFI 2017 and wood density, in addition to IPCC defaults were applied.
Afforestation and reforestation data was obtained from the annual records of the FNC state
offices. The activity data for Deforestation was developed using Remote Sensing data on
detection of changes in forest area in three (3) change assessment points during the reference
43
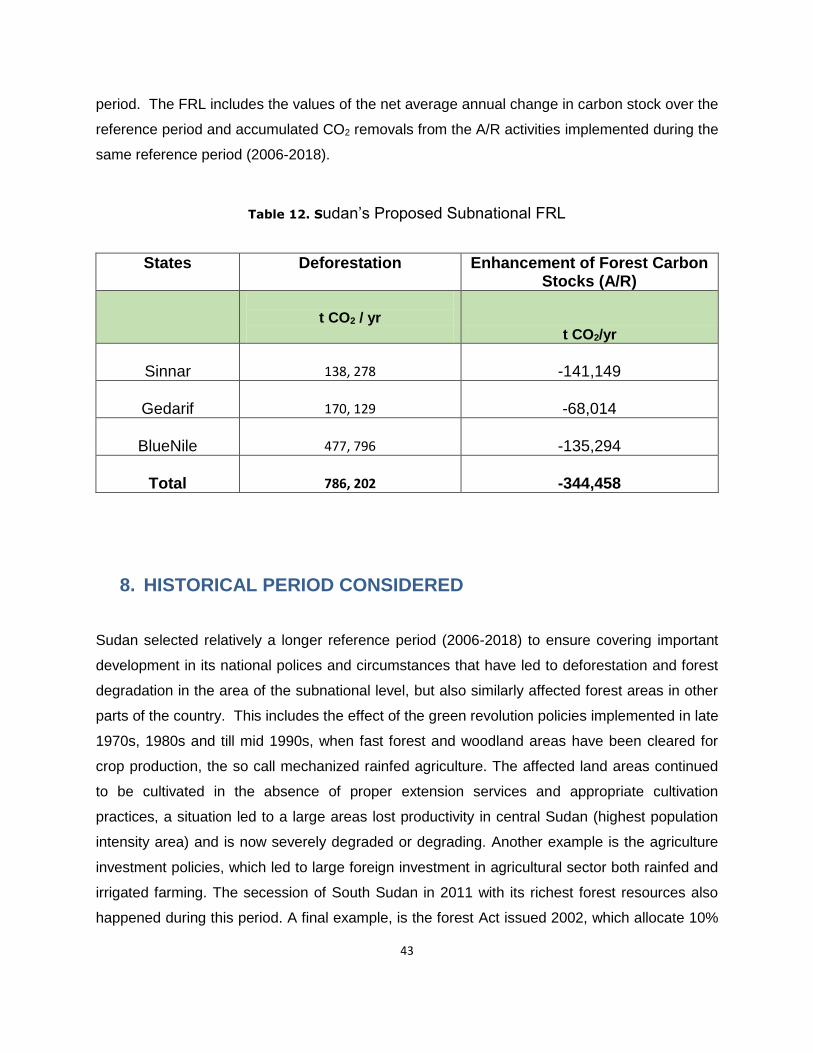
period. The FRL includes the values of the net average annual change in carbon stock over the
reference period and accumulated CO2 removals from the A/R activities implemented during the
same reference period (2006-2018).
Table 12. Sudan’s Proposed Subnational FRL
States Deforestation Enhancement of Forest Carbon Stocks (A/R)
t CO2 / yr
/yr2t CO
Sinnar 138, 278 -141,149
Gedarif 170, 129 -68,014
BlueNile 477, 796 -135,294
Total 786, 202 -344,458
8. HISTORICAL PERIOD CONSIDERED
Sudan selected relatively a longer reference period (2006-2018) to ensure covering important
development in its national polices and circumstances that have led to deforestation and forest
degradation in the area of the subnational level, but also similarly affected forest areas in other
parts of the country. This includes the effect of the green revolution policies implemented in late
1970s, 1980s and till mid 1990s, when fast forest and woodland areas have been cleared for
crop production, the so call mechanized rainfed agriculture. The affected land areas continued
to be cultivated in the absence of proper extension services and appropriate cultivation
practices, a situation led to a large areas lost productivity in central Sudan (highest population
intensity area) and is now severely degraded or degrading. Another example is the agriculture
investment policies, which led to large foreign investment in agricultural sector both rainfed and
irrigated farming. The secession of South Sudan in 2011 with its richest forest resources also
happened during this period. A final example, is the forest Act issued 2002, which allocate 10%
44
of the rainfed agricultural schemes and 5% of the irrigated agricultural farms to forestry. Given
the development in national policies and circumstances in the country as indicated above, and
also taking into consideration the guidance from UNFCCC, FCPF and REDD+ financing
communities (e.g. GCF) Sudan selected a reference period of 13 years starting 2006 and
ending 2018 when REDD+ programme has started its implementation phase.
9. ADJUSTMENT FOR NATIONAL CIRCUMSTANCES
Sudan’s current forest and related policies development framework is considered conducive for
REDD+ implementation. However, future reforms in the current forest and related policies are
also underway as a result of the outcomes of the REDD+ readiness programme. The reference
period selected for this subnational FREL/FRL, is considered representative in terms of
capturing the effect of the development in forest and related policies and regulations.
Accordingly Sudan does see the need to future undertake an adjustment to the propose
FREL/FRL in this submission. However, further work on the effects of policy development on
forest management and implementation of REDD+ activities will be studied in the future
submission of the national FREL/FRL.
10. UPDATING FREQUENCY
The sub-national FREL/FRL is planned to be updated as part of the development on the
national FREL/FRL, in line with the expected development in the activity data and other
parameters based on the completion of the NFI and the work currently undertaken by the
REDD+ readiness programme and the national inventory team of Higher Council for
Environment and Natural Resources (HCENR). Also updating of the FREL/FRL is expected
based on experiences gained and improvements in the methods used and their application.
Further updates in future will depend on the development on NFI, remote sensing and related
research data, in addition to the development in the international guidance, methods and
standards.
45
11. FUTURE IMPROVEMENTS
Sudan followed a stepwise approach as guided the UNFCCC decisions and started at the
subnational level in order to develop required knowledge, experience, resources and capacities
within its national institutions. The experience gained in the preparation of the current
FREL/FRL, reveal the need to improve application of methods and tools, activity data, emission
factors and other parameters to inform and improve the development of the national FREL/FRL.
11.1. Improvement of Activity Data
The activity data (AD) used in the construction of the present sub national FREL/FRL was
based on the accessible remote sensing data and technologies, current institutional capacities
and expertise. The US sanctions, hindered Sudan ability to access and utilize cost-effective,
high-resolution imageries that could have further improved the quality of the activity data.
However, this situation is expected to improve after the current political change in Sudan and
expected to result in a better access to advanced technology in remote sensing.
Specific activities will be planned for the improvement of AD, including provision of high
resolution imageries, establishment of permanent sample plots network (land trothing),
strengthening the capacity of the staff, providing technical support on the up-to-date remote
sensing and GIS technology and their application in forest monitoring in order to provide high
quality data and information for future national FREL submission. Sudan also planning to use
advanced remote sensing technologies such as RADAR and LIDAR for biomass estimation.
11.2. Improvement of Emission Factors
The emission factors and other parameters used in this submission were derived from the
ongoing National Forest Inventory (NFI 2017) and available published data. NFI (2017), which is
still being finalized, provides a good opportunity though establishing permanent sample plots
network all over the country, to improve the available field data. The network of permanent plots
are distributed in a grid across the country and will be assessed on a regular cycle of
measurements, thus enabling a time-series database to be established. Measurements will
provide accurate data including on stand volume, biomass, increment, and tree species in
46
addition to site productivity and biological diversity. Moreover, country specific allometric
equations to calculate biomass and volume will be developed to increase accuracy of volume
estimates. The ongoing project on NFI is also planning to develop country specific parameters
such as wood density and root shoot ratio for number of dominant tree species in the country.
11.3. Inclusion of other REDD+ Activities
This FREL/FRL submission covers only two activities: deforestation and enhancement of carbon
stocks (A/R), other REDD+ activities are not yet covered, mainly because of lack of data. Forest
degradation is a significant REDD+ activity in Sudan, however, it was not included in this
submission. For assessing deforestation used accessible historical Landsat images (TM, ETM,
OLI 30 m and SPOT 20 m) to create land-cover maps that are suitable for detection of
deforestation with good accuracy. However, these are not suitable to monitoring forest
degradation with the same level of accuracy.
Sudan intends to undertake further work to include forest degradation its national FREL/FRL
through improving relevant national records, developing ground observations data including
through the permanent sample plots established by the recent NFI (2017), and to use very high
spectral and spatial resolution remote sensing data. The role of conservation and sustainable
management (SFM) of forest also has a potential to be included in future improvements of the
national FREL/FRL since these approaches have been introduced in Sudan since 1932
11.4. Inclusion of forest Fires
In the context of Sudan, forest fires are considered important by the REDD+ readiness
programme, However, the effects of forest fires on the forest carbon stocks need to be
understood and estimated in the future. Most of the Acacia species that are dominant in the
forest cover are less affected by forest fires e.g. A. Seyal, however, there are some other
species in natural forests and plantations (e.g Eucalyptus) sensitive to forest fires. Sudan Still
has no comprehensive fire management strategy and the current fire related activities are
limited to opening of fire lines within some forest reserves and protected areas.
In February 2019, in the framework of its REDD+ readiness in Sudan, Food and Agriculture
Organization of the United Nations (FAO) in collaboration with the Forests National Corporation
47
(FNC) and the Remote Sensing & Seismology Authority (RSSA) initiated a series of workshops
targeting the states that are most affected by forest fires including Darfur, Kordofan, and Blue
Nile. The intention of the workshops was to initiate discussions with natural resources
specialists, stakeholder, beneficiaries and local leaders about the current situation of fire
management, as well as means and ways to establish a well-equipped national fire monitoring
system including institutional arrangements. The REDD+ readiness programme initiated work
on forest fire monitoring system, using Remote Sensing techniques, aiming to prepare historic
forest fire maps for the period 2000-2018 in order to identify and visualize forest fire hotspots.
These maps are expected to provide data for inclusion of the effects of forest fires in future
National Forest Reference (Emission) Level and national Greenhouse Gas Inventories.
48
12. REFERENCES
Aamir Osman Ali Elmaleeh, 1996. An approach for study wood supply from Acacia seyal stands
on Gadaref State, A case study: Wad Elkheseid natural forest reserve, A Thesis Submitted for
the Degree of Master of Science in Forestry , University of Khartoum
Abdalla, G., (2019) Draft of Climate Change Mitigation potential od Sudan’s Forestry Sector,
Amado S. Tolentino (1994), Environmental Legislations and Institutions in the Sudan.
Africover, 2012. Sudan Land Cover Atlas
Atta El Moula, M.E., 1985. On the problem of resource management in the Sudan.
institute of Environmental Studies, University of Khartoum. Environmental Monograph No. 4.
Brown, S. and A.E. Lugo, Aboveground biomass estimates for tropical moist forests of the
Brazilian Ama7.on, Intt:rtit:n<ia, 11, 8-18 (1992).
Donna Lee, Margaret Skutch, Marieke Sandker (2018), Challenges with measurement and
accounting of the plus in REDD+
Drivers of Deforestation and Forest Degradation (D O D), 2018. Report for Republic of Sudan
REDD+ Programme, In-depth analysis of Drivers of Deforestation & Forest/Range Degradation
Elmahi, A. G. and Abdel Magid, T. D. (2002) The Role of the Private Sector, Civil Society and
NGOs in the Formulation and Implementation of National Forest Policies and National Forest
Programmes in Sudan, Prepared as a contribution of the Sudan Forests National
Corporation to the Regional Workshop held by FAO/RNE in Khartoum 26-27 January 2002.
GFOI 2016, Integration of remote-sensing and ground-based observations for estimation of
emissions and removals of greenhouse gases in forests: Methods and Guidance from the
Global Forest Observations Initiative, Edition 2.0, Food and Agriculture Organization, Rome
Global Forest Resources Assessment (FRA) 2010. FAO. Rome
49
Hassan O., EL Nour A. (2012), Readiness Preparation Proposal (R-PP), The United Nations
Collaborative Programme on Reducing Emissions from Deforestation and Forest Degradation in
Developing Countries, Sudan
Mahgoub Suliman Mohamedain1, Elmar Csaplovics2, Mohammed H. Mohammed, 2009 .Model
for Estimation of Acacia senegal Volume from NDVI. Tropentag, October 6-8, 2009
“Biophysical and Socio-economic Frame Conditions for the Sustainable Management of Natural
Resources
Republic of Sudan (2015), Intended National Determined Contributions (INDCs)
Sudan’s Readiness Preparation Proposal (R-PP), 2010. Sudan National REDD+ programme
Tarig O. Khider and Osman T. Elsak, 2012. Heat Value of Four Hardwood Species from Sudan
JOURNAL OF FOREST PRODUCTS & INDUSTRIES, 2012, 1(2), 5-9
Mohammed Hamed Mohammed, 2011. Management of natural stands of Acacia seyal Del.
variety seyal (Brenan) for Production of Gum Talha, South Kordofan, Sudan, MSc. Forestry,
University of Khartoum, Sudan
The Open- Foris tools are described in the FAO website
(www.fao.org/forestry/fma/openforis/en/) and on the OpenForis wiki-page
(www.openforis.org/OFwiki/index.php/Main_Page).
FAO 2018, forest and climate change working paper No. 17, form reference level to results
reporting: REDD+ under the UNFCCC 2018 update
FNC/FAO 2017, Manual for integrated field data collection. Adapted from the original Edited by
Anne Branthomme, in collaboration with Dan Altrell, Kewin Kamelarczyk and Mohamed Saket
FAO, Rome, 2012, NFMA Working Paper N° 37/E Rome, 2012
IPCC 2006 Guidelines for National Greenhouse Gases Inventories
http://www.fao.org/fileadmin/user_upload/geospatial/docs/GLCN/GLCN_Internat_partnership_fo
r_harmonized_accessible_LC_data_information.pdf
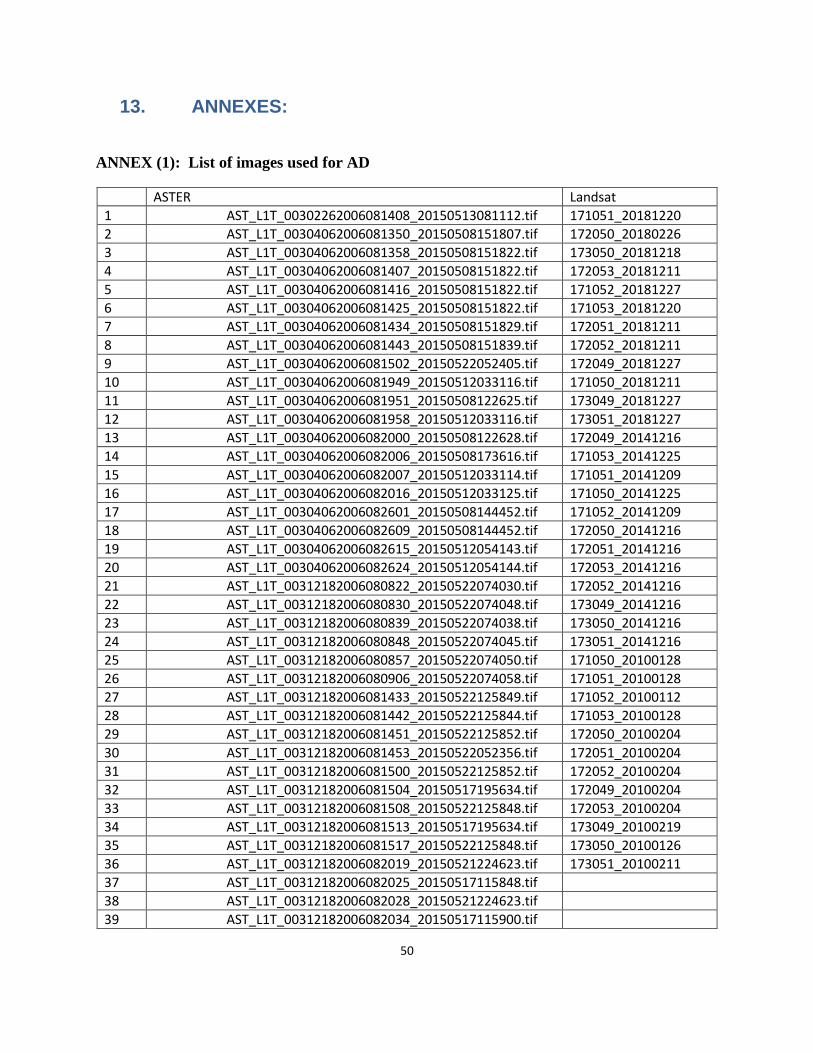
50
13. ANNEXES:
ANNEX (1): List of images used for AD
ASTER Landsat
1 AST_L1T_00302262006081408_20150513081112.tif 171051_20181220
2 AST_L1T_00304062006081350_20150508151807.tif 172050_20180226
3 AST_L1T_00304062006081358_20150508151822.tif 173050_20181218
4 AST_L1T_00304062006081407_20150508151822.tif 172053_20181211
5 AST_L1T_00304062006081416_20150508151822.tif 171052_20181227
6 AST_L1T_00304062006081425_20150508151822.tif 171053_20181220
7 AST_L1T_00304062006081434_20150508151829.tif 172051_20181211
8 AST_L1T_00304062006081443_20150508151839.tif 172052_20181211
9 AST_L1T_00304062006081502_20150522052405.tif 172049_20181227
10 AST_L1T_00304062006081949_20150512033116.tif 171050_20181211
11 AST_L1T_00304062006081951_20150508122625.tif 173049_20181227
12 AST_L1T_00304062006081958_20150512033116.tif 173051_20181227
13 AST_L1T_00304062006082000_20150508122628.tif 172049_20141216
14 AST_L1T_00304062006082006_20150508173616.tif 171053_20141225
15 AST_L1T_00304062006082007_20150512033114.tif 171051_20141209
16 AST_L1T_00304062006082016_20150512033125.tif 171050_20141225
17 AST_L1T_00304062006082601_20150508144452.tif 171052_20141209
18 AST_L1T_00304062006082609_20150508144452.tif 172050_20141216
19 AST_L1T_00304062006082615_20150512054143.tif 172051_20141216
20 AST_L1T_00304062006082624_20150512054144.tif 172053_20141216
21 AST_L1T_00312182006080822_20150522074030.tif 172052_20141216
22 AST_L1T_00312182006080830_20150522074048.tif 173049_20141216
23 AST_L1T_00312182006080839_20150522074038.tif 173050_20141216
24 AST_L1T_00312182006080848_20150522074045.tif 173051_20141216
25 AST_L1T_00312182006080857_20150522074050.tif 171050_20100128
26 AST_L1T_00312182006080906_20150522074058.tif 171051_20100128
27 AST_L1T_00312182006081433_20150522125849.tif 171052_20100112
28 AST_L1T_00312182006081442_20150522125844.tif 171053_20100128
29 AST_L1T_00312182006081451_20150522125852.tif 172050_20100204
30 AST_L1T_00312182006081453_20150522052356.tif 172051_20100204
31 AST_L1T_00312182006081500_20150522125852.tif 172052_20100204
32 AST_L1T_00312182006081504_20150517195634.tif 172049_20100204
33 AST_L1T_00312182006081508_20150522125848.tif 172053_20100204
34 AST_L1T_00312182006081513_20150517195634.tif 173049_20100219
35 AST_L1T_00312182006081517_20150522125848.tif 173050_20100126
36 AST_L1T_00312182006082019_20150521224623.tif 173051_20100211
37 AST_L1T_00312182006082025_20150517115848.tif
38 AST_L1T_00312182006082028_20150521224623.tif
39 AST_L1T_00312182006082034_20150517115900.tif
51
40 AST_L1T_00312182006082043_20150517115900.tif
41 AST_L1T_00312182006082102_20150518034649.tif
42 AST_L1T_00312182006082102_20150518034649.tif
43 AST_L1T_00312182006082110_20150518034649.tif
44 AST_L1T_00312182006082119_20150518034650.tif
45 AST_L1T_00312182006082128_20150518034650.tif
46 AST_L1T_00312252006082634_20150517141449.tif
47 AST_L1T_00312272006081423_20150517144540.tif
48 AST_L1T_00312272006081432_20150517144540.tif
49 AST_L1T_00312272006081441_20150517144536.tif
50 AST_L1T_00312272006081459_20150517144546.tif
51 AST_L1T_00303302006081445_20150513183821.tif
52 AST_L1T_00303302006081454_20150513183821.tif
53 AST_L1T_00303302006081502_20150513183821.tif
54 AST_L1T_00303302006081511_20150513183818.tif
55 AST_L1T_00303302006081520_20150513183831.tif
56 AST_L1T_00304062006081434_20150508101323.tif
57 AST_L1T_00304062006081443_20150508101313.tif
58 AST_L1T_00304062006081452_20150508101323.tif
59 AST_L1T_00304062006082107_20150513205503.tif
60 AST_L1T_00304062006082116_20150513205503.tif
61 AST_L1T_00304062006082659_20150512054144.tif
62 AST_L1T_00304062006082708_20150512054144.tif
63 AST_L1T_00305082006082106_20150514072623.tif
64 AST_L1T_00306042006081425_20150508101323.tif
65 AST_L1T_00310152006082052_20150516151433.tif
66 AST_L1T_00312182006081520_20150522052418.tif
67 AST_L1T_00312182006082109_20150517115900.tif
68 AST_L1T_00312182006082118_20150517115855.tif
69 AST_L1T_00312182006082127_20150517115855.tif
70 AST_L1T_00312182006082136_20150517115904.tif
71 AST_L1T_00312182006082145_20150517115858.tif
72 AST_L1T_00312182006082146_20150518034647.tif
73 AST_L1T_00312182006082153_20150517115859.tif
74 AST_L1T_00312182006082155_20150518034647.tif
75 AST_L1T_00312182006082204_20150518034651.tif
76 AST_L1T_00312182006082204_20150518034651.tif
77 AST_L1T_00312272006081525_20150517144604.tif
78 AST_L1T_00312272006081534_20150517144611.tif
79 AST_L1T_003012182006082212_2015051803465.tif
80 AST_L1T_00304062006082058_20150513205500.tif
81 AST_L1T_00304062006082107_20150513205503.tif
82 AST_L1T_00304062006082624_20150512054144.tif
83 AST_L1T_00310062006082636_20150516120821.tif
84 AST_L1T_00310152006082052_20150516151433.tif
52
85 AST_L1T_00310152006082137_20150518034653.tif
86 AST_L1T_00310152006082146_20150518034647.tif
87 AST_L1T_00310152006082155_20150518034647.tif
88 AST_L1T_00312182006081513_20150517195633.tif
89 AST_L1T_00312182006082052_20150517115900.tif
90 AST_L1T_00312182006082100_20150517115900.tif
91 AST_L1T_00312252006081517_20150522125848.tif
92 AST_L1T_00312252006082633_20150512054144.tif
93 AST_L1T_00312252006082642_20150512054144.tif
94 AST_L1T_00312252006082651_20150512054144.tif
95 AST_L1T_00312252006082701_20150517141500.tif
96 AST_L1T_00312252006082710_20150517141525.tif
97 AST_L1T_00312252006082741_20150520163615.tif
98 AST_L1T_00312252006082750_20150520163615.tif
99 AST_L1T_00312272006081459_20150517144546.tif
100 AST_L1T_00312272006081508_20150517144551.tif
101 AST_L1T_00312272006081517_20150517144604.tif
102 AST_L1T_00312272006081521_20150517195636.tif
103 AST_L1T_00312272006082119_20150518034650.tif
104 AST_L1T_00312272006082128_20150518034650.tif
105 AST_L1T_0012252006082732_20150520163615.tif
106 AST_L1T_00303302006081445_2015051318382.tif
107 AST_L1T_00304062006081502_20150522052405.tif
108 AST_L1T_00304062006081511_20150522052418.tif
109 AST_L1T_00304062006081520_20150522052418.tif
110 AST_L1T_00304062006082049_20150513205500.tif
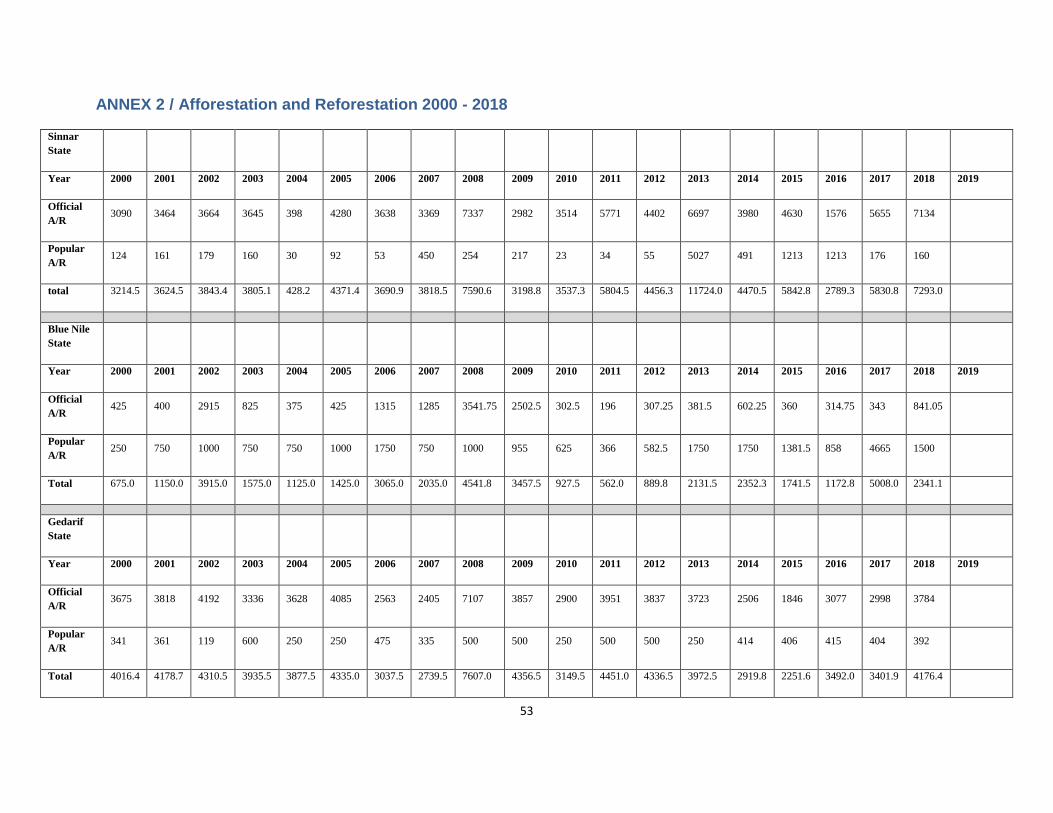
53
ANNEX 2 / Afforestation and Reforestation 2000 - 2018
Sinnar
State
Year 2000 2001 2002 2003 2004 2005 2006 2007 2008 2009 2010 2011 2012 2013 2014 2015 2016 2017 2018 2019
Official
A/R 3090 3464 3664 3645 398 4280 3638 3369 7337 2982 3514 5771 4402 6697 3980 4630 1576 5655 7134
Popular
A/R 124 161 179 160 30 92 53 450 254 217 23 34 55 5027 491 1213 1213 176 160
total 3214.5 3624.5 3843.4 3805.1 428.2 4371.4 3690.9 3818.5 7590.6 3198.8 3537.3 5804.5 4456.3 11724.0 4470.5 5842.8 2789.3 5830.8 7293.0
Blue Nile
State
Year 2000 2001 2002 2003 2004 2005 2006 2007 2008 2009 2010 2011 2012 2013 2014 2015 2016 2017 2018 2019
Official
A/R 425 400 2915 825 375 425 1315 1285 3541.75 2502.5 302.5 196 307.25 381.5 602.25 360 314.75 343 841.05
Popular
A/R 250 750 1000 750 750 1000 1750 750 1000 955 625 366 582.5 1750 1750 1381.5 858 4665 1500
Total 675.0 1150.0 3915.0 1575.0 1125.0 1425.0 3065.0 2035.0 4541.8 3457.5 927.5 562.0 889.8 2131.5 2352.3 1741.5 1172.8 5008.0 2341.1
Gedarif
State
Year 2000 2001 2002 2003 2004 2005 2006 2007 2008 2009 2010 2011 2012 2013 2014 2015 2016 2017 2018 2019
Official
A/R 3675 3818 4192 3336 3628 4085 2563 2405 7107 3857 2900 3951 3837 3723 2506 1846 3077 2998 3784
Popular
A/R 341 361 119 600 250 250 475 335 500 500 250 500 500 250 414 406 415 404 392
Total 4016.4 4178.7 4310.5 3935.5 3877.5 4335.0 3037.5 2739.5 7607.0 4356.5 3149.5 4451.0 4336.5 3972.5 2919.8 2251.6 3492.0 3401.9 4176.4
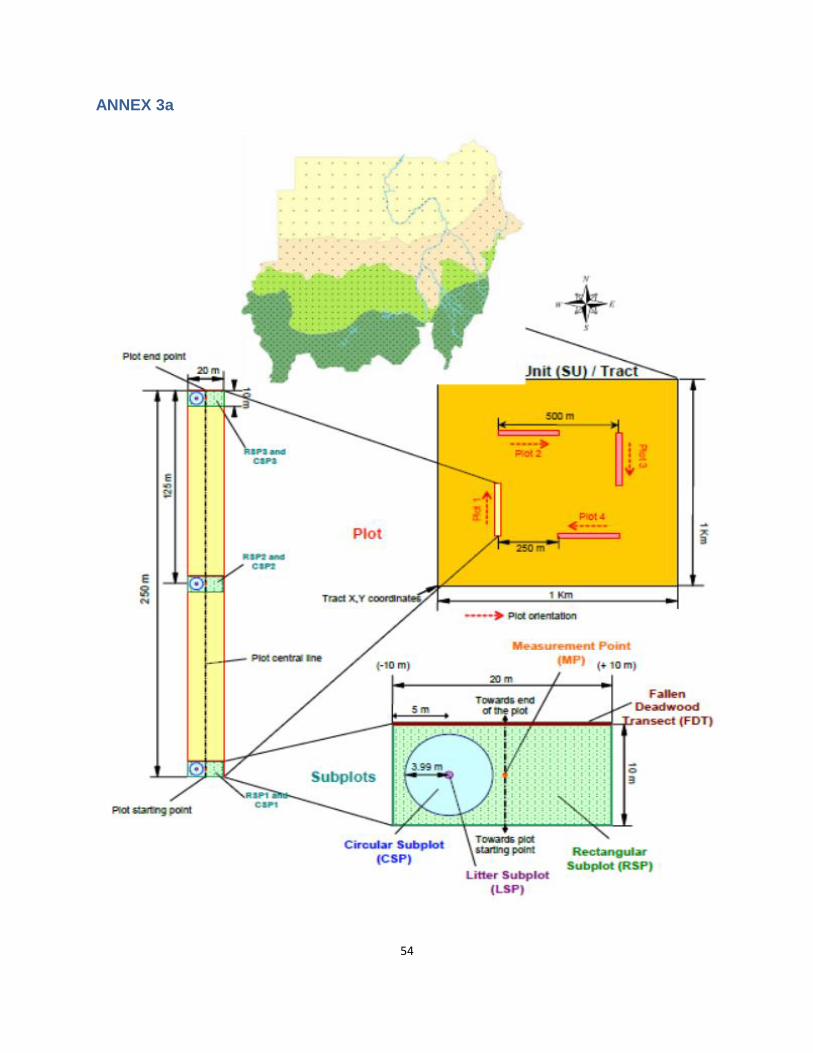
54
ANNEX 3a
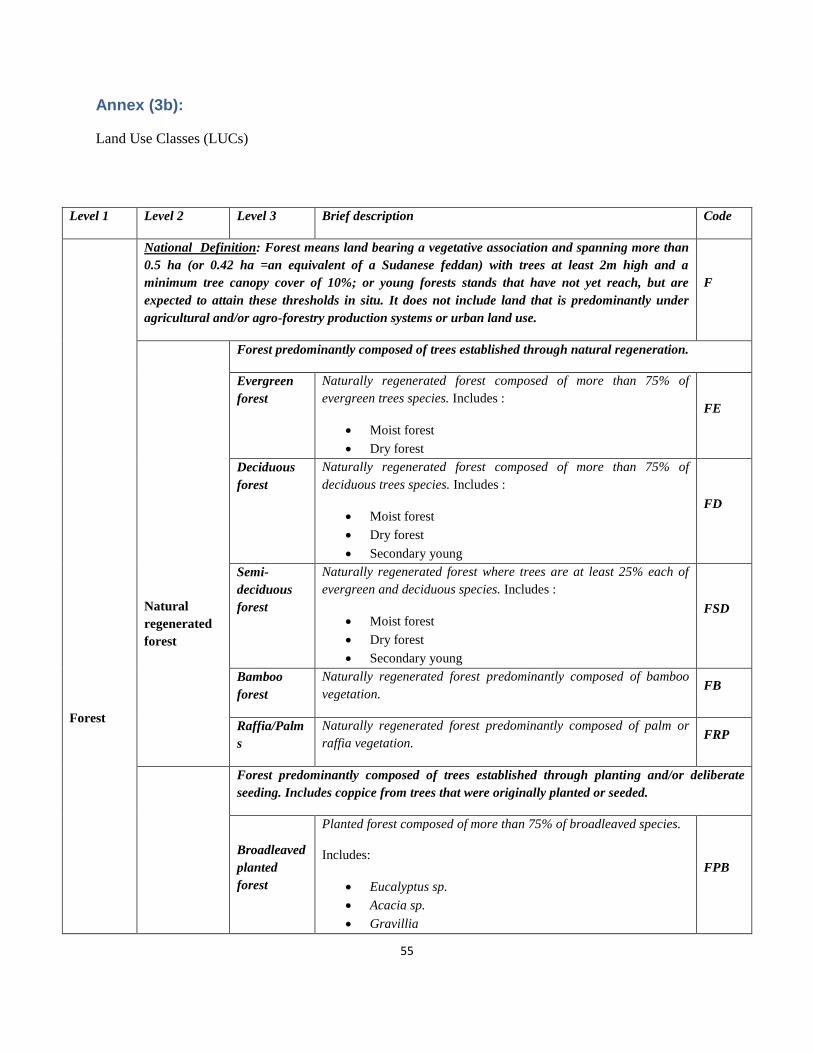
55
Annex (3b):
Land Use Classes (LUCs)
Level 1 Level 2 Level 3 Brief description Code
Forest
National Definition: Forest means land bearing a vegetative association and spanning more than
0.5 ha (or 0.42 ha =an equivalent of a Sudanese feddan) with trees at least 2m high and a
minimum tree canopy cover of 10%; or young forests stands that have not yet reach, but are
expected to attain these thresholds in situ. It does not include land that is predominantly under
agricultural and/or agro-forestry production systems or urban land use.
F
Natural
regenerated
forest
Forest predominantly composed of trees established through natural regeneration.
Evergreen
forest
Naturally regenerated forest composed of more than 75% of
evergreen trees species. Includes :
Moist forest
Dry forest
FE
Deciduous
forest
Naturally regenerated forest composed of more than 75% of
deciduous trees species. Includes :
Moist forest
Dry forest
Secondary young
FD
Semi-
deciduous
forest
Naturally regenerated forest where trees are at least 25% each of
evergreen and deciduous species. Includes :
Moist forest
Dry forest
Secondary young
FSD
Bamboo
forest
Naturally regenerated forest predominantly composed of bamboo
vegetation. FB
Raffia/Palm
s
Naturally regenerated forest predominantly composed of palm or
raffia vegetation. FRP
Forest predominantly composed of trees established through planting and/or deliberate
seeding. Includes coppice from trees that were originally planted or seeded.
Broadleaved
planted
forest
Planted forest composed of more than 75% of broadleaved species.
Includes:
Eucalyptus sp.
Acacia sp.
Gravillia
FPB
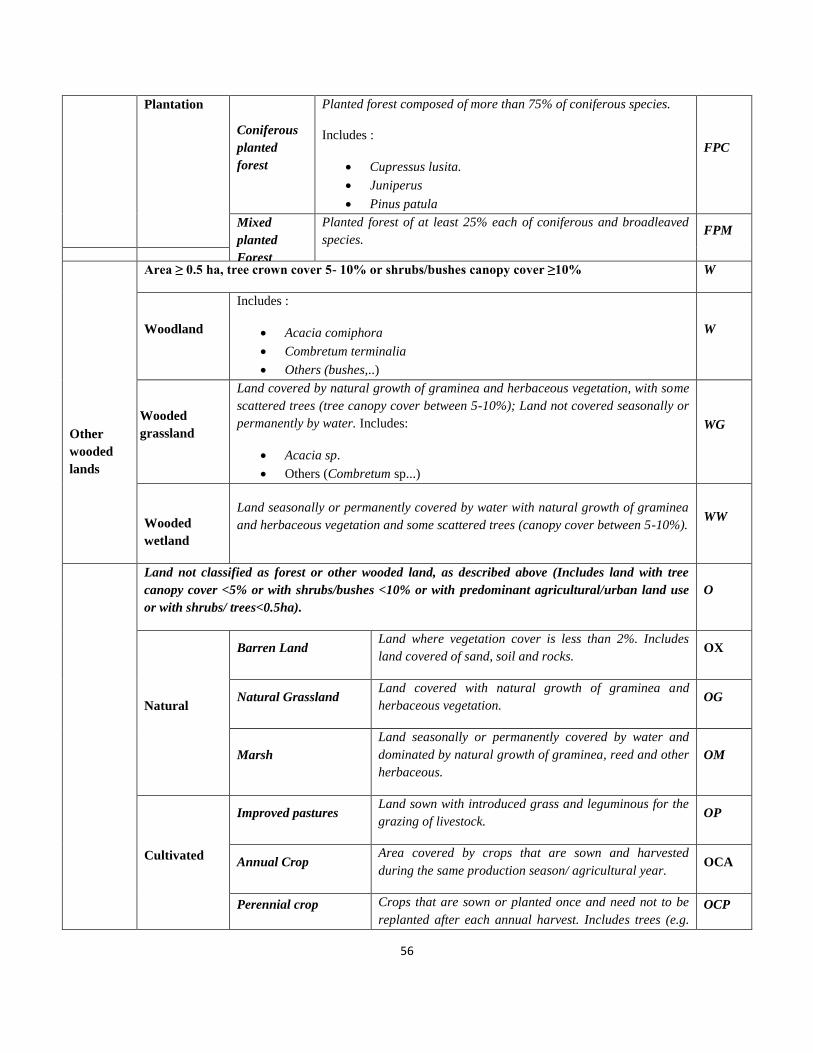
56
Plantation
Coniferous
planted
forest
Planted forest composed of more than 75% of coniferous species.
Includes :
Cupressus lusita.
Juniperus
Pinus patula
FPC
Mixed
planted
Forest
Planted forest of at least 25% each of coniferous and broadleaved
species.
FPM
Other
wooded
lands
Area ≥ 0.5 ha, tree crown cover 5- 10% or shrubs/bushes canopy cover ≥10% W
Woodland
Includes :
Acacia comiphora
Combretum terminalia
Others (bushes,..)
W
Wooded
grassland
Land covered by natural growth of graminea and herbaceous vegetation, with some
scattered trees (tree canopy cover between 5-10%); Land not covered seasonally or
permanently by water. Includes:
Acacia sp.
Others (Combretum sp...)
WG
Wooded
wetland
Land seasonally or permanently covered by water with natural growth of graminea
and herbaceous vegetation and some scattered trees (canopy cover between 5-10%). WW
Land not classified as forest or other wooded land, as described above (Includes land with tree
canopy cover <5% or with shrubs/bushes <10% or with predominant agricultural/urban land use
or with shrubs/ trees<0.5ha).
O
Natural
Barren Land Land where vegetation cover is less than 2%. Includes
land covered of sand, soil and rocks. OX
Natural Grassland Land covered with natural growth of graminea and
herbaceous vegetation. OG
Marsh
Land seasonally or permanently covered by water and
dominated by natural growth of graminea, reed and other
herbaceous.
OM
Cultivated
Improved pastures Land sown with introduced grass and leguminous for the
grazing of livestock. OP
Annual Crop Area covered by crops that are sown and harvested
during the same production season/ agricultural year. OCA
Perennial crop Crops that are sown or planted once and need not to be
replanted after each annual harvest. Includes trees (e.g.
OCP
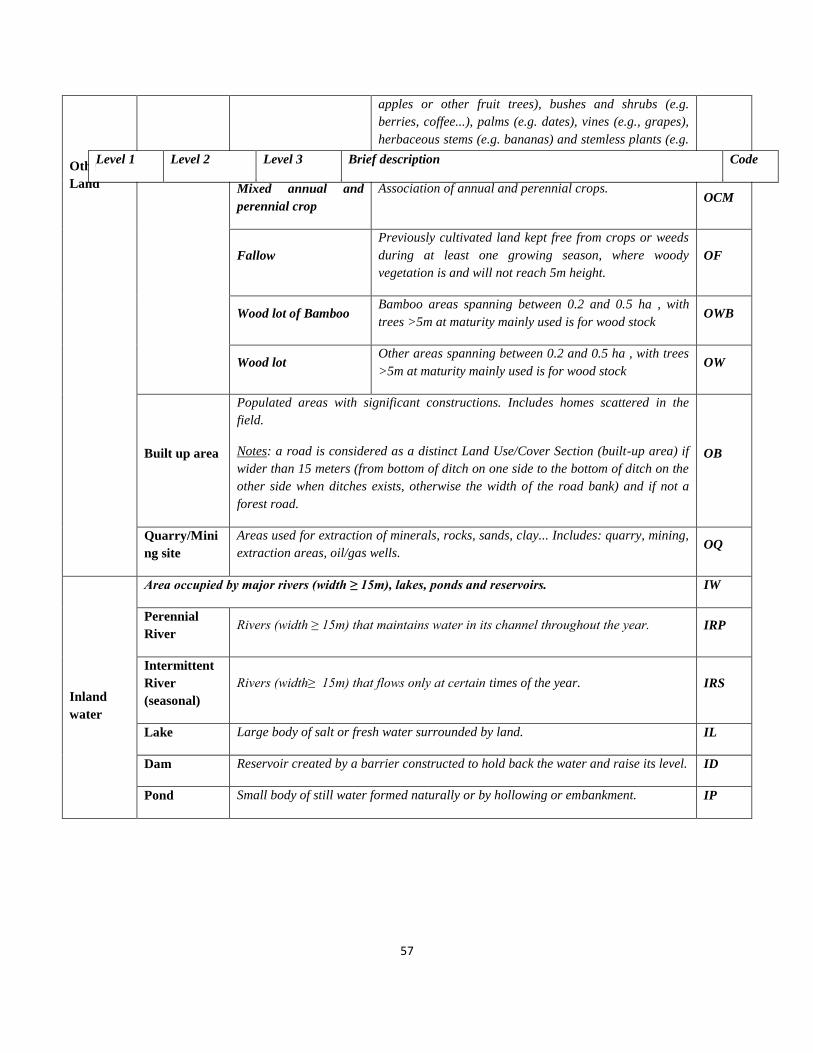
57
Other
Land
apples or other fruit trees), bushes and shrubs (e.g.
berries, coffee...), palms (e.g. dates), vines (e.g., grapes),
herbaceous stems (e.g. bananas) and stemless plants (e.g.
pineapples).
Mixed annual and
perennial crop
Association of annual and perennial crops. OCM
Fallow
Previously cultivated land kept free from crops or weeds
during at least one growing season, where woody
vegetation is and will not reach 5m height.
OF
Wood lot of Bamboo Bamboo areas spanning between 0.2 and 0.5 ha , with
trees >5m at maturity mainly used is for wood stock OWB
Wood lot Other areas spanning between 0.2 and 0.5 ha , with trees
>5m at maturity mainly used is for wood stock OW
Built up area
Populated areas with significant constructions. Includes homes scattered in the
field.
Notes: a road is considered as a distinct Land Use/Cover Section (built-up area) if
wider than 15 meters (from bottom of ditch on one side to the bottom of ditch on the
other side when ditches exists, otherwise the width of the road bank) and if not a
forest road.
OB
Quarry/Mini
ng site
Areas used for extraction of minerals, rocks, sands, clay... Includes: quarry, mining,
extraction areas, oil/gas wells. OQ
Inland
water
Area occupied by major rivers (width ≥ 15m), lakes, ponds and reservoirs. IW
Perennial
River Rivers (width ≥ 15m) that maintains water in its channel throughout the year. IRP
Intermittent
River
(seasonal)
Rivers (width≥ 15m) that flows only at certain times of the year. IRS
Lake Large body of salt or fresh water surrounded by land. IL
Dam Reservoir created by a barrier constructed to hold back the water and raise its level. ID
Pond Small body of still water formed naturally or by hollowing or embankment. IP
Level 1 Level 2 Level 3 Brief description Code

58
Forest
National Definition: Forest means land bearing a vegetative association and spanning more than
0.5 ha (or 0.42 ha =an equivalent of a Sudanese feddan) with trees at least 2m high and a
minimum tree canopy cover of 10%; or young forests stands that have not yet reach, but are
expected to attain these thresholds in situ. It does not include land that is predominantly under
agricultural and/or agro-forestry production systems or urban land use.
F
Natural
regenerated
forest
Forest predominantly composed of trees established through natural regeneration.
Evergreen
forest
Naturally regenerated forest composed of more than 75% of
evergreen trees species. Includes :
Moist forest
Dry forest
FE
Deciduous
forest
Naturally regenerated forest composed of more than 75% of
deciduous trees species. Includes :
Moist forest
Dry forest
Secondary young
FD
Semi-
deciduous
forest
Naturally regenerated forest where trees are at least 25% each of
evergreen and deciduous species. Includes :
Moist forest
Dry forest
Secondary young
FSD
Bamboo
forest
Naturally regenerated forest predominantly composed of bamboo
vegetation. FB
Raffia/Palm
s
Naturally regenerated forest predominantly composed of palm or
raffia vegetation. FRP
Plantation
Forest predominantly composed of trees established through planting and/or deliberate
seeding. Includes coppice from trees that were originally planted or seeded.
Broadleaved
planted
forest
Planted forest composed of more than 75% of broadleaved species.
Includes:
Eucalyptus sp.
Acacia sp.
Gravillia
FPB
Coniferous
planted
forest
Planted forest composed of more than 75% of coniferous species.
Includes :
Cupressus lusita.
Juniperus
Pinus patula
FPC

59
Mixed
planted
Forest
Planted forest of at least 25% each of coniferous and broadleaved
species.
FPM
Other
wooded
lands
Area ≥ 0.5 ha, tree crown cover 5- 10% or shrubs/bushes canopy cover ≥10% W
Woodland
Includes :
Acacia comiphora
Combretum terminalia
Others (bushes,..)
W
Wooded
grassland
Land covered by natural growth of graminea and herbaceous vegetation, with some
scattered trees (tree canopy cover between 5-10%); Land not covered seasonally or
permanently by water. Includes:
Acacia sp.
Others (Combretum sp...)
WG
Wooded
wetland
Land seasonally or permanently covered by water with natural growth of graminea
and herbaceous vegetation and some scattered trees (canopy cover between 5-10%). WW
Other
Land
Land not classified as forest or other wooded land, as described above (Includes land with tree
canopy cover <5% or with shrubs/bushes <10% or with predominant agricultural/urban land use
or with shrubs/ trees<0.5ha).
O
Natural
Barren Land Land where vegetation cover is less than 2%. Includes
land covered of sand, soil and rocks. OX
Natural Grassland Land covered with natural growth of graminea and
herbaceous vegetation. OG
Marsh
Land seasonally or permanently covered by water and
dominated by natural growth of graminea, reed and other
herbaceous.
OM
Cultivated
Improved pastures Land sown with introduced grass and leguminous for the
grazing of livestock. OP
Annual Crop Area covered by crops that are sown and harvested
during the same production season/ agricultural year. OCA
Perennial crop
Crops that are sown or planted once and need not to be
replanted after each annual harvest. Includes trees (e.g.
apples or other fruit trees), bushes and shrubs (e.g.
berries, coffee...), palms (e.g. dates), vines (e.g., grapes),
herbaceous stems (e.g. bananas) and stemless plants (e.g.
pineapples).
OCP
Mixed annual and Association of annual and perennial crops. OCM
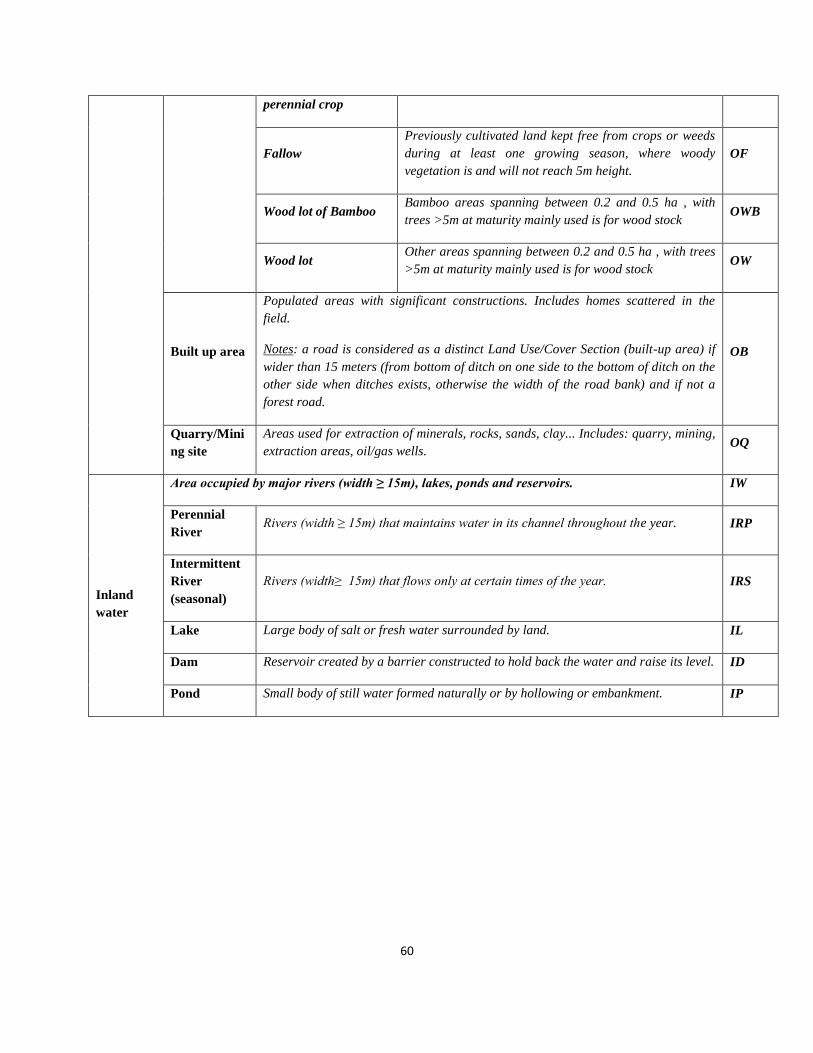
60
perennial crop
Fallow
Previously cultivated land kept free from crops or weeds
during at least one growing season, where woody
vegetation is and will not reach 5m height.
OF
Wood lot of Bamboo Bamboo areas spanning between 0.2 and 0.5 ha , with
trees >5m at maturity mainly used is for wood stock OWB
Wood lot Other areas spanning between 0.2 and 0.5 ha , with trees
>5m at maturity mainly used is for wood stock OW
Built up area
Populated areas with significant constructions. Includes homes scattered in the
field.
Notes: a road is considered as a distinct Land Use/Cover Section (built-up area) if
wider than 15 meters (from bottom of ditch on one side to the bottom of ditch on the
other side when ditches exists, otherwise the width of the road bank) and if not a
forest road.
OB
Quarry/Mini
ng site
Areas used for extraction of minerals, rocks, sands, clay... Includes: quarry, mining,
extraction areas, oil/gas wells. OQ
Inland
water
Area occupied by major rivers (width ≥ 15m), lakes, ponds and reservoirs. IW
Perennial
River Rivers (width ≥ 15m) that maintains water in its channel throughout the year. IRP
Intermittent
River
(seasonal)
Rivers (width≥ 15m) that flows only at certain times of the year. IRS
Lake Large body of salt or fresh water surrounded by land. IL
Dam Reservoir created by a barrier constructed to hold back the water and raise its level. ID
Pond Small body of still water formed naturally or by hollowing or embankment. IP
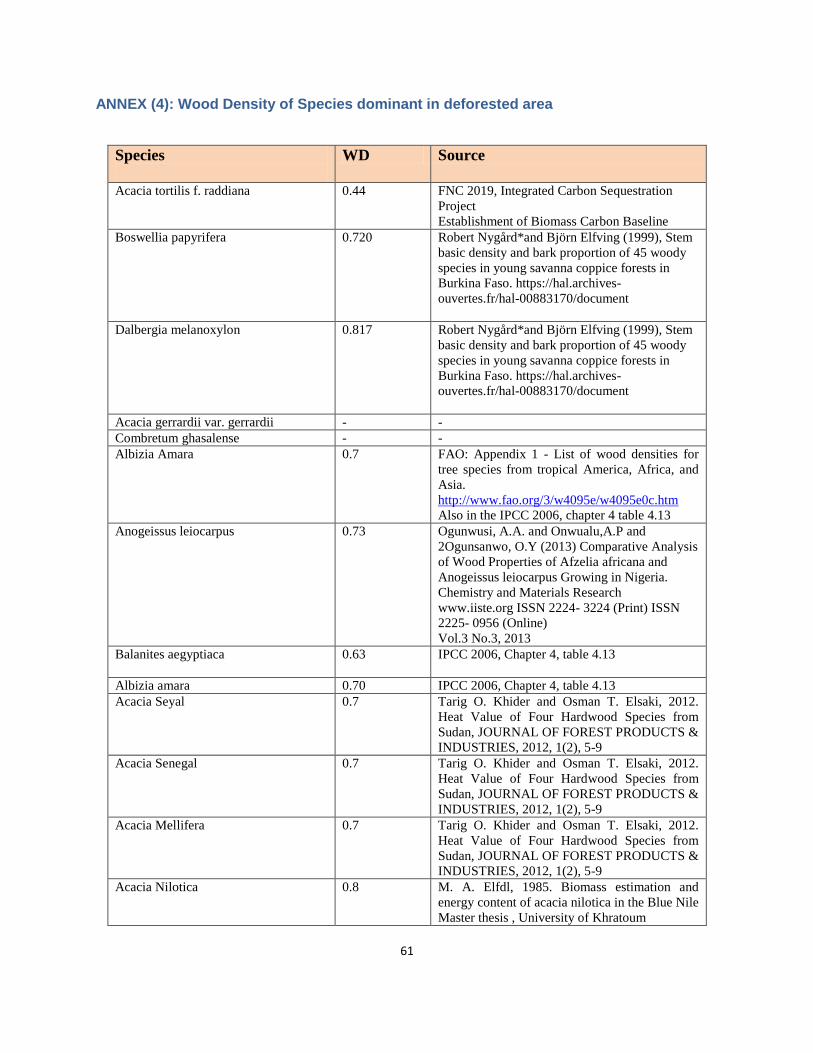
61
ANNEX (4): Wood Density of Species dominant in deforested area
Species
WD Source
Acacia tortilis f. raddiana 0.44 FNC 2019, Integrated Carbon Sequestration
Project
Establishment of Biomass Carbon Baseline
Boswellia papyrifera 0.720 Robert Nygård*and Björn Elfving (1999), Stem
basic density and bark proportion of 45 woody
species in young savanna coppice forests in
Burkina Faso. https://hal.archives-
ouvertes.fr/hal-00883170/document
Dalbergia melanoxylon 0.817 Robert Nygård*and Björn Elfving (1999), Stem
basic density and bark proportion of 45 woody
species in young savanna coppice forests in
Burkina Faso. https://hal.archives-
ouvertes.fr/hal-00883170/document
Acacia gerrardii var. gerrardii - -
Combretum ghasalense - -
Albizia Amara 0.7 FAO: Appendix 1 - List of wood densities for
tree species from tropical America, Africa, and
Asia.
http://www.fao.org/3/w4095e/w4095e0c.htm
Also in the IPCC 2006, chapter 4 table 4.13
Anogeissus leiocarpus 0.73 Ogunwusi, A.A. and Onwualu,A.P and
2Ogunsanwo, O.Y (2013) Comparative Analysis
of Wood Properties of Afzelia africana and
Anogeissus leiocarpus Growing in Nigeria.
Chemistry and Materials Research
www.iiste.org ISSN 2224- 3224 (Print) ISSN
2225- 0956 (Online)
Vol.3 No.3, 2013
Balanites aegyptiaca 0.63
IPCC 2006, Chapter 4, table 4.13
Albizia amara 0.70 IPCC 2006, Chapter 4, table 4.13
Acacia Seyal 0.7 Tarig O. Khider and Osman T. Elsaki, 2012.
Heat Value of Four Hardwood Species from
Sudan, JOURNAL OF FOREST PRODUCTS &
INDUSTRIES, 2012, 1(2), 5-9
Acacia Senegal 0.7 Tarig O. Khider and Osman T. Elsaki, 2012.
Heat Value of Four Hardwood Species from
Sudan, JOURNAL OF FOREST PRODUCTS &
INDUSTRIES, 2012, 1(2), 5-9
Acacia Mellifera 0.7 Tarig O. Khider and Osman T. Elsaki, 2012.
Heat Value of Four Hardwood Species from
Sudan, JOURNAL OF FOREST PRODUCTS &
INDUSTRIES, 2012, 1(2), 5-9
Acacia Nilotica 0.8 M. A. Elfdl, 1985. Biomass estimation and
energy content of acacia nilotica in the Blue Nile
Master thesis , University of Khratoum
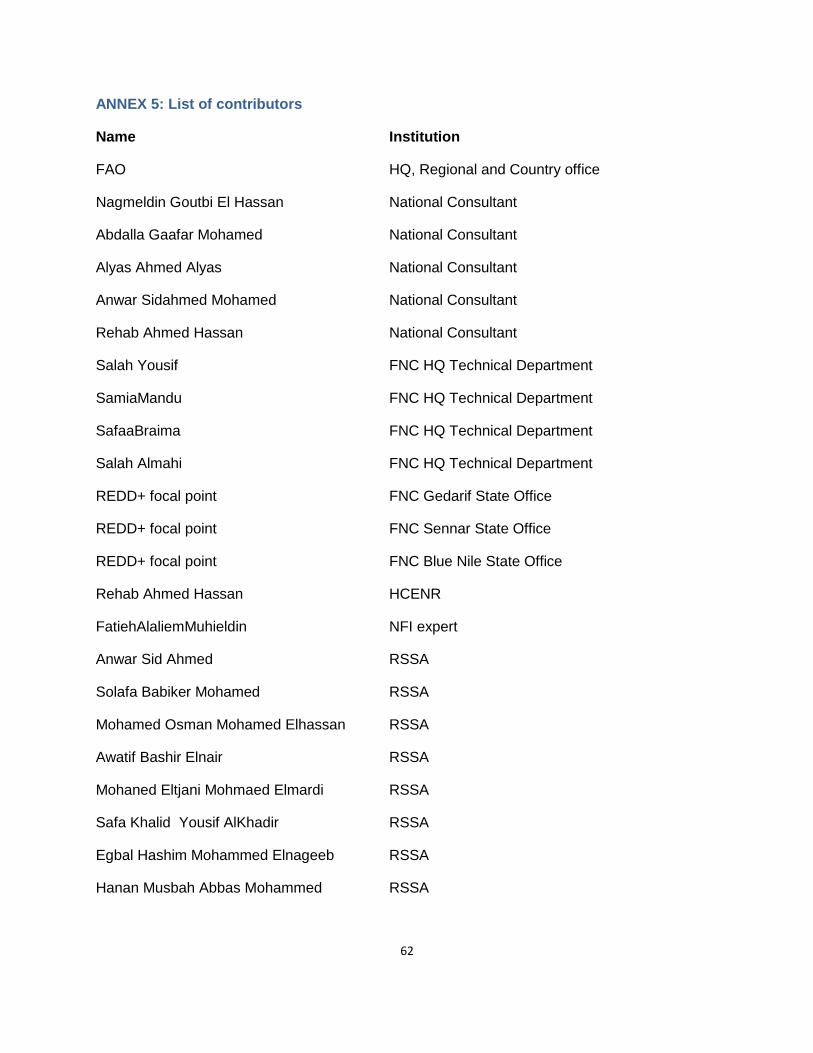
62
ANNEX 5: List of contributors
Name Institution
FAO HQ, Regional and Country office
Nagmeldin Goutbi El Hassan National Consultant
Abdalla Gaafar Mohamed National Consultant
Alyas Ahmed Alyas National Consultant
Anwar Sidahmed Mohamed National Consultant
Rehab Ahmed Hassan National Consultant
Salah Yousif FNC HQ Technical Department
SamiaMandu FNC HQ Technical Department
SafaaBraima FNC HQ Technical Department
Salah Almahi FNC HQ Technical Department
REDD+ focal point FNC Gedarif State Office
REDD+ focal point FNC Sennar State Office
REDD+ focal point FNC Blue Nile State Office
Rehab Ahmed Hassan HCENR
FatiehAlaliemMuhieldin NFI expert
Anwar Sid Ahmed RSSA
Solafa Babiker Mohamed RSSA
Mohamed Osman Mohamed Elhassan RSSA
Awatif Bashir Elnair RSSA
Mohaned Eltjani Mohmaed Elmardi RSSA
Safa Khalid Yousif AlKhadir RSSA
Egbal Hashim Mohammed Elnageeb RSSA
Hanan Musbah Abbas Mohammed RSSA

63
Fatima Abdlwahid Abdalla RSSA
Nahid Sirage eldin Babeker RSSA
Amani Amadeldin Elshiekh Idrees RSSA
Hebatalla Eltayeb Ali Awadalla RSSA
Amged Omer Daffelseed RSSA
Omnia Omer Daffelseed RSSA
Mohamed Ahmed Dfaelsied Hamid RSSA
Eiman Eltayeb Mohamed Yassin RSSA
Yahya Hassan Eltayeb RSSA
Walaa Hassan Musnd RSSA
Fatima Salaheldin Mohamad Ali RSSA
Hatim Elobied Ibrahim Nuh RSSA
Khalid Mohamed Elhaj RSSA

64