the republic of uganda united nations development ... uganda/about uganda/abo…united nations...
TRANSCRIPT
THE REPUBLIC OF UGANDA
UNITED NATIONS DEVELOPMENT ASSISTANCE FRAMEWORK (UNDAF)
2010 to 2014
United Nations Development Assistance Framework for Uganda, 2010‐2014
Vision Statement
The United Nations in Uganda will support Uganda’s capacity to deliver on the National Development Plan, with a focus on Equity and Inclusion, Peace and
Recovery, Population and Sustainable Growth
United Nations Development Assistance Framework for Uganda, 2010‐2014
United Nations Development Assistance Framework for Uganda, 2010‐2014 UNDAF Uganda 2010‐2014 Source, date and place of publication: UN: December 2009, Kampala, Uganda This document is a formal publication of the United Nations System in Uganda and all rights are reserved. The document however, may be freely reviewed, quoted, reproduced or translated, in part or in full, provided that the source is acknowledged. The views presented in the document are solely the responsibility of the UN system in Uganda. Office of the Resident Coordinator of the UN System in Uganda Plot 24 Prince Charles Drive, Kololo P.O. Box 7184 Kampala, Uganda Telephone: +256‐312‐338‐100 Email: [email protected]
United Nations Development Assistance Framework for Uganda, 2010‐2014
1
Table of Contents Acronyms and abbreviations…………………………………………………………………………………………………………………… Preamble .................................................................................................................................................. iii
Ii
Officers of the UN System in Uganda………………………………………………………………...................................... Iv Executive Summary………………………………………………………………………………………………………………………………… v UNDAF at a Glance…………………………………………………………………………………………………………………………………. vii Section 1: Introduction…………………………………………………………………………………………………………................ 1
1.1Situation analysis……………………………………………………………………………………………………………. 1 1.2 UNDAF process and UN comparative advantage ……………………………………………………………. 2 1.3 UN System support to government plans and strategies ……………………………………………….. 4 Section 2: Planned Results……………………………………………………………………………………………………………………… 5 2.1 Mainstreaming of areas of special focus…………………………………………………………………………. 5 2.1.1 Northern Uganda………………………………………………………………………………………… 5 2.1.2 Human rights …………………………………………………………………………………………….. 5 2.1.3 Gender………………………………………………………………………………………………………… 6 2.1.4 Environment……………………………………………………………………………………………….. 6 2.1.5 Population dynamics…………………………………………………………………………………… 7 2.1.6 HIV & AIDS 7 2.2 UNDAF Outcomes………………………………………………………………………………………………………….. 7 2.2.1 Definitions………………………………………………………………………………………………….. 7 2.2.2 Governance and Human Rights…………………………………………………………………… 8 2.2.3 Sustainable Livelihoods……………………………………………………………………………….. 10 2.2.4 Quality Social Services ………………………………………………………………………………… 12 Section 3: Initiatives outside the UNDAF results matrix ....……………………………………………………………… 14
Section 4: Estimated Resource Requirements………………………………………………………………………………………… 14 Section 5: Implementation, Management and Coordination…………………………………………………………... 15
5.1 Paris Declaration and Accra Agenda for Action………………………………………………………………. 15 5.2 Delivering as One United Nations.................…………………………………………………………………… 15 5.3 Operational mechanisms, management and coordination……………………………………………… 15 5.4 Roles of partners…………………………………………………………………………………………………………….. 17 Section 6: Monitoring, Reviewing, Reporting and Evaluating……………………………………………………………18
6.1 Results‐based management, including monitoring…………………………………………………………. 18 6.2 UNDAF reviews and Resident Coordinator’s Annual Reports………………………………………….. 18 6.3 Management of monitoring and evaluation…………………………………………………………………. 18 Annexes
Annex I: Result Matrices……………………………………………………………………………………………………….. 20 UNDAF Outcome 1……………………………………………………………………………………………….. 21 UNDAF Outcome 2……………………………………………………………………………………………….. 23 UNDAF Outcome 3……………………………………………………………………………………………….. 25Annex II: Monitoring Matrices……………………………………………………………………………………………… 27 UNDAF Outcome 1……………………………………………………………………………………………….. 28 UNDAF Outcome 2……………………………………………………………………………………………….. 35 UNDAF Outcome 3……………………………………………………………………………………………….. 43Annex III: Monitoring and Evaluation Calendar……………………………………………………………………. 50Annex IV: Population Data Per District ………………………………………………………………………………… 55
2
Acronyms and Abbreviations
AIDS Acquired Immune Deficiency Syndrome NDP National Development Plan AHSPR Annual Health Sector Performance Report NEMA National Environment Management Authority ART/V Anti RetroviralTreatment/Anti Retroviral NIMES National Integrated Monitoring & Evaluation
Strategy CAP Consolidated Appeals Process NGO Non‐governmental Organization CEDAW Convention on the Elimination of All Forms
of Discrimination against Women NPA National Planning Authority
CFSVA Comprehensive Food Security and Vulnerability Analysis
OECD Organization for Economic Co‐operation and Development
CRC Convention on the Rights of the Child OCHA Office for the Coordination of Humanitarian Affairs CSO Civil Society Organization OHCHR Office of the High Commissioner for Human Rights DRC Democratic Republic of Congo OPM Office of the Prime Minister DSIP Development Strategy and Investment Plan OVC Orphans and Other Vulnerable Children EMIS Education Management Information Systems PEAP Poverty Eradication Action Plan
PLHIV ‐ People Living with HIV&AIDS ESSAPR Education and Sports Sector Annual
Performance Report PMTCT Prevention of Mother‐To‐Child Transmission (of HIV)
FAO Food and Agriculture Organization of the UN PRDP Peace, Recovery & Development Plan FHRI Foundation for Human Rights Initiative RCO UN Resident Coordinator’s Office GDP Gross Domestic Product SWAp Sector Wide Approach GoU Government of Uganda TBD To Be Determined HACT Harmonized Approach to Cash Transfers UAC Uganda AIDS Commission HIV Human Immunodeficiency Virus UBOS Uganda Bureau of Statistics HRAP Human Rights‐based Approach to
Programming UDHS Uganda Demographic and Health Survey
HSSP Health Sector Strategic Plan UHRC Uganda Human Rights Commission IAEA International Atomic Energy Agency UN United Nations IASC Inter Agency Standing Committee (for
Coordinated Humanitarian Response) UNAIDS The Joint United Nations Programme on HIV&AIDS
IDP Internally Displaced Persons UNCDF UN Capital Development Fund IFAD
International Fund for Agricultural Development
UNCT UN Country Team
IFOAM International Federation of Organic Agriculture Movements
UNDAF UN Development Assistance Framework
ILO International Labour Organization UNDP UN Development Programme IMF International Monetary Fund UNEP UN Environment Programme IOM International Organization for Migration UNESCO UN Educational , Scientific and Cultural Organization JLOS Justice, Law and Order Sector UNFPA UN Population Fund JUNT Joint UN Team UNGASS United Nations General Assembly Special Session KIDDP Karamoja Integrated Disarmament and
Development Programme UNIFEM UN Development Fund for Women
LDPG Local Development Partners Group UN‐HABITAT
UN Human Settlements Programme
LG Local Government UNHCR UN High Commission for Refugees MAAIF Ministry of Agriculture, Animal Industries and
Fisheries UNHS Uganda National Household Survey
MDGs Millennium Development Goals UNICEF UN Children’s Fund M&E Monitoring and Evaluation UNIDO UN Industrial Development Organization MFPED Ministry of Finance, Planning and Economic
Development UJAS Uganda Joint Assistance Strategy
MIS Management Information Systems UNPRAP UN Peace Recovery Assistance Plan MoH Ministry of Health WB World Bank MoLHUD Ministry of Lands, Housing and Urban
Development WFP World Food Programme
MoLG Ministry of Local Government WHO World Health Organization MGLSD Ministry of Gender, Labour and Social
Development
NAADS National Agriculture Advisory Services NARO National Agriculture Research Organization
3
Preamble As a key development partner of Uganda, itself a member of the United Nations, the UN will continue to play a pivotal role in supporting the Government of Uganda’s vision for development and prosperity for the people of the nation. The Government of Uganda reaffirms its commitment to achieving the targets envisaged in the Millennium Declaration and the Millennium Development Goals (MDGs). It values the partnership between Government and the UN in Uganda towards achieving the MDGs and wishes to underscore the need to further strengthen this partnership in the new UN Development Assistance Framework for 2010‐2014. The Government of Uganda has pursued a poverty eradication agenda through the implementation of the Poverty Eradication Action Plan (PEAP). Over the period of its existence, PEAP made a strong contribution to poverty reduction in the country, helped manage macroeconomic stability and hence laid the foundations for further strengthening economic growth. Therefore, Government will build further on the gains of PEAP by focusing on structural transformation of the economy and thus promote economic growth, employment and prosperity in the National Development Plan (2010‐2014). The United Nations is committed to supporting the efforts of the Government to build on the gains of PEAP and further strengthen development in Uganda. By working to achieve the outcomes jointly agreed between the Government and the UN, as articulated in this UN Development Assistance Framework (2010‐2014), the UN will support national efforts and capacities for ensuring that the growth, prosperity and social transformation envisaged in the National Development Plan will be equitable, inclusive and sustainable and will contribute to further integrating population dynamics and climate change concerns into the development process, thus accelerating progress towards reaching the MDGs nationwide and deepening peace, recovery and development in the North. The UN and the Government of Uganda are committed to strengthening harmonization and coherence of UN assistance in Uganda, heeding the call of the UN governing bodies for Delivering as One, and in line with the principles of the Paris Declaration and the Accra Action Plan. Delivering as One will enhance the UN’s support to the government through greater efficiency, accountability and synergy, aligned with the national priorities. As articulated in this UNDAF (2010‐2014), more emphasis has been accorded to joint programming and joint programmes as a means of implementation and to joint institutional arrangements for management and review of progress and results. These efforts will be further strengthened over the duration of the UNDAF through a joint effort led by the Ministry of Finance. The Government and the United Nations are committed to continue strengthening their partnership to fully realize the development aspirations of the people of Uganda as stated in the National Development Plan (2010/11‐2014/15) and to work together to ensure effective and harmonized UN support. Together we will adhere to the mandate and principles of the United Nations Charter, through the programmes that we support. The UN will support the Government, as the principle duty‐bearer, to respect, protect, promote and fulfil the human rights of all Ugandans and of persons of specific concern to the UN who have been granted refuge in Uganda from persecution. We are grateful to all the partners and colleagues who contributed to the preparation of the UNDAF and count on their continued engagement and collaboration.
______________________________________________
______________________________________________ Honourable Syda Bbumba Théophane Nikyema
Minister of Finance, Planning and Economic Development
UN Resident Coordinator
4
The United Nations in Uganda
__________________________
Percy Misika FAO Representative
___________________________
Thabisile Moleah IAEA Programme Officer
___________________________
Ides de Willebois IFAD Director, E & S Africa
_________________________
Alexio Musindo ILO Director of Area Office
__________________________
Jeremy R. A. Haslam IOM Chief of Mission
___________________________
Musa Bungudu UNAIDS Country Coordinator
_________________________ David Morrison
UNCDF Executive Secretary
__________________________ Mounkaila Goumandakoye UNEP Director& Regional
Representative Regional Office for Africa
___________________________
Joseph G.M. Massaquoi UNESCO Director
Regional Bureau for Science in Africa and UNESCO
representative to Kenya, Eritrea, Rwanda, Somalia and Uganda
_________________________
Dr. Alioune Badiane UN‐HABITAT Director of Regional Office for Africa & Arab States
__________________________
Sharad Sapra UNICEF Representative
___________________________
Dr. Tommy Davis UNIDO Representative/ Regional
Director
_________________________ Meryem Aslan
UNIFEM Regional Programme Director, East & Horn of Africa
__________________________
Mary Symmonds UNDP Country Director
__________________________
Janet Jackson UNFPA Representative
_________________________
Kai Nielsen UNHCR Representative
__________________________
Timothy Pitt UN‐OCHA Head of Office
___________________________
Kyle F. Ward UN‐OHCHR Chief
Programme Support and Management Services
_________________________
Stanlake Samkange WFP Representative and Country
Director
__________________________
Joaquim Saweka WHO Representative
5
Executive Summary Background The civil and political turn‐around in Uganda in the 1990s has had a positive effect on many areas of life in the country and can be seen in the key economic indicators of growth noticeable since the 1990s. Building on the new atmosphere of peace, economic liberalization, macroeconomic stabilization and increases in foreign aid, Uganda’s annual per capita GDP growth of 3.5 percent was among the fastest in the world in the 1990s. Even exogenous shocks to the economy in the last three years have not affected macroeconomic stability and resiliency; hence GDP growth averaged 8.0 percent between 2004/2005 and 2007/2008. Overall, Uganda has made good progress towards achieving some of the targets set out in its Poverty Eradication Action Plan (PEAP) and the MDGs. PEAP implementation reduced poverty from 44 percent in 1997/1998 to 31 percent in 2005/2006 although regional inequalities remain. Net primary enrolment is above 84 percent, so achievement of MDG 2 (universal primary education) is possible though drop‐out rates are high and the average quality of education is poor. The economy needs accelerated structural transformation to boost industry, improve infrastructure, modernize agriculture and significantly increase products and services to sustain its growth. Despite the achievements, Uganda still faces serious challenges: Its population growth rate of 3.2 percent is one of the highest in the world, and poses serious challenges to the economy. Also, youths of 15 years old or less make up 48 percent of the population, resulting in the highest dependency ratio in the world. Most policies, laws and standards are up‐to‐date, but implementation and enforcement remain weak. Social services, especially health and education, continue to be functionally weak; social protection is fragmented, with large vulnerable population groups not covered. Sound governance, including transparency and accountability, are not yet a universal norm, resulting in 85 percent of Ugandans living in disadvantaged rural areas with hunger and food insecurity posing a major problem and number of undernourished people rising to 4.4 million in 2008. Linkage of UNDAF Outcomes with NDP Development Objectives The UNDAF was designed to support the principles embodied in the Paris Declaration and the subsequent Accra Agenda for Action. The outcomes and outputs in the UNDAF support the objectives of the National Development Plan (2010‐2014), and the linkages are shown in the table below. UNDAF Outcome NDP Development Objectives 1: Governance & Human Rights
7. Strengthening good governance, defence and security
2: Sustainable Livelihoods
1. Increasing household incomes and promoting equity 2. Enhancing the availability and quality of gainful employment 3. Improving stock and quality of economic infrastructure 5. Promoting science, technology, innovation and ICT to enhance competitiveness 8. Promoting sustainable population and use of the environment and natural resources
3: Quality Basic Social Services 4. Increasing access to quality social services 6. Enhancing human capital development 8. Promoting sustainable population and use of the environment and natural resources
Planned Results The UNDAF was designed as a results‐driven framework with three broad UNDAF Outcome Areas and corresponding agency outcomes and outputs: i) Governance and Human Rights; ii) Sustainable Livelihoods; and iii) Quality Social Services. The UNDAF reflects the national scope of the UN System in Uganda, but within that scope, six special areas of focus are mainstreamed and highlighted. These include i) Northern Uganda, a region that needs special attention to attain the national average in human development indicators and then meet the MDG targets; ii) human rights, which have improved but many challenges remain in the area of economic, social and cultural rights, especially of the most vulnerable groups of the population; iii) gender discrimination against women in all spheres of life; iv) the environment, for which the Government of Uganda has put in place strategies and plans to promote sound environmental management, but the quality of the environment continues to decline; v) population, for which there is a growing realization of the importance of population in development; and vi) HIV & AIDS that its pandemic continues to have deep, negative socio‐economic repercussions.
6
Initiatives Outside the UNDAF Results Matrix As of 2009/2010, Uganda continues to need a Consolidated Appeals Process (CAP) to coordinate remaining emergency and humanitarian needs addressed by the UN, NGOs and donors. CAP is based on a commonly agreed definition of humanitarian action in Uganda targeting at‐risk communities in areas prone to and/or recovering from conflict and natural disasters. The UNDAF includes interventions that will increase governmental and community capacity for disaster risk reduction, and for emergency preparedness and response. Estimated Resource Requirements The United Nations Country Team estimates that a minimum of US $911.4 million will be required to achieve the results in the UNDAF. This consists of an estimated US $184.5 million of regular (core) resources, which are provided by agencies’ respective headquarters and US $726.9 million in other (non‐core) resources to be raised from multilateral and bilateral donors and other external sources. Implementation, Management and Coordination The UN will implement the UNDAF under country leadership and management; it will strengthen and use Ugandan institutions and systems. To reduce costly fragmentation of aid, the UN has increased joint programming and programmes, and adheres to agreed global and local divisions of labour. The UNDAF envisions that the UN system will provide Government with policy and technical advice as well as practical support to help achieve national development objectives. The UNDAF will guide the UN’s coherent capacity strengthening of government, including for accountability. The UN in turn will manage for results, and be accountable and transparent in reporting on results in this UNDAF. The UN in Uganda aims to deliver one programme through the UNDAF, under one leader, the Resident Coordinator, with one budgetary framework tied to the results in the UNDAF. The UN also aims to deliver as “one office” through several shared services, systems and facilities. Delivering the UNDAF results as One UN will allow the UN to achieve greater effectiveness and efficiency. This will be achieved through four mechanisms:
i. Establish or strengthen coordination mechanisms within the UN system, including for planning, monitoring, reviewing, evaluating and reporting;
ii. Implement special areas of focus and other cross‐cutting programmes through joint programming and programmes;
iii. Commit to a coordinated engagement in government‐led sector working groups that promote national leadership, management and implementation;
iv. Provide coordinated support to the Local Development Partner Group (LDPG) and its sector‐specific subgroups.
Monitoring, Reviewing, Reporting and Evaluating The UNDAF is a results‐based planning tool which will use results and evidence‐based management for monitoring, reviewing, reporting and evaluating outcomes. This includes data collection and analysis to monitor progress, as well as to check whether the assumptions made at the design stage are still valid, and whether the risks identified are occurring or not. Evaluations determine progress made towards the UNDAF and Agency Outcomes. The indicators have baseline and target values against which the UN System’s collective contribution can be measured. The MDG indicators are included in the framework. Overall, monitoring will be based mainly on national data sources, tools and processes, such as annual panel survey, statistical abstract, National Development Plan (NDP) and sector progress reviews, the census in 2012, the Demographic Health Survey and other sectoral, national‐level surveys, sectoral management information systems and so forth. The UNDAF M&E calendar outlines the relevant studies and evaluations to be conducted by UN agencies and their partners. The UNDAF Review will draw on government‐led national and sub‐national reviews and evaluations. To assess progress in terms of the UN’s contribution, the review will use performance data drawn from joint and single agencies’ project and programme performance assessments, and reviews of progress on UN reform. The UNDAF Working Groups will meet annually and use the results matrix and M&E calendar as the basis for joint monitoring with partners of outcomes. For UNDAF Outcomes and Agency Outcomes, the Outcome Groups prepare the annual review findings, and identify and report on lessons learnt, while UN Joint Teams will do the same for UN joint programmes. Participation by government, civil society and development partners in joint UNDAF reviews, and UN participation in sector reviews, also will strengthen capacity for M&E and facilitate harmonization within the UN and with Government and other partners. The review findings and recommendations will inform the Resident Coordinator’s Annual Plans and Reports, as well as a joint mid‐term review or evaluation of UNDAF. The Mid‐Term Review or Evaluation of the UNDAF will be harmonized with Government‐led reviews or evaluations, and will also draw on UNDAF annual reviews, studies, surveys and programme evaluations conducted by UN agencies and their partners. The review or evaluation will examine whether the UNDAF contributed towards achieving the selected priorities in the national development framework, generated a coherent UNCT response to these priorities, remain true to the UN Vision and effectively exploited the UN’s comparative advantage in the
7
country. It may make recommendations for immediate adjustments, and will make recommendations for the UNDAF of 2015‐2019.
8
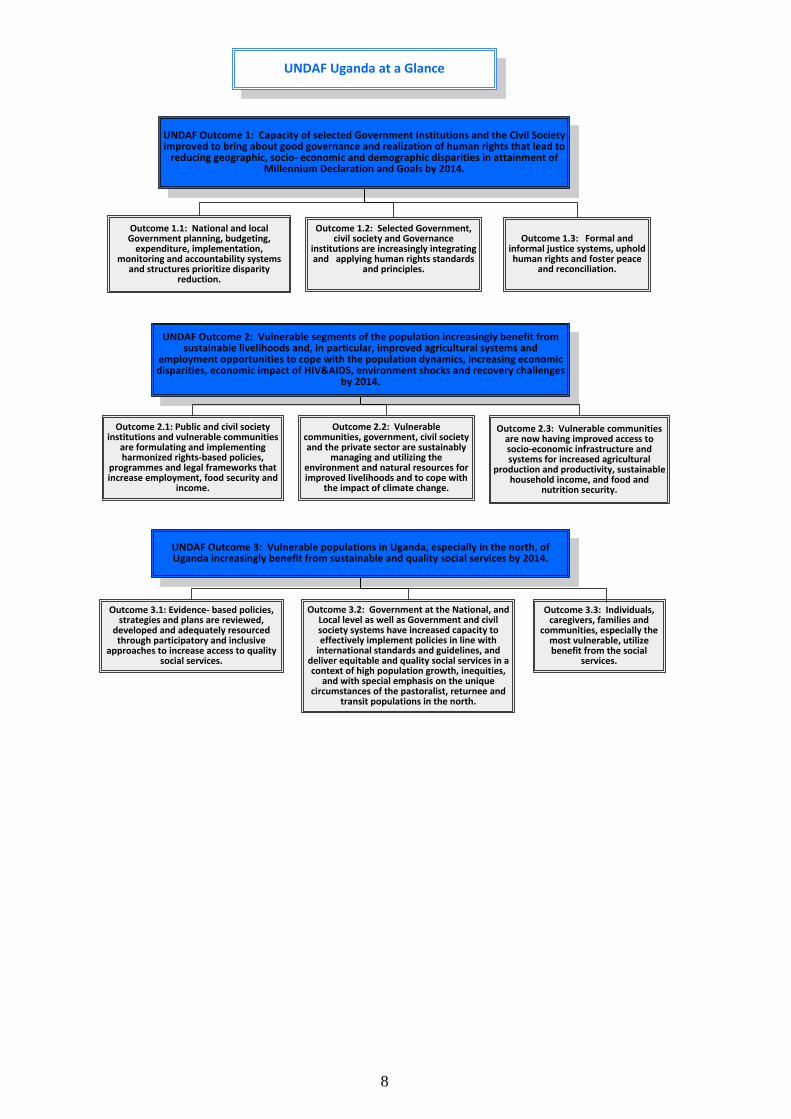
UNDAF Outcome 1: Capacity of selected Government Institutions and the Civil Societyimproved to bring about good governance and realization of human rights that lead toreducing geographic, socio‐ economic and demographic disparities in attainment of
Millennium Declaration and Goals by 2014.
Outcome 1.1: National and localGovernment planning, budgeting,expenditure, implementation,
monitoring and accountability systemsand structures prioritize disparity
reduction.
Outcome 1.2: Selected Government,civil society and Governance
institutions are increasingly integratingand applying human rights standards
and principles.
Outcome 1.3: Formal andinformal justice systems, upholdhuman rights and foster peace
and reconciliation.
UNDAF Outcome 2: Vulnerable segments of the population increasingly benefit fromsustainable livelihoods and, in particular, improved agricultural systems and
employment opportunities to cope with the population dynamics, increasing economicdisparities, economic impact of HIV&AIDS, environment shocks and recovery challenges
by 2014.
Outcome 2.1: Public and civil societyinstitutions and vulnerable communities
are formulating and implementingharmonized rights‐based policies,
programmes and legal frameworks thatincrease employment, food security and
income.
Outcome 2.2: Vulnerablecommunities, government, civil societyand the private sector are sustainably
managing and utilizing theenvironment and natural resources forimproved livelihoods and to cope with
the impact of climate change.
Outcome 2.3: Vulnerable communitiesare now having improved access tosocio‐economic infrastructure andsystems for increased agricultural
production and productivity, sustainablehousehold income, and food and
nutrition security.
UNDAF Outcome 3: Vulnerable populations in Uganda, especially in the north, ofUganda increasingly benefit from sustainable and quality social services by 2014.
UNDAF Uganda at a Glance
Outcome 3.1: Evidence‐ based policies,strategies and plans are reviewed,
developed and adequately resourcedthrough participatory and inclusive
approaches to increase access to qualitysocial services.
Outcome 3.2: Government at the National, andLocal level as well as Government and civilsociety systems have increased capacity toeffectively implement policies in line withinternational standards and guidelines, and
deliver equitable and quality social services in acontext of high population growth, inequities,
and with special emphasis on the uniquecircumstances of the pastoralist, returnee and
transit populations in the north.
Outcome 3.3: Individuals,caregivers, families and
communities, especially themost vulnerable, utilizebenefit from the social
services.
9
1: Introduction 1.1 Situation Analysis1 The turn‐around that happened to the political climate in Uganda has had a positive effect on many areas of life and can be seen in the key economic indicators of growth noticeable in the country since the 1990s. Thus, building on the new atmosphere of peace, economic liberalization, macroeconomic stabilization and increases in foreign aid, Uganda’s annual per capita GDP growth of 3.5 percent was among the fastest in the world in the 1990s.2 Annual real growth averaged 6.9 percent, well above the sub‐Saharan African average of 2.0 percent. Despite exogenous shocks to the economy over the last three years, macroeconomic stability and resiliency were maintained; GDP growth averaged 8.0 percent between 2004/2005 and 2007/2008. The industrial and services sectors performed strongly, unlike the agriculture sector which posted the lowest growth rate. Nevertheless, the country needs to accelerate a structural transformation in the economy to boost its manufacturing sector and modernize its agriculture. Also, the country needs more significant increases in products and services to sustain its growth. Uganda has made good progress towards achieving some of the targets set out in its Poverty Eradication Action Plan (PEAP) and in the Millennium Development Goals (MDGs). PEAP implementation, especially in social development, led to a significant contribution to poverty reduction. The percentage of the population below the poverty line reduced from 44 percent in 1997/1998 to 31 percent in 2005/2006, and Uganda is on track to meet MDG 1, although regional inequalities remain. Net enrolment in primary schools is above 84 percent, so achievement of MDG2 (universal primary education) is possible even though drop‐out rates are high and the average quality of education is poor. The MDG target on gender parity in primary school enrolment was achieved in 2006, but the completion rate for girls is 42 percent, compared with 55 percent for boys. Negative influences responsible for this include high fertility rates that strain household and government resources, gender inequality, and capacity gaps in facilities, supplies and human resources. Technical, vocational and university education is not yet adequately supporting the development of a work force with appropriate skills. Life expectancy at birth is currently low, at around 50 years, primarily due to preventable and treatable diseases such as malaria. The prevalence of HIV & AIDS declined from 18.5 percent in early 1990s to 6.4 percent in 2005. However, rapid population growth has led to a dramatic increase in the number of new HIV infections each year. The HIV epidemic, along with other endemic diseases such as malaria and respiratory tract infections, is a key contributor to vulnerability.3 In terms of adult morbidity, HIV & AIDS, malaria, and respiratory infections are the top three causes of the overall disease burden in terms of disability‐adjusted life years (DALYs) lost.4 An additional challenge to adult mortality is the estimated maternal mortality ratio of 435 per 100,000 live births, which is one of the highest in the world.5 Inadequate numbers of skilled professionals, due to poor human resource management, insufficient budgetary allocations and absenteeism, hamper the delivery of quality social services, especially in hard‐to‐reach areas. Inadequate infrastructure, poor management of supplies, and low remuneration of staff are further challenges. Also, insufficient geographical coverage of service points, user fees and associated costs, and low demand for social services have further compounded inadequate use of social services by the population. The population growth rate of 3.2 percent is one of the highest in the world, and poses serious challenges to job creation, agricultural production, income distribution and the delivery of social services. Nearly half of the population (around 48 percent) is below the age of 15 years, resulting in the highest dependency ratio in the world, currently standing at 1.12 dependents per worker compared to the 0.87 average for sub‐Saharan Africa. A lower birth rate would result in a lower dependency ratio, and the consequent increased population in the working ages would translate to a potential demographic dividend of a large productive labour force for Uganda.
1 This section is a synopsis of the UN Meta‐Analysis on Levels, Trends and Causes of the Main Development and Humanitarian Challenges in Uganda, REEV Consult International, January 2009. This meta‐analysis drew on over 300 studies, papers, survey reports and evaluations. This section also draws on the African Peer Review Mechanism (APRM) Report Number 7 on the Republic of Uganda, January 2009; Uganda: Moving Beyond Recovery, Investment and Behaviour Change for Growth, World Bank Country Economic Memorandum, Volume II: Overview, October 2007; and the draft National Development Plan (version October 2009). 2 APRM, Country Review Report Number 7, Republic of Uganda, January 2009, p. xxxvi. 3 Economic assessment of HIV, 2008 4 Disability‐adjusted life years (DALYs) are a metric for combining healthy time loss from morbidity as well as premature mortality. Fiscal Space for Health in Uganda, Contribution to the 2008 Uganda Public Expenditure Review, The World Bank in collaboration with the Ministry of Finance, Planning, and Economic Development and the Ministry of Health, May 2009 5 DHS.
10
The Constitution of Uganda and the Uganda Gender Policy provide a positive legal and policy framework for gender equality and the promotion of women’s rights, including affirmative action in favour of women and other marginalized groups to redress current disparities. Women’s representation in decision‐making is increasing: women account for 24 percent of cabinet members and 31 percent of parliamentarians. However, women are highly underrepresented in senior positions in government (17 percent of such positions held by women as against 83 percent by men). Female access to higher education, property ownership and decision‐making is still inequitable. There are also significant differences between men and women’s access to productive resources and economic opportunities, contributing to feminization of poverty. Gender based violence remains prevalent, underreported and rarely redressed. Most policies, laws and standards are up‐to‐date; the key challenges are effective implementation and enforcement. Social services, especially health and education, continue to be functionally weak, with poor oversight and supervision. Social protection, including social security, is fragmented, with large vulnerable population groups not covered. Diverse natural and cultural heritage and cultural industries must be further safeguarded and promoted in order to ensure the development of the country that is based on the identity of people. Sound governance and financial management, including transparency and accountability, are not yet a universal norm. Particularly at service delivery points, inadequate resources and capacity are major challenges. The effectiveness of public service and expenditure management, revenue enhancement and coordination of development assistance also needs to improve. As a result of the decentralization policy, numerous improvements have been realized in governance through democratic participation and community involvement, empowering local communities to manage their affairs. However, the tendency to multiply the number of districts decreases efficiency by increasing the challenges of insufficient technical and managerial capacity, declining local revenues, and weak management, thereby contributing to gaps in coverage and quality of services and infrastructure. Multiparty elections in 2006 marked an important cornerstone in Uganda’s democratization process. Uganda is progressive in committing itself to promote and respect internationally recognized human rights instruments. It has ratified several major international and regional instruments and spearheaded the move for adoption of an African Union Convention on Forced Displacement.6 Whereas Uganda has come a long way in ensuring the protection of and respect for the rights of its citizens and those who have sought refuge in its territory, human rights violations, corruption and impunity are major challenges still to be overcome. Another challenge is domesticating signed treaties and meeting their reporting obligations. A coherent and agreed framework for acceding to standards and codes as well as the mechanisms for following up on implementation needs to be put in place. Popular confidence in the rule of law remains low, with issues to resolve in many parts of the justice sector. There are considerable problems around land rights, emanating from absence of a land policy, conflicting or missing information, inequitable access to legal aid to support property rights, insecurity and confusion over different kinds of rights. Eighty‐five percent of Ugandans live in disadvantaged rural areas where resources and potential to tap for higher economic growth are underutilized. The Inequality GINI for urban areas of Uganda was 0.36 in 2005/6, and 0.43 for rural areas7, and the urban income poverty rate was 13.7% compared to the 41.7% in rural areas.8 Many rural populations are constrained along an “agricultural value chain” that stretches from production to storage and marketing, and they have limited opportunities to diversify their livelihoods. Hunger and food insecurity are still a major problem in Uganda, particularly in northeastern (Karamoja) and northern Uganda. Uganda had 4.1 million undernourished people from 2003‐2005 and 4.4 million in 2008. According to the Uganda Demographic and Health Survey of 2006, 25 percent of children under five years old were underweight. Urban growth is occurring at a rapid rate and the ability to absorb this growth is a challenge. Kampala‐Entebbe is becoming a major urban conglomerate facing challenges of pollution, congestion, mushrooming informal settlements and service coverage. Women make up 80 percent of those working in agriculture, but have unequal access to, and control over, important productive resources, thus limiting their ability to move beyond subsistence agriculture. Northern Uganda, recovering from decades of violent conflict that has now ended, and northeastern Uganda, plagued by insecurity, underdevelopment and the effects of climate change, are in need of special attention to bring human development indicators first to the national average, and then to the MDG targets. Pockets of disparity exist across the rest of Uganda, as well. Among these, the southwest, central west and northwest regions of Uganda have long been hosting refugees, with periodic upsurges related to cross‐border conflict.9 Humanitarian emergencies
6 Uganda is the forerunner of asylum rights in the region, having passed the Refugee Act. The African Union Special Summit in Kampala in October 2009 agreed to a Convention on Forced Displacement. 7 UNHS and World Bank calculations 8 State of Ugandan Population Report, 2007 9 As of 2009, there are more than 140,000 refugees and asylum seekers from 23 countries, with most coming from Democratic Republic of Congo, Rwanda, Sudan and Somalia.
11
continue to occur every year from a complex array of causes, including environmental degradation, extreme vulnerability and lack of coping mechanisms, low levels of education and productivity and global factors such as climate change, rising food prices, and epidemics. Riverine and lacustrine areas of the country are subject to flooding, while others are prone to drought. Recurring animal, crop and human disease epidemics require vigilance and response. An analysis of the development challenges faced by Uganda, briefly summarized above, was the foundation for the development of this UNDAF. This process is described below. 1.2 The UNDAF Process and UN Comparative Advantage The 2006‐2010 UNDAF was shortened by a year, to harmonize with Government’s decision to end the Poverty Eradication and Development Plan, and initiate a new National Development Plan. Rather than conduct a separate UNDAF evaluation, the UN contributed to the PEAP and Joint Assistance Strategy evaluations, and to reviews of Technical Sectors and Sector Wide Approaches (SWAPs). A meta‐analysis10 of over 300 surveys, reports, evaluations and studies was conducted within the conceptual framework of a causal analysis. At a Strategic Prioritization Retreat, around 140 stakeholders considered the findings of the meta‐analysis, and the challenges and objectives identified in the first draft of the National Development Plan. Strengths, comparative advantages, as well as weaknesses of the UN system were assessed during the Retreat. The preliminary findings were enlarged and validated through a stakeholders’ opinion survey.11 There was a consensus that the UN system, under the 2006‐2010 UNDAF, made a moderate contribution to Uganda’s development, with most impact in humanitarian assistance, response to HIV & AIDS, conflict resolution and peace and security. The stakeholders determined that, for the period of the new UNDAF (2010‐2014), the UN can achieve comparative advantages in health and response to HIV&AIDS; economic development, planning, poverty eradication, capacity strengthening, governance and conflict resolution, and peace and security. In addition, localization of international agreements and protocols and humanitarian assistance were identified as important areas for UN assistance. The UN’s general comparative advantage lies in its role as a multilateral organization, accountability to member states, plus its diversified and multidisciplinary global technical knowledge within its various funds, programmes, agencies, departments and offices. The UN is a unique organization that derives its mandate, which is wide and diverse, from a broad consensus among its members. This consensus is reflected in a series of conventions and declarations. The unique characteristics of the UN system are: universality and impartiality; advocacy for people‐centred and rights‐based development policies and strategies; presentation and adherence to international standards and practices, some of which are demanding greater social equity; capacity to play a facilitating role between internal and external parties; support for peace and security; and access to global and regional technical knowledge. Furthermore, the UN’s advocacy, fund raising and leveraging capacity plus its ability to transfer technical knowledge from its funds, programmes, agencies, departments and offices to national counterparts are considered to be comparative advantages. The follow‐up of this transfer of technical knowledge, and building on the previous lessons learned from the UN’s work in Uganda as well as all the tools and programming manuals from previous programmes, will further ensure sustainability from one UNDAF to the other. The role of the UN in Uganda also is recognized in supporting the establishment of norms and standards in accordance with international conventions, treaties, UN General Assembly guidelines and Security Council resolutions. This is in line with the United Nations Charter that has set forth the purposes of the system as promoting respect for human rights and supporting coordination of socio‐economic development initiatives. Accordingly, UN Funds, Programmes and Agencies in Uganda will pursue international commitments and agreements, in particular the Millennium Declaration, in line with their shared and distinctive mandated areas. Based on the result of the Strategic Prioritization Retreat, the Opinion Survey and the Meta‐Analysis, the UNCT adopted in February 2009 three UNDAF Outcomes: 1. Governance and Human Rights 2. Sustainable Livelihoods 3. Quality Social Services. In addition, Special Areas of Focus for the UNDAF were identified for mainstreaming across all Outcome Areas.
10 REEV Consult International, Final Report: UNDAF Meta‐Analysis on Levels, Trends and Causes of the Main Development and Humanitarian Challenges in Uganda, Kampala, January 2009 11 Brain Trust Consult, Ltd., Opinion Survey for External Validation of Strategic Priorities for the UN System in Uganda, March 2009
12
The Task Force assigned to write the UNDAF and results matrices was trained in the human rights approach, gender mainstreaming, results‐based planning, and in joint programming. These staff, along with government and development partners, formed three Technical Working Groups (TWGs) with a mandate to develop the results hierarchy of Agency Outcomes and Outputs, with indicators, baselines, targets and resource requirements. The TWGs worked simultaneously within Government‐led sector working groups, which were developing the National Development Plan (NDP). The UN Monitoring and Evaluation Team assisted each TWG to develop the UNDAF M&E matrix and calendar, and at the same time supported the development of the M&E strategy for the NDP. A Steering Group oversaw the completion of an agreed work plan, and reported regularly to the Heads of Agencies of the UNCT. Government, NGO, bilateral donor and civil society stakeholders reviewed the first draft of the UNDAF and results matrices at a consultative meeting in March 2009. The meeting provided valuable feedback for revision. In addition, audits were carried out to ensure that human rights, environment, gender and HIV&AIDS were sufficiently highlighted throughout the UNDAF. The quality of the Monitoring and Evaluation matrix was also reviewed by the UNDAF Monitoring and Evaluation team and external advisors. The audit recommendations produced by OHCHR for human rights, UNIFEM for gender, UNEP for environment, UNAIDS for HIV&AIDS and by the M&E team and advisors, were addressed by the three Technical Working Groups and the Steering Committee. The final draft of the UNDAF was considered by the NDP and made ready for final review in November 2009 by the UN system, Government and other stakeholders in Uganda, and by the regional UN Quality Support and Assurance system. All comments were addressed in the final version, which was signed and launched in December 2009. 1.3 UN System Support to Government Plans and Strategies The National Development Plan (NDP) is a medium‐term development strategy for the period 2010/11 to 2014/15, following the Poverty Eradication Action Plan (PEAP). The NDP includes sector specific targets, with an overall theme of “Growth, Employment and Prosperity for Socio‐Economic Transformation” and its eight overall objectives are:
1. Increasing household incomes and promoting equity 2. Enhancing the availability and quality of gainful employment 3. Improving stock and quality of economic infrastructure 4. Increasing access to quality social services 5. Promoting science, technology, innovation and ICT to enhance competitiveness 6. Enhancing human capital development 7. Strengthening good governance, defence and security 8. Promoting sustainable population and use of the environment and natural resources.
Within these objectives, priority actions are required in: (i) Industrialization and value‐addition; (ii) development and promotion of the tourism industry; (iii) accelerating agricultural growth; (iv) improving the stock and quality of physical infrastructure; and (v) human resource development. The conceptual framework for the NDP encompasses four clusters, namely, the primary growth sectors, complementary sectors, social service sectors and enabling sectors. Table 1: Linkage of NDP and UNDAF Outcomes UNDAF Outcome NDP Development Objectives 1: Governance & Human Rights
7: Strengthening good governance, defence and security
2: Sustainable Livelihoods
1: Increasing household incomes and promoting equity 2: Enhancing the availability and quality of gainful employment 3: Improving stock and quality of economic infrastructure 5: Promoting science, technology, innovation and ICT to enhance competitiveness 8: Promoting sustainable population and use of the environment and natural resources
3: Quality Basic Social Services 4: Increasing access to quality social services 6: Enhancing human capital development 8: Promoting sustainable population and use of the environment and natural resources
The UNDAF also supports a number of other Government policies, strategies and action plans and is designed to encompass and enhance UN plans and strategies already in place. Interventions towards maternal and child health are implemented through the National Health Policy and the Health Sector Strategic Plan. The Plan for Modernization
13
of Agriculture provides the framework – aligned under pillar 2 of PEAP – for transforming Uganda’s agriculture from a subsistence‐based to a commercial‐oriented sector. The main goals of the PMA include increasing incomes and improving the quality of life of subsistence farmers through increased productivity and greater access to market. Other development plans include : (i) the Education Sector Strategic Plan 2004‐2015, which gives the basis for free and compulsory primary education; (ii) the Uganda National Disaster Preparedness Policy and Institutional Framework, led by the Office of the Prime Minister; (iii) the National Adaptation Plan of Action 2007, which deals with the challenges of climate change; (iv) the National HIV & AIDS Strategic Plan 2007/08‐2011/12; (v) the Development Assistance to Refugee Hosting Areas 2009‐2013, which promotes a holistic approach in tackling long‐term development needs of refugees and hosting communities; (vi) the Decentralization Plan, whose aim is to support the implementation of the Government’s national strategies at the district level while promoting the participation of citizens and local communities; (vii) the Water Supply and Sanitation Sector Investment Plan 2009‐2014; (viii) Health Sector Strategic Plan 2009/10‐2014/15; and (ix) the Justice Law and Order Sector Strategic Investment Plan 2006‐2011. Analysis from economic modelling shows that to maintain current growth levels and make progress in achieving social development targets, it is necessary to increase investments in priority sectors, including improvements in spending patterns.12 In line with the growth‐oriented approach of government envisaged in the new National Development Plan, the UN has identified that without making inroads in the human development realm the opportunities offered by economic growth will only reach limited segments of population of the country. The UN Development Assistance Framework is thus aimed to support the achievement of the national development plan priorities with focus on Equity and Inclusion, Peace and Recovery, Population Dynamics and Sustainable Growth.
2: Planned Results 2.1 Mainstreaming of Areas of Special Focus The UNDAF was designed as a results hierarchy, in accordance with principles of results‐based planning and management. As such, there are three broad UNDAF Outcome Areas, and within each of these areas, there are Agency Outcomes, and corresponding Outputs. The UNDAF reflects the national scope of the UN System in Uganda, but within that scope, six thematic areas, or areas of special focus, are mainstreamed and highlighted. 2.1.1 Northern Uganda After 21 years of conflict, death, destruction and suffering in northern Uganda, peace now prevails throughout the country. Following the 2006 cessation of hostilities agreement between the Government of Uganda and the Lord’s Resistance Army, stability and security has returned to the war‐affected northern region of Uganda. Uganda has begun a concerted plan for peace, recovery and development in affected areas in order to address large inequities in the distribution of income, wealth and access to services (Peace, Recovery and Development Plan – PRDP). The north now has the opportunity to realize the peace dividend achieved by the rest of the country in the 1990s. There is a national policy on durable solutions for internally displaced persons (IDPs), which recognizes three alternatives for ending displacement: (i) voluntary return to place of habitual residence; (ii) voluntary relocation to another part of the country; and (iii) local integration in areas in which IDPs take refuge. Already nearly a million IDPs have returned or are returning to their areas of origin. Over 400,000 remained displaced in 2009 and many returnees lack access to safe water, schooling and health care. Security, protection and income‐generating opportunities need to be provided for the people of northern Uganda, particularly to enable women, children, the elderly and disabled re‐build sustainable livelihoods. Another disadvantaged area of the country is the northeast, (Karamoja), where over 80 percent of the population live below the poverty line13 and experience the highest levels of deprivation in the country, as defined by the UNDP Human Poverty Index. In recent years, prolonged dry spells have further deepened the vulnerability of the population of the region, threatening livelihoods and resulting in poor nutrition and hunger. The number of food aid beneficiaries is expected to increase from the current 70 percent of the population to as many as 800,000, or nearly 80 percent of the total population of this region. Adding to the misery are animal and crop diseases, a low level of basic service provision in the region, and the frequency of raids, attacks and other criminal activities, which compromise the health, education and protection status of the population, particularly women and children.
12 Economic Management, Investment Options and Growth (2008/09‐2012/13), Background Paper on the NDP (2008/09‐2012/13) 13 PEAP report 2005
14
In October 2007, the Government launched its Peace, Recovery and Development Plan for Northern Uganda (PRDP) 2007–2010, which came into force in July 2008. The PRDP functions within the PEAP and also will be encompassed by the National Development Plan. In support of the PRDP, and the government’s delivery of services to the vulnerable populations of the north, the UN, in close collaboration with partners, developed a Peace‐Building and Recovery Assistance Plan (UNPRAP), 2009‐2011, a common strategy of UN support to activities for transition from humanitarian relief to recovery and long‐term development in northern Uganda. The UNPRAP is aimed at aligning UN interventions with the PRDP and other government frameworks for northern Uganda, as well as facilitating the UN system’s goal to ”deliver as one” in Uganda. As an elaborated subset of interventions with a recovery and geographic focus, mirrored by a special area of focus in the UNDAF, UNPRAP has contributed to the development of this UNDAF and will overlap with it by two years. The planned results in the UNPRAP and UNDAF also support the Karamoja Integrated Disarmament and Development Programme (KIDDP) 2007‐2010, whose implementation began in 2008. The KIDDP is a medium‐term framework harmonizing the various interventions by the Government and its development partners in the northeastern region. 2.1.2 Human Rights Uganda made important progress over the last decade in developing its institutional and legal framework to promote and protect the human rights of citizens, refugees and asylum seekers. The overall human rights situation has improved with the end of the conflict in the North. The most important challenges remain in the area of economic, social and cultural rights, especially of the most vulnerable groups of the population, including women. Vigilance and commitment are required to improve equal realization of political rights such as freedom of expression and association, right to personal liberty, security and bodily integrity; and of transitional justice (reconciliation, rights of the underserved to reparation, truth telling and justice). The independence and capacity development of the Uganda Human Rights Commission and of other civil society watchdogs are of central relevance for improving State accountability regarding human rights violations as well as for awareness raising and advocacy to improve the performance of the institutions in implementing policies and laws with a human rights perspective. Human rights and human development both aim to promote higher levels of well‐being and freedom, based on the inherent dignity and equality of all people. Through working towards Human Rights treaty obligations States are enabling opportunities such as those given by schooling, health care provision, equality guarantees and a functioning justice system. The Human Rights Approach to Programming (HRAP) addresses necessary outcomes to improve people’s lives, but also includes institutional development, policies, legal framework and participatory decision making. 2.1.3 Gender Uganda is a signatory to several major international human rights conventions related to women’s rights, such as the Convention for the Elimination of All Forms of Discrimination against Women (CEDAW) and the Beijing Platform for Action. Gender equality is a fundamental human rights principle.14 However, certain social and traditional norms and practices have prevented the implementation of some of these conventions. The continued existence of gender discriminatory laws and the slow pace of much‐needed legislation to address the root causes of violence against women and children further impede the attainment of gender equality. Gender inequality and the lack of respect for the rights of all human beings, regardless of sex, are both a cause and consequence of poverty and low educational attainment. A gender analysis of Uganda National Household Survey (UNHS 1992‐2003) data indicates that higher proportions of women‐headed households are chronically poor and move into poverty. Selling assets to avoid moving into poverty is far more common in female‐headed households than in male‐headed ones. The rise of new HIV infections (especially among couples), teenage pregnancies, unwanted pregnancies and early marriage are linked to gender inequality and the low status of women. Gender inequality is a contributing factor to the slow progress of the attainment of critical MDGs, including the reduction of maternal and child mortality, reduction in HIV&AIDS prevalence and gender parity in education. Although 60 percent of women have experienced gender‐based violence in some form, access to prevention and response services is limited. Factors contributing to gender‐based violence include traditional cultural practices, poverty, insecurity, alcohol abuse, and lack of information and rights awareness. Female genital mutilation remains a serious violation of rights in a few districts, but policymakers and civil society groups are joining the UN in mobilizing against it. Gender considerations are a special area of focus in this UNDAF because of the need to ensure that all proposed UN actions identify and address inequality and social exclusion. Promoting gender equality and advancing the status of
14 Art.33, Constitution of the Republic of Uganda, 1995.
15
women is a Millennium Development Goal and affects attainment of all the other MDGs. This UNDAF, therefore, mainstreams gender throughout the identified priority areas of governance, human rights, sustainable livelihoods and quality social services. 2.1.4 Environment Sustainable development rests on three pillars: economic growth, social progress and protection of our environment and natural resources. Responsible environmental management is essential to achieving overall sustainable development. Environmental sustainability is an explicit objective of Millennium Development Goal 7, and a thread that runs through all the other MDGs. Environment and natural resources enhance performance and productivity; they also provide the raw material for economic sectors. Agriculture and fisheries, for instance, contributed almost 45 percent of GDP in 2000. Furthermore, over 90 percent of households are dependent on forest wood for fuel. As the custodians of many natural resources, the rural poor are the most affected by environment and natural resource degradation and are the most vulnerable to environmental hazards. Therefore, the quantity and quality of environmental resources directly determine the achievement of socio‐economic human rights. Although the Government of Uganda has put in place strategies and plans to promote sound environmental management, the quality of the environment continues to decline. This serious trend of environmental degradation must be reversed. Environmental protection and management underlie the sustainable growth mentioned in the UN Vision Statement. Environmental issues are mainstreamed throughout the UNDAF, and are particularly addressed in Outcome 2 of the Uganda UNDAF, aimed at ensuring that vulnerable segments of the population increasingly benefit from sustainable livelihoods. In addition, the UN System proposes to implement a joint UN Programme on Climate Change. 2.1.5 Population Dynamics The PEAP evaluation in 2008 concluded that the most significant factor standing in the way of faster development in Uganda was its rapid, unmanaged population growth. Getting the balance right between population and economic growth rates is both complex and delicate; but if left unmanaged, high population growth can thwart nation‐building efforts and achievement of human rights. At present, in Uganda, population growth outstrips growth in vital services, including housing, utilities, employment, education and health care. A burgeoning population of young people with potential and ambition but constrained opportunity can increase vulnerability as well as unrest. For Uganda, managing the population growth means harnessing and channelling young people’s energies and potentials productively. It means reducing fertility by giving couples, women and men, options in family planning; and it means mobilizing the leadership to champion the right of individuals and couples to make choices on factors that affect equity and inclusion for the population and in the society; the choice of family size being one of these factors. Improving the status of women has a direct relationship with influencing the fertility choices of a family and improving the family well‐being. Uganda is at a critical juncture in its stride to become a middle‐income country and, as such, there is growing realization of the importance of population in development. Thus, the UN Vision Statement highlights population and sustainable growth, and related issues are addressed throughout the UNDAF Results Matrices. In addition, the UN system in Uganda plans to implement a joint programme on population. 2.1.6 HIV & AIDS The Millennium Development Goal 6 calls on the UN to support countries to halt and begin to reverse the spread of HIV. In the 1990s, Uganda was one of the few countries globally to have made progress toward this MDG. Yet, recent preliminary data indicates that the adult HIV prevalence rate is increasing, threatening a reversal of past gains.15 Females remain more likely than males to be infected, due to economic, cultural and biological reasons. The number of new infections continues to grow: in 2008 there were 1.1 million people living with HIV, of which 120,000 were children. The dynamics of the epidemic include multiple concurrent partnerships, low prevalence of male circumcision, low use of condoms, and low enrolment for Prevention of Mother to Child Transmission (PMTCT). Almost half of all new infections are among married people and those in long‐term relationships. Mother‐to‐child transmission accounts for 18 percent of all new infections. Only 39 percent of people requiring antiretroviral (ARV) treatment (approximately 156,000) are accessing it; 8 percent of those on ARV treatment are children. For every two people who start to take anti‐retroviral drugs, another five people become infected. In addition to the suffering by infected and affected persons and families, the AIDS pandemic continues to have deep, negative socio‐economic repercussions. These include increases in orphanhood, households headed by a single parent, grandparent or child, and multiplier effects on the percentage of households below the poverty line. Analysis
15 According to the HIV&AIDS surveillance report 2005‐2007, HIV prevalence in 2007 was estimated at 6.2 percent.
16
shows that the GDP grows by 1.2 percent less due to the macroeconomic effect of AIDS, and that AIDS increases the percentage of households living below the poverty line by 1.4 percent overall and by 1.6 percent in rural areas. The impact of HIV&AIDS is widespread and insidious, and calls for redoubled efforts to reach the target of universal access to prevention, treatment and care. Thus, HIV&AIDS is a special area of focus in the UNDAF and its results matrices. In addition, the most long‐standing and successful UN joint team and programme on HIV &AIDS will continue as an important operational mechanism of the UNDAF. 2.2 UNDAF Outcomes This section outlines the three UNDAF Outcomes that the UN aims to collectively achieve with partners. The complete results matrices, with outcomes and outputs, are contained in Appendix I: Results Matrix. 2.2.1 Definitions There are several terms used throughout the UNDAF to capture important concepts for development work in Uganda. While various definitions16 exist among UN agencies, Government Ministries and development partners, this UNDAF defines the terms as follows: Poverty is defined as a state of deprivation of an individual or group of individuals, due to a myriad of predisposing conditions surrounding the individual or group. Vulnerability can be defined as the probability of the individual or the group to experience deprivation now or sometime in the future, when the conditions change. Vulnerable segments of the population are defined as population groups whose survival, well‐being, development or other rights are threatened, and whose capacity to cope on their own is severely limited or compromised. Livelihoods are defined as “a person’s means of supporting oneself” or “financial means whereby one lives”. Social services are defined by the UN according to the six key areas under the UN Basic Social Services Act: (i) population services, with special emphasis on reproductive health and family planning services; (ii) primary health care; (iii) food and nutrition services; (iv) basic education; (v) drinking water and sanitation; and (vi) shelter services. In the Uganda context, this UNDAF adds (vii) HIV&AIDS prevention, treatment, care and support; and (viii) social protection,17 including livelihood safety nets, social welfare safety nets, and interventions to prevent and address violence, conflict and abuse, especially for children and women. Capacity building. Through the Triennial Comprehensive Policy Review of operational activities for development (TCPR), the Paris Declaration on Harmonization and Alignment, and more recently at the 2005 World Summit, Member States have called for the UN system to enhance its efforts particularly at country level to support national capacity development. The overall goal of the UN at country level is to help the national counterparts develop their capacities to lead, manage, achieve and account for their national development priorities. This is especially so for those related to the MDGs and internationally agreed development goals, as well as human rights obligations in ratified UN conventions and treaties. The capacity development agenda reinforces the UNCTs role and responsibilities as multilateral organizations accountable to the Member States and guided by the principles of a human rights‐based approach. It is also integral to and builds on the relationship of trust derived from this multilateral mandate and long‐standing presence and relations at country level. 2.2.2 Governance and Human Rights UNDAF Outcome 1: Capacity of selected Government Institutions and Civil Society improved for good governance and realization of human rights that lead to reducing geographic, socio‐economic and demographic disparities in attainment of Millennium Declaration and Goals by 2014. Agency Outcomes:
16 The terms can be further understood through the specific results statements and the indicators in the results and monitoring and evaluation matrices. 17 In the Ugandan context, social protection is defined as all formal and informal initiatives that provide assistance to extremely poor individuals and households, enhance delivery of services to groups who need special attention or would otherwise be denied access to basic services (MGLSD NDP working Paper).
17
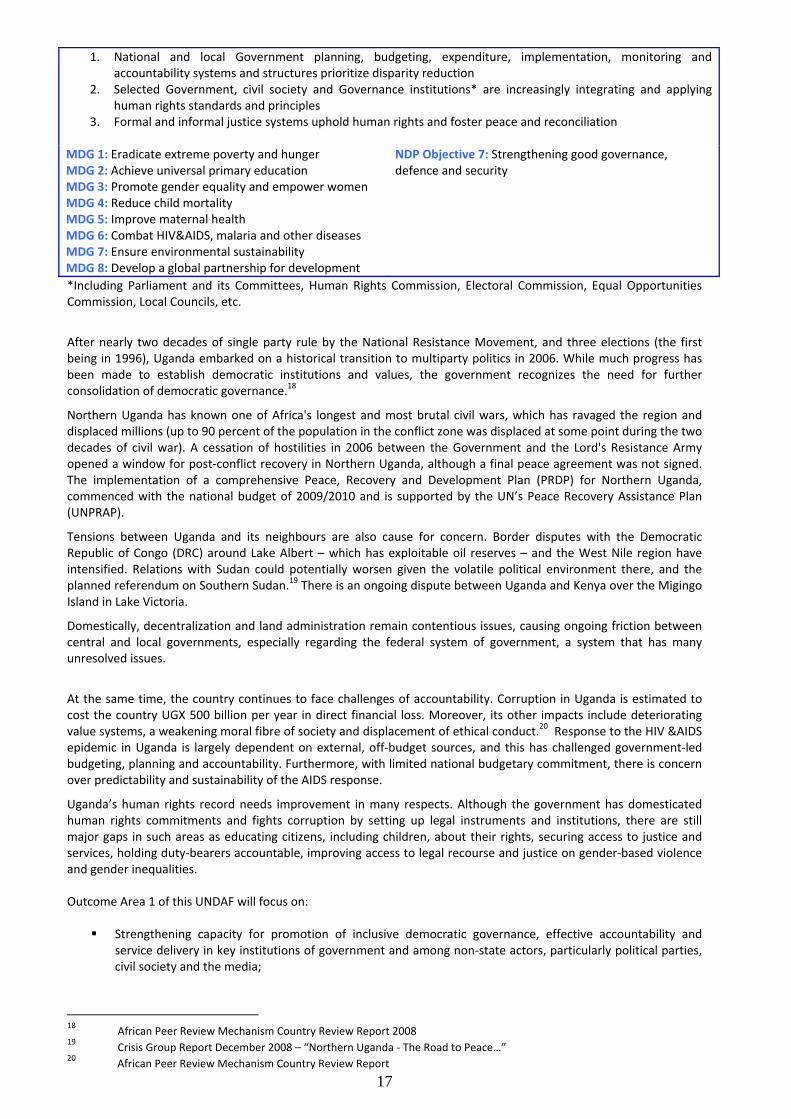
1. National and local Government planning, budgeting, expenditure, implementation, monitoring and accountability systems and structures prioritize disparity reduction
2. Selected Government, civil society and Governance institutions* are increasingly integrating and applying human rights standards and principles
3. Formal and informal justice systems uphold human rights and foster peace and reconciliation MDG 1: Eradicate extreme poverty and hunger MDG 2: Achieve universal primary education MDG 3: Promote gender equality and empower women MDG 4: Reduce child mortality MDG 5: Improve maternal health MDG 6: Combat HIV&AIDS, malaria and other diseases MDG 7: Ensure environmental sustainability MDG 8: Develop a global partnership for development
NDP Objective 7: Strengthening good governance, defence and security
*Including Parliament and its Committees, Human Rights Commission, Electoral Commission, Equal Opportunities Commission, Local Councils, etc.
After nearly two decades of single party rule by the National Resistance Movement, and three elections (the first being in 1996), Uganda embarked on a historical transition to multiparty politics in 2006. While much progress has been made to establish democratic institutions and values, the government recognizes the need for further consolidation of democratic governance.18
Northern Uganda has known one of Africa's longest and most brutal civil wars, which has ravaged the region and displaced millions (up to 90 percent of the population in the conflict zone was displaced at some point during the two decades of civil war). A cessation of hostilities in 2006 between the Government and the Lord's Resistance Army opened a window for post‐conflict recovery in Northern Uganda, although a final peace agreement was not signed. The implementation of a comprehensive Peace, Recovery and Development Plan (PRDP) for Northern Uganda, commenced with the national budget of 2009/2010 and is supported by the UN’s Peace Recovery Assistance Plan (UNPRAP).
Tensions between Uganda and its neighbours are also cause for concern. Border disputes with the Democratic Republic of Congo (DRC) around Lake Albert – which has exploitable oil reserves – and the West Nile region have intensified. Relations with Sudan could potentially worsen given the volatile political environment there, and the planned referendum on Southern Sudan.19 There is an ongoing dispute between Uganda and Kenya over the Migingo Island in Lake Victoria.
Domestically, decentralization and land administration remain contentious issues, causing ongoing friction between central and local governments, especially regarding the federal system of government, a system that has many unresolved issues.
At the same time, the country continues to face challenges of accountability. Corruption in Uganda is estimated to cost the country UGX 500 billion per year in direct financial loss. Moreover, its other impacts include deteriorating value systems, a weakening moral fibre of society and displacement of ethical conduct.20 Response to the HIV &AIDS epidemic in Uganda is largely dependent on external, off‐budget sources, and this has challenged government‐led budgeting, planning and accountability. Furthermore, with limited national budgetary commitment, there is concern over predictability and sustainability of the AIDS response.
Uganda’s human rights record needs improvement in many respects. Although the government has domesticated human rights commitments and fights corruption by setting up legal instruments and institutions, there are still major gaps in such areas as educating citizens, including children, about their rights, securing access to justice and services, holding duty‐bearers accountable, improving access to legal recourse and justice on gender‐based violence and gender inequalities. Outcome Area 1 of this UNDAF will focus on:
Strengthening capacity for promotion of inclusive democratic governance, effective accountability and service delivery in key institutions of government and among non‐state actors, particularly political parties, civil society and the media;
18 African Peer Review Mechanism Country Review Report 2008 19 Crisis Group Report December 2008 – “Northern Uganda ‐ The Road to Peace…” 20 African Peer Review Mechanism Country Review Report
18
Strengthening capacity of national government to dialogue with political parties and civil society organizations on issues of governance;
Strengthening capacity of national and local government for planning, budgeting, implementation, monitoring and accountability for disparity reduction, including gender disparities;
Strengthening capacity for incorporating the voices of the poor, marginalized and vulnerable people in public policy and building consensus over how to address key development challenges;
Strengthening socio‐economic policies in line with key cross‐cutting principles, as well as capacity to coordinate and manage the implementation of development strategies at all levels of government;
Strengthening capacity for data collection, disaggregation and analysis; Promoting a conducive policy environment that supports equity and strengthens the inclusive dimensions of
the growth agenda of the Government, as described in the National Development Plan; Strengthening oversight and decision‐making; promoting public awareness and empowerment on rights and
entitlements; and building inclusive, peaceful and transparent electoral processes; Strengthening capacity for integrating human rights standards and principles by formal and informal justice
systems for upholding human rights, peace and reconciliation; Strengthening the capacity to report on and implement recommendations from international and regional
Human Rights Covenants and other conventions; as well as for human rights observance and protection of persons whose rights are abused, including refugees and displaced populations, especially marginalized groups;
Strengthening the capacity of national and local governments and civil society to undertake peace‐building and community security initiatives and recovery efforts so as to ensure the necessary conditions for development in northern and northeastern Uganda (Karamoja).
Empowering women to influence and contribute to security, justice and peace building in northern and northeastern Uganda (Karamoja).
2.2.3 Sustainable Livelihoods
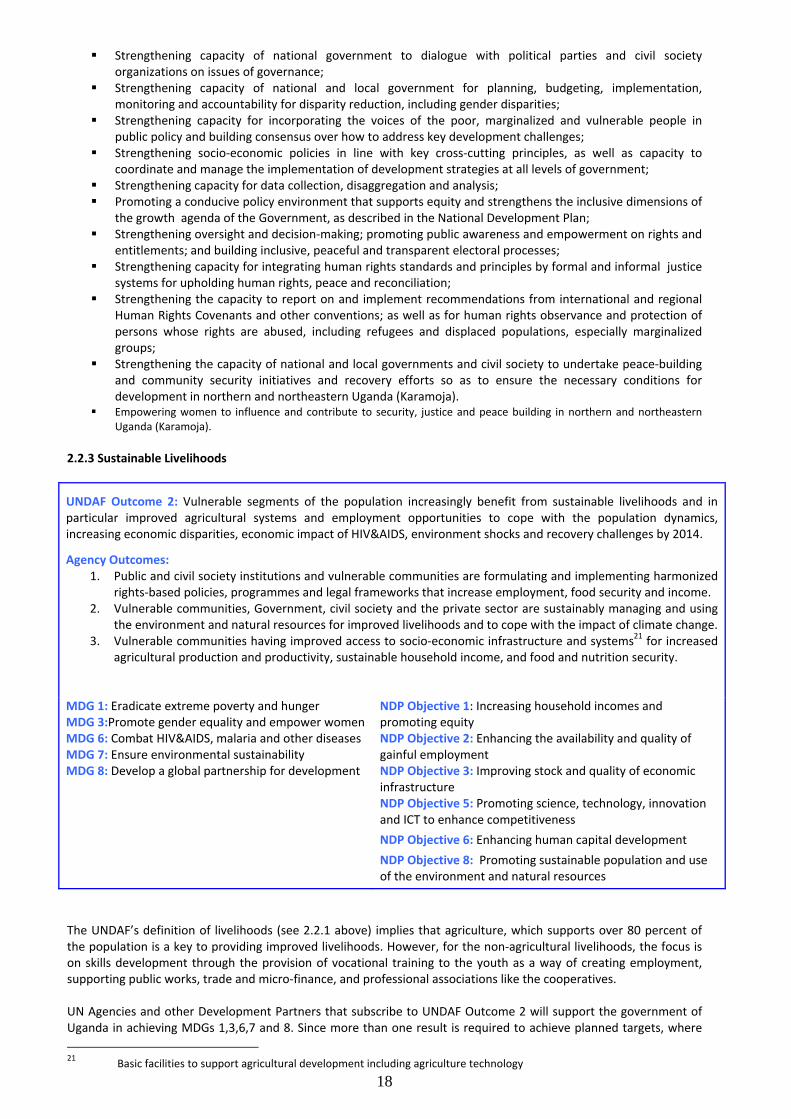
UNDAF Outcome 2: Vulnerable segments of the population increasingly benefit from sustainable livelihoods and in particular improved agricultural systems and employment opportunities to cope with the population dynamics, increasing economic disparities, economic impact of HIV&AIDS, environment shocks and recovery challenges by 2014.
Agency Outcomes: 1. Public and civil society institutions and vulnerable communities are formulating and implementing harmonized
rights‐based policies, programmes and legal frameworks that increase employment, food security and income. 2. Vulnerable communities, Government, civil society and the private sector are sustainably managing and using
the environment and natural resources for improved livelihoods and to cope with the impact of climate change.3. Vulnerable communities having improved access to socio‐economic infrastructure and systems21 for increased
agricultural production and productivity, sustainable household income, and food and nutrition security. MDG 1: Eradicate extreme poverty and hunger MDG 3:Promote gender equality and empower women MDG 6: Combat HIV&AIDS, malaria and other diseases MDG 7: Ensure environmental sustainability MDG 8: Develop a global partnership for development
NDP Objective 1: Increasing household incomes and promoting equity NDP Objective 2: Enhancing the availability and quality of gainful employment NDP Objective 3: Improving stock and quality of economic infrastructure NDP Objective 5: Promoting science, technology, innovation and ICT to enhance competitiveness NDP Objective 6: Enhancing human capital development NDP Objective 8: Promoting sustainable population and use of the environment and natural resources
The UNDAF’s definition of livelihoods (see 2.2.1 above) implies that agriculture, which supports over 80 percent of the population is a key to providing improved livelihoods. However, for the non‐agricultural livelihoods, the focus is on skills development through the provision of vocational training to the youth as a way of creating employment, supporting public works, trade and micro‐finance, and professional associations like the cooperatives. UN Agencies and other Development Partners that subscribe to UNDAF Outcome 2 will support the government of Uganda in achieving MDGs 1,3,6,7 and 8. Since more than one result is required to achieve planned targets, where 21 Basic facilities to support agricultural development including agriculture technology
19
the UN Agencies and Government contribute to one or two, other development partners will commit to achieving others. Some results are chosen over others because of priority setting based on the results of Meta Analysis,22 where key areas selected for support are based on key sector constraints in line with national needs and objectives, and are within areas where specific Agencies have comparative advantages and are within UN mandate. Government priorities within the NDP are aligned to the MDGs, which are supported by all the world’s states and its leading development institutions, and which, collectively within the Millennium Declaration, form a global agenda for development. As mentioned in the Situation Analysis (section 1.1), Uganda has made progress on many of the MDGs, including poverty. Under Goal 3, the target on the proportion of women in wage employment in the non‐agricultural sector is likely to be achieved, given that the indicator now stands at 50 percent of the total employed, rising from an average of 11 percent recorded for four years between 2003 and 2006, and 28.2 percent in 2005/06. On MDG 7, government and development partners are now more concerned about climate change. The major concern is to halt deforestation and industrial logging, while protecting the rights of forest communities and increasing forestation. Highly prevalent diseases such as malaria and HIV&AIDS have well‐documented adverse macroeconomic and social impact. For example, one study shows that HIV&AIDS raises the overall headcount poverty rate by 1.4 percentage points. The impact is greater in rural areas, where poverty rises by 1.6 percentage points compared to 0.9 percentage points in urban areas. The poverty and vulnerability effects of HIV are multi‐generational as Ugandan households sell off assets to fund long‐term health care. It should be noted that attaining most of the targets will require increased support within the agricultural sector for reasons not too far to seek. First, agriculture is a key sector of the Ugandan economy; it employs 77 percent of the working population, comprises agriculture and fishery workers; contributes over 80 percent of export earnings; and engages about 40 percent of the manufacturing sector in food processing. The sector supports about 4.6 million agricultural households,23 which is about 24 million persons of the estimated 29.6 total Ugandan population. In addition, agriculture is important for stimulating economic growth through the supply of raw materials to agro‐industries, supporting the development of food and nutrition security systems, as well as income enhancement and employment. The share of agriculture in total GDP is, however, continuing to decline: from 15.7 percent in 2007/08 to about 15.1 percent in 2009. At current market prices, agriculture contributed 15.7 percent of GDP in 2008/09 compared to 21.2 percent in 2007/2008. Similarly, the crops subsector growth declined from 5.4 percent in 2006/2007 to 1.7 percent in 2008/2009, the fisheries from ‐3.0 percent to ‐0.1 percent in the same period, while livestock growth remained at 3.0 percent. Only forestry had a positive growth from 2.0 percent to 3.3 percent. In Karamoja, pastoralism is an important (and in some places the primary) component of the populations' livelihoods. The UN will support pastoral livelihoods in two complementary ways. On the one hand, it will work to strengthen pastoralism by focusing on activities that help to sustain herds (e.g. watershed management, vaccinations) and that link livestock products to markets. On the other hand, it will engage with the communities to identify and support alternative livelihood options (e.g. gum Arabic) for agro‐pastoralists and pastoralists, to give them a greater range of choices for meeting their needs in a sustainable manner. According to FAO (2008) and the World Bank Development Report (2008), supporting agricultural sector development has a comparative advantage in that it reduces rural poverty and increases employment through on‐and‐off farm enterprises. The potential for Uganda in the agriculture sector, therefore, hinges on increasing agricultural output through higher productivity, and adopting improved planting seedlings and better breeds. It also rests on improved agricultural production methods, increasing labour productivity, value addition and product diversification, as also indicated in prior assessment in the Meta Analysis. In addition, it is indicated in the Ministry of Finance, Planning and Economic Development 2009/10 Budget Speech that increased agricultural production is essential for economic transformation and prosperity for all and has strong multiplier effects because of its linkages with other sectors. For example, an increase in production addresses high food prices by increasing supply, increasing exports in areas where Uganda has a niche and addressing food security and nutrition.
Outcome Area 2 of this UNDAF will focus on:
Promoting the review, development, harmonization and dissemination of policies, programmes and laws; Strengthening capacity building to implement policies and laws for household economic, food and nutrition
security, employment, environment and natural resources;
22 UNDAF – Uganda: Meta‐Analysis of the Levels, Trends and Causes of the Main Development and Humanitarian Challenges; Internal UNCT document; August 1, 2009 23 Uganda Bureau of Statistics, 2008
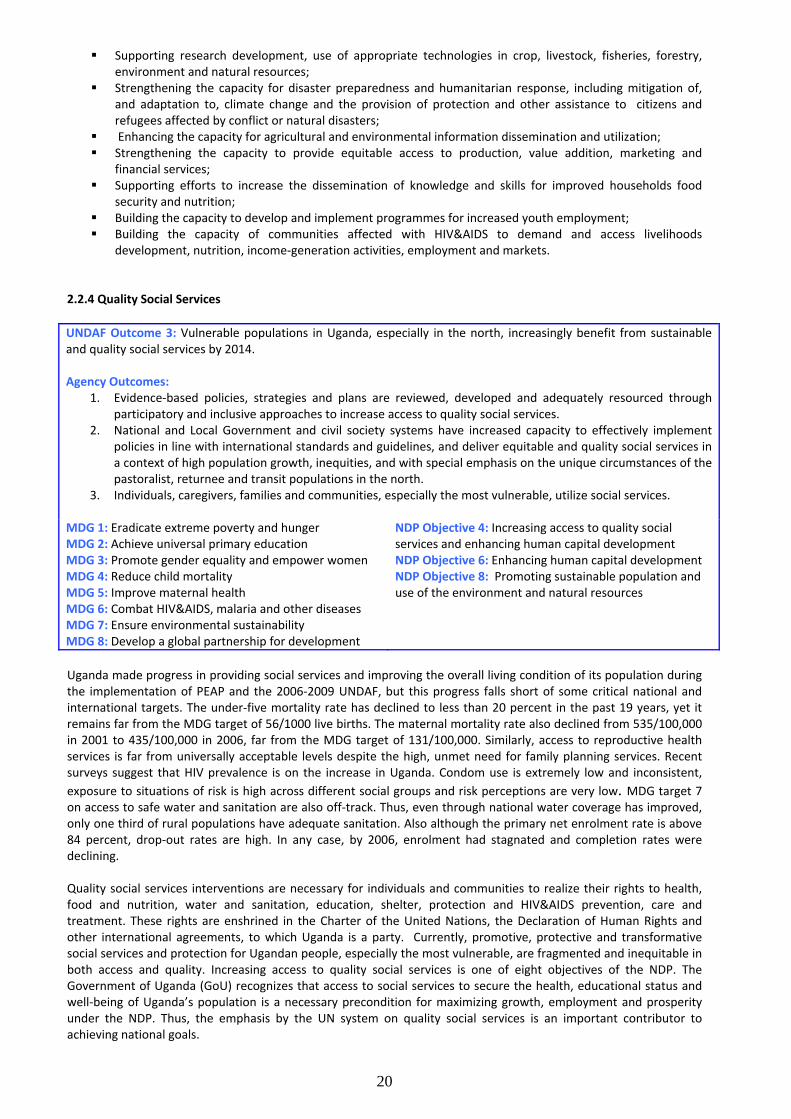
20
Supporting research development, use of appropriate technologies in crop, livestock, fisheries, forestry, environment and natural resources;
Strengthening the capacity for disaster preparedness and humanitarian response, including mitigation of, and adaptation to, climate change and the provision of protection and other assistance to citizens and refugees affected by conflict or natural disasters;
Enhancing the capacity for agricultural and environmental information dissemination and utilization; Strengthening the capacity to provide equitable access to production, value addition, marketing and
financial services; Supporting efforts to increase the dissemination of knowledge and skills for improved households food
security and nutrition; Building the capacity to develop and implement programmes for increased youth employment; Building the capacity of communities affected with HIV&AIDS to demand and access livelihoods
development, nutrition, income‐generation activities, employment and markets. 2.2.4 Quality Social Services UNDAF Outcome 3: Vulnerable populations in Uganda, especially in the north, increasingly benefit from sustainable and quality social services by 2014. Agency Outcomes:
1. Evidence‐based policies, strategies and plans are reviewed, developed and adequately resourced through participatory and inclusive approaches to increase access to quality social services.
2. National and Local Government and civil society systems have increased capacity to effectively implement policies in line with international standards and guidelines, and deliver equitable and quality social services in a context of high population growth, inequities, and with special emphasis on the unique circumstances of the pastoralist, returnee and transit populations in the north.
3. Individuals, caregivers, families and communities, especially the most vulnerable, utilize social services. MDG 1: Eradicate extreme poverty and hunger MDG 2: Achieve universal primary education MDG 3: Promote gender equality and empower women MDG 4: Reduce child mortality MDG 5: Improve maternal health MDG 6: Combat HIV&AIDS, malaria and other diseases MDG 7: Ensure environmental sustainability MDG 8: Develop a global partnership for development
NDP Objective 4: Increasing access to quality social services and enhancing human capital development NDP Objective 6: Enhancing human capital development NDP Objective 8: Promoting sustainable population and use of the environment and natural resources
Uganda made progress in providing social services and improving the overall living condition of its population during the implementation of PEAP and the 2006‐2009 UNDAF, but this progress falls short of some critical national and international targets. The under‐five mortality rate has declined to less than 20 percent in the past 19 years, yet it remains far from the MDG target of 56/1000 live births. The maternal mortality rate also declined from 535/100,000 in 2001 to 435/100,000 in 2006, far from the MDG target of 131/100,000. Similarly, access to reproductive health services is far from universally acceptable levels despite the high, unmet need for family planning services. Recent surveys suggest that HIV prevalence is on the increase in Uganda. Condom use is extremely low and inconsistent, exposure to situations of risk is high across different social groups and risk perceptions are very low. MDG target 7 on access to safe water and sanitation are also off‐track. Thus, even through national water coverage has improved, only one third of rural populations have adequate sanitation. Also although the primary net enrolment rate is above 84 percent, drop‐out rates are high. In any case, by 2006, enrolment had stagnated and completion rates were declining. Quality social services interventions are necessary for individuals and communities to realize their rights to health, food and nutrition, water and sanitation, education, shelter, protection and HIV&AIDS prevention, care and treatment. These rights are enshrined in the Charter of the United Nations, the Declaration of Human Rights and other international agreements, to which Uganda is a party. Currently, promotive, protective and transformative social services and protection for Ugandan people, especially the most vulnerable, are fragmented and inequitable in both access and quality. Increasing access to quality social services is one of eight objectives of the NDP. The Government of Uganda (GoU) recognizes that access to social services to secure the health, educational status and well‐being of Uganda’s population is a necessary precondition for maximizing growth, employment and prosperity under the NDP. Thus, the emphasis by the UN system on quality social services is an important contributor to achieving national goals.
21
The period covered by the new NDP and this UNDAF is the countdown to the MDGs in 2015. Special emphasis is required in meeting the MDG targets where Uganda is significantly off‐track: MDG 1 (to reduce hunger), MDGs 4 and 5 (to reduce child and maternal mortality); MDG 7 (to address poor access to sanitation services and poor progress on environmental targets); and MDG 6 (in view of the current increase in HIV prevalence). Through UNDAF Outcome 3, the UN focuses its support to Government for the implementation of NDP on ensuring that vulnerable populations in Uganda, especially pastoralists, returnees and transit populations in the north and northeast have increased access to and use of sustainable and quality social and protective services by 2014. There is a special emphasis on addressing issues of high population growth, inequities, HIV&AIDS, sustainability and disaster risk reduction with an emphasis on building community resilience. UN support will be directed at (i) the policy level to ensure participation in the development or adaptation of policies to boost social service access and quality; (ii) the ”system” level to ensure that Government and civil society have the capacity to effectively implement policies and deliver more effective and equitable social services; and (iii) the individual and community level, to increase demand for use of services. The constraints and challenges faced by the social service sector fall into three broad categories, in line with the levels of UN support: (i) ensuring that effective policies, strategies, plans are in place; (ii) promoting access by ensuring that critical inputs are in place for effective social service delivery, including management and planning capacity as well as human and financial resources; and (iii) addressing critical gaps in ”demand” for socials services through building the awareness and capacity of individuals, families and communities to demand quality social services and effectively use such services; and protect themselves against vulnerability, risk and deprivation. Outcome Area 3 of this UNDAF will focus on:
Strengthening evidence‐based policy development, knowledge generation and advocacy, and adequate resources;
Improving systems for promoting quality and efficiency of service delivery; Raising awareness and capacity development of individuals, families and communities.
3: Initiatives Outside the UNDAF Results Matrix As of 2009, the UN continues to lead the Inter‐Agency Standing Committee (IASC) for Coordinated Humanitarian Response, and is strengthening capacity of Government to take over this role completely. As of 2009/10, Uganda continues to need a Consolidated Appeals Process (CAP) to coordinate remaining emergency and humanitarian needs addressed by the UN, NGOs and donors. CAP is based on a commonly agreed definition of humanitarian action in Uganda targeting at‐risk communities in areas prone to and/or recovering from conflict and natural disasters. CAP aims at saving lives by ensuring an effective and rapid emergency response; supplementing the provision of basic services and livelihoods to help achieve the three durable solutions to displacement; and protecting crisis‐prone communities by reducing the impact of potential natural and man‐made hazards and strengthening disaster preparedness for effective response. CAP complements the recovery interventions in the UNPRAP. By contrast, the UNDAF does not include humanitarian response, but it does include increased governmental and community capacity for disaster risk reduction, and for emergency preparedness and response.
4: Estimated Resource Requirements
The United Nations Country Team estimates that a minimum of US $911.4 million will be required to achieve the results in the UNDAF. This consists of US $184.5 million of regular (core) resources, which are provided by agencies’ respective headquarters and US $726.9 million in other (non‐core) resources to be raised from multilateral and bilateral donors and other external sources. The resource envelope shown in Table 2 includes funding from UN agencies that have presented their funding status to the UNDAF Theme Groups. Preliminary estimates indicate that the UNDAF budget will be distributed across the three UNDAF Outcomes as follows: US $210.3 million will be allocated to Governance and Rule of Law; US $272.7 million to Sustainable Livelihood; and US $428.4 million to Quality Basic Social Services. These indicative figures are likely to change as programme implementation progresses and the programming context evolves over time.

22
Table 2: Indicative, Planning Figures for Regular (RR) and Other Resources (OR) of Resident Funds, Programmes and Agencies, per UNDAF Outcome Area in Millions of US Dollars24 * UNDAF Outcome 1 UNDAF Outcome 2 UNDAF Outcome 3 Total per agency RR: OR: RR: OR: RR: OR: FAO 0 0 7.5 35 0 0 42.5 IAEA 0 0.8 0 1.6 0 2.5 4.9 ILO 0 0 0 1.0 0 0 1.0 IOM 0 67 0 13.9 0 4.4 85.3 UNAIDS 1 1 0.1 0 0.5 1 3.6 UNCDF 0.17 0 0.23 0 1.0 0 1.4 UNESCO 0.08 0.35 0.095 0.35 0.625 1.2 2.7 UN‐HABITAT 0 0 0 0 0 45.5 45.5 UNICEF 2 0.11 0 0 65 120.9 188 UNIFEM 1.8 7.1 1.2 6 0 0 16.1 UNDP 26.4 14.3 22.1 20 2 2 86.8 UNFPA 2.2 2 4.1 3 23.7 10 45 UNHCR 0 65.1 0 36.9 0 69.2 171.2 UN‐OHCHR 16.5 2.4 0 0 0 0 18.9 WFP 0 0 0 119.6 0 38.7 158.3 WHO 0 0 0 0 6.2 34 40.2 Total RR/OR: tbd tbd tbd tbd tbd tbd tbd *Figures in Table 2 are indicative, and subject to the success of resource mobilization efforts. The actual funding level will depend on amount of donor participation and contribution to each UNDAF outcome area.
5: Implementation, Management and Coordination 5.1 Paris Declaration and Accra Agenda for Action “Using a country’s own institutions and systems, where these provide assurance that aid will be used for agreed purposes, increases aid effectiveness by strengthening the partner country’s sustainable capacity to develop, implement and account for its policies to its citizens and parliament”. (Paris Declaration on Aid Effectiveness, Para. 17). “Evidence shows that we will need to address three major challenges to accelerate progress on aid effectiveness: Country ownership is key; [ ] Building more effective and inclusive partnerships; [ ] and Achieving development results—and openly accounting for them—must be at the heart of all we do; [ ]. Without addressing these obstacles to faster progress, we will fall short of our commitments and miss opportunities to improve the livelihoods of the most vulnerable people in the world. (Accra Agenda for Action, page 1) This UNDAF adheres to the principles in the Paris Declaration, and to the commitments in the subsequent Accra Agenda for Action. The UN harmonized the start and duration of this UNDAF with the NDP, harmonized the UNDAF Outcomes with the national priorities in the NDP, and will implement the UNDAF under country leadership and management. The UN will strengthen and use Ugandan institutions and systems to the maximum extent possible. To reduce costly fragmentation of aid, the UN participates in donor working groups, has increased joint programming and programmes, and adheres to agreed divisions of labour. The UNDAF will build government’s capacity for accountability, and the UN in turn will manage for results, and be accountable and transparent in reporting on results in this UNDAF. 5.2 Delivering as One United Nations The United Nations system in Uganda consists of 11 resident and nine non‐resident agencies, programmes and funds.25 While each United Nations agency pursues its specific mandate, each is committed to collaborating within the UNDAF and the resident coordinator system. When preparing this UNDAF, the UN Country Team (UNCT) put considerable emphasis on ensuring that the process, product and implementation plan are in line with the Delivering as One UN reform agenda of the Secretary General. UNDP, UNFPA, UNICEF, and WFP have harmonized their
24 Other agencies, particularly non‐resident agencies, including IFAD, UNEP, UNIDO and UN‐OCHA will also contribute. 25 The Bretton Woods system is also present in Uganda through IMF and World Bank Country Offices.
23
programming cycles, and adopted common country programming processes. The UNDAF is inclusive of all work by resident and non‐resident agencies in Uganda. The UN in Uganda aims to deliver one programme through the UNDAF, under one leader, the Resident Coordinator, with one budgetary framework tied to the results in the UNDAF. The UN also aims to deliver as “one office” through several shared services, a common security system, a common cash transfer system (UNDP, UNFP, UNICEF, WFP), and shared premises at regional level. Delivering the UNDAF results as One UN will allow the UN to achieve greater effectiveness and efficiency. This will be achieved through four mechanisms:
i. Establish or strengthen joint management and coordination mechanisms within the UN system, including for planning, monitoring, reviewing, evaluating and reporting;
ii. Implement special areas of focus and other cross‐cutting programmes through joint programming; iii. Commit to a coordinated engagement in government‐led sector working groups that promote national
leadership, management and implementation;26 iv. Provide coordinated support to the Local Development Partner Group (LDPG) and its sector‐specific
subgroups. These four mechanisms are described in more detail in Sections 5.3 and 5.4. The consensus between government and UN is to advance further Delivering as One through a mechanism led by Ministry of Finance. 5.3 Operational Mechanisms, Management and Coordination The UNDAF will be implemented through the government‐approved UN country programme documents, plans, notes or strategies. These Agency programmes or projects will contribute clearly to the Outcomes and Outputs in the UNDAF. The UN System in Uganda is coordinated by the Resident Coordinator, who is also the Humanitarian Coordinator. The Office of the UN Resident Coordinator (RCO) plays an important role in overall coordination of the UN system in Uganda, including coordination of UN programme and operational management mechanisms. These include the UN Programme Management Team, the UN Operations Management Team, the UN Monitoring and Evaluation Working Group, and the UN Communication Group. The UN Programme Management Team that consists of UN agency deputies provides supervision and guidance to the UNDAF Outcome groups and M&E group. The UN Operations Management Team oversees and expands common service areas, for greater efficiency. The Heads of Agency of the UNCT will oversee the implementation, monitoring, review and reporting of the UNDAF, will ensure the effectiveness and efficiency of UN support to national systems, and will identify and implement change for greater delivery as one UN. The UNCT will receive and analyse monitoring and evaluation reports and ensure that the recommendations and lessons learnt are incorporated in the annual work‐planning processes. Furthermore, the UNCT and the GoU are committed to ensuring that adequate funds are available to implement the monitoring and evaluation activities required by this UNDAF. Improved harmonization of programme delivery will be achieved through joint programming and more joint programmes. Joint programming is the collective effort through which the UN organizations and national partners work together to prepare, implement, monitor and evaluate common activities aimed at effectively and efficiently achieving the MDGs and other international commitments arising from UN conferences, summits, conventions and human rights instruments. Through joint programming, common results and the modalities for supporting programme implementation are identified. It is meant to avoid duplication, reduce transaction costs and maximize synergies among the national partners and the differing contributions of UN system organizations. In addition, joint programmes with one budget,27 one work plan and one monitoring, review and reporting mechanism, have been identified. Each Joint Programme will be implemented by a Joint Team with a steering committee. These Joint Teams will speak with one voice within relevant Government‐led sector working groups. Joint programmes ongoing or under development in late 2009 are listed in Table 5.3.1.
26 Implementation by the national government is called national execution, or NEX, by UNDP 27 Joint programmes will be implemented through various funding mechanisms, as described in the Guidelines for UN Joint Programmes
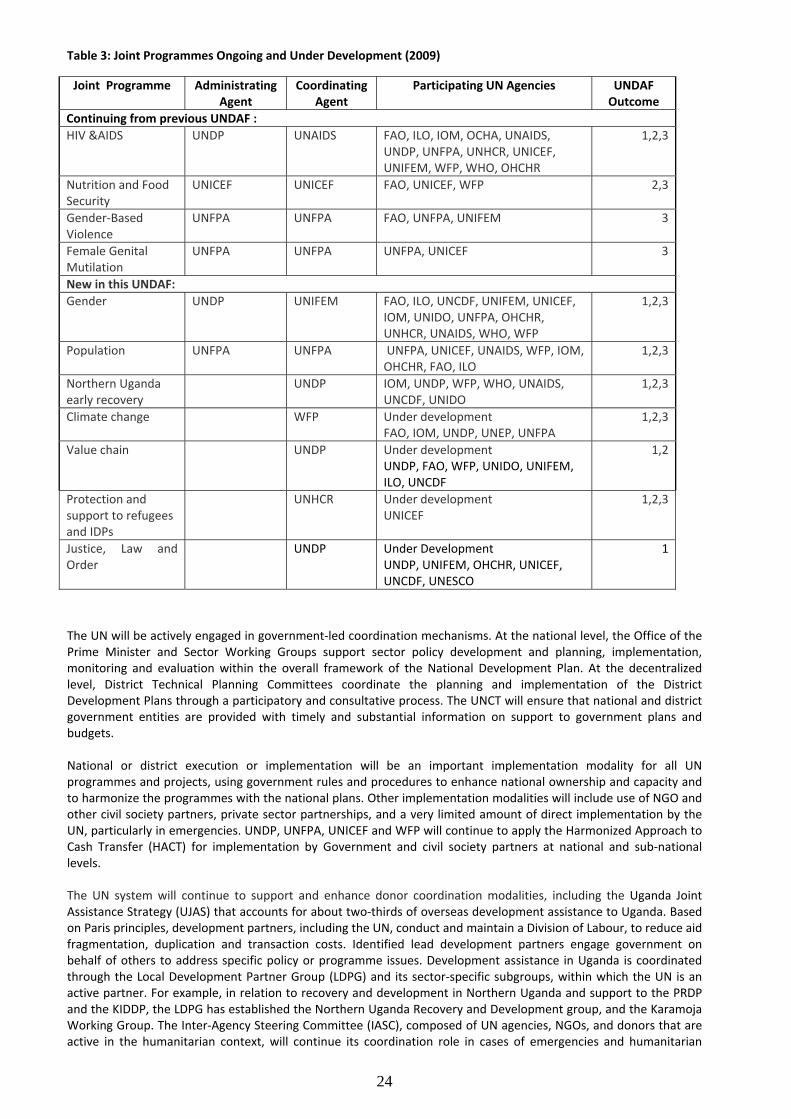
24
Table 3: Joint Programmes Ongoing and Under Development (2009)
The UN will be actively engaged in government‐led coordination mechanisms. At the national level, the Office of the Prime Minister and Sector Working Groups support sector policy development and planning, implementation, monitoring and evaluation within the overall framework of the National Development Plan. At the decentralized level, District Technical Planning Committees coordinate the planning and implementation of the District Development Plans through a participatory and consultative process. The UNCT will ensure that national and district government entities are provided with timely and substantial information on support to government plans and budgets. National or district execution or implementation will be an important implementation modality for all UN programmes and projects, using government rules and procedures to enhance national ownership and capacity and to harmonize the programmes with the national plans. Other implementation modalities will include use of NGO and other civil society partners, private sector partnerships, and a very limited amount of direct implementation by the UN, particularly in emergencies. UNDP, UNFPA, UNICEF and WFP will continue to apply the Harmonized Approach to Cash Transfer (HACT) for implementation by Government and civil society partners at national and sub‐national levels. The UN system will continue to support and enhance donor coordination modalities, including the Uganda Joint Assistance Strategy (UJAS) that accounts for about two‐thirds of overseas development assistance to Uganda. Based on Paris principles, development partners, including the UN, conduct and maintain a Division of Labour, to reduce aid fragmentation, duplication and transaction costs. Identified lead development partners engage government on behalf of others to address specific policy or programme issues. Development assistance in Uganda is coordinated through the Local Development Partner Group (LDPG) and its sector‐specific subgroups, within which the UN is an active partner. For example, in relation to recovery and development in Northern Uganda and support to the PRDP and the KIDDP, the LDPG has established the Northern Uganda Recovery and Development group, and the Karamoja Working Group. The Inter‐Agency Steering Committee (IASC), composed of UN agencies, NGOs, and donors that are active in the humanitarian context, will continue its coordination role in cases of emergencies and humanitarian
Joint Programme Administrating Agent
Coordinating Agent
Participating UN Agencies UNDAF Outcome
Continuing from previous UNDAF : HIV &AIDS UNDP UNAIDS FAO, ILO, IOM, OCHA, UNAIDS,
UNDP, UNFPA, UNHCR, UNICEF, UNIFEM, WFP, WHO, OHCHR
1,2,3
Nutrition and Food Security
UNICEF UNICEF FAO, UNICEF, WFP 2,3
Gender‐Based Violence
UNFPA UNFPA FAO, UNFPA, UNIFEM 3
Female Genital Mutilation
UNFPA UNFPA UNFPA, UNICEF 3
New in this UNDAF: Gender UNDP UNIFEM FAO, ILO, UNCDF, UNIFEM, UNICEF,
IOM, UNIDO, UNFPA, OHCHR, UNHCR, UNAIDS, WHO, WFP
1,2,3
Population UNFPA UNFPA UNFPA, UNICEF, UNAIDS, WFP, IOM, OHCHR, FAO, ILO
1,2,3
Northern Uganda early recovery
UNDP IOM, UNDP, WFP, WHO, UNAIDS, UNCDF, UNIDO
1,2,3
Climate change WFP Under developmentFAO, IOM, UNDP, UNEP, UNFPA
1,2,3
Value chain UNDP Under development UNDP, FAO, WFP, UNIDO, UNIFEM, ILO, UNCDF
1,2
Protection and support to refugees and IDPs
UNHCR Under developmentUNICEF
1,2,3
Justice, Law and Order
UNDP Under DevelopmentUNDP, UNIFEM, OHCHR, UNICEF, UNCDF, UNESCO
1

25
response. The UN will continue to participate in development partners’ coordination mechanisms and programmes, yet will adhere to its normative role and the General Assembly mandates. 5.4 Roles of Partners28 Delivery of the outcome and output results in the UNDAF is to be ensured through Government‐led planning and implementation mechanisms, including the National Planning Authority, Sectoral and Intersectoral Working Groups and Committees and District Implementation Teams. The Ministry of Finance, Planning and Economic Development and other key ministries29 will take the lead role in the development of policies and strategies, standards setting, human resource strengthening, capacity building, budget allocation, behaviour change communication for development, quality assurance, emergency preparedness and response, and assuring political commitment to the implementation of the UNDAF. Partnership with civil society and private sector organizations in the delivery of planned results will also remain important in regards to human resource strengthening, service delivery, community mobilization, institution strengthening and capacity building, resource mobilization and advocacy. Bilateral and multilateral partners remain important to the UN system and to the achievement of the UNDAF results. Their role will be as partners in coordination and joint assistance strategy development, both within and outside sector working groups. In addition, resources must be mobilized from these partners, for the implementation of many of the activities to achieve the UNDAF results. The UNDAF envisions that the UN system will provide Government with policy and technical advice as well as practical support to help achieve national development objectives, including economic growth, poverty reduction and the realization of human rights and MDGs. The Government of Uganda will provide national strategies and plans, as well as a business environment favourable to private sector and public investments (management, implementation, accountability systems, effectiveness and inclusive coordination mechanisms and means to measure progress). This implies that the Ugandan Government is the largest partner in terms of human resource contribution by specific Line Ministries as well as being a financial contributor towards various programmes and projects. Line Ministries promote policies and strategies, the NGOs and Local Governments ensure popular participation in projects and programmes at grass‐roots level, while the private sector aims at promoting corporate social responsibility and encourages responsible redistribution of resources.
6: Monitoring, Reviewing, Reporting and Evaluating 6.1 Results Based Management, including Monitoring The UNDAF is a results‐based planning which will use results and evidence‐based management for monitoring, reviewing, reporting and evaluating outcomes. This includes data collection and analysis to monitor progress towards targets, as well as to check whether the assumptions made at the design stage are still valid, and whether the risks identified are occurring or not. Evaluations determine progress towards higher‐level results, specifically the UNDAF and Agency Outcomes. The indicators have baseline and target values against which the UN System’s collective contribution can be measured. The indicators mostly rely on existing monitoring and evaluation mechanisms of government–including the National Development Plan–but also draw upon UN agency‐specific programme indicators. MDG indicators are included in the framework. Overall, monitoring will be based mainly on national data sources such as annual panel survey, statistical abstract, NDP and sector progress reviews, the national census in 2012, the Demographic Health Survey and other sectoral, national‐level surveys, sectoral management information systems and so forth. The UNDAF M&E calendar outlines the relevant studies and evaluations to be conducted by UN agencies and their partners. The UNDAF and the UNDAF management mechanisms include harmonization with, and support to, monitoring of the NDP and of sector strategies and plans. 6.2 UNDAF Reviews and the Resident Coordinator’s Annual Report
28 Specific partners for each Outcome and Output are named in the Results matrix in the roles and responsibilities of partners’ columns. 29 Including, but not limited to Ministry of Health, Ministry of Gender, Labour and Social Development, Ministry of Education and Sports, Ministry of Water and Environment, Ministry of Local Government, Ministry of Disaster, Relief and Refugees, Ministry of Agriculture, Animal Industries and Fisheries. See UNDAF Results Matrices for names of all partners.
26
The annual review process for the UNDAF is aligned and harmonized with the planning and review schedule of the National Development Plan and Sector Reviews, all of which Government leads. The annual review process assesses progress made against the outputs and outcomes in the results matrix. For assessing progress towards the outcomes, the UNDAF Review will draw on government‐led national and subnational reviews and evaluations. To assess progress in terms of the UN’s contribution, the review will use performance data drawn from joint and single agencies’ project and programme performance assessments, and reviews of progress on UN reform. The annual review process is also when the UNDAF partners identify action points and detailed commitments for the coming year. In order to facilitate the review process, the UNDAF Working Groups will meet annually and use the results matrix and M&E calendar as the basis for joint monitoring with partners of outcomes. For UNDAF Outcomes and Agency Outcomes, the Outcome Groups prepare the annual review findings, and identify and report on lessons learnt, while UN Joint Teams (JUNT) will do the same for UN joint programmes. Participation by government, development partners and civil society in joint UNDAF reviews, and UN participation in sector reviews, also will strengthen capacity for M&E and facilitate harmonization within the UN and with Government and other partners. The review findings and recommendations will inform the Resident Coordinator’s Annual Plan and Report, as well as providing information for a mid‐term review or evaluation. A Mid‐Term Review or Evaluation of the UNDAF30 will be harmonized with Government‐led reviews or evaluations, and will also draw on UNDAF annual reviews, studies, surveys and programme evaluations conducted by UN agencies and their partners. The Review or evaluation will examine whether the UNDAF contributed towards achieving the selected priorities in the national development framework, generated a coherent UNCT response to these priorities, remained true to the UN Vision and effectively exploited the UN’s comparative advantage in the country. 6.3 Management of Monitoring and Evaluation All UN programme officers will continue to focus on support within Government structures and mechanisms for development, humanitarian preparation and response at national, sectoral and subnational levels. UNDAF Outcome Groups and Joint Programme Teams will do the substantive monitoring of their respective outcome and joint programme areas. A joint UN M&E team (JUNT/M&E) is responsible for tracking and coordinating the overall UNDAF M&E plan and promoting joint UNDAF monitoring and evaluation and enhanced teamwork. The chair of this team represents the UN on the NDP M&E Working Group. Members of the JUNT/M&E Team also address needs by partners for capacity development, especially in data collection analysis, monitoring and reporting. The Team contributes to high technical quality of improved results‐based management and reporting. The Team monitors and reports on the capacity of UN agencies and makes recommendations for internal capacity development. The Team will also support joint programme teams and advocate for joint data collection, analysis and evaluations. The UN will promote a harmonized approach to M&E that emphasizes country ownership and reduction of duplication. Of the selected indicators in the M&E Matrix, about 80 percent are ones with already existing national data source such as Uganda Bureau of Statistics or line ministries. The remaining indicators were identified from agency‐specific country programme documents and will be tracked by the respective agencies, funds and programmes. The UNDAF M&E system will strengthen the national M&E system through direct support and by participating in national coordination mechanisms such as the National Integrated Monitoring and Evaluation Strategy (NIMES) and its working groups. Engagement in M&E for sector working groups and their information systems also will be important. The UN will strengthen the capacity of government to measure development effectiveness and attainment of MDGs and to collect, analyse and use evidence, including through new technology. Capacity by civil society organizations to generate, analyse and disseminate information also will be strengthened. Annex II contains the Monitoring and Evaluation Matrices for the planned results.
�
30 Whether to conduct a Mid Term Review or Final Evaluation, and when, will be determined by Government and the UNCT.
27
� ��������
������ ��� �� ������ �
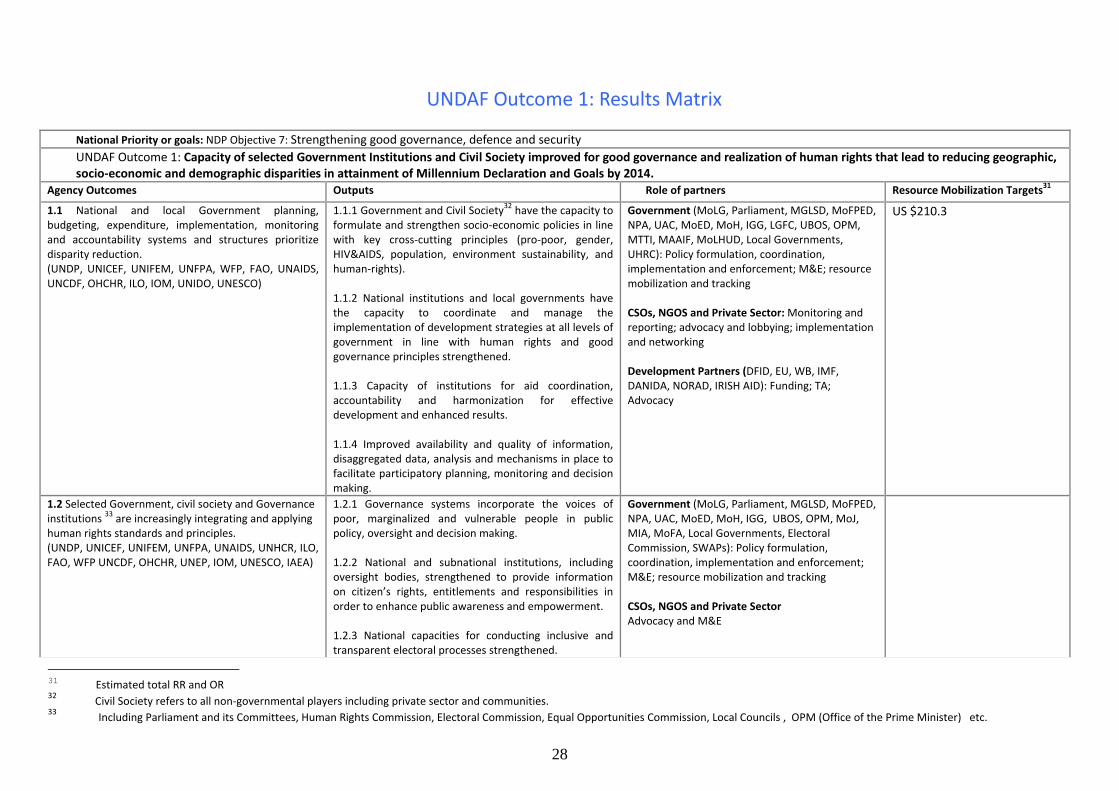
28
UNDAF Outcome 1: Results Matrix
National Priority or goals: NDP Objective 7: Strengthening good governance, defence and security UNDAF Outcome 1: Capacity of selected Government Institutions and Civil Society improved for good governance and realization of human rights that lead to reducing geographic,
socio‐economic and demographic disparities in attainment of Millennium Declaration and Goals by 2014. Agency Outcomes Outputs Role of partners Resource Mobilization Targets31
1.1 National and local Government planning, budgeting, expenditure, implementation, monitoring and accountability systems and structures prioritize disparity reduction. (UNDP, UNICEF, UNIFEM, UNFPA, WFP, FAO, UNAIDS, UNCDF, OHCHR, ILO, IOM, UNIDO, UNESCO)
1.1.1 Government and Civil Society32 have the capacity to formulate and strengthen socio‐economic policies in line with key cross‐cutting principles (pro‐poor, gender, HIV&AIDS, population, environment sustainability, and human‐rights).
1.1.2 National institutions and local governments have the capacity to coordinate and manage the implementation of development strategies at all levels of government in line with human rights and good governance principles strengthened. 1.1.3 Capacity of institutions for aid coordination, accountability and harmonization for effective development and enhanced results. 1.1.4 Improved availability and quality of information, disaggregated data, analysis and mechanisms in place to facilitate participatory planning, monitoring and decision making.
Government (MoLG, Parliament, MGLSD, MoFPED, NPA, UAC, MoED, MoH, IGG, LGFC, UBOS, OPM, MTTI, MAAIF, MoLHUD, Local Governments, UHRC): Policy formulation, coordination, implementation and enforcement; M&E; resource mobilization and tracking CSOs, NGOS and Private Sector: Monitoring and reporting; advocacy and lobbying; implementation and networking Development Partners (DFID, EU, WB, IMF, DANIDA, NORAD, IRISH AID): Funding; TA; Advocacy
US $210.3
1.2 Selected Government, civil society and Governance institutions 33 are increasingly integrating and applying human rights standards and principles. (UNDP, UNICEF, UNIFEM, UNFPA, UNAIDS, UNHCR, ILO, FAO, WFP UNCDF, OHCHR, UNEP, IOM, UNESCO, IAEA)
1.2.1 Governance systems incorporate the voices of poor, marginalized and vulnerable people in public policy, oversight and decision making.
1.2.2 National and subnational institutions, including oversight bodies, strengthened to provide information on citizen’s rights, entitlements and responsibilities in order to enhance public awareness and empowerment.
1.2.3 National capacities for conducting inclusive and transparent electoral processes strengthened.
Government (MoLG, Parliament, MGLSD, MoFPED, NPA, UAC, MoED, MoH, IGG, UBOS, OPM, MoJ, MIA, MoFA, Local Governments, Electoral Commission, SWAPs): Policy formulation, coordination, implementation and enforcement; M&E; resource mobilization and tracking
CSOs, NGOS and Private Sector Advocacy and M&E
31 Estimated total RR and OR 32 Civil Society refers to all non‐governmental players including private sector and communities. 33 Including Parliament and its Committees, Human Rights Commission, Electoral Commission, Equal Opportunities Commission, Local Councils , OPM (Office of the Prime Minister) etc.
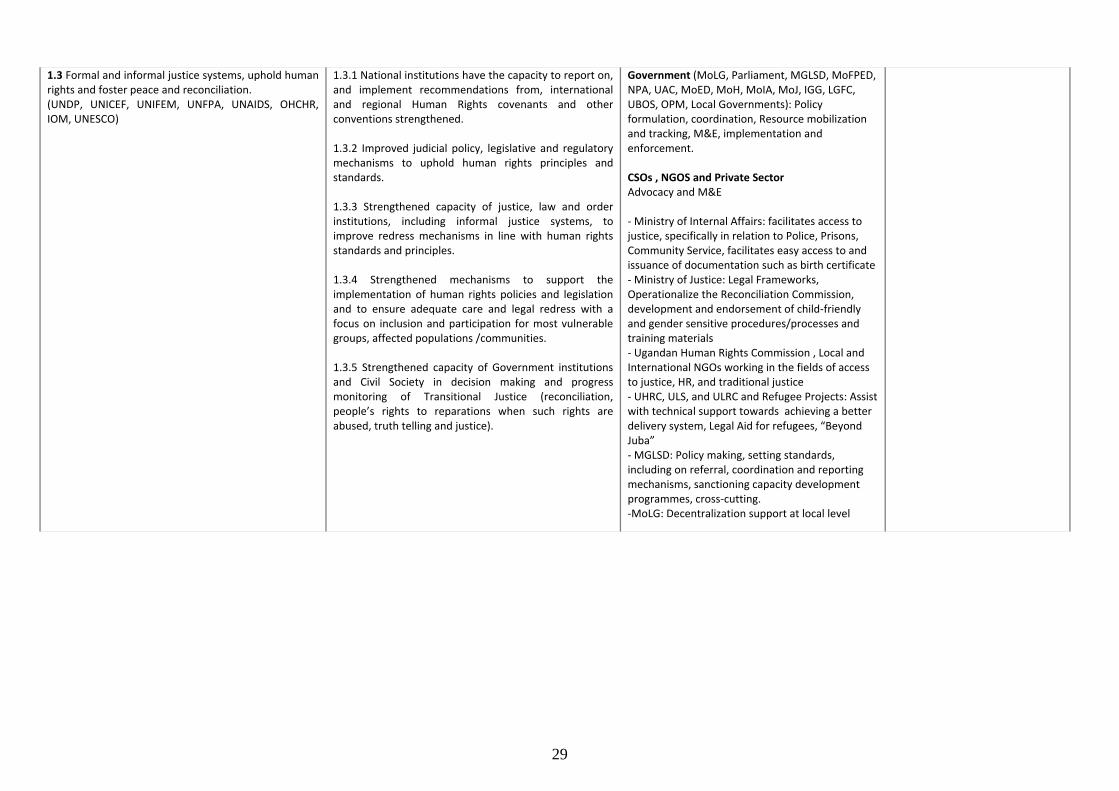
29
1.3 Formal and informal justice systems, uphold human rights and foster peace and reconciliation. (UNDP, UNICEF, UNIFEM, UNFPA, UNAIDS, OHCHR, IOM, UNESCO)
1.3.1 National institutions have the capacity to report on, and implement recommendations from, international and regional Human Rights covenants and other conventions strengthened. 1.3.2 Improved judicial policy, legislative and regulatory mechanisms to uphold human rights principles and standards. 1.3.3 Strengthened capacity of justice, law and order institutions, including informal justice systems, to improve redress mechanisms in line with human rights standards and principles. 1.3.4 Strengthened mechanisms to support the implementation of human rights policies and legislation and to ensure adequate care and legal redress with a focus on inclusion and participation for most vulnerable groups, affected populations /communities. 1.3.5 Strengthened capacity of Government institutions and Civil Society in decision making and progress monitoring of Transitional Justice (reconciliation, people’s rights to reparations when such rights are abused, truth telling and justice).
Government (MoLG, Parliament, MGLSD, MoFPED, NPA, UAC, MoED, MoH, MoIA, MoJ, IGG, LGFC, UBOS, OPM, Local Governments): Policy formulation, coordination, Resource mobilization and tracking, M&E, implementation and enforcement.
CSOs , NGOS and Private Sector Advocacy and M&E
‐ Ministry of Internal Affairs: facilitates access to justice, specifically in relation to Police, Prisons, Community Service, facilitates easy access to and issuance of documentation such as birth certificate ‐ Ministry of Justice: Legal Frameworks, Operationalize the Reconciliation Commission, development and endorsement of child‐friendly and gender sensitive procedures/processes and training materials ‐ Ugandan Human Rights Commission , Local and International NGOs working in the fields of access to justice, HR, and traditional justice ‐ UHRC, ULS, and ULRC and Refugee Projects: Assist with technical support towards achieving a better delivery system, Legal Aid for refugees, “Beyond Juba” ‐ MGLSD: Policy making, setting standards, including on referral, coordination and reporting mechanisms, sanctioning capacity development programmes, cross‐cutting. ‐MoLG: Decentralization support at local level
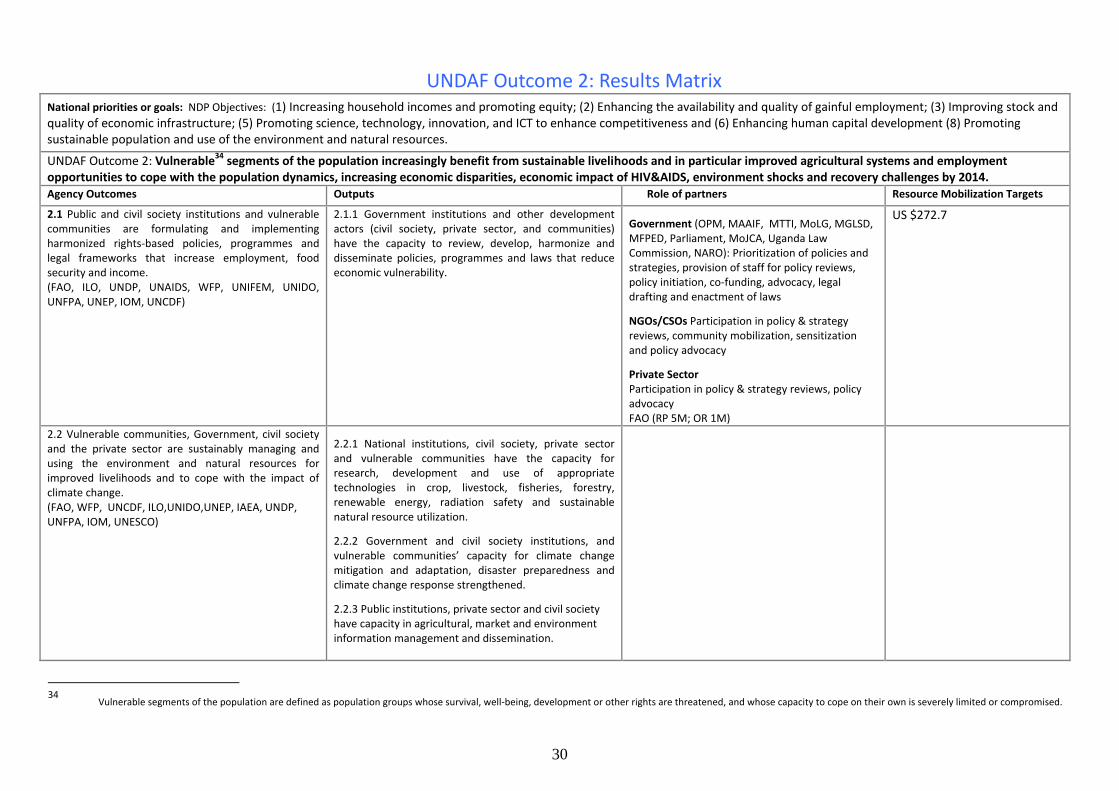
30
UNDAF Outcome 2: Results Matrix National priorities or goals: NDP Objectives: (1) Increasing household incomes and promoting equity; (2) Enhancing the availability and quality of gainful employment; (3) Improving stock and quality of economic infrastructure; (5) Promoting science, technology, innovation, and ICT to enhance competitiveness and (6) Enhancing human capital development (8) Promoting sustainable population and use of the environment and natural resources.
UNDAF Outcome 2: Vulnerable34 segments of the population increasingly benefit from sustainable livelihoods and in particular improved agricultural systems and employment opportunities to cope with the population dynamics, increasing economic disparities, economic impact of HIV&AIDS, environment shocks and recovery challenges by 2014. Agency Outcomes Outputs Role of partners Resource Mobilization Targets
2.1 Public and civil society institutions and vulnerable communities are formulating and implementing harmonized rights‐based policies, programmes and legal frameworks that increase employment, food security and income. (FAO, ILO, UNDP, UNAIDS, WFP, UNIFEM, UNIDO, UNFPA, UNEP, IOM, UNCDF)
2.1.1 Government institutions and other development actors (civil society, private sector, and communities) have the capacity to review, develop, harmonize and disseminate policies, programmes and laws that reduce economic vulnerability.
Government (OPM, MAAIF, MTTI, MoLG, MGLSD, MFPED, Parliament, MoJCA, Uganda Law Commission, NARO): Prioritization of policies and strategies, provision of staff for policy reviews, policy initiation, co‐funding, advocacy, legal drafting and enactment of laws
NGOs/CSOs Participation in policy & strategy reviews, community mobilization, sensitization and policy advocacy
Private Sector Participation in policy & strategy reviews, policy advocacy FAO (RP 5M; OR 1M)
US $272.7
2.2 Vulnerable communities, Government, civil society and the private sector are sustainably managing and using the environment and natural resources for improved livelihoods and to cope with the impact of climate change. (FAO, WFP, UNCDF, ILO,UNIDO,UNEP, IAEA, UNDP, UNFPA, IOM, UNESCO)
2.2.1 National institutions, civil society, private sector and vulnerable communities have the capacity for research, development and use of appropriate technologies in crop, livestock, fisheries, forestry, renewable energy, radiation safety and sustainable natural resource utilization.
2.2.2 Government and civil society institutions, and vulnerable communities’ capacity for climate change mitigation and adaptation, disaster preparedness and climate change response strengthened.
2.2.3 Public institutions, private sector and civil society have capacity in agricultural, market and environment information management and dissemination.
34
Vulnerable segments of the population are defined as population groups whose survival, well‐being, development or other rights are threatened, and whose capacity to cope on their own is severely limited or compromised.
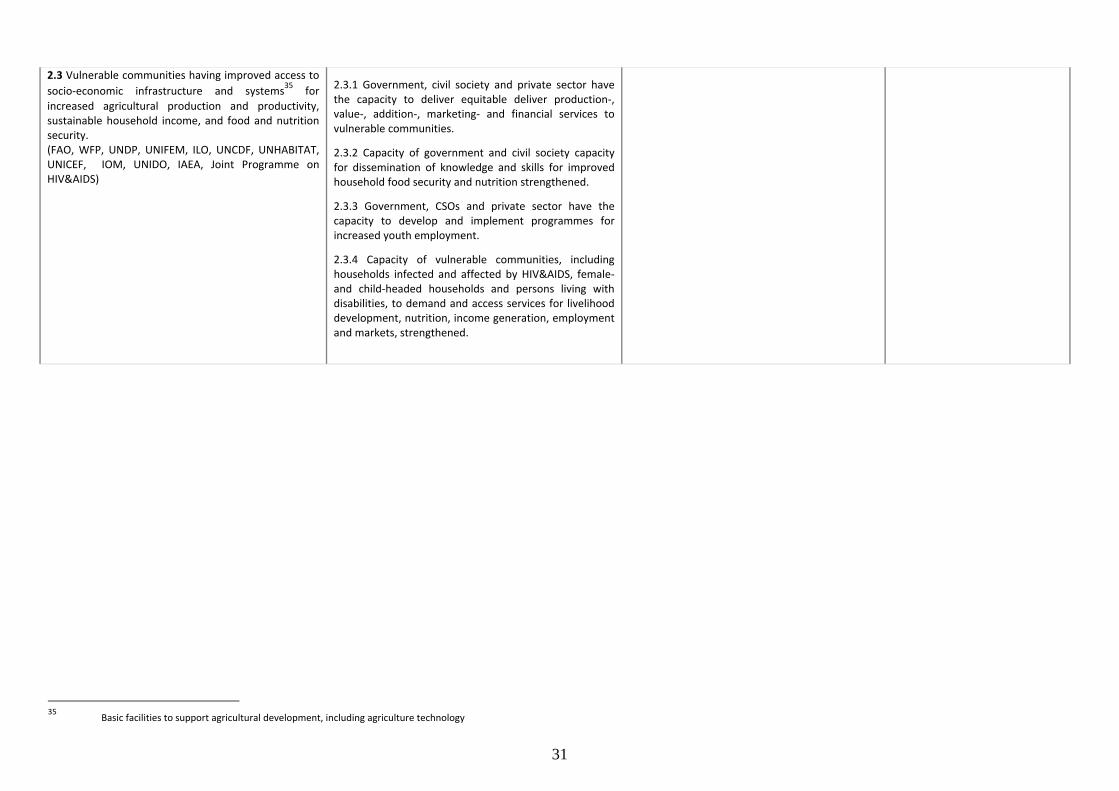
31
2.3 Vulnerable communities having improved access to socio‐economic infrastructure and systems35 for increased agricultural production and productivity, sustainable household income, and food and nutrition security. (FAO, WFP, UNDP, UNIFEM, ILO, UNCDF, UNHABITAT, UNICEF, IOM, UNIDO, IAEA, Joint Programme on HIV&AIDS)
2.3.1 Government, civil society and private sector have the capacity to deliver equitable deliver production‐, value‐, addition‐, marketing‐ and financial services to vulnerable communities.
2.3.2 Capacity of government and civil society capacity for dissemination of knowledge and skills for improved household food security and nutrition strengthened.
2.3.3 Government, CSOs and private sector have the capacity to develop and implement programmes for increased youth employment.
2.3.4 Capacity of vulnerable communities, including households infected and affected by HIV&AIDS, female‐and child‐headed households and persons living with disabilities, to demand and access services for livelihood development, nutrition, income generation, employment and markets, strengthened.
35 Basic facilities to support agricultural development, including agriculture technology
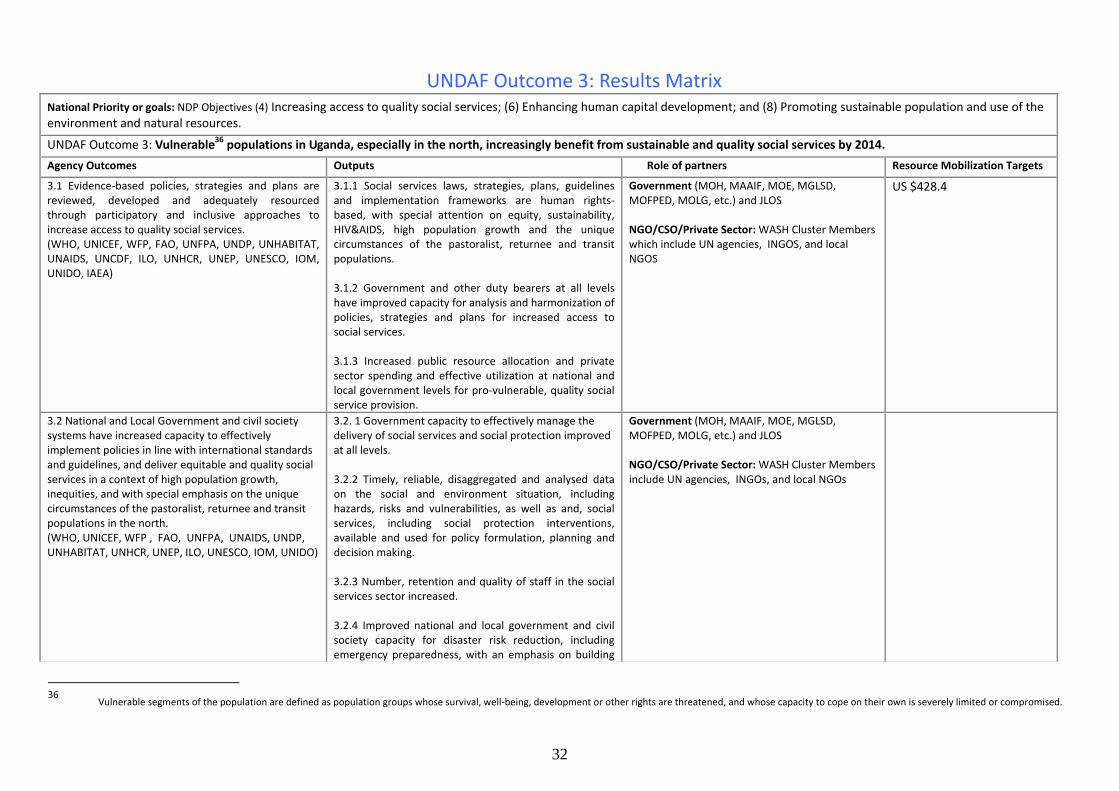
32
UNDAF Outcome 3: Results Matrix National Priority or goals: NDP Objectives (4) Increasing access to quality social services; (6) Enhancing human capital development; and (8) Promoting sustainable population and use of the environment and natural resources.
UNDAF Outcome 3: Vulnerable36 populations in Uganda, especially in the north, increasingly benefit from sustainable and quality social services by 2014.Agency Outcomes Outputs Role of partners Resource Mobilization Targets
3.1 Evidence‐based policies, strategies and plans are reviewed, developed and adequately resourced through participatory and inclusive approaches to increase access to quality social services. (WHO, UNICEF, WFP, FAO, UNFPA, UNDP, UNHABITAT, UNAIDS, UNCDF, ILO, UNHCR, UNEP, UNESCO, IOM, UNIDO, IAEA)
3.1.1 Social services laws, strategies, plans, guidelines and implementation frameworks are human rights‐based, with special attention on equity, sustainability, HIV&AIDS, high population growth and the unique circumstances of the pastoralist, returnee and transit populations. 3.1.2 Government and other duty bearers at all levels have improved capacity for analysis and harmonization of policies, strategies and plans for increased access to social services. 3.1.3 Increased public resource allocation and private sector spending and effective utilization at national and local government levels for pro‐vulnerable, quality social service provision.
Government (MOH, MAAIF, MOE, MGLSD, MOFPED, MOLG, etc.) and JLOS NGO/CSO/Private Sector: WASH Cluster Members which include UN agencies, INGOS, and local NGOS
US $428.4
3.2 National and Local Government and civil society systems have increased capacity to effectively implement policies in line with international standards and guidelines, and deliver equitable and quality social services in a context of high population growth, inequities, and with special emphasis on the unique circumstances of the pastoralist, returnee and transit populations in the north. (WHO, UNICEF, WFP , FAO, UNFPA, UNAIDS, UNDP, UNHABITAT, UNHCR, UNEP, ILO, UNESCO, IOM, UNIDO)
3.2. 1 Government capacity to effectively manage the delivery of social services and social protection improved at all levels. 3.2.2 Timely, reliable, disaggregated and analysed data on the social and environment situation, including hazards, risks and vulnerabilities, as well as and, social services, including social protection interventions, available and used for policy formulation, planning and decision making. 3.2.3 Number, retention and quality of staff in the social services sector increased. 3.2.4 Improved national and local government and civil society capacity for disaster risk reduction, including emergency preparedness, with an emphasis on building
Government (MOH, MAAIF, MOE, MGLSD, MOFPED, MOLG, etc.) and JLOS NGO/CSO/Private Sector: WASH Cluster Members include UN agencies, INGOs, and local NGOs
36
Vulnerable segments of the population are defined as population groups whose survival, well‐being, development or other rights are threatened, and whose capacity to cope on their own is severely limited or compromised.
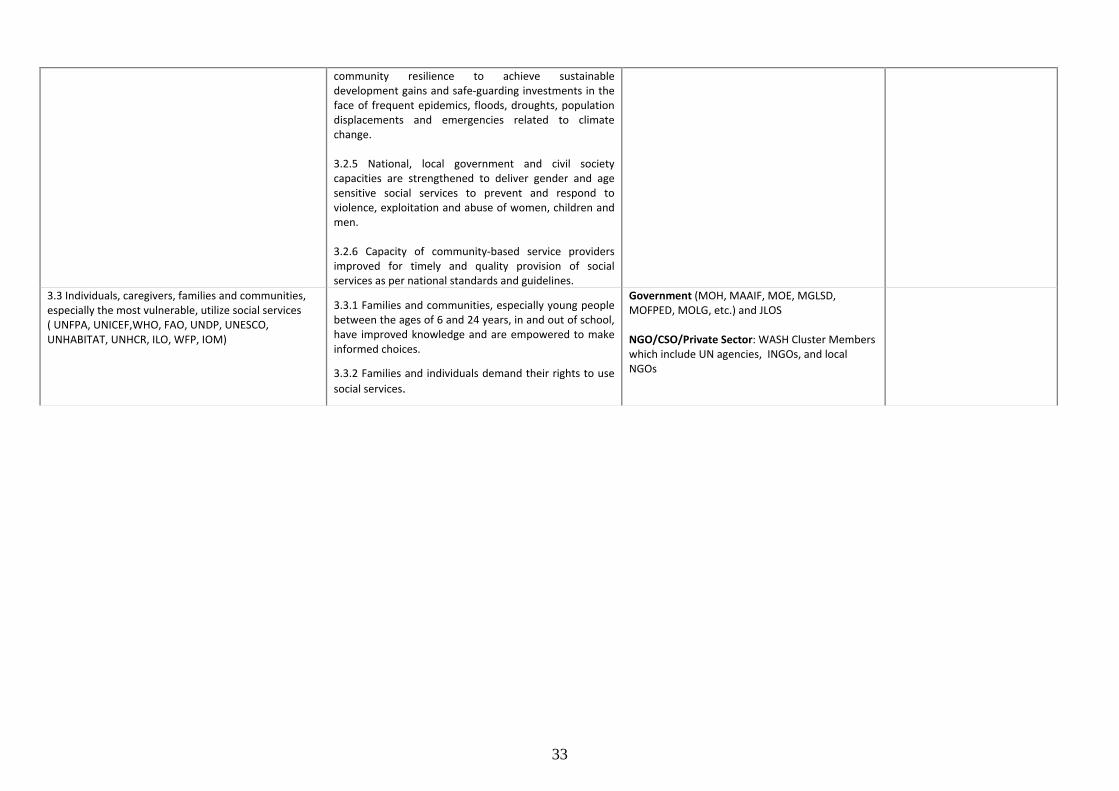
33
community resilience to achieve sustainable development gains and safe‐guarding investments in the face of frequent epidemics, floods, droughts, population displacements and emergencies related to climate change. 3.2.5 National, local government and civil society capacities are strengthened to deliver gender and age sensitive social services to prevent and respond to violence, exploitation and abuse of women, children and men. 3.2.6 Capacity of community‐based service providers improved for timely and quality provision of social services as per national standards and guidelines.
3.3 Individuals, caregivers, families and communities, especially the most vulnerable, utilize social services ( UNFPA, UNICEF,WHO, FAO, UNDP, UNESCO, UNHABITAT, UNHCR, ILO, WFP, IOM)
3.3.1 Families and communities, especially young people between the ages of 6 and 24 years, in and out of school, have improved knowledge and are empowered to make informed choices.
3.3.2 Families and individuals demand their rights to use social services.
Government (MOH, MAAIF, MOE, MGLSD, MOFPED, MOLG, etc.) and JLOS NGO/CSO/Private Sector: WASH Cluster Members which include UN agencies, INGOs, and local NGOs

34
��������� ����� �������������������������� ������ �
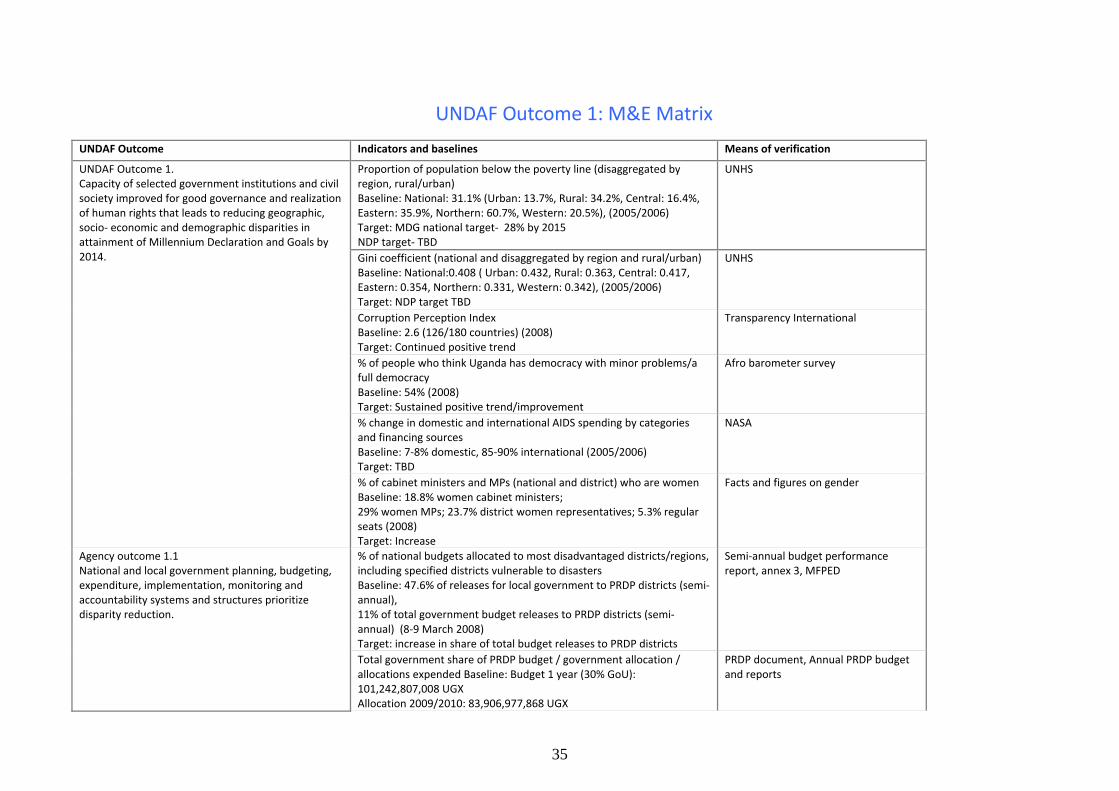
35
UNDAF Outcome 1: M&E Matrix
UNDAF Outcome Indicators and baselines Means of verification
UNDAF Outcome 1. Capacity of selected government institutions and civil society improved for good governance and realization of human rights that leads to reducing geographic, socio‐ economic and demographic disparities in attainment of Millennium Declaration and Goals by 2014.
Proportion of population below the poverty line (disaggregated by region, rural/urban) Baseline: National: 31.1% (Urban: 13.7%, Rural: 34.2%, Central: 16.4%, Eastern: 35.9%, Northern: 60.7%, Western: 20.5%), (2005/2006) Target: MDG national target‐ 28% by 2015 NDP target‐ TBD
UNHS
Gini coefficient (national and disaggregated by region and rural/urban) Baseline: National:0.408 ( Urban: 0.432, Rural: 0.363, Central: 0.417, Eastern: 0.354, Northern: 0.331, Western: 0.342), (2005/2006) Target: NDP target TBD
UNHS
Corruption Perception Index Baseline: 2.6 (126/180 countries) (2008) Target: Continued positive trend
Transparency International
% of people who think Uganda has democracy with minor problems/a full democracy Baseline: 54% (2008) Target: Sustained positive trend/improvement
Afro barometer survey
% change in domestic and international AIDS spending by categories and financing sources Baseline: 7‐8% domestic, 85‐90% international (2005/2006) Target: TBD
NASA
% of cabinet ministers and MPs (national and district) who are women Baseline: 18.8% women cabinet ministers; 29% women MPs; 23.7% district women representatives; 5.3% regular seats (2008) Target: Increase
Facts and figures on gender
Agency outcome 1.1 National and local government planning, budgeting, expenditure, implementation, monitoring and accountability systems and structures prioritize disparity reduction.
% of national budgets allocated to most disadvantaged districts/regions, including specified districts vulnerable to disasters Baseline: 47.6% of releases for local government to PRDP districts (semi‐annual), 11% of total government budget releases to PRDP districts (semi‐annual) (8‐9 March 2008) Target: increase in share of total budget releases to PRDP districts
Semi‐annual budget performance report, annex 3, MFPED
Total government share of PRDP budget / government allocation / allocations expended Baseline: Budget 1 year (30% GoU): 101,242,807,008 UGX Allocation 2009/2010: 83,906,977,868 UGX
PRDP document, Annual PRDP budget and reports

36
Expenditure: TBD (2009/2010) Target: 100% of budgeted allocated, 100% allocated expended % of budget allocation to the social sector (Education, Health, HIV&AIDS, Water and Environment, and Social Development) Baseline: Health : 10.7%, Education: 15.3%, Water and Environment: 2.4%, Social Development 0.4%, HIV&AIDS: TBD (2009/2010) Target: Health‐ 15% by 2010, Education: No decline, WASH: TBD, Soc. Dev: Increase
Background to the Budget
No. of social sector plans incorporating DRR Baseline: very limited integration of DRR in sector plans (2009) Target: All social sector plans incorporate DRR
TBD
Output 1.1.1 Government and civil society37 have the capacity to formulate and strengthen socio‐economic policies in line with key cross‐cutting principles (pro‐poor, gender, HIV&AIDS, population, environment sustainability, and human rights)
National HIV prevention policy includes rights of most at risk populations Baseline: No (2009) Target: Yes
UNFPA
No. of environmental pro‐poor policies developed and implemented for sustainable natural resources management Baseline: 0 (2009) Target: TBD
Ministry of Environment, NEMA, UNEP
% of prosecutions for infringement of environmental laws Baseline: TBD (2009) Target: Increase
Ministry of Environment, NEMA, UNEP
% population affected by environmental degradation Baseline: TBD (2009) Target: Re‐education
Ministry of Environment, NEMA, UNEP
Output 1.1.2 National institutions and local governments have the capacity to coordinate and manage the implementation of development strategies at all levels of government in line with human rights and good governance principles strengthened.
Percent of local governments meeting minimum capacity conditions38 Baseline: 34%39 (2008) Target: Reverse the declining trend
MoLG, LG performance review 2008
% of Districts with functional District AIDS Committees Baseline: 97% (2005) Target: 100%
UAC
Output 1.1.3 Capacity of institutions for aid coordination, accountability and harmonization for effective development results enhanced.
Number of coalitions/alliances active for gender equality Baseline: 2 in target districts(2009) Target: Increase
UNFPA
Number of coalitions/alliances promoting reproductive health (including family planning)
UNFPA
37 Civil Society refers to all non‐ governmental players including private sector and communities. 38 Includes: Functional capacity for planning, functional capacity for finance, management and audit, local revenue enhancement performance, functional capacity for capacity building and project specific conditions (see MoLG, Performance review, 2006, 2007 and 2008) 39 MoLG Performance review, 2008
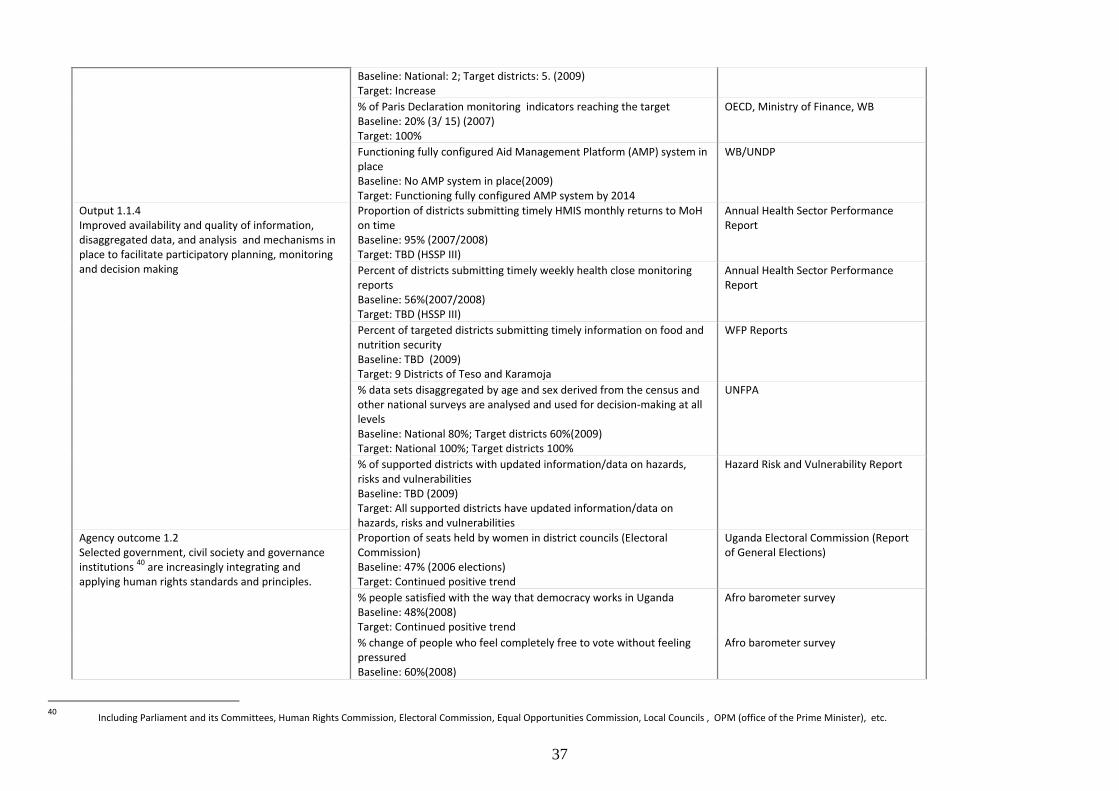
37
Baseline: National: 2; Target districts: 5. (2009) Target: Increase % of Paris Declaration monitoring indicators reaching the target Baseline: 20% (3/ 15) (2007) Target: 100%
OECD, Ministry of Finance, WB
Functioning fully configured Aid Management Platform (AMP) system in place Baseline: No AMP system in place(2009) Target: Functioning fully configured AMP system by 2014
WB/UNDP
Output 1.1.4 Improved availability and quality of information, disaggregated data, and analysis and mechanisms in place to facilitate participatory planning, monitoring and decision making
Proportion of districts submitting timely HMIS monthly returns to MoH on time Baseline: 95% (2007/2008) Target: TBD (HSSP III)
Annual Health Sector Performance Report
Percent of districts submitting timely weekly health close monitoring reports Baseline: 56%(2007/2008) Target: TBD (HSSP III)
Annual Health Sector Performance Report
Percent of targeted districts submitting timely information on food and nutrition security Baseline: TBD (2009) Target: 9 Districts of Teso and Karamoja
WFP Reports
% data sets disaggregated by age and sex derived from the census and other national surveys are analysed and used for decision‐making at all levels Baseline: National 80%; Target districts 60%(2009) Target: National 100%; Target districts 100%
UNFPA
% of supported districts with updated information/data on hazards, risks and vulnerabilities Baseline: TBD (2009) Target: All supported districts have updated information/data on hazards, risks and vulnerabilities
Hazard Risk and Vulnerability Report
Agency outcome 1.2 Selected government, civil society and governance institutions 40 are increasingly integrating and applying human rights standards and principles.
Proportion of seats held by women in district councils (Electoral Commission) Baseline: 47% (2006 elections) Target: Continued positive trend
Uganda Electoral Commission (Report of General Elections)
% people satisfied with the way that democracy works in Uganda Baseline: 48%(2008) Target: Continued positive trend
Afro barometer survey
% change of people who feel completely free to vote without feeling pressured Baseline: 60%(2008)
Afro barometer survey
40 Including Parliament and its Committees, Human Rights Commission, Electoral Commission, Equal Opportunities Commission, Local Councils , OPM (office of the Prime Minister), etc.
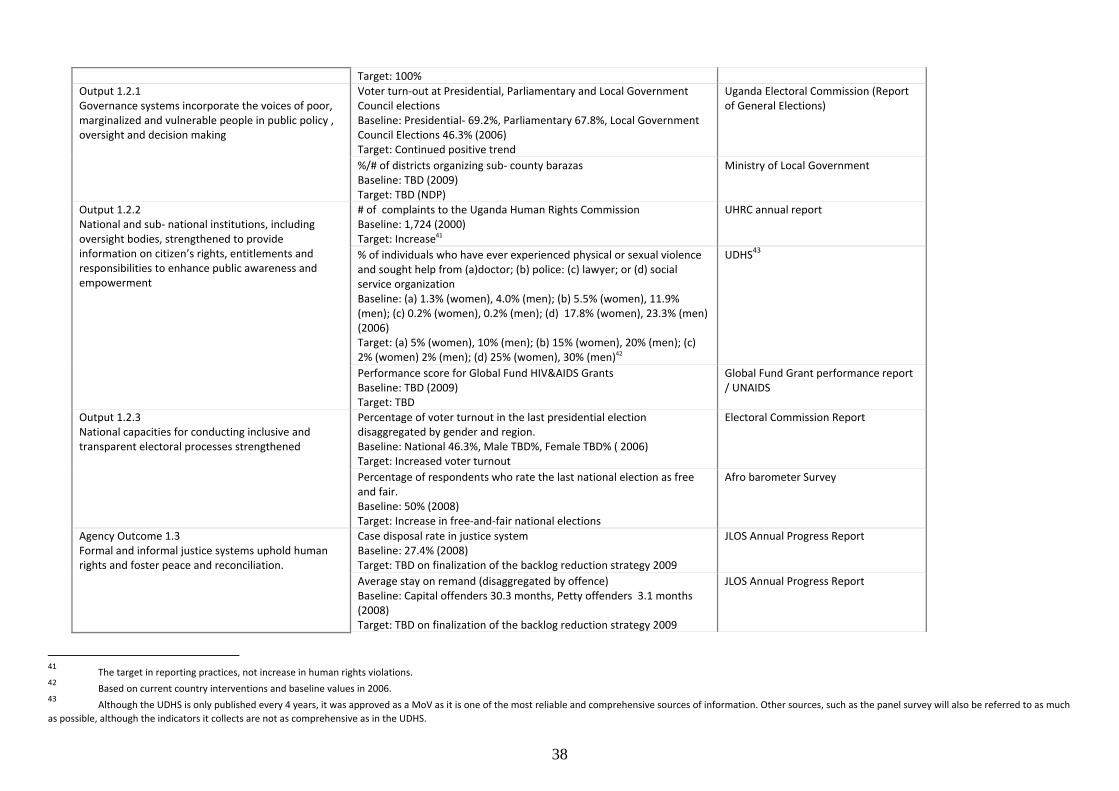
38
Target: 100% Output 1.2.1 Governance systems incorporate the voices of poor, marginalized and vulnerable people in public policy , oversight and decision making
Voter turn‐out at Presidential, Parliamentary and Local Government Council elections Baseline: Presidential‐ 69.2%, Parliamentary 67.8%, Local Government Council Elections 46.3% (2006) Target: Continued positive trend
Uganda Electoral Commission (Report of General Elections)
%/# of districts organizing sub‐ county barazas Baseline: TBD (2009) Target: TBD (NDP)
Ministry of Local Government
Output 1.2.2 National and sub‐ national institutions, including oversight bodies, strengthened to provide information on citizen’s rights, entitlements and responsibilities to enhance public awareness and empowerment
# of complaints to the Uganda Human Rights Commission Baseline: 1,724 (2000) Target: Increase41
UHRC annual report
% of individuals who have ever experienced physical or sexual violence and sought help from (a)doctor; (b) police: (c) lawyer; or (d) social service organization Baseline: (a) 1.3% (women), 4.0% (men); (b) 5.5% (women), 11.9% (men); (c) 0.2% (women), 0.2% (men); (d) 17.8% (women), 23.3% (men) (2006) Target: (a) 5% (women), 10% (men); (b) 15% (women), 20% (men); (c) 2% (women) 2% (men); (d) 25% (women), 30% (men)42
UDHS43
Performance score for Global Fund HIV&AIDS Grants Baseline: TBD (2009) Target: TBD
Global Fund Grant performance report / UNAIDS
Output 1.2.3 National capacities for conducting inclusive and transparent electoral processes strengthened
Percentage of voter turnout in the last presidential election disaggregated by gender and region. Baseline: National 46.3%, Male TBD%, Female TBD% ( 2006) Target: Increased voter turnout
Electoral Commission Report
Percentage of respondents who rate the last national election as free and fair. Baseline: 50% (2008) Target: Increase in free‐and‐fair national elections
Afro barometer Survey
Agency Outcome 1.3 Formal and informal justice systems uphold human rights and foster peace and reconciliation.
Case disposal rate in justice system Baseline: 27.4% (2008) Target: TBD on finalization of the backlog reduction strategy 2009
JLOS Annual Progress Report
Average stay on remand (disaggregated by offence) Baseline: Capital offenders 30.3 months, Petty offenders 3.1 months (2008) Target: TBD on finalization of the backlog reduction strategy 2009
JLOS Annual Progress Report
41 The target in reporting practices, not increase in human rights violations. 42 Based on current country interventions and baseline values in 2006. 43 Although the UDHS is only published every 4 years, it was approved as a MoV as it is one of the most reliable and comprehensive sources of information. Other sources, such as the panel survey will also be referred to as much as possible, although the indicators it collects are not as comprehensive as in the UDHS.
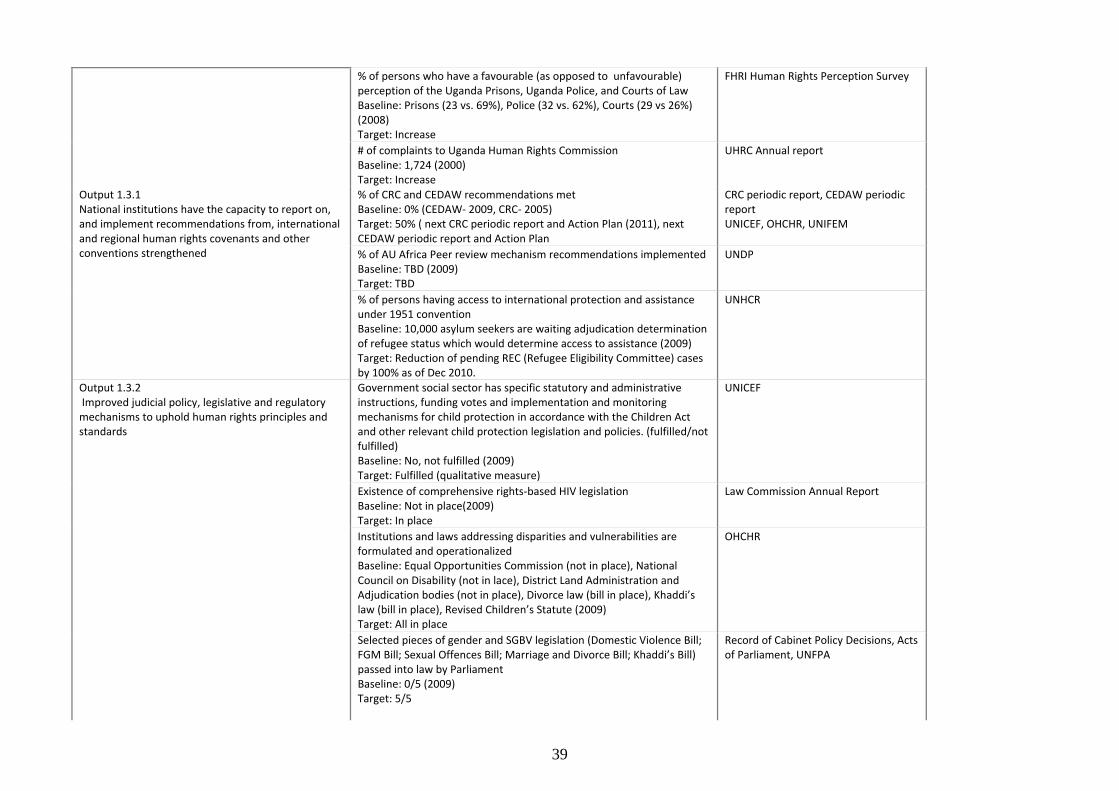
39
% of persons who have a favourable (as opposed to unfavourable) perception of the Uganda Prisons, Uganda Police, and Courts of Law Baseline: Prisons (23 vs. 69%), Police (32 vs. 62%), Courts (29 vs 26%) (2008) Target: Increase
FHRI Human Rights Perception Survey
# of complaints to Uganda Human Rights Commission Baseline: 1,724 (2000) Target: Increase
UHRC Annual report
Output 1.3.1 National institutions have the capacity to report on, and implement recommendations from, international and regional human rights covenants and other conventions strengthened
% of CRC and CEDAW recommendations met Baseline: 0% (CEDAW‐ 2009, CRC‐ 2005) Target: 50% ( next CRC periodic report and Action Plan (2011), next CEDAW periodic report and Action Plan
CRC periodic report, CEDAW periodic report UNICEF, OHCHR, UNIFEM
% of AU Africa Peer review mechanism recommendations implemented Baseline: TBD (2009) Target: TBD
UNDP
% of persons having access to international protection and assistance under 1951 convention Baseline: 10,000 asylum seekers are waiting adjudication determination of refugee status which would determine access to assistance (2009) Target: Reduction of pending REC (Refugee Eligibility Committee) cases by 100% as of Dec 2010.
UNHCR
Output 1.3.2 Improved judicial policy, legislative and regulatory mechanisms to uphold human rights principles and standards
Government social sector has specific statutory and administrative instructions, funding votes and implementation and monitoring mechanisms for child protection in accordance with the Children Act and other relevant child protection legislation and policies. (fulfilled/not fulfilled) Baseline: No, not fulfilled (2009) Target: Fulfilled (qualitative measure)
UNICEF
Existence of comprehensive rights‐based HIV legislation Baseline: Not in place(2009) Target: In place
Law Commission Annual Report
Institutions and laws addressing disparities and vulnerabilities are formulated and operationalized Baseline: Equal Opportunities Commission (not in place), National Council on Disability (not in lace), District Land Administration and Adjudication bodies (not in place), Divorce law (bill in place), Khaddi’s law (bill in place), Revised Children’s Statute (2009) Target: All in place
OHCHR
Selected pieces of gender and SGBV legislation (Domestic Violence Bill; FGM Bill; Sexual Offences Bill; Marriage and Divorce Bill; Khaddi’s Bill) passed into law by Parliament Baseline: 0/5 (2009) Target: 5/5
Record of Cabinet Policy Decisions, Acts of Parliament, UNFPA
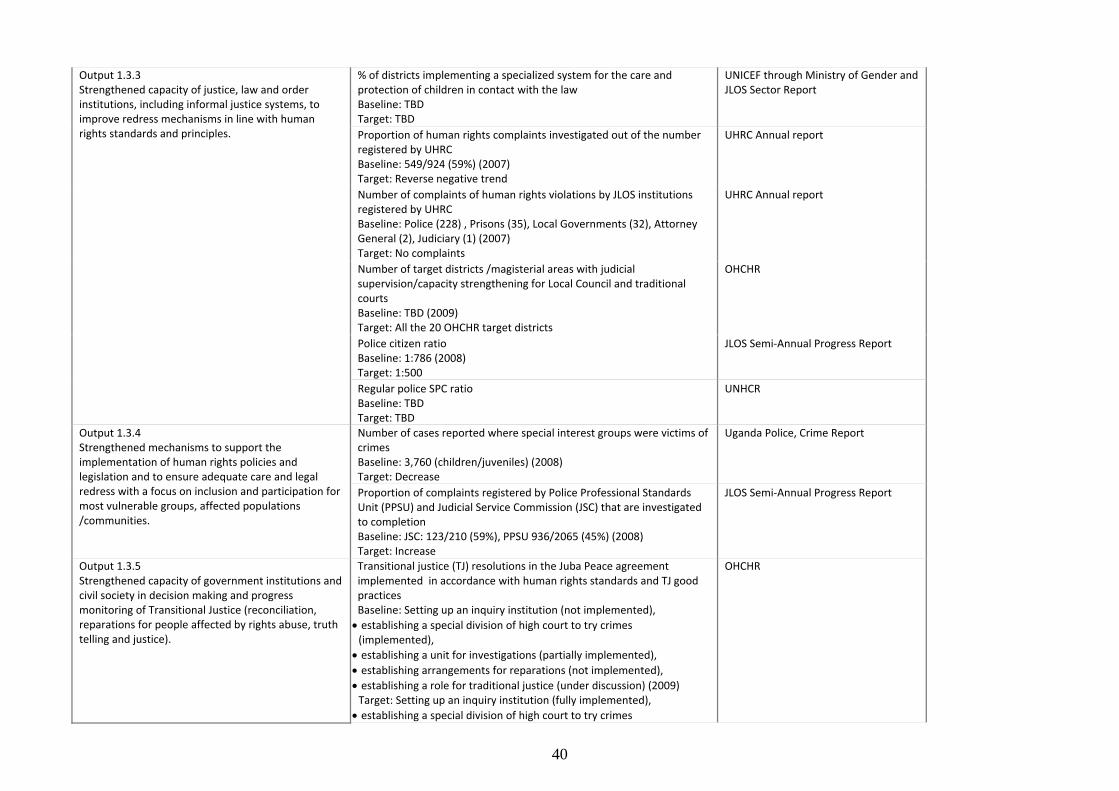
40
Output 1.3.3 Strengthened capacity of justice, law and order institutions, including informal justice systems, to improve redress mechanisms in line with human rights standards and principles.
% of districts implementing a specialized system for the care and protection of children in contact with the law Baseline: TBD Target: TBD
UNICEF through Ministry of Gender and JLOS Sector Report
Proportion of human rights complaints investigated out of the number registered by UHRC Baseline: 549/924 (59%) (2007) Target: Reverse negative trend
UHRC Annual report
Number of complaints of human rights violations by JLOS institutions registered by UHRC Baseline: Police (228) , Prisons (35), Local Governments (32), Attorney General (2), Judiciary (1) (2007) Target: No complaints
UHRC Annual report
Number of target districts /magisterial areas with judicial supervision/capacity strengthening for Local Council and traditional courts Baseline: TBD (2009) Target: All the 20 OHCHR target districts
OHCHR
Police citizen ratio Baseline: 1:786 (2008) Target: 1:500
JLOS Semi‐Annual Progress Report
Regular police SPC ratio Baseline: TBD Target: TBD
UNHCR
Output 1.3.4 Strengthened mechanisms to support the implementation of human rights policies and legislation and to ensure adequate care and legal redress with a focus on inclusion and participation for most vulnerable groups, affected populations /communities.
Number of cases reported where special interest groups were victims of crimes Baseline: 3,760 (children/juveniles) (2008) Target: Decrease
Uganda Police, Crime Report
Proportion of complaints registered by Police Professional Standards Unit (PPSU) and Judicial Service Commission (JSC) that are investigated to completion Baseline: JSC: 123/210 (59%), PPSU 936/2065 (45%) (2008) Target: Increase
JLOS Semi‐Annual Progress Report
Output 1.3.5 Strengthened capacity of government institutions and civil society in decision making and progress monitoring of Transitional Justice (reconciliation, reparations for people affected by rights abuse, truth telling and justice).
Transitional justice (TJ) resolutions in the Juba Peace agreement implemented in accordance with human rights standards and TJ good practices Baseline: Setting up an inquiry institution (not implemented), • establishing a special division of high court to try crimes (implemented), • establishing a unit for investigations (partially implemented), • establishing arrangements for reparations (not implemented), • establishing a role for traditional justice (under discussion) (2009) Target: Setting up an inquiry institution (fully implemented), • establishing a special division of high court to try crimes
OHCHR
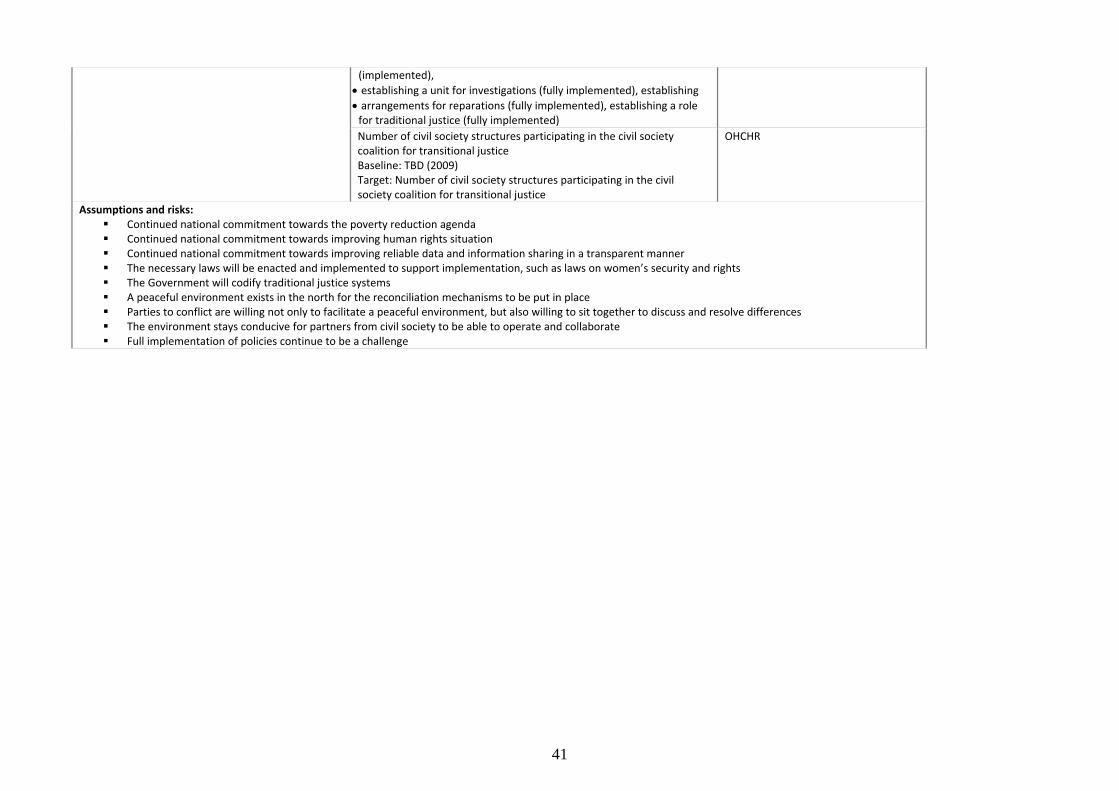
41
(implemented), • establishing a unit for investigations (fully implemented), establishing • arrangements for reparations (fully implemented), establishing a role for traditional justice (fully implemented) Number of civil society structures participating in the civil society coalition for transitional justice Baseline: TBD (2009) Target: Number of civil society structures participating in the civil society coalition for transitional justice
OHCHR
Assumptions and risks: Continued national commitment towards the poverty reduction agenda Continued national commitment towards improving human rights situation Continued national commitment towards improving reliable data and information sharing in a transparent manner The necessary laws will be enacted and implemented to support implementation, such as laws on women’s security and rights The Government will codify traditional justice systems A peaceful environment exists in the north for the reconciliation mechanisms to be put in place Parties to conflict are willing not only to facilitate a peaceful environment, but also willing to sit together to discuss and resolve differences The environment stays conducive for partners from civil society to be able to operate and collaborate Full implementation of policies continue to be a challenge
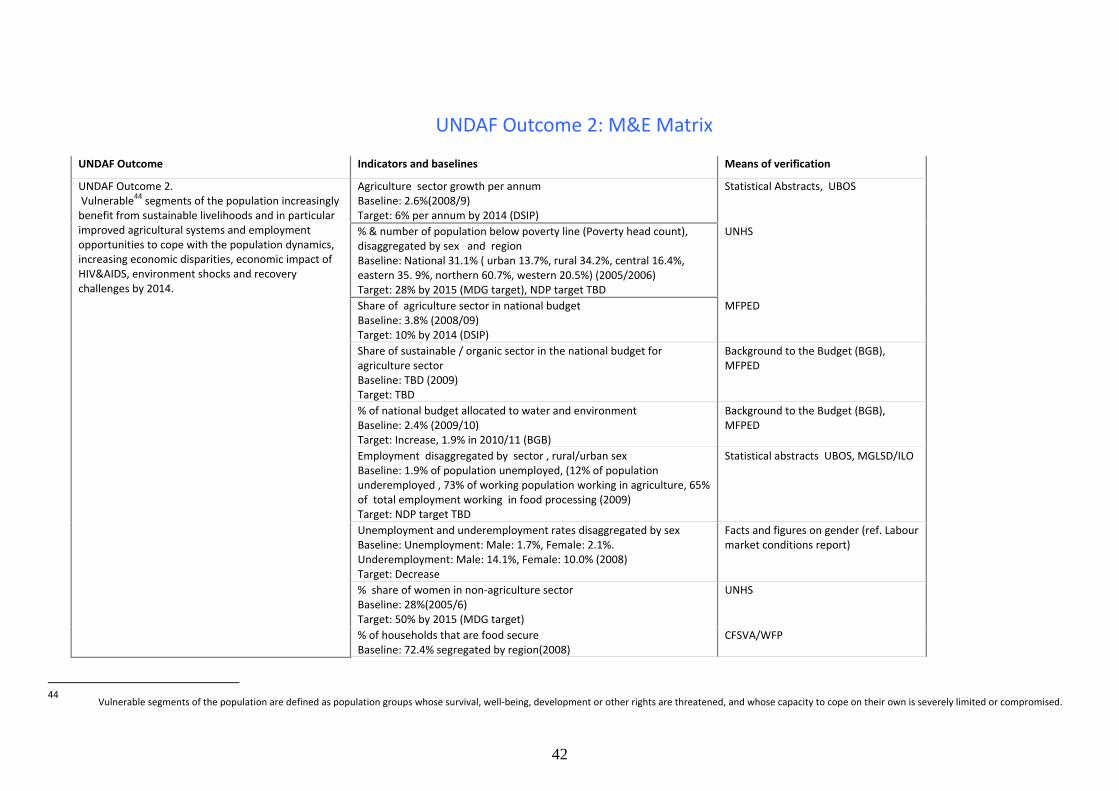
42
UNDAF Outcome 2: M&E Matrix
UNDAF Outcome Indicators and baselines Means of verification
UNDAF Outcome 2. Vulnerable44 segments of the population increasingly benefit from sustainable livelihoods and in particular improved agricultural systems and employment opportunities to cope with the population dynamics, increasing economic disparities, economic impact of HIV&AIDS, environment shocks and recovery challenges by 2014.
Agriculture sector growth per annum Baseline: 2.6%(2008/9) Target: 6% per annum by 2014 (DSIP)
Statistical Abstracts, UBOS
% & number of population below poverty line (Poverty head count), disaggregated by sex and region Baseline: National 31.1% ( urban 13.7%, rural 34.2%, central 16.4%, eastern 35. 9%, northern 60.7%, western 20.5%) (2005/2006) Target: 28% by 2015 (MDG target), NDP target TBD
UNHS
Share of agriculture sector in national budget Baseline: 3.8% (2008/09) Target: 10% by 2014 (DSIP)
MFPED
Share of sustainable / organic sector in the national budget for agriculture sector Baseline: TBD (2009) Target: TBD
Background to the Budget (BGB), MFPED
% of national budget allocated to water and environment Baseline: 2.4% (2009/10) Target: Increase, 1.9% in 2010/11 (BGB)
Background to the Budget (BGB), MFPED
Employment disaggregated by sector , rural/urban sex Baseline: 1.9% of population unemployed, (12% of population underemployed , 73% of working population working in agriculture, 65% of total employment working in food processing (2009) Target: NDP target TBD
Statistical abstracts UBOS, MGLSD/ILO
Unemployment and underemployment rates disaggregated by sex Baseline: Unemployment: Male: 1.7%, Female: 2.1%. Underemployment: Male: 14.1%, Female: 10.0% (2008) Target: Decrease
Facts and figures on gender (ref. Labour market conditions report)
% share of women in non‐agriculture sector Baseline: 28%(2005/6) Target: 50% by 2015 (MDG target)
UNHS
% of households that are food secure Baseline: 72.4% segregated by region(2008)
CFSVA/WFP
44
Vulnerable segments of the population are defined as population groups whose survival, well‐being, development or other rights are threatened, and whose capacity to cope on their own is severely limited or compromised.
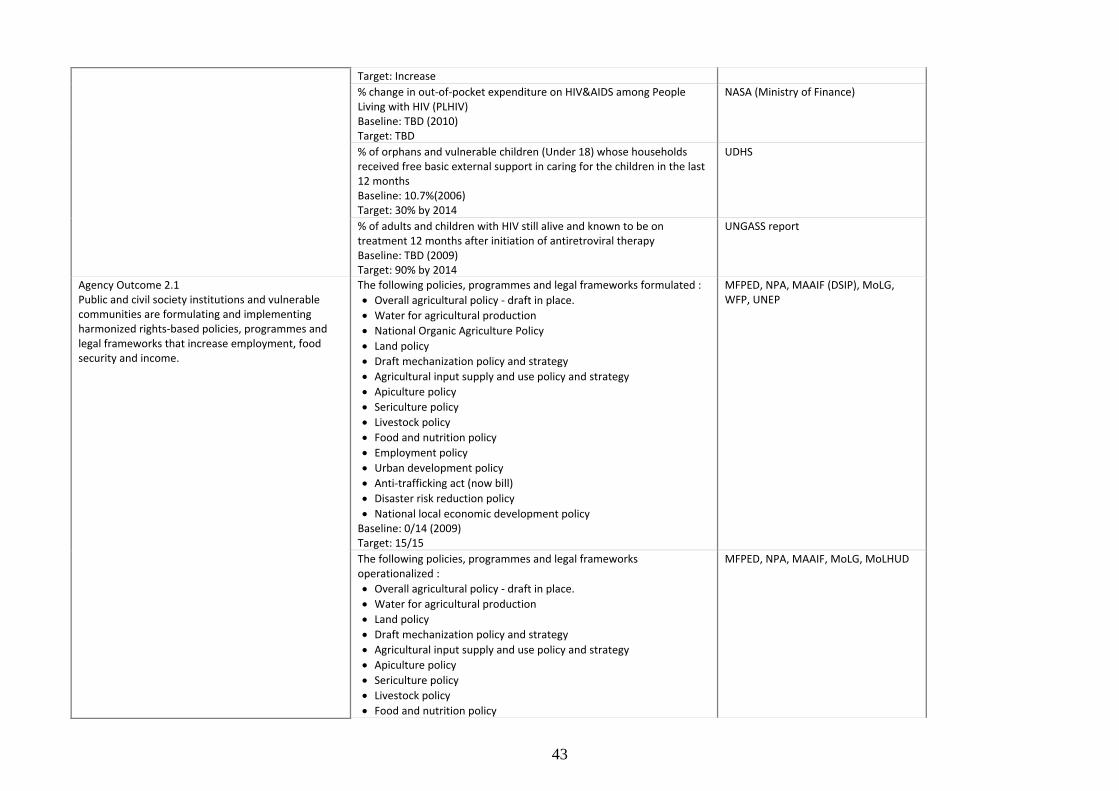
43
Target: Increase % change in out‐of‐pocket expenditure on HIV&AIDS among People Living with HIV (PLHIV) Baseline: TBD (2010) Target: TBD
NASA (Ministry of Finance)
% of orphans and vulnerable children (Under 18) whose households received free basic external support in caring for the children in the last 12 months Baseline: 10.7%(2006) Target: 30% by 2014
UDHS
% of adults and children with HIV still alive and known to be on treatment 12 months after initiation of antiretroviral therapy Baseline: TBD (2009) Target: 90% by 2014
UNGASS report
Agency Outcome 2.1 Public and civil society institutions and vulnerable communities are formulating and implementing harmonized rights‐based policies, programmes and legal frameworks that increase employment, food security and income.
The following policies, programmes and legal frameworks formulated : • Overall agricultural policy ‐ draft in place. • Water for agricultural production • National Organic Agriculture Policy • Land policy • Draft mechanization policy and strategy • Agricultural input supply and use policy and strategy • Apiculture policy • Sericulture policy • Livestock policy • Food and nutrition policy • Employment policy • Urban development policy • Anti‐trafficking act (now bill) • Disaster risk reduction policy • National local economic development policy Baseline: 0/14 (2009) Target: 15/15
MFPED, NPA, MAAIF (DSIP), MoLG, WFP, UNEP
The following policies, programmes and legal frameworks operationalized : • Overall agricultural policy ‐ draft in place. • Water for agricultural production • Land policy • Draft mechanization policy and strategy • Agricultural input supply and use policy and strategy • Apiculture policy • Sericulture policy • Livestock policy • Food and nutrition policy
MFPED, NPA, MAAIF, MoLG, MoLHUD
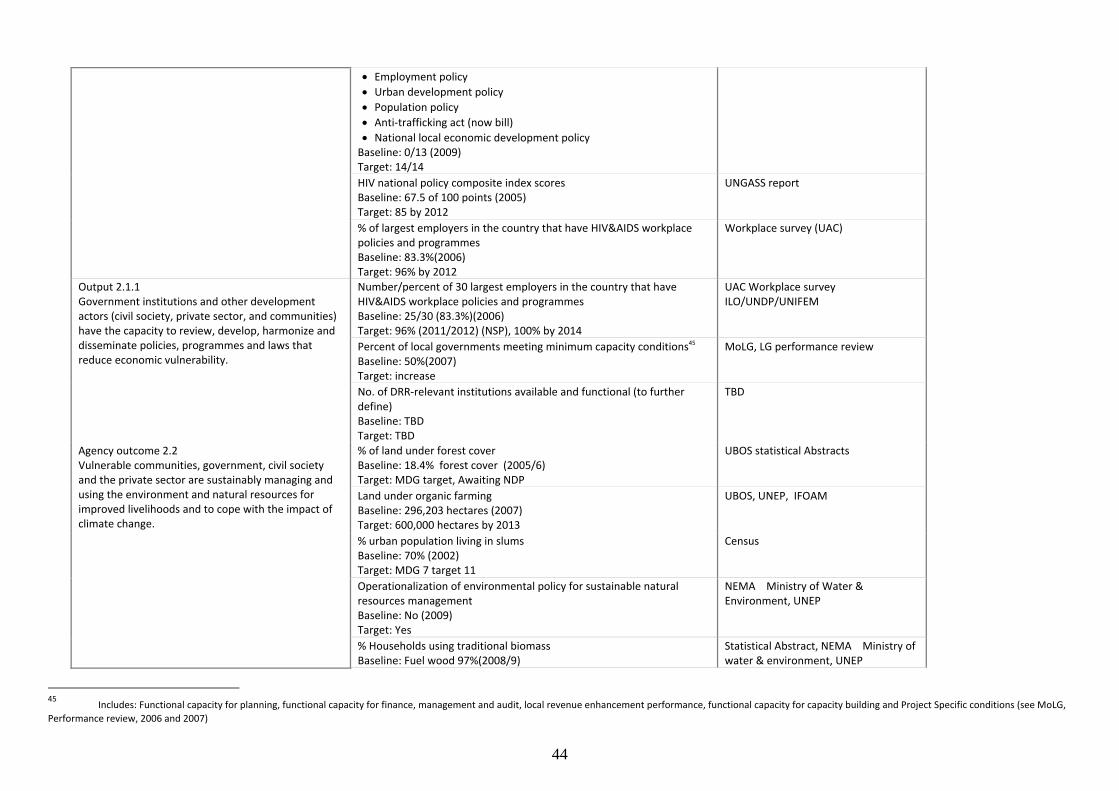
44
• Employment policy • Urban development policy • Population policy • Anti‐trafficking act (now bill) • National local economic development policy Baseline: 0/13 (2009) Target: 14/14 HIV national policy composite index scores Baseline: 67.5 of 100 points (2005) Target: 85 by 2012
UNGASS report
% of largest employers in the country that have HIV&AIDS workplace policies and programmes Baseline: 83.3%(2006) Target: 96% by 2012
Workplace survey (UAC)
Output 2.1.1 Government institutions and other development actors (civil society, private sector, and communities) have the capacity to review, develop, harmonize and disseminate policies, programmes and laws that reduce economic vulnerability.
Number/percent of 30 largest employers in the country that have HIV&AIDS workplace policies and programmes Baseline: 25/30 (83.3%)(2006) Target: 96% (2011/2012) (NSP), 100% by 2014
UAC Workplace survey ILO/UNDP/UNIFEM
Percent of local governments meeting minimum capacity conditions45 Baseline: 50%(2007) Target: increase
MoLG, LG performance review
No. of DRR‐relevant institutions available and functional (to further define) Baseline: TBD Target: TBD
TBD
Agency outcome 2.2 Vulnerable communities, government, civil society and the private sector are sustainably managing and using the environment and natural resources for improved livelihoods and to cope with the impact of climate change.
% of land under forest cover Baseline: 18.4% forest cover (2005/6) Target: MDG target, Awaiting NDP
UBOS statistical Abstracts
Land under organic farming Baseline: 296,203 hectares (2007) Target: 600,000 hectares by 2013
UBOS, UNEP, IFOAM
% urban population living in slums Baseline: 70% (2002) Target: MDG 7 target 11
Census
Operationalization of environmental policy for sustainable natural resources management Baseline: No (2009) Target: Yes
NEMA Ministry of Water & Environment, UNEP
% Households using traditional biomass Baseline: Fuel wood 97%(2008/9)
Statistical Abstract, NEMA Ministry of water & environment, UNEP
45 Includes: Functional capacity for planning, functional capacity for finance, management and audit, local revenue enhancement performance, functional capacity for capacity building and Project Specific conditions (see MoLG, Performance review, 2006 and 2007)
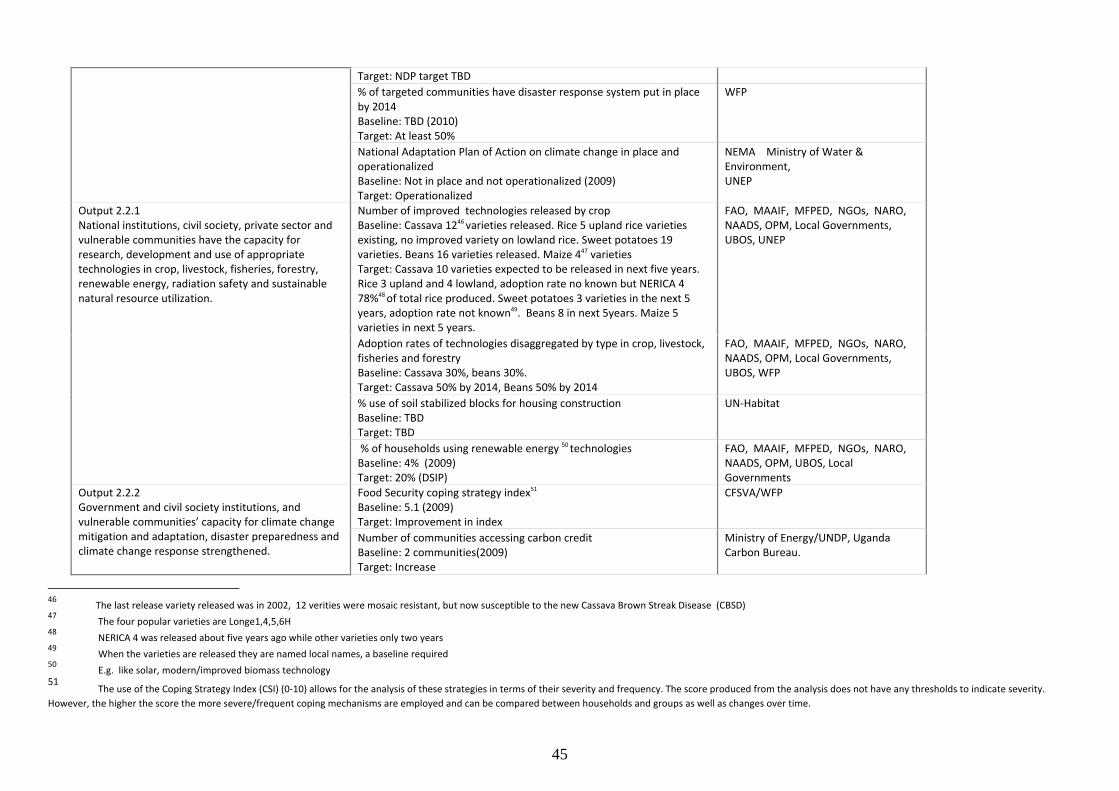
45
Target: NDP target TBD % of targeted communities have disaster response system put in place by 2014 Baseline: TBD (2010) Target: At least 50%
WFP
National Adaptation Plan of Action on climate change in place and operationalized Baseline: Not in place and not operationalized (2009) Target: Operationalized
NEMA Ministry of Water & Environment, UNEP
Output 2.2.1 National institutions, civil society, private sector and vulnerable communities have the capacity for research, development and use of appropriate technologies in crop, livestock, fisheries, forestry, renewable energy, radiation safety and sustainable natural resource utilization.
Number of improved technologies released by crop Baseline: Cassava 1246 varieties released. Rice 5 upland rice varieties existing, no improved variety on lowland rice. Sweet potatoes 19 varieties. Beans 16 varieties released. Maize 447 varieties Target: Cassava 10 varieties expected to be released in next five years. Rice 3 upland and 4 lowland, adoption rate no known but NERICA 4 78%48 of total rice produced. Sweet potatoes 3 varieties in the next 5 years, adoption rate not known49. Beans 8 in next 5years. Maize 5 varieties in next 5 years.
FAO, MAAIF, MFPED, NGOs, NARO, NAADS, OPM, Local Governments, UBOS, UNEP
Adoption rates of technologies disaggregated by type in crop, livestock, fisheries and forestry Baseline: Cassava 30%, beans 30%. Target: Cassava 50% by 2014, Beans 50% by 2014
FAO, MAAIF, MFPED, NGOs, NARO, NAADS, OPM, Local Governments, UBOS, WFP
% use of soil stabilized blocks for housing construction Baseline: TBD Target: TBD
UN‐Habitat
% of households using renewable energy 50 technologies Baseline: 4% (2009) Target: 20% (DSIP)
FAO, MAAIF, MFPED, NGOs, NARO, NAADS, OPM, UBOS, Local Governments
Output 2.2.2 Government and civil society institutions, and vulnerable communities’ capacity for climate change mitigation and adaptation, disaster preparedness and climate change response strengthened.
Food Security coping strategy index51 Baseline: 5.1 (2009) Target: Improvement in index
CFSVA/WFP
Number of communities accessing carbon credit Baseline: 2 communities(2009) Target: Increase
Ministry of Energy/UNDP, Uganda Carbon Bureau.
46 The last release variety released was in 2002, 12 verities were mosaic resistant, but now susceptible to the new Cassava Brown Streak Disease (CBSD) 47 The four popular varieties are Longe1,4,5,6H 48 NERICA 4 was released about five years ago while other varieties only two years 49 When the varieties are released they are named local names, a baseline required 50 E.g. like solar, modern/improved biomass technology 51
The use of the Coping Strategy Index (CSI) (0‐10) allows for the analysis of these strategies in terms of their severity and frequency. The score produced from the analysis does not have any thresholds to indicate severity. However, the higher the score the more severe/frequent coping mechanisms are employed and can be compared between households and groups as well as changes over time.
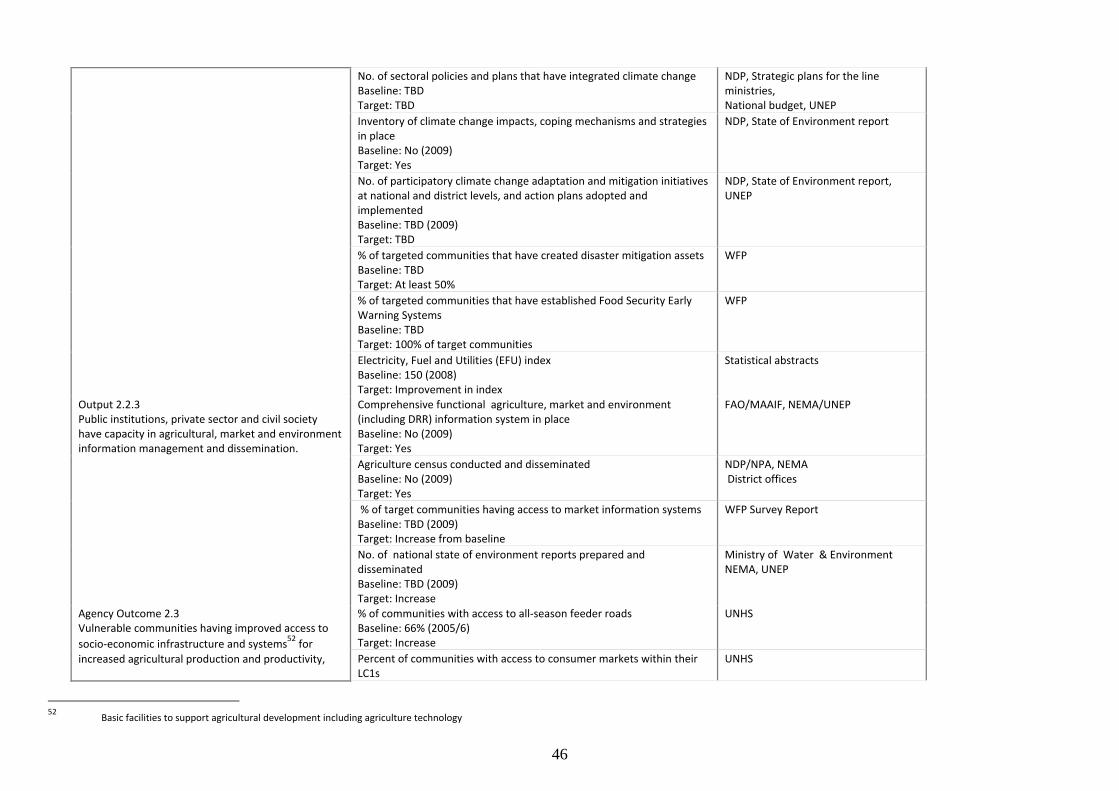
46
No. of sectoral policies and plans that have integrated climate change Baseline: TBD Target: TBD
NDP, Strategic plans for the line ministries, National budget, UNEP
Inventory of climate change impacts, coping mechanisms and strategies in place Baseline: No (2009) Target: Yes
NDP, State of Environment report
No. of participatory climate change adaptation and mitigation initiatives at national and district levels, and action plans adopted and implemented Baseline: TBD (2009) Target: TBD
NDP, State of Environment report, UNEP
% of targeted communities that have created disaster mitigation assets Baseline: TBD Target: At least 50%
WFP
% of targeted communities that have established Food Security Early Warning Systems Baseline: TBD Target: 100% of target communities
WFP
Electricity, Fuel and Utilities (EFU) index Baseline: 150 (2008) Target: Improvement in index
Statistical abstracts
Output 2.2.3 Public institutions, private sector and civil society have capacity in agricultural, market and environment information management and dissemination.
Comprehensive functional agriculture, market and environment (including DRR) information system in place Baseline: No (2009) Target: Yes
FAO/MAAIF, NEMA/UNEP
Agriculture census conducted and disseminated Baseline: No (2009) Target: Yes
NDP/NPA, NEMA District offices
% of target communities having access to market information systems Baseline: TBD (2009) Target: Increase from baseline
WFP Survey Report
No. of national state of environment reports prepared and disseminated Baseline: TBD (2009) Target: Increase
Ministry of Water & Environment NEMA, UNEP
Agency Outcome 2.3 Vulnerable communities having improved access to socio‐economic infrastructure and systems52 for increased agricultural production and productivity,
% of communities with access to all‐season feeder roads Baseline: 66% (2005/6) Target: Increase
UNHS
Percent of communities with access to consumer markets within their LC1s
UNHS
52 Basic facilities to support agricultural development including agriculture technology
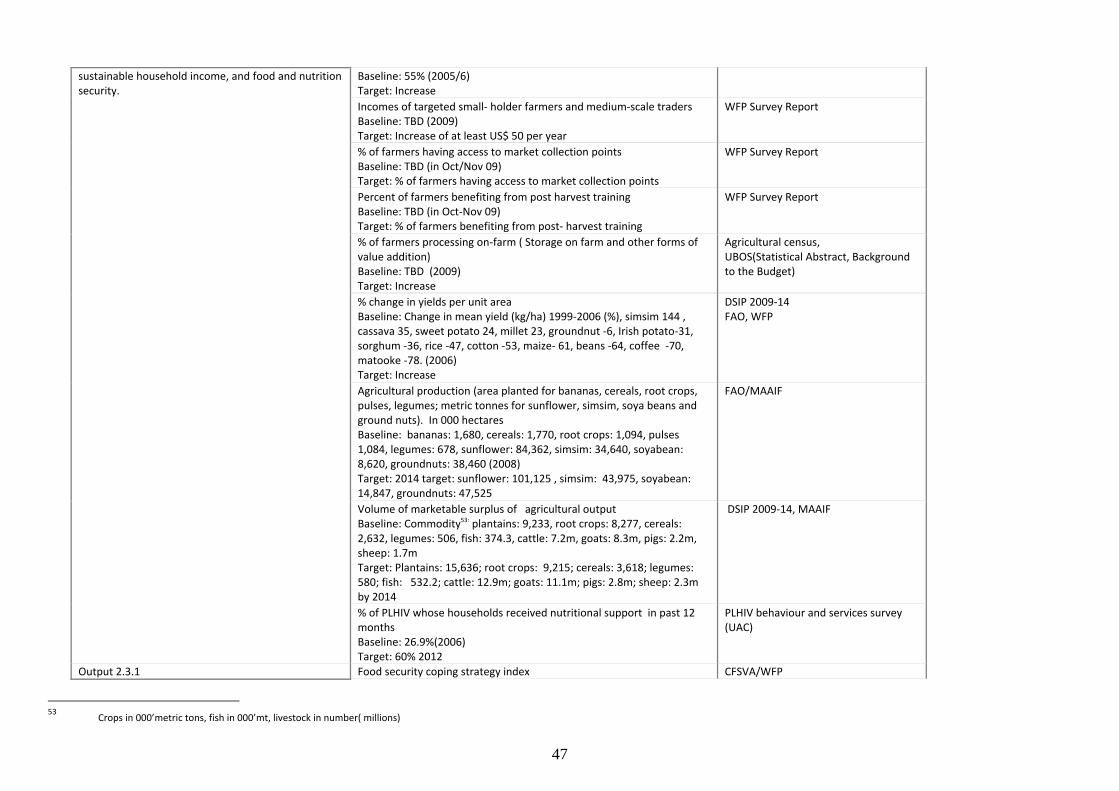
47
sustainable household income, and food and nutrition security.
Baseline: 55% (2005/6) Target: Increase Incomes of targeted small‐ holder farmers and medium‐scale traders Baseline: TBD (2009) Target: Increase of at least US$ 50 per year
WFP Survey Report
% of farmers having access to market collection points Baseline: TBD (in Oct/Nov 09) Target: % of farmers having access to market collection points
WFP Survey Report
Percent of farmers benefiting from post harvest training Baseline: TBD (in Oct‐Nov 09) Target: % of farmers benefiting from post‐ harvest training
WFP Survey Report
% of farmers processing on‐farm ( Storage on farm and other forms of value addition) Baseline: TBD (2009) Target: Increase
Agricultural census, UBOS(Statistical Abstract, Background to the Budget)
% change in yields per unit area Baseline: Change in mean yield (kg/ha) 1999‐2006 (%), simsim 144 , cassava 35, sweet potato 24, millet 23, groundnut ‐6, Irish potato‐31, sorghum ‐36, rice ‐47, cotton ‐53, maize‐ 61, beans ‐64, coffee ‐70, matooke ‐78. (2006) Target: Increase
DSIP 2009‐14 FAO, WFP
Agricultural production (area planted for bananas, cereals, root crops, pulses, legumes; metric tonnes for sunflower, simsim, soya beans and ground nuts). In 000 hectares Baseline: bananas: 1,680, cereals: 1,770, root crops: 1,094, pulses 1,084, legumes: 678, sunflower: 84,362, simsim: 34,640, soyabean: 8,620, groundnuts: 38,460 (2008) Target: 2014 target: sunflower: 101,125 , simsim: 43,975, soyabean: 14,847, groundnuts: 47,525
FAO/MAAIF
Volume of marketable surplus of agricultural output Baseline: Commodity53: plantains: 9,233, root crops: 8,277, cereals: 2,632, legumes: 506, fish: 374.3, cattle: 7.2m, goats: 8.3m, pigs: 2.2m, sheep: 1.7m Target: Plantains: 15,636; root crops: 9,215; cereals: 3,618; legumes: 580; fish: 532.2; cattle: 12.9m; goats: 11.1m; pigs: 2.8m; sheep: 2.3m by 2014
DSIP 2009‐14, MAAIF
% of PLHIV whose households received nutritional support in past 12 months Baseline: 26.9%(2006) Target: 60% 2012
PLHIV behaviour and services survey (UAC)
Output 2.3.1 Food security coping strategy index CFSVA/WFP
53 Crops in 000’metric tons, fish in 000’mt, livestock in number( millions)

48
Government, civil society and private sector have the capacity to deliver equitable production‐, value‐addition‐, marketing‐ and financial services to vulnerable communities
Baseline:5.1 (2009) Target: Improved index % of communities with access to consumer markets within their LC1s Baseline: 55% (2005/6) Target: Increase
UNHS
% of households that applied for loans Baseline: 10% (2005/6) Target: Increase
UNHS
Market collection points established and are operating the Warehouse Receipt System Baseline: TBD (2009/10) Target: Sixteen (16)
WFP
Output 2.3.2 Government and civil society’s capacity for dissemination of knowledge and skills for improved household food security and nutrition strengthened.
Average caloric intake per person per day Baseline: 1,971(2005) Target: 2,100kcal per person/day by 2014
DSIP, 2009‐2014
% of districts with regular, up‐to‐date nutrition data available Baseline: 19% (2009) Target: 100%
UNICEF
Number of districts with functional Early Warning Systems Baseline: 0% (2009) Target: 9 (3 in Teso and 6 in Karamoja)
WFP
Output 2.3.3 Government, CSOs, Private sector have the capacity to develop and implement programmes for increased youth employment.
Number of programmes on youth employment opportunities established/supported Baseline: TBD (2009) Target: TBD
ILO
% of youth in gainful employment Baseline: TBD (2009) Target: TBD
ILO
Number of functional youth employment programmes Baseline: TBD (2009) Target: TBD
ILO
Output 2.3.4 Capacity of vulnerable communities, including households infected and affected by HIV&AIDS, female‐ and child‐ headed households and persons living with disabilities to demand and access services for livelihoods development, nutrition, income generation, employment and markets, strengthened.
% of households of people living with HIV&AIDS that have benefited from IGAs Baseline: 41.2% (2006) Target: 80% (2011/12)
UAC
% of OVCs (<18) whose households received free basic external support in caring for the children in the last 12 months Baseline: 10.7% (2006) Target: 30% (2011/12)
UDHS
% of poor PLHIVs whose households receive nutritional support Baseline: 26.9% PLHIVs in past three months (2006) Target: 60% (2011/12)
UAC
% of PLHIVs whose households receive psychosocial support UAC
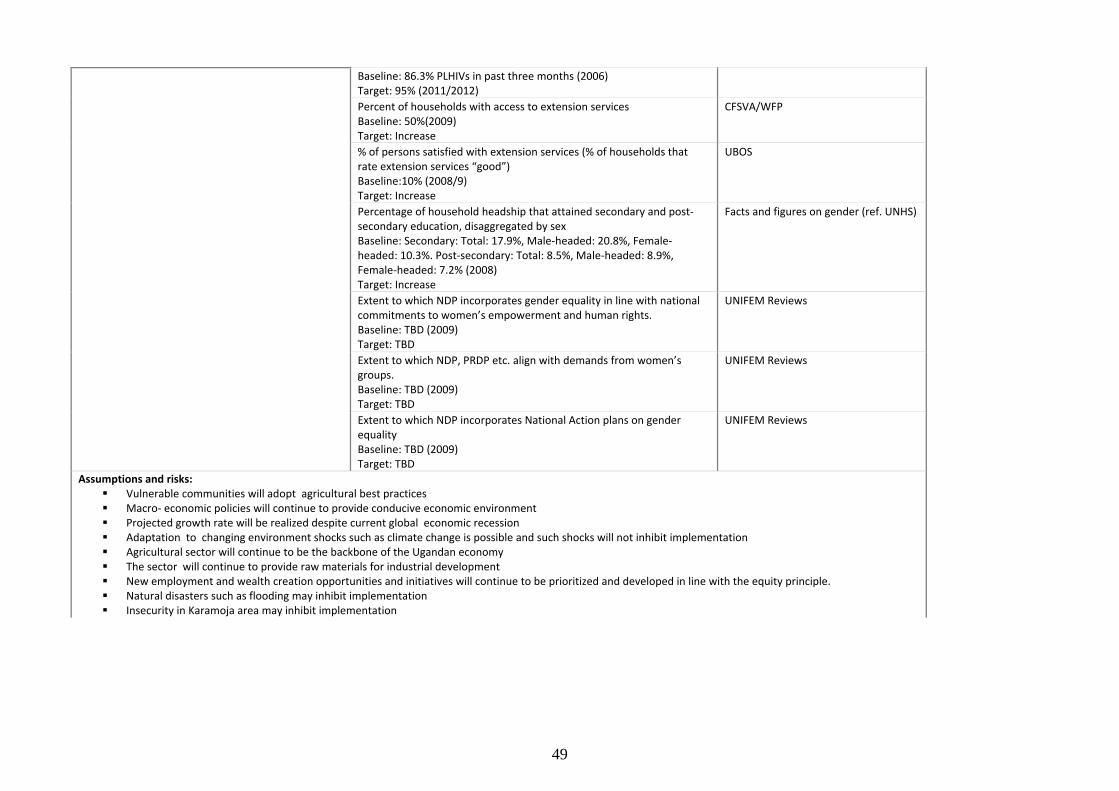
49
Baseline: 86.3% PLHIVs in past three months (2006) Target: 95% (2011/2012) Percent of households with access to extension services Baseline: 50%(2009) Target: Increase
CFSVA/WFP
% of persons satisfied with extension services (% of households that rate extension services “good”) Baseline:10% (2008/9) Target: Increase
UBOS
Percentage of household headship that attained secondary and post‐secondary education, disaggregated by sex Baseline: Secondary: Total: 17.9%, Male‐headed: 20.8%, Female‐headed: 10.3%. Post‐secondary: Total: 8.5%, Male‐headed: 8.9%, Female‐headed: 7.2% (2008) Target: Increase
Facts and figures on gender (ref. UNHS)
Extent to which NDP incorporates gender equality in line with national commitments to women’s empowerment and human rights. Baseline: TBD (2009) Target: TBD
UNIFEM Reviews
Extent to which NDP, PRDP etc. align with demands from women’s groups. Baseline: TBD (2009) Target: TBD
UNIFEM Reviews
Extent to which NDP incorporates National Action plans on gender equality Baseline: TBD (2009) Target: TBD
UNIFEM Reviews
Assumptions and risks: Vulnerable communities will adopt agricultural best practices Macro‐ economic policies will continue to provide conducive economic environment Projected growth rate will be realized despite current global economic recession Adaptation to changing environment shocks such as climate change is possible and such shocks will not inhibit implementation Agricultural sector will continue to be the backbone of the Ugandan economy The sector will continue to provide raw materials for industrial development New employment and wealth creation opportunities and initiatives will continue to be prioritized and developed in line with the equity principle. Natural disasters such as flooding may inhibit implementation Insecurity in Karamoja area may inhibit implementation
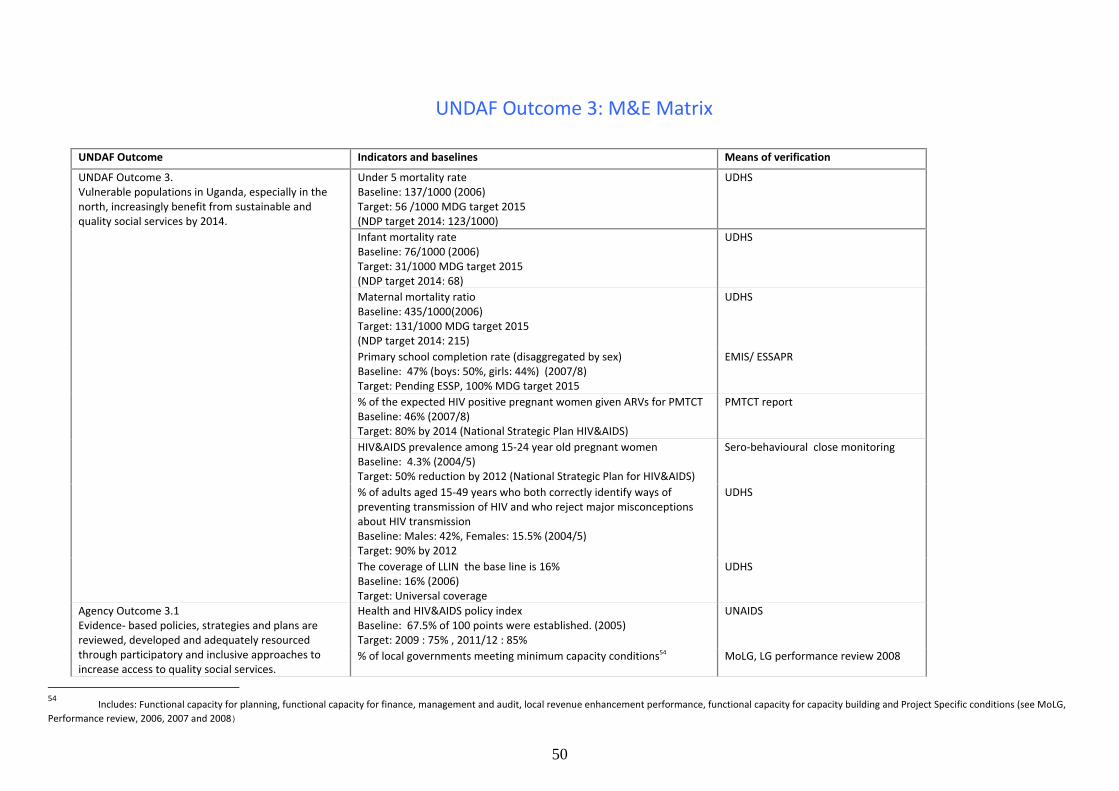
50
UNDAF Outcome 3: M&E Matrix
UNDAF Outcome Indicators and baselines Means of verification
UNDAF Outcome 3. Vulnerable populations in Uganda, especially in the north, increasingly benefit from sustainable and quality social services by 2014.
Under 5 mortality rate Baseline: 137/1000 (2006) Target: 56 /1000 MDG target 2015 (NDP target 2014: 123/1000)
UDHS
Infant mortality rate Baseline: 76/1000 (2006) Target: 31/1000 MDG target 2015 (NDP target 2014: 68)
UDHS
Maternal mortality ratio Baseline: 435/1000(2006) Target: 131/1000 MDG target 2015 (NDP target 2014: 215)
UDHS
Primary school completion rate (disaggregated by sex) Baseline: 47% (boys: 50%, girls: 44%) (2007/8) Target: Pending ESSP, 100% MDG target 2015
EMIS/ ESSAPR
% of the expected HIV positive pregnant women given ARVs for PMTCT Baseline: 46% (2007/8) Target: 80% by 2014 (National Strategic Plan HIV&AIDS)
PMTCT report
HIV&AIDS prevalence among 15‐24 year old pregnant women Baseline: 4.3% (2004/5) Target: 50% reduction by 2012 (National Strategic Plan for HIV&AIDS)
Sero‐behavioural close monitoring
% of adults aged 15‐49 years who both correctly identify ways of preventing transmission of HIV and who reject major misconceptions about HIV transmission Baseline: Males: 42%, Females: 15.5% (2004/5) Target: 90% by 2012
UDHS
The coverage of LLIN the base line is 16% Baseline: 16% (2006) Target: Universal coverage
UDHS
Agency Outcome 3.1 Evidence‐ based policies, strategies and plans are reviewed, developed and adequately resourced through participatory and inclusive approaches to increase access to quality social services.
Health and HIV&AIDS policy index Baseline: 67.5% of 100 points were established. (2005) Target: 2009 : 75% , 2011/12 : 85%
UNAIDS
% of local governments meeting minimum capacity conditions54 MoLG, LG performance review 2008
54 Includes: Functional capacity for planning, functional capacity for finance, management and audit, local revenue enhancement performance, functional capacity for capacity building and Project Specific conditions (see MoLG, Performance review, 2006, 2007 and 2008)
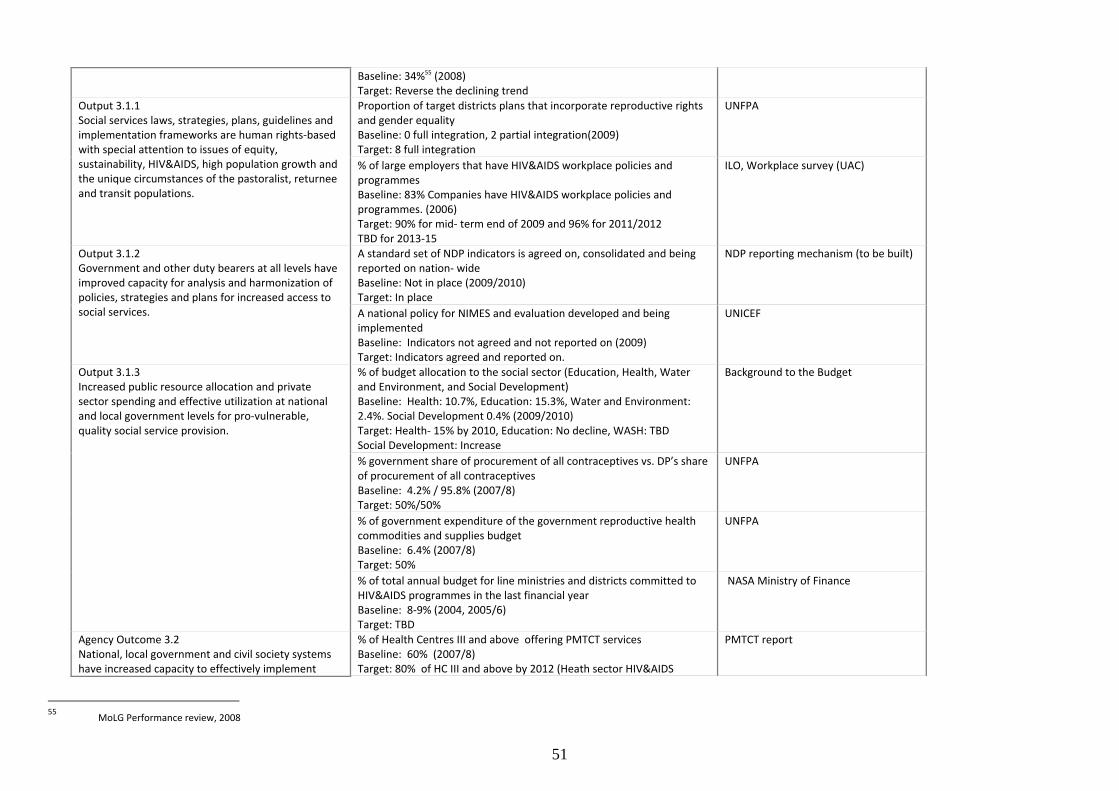
51
Baseline: 34%55 (2008) Target: Reverse the declining trend
Output 3.1.1 Social services laws, strategies, plans, guidelines and implementation frameworks are human rights‐based with special attention to issues of equity, sustainability, HIV&AIDS, high population growth and the unique circumstances of the pastoralist, returnee and transit populations.
Proportion of target districts plans that incorporate reproductive rights and gender equality Baseline: 0 full integration, 2 partial integration(2009) Target: 8 full integration
UNFPA
% of large employers that have HIV&AIDS workplace policies and programmes Baseline: 83% Companies have HIV&AIDS workplace policies and programmes. (2006) Target: 90% for mid‐ term end of 2009 and 96% for 2011/2012 TBD for 2013‐15
ILO, Workplace survey (UAC)
Output 3.1.2 Government and other duty bearers at all levels have improved capacity for analysis and harmonization of policies, strategies and plans for increased access to social services.
A standard set of NDP indicators is agreed on, consolidated and being reported on nation‐ wide Baseline: Not in place (2009/2010) Target: In place
NDP reporting mechanism (to be built)
A national policy for NIMES and evaluation developed and being implemented Baseline: Indicators not agreed and not reported on (2009) Target: Indicators agreed and reported on.
UNICEF
Output 3.1.3 Increased public resource allocation and private sector spending and effective utilization at national and local government levels for pro‐vulnerable, quality social service provision.
% of budget allocation to the social sector (Education, Health, Water and Environment, and Social Development) Baseline: Health: 10.7%, Education: 15.3%, Water and Environment: 2.4%. Social Development 0.4% (2009/2010) Target: Health‐ 15% by 2010, Education: No decline, WASH: TBD Social Development: Increase
Background to the Budget
% government share of procurement of all contraceptives vs. DP’s share of procurement of all contraceptives Baseline: 4.2% / 95.8% (2007/8) Target: 50%/50%
UNFPA
% of government expenditure of the government reproductive health commodities and supplies budget Baseline: 6.4% (2007/8) Target: 50%
UNFPA
% of total annual budget for line ministries and districts committed to HIV&AIDS programmes in the last financial year Baseline: 8‐9% (2004, 2005/6) Target: TBD
NASA Ministry of Finance
Agency Outcome 3.2 National, local government and civil society systems have increased capacity to effectively implement
% of Health Centres III and above offering PMTCT services Baseline: 60% (2007/8) Target: 80% of HC III and above by 2012 (Heath sector HIV&AIDS
PMTCT report
55 MoLG Performance review, 2008
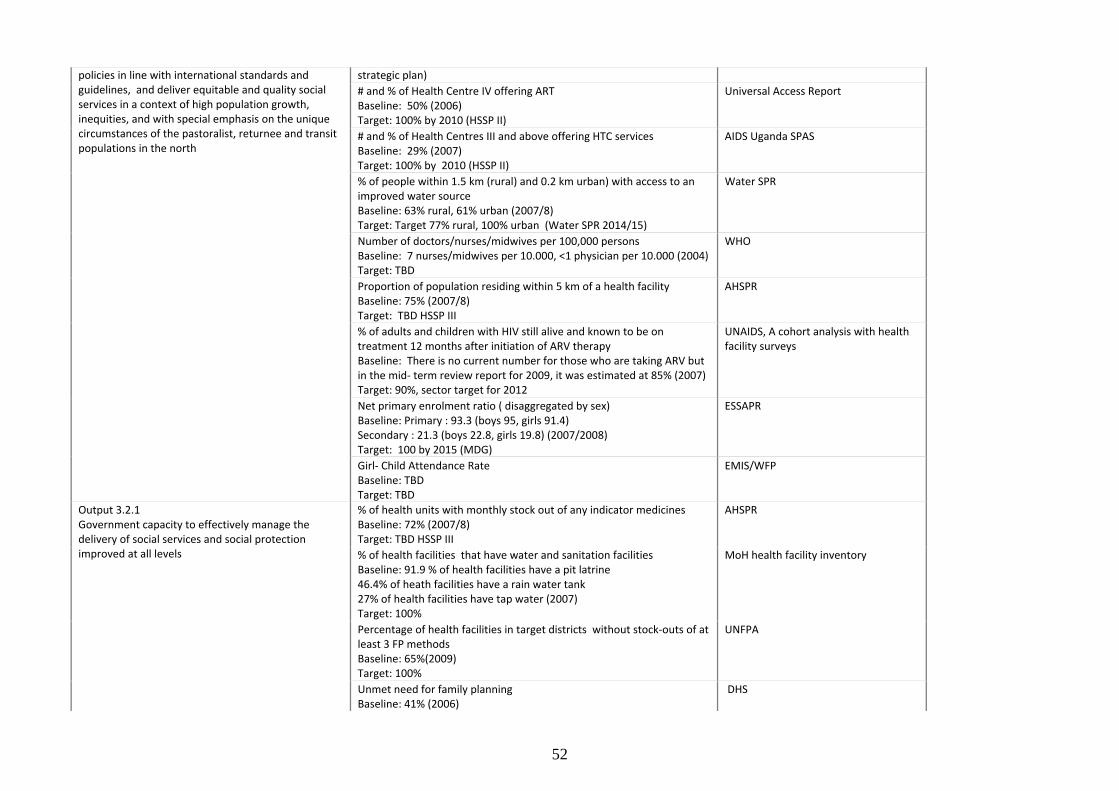
52
policies in line with international standards and guidelines, and deliver equitable and quality social services in a context of high population growth, inequities, and with special emphasis on the unique circumstances of the pastoralist, returnee and transit populations in the north
strategic plan) # and % of Health Centre IV offering ART Baseline: 50% (2006) Target: 100% by 2010 (HSSP II)
Universal Access Report
# and % of Health Centres III and above offering HTC services Baseline: 29% (2007) Target: 100% by 2010 (HSSP II)
AIDS Uganda SPAS
% of people within 1.5 km (rural) and 0.2 km urban) with access to an improved water source Baseline: 63% rural, 61% urban (2007/8) Target: Target 77% rural, 100% urban (Water SPR 2014/15)
Water SPR
Number of doctors/nurses/midwives per 100,000 persons Baseline: 7 nurses/midwives per 10.000, <1 physician per 10.000 (2004) Target: TBD
WHO
Proportion of population residing within 5 km of a health facility Baseline: 75% (2007/8) Target: TBD HSSP III
AHSPR
% of adults and children with HIV still alive and known to be on treatment 12 months after initiation of ARV therapy Baseline: There is no current number for those who are taking ARV but in the mid‐ term review report for 2009, it was estimated at 85% (2007) Target: 90%, sector target for 2012
UNAIDS, A cohort analysis with health facility surveys
Net primary enrolment ratio ( disaggregated by sex) Baseline: Primary : 93.3 (boys 95, girls 91.4) Secondary : 21.3 (boys 22.8, girls 19.8) (2007/2008) Target: 100 by 2015 (MDG)
ESSAPR
Girl‐ Child Attendance Rate Baseline: TBD Target: TBD
EMIS/WFP
Output 3.2.1 Government capacity to effectively manage the delivery of social services and social protection improved at all levels
% of health units with monthly stock out of any indicator medicines Baseline: 72% (2007/8) Target: TBD HSSP III
AHSPR
% of health facilities that have water and sanitation facilities Baseline: 91.9 % of health facilities have a pit latrine 46.4% of heath facilities have a rain water tank 27% of health facilities have tap water (2007) Target: 100%
MoH health facility inventory
Percentage of health facilities in target districts without stock‐outs of at least 3 FP methods Baseline: 65%(2009) Target: 100%
UNFPA
Unmet need for family planning Baseline: 41% (2006)
DHS
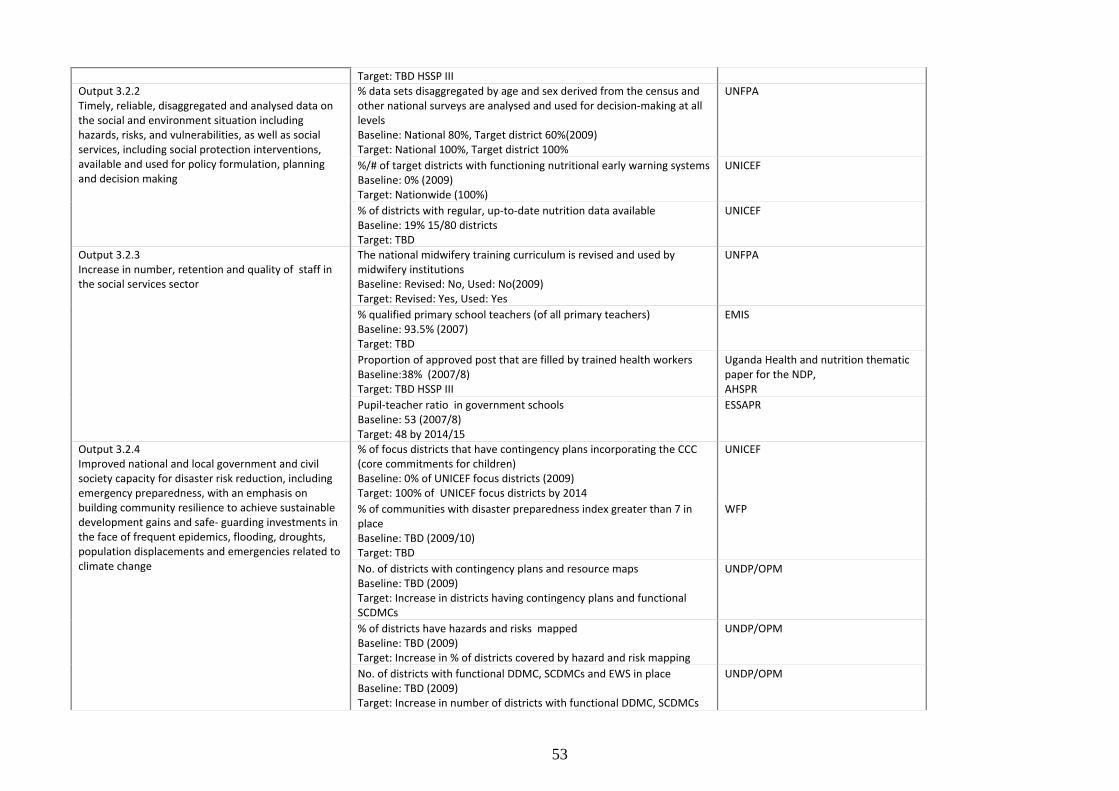
53
Target: TBD HSSP III Output 3.2.2 Timely, reliable, disaggregated and analysed data on the social and environment situation including hazards, risks, and vulnerabilities, as well as social services, including social protection interventions, available and used for policy formulation, planning and decision making
% data sets disaggregated by age and sex derived from the census and other national surveys are analysed and used for decision‐making at all levels Baseline: National 80%, Target district 60%(2009) Target: National 100%, Target district 100%
UNFPA
%/# of target districts with functioning nutritional early warning systems Baseline: 0% (2009) Target: Nationwide (100%)
UNICEF
% of districts with regular, up‐to‐date nutrition data available Baseline: 19% 15/80 districts Target: TBD
UNICEF
Output 3.2.3 Increase in number, retention and quality of staff in the social services sector
The national midwifery training curriculum is revised and used by midwifery institutions Baseline: Revised: No, Used: No(2009) Target: Revised: Yes, Used: Yes
UNFPA
% qualified primary school teachers (of all primary teachers) Baseline: 93.5% (2007) Target: TBD
EMIS
Proportion of approved post that are filled by trained health workers Baseline:38% (2007/8) Target: TBD HSSP III
Uganda Health and nutrition thematic paper for the NDP, AHSPR
Pupil‐teacher ratio in government schools Baseline: 53 (2007/8) Target: 48 by 2014/15
ESSAPR
Output 3.2.4 Improved national and local government and civil society capacity for disaster risk reduction, including emergency preparedness, with an emphasis on building community resilience to achieve sustainable development gains and safe‐ guarding investments in the face of frequent epidemics, flooding, droughts, population displacements and emergencies related to climate change
% of focus districts that have contingency plans incorporating the CCC (core commitments for children) Baseline: 0% of UNICEF focus districts (2009) Target: 100% of UNICEF focus districts by 2014
UNICEF
% of communities with disaster preparedness index greater than 7 in place Baseline: TBD (2009/10) Target: TBD
WFP
No. of districts with contingency plans and resource maps Baseline: TBD (2009) Target: Increase in districts having contingency plans and functional SCDMCs
UNDP/OPM
% of districts have hazards and risks mapped Baseline: TBD (2009) Target: Increase in % of districts covered by hazard and risk mapping
UNDP/OPM
No. of districts with functional DDMC, SCDMCs and EWS in place Baseline: TBD (2009) Target: Increase in number of districts with functional DDMC, SCDMCs
UNDP/OPM
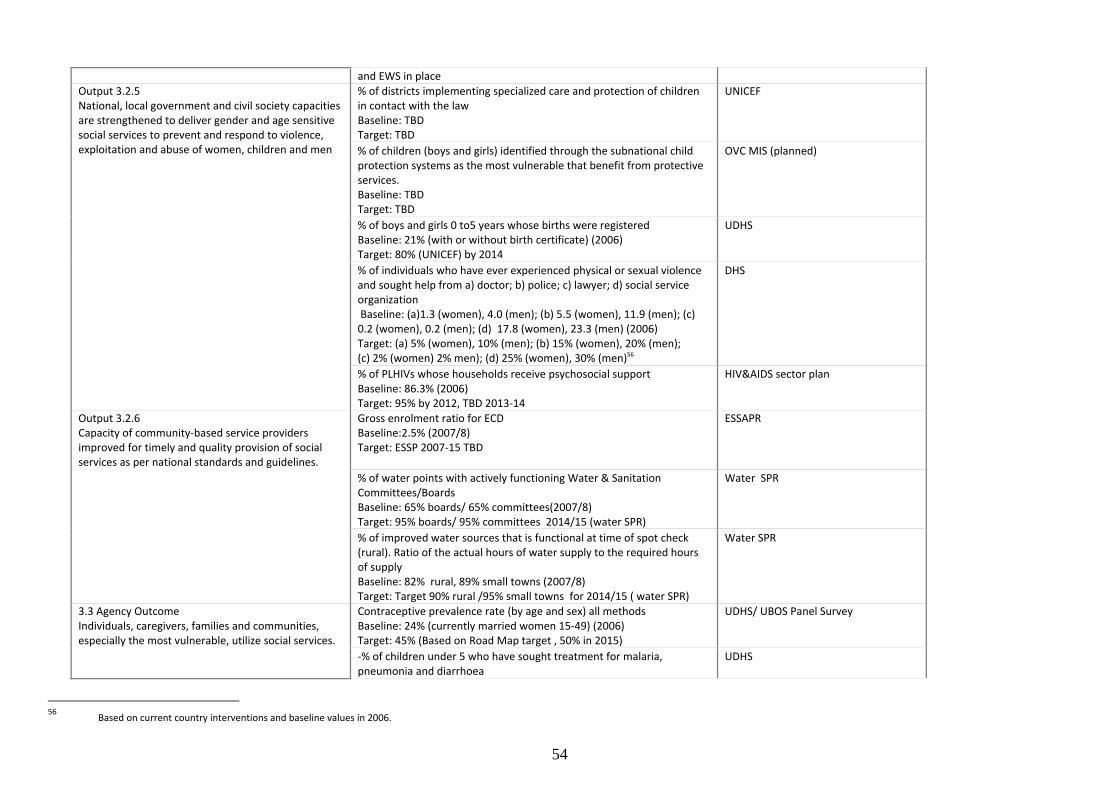
54
and EWS in place Output 3.2.5 National, local government and civil society capacities are strengthened to deliver gender and age sensitive social services to prevent and respond to violence, exploitation and abuse of women, children and men
% of districts implementing specialized care and protection of children in contact with the law Baseline: TBD Target: TBD
UNICEF
% of children (boys and girls) identified through the subnational child protection systems as the most vulnerable that benefit from protective services. Baseline: TBD Target: TBD
OVC MIS (planned)
% of boys and girls 0 to5 years whose births were registered Baseline: 21% (with or without birth certificate) (2006) Target: 80% (UNICEF) by 2014
UDHS
% of individuals who have ever experienced physical or sexual violence and sought help from a) doctor; b) police; c) lawyer; d) social service organization Baseline: (a)1.3 (women), 4.0 (men); (b) 5.5 (women), 11.9 (men); (c) 0.2 (women), 0.2 (men); (d) 17.8 (women), 23.3 (men) (2006) Target: (a) 5% (women), 10% (men); (b) 15% (women), 20% (men); (c) 2% (women) 2% men); (d) 25% (women), 30% (men)56
DHS
% of PLHIVs whose households receive psychosocial support Baseline: 86.3% (2006) Target: 95% by 2012, TBD 2013‐14
HIV&AIDS sector plan
Output 3.2.6 Capacity of community‐based service providers improved for timely and quality provision of social services as per national standards and guidelines.
Gross enrolment ratio for ECD Baseline:2.5% (2007/8) Target: ESSP 2007‐15 TBD
ESSAPR
% of water points with actively functioning Water & Sanitation Committees/Boards Baseline: 65% boards/ 65% committees(2007/8) Target: 95% boards/ 95% committees 2014/15 (water SPR)
Water SPR
% of improved water sources that is functional at time of spot check (rural). Ratio of the actual hours of water supply to the required hours of supply Baseline: 82% rural, 89% small towns (2007/8) Target: Target 90% rural /95% small towns for 2014/15 ( water SPR)
Water SPR
3.3 Agency Outcome Individuals, caregivers, families and communities, especially the most vulnerable, utilize social services.
Contraceptive prevalence rate (by age and sex) all methods Baseline: 24% (currently married women 15‐49) (2006) Target: 45% (Based on Road Map target , 50% in 2015)
UDHS/ UBOS Panel Survey
‐% of children under 5 who have sought treatment for malaria, pneumonia and diarrhoea
UDHS
56 Based on current country interventions and baseline values in 2006.
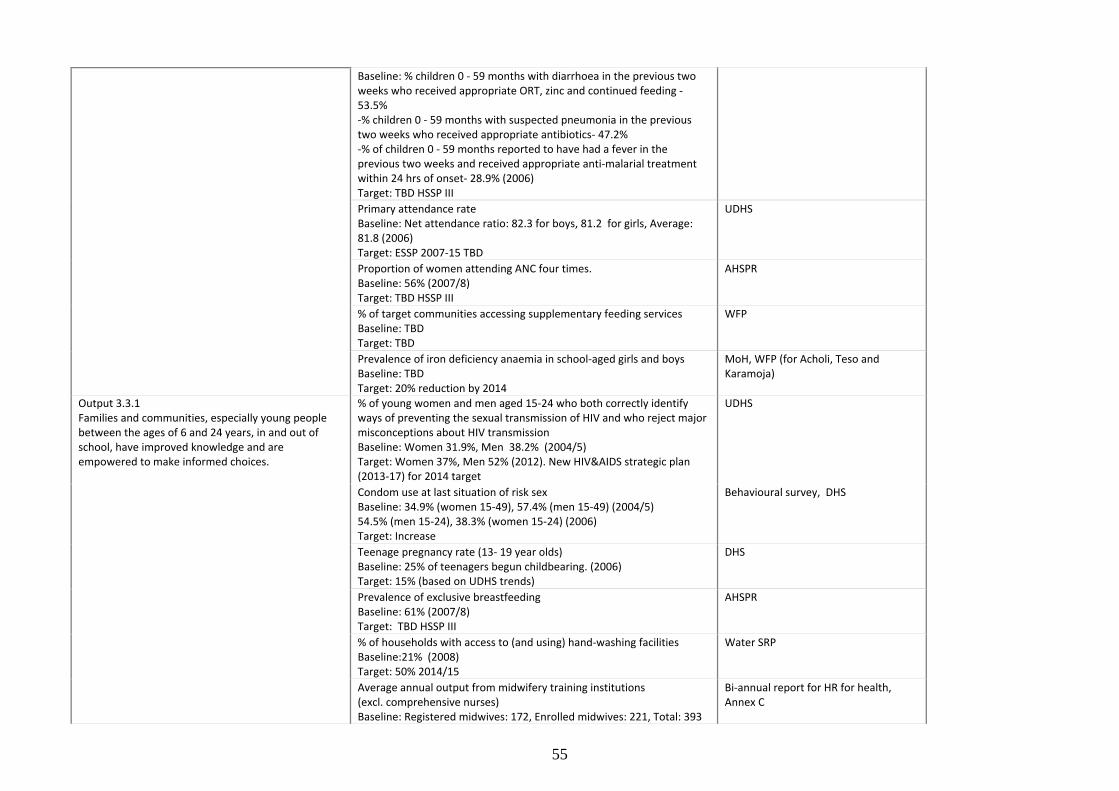
55
Baseline: % children 0 ‐ 59 months with diarrhoea in the previous two weeks who received appropriate ORT, zinc and continued feeding ‐53.5% ‐% children 0 ‐ 59 months with suspected pneumonia in the previous two weeks who received appropriate antibiotics‐ 47.2% ‐% of children 0 ‐ 59 months reported to have had a fever in the previous two weeks and received appropriate anti‐malarial treatment within 24 hrs of onset‐ 28.9% (2006) Target: TBD HSSP III Primary attendance rate Baseline: Net attendance ratio: 82.3 for boys, 81.2 for girls, Average: 81.8 (2006) Target: ESSP 2007‐15 TBD
UDHS
Proportion of women attending ANC four times. Baseline: 56% (2007/8) Target: TBD HSSP III
AHSPR
% of target communities accessing supplementary feeding services Baseline: TBD Target: TBD
WFP
Prevalence of iron deficiency anaemia in school‐aged girls and boys Baseline: TBD Target: 20% reduction by 2014
MoH, WFP (for Acholi, Teso and Karamoja)
Output 3.3.1 Families and communities, especially young people between the ages of 6 and 24 years, in and out of school, have improved knowledge and are empowered to make informed choices.
% of young women and men aged 15‐24 who both correctly identify ways of preventing the sexual transmission of HIV and who reject major misconceptions about HIV transmission Baseline: Women 31.9%, Men 38.2% (2004/5) Target: Women 37%, Men 52% (2012). New HIV&AIDS strategic plan (2013‐17) for 2014 target
UDHS
Condom use at last situation of risk sex Baseline: 34.9% (women 15‐49), 57.4% (men 15‐49) (2004/5) 54.5% (men 15‐24), 38.3% (women 15‐24) (2006) Target: Increase
Behavioural survey, DHS
Teenage pregnancy rate (13‐ 19 year olds) Baseline: 25% of teenagers begun childbearing. (2006) Target: 15% (based on UDHS trends)
DHS
Prevalence of exclusive breastfeeding Baseline: 61% (2007/8) Target: TBD HSSP III
AHSPR
% of households with access to (and using) hand‐washing facilities Baseline:21% (2008) Target: 50% 2014/15
Water SRP
Average annual output from midwifery training institutions (excl. comprehensive nurses) Baseline: Registered midwives: 172, Enrolled midwives: 221, Total: 393
Bi‐annual report for HR for health, Annex C
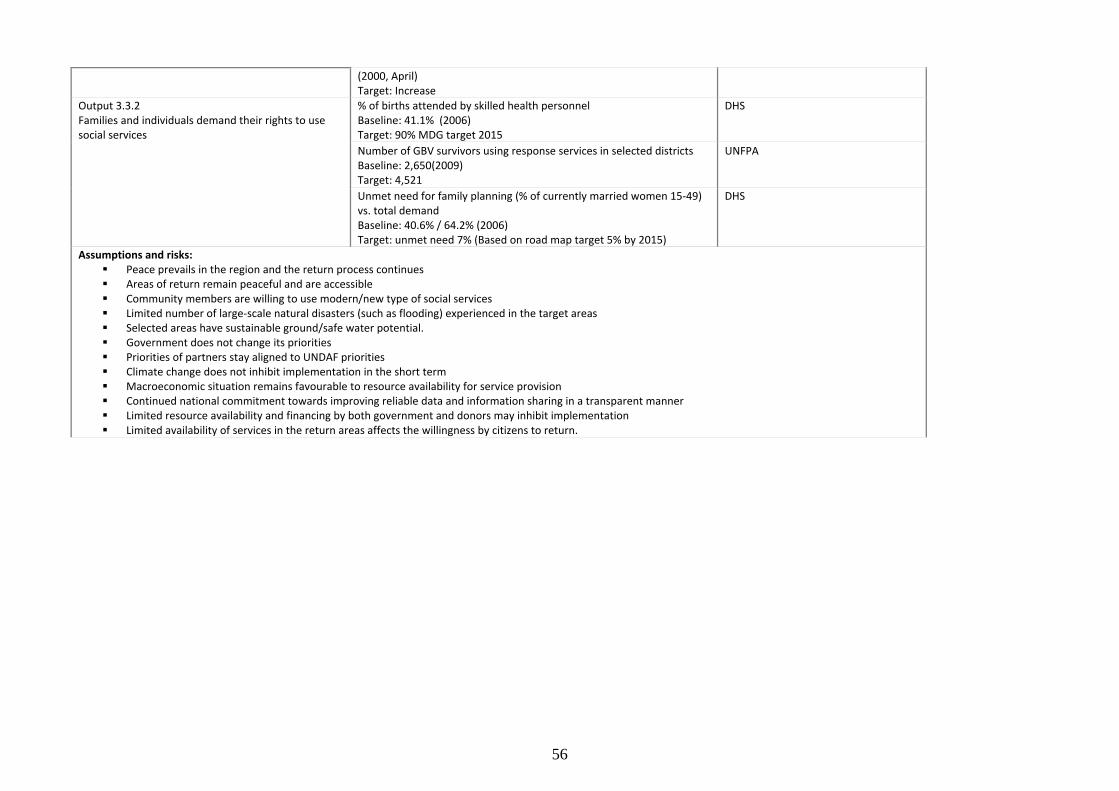
56
(2000, April) Target: Increase
Output 3.3.2 Families and individuals demand their rights to use social services
% of births attended by skilled health personnel Baseline: 41.1% (2006) Target: 90% MDG target 2015
DHS
Number of GBV survivors using response services in selected districts Baseline: 2,650(2009) Target: 4,521
UNFPA
Unmet need for family planning (% of currently married women 15‐49) vs. total demand Baseline: 40.6% / 64.2% (2006) Target: unmet need 7% (Based on road map target 5% by 2015)
DHS
Assumptions and risks: Peace prevails in the region and the return process continues Areas of return remain peaceful and are accessible Community members are willing to use modern/new type of social services Limited number of large‐scale natural disasters (such as flooding) experienced in the target areas Selected areas have sustainable ground/safe water potential. Government does not change its priorities Priorities of partners stay aligned to UNDAF priorities Climate change does not inhibit implementation in the short term Macroeconomic situation remains favourable to resource availability for service provision Continued national commitment towards improving reliable data and information sharing in a transparent manner Limited resource availability and financing by both government and donors may inhibit implementation Limited availability of services in the return areas affects the willingness by citizens to return.

57
� ����������
����� ����������������������������������
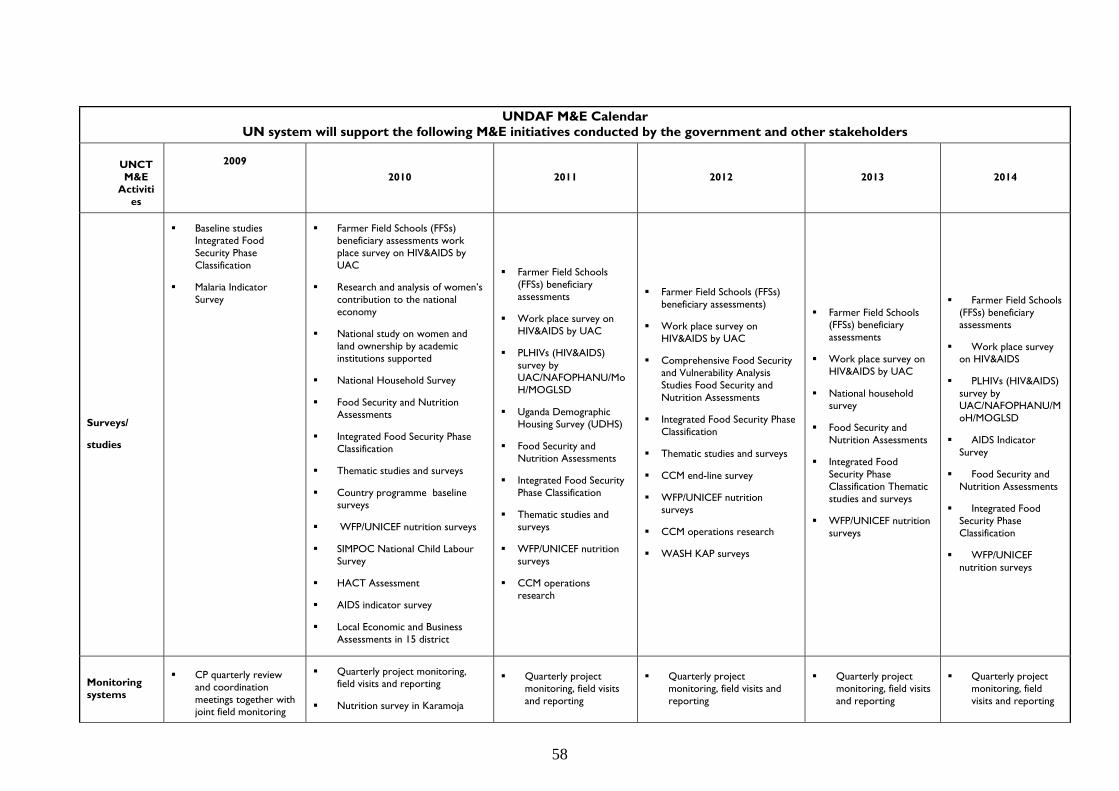
58
UNDAF M&E Calendar UN system will support the following M&E initiatives conducted by the government and other stakeholders
UNCT M&E
Activities
2009
2010 2011 2012 2013 2014
Surveys/
studies
Baseline studies Integrated Food Security Phase Classification
Malaria Indicator Survey
Farmer Field Schools (FFSs) beneficiary assessments work place survey on HIV&AIDS by UAC
Research and analysis of women’s contribution to the national economy
National study on women and land ownership by academic institutions supported
National Household Survey
Food Security and Nutrition Assessments
Integrated Food Security Phase Classification
Thematic studies and surveys
Country programme baseline surveys
WFP/UNICEF nutrition surveys
SIMPOC National Child Labour Survey
HACT Assessment
AIDS indicator survey
Local Economic and Business Assessments in 15 district
Farmer Field Schools (FFSs) beneficiary assessments
Work place survey on HIV&AIDS by UAC
PLHIVs (HIV&AIDS) survey by UAC/NAFOPHANU/MoH/MOGLSD
Uganda Demographic Housing Survey (UDHS)
Food Security and Nutrition Assessments
Integrated Food Security Phase Classification
Thematic studies and surveys
WFP/UNICEF nutrition surveys
CCM operations research
Farmer Field Schools (FFSs) beneficiary assessments)
Work place survey on HIV&AIDS by UAC
Comprehensive Food Security and Vulnerability Analysis Studies Food Security and Nutrition Assessments
Integrated Food Security Phase Classification
Thematic studies and surveys
CCM end-line survey
WFP/UNICEF nutrition surveys
CCM operations research
WASH KAP surveys
Farmer Field Schools (FFSs) beneficiary assessments
Work place survey on HIV&AIDS by UAC
National household survey
Food Security and Nutrition Assessments
Integrated Food Security Phase Classification Thematic studies and surveys
WFP/UNICEF nutrition surveys
Farmer Field Schools (FFSs) beneficiary assessments
Work place survey on HIV&AIDS
PLHIVs (HIV&AIDS) survey by UAC/NAFOPHANU/MoH/MOGLSD
AIDS Indicator Survey
Food Security and Nutrition Assessments
Integrated Food Security Phase Classification
WFP/UNICEF nutrition surveys
Monitoring systems
CP quarterly review and coordination meetings together with joint field monitoring
Quarterly project monitoring, field visits and reporting
Nutrition survey in Karamoja
Quarterly project monitoring, field visits and reporting
Quarterly project monitoring, field visits and reporting
Quarterly project monitoring, field visits and reporting
Quarterly project monitoring, field visits and reporting
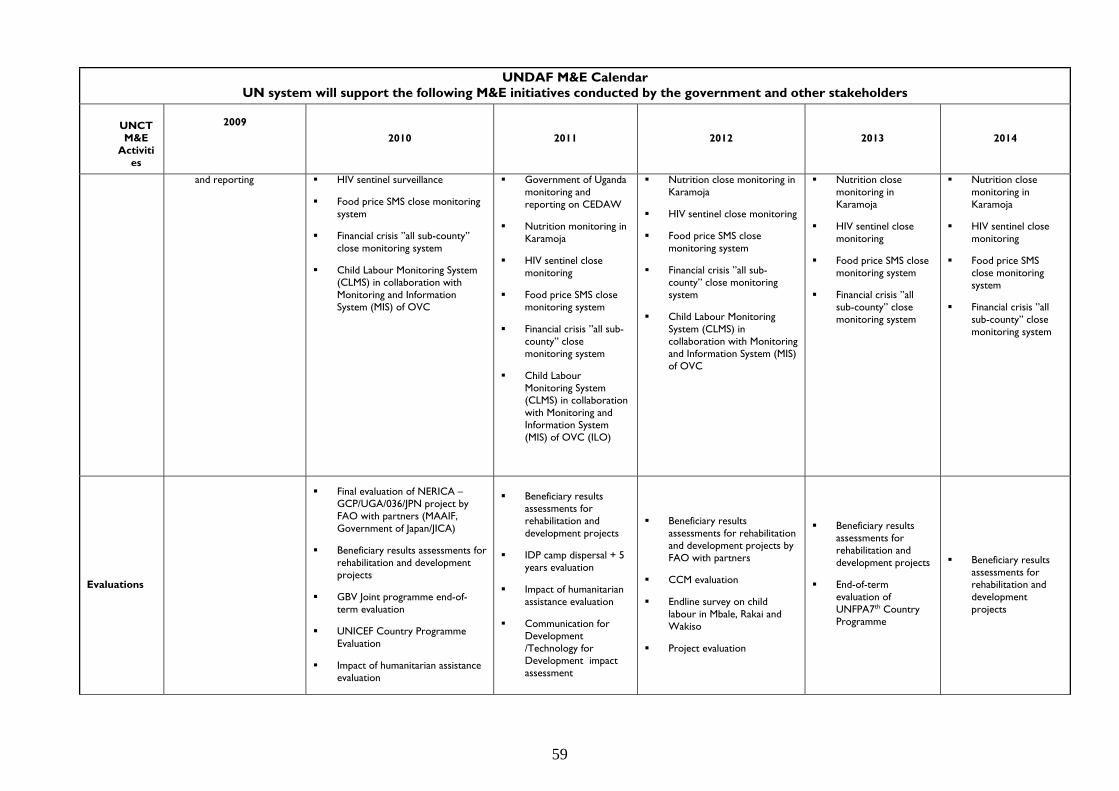
59
UNDAF M&E Calendar UN system will support the following M&E initiatives conducted by the government and other stakeholders
UNCT M&E
Activities
2009
2010 2011 2012 2013 2014
and reporting
HIV sentinel surveillance
Food price SMS close monitoring system
Financial crisis ”all sub-county” close monitoring system
Child Labour Monitoring System (CLMS) in collaboration with Monitoring and Information System (MIS) of OVC
Government of Uganda monitoring and reporting on CEDAW
Nutrition monitoring in Karamoja
HIV sentinel close monitoring
Food price SMS close monitoring system
Financial crisis ”all sub-county” close monitoring system
Child Labour Monitoring System (CLMS) in collaboration with Monitoring and Information System (MIS) of OVC (ILO)
Nutrition close monitoring in Karamoja
HIV sentinel close monitoring
Food price SMS close monitoring system
Financial crisis ”all sub-county” close monitoring system
Child Labour Monitoring System (CLMS) in collaboration with Monitoring and Information System (MIS) of OVC
Nutrition close monitoring in Karamoja
HIV sentinel close monitoring
Food price SMS close monitoring system
Financial crisis ”all sub-county” close monitoring system
Nutrition close monitoring in Karamoja
HIV sentinel close monitoring
Food price SMS close monitoring system
Financial crisis ”all sub-county” close monitoring system
Evaluations
Final evaluation of NERICA – GCP/UGA/036/JPN project by FAO with partners (MAAIF, Government of Japan/JICA)
Beneficiary results assessments for rehabilitation and development projects
GBV Joint programme end-of-term evaluation
UNICEF Country Programme Evaluation
Impact of humanitarian assistance evaluation
Beneficiary results assessments for rehabilitation and development projects
IDP camp dispersal + 5 years evaluation
Impact of humanitarian assistance evaluation
Communication for Development /Technology for Development impact assessment
Beneficiary results assessments for rehabilitation and development projects by FAO with partners
CCM evaluation
Endline survey on child labour in Mbale, Rakai and Wakiso
Project evaluation
Beneficiary results assessments for rehabilitation and development projects
End-of-term evaluation of UNFPA7th Country Programme
Beneficiary results assessments for rehabilitation and development projects

60
UNDAF M&E Calendar UN system will support the following M&E initiatives conducted by the government and other stakeholders
UNCT M&E
Activities
2009
2010 2011 2012 2013 2014
Reviews
Impact of humanitarian assistance evaluation Quarterly and Annual programme and Project reviews
FAO half-yearly post-harvest crop assessments with partners (NGOs, farming communities)
Quarterly and Annual Programme and Project reviews
FAO Half-yearly post-harvest crop assessments with partners (NGOs, farming communities)
Annual Country Programme Review (UNICEF)
Mid-term project reviews
Quarterly and Annual Programme and Project reviews
• Mid-term Country Programme Reviews
• Annual and Mid-term review of 7th Country Programme (UNFPA)
Quarterly and Annual Programme and Project reviews
FAO half-yearly post-harvest crop assessments with partners (NGOs, farming communities)
Quarterly and Annual Programme and Project reviews
• FAO half-yearly post-harvest crop assessments with partners (NGOs, farming communities)
UNDAF evaluation milestones
The UN will align evaluation milestones with the NDP Monitoring and Evaluation strategy now under development. The UN may conduct a few joint thematic evaluations and will discuss with Government whether to conduct a mid-term review or final evaluation of the UNDAF.
M&E capacity building
• Training on M&E and RBM for UNFPA implementing partners
Support to Census 2012
Support to annual panel survey
• Support to sero-behavioural survey
• Support to EMIS, HMIS, WESMIS, OVC MIS, cash transfer MIS, NDP monitoring , HIV sentinel survey, Community Information Systems, NIMES and creation of Child Protection monitoring system
• Support to UDHS 2011
Support to Census 2012
Support to annual panel survey
• Support pilot population census
• Support to NDP mid/final evaluation
• Support to UNHS
• Support to EMIS, HMIS, WESMIS, OVC MIS, cash transfer MIS, NDP monitoring , HIV sentinel close
Support to Census 2012
Support to annual panel survey
• Support pilot population census
• Support to NDP mid/final evaluation
• Support to EMIS, HMIS, WESMIS, OVC MIS, cash transfer MIS, NDP monitoring , HIV sentinel close monitoring, Community Information Systems, NIMES and Child Protection monitoring system
Support to Census 2012
Support to annual panel survey
• Support to EMIS, HMIS, WESMIS, OVC MIS, cash transfer MIS, NDP monitoring , HIV sentinel close monitoring, Community Information Systems, NIMES and Child Protection monitoring system
Support to Census 2012 (UNFPA)
Support to annual panel survey (UNFPA)
• Support to UBOS/WB panel survey(UNICEF)
• Support to NDP mid/final evaluation
• Support to EMIS, HMIS, WESMIS, OVC MIS, cash transfer MIS, NDP monitoring , HIV sentinel close monitoring,
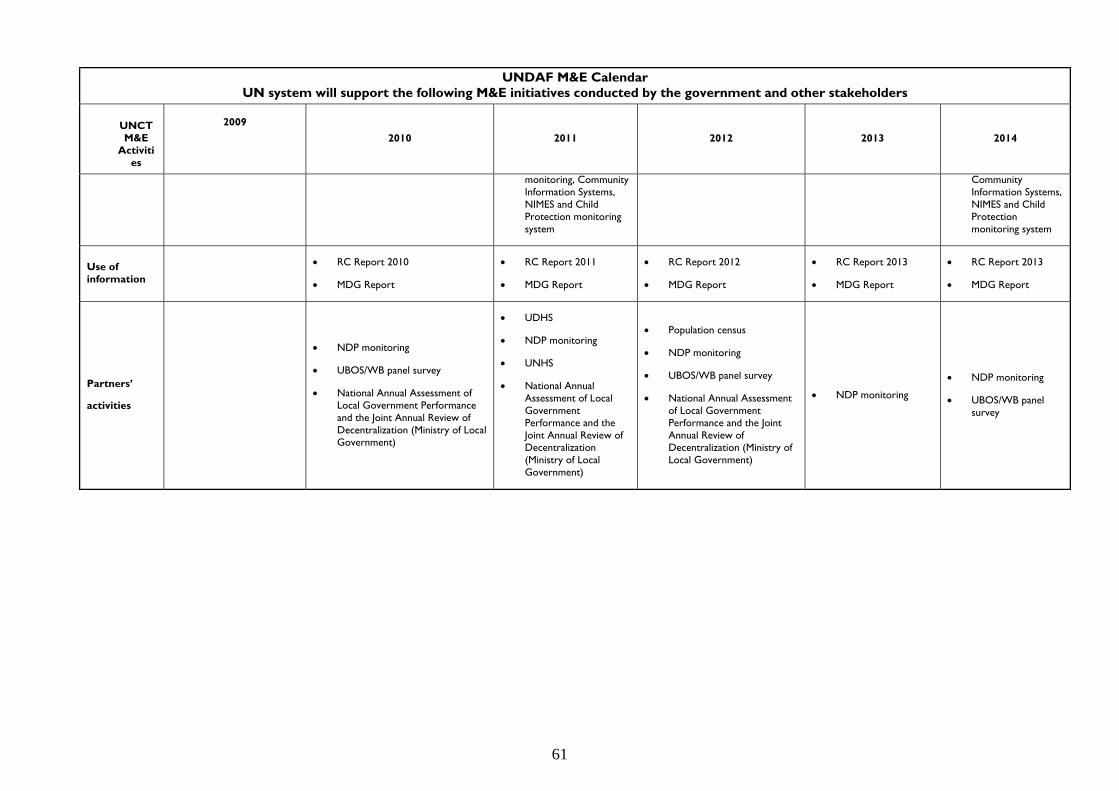
61
UNDAF M&E Calendar UN system will support the following M&E initiatives conducted by the government and other stakeholders
UNCT M&E
Activities
2009
2010 2011 2012 2013 2014
monitoring, Community Information Systems, NIMES and Child Protection monitoring system
Community Information Systems, NIMES and Child Protection monitoring system
Use of information
• RC Report 2010
• MDG Report
• RC Report 2011
• MDG Report
• RC Report 2012
• MDG Report
• RC Report 2013
• MDG Report
• RC Report 2013
• MDG Report
Partners’
activities
• NDP monitoring
• UBOS/WB panel survey
• National Annual Assessment of Local Government Performance and the Joint Annual Review of Decentralization (Ministry of Local Government)
• UDHS
• NDP monitoring
• UNHS
• National Annual Assessment of Local Government Performance and the Joint Annual Review of Decentralization (Ministry of Local Government)
• Population census
• NDP monitoring
• UBOS/WB panel survey
• National Annual Assessment of Local Government Performance and the Joint Annual Review of Decentralization (Ministry of Local Government)
• NDP monitoring
• NDP monitoring
• UBOS/WB panel survey
62
� � � � � � � � �
��������� � ���������������������
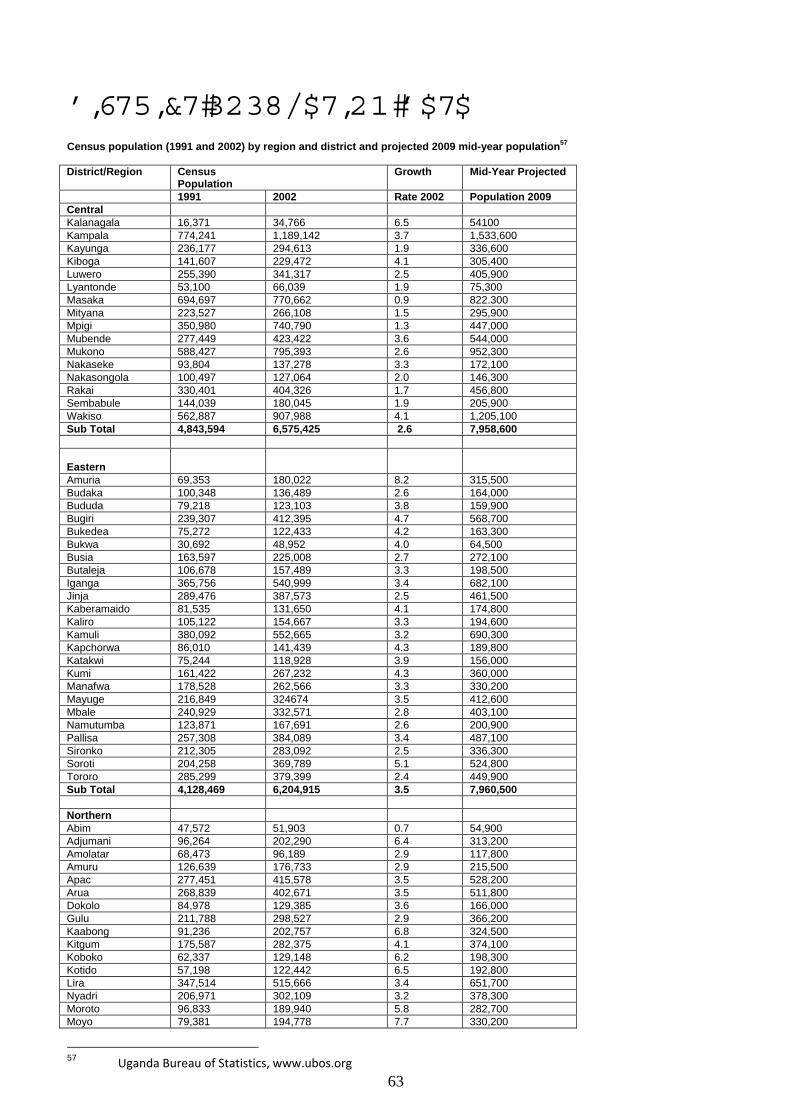
63
�� ��� ��!��"� �!�� � Census population (1991 and 2002) by region and district and projected 2009 mid-year population57 District/Region Census
Population Growth Mid-Year Projected
1991 2002 Rate 2002 Population 2009 Central Kalanagala 16,371 34,766 6.5 54100 Kampala 774,241 1,189,142 3.7 1,533,600 Kayunga 236,177 294,613 1.9 336,600 Kiboga 141,607 229,472 4.1 305,400 Luwero 255,390 341,317 2.5 405,900 Lyantonde 53,100 66,039 1.9 75,300 Masaka 694,697 770,662 0.9 822.300 Mityana 223,527 266,108 1.5 295,900 Mpigi 350,980 740,790 1.3 447,000 Mubende 277,449 423,422 3.6 544,000 Mukono 588,427 795,393 2.6 952,300 Nakaseke 93,804 137,278 3.3 172,100 Nakasongola 100,497 127,064 2.0 146,300 Rakai 330,401 404,326 1.7 456,800 Sembabule 144,039 180,045 1.9 205,900 Wakiso 562,887 907,988 4.1 1,205,100 Sub Total 4,843,594 6,575,425 2.6 7,958,600 Eastern
Amuria 69,353 180,022 8.2 315,500 Budaka 100,348 136,489 2.6 164,000 Bududa 79,218 123,103 3.8 159,900 Bugiri 239,307 412,395 4.7 568,700 Bukedea 75,272 122,433 4.2 163,300 Bukwa 30,692 48,952 4.0 64,500 Busia 163,597 225,008 2.7 272,100 Butaleja 106,678 157,489 3.3 198,500 Iganga 365,756 540,999 3.4 682,100 Jinja 289,476 387,573 2.5 461,500 Kaberamaido 81,535 131,650 4.1 174,800 Kaliro 105,122 154,667 3.3 194,600 Kamuli 380,092 552,665 3.2 690,300 Kapchorwa 86,010 141,439 4.3 189,800 Katakwi 75,244 118,928 3.9 156,000 Kumi 161,422 267,232 4.3 360,000 Manafwa 178,528 262,566 3.3 330,200 Mayuge 216,849 324674 3.5 412,600 Mbale 240,929 332,571 2.8 403,100 Namutumba 123,871 167,691 2.6 200,900 Pallisa 257,308 384,089 3.4 487,100 Sironko 212,305 283,092 2.5 336,300 Soroti 204,258 369,789 5.1 524,800 Tororo 285,299 379,399 2.4 449,900 Sub Total 4,128,469 6,204,915 3.5 7,960,500 Northern Abim 47,572 51,903 0.7 54,900 Adjumani 96,264 202,290 6.4 313,200 Amolatar 68,473 96,189 2.9 117,800 Amuru 126,639 176,733 2.9 215,500 Apac 277,451 415,578 3.5 528,200 Arua 268,839 402,671 3.5 511,800 Dokolo 84,978 129,385 3.6 166,000 Gulu 211,788 298,527 2.9 366,200 Kaabong 91,236 202,757 6.8 324,500 Kitgum 175,587 282,375 4.1 374,100 Koboko 62,337 129,148 6.2 198,300 Kotido 57,198 122,442 6.5 192,800 Lira 347,514 515,666 3.4 651,700 Nyadri 206,971 302,109 3.2 378,300 Moroto 96,833 189,940 5.8 282,700 Moyo 79,381 194,778 7.7 330,200
57 Uganda Bureau of Statistics, www.ubos.org
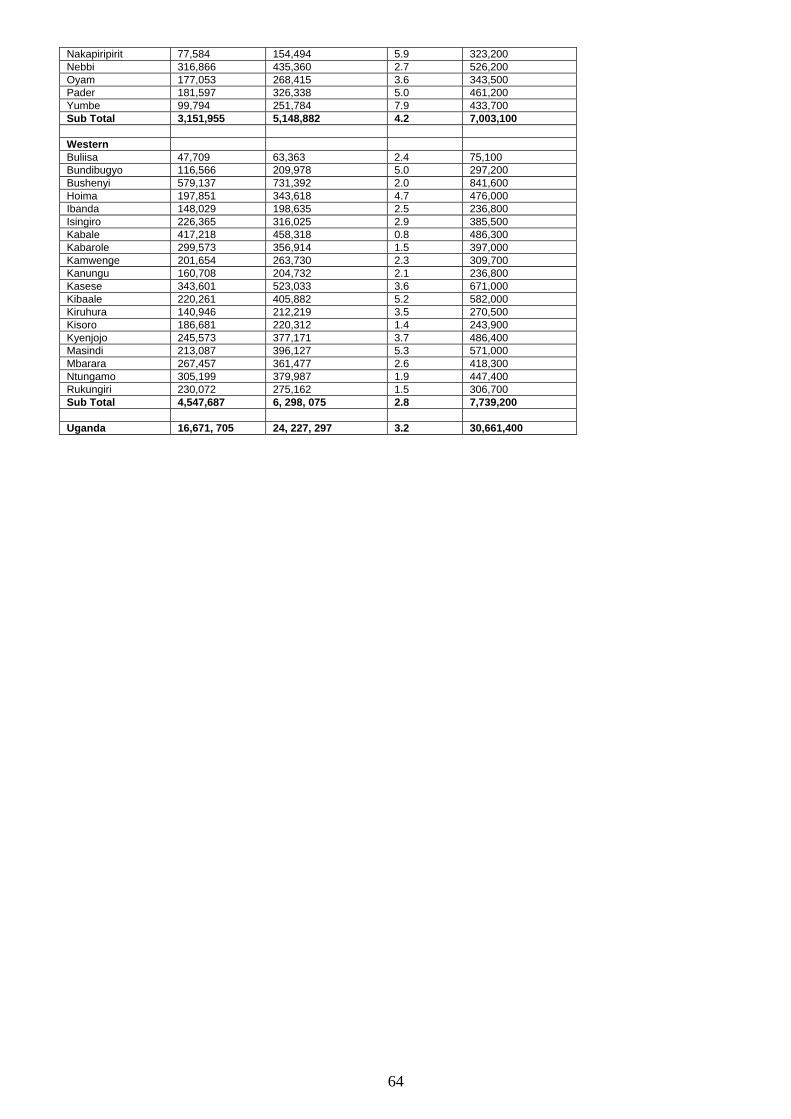
64
Nakapiripirit 77,584 154,494 5.9 323,200 Nebbi 316,866 435,360 2.7 526,200 Oyam 177,053 268,415 3.6 343,500 Pader 181,597 326,338 5.0 461,200 Yumbe 99,794 251,784 7.9 433,700 Sub Total 3,151,955 5,148,882 4.2 7,003,100 Western Buliisa 47,709 63,363 2.4 75,100 Bundibugyo 116,566 209,978 5.0 297,200 Bushenyi 579,137 731,392 2.0 841,600 Hoima 197,851 343,618 4.7 476,000 Ibanda 148,029 198,635 2.5 236,800 Isingiro 226,365 316,025 2.9 385,500 Kabale 417,218 458,318 0.8 486,300 Kabarole 299,573 356,914 1.5 397,000 Kamwenge 201,654 263,730 2.3 309,700 Kanungu 160,708 204,732 2.1 236,800 Kasese 343,601 523,033 3.6 671,000 Kibaale 220,261 405,882 5.2 582,000 Kiruhura 140,946 212,219 3.5 270,500 Kisoro 186,681 220,312 1.4 243,900 Kyenjojo 245,573 377,171 3.7 486,400 Masindi 213,087 396,127 5.3 571,000 Mbarara 267,457 361,477 2.6 418,300 Ntungamo 305,199 379,987 1.9 447,400 Rukungiri 230,072 275,162 1.5 306,700 Sub Total 4,547,687 6, 298, 075 2.8 7,739,200 Uganda 16,671, 705 24, 227, 297 3.2 30,661,400