the resistivity of metals wire as a function of...
TRANSCRIPT

RESISTIVITY OF METAL WIREAS A FUNCTION OF
TEMPERATURE
Mike L. Meier and Rita Kirchhofer
Department of Chemical Engineering and Materials ScienceUniversity of California, Davis
Davis, California 95616
Telephone: 530-752-5166e-mail: [email protected]
e-mail: [email protected]
(1)
RESISTIVITY OF METAL WIRE AS A FUNCTION OFTEMPERATURE
Mike Meier, Rita Kirchoffer
Department of Chemical Engineering and Materials ScienceUniversity of California, Davis
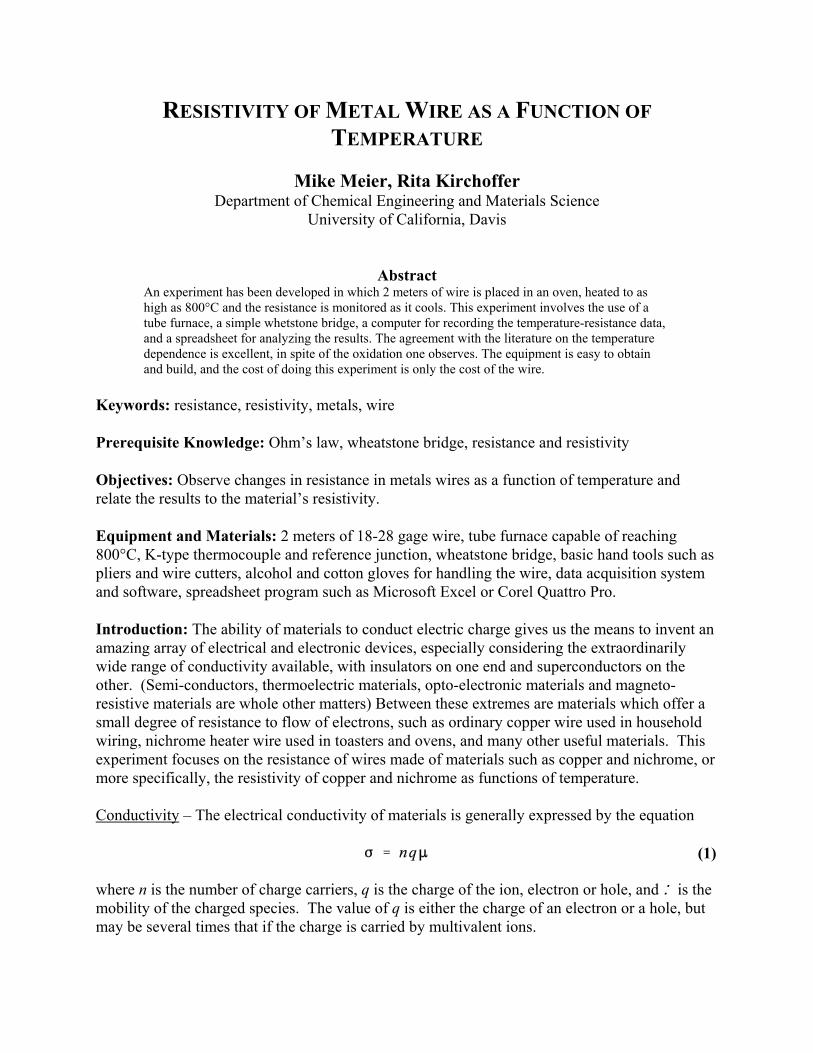
AbstractAn experiment has been developed in which 2 meters of wire is placed in an oven, heated to ashigh as 800°C and the resistance is monitored as it cools. This experiment involves the use of atube furnace, a simple whetstone bridge, a computer for recording the temperature-resistance data,and a spreadsheet for analyzing the results. The agreement with the literature on the temperaturedependence is excellent, in spite of the oxidation one observes. The equipment is easy to obtainand build, and the cost of doing this experiment is only the cost of the wire.
Keywords: resistance, resistivity, metals, wire
Prerequisite Knowledge: Ohm’s law, wheatstone bridge, resistance and resistivity
Objectives: Observe changes in resistance in metals wires as a function of temperature andrelate the results to the material’s resistivity.
Equipment and Materials: 2 meters of 18-28 gage wire, tube furnace capable of reaching800°C, K-type thermocouple and reference junction, wheatstone bridge, basic hand tools such aspliers and wire cutters, alcohol and cotton gloves for handling the wire, data acquisition systemand software, spreadsheet program such as Microsoft Excel or Corel Quattro Pro.
Introduction: The ability of materials to conduct electric charge gives us the means to invent anamazing array of electrical and electronic devices, especially considering the extraordinarilywide range of conductivity available, with insulators on one end and superconductors on theother. (Semi-conductors, thermoelectric materials, opto-electronic materials and magneto-resistive materials are whole other matters) Between these extremes are materials which offer asmall degree of resistance to flow of electrons, such as ordinary copper wire used in householdwiring, nichrome heater wire used in toasters and ovens, and many other useful materials. Thisexperiment focuses on the resistance of wires made of materials such as copper and nichrome, ormore specifically, the resistivity of copper and nichrome as functions of temperature.
Conductivity – The electrical conductivity of materials is generally expressed by the equation
where n is the number of charge carriers, q is the charge of the ion, electron or hole, and : is themobility of the charged species. The value of q is either the charge of an electron or a hole, butmay be several times that if the charge is carried by multivalent ions.
(2)
(3)
Resistivity – The resistivity of materials is simply the inverse of the conductivity
and the temperature dependence of resistivity is often represented by the empirical relationship
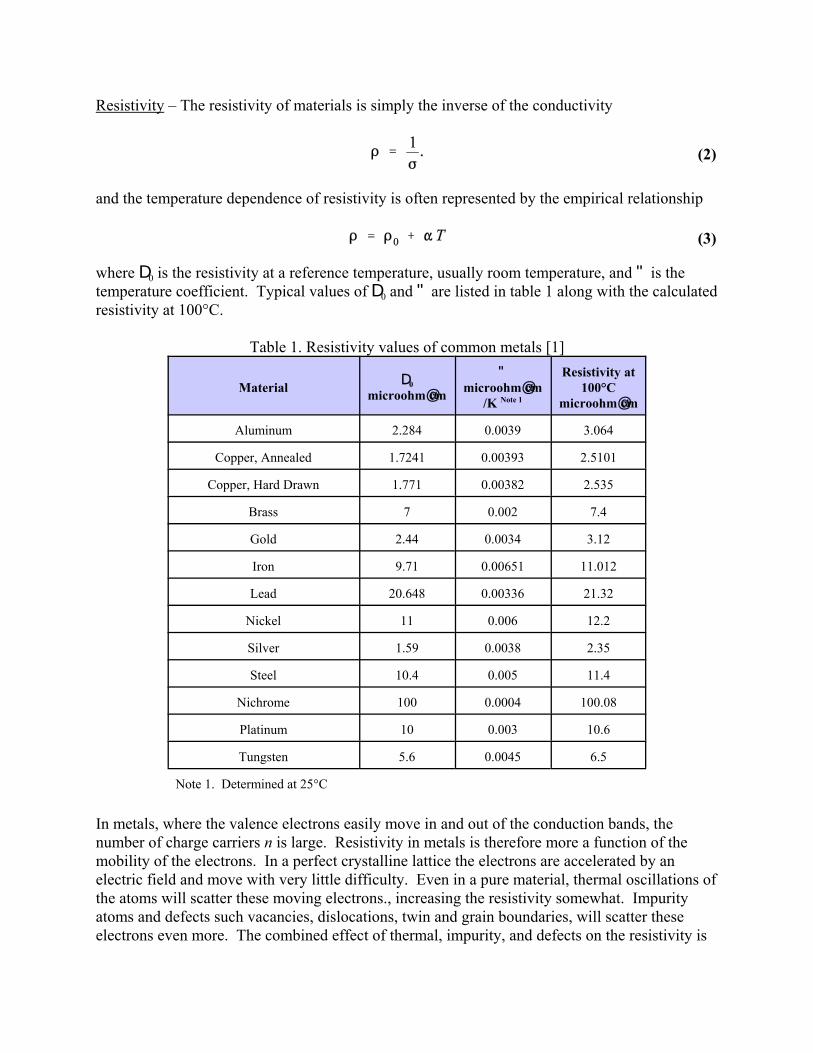
where D0 is the resistivity at a reference temperature, usually room temperature, and " is thetemperature coefficient. Typical values of D0 and " are listed in table 1 along with the calculatedresistivity at 100°C.
Table 1. Resistivity values of common metals [1]
Material D0microohm@cm
"microohm@cm
/K Note 1
Resistivity at100°C
microohm@cm
Aluminum 2.284 0.0039 3.064
Copper, Annealed 1.7241 0.00393 2.5101
Copper, Hard Drawn 1.771 0.00382 2.535
Brass 7 0.002 7.4
Gold 2.44 0.0034 3.12
Iron 9.71 0.00651 11.012
Lead 20.648 0.00336 21.32
Nickel 11 0.006 12.2
Silver 1.59 0.0038 2.35
Steel 10.4 0.005 11.4
Nichrome 100 0.0004 100.08
Platinum 10 0.003 10.6
Tungsten 5.6 0.0045 6.5
Note 1. Determined at 25°C
In metals, where the valence electrons easily move in and out of the conduction bands, thenumber of charge carriers n is large. Resistivity in metals is therefore more a function of themobility of the electrons. In a perfect crystalline lattice the electrons are accelerated by anelectric field and move with very little difficulty. Even in a pure material, thermal oscillations ofthe atoms will scatter these moving electrons., increasing the resistivity somewhat. Impurityatoms and defects such vacancies, dislocations, twin and grain boundaries, will scatter theseelectrons even more. The combined effect of thermal, impurity, and defects on the resistivity is
(5)
given by Mathesson’s rule where
For pure elements the contribution of defects is on the order of 0.1 percent of the total but forheavily cold worked metals it can be as high as 5 percent.
Resistance – Resistance is an extrinsic property of a device which is represented by the equation
where A is the cross-sectional area and l its length. Practical devices are manufactured using anumber of techniques and geometries, including:
• Winding a metal wire on a cylindrical ceramic core. These resistors generally have ahigh power ratings.
• Coating a cylindrical ceramic core with a material that has the desired resistivity. Controlling the film thickness and length (the film may be applied in a helical pattern) iscritical.
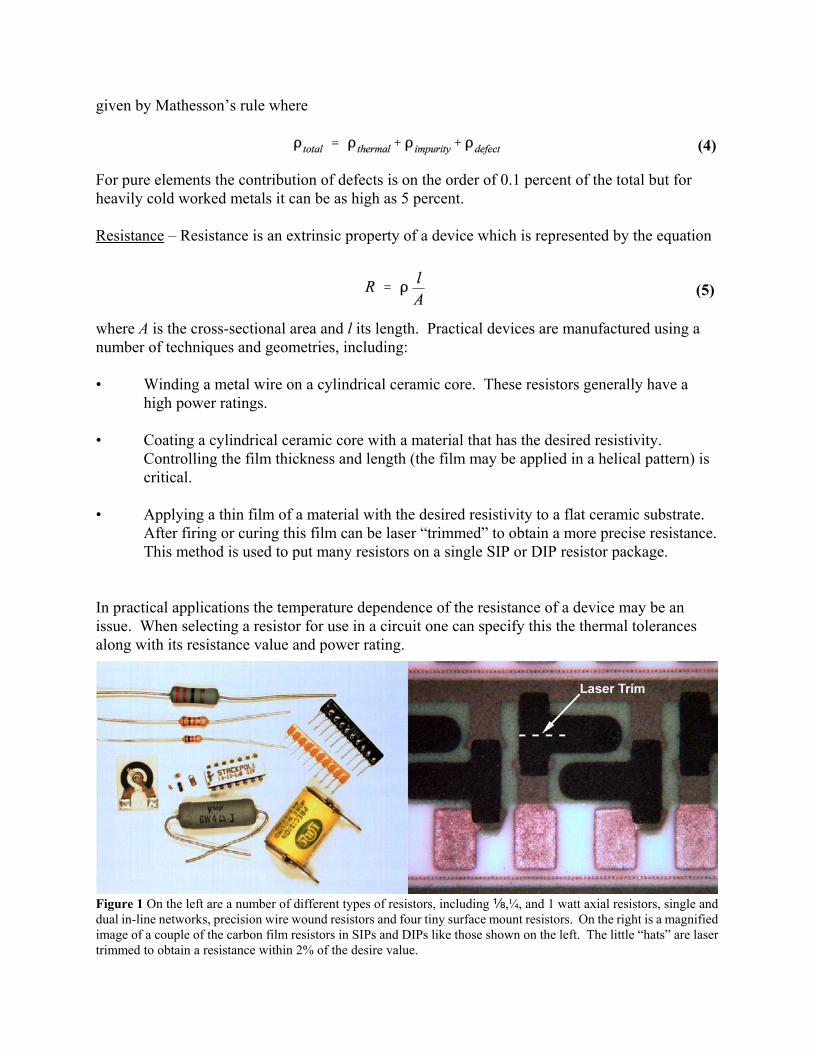
• Applying a thin film of a material with the desired resistivity to a flat ceramic substrate. After firing or curing this film can be laser “trimmed” to obtain a more precise resistance. This method is used to put many resistors on a single SIP or DIP resistor package.
In practical applications the temperature dependence of the resistance of a device may be anissue. When selecting a resistor for use in a circuit one can specify this the thermal tolerancesalong with its resistance value and power rating.
(4)
Figure 1 On the left are a number of different types of resistors, including c,¼, and 1 watt axial resistors, single anddual in-line networks, precision wire wound resistors and four tiny surface mount resistors. On the right is a magnifiedimage of a couple of the carbon film resistors in SIPs and DIPs like those shown on the left. The little “hats” are lasertrimmed to obtain a resistance within 2% of the desire value.
Procedure: Students prepare to do the experiment by building a simple model/simulation usingspreadsheets or similar software tools. This involves calculating:
• Calculating the resistivity of all of the materials listed in table 1 from room temperatureto 1000°C and examining the range of values and the trends.
• Calculating the resistance of these materials when they are in the form of 2 meters of 24gage wire.
• Calculating the output voltages from Wheatstone bridge where R1=R2=1000 ohms, R3=1ohm, and the lead resistance is zero.
When this part of the experiment is done the students will know exactly what to expect whenthey do the experiment.
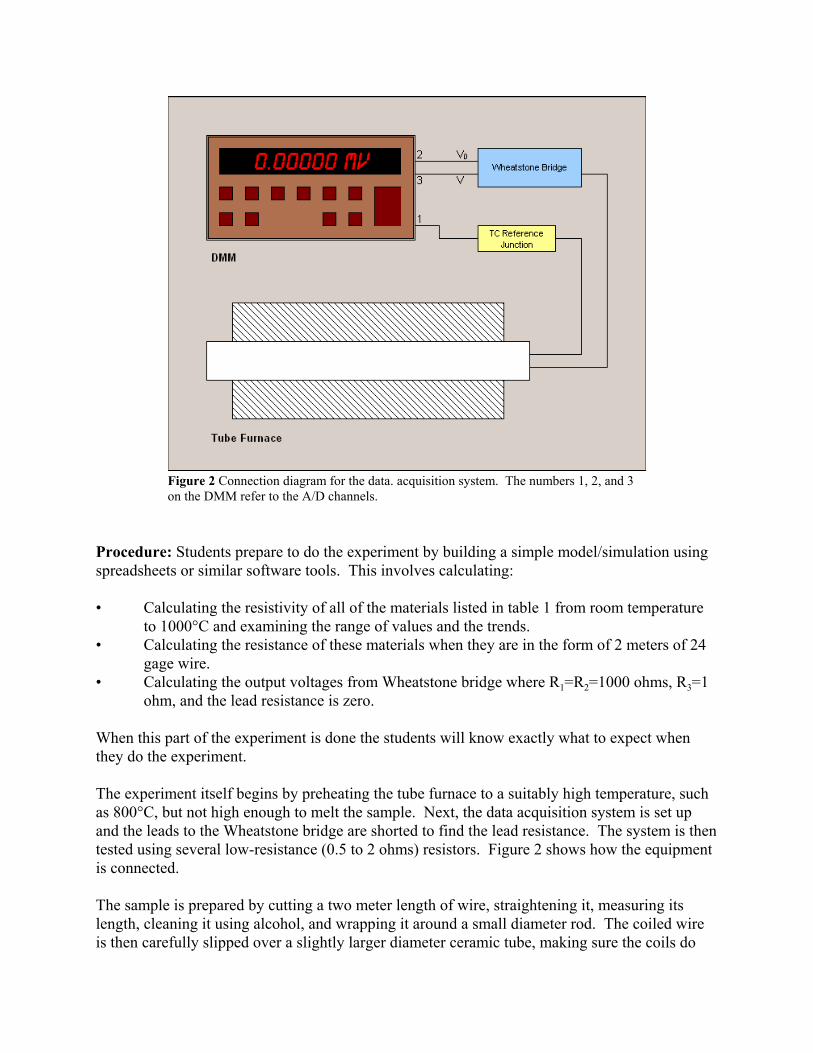
The experiment itself begins by preheating the tube furnace to a suitably high temperature, suchas 800°C, but not high enough to melt the sample. Next, the data acquisition system is set upand the leads to the Wheatstone bridge are shorted to find the lead resistance. The system is thentested using several low-resistance (0.5 to 2 ohms) resistors. Figure 2 shows how the equipmentis connected.
The sample is prepared by cutting a two meter length of wire, straightening it, measuring itslength, cleaning it using alcohol, and wrapping it around a small diameter rod. The coiled wireis then carefully slipped over a slightly larger diameter ceramic tube, making sure the coils do
Figure 2 Connection diagram for the data. acquisition system. The numbers 1, 2, and 3on the DMM refer to the A/D channels.
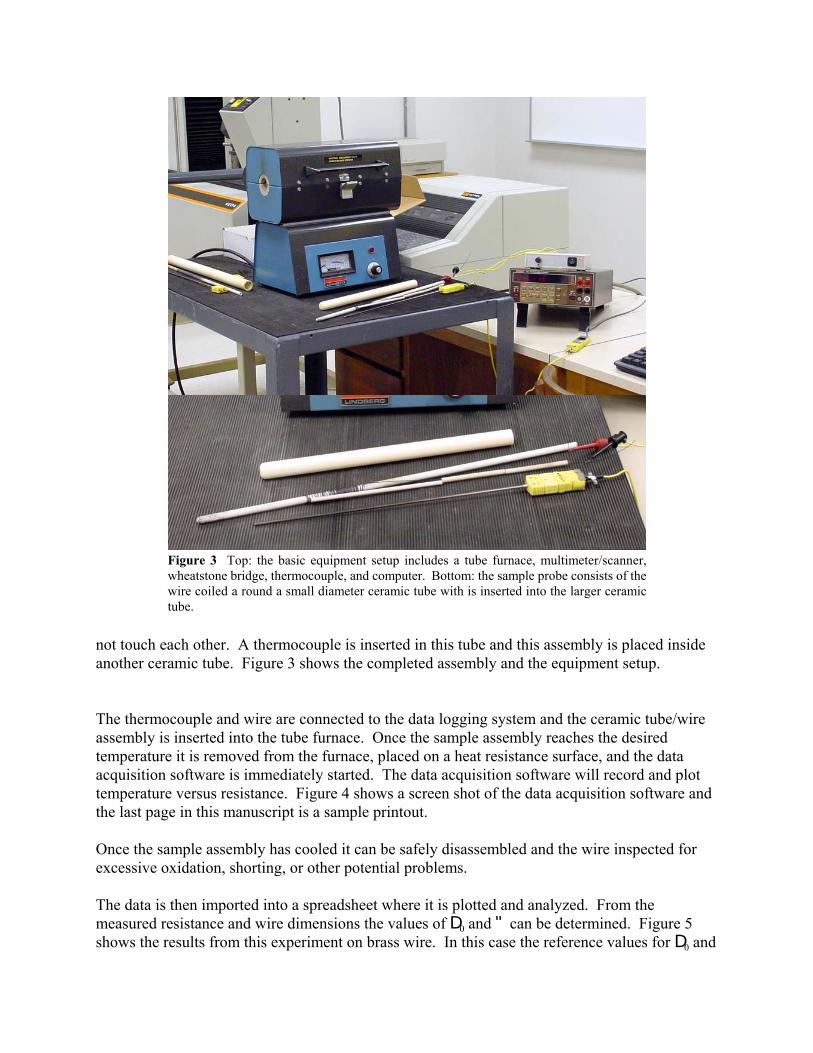
not touch each other. A thermocouple is inserted in this tube and this assembly is placed insideanother ceramic tube. Figure 3 shows the completed assembly and the equipment setup.
The thermocouple and wire are connected to the data logging system and the ceramic tube/wireassembly is inserted into the tube furnace. Once the sample assembly reaches the desiredtemperature it is removed from the furnace, placed on a heat resistance surface, and the dataacquisition software is immediately started. The data acquisition software will record and plottemperature versus resistance. Figure 4 shows a screen shot of the data acquisition software andthe last page in this manuscript is a sample printout.
Once the sample assembly has cooled it can be safely disassembled and the wire inspected forexcessive oxidation, shorting, or other potential problems.
The data is then imported into a spreadsheet where it is plotted and analyzed. From themeasured resistance and wire dimensions the values of D0 and " can be determined. Figure 5shows the results from this experiment on brass wire. In this case the reference values for D0 and
Figure 3 Top: the basic equipment setup includes a tube furnace, multimeter/scanner,wheatstone bridge, thermocouple, and computer. Bottom: the sample probe consists of thewire coiled a round a small diameter ceramic tube with is inserted into the larger ceramictube.

" are 1.72 :S@cm and 0.0039 :S@cm/K respectively. The measured values were 2.18 :S@cmand 0.0038 :S@cm/K. The slight differences could be easily explained in terms of leadresistance or lower temperature of the wire than the thermocouple. These results were betterthan what many students could get. In most cases the values of " was in excellent agreementwith the literature but the value of D0 was several ohms off.
Comments: The overall results teaching this experiment have been good. Students have commented on howwell the results agree with the values in the references, in spite of the errors due to thetemperature gradient, and simple setup used. They also said they were happy to finally get achange to work with the wheatstone bridge, and I think they learned more about how to designand carry out experiments that at first may have seemed difficult.
Students may (should) express some concern about the oxidation of the wire and how it mighthave effected the results. In general, it has not been much of a problem so far. Keeping the wireclean probably helps improve the results of the experiment, but it definitely improves thestudents’ confidence in the results.
The issue of temperature gradient, both along the length of the sample assembly and between thewire and the thermocouple, and has been dealt with as much as possible for this type(inexpensive) of experiment. In an earlier version of this experiment where we did not use theouter ceramic tube the difference in temperature between the thermocouple and the wire was
Figure 5. Typical results from an experiment conducted on a 2.5 meter length of 28 gage copper wire.

considerable. The result was a value of D0 that was obviously in error but the value of " wasvery close to that listed in the references. By using the outer ceramic tube the temperatureshould be much more uniform, even if the heating and cooling rates are much lower.
There are a few other practical aspects to consider when doing this experiment. Thetemperature-resistance data is recorded during cooling because the fields produced inside thetube furnace cause problems with the resistance measurements. Collecting the data duringcooling is also slower and so the temperature gradients will be even less of a problem. Also,having only one tube furnace for four computers and multimeters, the furnace is not as much of abottleneck to being able to test a number of samples during the laboratory session. Recordingthe data during cooling will also help minimize artifacts caused by recrystallization of the wire,which is usually heavily cold worked.
The process of selecting which wire to work with can make the experiment interesting. One caneasily find copper, brass, aluminum, and iron wire at the hardware store, and nichrome and othermaterials can be obtained from industrial and scientific supply vendors. Nichrome has excellentoxidation resistance and a high overall resistivity, but a very low value of ". Copper has lowoverall resistivity, so low it may be difficult to measure, but its thermal coefficient is aboutaverage. Aluminum has about 50% higher resistivity than copper but it also has a relatively lowmelting point compared to the other materials. Brass wire, which has a noticeably higher valueof D0 and a fairly typical value of ", has worked very well in our experiments.
The cost of setting up and running this experiment were modest. We’re using the samecomputers and digital multimeter/scanner we use in the phase diagram experiments, and thesoftware was based on the software used in that experiment. The thermocouple and referencejunction were also laying around the laboratory. The only new parts were the ceramic tubes andthe wheatstone bridge. The wheatstone bridge contains about $25 in parts plus the circuit boardwhich was designed on my computer using ExpressPCB’s free software and then manufacturedby ExpressPCB for a cost of about $25 per board. The cost of the wire, which was purchased atthe local hardware store, is negligible.
References:1. CRC Handbook of Chemistry and Physics, 65th edition, CRC Press, Inc, Boca Raton, FL, pp.
F-114 - F-120, (1984-85).
Biography:Michael L. Meier received his B.S. in Materials Engineering from North Carolina StateUniversity in 1979 and his M.S. (1986) and Ph.D. (1991) in Materials Science and Engineeringfrom the University of California, Davis. After a two-year post-doctorate position at theUniversität Erlangen-Nürnberg in Erlangen, Germany he returned to UC Davis where he is nowthe director of Materials Science Central Facilities and is also developing the laboratory teachingprogram.
Rita Kirchhofer is an undergraduate student at the University of California, Davis seeking

degrees in Mechanical Engineering and Materials Science and Engineering. She has participatedin the Materials Science Internship Program set up by Michael Meier at her institution for twoyears. This is her second collaboration for the N.E.W. Conference.
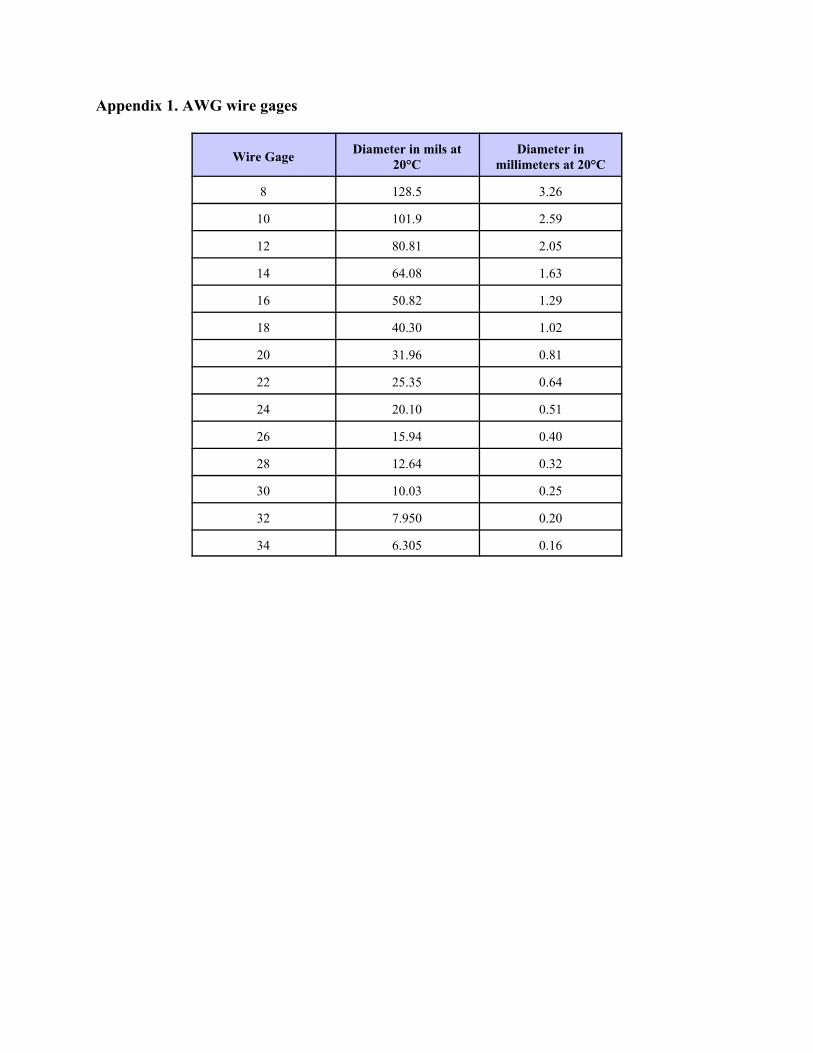
Appendix 1. AWG wire gages
Wire Gage Diameter in mils at20°C
Diameter inmillimeters at 20°C
8 128.5 3.26
10 101.9 2.59
12 80.81 2.05
14 64.08 1.63
16 50.82 1.29
18 40.30 1.02
20 31.96 0.81
22 25.35 0.64
24 20.10 0.51
26 15.94 0.40
28 12.64 0.32
30 10.03 0.25
32 7.950 0.20
34 6.305 0.16
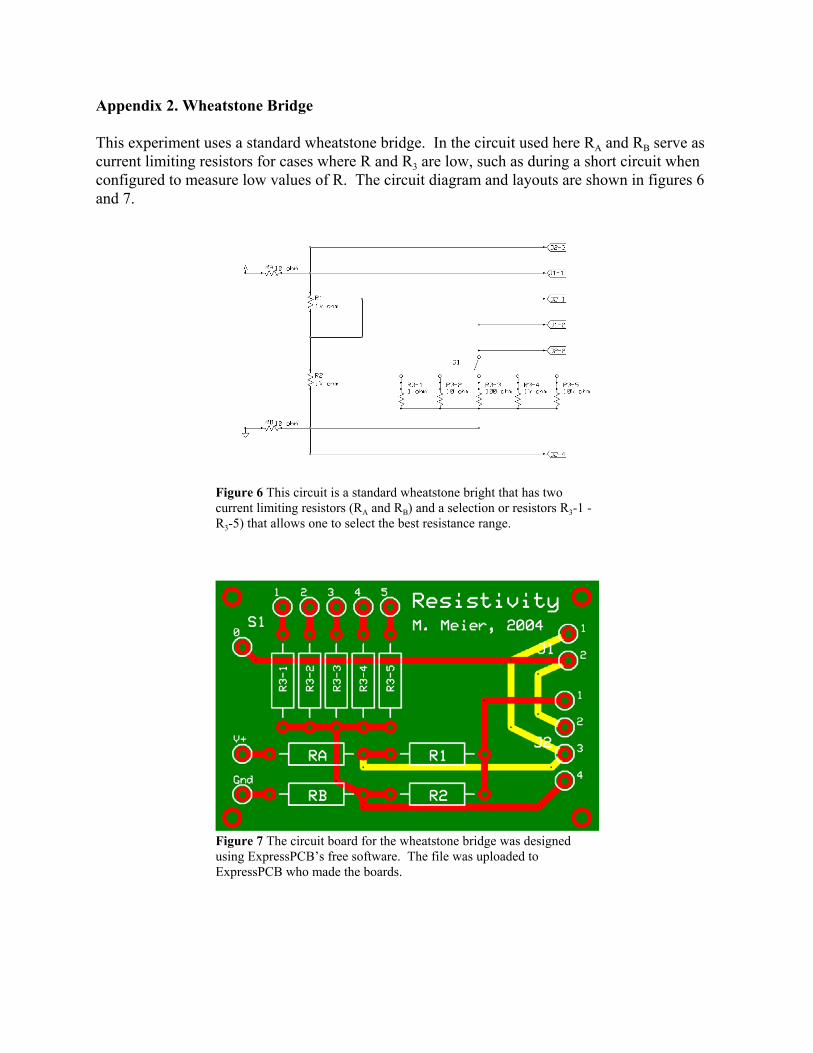
Appendix 2. Wheatstone Bridge
This experiment uses a standard wheatstone bridge. In the circuit used here RA and RB serve as current limiting resistors for cases where R and R3 are low, such as during a short circuit whenconfigured to measure low values of R. The circuit diagram and layouts are shown in figures 6and 7.
Figure 6 This circuit is a standard wheatstone bright that has twocurrent limiting resistors (RA and RB) and a selection or resistors R3-1 -R3-5) that allows one to select the best resistance range.
Figure 7 The circuit board for the wheatstone bridge was designedusing ExpressPCB’s free software. The file was uploaded toExpressPCB who made the boards.
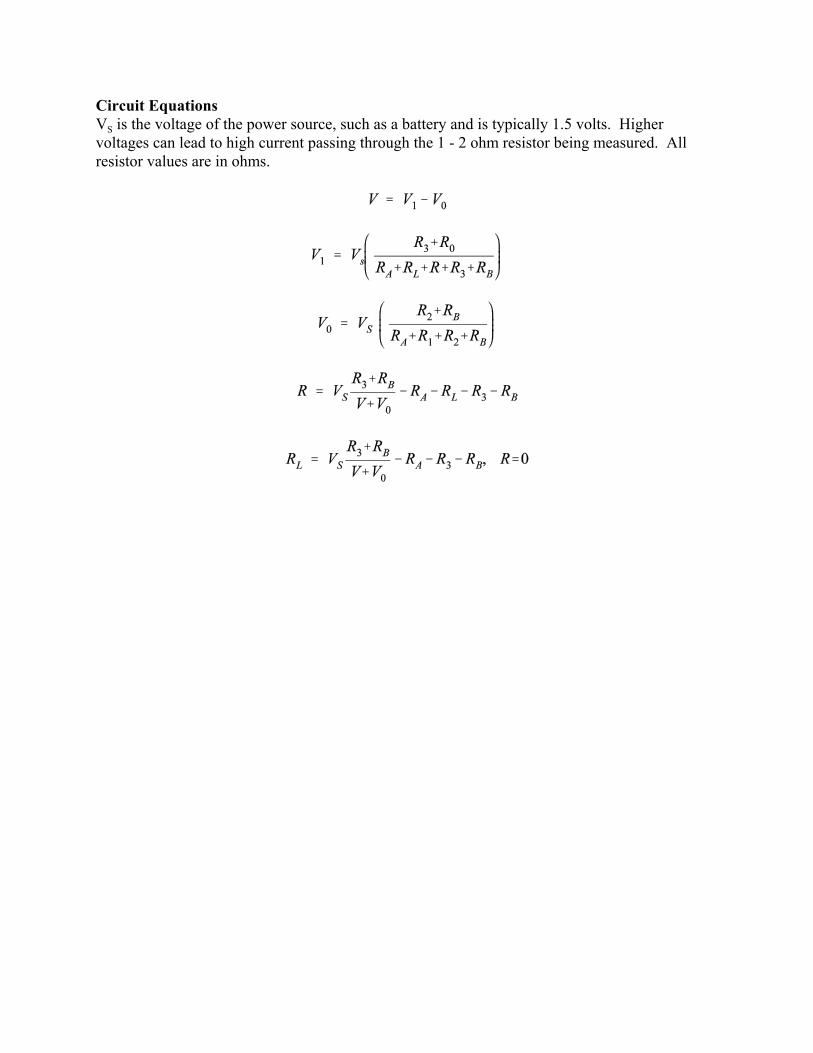
Circuit EquationsVS is the voltage of the power source, such as a battery and is typically 1.5 volts. Highervoltages can lead to high current passing through the 1 - 2 ohm resistor being measured. Allresistor values are in ohms.
Appendix 3. Safety Considerations
Chemical Hazards The methanol used to clean the wire poses fire and health hazards. Handle this solvent carefully. Use only small quantities, clean upany spills immediately, and keep it and its fumes away from thehot furnaces. An MSDS for methanol can be provided on request.
Physical Hazards Burns – The temperatures used in this experiment can causeserious burns and even fires if flammable materials come incontact with the hot parts. Be extremely careful when workingwith the furnaces and the hot specimens, be careful and deliberatewhen removing and handling the hot specimens, and remember,parts do not have to be glowing to be very hot.
Electrical – There is a minor electrical hazard in this experiment,similar to that one ... with when dealing with any small electricalappliance.
Fire – The combination of high temperatures, electrical appliances,and flammable methanol presents a definite fire hazard. Keep themethanol away from the furnaces, clean up any spills immediatelyand work with on small quantities of this flammable solvent.
Biohazards None.
Radiation Hazards None.
Protective Equipment Recommended: safety glassesRequired: heat-resistant gloves, as needed

Resistivity 1.0Resistance-Temperature Recording for the Keithley 199 DMM/ScannerVersion: 1.0 alpha, October 24, 2002
ProjectName: Resistivity 1.0Description: Resistance-Temperature Recording for the Keithley 199 DMM/ScannerOwner: K Street Technology CenterData File: Resistivity10.csv
Sensor ParametersThermocouple Type: K Resistance VS: 1.50 voltsResistance RA: 10.00 ohms Resistance RB: 10.00 ohmsResistance R1: 1000.00 ohms Resistance R2: 1000.00 ohmsResistance R3: 1.00 ohms Resistance RL: 0.00 ohms
DMM/Scanner ParametersDMM Status String: n/aFunction: DC Volts Channel 1: TemperatureRange: 300 mV Channel 2: V0Resolution: 4½ digits Channel 3: Resistance
Sampling ParametersPeriod: 1 secondChannels Scanned: 1 through 3Start Time: 09/02/04, 22:47:41End Time: 09/02/04, 22:48:26Duration: 0:00:45 (45.4 s)Samples: 47
Comments
Printed on Thursday, September, 2, 2004, 10:49:00 pm
0 80 160 240 320 400 480 560 640 720 800Temperature, °C
NEW Update 2004Resistance-Temperature Recording for the Keithley 199 DMM/Scanner
Sample Data
0.00
0.60
1.20
1.80
2.40
3.00
Res
ista
nce,
ohm
s