the rhessi spectrometer
TRANSCRIPT

The RHESSI Spectrometer
David M. Smith, R. P. Lin, P. Turin, D. W. Curtis, J. H. Primbsch,R. D. Campbell, R. Abiad, P. SchroederSpace Sciences Laboratory, University of California, Berkeley
C. Cork, E. Hull, D. Landis, N. W. Madden, D. Malone, R. PehlLawrence Berkeley National Laboratory
T. Raudorf, P. SangsingkeowORTEC
R. Boyle, I. S. Banks, K. ShireyNASA Goddard Space Flight Center
Richard SchwartzNASA Goddard Space Flight Center/Raytheon STX
Abstract.
RHESSI observes solar photons over three orders of magnitude in energy (3 keVto 17 MeV) with a single instrument: a set of nine cryogenically cooled coaxialgermanium detectors. With their extremely high energy resolution, RHESSI canresolve the line shape of every known solar gamma-ray line except the neutroncapture line at 2.223 MeV. High resolution also allows clean separation of thermaland non-thermal hard x-rays and the accurate measurement of even extremely steeppower-law spectra. Detector segmentation, fast signal processing, and two sets ofmovable attenuators allow RHESSI to make high-quality spectra and images offlares across seven orders of magnitude in intensity. Here we describe the configu-ration and operation of the RHESSI spectrometer, show early results on in-flightperformance, and discuss the principles of spectroscopic data analysis used by theRHESSI software.
Keywords: x-rays, gamma-rays, spectroscopy, germanium, RHESSI, solar flares
1. Introduction
The Reuven Ramaty High Energy Solar Spectroscopic Imager (RHESSI)was designed to study high-energy emission from flares over a broadenergy range, from thermal x-rays through nuclear gamma-ray lines(Lin et al., 2002). The design of its spectrometer was driven by theneed to satisfy many requirements with a single instrument of modestcost and weight. The spectrometer had to be able to process tens-to-hundreds of thousands of hard x-rays per second for imaging, whilecarefully collecting rare gamma-ray line photons with high efficiency,high energy resolution, and without interference from the x-rays. It wasdesirable for the energy range to extend down to 3 or 4 keV to clearly
c© 2002 Kluwer Academic Publishers. Printed in the Netherlands.
draft4.tex; 20/08/2002; 15:32; p.1

2 David M. Smith
image the thermal components of flares and to be highly sensitive tomicroflares, while extending well above the 4.4 and 6.1 MeV gamma-ray lines to characterize the electron bremsstrahlung spectrum abovethe nuclear line region. We wanted to be sensitive to events coveringat least seven orders of magnitude in intensity, from microflares to thelargest X-class events.Most importantly, RHESSI had to have extremely high energy res-
olution in order to make advances in spectroscopy comparable to theadvances its high-angular-resolution Rotating Modulation Collimator(RMC) system would make in imaging (Hurford et al., 2002). The SolarMaximum Mission Gamma-Ray Spectrometer (SMM/GRS), with itslarge collecting area and its long and successful mission operations,produced a wealth of data on gamma-ray lines from large flares (Ves-trand et al., 1999) and a significant contribution was also made by theinstruments on the Compton Gamma-Ray Observatory (Share, Mur-phy and Ryan, 1997) and the Gamma-Ray Spectrometer on Yohkoh(Yoshimori et al., 1994). But all these instruments were scintillatorswith energy resolution ≥ 6% full width at half maximum (FWHM) atgamma-ray line energies. In some cases (particularly around 1 MeV)this low resolution can result in the blending of several lines, and, moreimportantly, it leaves the issue of Doppler shifts and broadening ofthe nuclear deexcitation lines mostly unaddressed. Energy resolutionan order of magnitude finer would allow these Doppler phenomenato be observed unambiguously, revealing information about the angu-lar distribution of accelerated ions in large flares. In the hard x-rayband, high resolution (about 1 keV FWHM from 3-100 keV) wouldallow a clean separation between thermal and nonthermal emissionnever before achieved except on balloon payloads flying germaniumspectrometers (Lin and Schwartz, 1987).RHESSI has many new, unique features compared to other gamma-
ray spectrometers flown in space, even beyond the obvious advance ofusing a large array of germanium detectors. These include an efficient,lightweight, and inexpensive mechanical cooler; movable attenuatorsthat respond to the intensity of a flare, so that the detectors can recordmicroflares without saturating even in the biggest flares; and extremelylow-noise electronics and segmented detectors to cover from 3 keV to17 MeV with a single crystal. These and other advances allow RHESSIto meet its goals of resolution, sensitivity, and dynamic range withinthe cost and weight constraints of a Small Explorer mission.The sections below will address the composition and operation of
the RHESSI spectrometer, the spectrometer data formats, in-flightperformance, and the principles of the spectroscopic data analysis.
draft4.tex; 20/08/2002; 15:32; p.2
The RHESSI Spectrometer 3
2. Components of the RHESSI Spectrometer
2.1. Germanium detectors
RHESSI’s spectrometer is an array of segmented coaxial germaniumdetectors. When ultrapure germanium is at cryogenic temperatures,no electron-hole pairs are in the conduction band, but a hard x-rayor gamma ray interacting in the crystal will release one or more ener-getic electrons, which lose energy by creating free pairs. If there is ahigh electric field (on the order of 1000 V/cm) across the crystal, theelectrons and holes will be pulled to each electrode, creating a currentpulse that can be amplified and digitized by suitable electronics. Thetotal charge in the current pulse is proportional to the photon energy.
����
��������
������������������������������������
����
����
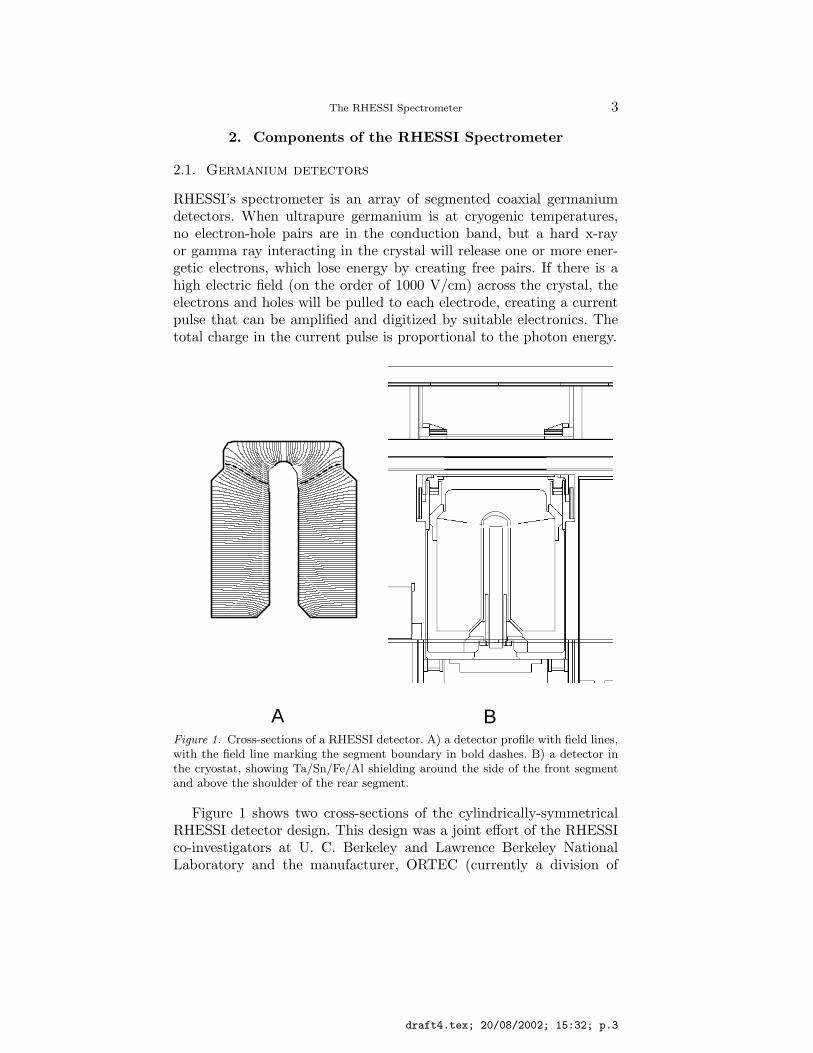
A BFigure 1. Cross-sections of a RHESSI detector. A) a detector profile with field lines,with the field line marking the segment boundary in bold dashes. B) a detector inthe cryostat, showing Ta/Sn/Fe/Al shielding around the side of the front segmentand above the shoulder of the rear segment.
Figure 1 shows two cross-sections of the cylindrically-symmetricalRHESSI detector design. This design was a joint effort of the RHESSIco-investigators at U. C. Berkeley and Lawrence Berkeley NationalLaboratory and the manufacturer, ORTEC (currently a division of
draft4.tex; 20/08/2002; 15:32; p.3

4 David M. Smith
AMETEK). The shape is a variation of a “closed-end coaxial” detector,the industry standard design for large volumes and high gamma-raysensitivity. The ultrapure, slightly n-type germanium material is dopedin a very thin outer layer with boron on the front and side surfaces,and a thicker, n-type layer of diffused lithium ions on the inner bore.The rear surface is left as an insulator. When 2000–4000 V is appliedbetween the inner and outer electrodes, the crystal is depleted of chargecarriers, with enough electric field in the crystal from the space chargeand external voltage combined to cause the electron-hole pairs to reachterminal velocity.For space applications, it is important to fly n-type material with
this electrode configuration in order to minimize the effect of radiationdamage on resolution. Since radiation damage produces primarily holetraps rather than electron traps, the goal is to minimize the lengthof germanium traversed by the holes. For a coaxial detector, most ofthe volume is near the outer radius. Thus most interactions take placenear the outside and the holes should therefore travel to the outsideelectrode. The effects of radiation damage can also be minimized bykeeping the detectors very cold (72–76 K in the case of RHESSI) andmaking sure the detector high voltage is never turned off once there hasbeen significant exposure to protons and neutrons (Hull, 1998; Koenenet al., 1995).The inner (lithium) contact is broken at a point near the top, and
signals are extracted separately from the two halves of this electrode.The line extending from this point to the outside edge of the detectorin Figure 1A represents a boundary electric field line: photons stoppingabove this line are detected in the front channel, and those stoppingbelow it in the rear channel. Thus a single crystal becomes a stackedpair of detectors. The front segment will absorb all the hard x-rays upto about 100 keV, letting most gamma-ray line photons through. Therear segment will stop many of the latter, so that fine spectroscopy canbe done without high deadtime from the x-rays.The notch on the outer edge of the detector serves two purposes:
first, it concentrates the electric field lines at the corner of the notch,so that the field line that originates at the break in the inner contactalways hits the proper place on the outside of the detector. In addition,it removes some mass from in front of the rear segment, so that fewerhigh-energy gamma rays Compton scatter before entering the rear. Aring of “graded-Z” material keeps the shoulder of the rear segment frombeing swamped with flare hard x-rays (see below). This shield is justas effective as the front segment in photoelectrically absorbing hardx-rays, but with much less Compton scattering of gamma-rays.
draft4.tex; 20/08/2002; 15:32; p.4

The RHESSI Spectrometer 5
Figure 2. Result of a narrow-beam 81 keV x-ray scan of the side of a RHESSIdetector showing the ripple in the segmentation boundary (see text). The front ofthe detector is to the left. The scan does not proceed all the way down the rearsegment. Lighter colors represent a higher count rate in the 81 keV line.
Figure 2 shows a side view of the detector segmentation producedby scanning a 3 mm beam of 81 keV x-rays across the detector andcounting the front and rear segment counts at each position (pixel).Note that the segmentation boundary is not independent of azimuthangle, but rather has a wavy appearance, with four peaks and fourvalleys around the periphery of the detector. This is a natural result ofthe cubic crystal structure of germanium: electron mobility is highestalong the three main crystal axes and lower between them. Thus elec-trons traveling to the central bore from different spots on the crystalsurface at terminal velocity will not travel directly along field lines butinstead their paths will bend toward the nearest axis. This distorts thesegmentation boundary position as a function of azimuth with respectto the x and y crystal axes (the crystals are always grown so that oneaxis is parallel to the z axis of the cylinder).
draft4.tex; 20/08/2002; 15:32; p.5

6 David M. Smith
Figure 3. The RHESSI spectrometer, before being mounted on the spacecraft. Thealuminum attenuator disks are visible on top (one set in the aperture, the otherout), and the preamplifiers and high-voltage filter boxes can be seen around theskirt. The detectors are behind the thin, ribbed side wall.
2.2. Detector Electronics
The preamplifiers for the RHESSI detectors feature four-terminal field-effect transistors (FETs) with adjustable back-gate voltage for very-low-noise operation, one for each segment. These are immediately be-hind the detectors, and are thermally connected by wires to the outerthermal shield (see below) to achieve an ideal operating temperaturebetween 130 and 170 K. Their signals are taken out to the rest of thepreamplifier circuit, which resides in an individual box for each detec-tor, clustered around the bottom of the spectrometer (see Figure 3),by a harness consisting of thin traces of manganin (for low thermalconductivity) layered in a flexible plastic film.The preamplifiers use a pulsed reset circuit developed at Lawrence
Berkeley National Laboratory (Landis, Madden and Goulding, 1998).The capacitors in the FETs are drained by this circuit when a totalcharge equivalent to interactions from 40 MeV worth of photons orcosmic rays has been deposited in each segment. Leakage current inthe detectors is so low (a few picoamps) that cosmic rays and back-
draft4.tex; 20/08/2002; 15:32; p.6

The RHESSI Spectrometer 7
4 6
5
3
a
9
28
1
7
Figure 4. Exterior of the spectrometer shown with part of the outer housing cutaway, revealing the detector modules inside. The numbering scheme of the detectorsmatches the grids.
ground photons dominate the total current through the detectors. Eachreset event results in approximately 40 µs of deadtime in the resettingsegment, but as this seldom happens at a rate of more than 100 Hz itrepresents a small contribution to the overall system deadtime. Leakagecurrent is kept low by avoiding the introduction of any contaminationon the back (insulating) surface of the crystals in two ways: 1) care-ful design of the cryostat (see below) and 2) a proprietary ORTECpassivation process used on the rear germanium surface.The signals from the preamplifier are taken to a Detector Inter-
face Board (DIB) in the primary Instrument Data Processing Unit(IDPU) (Curtis et al., 2002) box on the spacecraft deck. Each boardcontains both the analog and digital signal-processing circuitry for bothsegments of one detector. The signal from each event is split, goingto a fast-shaping channel (which produces a triangular pulse 800 nswide at the base) and a slow-shaping channel (8 µs peaking time) forspectroscopy.
draft4.tex; 20/08/2002; 15:32; p.7
8 David M. Smith
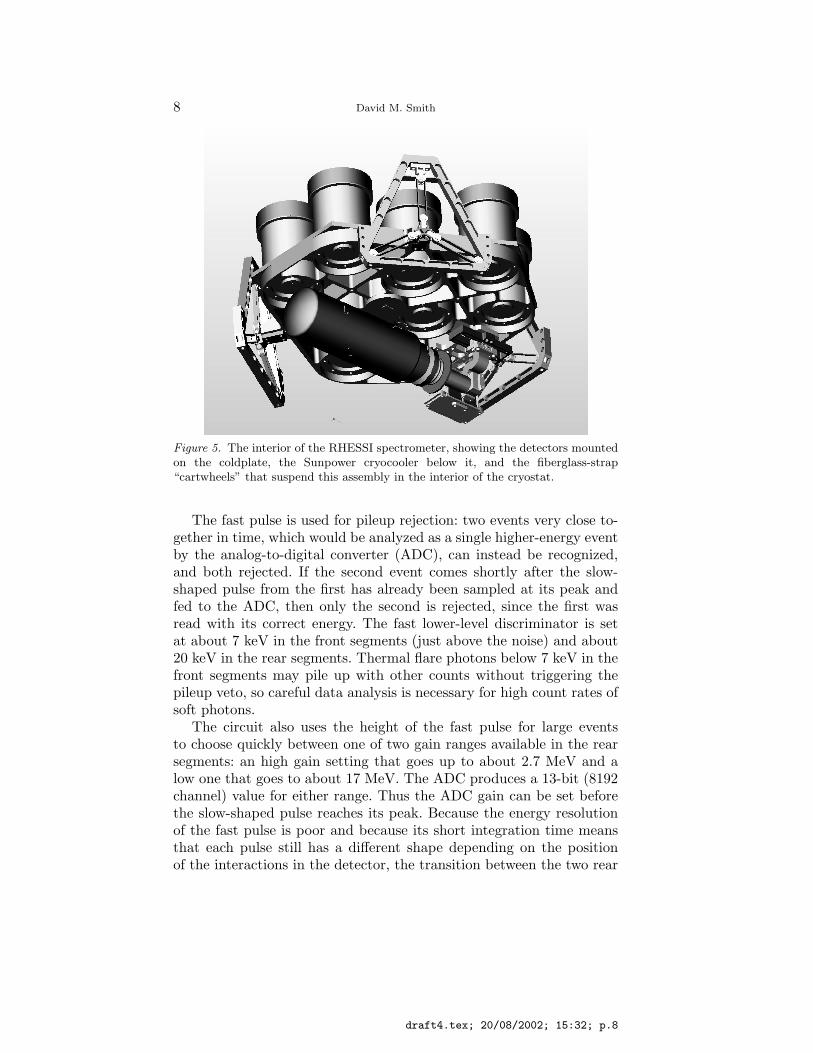
Figure 5. The interior of the RHESSI spectrometer, showing the detectors mountedon the coldplate, the Sunpower cryocooler below it, and the fiberglass-strap“cartwheels” that suspend this assembly in the interior of the cryostat.
The fast pulse is used for pileup rejection: two events very close to-gether in time, which would be analyzed as a single higher-energy eventby the analog-to-digital converter (ADC), can instead be recognized,and both rejected. If the second event comes shortly after the slow-shaped pulse from the first has already been sampled at its peak andfed to the ADC, then only the second is rejected, since the first wasread with its correct energy. The fast lower-level discriminator is setat about 7 keV in the front segments (just above the noise) and about20 keV in the rear segments. Thermal flare photons below 7 keV in thefront segments may pile up with other counts without triggering thepileup veto, so careful data analysis is necessary for high count rates ofsoft photons.The circuit also uses the height of the fast pulse for large events
to choose quickly between one of two gain ranges available in the rearsegments: an high gain setting that goes up to about 2.7 MeV and alow one that goes to about 17 MeV. The ADC produces a 13-bit (8192channel) value for either range. Thus the ADC gain can be set beforethe slow-shaped pulse reaches its peak. Because the energy resolutionof the fast pulse is poor and because its short integration time meansthat each pulse still has a different shape depending on the positionof the interactions in the detector, the transition between the two rear
draft4.tex; 20/08/2002; 15:32; p.8

The RHESSI Spectrometer 9
gain ranges is gradual rather than abrupt, i.e. events from about 2.6 to3.2 MeV may appear with either gain. Since the gain range that wasused is recorded as part of the event, there is no loss of information.The front segments use only the first (high) gain value.The bottoms of the usable energy ranges in each segment are set by
both electronics and physics. The physical limits are absorption in thematerials around the detectors (see below). The electronic thresholds,set by the noise level in the slow-shaping channel, are about 2.7 keV formost of the front segments and 20 keV in the rears. Both the physicaland electronic cutoffs are somewhat gradual and have to be modeledprecisely for low-energy spectral analysis.The ADC-busy and pileup rejection signals are “or-ed” together and
sampled at 1 MHz by a livetime counter. Because the pileup circuit hasthe ability to sometimes veto both piled-up events, no simple circuit cansample the true system livetime. There is, however, a simple mappingbetween the recorded and true livetimes as long as all events are abovethe fast discriminator threshold. When a large fraction of the countsare below this energy, deriving the true livetime is more complicated,but can still be done based on pre-flight and in-flight calibrations.
2.3. The RHESSI Cryostat
The RHESSI cryostat was designed to provide a lightweight but secureenvironment for the detectors. This involves maintaining a hard vacuumand very good thermal insulation, so that the detectors can remainat operating temperature (about 75 K) with a very low heat leak.Figures 3, 4, and 5 depict the interior and exterior of the cryostatand the arrangement of the detectors.The weight constraints of a Small Explorer did not allow a heavy
active shield to veto solar photons that scatter out of the detectorsand to keep out background photons. We therefore decided instead todesign the side walls of the cryostat to be as thin as possible; there isabout 4 mm of Al between the rear detector side surfaces and space.This allows hard x-rays (above about 25 keV) and gamma-rays fromcosmic sources such as supernova remnants, pulsars, and gamma-raybursters to enter the spectrometer, providing a wealth of secondaryscience (Smith et al., 2000; Smith et al., 2002). Since all these sourcesare orders of magnitude fainter than most solar flares, and also ap-pear primarily in the rear segments rather than the fronts, they don’tinterfere with solar observations.The detectors are securely housed in independent modules that are
not sealed but that have a very small, indirect leakage path to theoutside to minimize contamination during handling. The modules are
draft4.tex; 20/08/2002; 15:32; p.9

10 David M. Smith
firmly attached to a common coldplate, and the detector/coldplateassembly is suspended by three sets of fiberglass straps for thermalisolation (see Figure 5). The coldplate assembly is surrounded by twothin aluminum thermal shields at intermediate temperatures, each ofwhich is surrounded by multilayer aluminized-mylar insulation.The cryocooler is a Sunpower model M77 Stirling-cycle refrigerator,
a small, high-efficiency unit modified for long-term use in orbit by thecryogenics group at NASA’s Goddard Space Flight Center. The cooleris visible in Figure 5 as the horizontal cylindrical object below thecoldplate. It is equipped with an actively-driven balancer mass to cancelvibrations to first order. Its “gas bearing” system means that there is norubbing of solid parts during operation. With 55 W of input power, thecooler can provide the approximately 3.5 W of cooling needed to keepthe entire coldplate/detector assembly at 75 K. The cooler is coupledto the coldplate by a flexible, S-shaped link made from 700 sheetsof 0.025 mm aluminum foil for good heat conduction with minimumtransmission of vibration. Also in the thermal path between the cooler’scoldfinger and the coldplate is a rod of sapphire. This material hashigh thermal conductivity at low temperatures and vice-versa, and isimportant during cooldown and annealing (see below). As part of thethermal isolation, the outer thermal shield is actively cooled by itsown separate connection partway down the coldfinger of the cooler,which keeps it at about 155 K. Waste heat from the cooler is radiatedto space from the back surface of the spectrometer, which is also therearmost surface of the spacecraft. It is covered with silver teflon tape.It alternately views deep space and the Earth during each orbit.
2.4. The attenuators or shutters
Attached to the top of the spectrometer are two lightweight, movableframes, each of which carries nine aluminum disks that can be movedin front of the detectors (see Figure 3). These disks, manufactured toour design by Tecomet, Inc., serve as attenuators, to keep the detectorsfrom being saturated at high counting rates. One set of disks is thickerthan the other, but they are not uniform: each has a small, thin spot inthe center so that there is always some low-energy response. There isalso a slightly larger region that is thick on the otherwise thin disk andthin on the otherwise thick disk: thus, the full attenuation doesn’t occuruntil both disks are in place (see Figure 6). The attenuator dimensionsvary slightly from detector to detector based on the grid-slat spacing inorder to avoid introducing biases into the imaging when the attenuatorsare put in.
draft4.tex; 20/08/2002; 15:32; p.10

The RHESSI Spectrometer 11
Figure 6. Top: photographs of the attenuator disks. Left: thin disk. Right: thickdisk. Bottom: cross-section of the thin and thick disks. The vertical scale has beenexaggerated by a factor of four to make the features easier to see. The outer diametersare 61.5 mm to cover the detector front segments. Thicknesses vary from 0.05 mmto 1.53 mm.
The onboard computer monitors the front segment livetimes andputs the disks in (thin first) when deadtime gets too high. The statewith the thick shutter in and the thin shutter out is not currently usedin spacecraft operations. Because the system is particularly sensitiveto pileup at low energies (see above), and because low-energy thermalemission dominates the detected flare photons when both shutters areout, the thin shutter is set to come in when deadtime exceeds 8%.The deadtime will then drop sharply. If the flare brightens further, thethick shutter will come in when the deadtime reaches 10%. Early in themission the shutters were only brought in at higher deadtimes, until itwas realized that pileup was too severe in the resulting data. Becausebringing in each set of shutters reduces the deadtime so effectively, itis difficult for the onboard software to estimate when to pull them outagain. As long as the deadtime is very low, the flight software will trybriefly pulling out the last shutter it put in every 4 min until either 1)
draft4.tex; 20/08/2002; 15:32; p.11

12 David M. Smith
the deadtime is found to be low enough to leave it out or 2) it exceedsa set maximum number of shutter motions per spacecraft orbit.Each shutter frame is moved by long, thin shape-memory alloy
(SMA) wires that contract when a voltage is applied and current runsthrough them, producing heat. There are four sets of six wires each:one set for moving each frame in each direction. Each motion takesless than one second, including the delay for heating, and about 20 sis required for cooldown before the same set of wires can be activatedagain. In addition, each frame is connected to a heavy SMA spring foran emergency backup that can pull it strongly into its default position(thin in, thick out) and lock it there. These are only to be used in theunlikely event of a mechanical jam or other failure of the wire SMAsystem. A second set of SMA springs was used to uncage each frameafter launch.With neither attenuator in place, the front segments view the Sun
through four Be windows and four blankets of multilayer aluminized-mylar insulation (two inside the cryostat and one on each end of theimager tube). The blankets are thinned but not eliminated immediatelyabove each detector to improve the transmission of solar photons. Theattenuator system adds about four orders of magnitude to the dynamicrange of microflares and flares detectable by RHESSI. In order to saveonboard memory and downlink capacity, the thin shutter is often leftin place for one or more days at a time.
2.5. Other Spectrometer Subsystems
2.5.1. Charged particle detector
A solid-state silicon charged particle detector (CPD) is mounted on astrut that runs past the side of the spectrometer. The detector is adisk 1.0 mm thick and 5.64 mm in diameter, and is mounted so thatit faces outward, its normal axis perpendicular to the spacecraft axis.It is encased in shielding consisting of at least 3.8 mm of Al in alldirections except for an outward-facing pinhole of diameter 1.02 mm.This detector is not configured as a spectrometer, but count ratesare read out every 1/8 s above two energy thresholds: 50 keV and620 keV. The higher threshold is commandable and the lower fixed.The commandable threshold may be set to any energy from about20 keV (limited by noise) to 2 MeV.Cosmic rays penetrate the shielding easily and usually trigger both
thresholds. Thus the CPD can measure cosmic ray flux, although theupper level discriminator (ULD) counter in the germanium detectorsthemselves provides a more accurate measure due to their much largerarea. Electron precipitation events generally trigger the lower threshold
draft4.tex; 20/08/2002; 15:32; p.12

The RHESSI Spectrometer 13
only. During transit of the SAA, the upper threshold counts mostlytrapped protons and the lower mostly trapped electrons, although theupper threshold is partially contaminated by SAA electrons, whichare much more numerous, entering the pinhole. Because the detectorrotates with the spacecraft it samples the pitch-angle distribution of theparticles whenever the spacecraft axis is near perpendicular to the localmagnetic field. At these times, the SAA particles are seen to have anextreme pancake distribution (circling at 90o to the field) as expectedfor mirroring particles.
2.5.2. Beryllium scatterer
Since the rear segments see no direct flare photons below 100 keV,we can use them at these low energies as a hard x-ray polarimeter(McConnell et al., 2002). There is a cylinder of beryllium 3 cm indiameter and 3.5 cm long attached to the coldplate, nestled among therear segments near the center of the spectrometer. Above this cylinderis a thin spot in the spectrometer shell and a hole in the grid trays, sothat solar photons > 20 keV can reach the cylinder and scatter intothe adjacent rear segments. The Compton cross section, differential inazimuth angle, is a function of the angle from the polarization axis.Thus, by watching the relative counting rates in these rear segments,we will measure the direction and degree of polarization for incomingphotons of roughly 20–100 keV. Simulations (McConnell et al., 2002)suggest that we will be able to detect polarization fractions as low as afew percent for the largest flares. The key difficulty in the analysiswill be photons scattered from the Earth’s atmosphere, which alsoproduce low-energy counts in the rears and which also vary with thespacecraft spin, albeit with one peak per spin instead of two. Scatteringin the coldplate and other passive materials into the rear detectors doesnot modulate with the spacecraft spin, and so it only interferes withpolarization measurements by increasing the background count rate.
2.5.3. Graded-Z shielding
In the absence of a heavy active shield, there were several places werea small amount of passive shielding to block hard x-rays was consid-ered valuable. In each place, the material is a “graded-Z” laminate ofmetals: from outside to inside, 0.5 mm of tantalum, 1.0 mm of tin, and0.5 mm of stainless steel. The tantalum stops most incident photonsup to 100 keV. Each successive metal absorbs the K-shell fluorescencephotons of the one before it. The iron K-shell photons from the steelare absorbed in the aluminum structures backing the shielding, and thealuminum K-shell photons are both too low in energy to trigger the
draft4.tex; 20/08/2002; 15:32; p.13

14 David M. Smith
detectors and mostly stopped in the aluminum itself. The combinationis mostly opaque below 100 keV, and fairly transparent above.A ring of this material surrounds the side surface of the front seg-
ments to shield them from background photons from the Earth andspace, so that they can be sensitive to the faintest possible microflares.A washer-shaped ring sits above the shoulder of each of the rear seg-ments to protect them from direct solar photons. Both these rings arevisible in Figure 1B. Finally, a larger sheet of the material, with holesfor each detector and the Be scatterer, is attached to the top cryostatwall, below the attenuator assemblies. Its purpose is to minimize thenumber of solar hard x-rays which scatter in the coldplate and othercryostat materials and enter the rear segments at low energies. Thisserves two functions: to keep the counting rates in the rear segmentsfrom saturating during the very largest flares, and to reduce the back-ground against which polarization measurements will be made in therear segments at low energies.
2.5.4. Onboard Radioactive Source
RHESSI carries a tiny onboard radioactive source (5 nanocuries of137Cs) that makes a line at 662 keV, far from any line expected tooccur in flares or in RHESSI’s variable background. The count ratefrom this source is so small that it can only be detected in spectraaccumulated over many hours. Having a line of known intensity lets usmonitor any changes in the efficiency of the detectors such as mightoccur via radiation damage. The same function can be served by a lineat 1460 keV from naturally occurring 40K in the spacecraft, but theabsolute flux of this line is not known from before launch since therewas always some of the isotope in the laboratory.
2.5.5. Onboard Pulser
The IDPU can put regular, small pulses onto the detectors’ high voltage(HV) line. The electronics see this as equivalent to photon events. Thepulse energy can be tuned across the detectors’ full range, but thefront/rear ratio is fixed at roughly 1:3 because the HV is shared by bothsegments and their response is proportional to their capacitance. Pulserates can be commanded separately for each detector at 11 discretefrequencies, spaced by a factor of two, up to 1024 Hz.
2.6. Cryostat Thermal Operations
Cooldown of the spectrometer began within a few hours of launch andlasted about six days. Although the cryostat was kept on a vacuumpump until being sealed off shortly before launch, continued outgassing
draft4.tex; 20/08/2002; 15:32; p.14

The RHESSI Spectrometer 15
from the interior, particularly water from the mylar thermal blan-kets, remained a concern. The thermal impedance of the sapphire rodbetween the coldplate and the cryocooler was included to force thefirst stage of cooldown of the detectors to proceed extremely slowly.The secondary connection between the cryocooler and the intermedi-ate thermal shield has no such impedance, so the shield cools muchmore quickly. This allows all the water vapor and other volatiles inthe cryostat vacuum to freeze out onto the shield first instead of thedetectors. At about 200 K the cooling curves cross, so the detectorswere colder than the shield from then until they reached their operatingtemperature of around 75 K.Once the radiation damage that has built up in the detectors is
significantly affecting RHESSI’s energy resolution (which we predictwill occur 2-4 years after launch), we can anneal the detectors at hightemperature to remove most of the effects of the damage. Althoughsome damage is due to cosmic rays and the secondary neutrons theygenerate, most of it will be caused by trapped protons encounteredwhen the spacecraft passes through the SAA. When the anneal cyclebegins, the detectors will be powered down and then a one-time-useSMA actuator will be fired to open a valve in the cryostat’s back surfaceto the vacuum of space so that gases released during the warmup canescape. Then, diode heaters on the coldplate will be powered to beginheating it up. The cryocooler will be run at a low power level duringthe early phases of the warmup to keep the intermediate shield cold, sothat it doesn’t release any deposited water onto the detector surfaces.The detectors will be held near 100oC for several days before beingcooled down again to operating temperature.
3. Data Formats
3.1. Event Data
Most of the time, whether a flare is active or not, every photon eventin the RHESSI detectors is stored in onboard memory as 4 bytes ofdata and is telemetered to the Berkeley ground station (or a backupstation) within a day or two. Each event contains:
− 5 bits identifying the segment and (if a rear segment) gain settingof the event,
− 13 bits for the energy channel,
− the last 10 bits of the time counter, giving the event time in unitsof binary microseconds (i.e. 2−20 seconds), and
draft4.tex; 20/08/2002; 15:32; p.15
16 David M. Smith
− 4 bits that are a partial measurement of the livetime counter(Curtis et al., 2002).
If the onboard memory starts to fill up, a decimation algorithmautomatically throws out all but one out of every N events in thefront segments below a certain energy E, with N from 2–16. E and Nare functions of both the remaining memory and the position of theattenuators. Decimation in the rear segments can be commanded as aroutine way of keeping background (mostly photons from the Earth’satmosphere or the cosmic diffuse background) from filling up the mem-ory. Operating modes that have been used in flight have decimatedthe rear segments (with N=3 or 4 and E=150 keV to 450 keV) eitherduring spacecraft night or at times when RHESSI is at high magneticlatitudes and electron precipitation is common (see below). For most ofthe mission, front segment events have been turned off during spacecraftnight, and all events are always turned off during passage through theSAA.
3.2. Monitor Rates
Monitor rates are counters that are read out every second for eachof the 18 segments. They include: number of resets, number of eventstriggering the slow-channel lower-level discriminator (LLD), number ofevents triggering the fast-channel LLD, number of high-energy (ULD)events beyond the scale of the ADC (usually cosmic rays), and livetime.This information is normally used to check the health of the detectorsand is not necessary for spectroscopy.
3.3. Fast Rates
Fast rates are produced only when the count rates are very high. Thedata are count rates in four broad energy bands, roughly 7-15 keV, 15-25 keV, 25-70 keV, and 70 keV and higher, with significant variationfrom detector to detector. The pulses are sampled from the fast elec-tronics chain. The rates for the three detectors under the finest grids(and therefore the fastest imaging modulations) are sampled at 16 kHz;the next three at 4 kHz; and the three coarsest grids at 1 kHz. Eventsare not shut off when the fast rate data turn on; however, at these veryhigh count rates the event data will naturally taper off due to very highdeadtime.
draft4.tex; 20/08/2002; 15:32; p.16
The RHESSI Spectrometer 17
4. RHESSI’s Performance in Flight
4.1. Resolution
At low energies (below about 200 keV in the RHESSI front segments),the width of a spectral line in a germanium detector is dominated bynoise in the electronics, and is roughly constant. At higher energies,one of two noise components will dominate: the counting statistics ofthe electron-hole pairs, which increases as the square root of energy,and broadening due to trapping of electrons or holes in the crystal,which goes linearly with energy. Electron trapping is intrinsic to thedetectors, due to impurities when they are grown. Hole trapping is theresult of radiation damage in space.
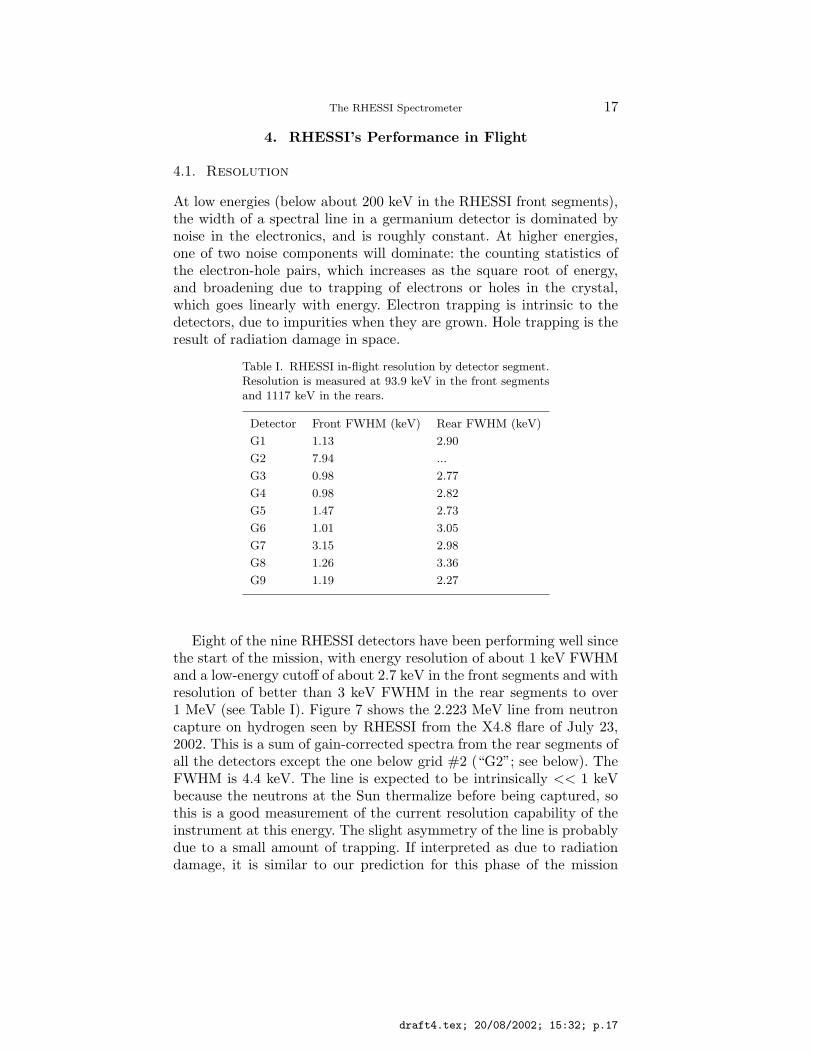
Table I. RHESSI in-flight resolution by detector segment.Resolution is measured at 93.9 keV in the front segmentsand 1117 keV in the rears.
Detector Front FWHM (keV) Rear FWHM (keV)
G1 1.13 2.90
G2 7.94 ...
G3 0.98 2.77
G4 0.98 2.82
G5 1.47 2.73
G6 1.01 3.05
G7 3.15 2.98
G8 1.26 3.36
G9 1.19 2.27
Eight of the nine RHESSI detectors have been performing well sincethe start of the mission, with energy resolution of about 1 keV FWHMand a low-energy cutoff of about 2.7 keV in the front segments and withresolution of better than 3 keV FWHM in the rear segments to over1 MeV (see Table I). Figure 7 shows the 2.223 MeV line from neutroncapture on hydrogen seen by RHESSI from the X4.8 flare of July 23,2002. This is a sum of gain-corrected spectra from the rear segments ofall the detectors except the one below grid #2 (“G2”; see below). TheFWHM is 4.4 keV. The line is expected to be intrinsically << 1 keVbecause the neutrons at the Sun thermalize before being captured, sothis is a good measurement of the current resolution capability of theinstrument at this energy. The slight asymmetry of the line is probablydue to a small amount of trapping. If interpreted as due to radiationdamage, it is similar to our prediction for this phase of the mission
draft4.tex; 20/08/2002; 15:32; p.17

18 David M. Smith
Figure 7. The 2.223 MeV neutron-capture line from the X4.8 solar flare of July 23,2002, as observed by the RHESSI rear segments.
(six months after launch). The resolution of the summed rear segmentsat low energies (i.e. the 93.3 keV background line) is 2.5 keV FWHM,which is the contribution of the electronics plus any blurring due toimperfect gain calibration.The gain calibration of each segment is currently re-calculated about
once a week, using a full orbit’s worth of background data. The entirechannel-to-energy conversion is represented as a purely linear fit overeach energy scale (0.0–2.7 MeV for the front segments and 0.0–2.7 and2.7–17 MeV in the rear segments). The gain and offset of the linearrelation are determined by finding the centroids of the two brightestbackground lines, a germanium activation line at 93.3 keV and thepositron annihilation line at 511 keV. The high degree of linearity ofthe electronics allows this fit to produce results as good as Figure 7even though the energy is extrapolated by a factor of four from thehigher line used in the gain solution. Gain variations within one orbitand within one day are negligible thanks to the thermal isolation of thedetectors and the careful design of the electronics to be temperature-independent. Gain solutions using more background lines and longerintegrations may yield a slight improvement on the already excellentresults.
draft4.tex; 20/08/2002; 15:32; p.18

The RHESSI Spectrometer 19
4.2. Dynamic range and effective area
With both sets of attenuators out, RHESSI can see microflares in the3-10 keV range that are too small to be seen by GOES (Krucker andChriste, 2002). With both sets in, the X4.8 flare of July 23, 2002, at itspeak, caused no more than 30% deadtime in the front segments. Thisstill requires a pileup correction for good hard x-ray spectroscopy (seebelow), but not a particularly difficult or nonlinear one. The countrate at the peak of the X4.8 flare was between 20,000 and 25,000counts/s in each front segment, close to the maximum throughput.The maximum throughput is about 20% higher when both shutters areout and the flare is dominated by soft photons that don’t trigger thepileup suppression.
Figure 8. RHESSI front and rear segment effective areas for photopeak absorption,summed over all 9 detectors. The front-segment traces peak at lower energy, andfrom top to bottom represent the case with no attenuator in, with the thin attenuatoronly in, and with both in. Below the rear-segment trace is the trace representingevents which are split between the front and rear segment of one detector. The totalof the front (no attenuator), rear, and coincidence modes is also shown.
Figure 8 shows the effective area of the RHESSI array for the frontsegments alone and the rear segments alone, including the effects of thegrids. The effect of the attenuators on the front segment effective areais also shown; their effect on the rear segment is negligible. The curvelabeled “F/R COINC.” represents events that leave part of their energy
draft4.tex; 20/08/2002; 15:32; p.19

20 David M. Smith
in each segment, adding up to the full energy. These events are not yetused by the analysis software, but the adaptation is in progress. Such“coincidence” events between segments of different detectors presenteven more complications and add less added effective area, so they willbe addressed only after front/rear coincidences have been incorporated.The grid and attenuator transmission values used for Figure 8 are
fits to data taken at the RHESSI x-ray grid characterization facilityat NASA’s Goddard Space Flight Center. The response of the spec-trometer is generated by GEANT3, a high-energy photon and particletransport code that is used to generate the response matrix of theinstrument (see below). Before flight, the GEANT3 performance wascalibrated by taking spectrometer data in the laboratory using radioiso-topes with lines from 3.7 keV to 6.1 MeV, placed in many positionsabove and around the spectrometer. The laboratory data were com-pared with GEANT3 simulations of the same configurations, and thedetails of the detector mass model in GEANT3 were adjusted until theGEANT3 results matched the data.Although the effective areas of the front and rear segments in Fig-
ure 8 cross at about 250 keV, this is not where the sensitivity of thetwo segments crosses. Because the background in the rear segments is afactor of 10 higher (see below), the front segments are more sensitive ina background-dominated situation up to about 800 keV. Summing theenergies of events that Compton scatter between segments or betweendetectors will improve the effective area, particularly at gamma-rayline energies. Proper handling of gain, effective area, and backgroundin this mode is being implemented but is not yet available at the timeof this writing.
4.3. Background
RHESSI is not designed to be a low-background instrument. Heavyshielding was not possible within the Small Explorer weight constraints.A launch into an equatorial orbit was not available, which would havereduced every background component except cosmic diffuse radiationby minimizing cosmic-ray exposure and eliminating exposure to trappedprotons in the South Atlantic Anomaly (SAA). Fortunately, solar flaresare bright, and most RHESSI flare science will still be done usingdata that are source-count limited rather than limited by statisticalfluctuations in the background.Figure 9 shows the background in the RHESSI front and rear seg-
ments. The front spectrum is shown both with the segment operated onits own and in anticoincidence with the rear segment. The latter modeis similar to “phoswich” detectors made of two layers of scintillator,
draft4.tex; 20/08/2002; 15:32; p.20

The RHESSI Spectrometer 21
Figure 9. Typical RHESSI background spectra, accumulated over 2.5 hr. The threesolid traces, top to bottom, are the backgrounds in the rear segments, the front seg-ments, and the front segments using front/rear anticoincidence (“phoswich mode”).The dotted lines are pre-flight predictions of the background that included contin-uum from the cosmic diffuse background and from cosmic rays interacting in theEarth’s atmosphere and in the spacecraft.
i.e. the rear segment serves as a closely-placed anticoincidence shield toreject events that Compton scatter into or out of the front segment andcharged-particle events. At most energies continuum is dominant, whichis typical for an unshielded instrument. The continuum is comparableto preflight estimates (dotted lines in Figure 9). In the simulationsthat produced the estimates, the dominant background component iscontinuum from the Earth’s atmosphere. Below about 100 keV in therear segments, cosmic diffuse emission dominates. Prompt cosmic-rayinteractions with the spacecraft, induced radioactivity of spacecraftmaterials and β-decays in the detectors also contribute.Most of the prominent lines in the background spectra are due to
the activation of the germanium detectors themselves (e.g. 10, 54, 67,93, and 198 keV). The brightest higher-energy line, however, is thepositron-annihilation line at 511 keV. Much of this comes from theatmosphere, but there is a significant contribution due to the activationof spacecraft materials: immediately after RHESSI exits the South At-
draft4.tex; 20/08/2002; 15:32; p.21

22 David M. Smith
lantic Anomaly (SAA), the 511 keV line flux is several times its averagevalue for orbits that don’t include the SAA, and the excess decays overthe next hour or so.The three primary sources of variation in the RHESSI background
are passes through SAA (several a day on successive orbits), smoothmodulations due to changes in geomagnetic latitude (and thereforecosmic-ray flux) over each orbit, and occasional periods of electronprecipitation from the outer radiation belt when the spacecraft is at itshighest geomagnetic latitudes (about 40-50o degrees). Bremsstrahlungproduced by these electrons in the spacecraft and the Earth’s atmo-sphere can temporarily increase the background rate by more than anorder of magnitude at times. These events can be distinguished from so-lar flares because they appear more strongly in the larger rear segments,whereas flares always produce more counts in the front segments. Inaddition, the CPD counts electrons at a significant rate in all but thesmallest precipitation events.
4.4. Instrumental anomalies
4.4.1. Detector dropouts
On orbit, we find that each detector segment can spontaneously shut offfor a brief period ranging from tens to hundreds of milliseconds. Thesedropouts occur up to once every few seconds in the front segments andgenerally much less often in the rear segments, although this is reversedin detector G5. The cause is still under investigation, but we expect itis a response of the electronics to heavy cosmic-ray nuclei, which leavemore energy in the detector than anything available on the groundduring pre-flight testing. This phenomenon does not have a significanteffect on spectroscopy, since it is energy independent, nor on imaging,since the dropouts do not correlate with the count-rate modulationsused to reconstruct images. It does have an effect on photometry andlightcurves, and this is addressed by the data-analysis software, whichcan recognize the dropouts and compensate for them by adjusting thelivetime accordingly.
4.4.2. Individual detector anomalies
Shortly after its high voltage was turned on, detector G2 suffered from abreakdown either on the rear surface of the crystal or somewhere alongits high voltage circuit, such that it can no longer be operated aboveabout 2400 V. At this voltage, the innermost part of the crystal is notdepleted, and therefore the contact break on the inner bore (see Fig-ure 1A) is not seen: G2 operates as a monolithic detector, with all eventsanywhere in the crystal going through the front segment electronics. In
draft4.tex; 20/08/2002; 15:32; p.22

The RHESSI Spectrometer 23
addition to losing the various advantages of segmentation, this alsoresults in extremely noisy operation: energy resolution of about 10 keVFWHM and a low-energy cutoff closer to 20 keV than the 2.7 keV ofmost of the front segments. Therefore this detector should not be usedfor spectroscopy, although it can still be used for imaging from about20 keV to the energy at which its grids, which are the second-finest ofthe nine, become transparent.Detector G8, which is located just a few centimeters from the aft
spacecraft antenna, becomes noisy when that antenna is switched on.This can occur several times a day for a few minutes at a time duringcontacts with the spacecraft. A database of times when this antenna isactive is on line, but has not yet been integrated with the data analysissoftware.Finally, detector G7 has a slight problem with its front segment
signal contact, which causes its energy resolution to be degraded from1 keV to 3 keV FWHM and its energy threshold to be raised from aboutthe normal 2.7 keV to 7 keV. This behavior has been understood andunchanged since before launch.
4.4.3. Spectral artifacts
A very small fraction of events near or above 3 MeV that should beanalyzed with the high-energy (low-gain) range of the rear segments donot trigger the gain shift in the fast channel. These pile up in the top64 channels (8128-8191) of the high-gain scale, and produce a spectralartifact there. A similar artifact appears in the 64 channels precedingthe halfway point of the spectrum (i.e. channels 4032-4095) (Share etal., 2002). Routines to automatically eliminate these channel ranges foreach detector will be implemented but are not yet in place.
4.4.4. Image events
When the clouds of electrons and holes liberated by a gamma-rayevent move through the detector, they create induced charges on theelectrodes of the segment in which they are moving. The change intime of this induced charge is the current pulse that is amplified andintegrated by the electronics to become the detected event. However,they also induce charges on the electrodes of the empty segment. Thedifference is that this image charge reverses sign in the empty segmentas the clouds approach the electrode of the segment in which they areactually moving. The result is that the image signals (current versustime) in the empty segment are bipolar in shape and integrate to zerocharge.The RHESSI electronics, however, do not integrate the signals for
an infinite time. Therefore a small amount at the very end of each pulse
draft4.tex; 20/08/2002; 15:32; p.23

24 David M. Smith
is not counted. Since it is the negative part of the bipolar signal in anempty segment that comes last, the result is that there is a very small,positive residual from the bipolar signal: in other words, a 1 MeV eventdetected in one segment will create a simultaneous (but false) event inthe other segment of a few keV. Fortunately, the timing of an imageevent is a couple of microseconds different from that of a front/rearcoincidence due to Compton scattering, so the image events can beweeded out of the data on the ground without eliminating Comptonscattered events, if that is desired.
5. Spectral data analysis
Deconvolve full response (SPEX/XSPEC)Divide by diagonal response OR
SPECTROSCOPY TASK FLOW CHART
Select segments and coincidence modes
Correct for deadtime & pileup
Convert counts to energy
Bin to desired energy bins
Before/after flare
Previous/next orbitPrevious/next daySynthetic
COUNT SPECTRUM
PHOTON SPECTRUM
ADVANCED
ADVANCED
Generate & subtract background
Grid transmissionAttenuator transmissionBlanket transmissionDetector response to modulated photons
Det. response to scattering in 2nd gridDet. response to scattering in spacecraftDet. response to scattering in atmosphere
& shutter
Det. intrinsic lineshape functionDet. electronics lineshape function
Electronics threshold cutoffs
Figure 10. Flowchart of a spectroscopy analysis. “Advanced” features are neededonly for a few flares, mostly the highest-energy ones.
Spectral analysis is an inverse problem that begins with a spectrumof counts per spectrometer channel and seeks to recover the spectrumof photons per energy interval initially incident on the spacecraft. Fig-ure 10 is a block diagram of the data analysis process for RHESSI
draft4.tex; 20/08/2002; 15:32; p.24
The RHESSI Spectrometer 25
spectra. The RHESSI data analysis software is written to be part ofthe SolarSoft system (Freeland and Handy, 1996), and, like all the data,is publicly available without a proprietary period. Spectral analysisin particular is accomplished with the SPEX spectral-inversion code(Schwartz, 1996), which has heritage from the Burst and TransientSource Experiment (BATSE) on the Compton Gamma-Ray Observa-tory. It would be beyond the scope of this paper to begin a tutorialon the use of the software, but it is worthwhile to summarize the stepsthat are needed for an accurate spectral result. As the software evolves,more and more of this will become automated and transparent to theuser.
5.1. Gain, Livetime, and Background
The first stage of analysis is to correct for gain drift and deadtime.Even our preliminary gain analysis is yielding excellent results (seeFigure 7) due to the high linearity of the electronics and the narrow,easily identified background lines. The deadtime correction routinesstart with the livetime counter in the electronics, correct for the doublerejection of piled-up events, and compensate for data dropouts.The next task is to identify and subtract background. At present
this is most easily done by selecting data intervals just before andjust after the flare and subtracting the spectra in those intervals fromthe spectrum at the time of interest (whether this is a small partof the flare or its entire duration). When the flare is long, this canbe inaccurate, since the background varies significantly over tens ofminutes. The results are improved by SPEX’s ability to take severalsuch intervals before and after the flare and fit a low-order polynomialto the background variation in each energy channel. At low energies,most flares are bright enough that the background is small comparedto the flare flux, and this method of subtraction is suitable.For a very few flares, more precise methods of background estimation
are desirable. These include very long flares and flares with faint hardemission or faint gamma-ray lines. We are developing several additionalbackground-subtraction options, including: 1) using as background theperiods exactly 15 orbits (approximately one day) before and after theflare interval, since at these times most of the parameters that controlthe background had the same value as during the flare; 2) for flaresthat do not extend much above 50 keV, using the simultaneous back-ground in the rear segments to predict the background in the fronts;and 3) training a neural network to produce a predictive model ofthe background at any time given a few parameters as input (such asgeomagnetic latitude, time since last passage through the SAA, etc.).
draft4.tex; 20/08/2002; 15:32; p.25

26 David M. Smith
5.2. Response Matrix
Once gain, livetime and background are accounted for, a series of in-strumental effects that together constitute the “response matrix” of theinstrument to flare photons must be removed. There are many effectsthat modify the input spectrum, including:
− absorption in the mylar blankets, cryostat windows, and grids;
− Compton scattering into and out of the detectors;
− Compton scattering off the Earth’s atmosphere, which can domi-nate the flare count rate in the rear segments below 100 keV;
− noise in the electronics;
− resolution degradation due to radiation damage; and
− the low-energy cutoff imposed by the electronics.
All these effects are accounted for when the analysis software creates aresponse matrix. Each of these effects contributes either to the diagonalelements of the matrix (i.e. the efficiency of the instrument for detectingphotons at their proper energy) or to the off-diagonal elements (movingphotons from their true energy to another energy, usually lower), or toboth.
Figure 11. RHESSI response matrices: Photopeak to Compton-continuum ratioversus energy.
draft4.tex; 20/08/2002; 15:32; p.26

The RHESSI Spectrometer 27
Figure 12. RHESSI response matrices: Sample responses at 50, 350, and 2500 keV(top to bottom).
When the user is only interested in isolated gamma-ray lines, theresponse is just the efficiency for photopeak detection, and the con-version from counts to photons is done immediately by dividing thecount spectrum by the diagonal terms of the response matrix. This isalso adequate for hard x-ray flares with no significant component above100 keV, since the response of the front segments below this point isdominated by complete absorption, not scattering. Figure 11 shows the
draft4.tex; 20/08/2002; 15:32; p.27

28 David M. Smith
ratio of photopeak to partial-energy (Compton-scattered) detections inRHESSI versus energy. Since most flare spectra are steeply falling, themeasured count rate in any given energy band is usually dominated byphotopeak counts up to an energy well beyond 100 keV. One exceptionis at the lowest energies (below 15 keV) when one or both of the shuttersare in. In this case, the true low-energy counts are strongly reduced andthe spectrum can be dominated by non-photopeak counts created whena 15-25 keV photon is photoelectrically absorbed in the germanium butthe K-shell fluorescence photon (about 10 keV) escapes.For studying low energies with the shutters in, or for studying con-
tinuum and broad-band emission at high energies, the non-diagonalresponse must be accounted for. This can be done automatically bySPEX using forward-folding. The user specifies a model form for theflare spectrum, which can be a combination of simple functions (powerlaws, Gaussians, etc.) and physics-based spectral forms (e.g. a set ofknown nuclear lines from a particular element bombarded by energeticprotons, or a thin-target bremsstrahlung spectrum from a monoener-getic electron beam). The software will then multiply this spectrumby the full response matrix, check the goodness of fit to the observedcount spectrum, and repeat the process, varying the parameters of theinput model until the best fit is found. The output of this process iseither the best-fit parameters themselves, or else a spectrum createdby multiplying the observed count spectrum by the ratio of the modelphoton spectrum to the model count spectrum.Figure 12 shows the modeled RHESSI front-segment response to
input photons at three energies: 50, 350, and 2500 keV. At 50 keV,the photopeak dominates but the K-shell escape peak is visible. At350 keV, a strong Compton continuum is seen, along with small K-shellfluorescence peaks from nearby passive material, including the tungstenRMC grids. At 2500 keV, pair-production can occur and there are threenarrow lines due to positron annihilation (511 keV) and to the escapeof one or two positron-annihilation photons from the detector.In addition to SPEX, we are developing tools to export the RHESSI
count spectra and response matrices to the XSPEC package (Arnaud,1996). XSPEC has a wider variety of built-in spectral models thanSPEX and is often used to combine simultaneous spectra from differentinstruments, which may be useful in the future if RHESSI and INTE-GRAL or another instrument observe the same flare. We also plan todevelop an algorithm for model-independent inversion of the spectra(Johns and Lin, 1992; Smith et al., 1995). This algorithm will probablybe most useful for spectra that are dominated by the continuum, notlines, but that extend to high enough energies that simply dividing bythe efficiency is insufficiently accurate.
draft4.tex; 20/08/2002; 15:32; p.28

The RHESSI Spectrometer 29
5.3. Pileup
Figure 13. Pileup correction at modest deadtime with the thin shutter in place.Top: count spectra before and after pileup correction. Bottom: Ratio of corrected touncorrected spectrum as a function of energy.
The pileup correction is the most difficult to implement. It is an off-diagonal effect in that it redistributes counts to different energies, but,unlike Compton scattering, its effect is also non-linear: the contributionof 100 keV photons to the piled-up spectrum depends not only on thenumber of 100 keV photons coming in, but also on the shape of therest of the spectrum as well. For this reason it cannot be made partof the response matrix. A full, correct treatment of pileup requires itto be treated as a separate stage of forward folding, occurring afterthe model spectrum has been folded through the response matrix.The (real) background must be added to the forward-folded modelflux before pileup is simulated. This is still far in the future for theRHESSI analysis software, but in the meantime we are implementing anapproximate pileup correction that can be applied early in the analysisflow (see Figure 10) without the need of a spectral model. Figure 13shows the effect of that pileup correction on a spectrum taken withthe thin shutter in and 12.4% deadtime. As we noted above, under
draft4.tex; 20/08/2002; 15:32; p.29

30 David M. Smith
the current flight software version the thick shutter would normally bebrought in to cut down on pileup at 10% deadtime.
Acknowledgements
The authors would like to thank Gerald Share of the Naval ResearchLaboratory for providing a valuable external perspective and advicethroughout the development process and since launch. We would liketo recognize our colleagues at the Space Sciences Laboratory who par-ticipated in calibration and testing of the spectrometer: engineers PeterHarvey (also the RHESSI Project Manager) and Jane Hoberman, tech-nician Michelle Galloway, and students Daniel Main, Albert Shih, LewisHyatt, Eunyong Cho, Scott Pollack, Mark Chu, and Carmel Levitan.Finally, we would like to thank the technicians, machinists, and otherswho helped build the RHESSI spectrometer.The instrument could not have been what it is without the contribu-
tions of our colleagues who passed away before RHESSI was launched:Reuven Ramaty and Natalie Mandzhavidze, whose work on gamma-rayline emission in flares inspired its high-resolution design, and RobertD. Campbell, who designed its particle detector and worked tirelesslyto characterize and calibrate its germanium detectors. We rememberthem with gratitude and respect.
References
Arnaud, K.: 1996, in G. Jacoby and J. Barnes (eds.), Astronomical Data AnalysisSoftware and Systems V , Astronomical Society of the Pacific, San Francisco,USA, p. 17.
Curtis, D. W. et al.: 2002, Solar Phys., in press (this volume)Freeland, S.L., and Handy, B.N.: 1998, Solar Phys. 182, 497.Hull, E. L.: 1998, Ph.D. dissertation, Indiana University, USAHurford, G. et al.: 2002, Solar Phys., in press (this volume)Johns, C. M., & Lin, R. P.: 1992, Solar Phys. 137, 121 (Erratum: Solar Phys.142,
219).Koenen, M., Bruckner, J., Korfer, M., Taylor, I. and Wanke, H.: 1995, IEEE Trans.
Nucl. Sci. 42, 653.Krucker, S. and Christe, S. D.: 2002, Solar Phys., in press (this volume)Landis, D. A., Madden, N. W., and Goulding, F. S.: 1998, IEEE Trans. Nucl. Sci.
45, 805.Lin, R. P. and Schwartz, R.: 1987, Solar Phys. 312, 462.Lin, R. P. et al.: 2002, Solar Phys., in press (this volume)McConnell, M. et al.: 2002, Solar Phys., in press (this volume)Schwartz, R. A. 1996, “Compton Gamma Ray Observatory Phase 4 Guest Investi-
gator Program: Solar Flare Hard X-ray Spectroscopy,” Technical Report, NASAGoddard Space Flight Center
draft4.tex; 20/08/2002; 15:32; p.30

The RHESSI Spectrometer 31
Share, G. H., Murphy, R. J., and Ryan, J.: 1997, in C. D. Dermer, M. S. Strick-man, and J. D. Kurfess (eds.), Proceedings of the Fourth Compton Symposium ,American Institute of Physics, Woodbury, New York, USA, p. 17.
Share, G. H. et al.: 2002, Solar Phys., in press (this volume)Smith, D. M. et al.: 1995, J. Geophys. Res. 100, 19675.Smith, D. M. et al.: 2000, “Extra-Solar Astrophysics with the High Energy So-
lar Spectroscopic Imager (HESSI),” in AIP Conf. Proc., The 5th ComptonSymposium, (New York: AIP), 510, 671
Smith, D. M. et al.: 2002, “Non-solar Astronomy with the Reuven Ramaty HighEnergy Solar Spectroscopic Imager (RHESSI),” SPIE Conf. Proceedings, vol.4851, in press
Vestrand, W. T. et al.: 1999, Ap. J. Suppl. 120, 409.Yoshimori, M. et al.: 1994, Ap. J. Suppl. 90, 639.
draft4.tex; 20/08/2002; 15:32; p.31

draft4.tex; 20/08/2002; 15:32; p.32