the rise and fall of the phytophthora infestans lineage...
TRANSCRIPT
elife.elifesciences.org
Yoshida et al. eLife 2013;2:e00731. DOI: 10.7554/eLife.00731 1 of 25
The rise and fall of the Phytophthora infestans lineage that triggered the Irish potato famineKentaro Yoshida1†, Verena J Schuenemann2†, Liliana M Cano1, Marina Pais1, Bagdevi Mishra3,4,5, Rahul Sharma3,4,5, Chirsta Lanz6, Frank N Martin7, Sophien Kamoun1‡, Johannes Krause2‡, Marco Thines3,4,5,8‡, Detlef Weigel9‡, Hernán A Burbano9*
1The Sainsbury Laboratory, Norwich, United Kingdom; 2Institute of Archaeological Sciences, University of Tübingen, Tübingen, Germany; 3Biodiversity and Climate Research Centre, Frankfurt, Germany; 4Institute of Ecology, Evolution and Diversity, Goethe University, Frankfurt, Germany; 5Senckenberg Gesellschaft für Naturforschung, Frankfurt, Germany; 6Genome Center, Max Planck Institute for Developmental Biology, Tübingen, Germany; 7Agriculture Research Services, United States Department of Agriculture, Salinas, United States; 8Centre for Integrated Fungal Research, Frankfurt, Germany; 9Department of Molecular Biology, Max Planck Institute for Developmental Biology, Tübingen, Germany
Abstract Phytophthora infestans, the cause of potato late blight, is infamous for having triggered the Irish Great Famine in the 1840s. Until the late 1970s, P. infestans diversity outside of its Mexican center of origin was low, and one scenario held that a single strain, US-1, had dominated the global population for 150 years; this was later challenged based on DNA analysis of historical herbarium specimens. We have compared the genomes of 11 herbarium and 15 modern strains. We conclude that the 19th century epidemic was caused by a unique genotype, HERB-1, that persisted for over 50 years. HERB-1 is distinct from all examined modern strains, but it is a close relative of US-1, which replaced it outside of Mexico in the 20th century. We propose that HERB-1 and US-1 emerged from a metapopulation that was established in the early 1800s outside of the species’ center of diversity.DOI: 10.7554/eLife.00731.001
IntroductionPotato late blight’s impact on humankind is rivaled by few other plant diseases. The Spanish intro-duced Europeans to the South American staple crop potato shortly after their conquest of the New World, but for three centuries Europe stayed free of P. infestans, the causal agent of late blight. In 1845, the oomycete P. infestans finally reached Europe, spreading rapidly from Belgium to other coun-tries of mainland Europe and then to Great Britain and Ireland. The impact of the epidemic reached catastrophic levels in Ireland, where the population was more dependent on potato for their subsist-ence than in other parts of Europe (Bourke, 1964; Reader, 2009). The subsequent Great Famine killed around 1 million people, and an additional million were forced to leave the island (Turner, 2005). Even today, the Irish population remains less than three quarters of what it was at the beginning of the 1840s. These dramatic consequences of the P. infestans epidemic were due to the absence of chemical and genetic methods to combat it; such means became available only several decades later.
Ever since triggering the Irish famine, P. infestans has continued to wreak havoc on potato fields throughout the world. Late blight remains the most destructive disease of the third largest food crop, resulting in annual losses of potatoes that would be sufficient to feed anywhere from 80 to many
*For correspondence: [email protected]
†These authors contributed equally to this work
‡These authors are listed in alphabetical order
Competing interests: See page 21
Funding: See page 21
Received: 12 March 2013Accepted: 10 May 2013Published: 28 May 2013
Reviewing editor: David Baulcombe, University of Cambridge, United Kingdom
This is an open-access article, free of all copyright, and may be freely reproduced, distributed, transmitted, modified, built upon, or otherwise used by anyone for any lawful purpose. The work is made available under the Creative Commons CC0 public domain dedication.
RESEARCH ARTICLE

Genomics and evolutionary biology
Yoshida et al. eLife 2013;2:e00731. DOI: 10.7554/eLife.00731 2 of 25
Research article
hundreds of millions of people (Fisher et al., 2012). Phytophthora infestans is an extraordinarily viru-lent and adaptable pathogen (Fry, 2008; Haas et al., 2009). In agricultural systems, sexual reproduc-tion may trigger explosive population shifts that are driven by the emergence and migration of asexual lineages (Fry et al., 1992, 2009; Cooke et al., 2012). The species is thought to originate from Toluca Valley, Mexico, where it infects wild relatives of potato, frequently undergoes sexual reproduction and co-occurs with the two closely related species P. mirabilis and P. ipomoeae (Tooley et al., 1985; Goodwin et al., 1994; Flier et al., 2003; Grünwald and Flier, 2005). In its center of origin, P. infestans is characterized by high levels of genetic and phenotypic diversity (Grünwald and Flier, 2005).
The genomes of a few P. infestans strains have been described (Haas et al., 2009; Raffaele et al., 2010a; Cooke et al., 2012). Compared to other species in the genus, the 240 Mb T30-4 reference genome of P. infestans is large, with three quarters of the genome consisting of repetitive DNA. A large number of genes codes for effector proteins, many of which are delivered inside plant cells to promote host colonization, for instance by suppressing plant immunity. RXLR proteins, the main class of host-translocated effectors, are encoded by about 550 genes in the P. infestans T30-4 genome. RXLR effectors that can be recognized by plant immune receptors, known as Resistance (R) proteins, are said to have ‘avirulence’ activity. Upon introduction of a cognate R gene into the host population, such avirulence effectors become a liability for the pathogen, and natural selection favors the spread of pseudogenized or mutated alleles (Vleeshouwers et al., 2011).
The detailed descriptions and drawings of Heinrich Anton de Bary and the reports of several other pioneers of plant pathology leave no doubt that the 19th century blight epidemic was triggered by P. infestans (de Bary, 1876; Bourke, 1964). What remains controversial is the relationship of the 19th century strains to modern isolates. The quest for understanding the origin of the strain that resulted in the Irish famine began with extant samples. Prior to the late 1970s, global P. infestans populations outside of South America and Mexico, the centers of diversity of the host and the pathogen, were dominated by a single clonal lineage that had the mitochondrial (mtDNA) haplotype Ib and was called US-1 (Goodwin et al., 1994). It was therefore proposed that the US-1 lineage was a direct descendant of the strain that first caused widespread late blight in North America from 1843 on, and then trig-gered the Irish famine beginning in 1845 (Bourke, 1964; Goodwin et al., 1994). This hypothesis was subsequently directly addressed by PCR analysis of infected 19th century potato leaves stored in her-baria. The conclusion from these studies was that the historic strains belonged to a mtDNA haplotype, Ia, that was distinct from that of the US-1 lineage (Ristaino et al., 2001; May and Ristaino, 2004).
eLife digest Few crop failures have been as devastating as those caused by potato late blight in the 1840s. This disease is caused by a filamentous microbe called Phytophthora infestans, which spread from North America to Europe in 1845, leading to the Great Famine in Ireland and to severe crop losses in the rest of Europe. Phytophthora is thought to have originated in the Toluca valley of Mexico, where many different strains evolve alongside wild potato relatives, but the exact strain that caused the Great Famine, and how it is related to modern strains of the pathogen, has remained a mystery.
Yoshida et al. have used a technique call ‘shotgun’ sequencing to map the genomes of 11 historical strains of P. infestans and 15 modern strains. The historical strains were extracted from the leaves of potato and tomato plants that were collected in North America and Europe, including Ireland and Great Britain, from 1845 onwards and stored in herbaria for future research. By comparing the genomes of the historical and modern samples, Yoshida et al. found that the historical strains all belonged to a single lineage that shows very little genetic diversity.
Previously it has been proposed that this lineage was the same as US-1, which was the dominant strain of potato blight in the world until the end of the 1970s, or that it was more closely related to modern strains than to US-1. Yoshida et al. now rule out both of these possibilities and show that the lineage that caused the great famine, which they call HERB-1, is clearly distinct from US-1, although they are closely related, and they conclude that both HERB-1 and US-1 might have dispersed from a common ancestor that existed outside of Mexico in the early 1800s. Why US-1 later replaced HERB-1 as the dominant strain in the world is an important question for future studies.DOI: 10.7554/eLife.00731.002

Genomics and evolutionary biology
Yoshida et al. eLife 2013;2:e00731. DOI: 10.7554/eLife.00731 3 of 25
Research article
Because Ia was at the time not only the predominant haplotype in the Toluca Valley in Mexico (Gavino and Fry, 2002; Flier et al., 2003), but had also been found in South America (Perez et al., 2001), May and Ristaino (2004) speculated that the 19th century and US-1 lineages represented two independent epidemics of divergent lineages that had both originated in South America and spread from there to North America and Europe. A caveat was that these far-reaching conclusions were based on only three mtDNA SNPs (Ristaino et al., 2001; May and Ristaino, 2004).
Since these first herbarium analyses, the retrieval and sequencing of DNA from museum specimens, fossil remains and archaeological samples—collectively known as ancient DNA (aDNA) (Pääbo et al., 2004)—have seen impressive advances thanks to the advent of high-throughput sequencing technolo-gies. The combined analysis of modern and ancient genomes of human pathogens has begun to solve important questions about their history and evolution (Bos et al., 2011, 2012). Here we show that aDNA methods hold similar promise for plant pathology and that they can improve our understanding of historically important plant pathogen epidemics.
To determine how the historic P. infestans strain(s) relate to extant isolates, we shotgun-sequenced 11 herbarium samples of infected potato and tomato leaves collected from continental Europe, Great Britain, Ireland, and North America in the period from 1845 to 1896, and extracted information on P. infestans mitochondrial and nuclear genomes. To understand the subsequent evolution of the path-ogen, we compared the historic P. infestans genomes to those of 15 modern 20th century strains that span the genetic diversity of the species, and to the two sister species P. ipomoeae and P. mirabilis. Our analyses revealed that the 19th century epidemic was caused by a single genotype, HERB-1, that persisted for at least 50 years. While it is distinct from all examined modern strains, HERB-1 is closely related to the 20th century US-1 genotype, suggesting that these two pandemic genotypes may have emerged from a secondary metapopulation rather than from the species’ Mexican center of diversity.
ResultsPreservation of ancient DNA and genome statisticsNineteenth-century samples of potato and tomato leaves with P. infestans lesions were obtained from the herbaria of the Botanische Staatssammlung München and the Kew Royal Botanical Gardens (Table 1 and Figure 1). DNA was extracted under clean room conditions and two genomic libraries were pre-pared from each sample for Illumina sequencing. The preparations were expected to comprise P. infestans DNA, host DNA from potato or tomato as well as DNA from microbes that had colonized either the living material at the time of its collection, or the dried material during its storage in the herbaria.
The first set of libraries was used for verification of aDNA-like characteristics, and the second set was used for production. In this second set we used a repair protocol that removes aDNA-associated lesions, mainly characterized by cytosine deamination to uracil (U), which is subsequently converted to and read as thymine (T) (Hofreiter et al., 2001; Briggs et al., 2007, 2010; Brotherton et al., 2007). The combination of uracil-DNA-glycosylase (UDG) and endonuclease VIII, which removes uracil resi-dues and repairs abasic sites, reduces the overall per-base error rate to as low as one 20th of unre-paired aDNA (Briggs et al., 2010).
Ancient DNA fragments are typically shorter than 100 bp (Pääbo, 1989), and paired-end reads of 100 bases each will therefore substantially overlap. Forward and reverse reads from the unrepaired libraries (Table 2) were merged, requiring at least 11 base overlap. Merging of short-insert libraries considerably decreases the error-rate and also generates sequences that reflect the original molecule length (Kircher, 2012). The median length of merged reads was in the range of approximately 50–85 bp (Figure 2A,B).
Merged sequences were mapped to the P. infestans T30-4 reference genome (Haas et al., 2009). Deamination of C to U in aDNA is highest at the first base (Briggs et al., 2007), and C-to-T was the predominant substitution at the 5’-end of molecules (Figure 2C,D). Based on mapping against the reference genome, we estimated the fraction of P. infestans DNA in the samples to be between 1% and 20% (Figure 2E). Most of the remaining reads could be mapped to the reference genomes for potato and tomato (Potato Genome Sequencing Consortium, 2011; The Tomato Genome Consortium, 2012).
In addition to 11 historic samples from Ireland, Great Britain, continental Europe and North America (Figure 1 and Table 1), we shotgun sequenced 14 modern strains from Europe, the Americas and
Genomics and evolutionary biology
Yoshida et al. eLife 2013;2:e00731. DOI: 10.7554/eLife.00731 4 of 25
Research article
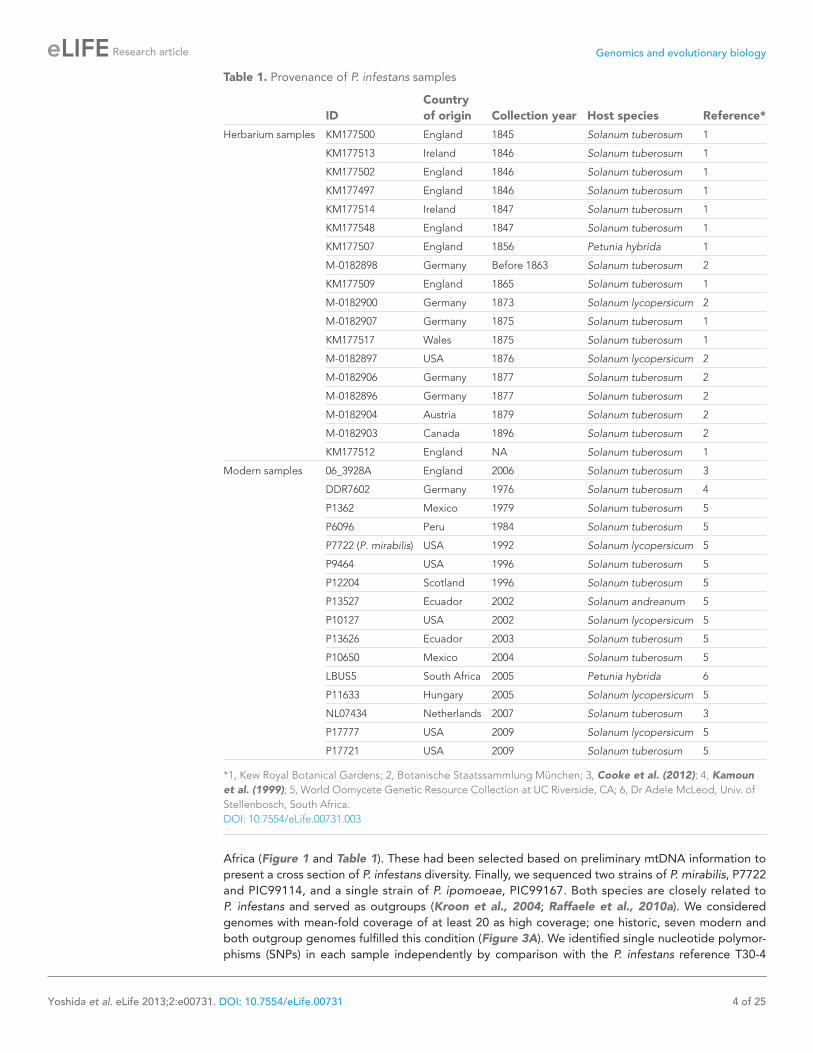
Table 1. Provenance of P. infestans samples
IDCountry of origin Collection year Host species Reference*
Herbarium samples KM177500 England 1845 Solanum tuberosum 1
KM177513 Ireland 1846 Solanum tuberosum 1
KM177502 England 1846 Solanum tuberosum 1
KM177497 England 1846 Solanum tuberosum 1
KM177514 Ireland 1847 Solanum tuberosum 1
KM177548 England 1847 Solanum tuberosum 1
KM177507 England 1856 Petunia hybrida 1
M-0182898 Germany Before 1863 Solanum tuberosum 2
KM177509 England 1865 Solanum tuberosum 1
M-0182900 Germany 1873 Solanum lycopersicum 2
M-0182907 Germany 1875 Solanum tuberosum 1
KM177517 Wales 1875 Solanum tuberosum 1
M-0182897 USA 1876 Solanum lycopersicum 2
M-0182906 Germany 1877 Solanum tuberosum 2
M-0182896 Germany 1877 Solanum tuberosum 2
M-0182904 Austria 1879 Solanum tuberosum 2
M-0182903 Canada 1896 Solanum tuberosum 2
KM177512 England NA Solanum tuberosum 1
Modern samples 06_3928A England 2006 Solanum tuberosum 3
DDR7602 Germany 1976 Solanum tuberosum 4
P1362 Mexico 1979 Solanum tuberosum 5
P6096 Peru 1984 Solanum tuberosum 5
P7722 (P. mirabilis) USA 1992 Solanum lycopersicum 5
P9464 USA 1996 Solanum tuberosum 5
P12204 Scotland 1996 Solanum tuberosum 5
P13527 Ecuador 2002 Solanum andreanum 5
P10127 USA 2002 Solanum lycopersicum 5
P13626 Ecuador 2003 Solanum tuberosum 5
P10650 Mexico 2004 Solanum tuberosum 5
LBUS5 South Africa 2005 Petunia hybrida 6
P11633 Hungary 2005 Solanum lycopersicum 5
NL07434 Netherlands 2007 Solanum tuberosum 3
P17777 USA 2009 Solanum lycopersicum 5
P17721 USA 2009 Solanum tuberosum 5
*1, Kew Royal Botanical Gardens; 2, Botanische Staatssammlung München; 3, Cooke et al. (2012); 4, Kamoun et al. (1999); 5, World Oomycete Genetic Resource Collection at UC Riverside, CA; 6, Dr Adele McLeod, Univ. of Stellenbosch, South Africa.DOI: 10.7554/eLife.00731.003
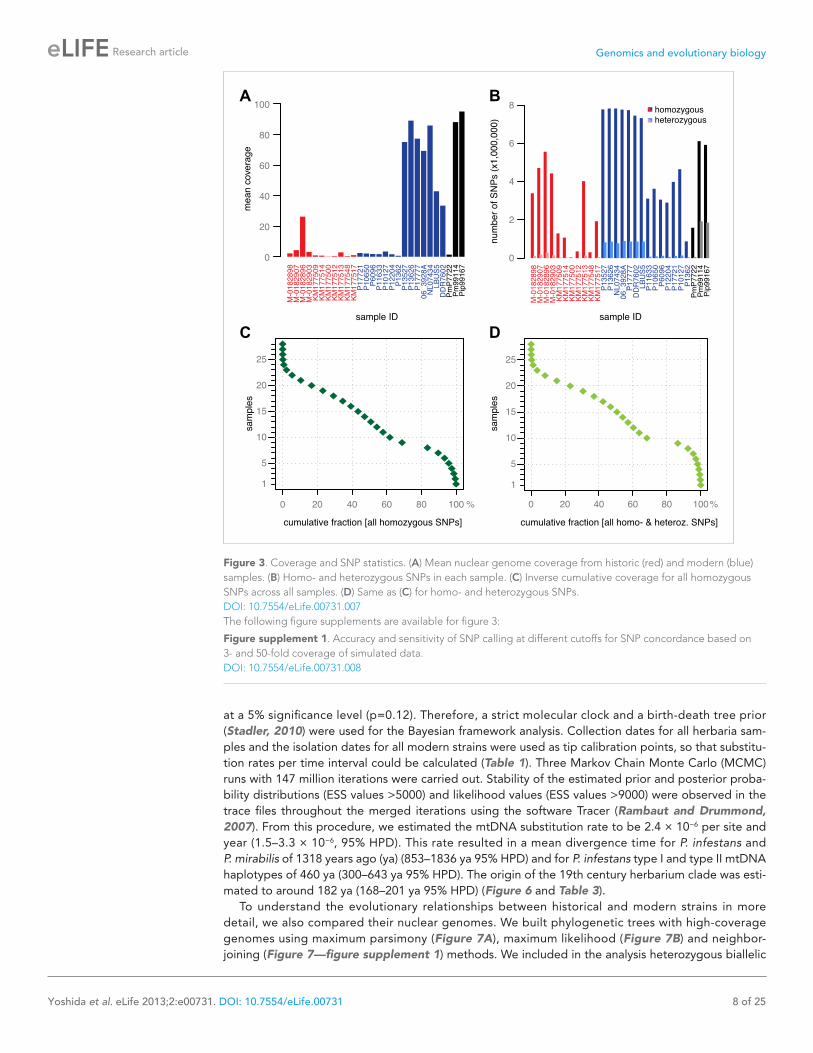
Africa (Figure 1 and Table 1). These had been selected based on preliminary mtDNA information to present a cross section of P. infestans diversity. Finally, we sequenced two strains of P. mirabilis, P7722 and PIC99114, and a single strain of P. ipomoeae, PIC99167. Both species are closely related to P. infestans and served as outgroups (Kroon et al., 2004; Raffaele et al., 2010a). We considered genomes with mean-fold coverage of at least 20 as high coverage; one historic, seven modern and both outgroup genomes fulfilled this condition (Figure 3A). We identified single nucleotide polymor-phisms (SNPs) in each sample independently by comparison with the P. infestans reference T30-4

Genomics and evolutionary biology
Yoshida et al. eLife 2013;2:e00731. DOI: 10.7554/eLife.00731 5 of 25
Research article
Figure 1. Countries of origin of samples used in whole-genome, mtDNA genome or both analyses. Red indicates number of historic and blue of modern samples. More information on the samples is given in Tables 1 and 2.DOI: 10.7554/eLife.00731.004
genome (Figure 3B). Thresholds for calling homozygous and heterozygous SNPs were determined from simulated data from high- and low-coverage genomes (Figure 3—figure supplement 1). We accepted SNPs from low-coverage genomes if the variants had also been called in a high-coverage genome. Inverse cumulative coverage plots indicated how many high- or low-coverage samples were needed to cover different fractions of SNPs (Figure 3C,D). A total of 4.5 million non-redundant SNPs were called. Eighty percent of all homozygous SNPs were found in at least eight samples, and only 20% of all SNPs were found in fewer than 10 strains. Thus, the great majority of polymorphic sites were shared by several strains and thus informative for phylogenetic analyses.
A unique type I mtDNA haplotype in 19th century P. infestans strainsWe reconstructed the mtDNA genomes from historic and modern strains using an iterative mapping assembler (Green et al., 2008) and estimated a phylogenetic tree from complete mtDNA genomes, with one of the P. mirabilis mtDNA genomes as outgroup. Previous studies have recognized four P. infestans mtDNA haplotype groups (Ia, Ib, IIa and IIb), based on a small number of restriction frag-ment length polymorphisms (RFLPs) (Carter et al., 1990). Surprisingly, a comparison of the complete mtDNA genomes revealed that the historic samples did not fit into any of these groups, and instead formed an independent clade, called HERB-1 from here on. Among the HERB-1 mtDNA genomes, there were very few differences, with a mean pair-wise difference of only 0.2 bp, compared to 3.9 bp for the modern haplotype I strains, and 9.0 bp for modern haplotype II strains. The origin of HERB-1 relative to haplotypes Ia and Ib could not be unequivocally resolved, and a polytomy was inferred for these three groups or support for branches were low (Figure 4 and Figure 4—figure supplement 1).
The clonal lineage US-1, with the diagnostic mtDNA haplotype Ib, was the predominant genotype throughout the world until about 1980 (Goodwin et al., 1994). The two US-1 representatives in our material, DDR7602 (Germany) and LBUS5 (South Africa), clustered together with the Ib reference genome and samples P6096 (Peru) and P1362 (Mexico) (Figure 4 and Figure 4—figure supplement 1), even though these last two samples had not been classified before as US-1 isolates. Although the US-1 genotype is closely related to the herbarium strains, US-1 is not a derivative of HERB-1. Rather, HERB-1 and US-1 are sister groups that share a common ancestor. There are three private substitutions that define the US-1 clade, and two that define the HERB-1 clade. In agreement with the previous report by Ristaino et al. (2001), all historic samples had a T at the position diagnostic for haplotype Ib (Figure 4—figure supplement 2), which distinguishes them from the US-1 lineage, which carries instead a C at this position. In contrast to the previous report (Ristaino et al., 2001), we found no other sequence differences around this diagnostic site.

Genomics and evolutionary biology
Yoshida et al. eLife 2013;2:e00731. DOI: 10.7554/eLife.00731 6 of 25
Research article
Table 2. Sequencing strategy
ID Instrument and read type Sequencing center Coverage
M-0182896 HiSeq 2000 (2 × 101 bp) MPI High
M-0182897 HiSeq 2000 (2 × 101 bp) MPI Low*
M-0182898 HiSeq 2000 (2 × 101 bp) MPI Low
M-0182900 HiSeq 2000 (2 × 101 bp) MPI Low†
M-0182903 HiSeq 2000 (2 × 101 bp) MPI Low
M-0182904 HiSeq 2000 (2 × 101 bp) MPI Low*
M-0182906 HiSeq 2000 (2 × 101 bp) MPI Low†
M-0182907 HiSeq 2000 (2 × 101 bp) MPI Low
KM177497 MiSeq (2 × 150 bp) MPI Low
KM177500 MiSeq (2 × 150 bp) MPI Low*
KM177502A MiSeq (2 × 150 bp) MPI Low*
KM177507 MiSeq (2 × 150 bp) MPI Low*
KM177509 MiSeq (2 × 150 bp) and HiSeq 2000 (2 × 101 bp) MPI Low
KM177512 MiSeq (2 × 150 bp) and HiSeq 2000 (2 × 101 bp) MPI Low
KM177513 MiSeq (2 × 150 bp) and HiSeq 2000 (2 × 101 bp) MPI Low
KM177514 MiSeq (2 × 150 bp) and HiSeq 2000 (2 × 101 bp) MPI Low
KM177517 MiSeq (2 × 150 bp) and HiSeq 2000 (2 × 101 bp) MPI Low
KM177548 MiSeq (2 × 150 bp) and HiSeq 2000 (2 × 101 bp) MPI Low
06_3928A GAIIX (2 × 76 bp) TSL High
DDR7602 GAIIX (2 × 76 bp) TSL High
LBUS5 GAIIX (2 × 76 bp) TSL High
NL07434 GAIIX (2 × 76 bp) TSL High
P10127 HiSeq 2000 (2 × 101 bp) MPI Low
P10650 HiSeq 2000 (2 × 101 bp) MPI Low
P12204 HiSeq 2000 (2 × 101 bp) MPI Low
P13527 GAIIX (2 × 76 bp) TSL High
P1362 HiSeq 2000 (2 × 101 bp) MPI Low
P13626 GAIIX (2 × 76 bp) TSL High
P11633 HiSeq 2000 (2 × 101 bp) MPI Low
P17721 HiSeq 2000 (2 × 101 bp) MPI Low
P17777 GAIIX (2 × 76 bp) TSL High
P6096 HiSeq 2000 (2 × 101 bp) MPI Low
P7722 HiSeq 2000 (2 × 101 bp) MPI Low
P9464 HiSeq 2000 (2 × 101 bp) MPI Low*
PIC99114 GAIIX (2 × 76 bp) TSL High
PIC99167 GAIIX (2 × 76 bp) TSL High
*Samples not included in any analysis due to extremely low coverage.†Samples used only in mtDNA analysis.DOI: 10.7554/eLife.00731.005
Relationship between HERB-1 and modern strains and divergence timesAs the HERB-1 strains were sampled in the 19th century, their genomes should harbor fewer substitu-tions compared to modern strains, which have continued to evolve for over a hundred years. This can be exploited to directly calculate substitution rates and divergence times using the sampling age as tip calibration in a Bayesian framework analysis. Shorter evolutionary time usually translate into branch shortening in phylogenetic trees that include both modern and ancient pathogen strains (Bos et al.,

Genomics and evolutionary biology
Yoshida et al. eLife 2013;2:e00731. DOI: 10.7554/eLife.00731 7 of 25
Research article
A
B
C
D
E
Figure 2. Ancient DNA-like characteristic of historic samples. (A) Lengths of merged reads from historic sample M-0182898. (B) Mean lengths of merged reads from historic samples. (C) Nucleotide mis-incorporation in reads from the historic sample M-0182898. (D) Deamination at first 5′ end base in historic samples. (E) Percentage of merged reads that mapped to the P. infestans reference genome.DOI: 10.7554/eLife.00731.006
2011). By calculating the nucleotide distance to the outgroup P17777, all HERB-1 strains were found to show significantly fewer mtDNA substitutions than modern strains with haplotype Ia or Ib (p=0.0003). Sampling age of the strain and the number of mtDNA substitutions were highly correlated (r2 = 0.8; Figure 5).
Given the correlation between sample age and the number of mtDNA substitutions, a multiple sequence alignment of 12 nearly complete modern and the 13 HERB-1 mtDNA genomes was used as input for a Bayesian framework analysis using algorithms implemented in the software package Beast (Drummond et al., 2012). The molecular clock hypothesis for the modern strains could not be rejected
Genomics and evolutionary biology
Yoshida et al. eLife 2013;2:e00731. DOI: 10.7554/eLife.00731 8 of 25
Research article
A
C
B
D
Figure 3. Coverage and SNP statistics. (A) Mean nuclear genome coverage from historic (red) and modern (blue) samples. (B) Homo- and heterozygous SNPs in each sample. (C) Inverse cumulative coverage for all homozygous SNPs across all samples. (D) Same as (C) for homo- and heterozygous SNPs.DOI: 10.7554/eLife.00731.007The following figure supplements are available for figure 3:
Figure supplement 1. Accuracy and sensitivity of SNP calling at different cutoffs for SNP concordance based on 3- and 50-fold coverage of simulated data. DOI: 10.7554/eLife.00731.008
at a 5% significance level (p=0.12). Therefore, a strict molecular clock and a birth-death tree prior (Stadler, 2010) were used for the Bayesian framework analysis. Collection dates for all herbaria sam-ples and the isolation dates for all modern strains were used as tip calibration points, so that substitu-tion rates per time interval could be calculated (Table 1). Three Markov Chain Monte Carlo (MCMC) runs with 147 million iterations were carried out. Stability of the estimated prior and posterior proba-bility distributions (ESS values >5000) and likelihood values (ESS values >9000) were observed in the trace files throughout the merged iterations using the software Tracer (Rambaut and Drummond, 2007). From this procedure, we estimated the mtDNA substitution rate to be 2.4 × 10⁻⁶ per site and year (1.5–3.3 × 10⁻⁶, 95% HPD). This rate resulted in a mean divergence time for P. infestans and P. mirabilis of 1318 years ago (ya) (853–1836 ya 95% HPD) and for P. infestans type I and type II mtDNA haplotypes of 460 ya (300–643 ya 95% HPD). The origin of the 19th century herbarium clade was esti-mated to around 182 ya (168–201 ya 95% HPD) (Figure 6 and Table 3).
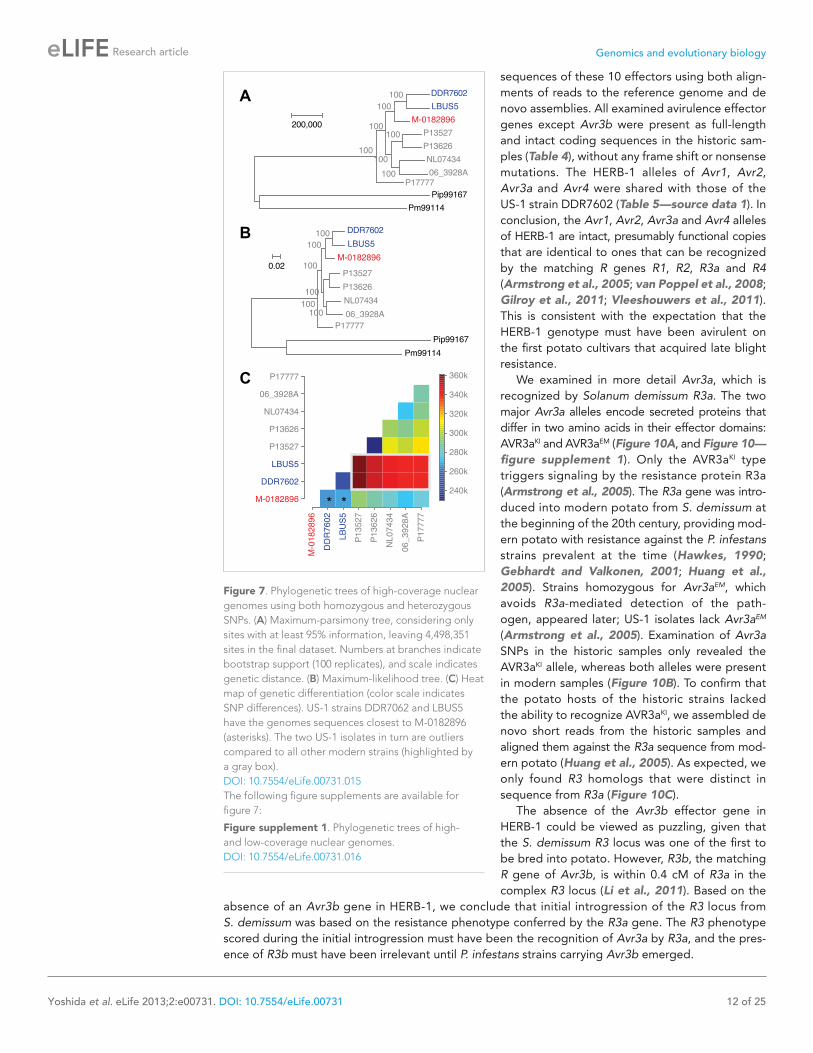
To understand the evolutionary relationships between historical and modern strains in more detail, we also compared their nuclear genomes. We built phylogenetic trees with high-coverage genomes using maximum parsimony (Figure 7A), maximum likelihood (Figure 7B) and neighbor-joining (Figure 7—figure supplement 1) methods. We included in the analysis heterozygous biallelic

Genomics and evolutionary biology
Yoshida et al. eLife 2013;2:e00731. DOI: 10.7554/eLife.00731 9 of 25
Research article
Figure 4. Maximum-parsimony phylogenetic tree of complete mtDNA genomes. Sites with less than 90% informa-tion were not considered, leaving 24,560 sites in the final dataset. Numbers at branches indicate bootstrap support (100 replicates), and scale indicates changes.DOI: 10.7554/eLife.00731.009The following figure supplements are available for figure 4:
Figure supplement 1. Maximum-likelihood phylogenetic tree of complete mtDNA genomes. DOI: 10.7554/eLife.00731.010
Figure supplement 2. mtDNA sequences around diagnostic Msp1 restriction site (grey) for reference haplotype modern strains (blue) and historic strains (red). DOI: 10.7554/eLife.00731.011
SNPs by random sampling an allele from each of them. In all cases, the HERB-1 representative, M-0182896, formed a distinct, isolated clade that appeared as a robust sister group to US-1 isolates DDR7602 and LBUS5. As a caveat, the random sampling of SNPs at heterozygous positions will inflate bootstrap support. Nevertheless, a heat map (Figure 7C) highlights that the two US-1 strains

Genomics and evolutionary biology
Yoshida et al. eLife 2013;2:e00731. DOI: 10.7554/eLife.00731 10 of 25
Research article
Figure 5. Correlation between nucleotide distance of mtDNA genomes of HERB-1/haplotype Ia/haplotype Ib clade to the outgroup P17777 and sample age in calendar years before present. DOI: 10.7554/eLife.00731.012
are both most closely related to HERB-1 and the most distinct among modern strains. Phylogenetic analyses that included the low-coverage genomes (Figure 7—figure supplement 1) were consistent with a close relationship between the HERB-1 and US-1 lineages.
Ploidy increase in modern strainsThe independent diversification of the pandemic HERB-1 and US-1 lineages together with a very recent common ancestor are consistent with both lineages having originated from the same metap-opulation. To test whether the global replacement of HERB-1 by US-1 in the 20th century was due to adaptive mutations, we searched for positively selected genes using PAML (Yang, 2007). We did not find any evidence for genes or sites that had experienced branch-specific positive selection in any of the lineages, only a mosaic pattern with potentially positively selected genes shared across lineages. Alternative scenarios could be that inactivating mutations were more important than non-synonymous substitutions, or that higher overall diversity and re-assortment of beneficial gene variants by recom-bination contributed to the success of US-1.
Genetic diversity can be increased by polyploidy, which has been reported in isolates of P. infestans (e.g., Daggett et al., 1995; Catal et al., 2010), and which has major evolutionary implications for asexual organisms. To estimate ploidy level in our specimens, we investigated the distribution of read counts at biallelic SNPs for high-coverage genomes. In a diploid species, the mean of read counts at heterozygous positions should have a single mode at 0.5, while there should be two modes, 0.33 and 0.67, for triploid genomes, and three modes, 0.25, 0.5 and 0.75 for tetraploid genomes. We compared the observed distributions of read counts with computational simulations of diploid, triploid and tet-raploid genomes. Based on the shape and kurtosis of the distributions we concluded that the historic M-0182896 genome was apparently diploid. Of the modern genomes, only NL07434 and P17777 were diploid, whereas the majority, including the two US-1 strains DDR7602 and LBUS5 as well as P13527 and P13626 were triploid. One strain, 06_3928A, even seemed to be tetraploid (Figure 8A,B and Figure 8—figure supplement 1). This conclusion was supported by polyploid strains having evi-dence for triallelic polymorphism at many more sites than M-0182896 (Figure 8C).
To further confirm the ploidy inferences, we classified 40,352 SNPs as derived or ancestral based on information from the outgroup species P. mirabilis and P. ipomoeae. We then compared the rate of homozygosity at derived alleles in M-0182896 and DDR7602. In agreement with the ploidy difference, M-0182896 had more than twice as many derived homozygous SNPs (8375) than DDR7602 (3440), regardless of annotation as synonymous, non-synonymous and non-sense (Figure 9A,B).
Effector genesPhytophthora infestans secretes a large repertoire of effector proteins, some of which are recognized by plant immune receptors encoded by R genes (Haas et al., 2009; Vleeshouwers et al., 2011).

Genomics and evolutionary biology
Yoshida et al. eLife 2013;2:e00731. DOI: 10.7554/eLife.00731 11 of 25
Research article
Figure 6. Divergence estimates of mtDNA genomes. Bayesian consensus tree from 147,000 inferred trees. Posterior probability support above 50% is shown next to each node. Blue horizontal bars represent the 95% HPD interval for the node height. Light yellow bars indicate major historical events discussed in the text. See Figure 5 and Table 3 for detailed estimates at the four main nodes in P. infestans.DOI: 10.7554/eLife.00731.013
These R genes occur in wild potato (Solanum) species mostly originating from the pathogen center of diversity in Mexico, and have been introduced by breeding into cultivated potato since the beginning of the 20th century (Hawkes, 1990). The analysis of effector gene sequences in HERB-1 strains should reveal the effector repertoire prior to its disruption by the selective forces imposed by resistance gene breeding. Given that 19th century potato cultivars in North America and Europe were fully susceptible to late blight, we presume that they did not yet contain resistance genes that are effective against HERB-1. Conversely, the first R genes for P. infestans resistance, introduced into cultivated potato only
after the dates for our HERB-1 samples, should be effective against HERB-1 strains, which are predicted to carry matching avirulence effector genes. The R genes include in particular R1 to R4 from Solanum demissum (Hawkes, 1990).
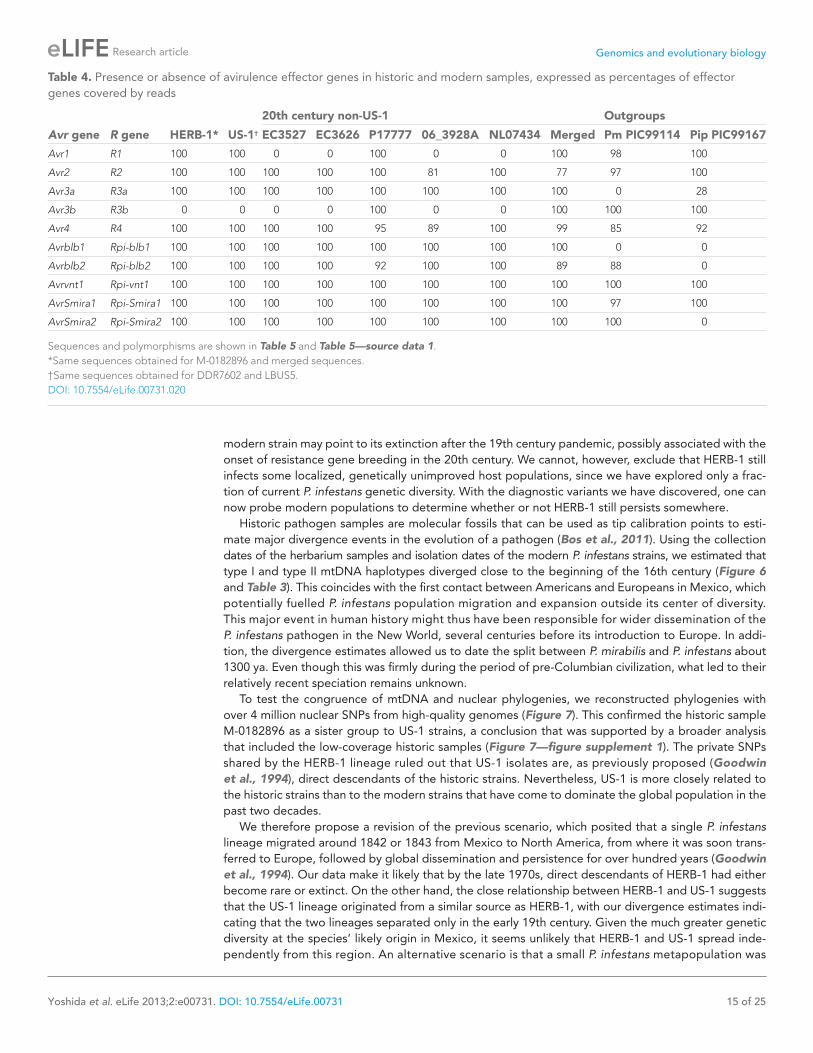
To date, 10 avirulence effector genes, recog-nized by 10 matching Solanum R genes, have been described in P. infestans (Vleeshouwers et al., 2011). We first estimated the presence/absence profiles of these effector genes based on the frac-tion of gene length that was covered by reads (‘breadth of coverage’) in each high-coverage genome, and by merged reads from low-coverage genomes (Table 4). We deduced the amino acid
Table 3. Inferred time to most recent common ancestor (TMRCA) for different splits in the mtDNA tree
Node
TMRCA (ya)
Best estimate
Lower 2.5%
Upper 2.5%
I/HERB-1, II 460 300 643
Ia/Ib, HERB-1 234 187 290
HERB-1 strains 182 168 201
IIa, IIb 142 78 214
DOI: 10.7554/eLife.00731.014
Genomics and evolutionary biology
Yoshida et al. eLife 2013;2:e00731. DOI: 10.7554/eLife.00731 12 of 25
Research article
A
B
C
Figure 7. Phylogenetic trees of high-coverage nuclear genomes using both homozygous and heterozygous SNPs. (A) Maximum-parsimony tree, considering only sites with at least 95% information, leaving 4,498,351 sites in the final dataset. Numbers at branches indicate bootstrap support (100 replicates), and scale indicates genetic distance. (B) Maximum-likelihood tree. (C) Heat map of genetic differentiation (color scale indicates SNP differences). US-1 strains DDR7062 and LBUS5 have the genomes sequences closest to M-0182896 (asterisks). The two US-1 isolates in turn are outliers compared to all other modern strains (highlighted by a gray box).DOI: 10.7554/eLife.00731.015The following figure supplements are available for figure 7:
Figure supplement 1. Phylogenetic trees of high- and low-coverage nuclear genomes. DOI: 10.7554/eLife.00731.016
sequences of these 10 effectors using both align-ments of reads to the reference genome and de novo assemblies. All examined avirulence effector genes except Avr3b were present as full-length and intact coding sequences in the historic sam-ples (Table 4), without any frame shift or nonsense mutations. The HERB-1 alleles of Avr1, Avr2, Avr3a and Avr4 were shared with those of the US-1 strain DDR7602 (Table 5—source data 1). In conclusion, the Avr1, Avr2, Avr3a and Avr4 alleles of HERB-1 are intact, presumably functional copies that are identical to ones that can be recognized by the matching R genes R1, R2, R3a and R4 (Armstrong et al., 2005; van Poppel et al., 2008; Gilroy et al., 2011; Vleeshouwers et al., 2011). This is consistent with the expectation that the HERB-1 genotype must have been avirulent on the first potato cultivars that acquired late blight resistance.
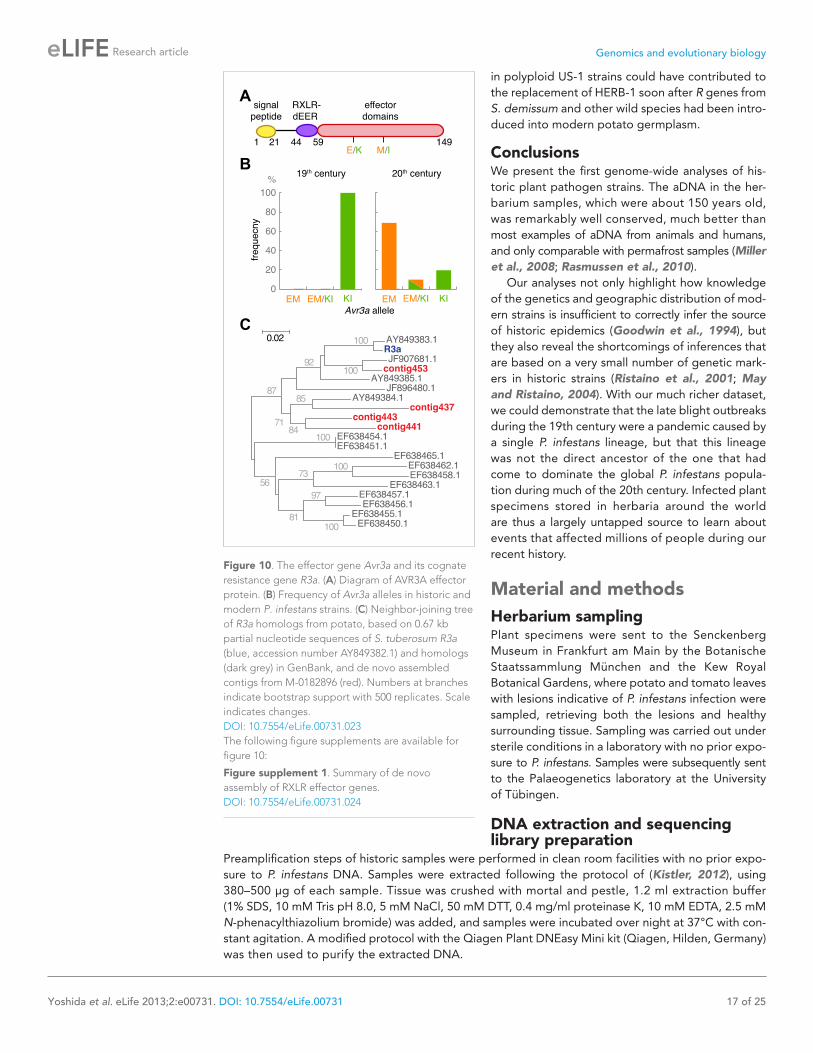
We examined in more detail Avr3a, which is recognized by Solanum demissum R3a. The two major Avr3a alleles encode secreted proteins that differ in two amino acids in their effector domains: AVR3aKI and AVR3aEM (Figure 10A, and Figure 10—figure supplement 1). Only the AVR3aKI type triggers signaling by the resistance protein R3a (Armstrong et al., 2005). The R3a gene was intro-duced into modern potato from S. demissum at the beginning of the 20th century, providing mod-ern potato with resistance against the P. infestans strains prevalent at the time (Hawkes, 1990; Gebhardt and Valkonen, 2001; Huang et al., 2005). Strains homozygous for Avr3aEM, which avoids R3a-mediated detection of the path-ogen, appeared later; US-1 isolates lack Avr3aEM (Armstrong et al., 2005). Examination of Avr3a SNPs in the historic samples only revealed the AVR3aKI allele, whereas both alleles were present in modern samples (Figure 10B). To confirm that the potato hosts of the historic strains lacked the ability to recognize AVR3aKI, we assembled de novo short reads from the historic samples and aligned them against the R3a sequence from mod-ern potato (Huang et al., 2005). As expected, we only found R3 homologs that were distinct in sequence from R3a (Figure 10C).
The absence of the Avr3b effector gene in HERB-1 could be viewed as puzzling, given that the S. demissum R3 locus was one of the first to be bred into potato. However, R3b, the matching R gene of Avr3b, is within 0.4 cM of R3a in the complex R3 locus (Li et al., 2011). Based on the
absence of an Avr3b gene in HERB-1, we conclude that initial introgression of the R3 locus from S. demissum was based on the resistance phenotype conferred by the R3a gene. The R3 phenotype scored during the initial introgression must have been the recognition of Avr3a by R3a, and the pres-ence of R3b must have been irrelevant until P. infestans strains carrying Avr3b emerged.

Genomics and evolutionary biology
Yoshida et al. eLife 2013;2:e00731. DOI: 10.7554/eLife.00731 13 of 25
Research article
A
C
B
Figure 8. Ploidy analysis. (A) Diagram of expected read frequencies of reads at biallelic SNPs for diploid, triploid and tetraploid genomes. (B) Reference read frequency at biallelic SNPs in gene dense regions (GDRs) for the historic sample M-0182896, two modern samples, and simulated diploid, triploid and tetraploid genomes. The simulated tetraploid genome is assumed to have 20% of pattern 1 and 80% of pattern 3 shown in (A). The shape and kurtosis of the observed distributions are similar to the corresponding simulated ones. (C) Polymorphic positions with more than one allele in the GDR.DOI: 10.7554/eLife.00731.017The following figure supplements are available for figure 8:
Figure supplement 1. Reference read frequency at biallelic SNPs in gene dense regions (GDRs) for five modern high-coverage samples. DOI: 10.7554/eLife.00731.018
DiscussionTo characterize the P. infestans strain(s) that triggered the Irish potato famine, we have sequenced several mtDNA and nuclear genomes of 19th century P. infestans strains. Because we wanted to inter-pret our findings in the context of extant genetic diversity, we investigated several modern strains as

Genomics and evolutionary biology
Yoshida et al. eLife 2013;2:e00731. DOI: 10.7554/eLife.00731 14 of 25
Research article
A
B
Figure 9. Read allele frequencies of historic genome M-0182896 and US-1 isolate DDR7602. Alleles were classified as ancestral or derived using outgroup species P. mirabilis and P. ipomoeae. There were 40,532 segregating sites. (A) Distributions of derived alleles at sites segregating between M-0182896 and DDR7602. (B) Annotation of the different site classes.DOI: 10.7554/eLife.00731.019
well. We could reconstruct the phylogenetic relationship between historic and modern strains using dozens of variants in complete mtDNA genomes, and millions of SNPs in the nuclear genomes, com-pared to previous work that had to rely on three mtDNA SNPs (Ristaino et al., 2001; May and Ristaino, 2004). The topologies of mtDNA and nuclear phylogenies were very similar, with the nuclear genomes yielding additional insights into differences in heterozygosity, ploidy levels and effector gene complement between historic and modern strains. Contrary to previous inferences (Ristaino et al., 2001; May and Ristaino, 2004), the 19th century strains are closely related to the modern US-1 lin-eage, but are characterized by a single, distinct mtDNA haplotype, HERB-1. Finally, from estimates of the divergence times of the different lineages, we were able to associate key events in P. infestans evolution with historic records of human migration and late blight spread.
Relationship between historical and modern strainsHistoric strains from different geographic locations all carried a mtDNA haplotype, HERB-1, that had not been recognized before (Figure 4). Although collected over a period of 50 years, the strains were distinguished from each other by few nuclear SNPs, indicating that the 19th century outbreak was a true pandemic of a rapidly spreading clonal genotype. That HERB-1 has so far not been found in any
Genomics and evolutionary biology
Yoshida et al. eLife 2013;2:e00731. DOI: 10.7554/eLife.00731 15 of 25
Research article
Table 4. Presence or absence of avirulence effector genes in historic and modern samples, expressed as percentages of effector genes covered by reads
Avr gene R gene HERB-1* US-1†
20th century non-US-1 Outgroups
EC3527 EC3626 P17777 06_3928A NL07434 Merged Pm PIC99114 Pip PIC99167
Avr1 R1 100 100 0 0 100 0 0 100 98 100
Avr2 R2 100 100 100 100 100 81 100 77 97 100
Avr3a R3a 100 100 100 100 100 100 100 100 0 28
Avr3b R3b 0 0 0 0 100 0 0 100 100 100
Avr4 R4 100 100 100 100 95 89 100 99 85 92
Avrblb1 Rpi-blb1 100 100 100 100 100 100 100 100 0 0
Avrblb2 Rpi-blb2 100 100 100 100 92 100 100 89 88 0
Avrvnt1 Rpi-vnt1 100 100 100 100 100 100 100 100 100 100
AvrSmira1 Rpi-Smira1 100 100 100 100 100 100 100 100 97 100
AvrSmira2 Rpi-Smira2 100 100 100 100 100 100 100 100 100 0
Sequences and polymorphisms are shown in Table 5 and Table 5—source data 1.*Same sequences obtained for M-0182896 and merged sequences.†Same sequences obtained for DDR7602 and LBUS5.DOI: 10.7554/eLife.00731.020
modern strain may point to its extinction after the 19th century pandemic, possibly associated with the onset of resistance gene breeding in the 20th century. We cannot, however, exclude that HERB-1 still infects some localized, genetically unimproved host populations, since we have explored only a frac-tion of current P. infestans genetic diversity. With the diagnostic variants we have discovered, one can now probe modern populations to determine whether or not HERB-1 still persists somewhere.
Historic pathogen samples are molecular fossils that can be used as tip calibration points to esti-mate major divergence events in the evolution of a pathogen (Bos et al., 2011). Using the collection dates of the herbarium samples and isolation dates of the modern P. infestans strains, we estimated that type I and type II mtDNA haplotypes diverged close to the beginning of the 16th century (Figure 6 and Table 3). This coincides with the first contact between Americans and Europeans in Mexico, which potentially fuelled P. infestans population migration and expansion outside its center of diversity. This major event in human history might thus have been responsible for wider dissemination of the P. infestans pathogen in the New World, several centuries before its introduction to Europe. In addi-tion, the divergence estimates allowed us to date the split between P. mirabilis and P. infestans about 1300 ya. Even though this was firmly during the period of pre-Columbian civilization, what led to their relatively recent speciation remains unknown.
To test the congruence of mtDNA and nuclear phylogenies, we reconstructed phylogenies with over 4 million nuclear SNPs from high-quality genomes (Figure 7). This confirmed the historic sample M-0182896 as a sister group to US-1 strains, a conclusion that was supported by a broader analysis that included the low-coverage historic samples (Figure 7—figure supplement 1). The private SNPs shared by the HERB-1 lineage ruled out that US-1 isolates are, as previously proposed (Goodwin et al., 1994), direct descendants of the historic strains. Nevertheless, US-1 is more closely related to the historic strains than to the modern strains that have come to dominate the global population in the past two decades.
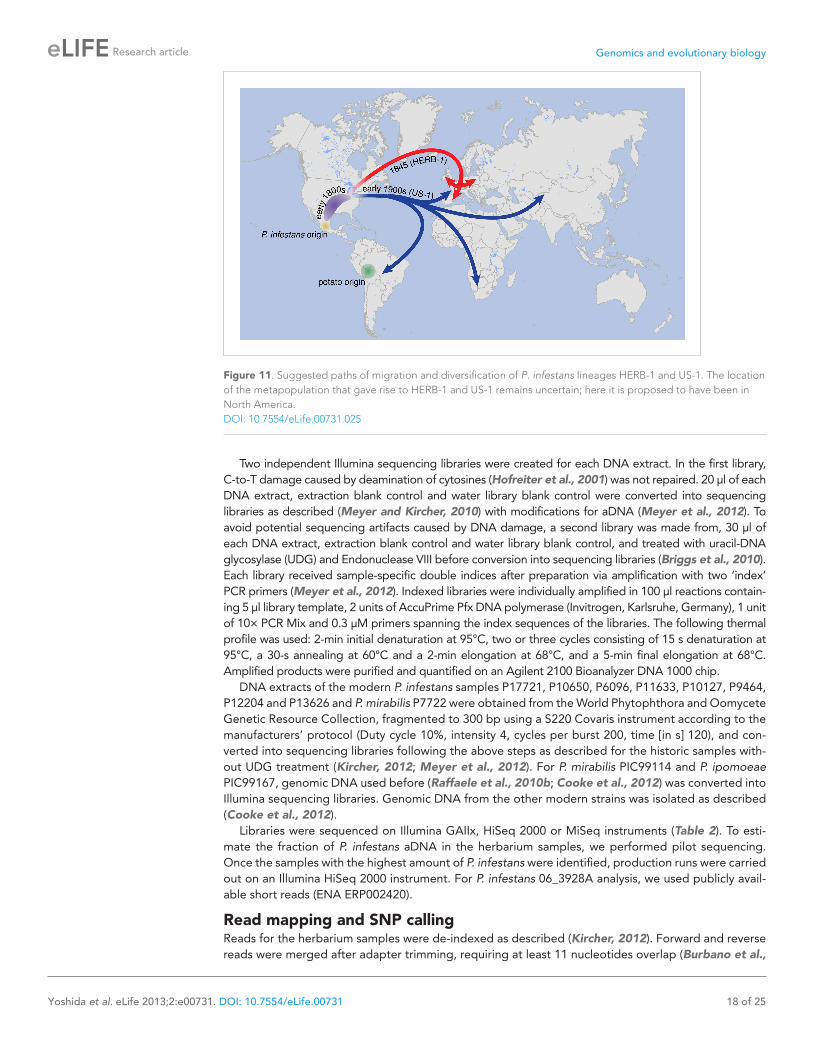
We therefore propose a revision of the previous scenario, which posited that a single P. infestans lineage migrated around 1842 or 1843 from Mexico to North America, from where it was soon trans-ferred to Europe, followed by global dissemination and persistence for over hundred years (Goodwin et al., 1994). Our data make it likely that by the late 1970s, direct descendants of HERB-1 had either become rare or extinct. On the other hand, the close relationship between HERB-1 and US-1 suggests that the US-1 lineage originated from a similar source as HERB-1, with our divergence estimates indi-cating that the two lineages separated only in the early 19th century. Given the much greater genetic diversity at the species’ likely origin in Mexico, it seems unlikely that HERB-1 and US-1 spread inde-pendently from this region. An alternative scenario is that a small P. infestans metapopulation was

Genomics and evolutionary biology
Yoshida et al. eLife 2013;2:e00731. DOI: 10.7554/eLife.00731 16 of 25
Research article
Table 5. Amino acid differences in the avirulence effectors AVR1, AVR2, AVR3a and AVR4 encoded by the T30-4 reference genome, HERB-1 and DDR7602 (US-1)
Position
Substitution
NoteT30-4 HERB1 DDR7602
AVR1 (PITG_16,663)
80 T T T, S HERB-1 polymorphisms shared with T30-4 and DDR7602.
142 I I, T T
154 V V, A A
185 I I I, V
AVR2 (PITG_22,870)
31 N K K HERB-1 identical to DDR7602.
AVR3a (PITG_14,371)
19 S C C HERB-1 identical to DDR7602; both correspond to AVR3aKI isoform.
80 E K K
103 M I I
139 M L L
AVR4 (PITG_07,387)
19 T T, I T HERB-1 polymorphisms shared with T30-4 and DDR7602.
139 L S L, S
221 L V L, V
271 V F V, F
IDs in parentheses refer to gene models in reference genome. Full-length sequences of deduced amino acid sequences of HERB-1 AVR1, AVR2, AVR3a and AVR4 are provided in Table 5—source data 1.DOI: 10.7554/eLife.00731.021The following source data are available for table 5:
Source data 1. Full-length sequences of deduced amino acid sequences of HERB-1 AVR1, AVR2, AVR3a and AVR4.DOI: 10.7554/eLife.00731.022
established at the periphery of its center of origin, or even outside Mexico, possibly in North America, some time before the first global P. infestans pandemic. The first lineage to spread from there was HERB-1, which persisted globally for at least half a century. Subsequently, the US-1 lineage expanded and spread, replacing HERB-1 (Figure 11).
Genetic and genomic differences between historic and modern strainsHost R genes that confer resistance to historic P. infestans strains, such as R3a, were bred into culti-vated potato Solanum tuberosum from the wild species S. demissum at the beginning of the 20th century, years after our youngest historic sample had been collected in 1896. In agreement with the products of these R genes being able to recognize HERB-1 effectors, HERB-1 strains seem to have only the Avr3aKI allele, which interacts with the product of the R gene R3a to trigger a host immune response (Armstrong et al., 2005; Huang et al., 2005). Moreover, de novo assembly of potato DNA did not provide evidence for the presence of R3a in the herbarium hosts, consistent with the narrative of potato breeding (Figure 10C; Hawkes, 1990). While it is uncertain when HERB-1 was displaced by the US-1 lineage, the US-1 lineage also carries only the Avr3aKI allele (Armstrong et al., 2005). The origin of the Avr3aEM allele that emerged to high frequency after the breeding of R3a into cultivated potatoes remains unclear.
A major genomic difference between the HERB-1 and US-1 lineages is the shift in ploidy, from dip-loid to triploid and even tetraploid (Figure 8 and Figure 8—figure supplement 1). Polyploidization could have provided an opportunity for US-1 isolates to enhance allelic diversity in the absence of frequent sexual reproduction, and could thus have contributed to their global success. Asexual repro-duction leads to an increase of deleterious mutation in the population due to a lack of meiotic recom-bination (Felsenstein, 1974). Therefore, if the major selection pressure that led to the replacement of HERB-1 by US-1 was the introduction of resistance gene breeding, greater variation at effector genes
Genomics and evolutionary biology
Yoshida et al. eLife 2013;2:e00731. DOI: 10.7554/eLife.00731 17 of 25
Research article
in polyploid US-1 strains could have contributed to the replacement of HERB-1 soon after R genes from S. demissum and other wild species had been intro-duced into modern potato germplasm.
ConclusionsWe present the first genome-wide analyses of his-toric plant pathogen strains. The aDNA in the her-barium samples, which were about 150 years old, was remarkably well conserved, much better than most examples of aDNA from animals and humans, and only comparable with permafrost samples (Miller et al., 2008; Rasmussen et al., 2010).
Our analyses not only highlight how knowledge of the genetics and geographic distribution of mod-ern strains is insufficient to correctly infer the source of historic epidemics (Goodwin et al., 1994), but they also reveal the shortcomings of inferences that are based on a very small number of genetic mark-ers in historic strains (Ristaino et al., 2001; May and Ristaino, 2004). With our much richer dataset, we could demonstrate that the late blight outbreaks during the 19th century were a pandemic caused by a single P. infestans lineage, but that this lineage was not the direct ancestor of the one that had come to dominate the global P. infestans popula-tion during much of the 20th century. Infected plant specimens stored in herbaria around the world are thus a largely untapped source to learn about events that affected millions of people during our recent history.
Material and methodsHerbarium samplingPlant specimens were sent to the Senckenberg Museum in Frankfurt am Main by the Botanische Staatssammlung München and the Kew Royal Botanical Gardens, where potato and tomato leaves with lesions indicative of P. infestans infection were sampled, retrieving both the lesions and healthy surrounding tissue. Sampling was carried out under sterile conditions in a laboratory with no prior expo-sure to P. infestans. Samples were subsequently sent to the Palaeogenetics laboratory at the University of Tübingen.
DNA extraction and sequencing library preparation
Preamplification steps of historic samples were performed in clean room facilities with no prior expo-sure to P. infestans DNA. Samples were extracted following the protocol of (Kistler, 2012), using 380–500 µg of each sample. Tissue was crushed with mortal and pestle, 1.2 ml extraction buffer (1% SDS, 10 mM Tris pH 8.0, 5 mM NaCl, 50 mM DTT, 0.4 mg/ml proteinase K, 10 mM EDTA, 2.5 mM N-phenacylthiazolium bromide) was added, and samples were incubated over night at 37°C with con-stant agitation. A modified protocol with the Qiagen Plant DNEasy Mini kit (Qiagen, Hilden, Germany) was then used to purify the extracted DNA.
A
B
C
Figure 10. The effector gene Avr3a and its cognate resistance gene R3a. (A) Diagram of AVR3A effector protein. (B) Frequency of Avr3a alleles in historic and modern P. infestans strains. (C) Neighbor-joining tree of R3a homologs from potato, based on 0.67 kb partial nucleotide sequences of S. tuberosum R3a (blue, accession number AY849382.1) and homologs (dark grey) in GenBank, and de novo assembled contigs from M-0182896 (red). Numbers at branches indicate bootstrap support with 500 replicates. Scale indicates changes.DOI: 10.7554/eLife.00731.023The following figure supplements are available for figure 10:
Figure supplement 1. Summary of de novo assembly of RXLR effector genes. DOI: 10.7554/eLife.00731.024
Genomics and evolutionary biology
Yoshida et al. eLife 2013;2:e00731. DOI: 10.7554/eLife.00731 18 of 25
Research article
Two independent Illumina sequencing libraries were created for each DNA extract. In the first library, C-to-T damage caused by deamination of cytosines (Hofreiter et al., 2001) was not repaired. 20 µl of each DNA extract, extraction blank control and water library blank control were converted into sequencing libraries as described (Meyer and Kircher, 2010) with modifications for aDNA (Meyer et al., 2012). To avoid potential sequencing artifacts caused by DNA damage, a second library was made from, 30 µl of each DNA extract, extraction blank control and water library blank control, and treated with uracil-DNA glycosylase (UDG) and Endonuclease VIII before conversion into sequencing libraries (Briggs et al., 2010). Each library received sample-specific double indices after preparation via amplification with two ‘index’ PCR primers (Meyer et al., 2012). Indexed libraries were individually amplified in 100 µl reactions contain-ing 5 µl library template, 2 units of AccuPrime Pfx DNA polymerase (Invitrogen, Karlsruhe, Germany), 1 unit of 10× PCR Mix and 0.3 µM primers spanning the index sequences of the libraries. The following thermal profile was used: 2-min initial denaturation at 95°C, two or three cycles consisting of 15 s denaturation at 95°C, a 30-s annealing at 60°C and a 2-min elongation at 68°C, and a 5-min final elongation at 68°C. Amplified products were purified and quantified on an Agilent 2100 Bioanalyzer DNA 1000 chip.
DNA extracts of the modern P. infestans samples P17721, P10650, P6096, P11633, P10127, P9464, P12204 and P13626 and P. mirabilis P7722 were obtained from the World Phytophthora and Oomycete Genetic Resource Collection, fragmented to 300 bp using a S220 Covaris instrument according to the manufacturers’ protocol (Duty cycle 10%, intensity 4, cycles per burst 200, time [in s] 120), and con-verted into sequencing libraries following the above steps as described for the historic samples with-out UDG treatment (Kircher, 2012; Meyer et al., 2012). For P. mirabilis PIC99114 and P. ipomoeae PIC99167, genomic DNA used before (Raffaele et al., 2010b; Cooke et al., 2012) was converted into Illumina sequencing libraries. Genomic DNA from the other modern strains was isolated as described (Cooke et al., 2012).
Libraries were sequenced on Illumina GAIIx, HiSeq 2000 or MiSeq instruments (Table 2). To esti-mate the fraction of P. infestans aDNA in the herbarium samples, we performed pilot sequencing. Once the samples with the highest amount of P. infestans were identified, production runs were carried out on an Illumina HiSeq 2000 instrument. For P. infestans 06_3928A analysis, we used publicly avail-able short reads (ENA ERP002420).
Read mapping and SNP callingReads for the herbarium samples were de-indexed as described (Kircher, 2012). Forward and reverse reads were merged after adapter trimming, requiring at least 11 nucleotides overlap (Burbano et al.,
Figure 11. Suggested paths of migration and diversification of P. infestans lineages HERB-1 and US-1. The location of the metapopulation that gave rise to HERB-1 and US-1 remains uncertain; here it is proposed to have been in North America.DOI: 10.7554/eLife.00731.025

Genomics and evolutionary biology
Yoshida et al. eLife 2013;2:e00731. DOI: 10.7554/eLife.00731 19 of 25
Research article
2010). Only fragments that that allowed merging of reads were used in subsequent analyses. Merged reads were mapped to the P. infestans T30-4 reference genome (Haas et al., 2009) with BWA, allow-ing two gaps and without seeding (Li and Durbin, 2009). PCR duplicates were identified based on read start and end alignment coordinates. For each cluster of duplicates a consensus sequence was calculated as described (Kircher, 2012). Only reads with a Phred-like mapping quality score of at least 30 were used further. Alignments were converted to BAM files (Li et al., 2009). For modern strains, single reads were mapped in a similar manner, and subsequent processing was performed as described (Cooke et al., 2012).
SNPs in the herbarium samples were called by independently comparing each strain with the P. infestans T30-4 genome. Raw allele counts for each position were obtained using pileup from SAMtools (Li et al., 2009). To decide the cutoffs for SNP calling we resorted to simulations. Reads from two 50-fold and 3-fold coverage genomes were simulated using the pIRS software (Hu et al., 2012), with empirical base-calling and GC%-depth profiles trained on five modern P. infestans genomes (P13527, P13626, 06_3928A, NL07434 and P17777). Based on the simulated data we called both homo and heterozygous SNPs employing different cutoffs for SNP concordance (Figure 3—figure supplement 1). Genotypes calls were classified as high quality if coverage was at least 10. We also considered low-quality SNPs, if a high-quality SNP call had been made in a different strain, using specific coverage cutoffs for rescuing low-quality SNPs (Figure 3—figure supplement 1). We calculated sensitivity and accuracy of SNP calls for different combination of cutoffs and selected the following criteria: • Minimum coverage of 10 for high quality calls.• Concordance ≥80% for homozygous SNPs.• Concordance between 20% and 80% for heterozygous SNPs.• Minimum coverage of 3 to rescue low-quality SNPs.
We called synonymous, nonsynonymous and nonsense polymorphisms employing snpEff (Cingolani et al., 2012).
Mitochondrial DNA (mtDNA) assembly and phylogenetic analysesFragments that could be aligned to any of the four reference haplotypes (Ia, IIa, Ib and IIb) were used to assemble mtDNA genomes. For each strain four different assemblies (one for each reference hap-lotype) were built using an iterative mapping assembly program (Green et al., 2008; Burbano et al., 2010). Only positions with coverage of at least 3 were included in the assemblies. The four assemblies were aligned using Kalign (Lassmann and Sonnhammer, 2005) with default parameters, and a con-sensus assembly was generated based on the alignment.
The 1.8-kb insertion present in haplotype II was not considered for phylogenetic reconstruction. The mtDNA phylogeny was built using a maximum parsimony and a maximum likelihood tree using MEGA5 (Tamura et al., 2011). For both, positions with less than 90% site coverage were eliminated. There were a total of 24,560 positions in the final dataset, compared to the multiple sequence align-ment length (37,762 bp). For the maximum likelihood reconstruction we used the Hasegawa-Kishino-Yano (HKY) model assuming that a certain fraction of sites are evolutionarily invariable. The model was selected using MEGA5 (Tamura et al., 2011).
Nuclear genome phylogenetic analysesWe reconstructed the nuclear phylogeny for the high-coverage samples alone and for all samples to-gether independently, using maximum parsimony and maximum likelihood approaches. We built the neighbor-joining trees based on a genetic distance matrix calculated from both homo- and heterozy-gous SNPs (Xu et al., 2012). For the high-coverage genomes we used only the SNPs positions with complete information in all samples. For the low-coverage genomes we used homo- and heterozygous SNPs, and allowing for missing data. So that we could include heterozygous SNPs in the analysis, we randomly sampled one allele at each site. The maximum parsimony trees were calculated with 100 replicates in MEGA5 using the Close-Neighbor-Interchange algorithm with search level 0, in which the initial trees were obtained with the random addition of sequences (10 replicates). All positions with less than 95% site coverage were eliminated (Tamura et al., 2011). For the high-coverage genomes-only analysis, all positions with less than 85% site coverage were eliminated. For the all-sample anal-ysis the threshold was lowered to 80%. Maximum likelihood trees were built using RaxML 7.0.4 with 100 replicates using the rapid bootstrap algorithm (Stamatakis, 2006).

Genomics and evolutionary biology
Yoshida et al. eLife 2013;2:e00731. DOI: 10.7554/eLife.00731 20 of 25
Research article
Effector analysesTo address presence and absence polymorphisms of effectors, we used a previously published pipe-line (Raffaele et al., 2010a). We calculated the fraction of each gene that was covered by reads (‘breadth of coverage’) for each strain. We regarded zero breadth of coverage as absence of the gene. For herbarium and modern samples with genome-wide coverage depth less than 20×, we merged BAM files from each strain into a single BAM file, and used this to estimated breadth of coverage.
We also tested for presence/absence polymorphisms of RXLR effector genes between herbarium samples and modern strains using de novo assembly of short reads. First, we extracted 140 bp frag-ments from M-0182896 merged reads, and assembled these with SOAPdenovo v1.05 (Luo et al., 2012). We aligned the six-frame translation of resulting contigs to a non-redundant protein database using blastx (Altschul et al., 1990). Most contigs matched proteins from either potato, Solanum tuberosum, or to microbial species P. infestans, Pantoea vagans and Pseudomonas sp. To focus on P. infestans, we aligned fragments that were at least 140 bp to the genomes of P. infestans, S. tuberosum, P. vagans, P. syringae pv. syringae, and P. fluorescens with blastn. We extracted fragments that aligned the P. infestans genomic regions encoding RXLR effector genes, but over at most 90 bp. These and unmapped fragments were de novo assembled with SOAPdenovo v1.05. A k-mer size of 67 was deemed optimal, because it resulted in the highest coverage of Avr1, Avr2 and Avr3a, and resulted in the largest number of RXLR proteins with TBLASTN hits (Figure 10—figure supplement 1). We obtained partial sequences of Avr4 and Avrblb1. We visually evaluated BWA alignments of M-0182896 in the Avr4 and Avrblb1 genomic regions and identified T30-4 sequences uncovered by alignments using Integrative Genomics Viewer (Robinson et al., 2011). We then identified T30-4 genomic regions with at least 99% similarity to these uncovered regions. In BWA, if reads match several genomic regions, one genomic location is randomly chosen as default (Li and Durbin, 2009). Thus, it is possible that BWA alignment distributes reads coming from the same gene across several, closely related genes in the target genome. We assembled such reads that mapped to closely related sequences in the reference genome together with the partial sequences of Avr4 and Avrblb1 using Geneious Pro 5.6.3 to obtain full-length sequences of these Avr genes.
Selection testsHomozygous SNPs from modern P. infestans strains EC3527, EC3626, NL07434, 06_3928A, DDR7602, LBUS5, P17777 and the historic strain M-0182896 were used for selection tests. Gene sequences were converted into amino acid sequences using EMBOSS tools (Rice et al., 2000), and Pla2Nal v14 (Suyama et al., 2006) was used to convert protein alignments to codon alignments. The codeml mod-ule of PAML package v4.6 (Yang, 2007) was used for positive selection studies with site models M7 (parameters NSsites = 7, fix_omega = 0, omega = 2 and kappa = 3) and M8 (NSsites = 8, fix_omega = 0, omega = 2 and kappa = 3). A 5% level of significance was established with Likelihood ratio test. Genes were considered to be under positive selection if at least one site was found to be under selection with a Bayes Empirical Bayes confidence >95%.
Ploidy analysesTo estimate ploidy levels, we assessed the distributions of read counts at biallelic SNPs. For diploid species, the mean frequency of reads for each allele at non-homozygous sites is 1/2, while we expect two modes for triploid genomes, at 1/3 and 2/3, and four modes for tetraploid genomes, at 1/4, 1/2 and 3/4 (Figure 8A). We simulated genomes with different ploidy levels using pIRS (Hu et al., 2012), based on two strains, P. infestans T30-4 and EC3527. The SNPs used for the construction of two simu-lated chromosomes were determined with SAMtools v0.1.8 mpileup and bcftools v0.1.17 (Li et al., 2009). For the diploid genome, we simulated 10x coverage reads for each of two different chromo-somes. For the triploid genome, we merged simulated 5× and 15× coverage reads from two different chromosomes. For the tetraploid genome, we merged simulated 10× coverage reads from two dif-ferent chromosomes (Figure 8B). Next, we aligned the simulated reads to the P. infestans T30-4 refer-ence genome with BWA and called heterozygous SNPs under the following criteria: minimum coverage of 10 for high-quality calls, and concordance between 20% and 80% for heterozygous SNPs. Since tetraploid species are considered to be a mixtures of two ratio, we mixed SNPs from the 20× coverage diploid reads and the 20× coverage tetraploid reads in following ratios: 0:100, 10:90, 20:80, 30:70, 40:60, 50:50, 60:40, 70:30, 80:20, 90:10 and 100:0. Finally, we estimated frequency of reads assigning each allele at each SNP position. Based on shapes, standard deviation, skewedness and kurtosis of the
Genomics and evolutionary biology
Yoshida et al. eLife 2013;2:e00731. DOI: 10.7554/eLife.00731 21 of 25
Research article
observed distributions and comparison with the simulated distributions, we classified the tested P. infestans genomes as diploid, triploid and tetraploid.
Substitution rates and divergence times for P. infestansIn order to test whether we can detect a temporal signal in the ancient P. infestans mtDNA sequences compared to modern strains, that is, shorter branches in the ancient strains compared to the modern ones, we calculated the nucleotide distance as the number of substitutions between HERB-1, haplo-type Ia and haplotype Ib mtDNA genomes to the outgroup P17777. The analysis involved 19 nucleo-tide sequences. All positions with less than 90% site coverage were eliminated, resulting in 34,174 informative positions. The samples were subsequently grouped into ancient and modern strains. The ancient and modern nucleotide distances were significantly different (Mann–Whitney U-test, p=0.0003). We furthermore correlated the nucleotide distance of HERB-1, haplotype Ia and haplotype Ib mtDNA genomes to the outgroup P17777 with the tip age of each sample.
To estimate divergence times of P. infestans strains, substitution rates were calculated in a Bayesian framework analysis using the software package BEAST 1.7.5 (Drummond et al., 2012). A multiple sequence alignment that included all 12 nearly complete modern P. infestans mtDNA sequences plus all 13 herbaria samples was used as input. In order to test if the mtDNAs evolved clock like a likelihood ratio test was performed in MEGA5 (Tamura et al., 2011) by comparing the maximum likelihood (ML) value for the given topology using only the modern strains with and without the molecular clock con-straints. The null hypothesis of equal evolutionary rate throughout the tree was not rejected at a 5% significance level (p=0.115). All positions containing gaps and missing data were eliminated resulting in a total of 22,591 positions in the final dataset.
As a result a strict molecular clock and the HKY sequence evolution model were used for the Bayesian framework. For the tree prior, five different models were tested including four coalescence models: constant size, expansion growth, exponential growth, logistic growth and a epidemiology birth–death model (Stadler, 2010). For each tree prior, three MCMC runs were carried out with 10,000,000 iterations each and subsequently merged using LogCombiner 1.7.5 from the BEAST package. Resulting ESS values and overall posterior likelihoods were compared using the software Tracer (Rambaut and Drummond, 2007). The birth-death model gave the highest ESS values and posterior likelihood and was therefore chosen for the subsequent dating analysis. The collection dates for all herbaria samples as well as the isolation dates for all modern strains were used as tip calibration points (Table 1). Three MCMC runs were carried out with 50,000,000 iterations each, sampling every 10,000 steps. The first 1,000,000 iterations were discarded as burn-in resulting in a total of 147,000,000 iterations.
AcknowledgementsWe are indebted to Bryn Dentinger, curator of the herbarium of the Kew Royal Botanical Gardens, and to Dagmar Triebel, curator of the herbarium of the Botanische Staatssammlung München, for providing the historic specimens used in this study. We are grateful to Mike Coffey for discussion of strain selection for genome analyses and providing genomic DNA preparations, Tahir Ali for help with phylogenetic tests, Jodie Pike for sequencing support, and Mike Coffey, David Cooke, Geert Kessel, Adele McLeod, Ricardo Oliva and Vivianne Vlesshouwers for Phytophthora strains. We thank Axel Künstner, Dan Koenig, Jorge Quintana and Ignacio Rubio-Somoza for discussion on data analysis and Eunyoung Chae and Rebecca Schwab for comments on the manuscript.
Additional informationCompeting interestsDW: Deputy editor, eLife. The other authors declare that no competing interests exist.
Funding
Funder Author
European Research Council Kentaro Yoshida, Verena J Schuenemann, Liliana M Cano, Marina Pais, Sophien Kamoun, Johannes Krause
Gatsby Charitable Foundation Kentaro Yoshida, Liliana M Cano, Marina Pais, Sophien Kamoun
Genomics and evolutionary biology
Yoshida et al. eLife 2013;2:e00731. DOI: 10.7554/eLife.00731 22 of 25
Research article
Funder Author
Biotechnology and Biological Sciences Research Council (BBSRC)
Kentaro Yoshida, Liliana M Cano, Marina Pais, Sophien Kamoun
LOEWE Bagdevi Mishra, Rahul Sharma, Marco Thines
United States Department of Agriculture
Frank N Martin
Japan Society for the Promotion of Science
Kentaro Yoshida
Deutsche Forschungsgemeinschaft Detlef Weigel, Hernán A Burbano
Max Planck Society Chirsta Lanz, Detlef Weigel, Hernán A Burbano
The funders had no role in study design, data collection and interpretation, or the decision to submit the work for publication.
Author contributionsKY, Processed sequencing reads of modern strains, identified SNPs, performed phylogenetic, genome-wide and effector gene analyses, discussed interpretation and wrote the manuscript; VJS, Extracted DNA from herbarium samples and prepared genomic libraries; LMC, Processed sequencing reads of modern strains and performed genome-wide and effector genes analysis; MP, Coordinated sequencing of modern strains in Norwich; BM, RS, Performed positive selection analyses; CL, Coordinated sequencing of historic and modern strains in Tübingen; FNM, Performed mtDNA haplotype analyses for choosing modern strains for genome sequencing; SK, DW, Conceived the project, coordinated the collaborative effort, discussed interpretation and wrote the manuscript; JK, Conceived the project, coordinated aDNA wet-lab experiments, performed phylogenetic analysis and discussed interpretation and wrote the manuscript; MT, Conceived the project, coordinated the collection and sampling of herbarium strains, discussed interpretation and wrote the manuscript; HAB, Conceived the project, coordinated the collaborative effort, processed sequencing reads of modern and historic strains, identified SNPs, performed phylogenetic analysis, discussed interpretation and wrote the manuscript
Additional filesMajor datasets
The following datasets were generated:
Author(s) Year Dataset title Dataset ID and/or URL
Database, license, and accessibility information
Yoshida K, Schuenemann VJ, Cano LM, Pais M, Mishra B, Sharma R, Lanz C, Martin FN, Kamoun S, Krause J, Thines M, Weigel D, Burbano HA
2013 Sequencing Phytophthora infestans genomes
ERP002419; http://www.ebi.ac.uk/ena/data/view/ERP002419
Publicly available at the Sequence Read Archive (http://www.ncbi.nlm.nih.gov/sra).
Yoshida K, Schuenemann VJ, Cano LM, Pais M, Mishra B, Sharma R, Lanz C, Martin FN, Kamoun S, Krause J, Thines M, Weigel D, Burbano HA
2013 Resequencing Solanaceae (Potato and Tomato) 19th century samples
ERP002550; http://www.ebi.ac.uk/ena/data/view/ERP002550
Publicly available at the Sequence Read Archive (http://www.ncbi.nlm.nih.gov/sra).
Yoshida K, Schuenemann VJ, Cano LM, Pais M, Mishra B, Sharma R, Lanz C, Martin FN, Kamoun S, Krause J, Thines M, Weigel D, Burbano HA
2013 Resequencing Phytophthora strains
ERP002552; http://www.ebi.ac.uk/ena/data/view/ERP002552
Publicly available at the Sequence Read Archive (http://www.ncbi.nlm.nih.gov/sra).

Genomics and evolutionary biology
Yoshida et al. eLife 2013;2:e00731. DOI: 10.7554/eLife.00731 23 of 25
Research article
The following previously published datasets were used:
Author(s) Year Dataset title Dataset ID and/or URL
Database, license, and accessibility information
Haas BJ, Kamoun S, Zody MC, Jiang RH, Handsaker RE, Cano LM, Grabherr M, Kodira CD, Raffaele S, Torto-Alalibo T, et al.
2009 Phytophthora infestans Database, Broad Institute
http://www.broadinstitute.org/annotation/genome/phytophthora_infestans/MultiHome.html
Publicly available at http://www.broadinstitute.org/annotation/genome/phytophthora_infestans/MultiDownloads.html.
Cooke DEL, Cano LM, Rafffaele S, et al.
2012 Genome analyses of an aggressive and invasive lineage of the Irish potato famine pathogen
ERP002420; http://www.ebi.ac.uk/ena/data/view/ERP002420
Publicly available at the Sequence Read Archive (http://www.ncbi.nlm.nih.gov/sra).
ReferencesAltschul SF, Gish W, Miller W, Myers EW, Lipman DJ. 1990. Basic local alignment search tool. J Mol Biol
215:403–10. doi: 10.1006/jmbi.1990.9999.Armstrong MR, Whisson SC, Pritchard L, Bos JI, Venter E, Avrova AO, et al. 2005. An ancestral oomycete locus
contains late blight avirulence gene Avr3a, encoding a protein that is recognized in the host cytoplasm. Proc Natl Acad Sci USA 102:7766–71. doi: 10.1073/pnas.0500113102.
Bos KI, Schuenemann VJ, Golding GB, Burbano HA, Waglechner N, Coombes BK, et al. 2011. A draft genome of Yersinia pestis from victims of the Black Death. Nature 478:506–10. doi: 10.1038/nature10549.
Bos KI, Stevens P, Nieselt K, Poinar HN, Dewitte SN, Krause J. 2012. Yersinia pestis: new evidence for an old infection. PLOS ONE 7:e49803. doi: 10.1371/journal.pone.0049803.
Bourke PMA. 1964. Emergence of potato blight, 1843-46. Nature 203:805–8. doi: 10.1038/203805a0.Briggs AW, Stenzel U, Johnson PL, Green RE, Kelso J, Prüfer K, et al. 2007. Patterns of damage in genomic DNA
sequences from a Neandertal. Proc Natl Acad Sci USA 104:14616–21. doi: 10.1073/pnas.0704665104.Briggs AW, Stenzel U, Meyer M, Krause J, Kircher M, Pääbo S. 2010. Removal of deaminated cytosines and
detection of in vivo methylation in ancient DNA. Nucleic Acids Res 38:e87. doi: 10.1093/nar/gkp1163.Brotherton P, Endicott P, Sanchez JJ, Beaumont M, Barnett R, Austin J, et al. 2007. Novel high-resolution
characterization of ancient DNA reveals C > U-type base modification events as the sole cause of post mortem miscoding lesions. Nucleic Acids Res 35:5717–28. doi: 10.1093/nar/gkm588.
Burbano HA, Hodges E, Green RE, Briggs AW, Krause J, Meyer M, et al. 2010. Targeted investigation of the Neandertal genome by array-based sequence capture. Science 328:723–5. doi: 10.1126/science.1188046.
Carter DA, Archer SA, Buck KW, Shaw DS, Shattock RC. 1990. Restriction fragment length polymorphisms of mitochondrial DNA of Phytophthora infestans. Mycol Res 94:1123–8. doi: 10.1016/S0953-7562(09)81344-0.
Catal M, King L, Tumbalam P, Wiriyajitsomboon P, Kirk WW, Adams GC. 2010. Heterokaryotic nuclear conditions and a heterogeneous nuclear population are observed by flow cytometry in Phytophthora infestans. Cytometry A 77:769–75. doi: 10.1002/cyto.a.20888.
Cingolani P, Platts A, Wang le L, Coon M, Nguyen T, Wang L, et al. 2012. A program for annotating and predicting the effects of single nucleotide polymorphisms, SnpEff: SNPs in the genome of Drosophila mela-nogaster strain w1118; iso-2; iso-3. Fly (Austin) 6:80–92. doi: 10.4161/fly.19695.
Cooke DE, Cano LM, Raffaele S, Bain RA, Cooke LR, Etherington GJ, et al. 2012. Genome analyses of an aggressive and invasive lineage of the Irish potato famine pathogen. PLOS PATHOG 8:e1002940. doi: 10.1371/journal.ppat.1002940.
Daggett SS, Knighton JE, Therrien CD. 1995. Polyploidy among isolates of Phytophthora infestans from Eastern Germany. J Phytopathol 143:419–22. doi: 10.1111/j.1439-0434.1995.tb00286.x.
de Bary HA. 1876. Researches into the nature of the potato fungus, Phytophthora infestans. J Roy Agric Soc Engl Ser 2:239–69.
Drummond AJ, Suchard MA, Xie D, Rambaut A. 2012. Bayesian phylogenetics with BEAUti and the BEAST 1.7. Mol Biol Evol 29:1969–73. doi: 10.1093/molbev/mss075.
Felsenstein J. 1974. The evolutionary advantage of recombination. Genetics 78:737–56.Fisher MC, Henk DA, Briggs CJ, Brownstein JS, Madoff LC, McCraw SL, et al. 2012. Emerging fungal threats to
animal, plant and ecosystem health. Nature 484:186–94. doi: 10.1038/nature10947.Flier WG, Grunwald NJ, Kroon LP, Sturbaum AK, van den Bosch TB, Garay-Serrano E, et al. 2003. The population
structure of Phytophthora infestans from the Toluca Valley of Central Mexico suggests genetic differentiation between populations from cultivated potato and wild Solanum species. Phytopathology 93:382–90. doi: 10.1094/PHYTO.2003.93.4.382.
Fry W. 2008. Phytophthora infestans: the plant (and R gene) destroyer. Mol Plant Pathol 9:385–402. doi: 10.1111/j.1364-3703.2007.00465.x.
Fry W, Grünwald N, Cooke D, McLeod A, Forbes G, Cao K. 2009. Population genetics and population diversity of Phytophthora infestans. In: Lamour K, Kamoun S, editors. Oomycete genetics and genomics: diversity, interactions, and research tools. Hoboken, NJ: Wiley-Blackwell. pp. 139–64.

Genomics and evolutionary biology
Yoshida et al. eLife 2013;2:e00731. DOI: 10.7554/eLife.00731 24 of 25
Research article
Fry WE, Goodwin SB, Matuszak JM, Spielman LJ, Milgroom MG, Drenth A. 1992. Population genetics and intercontinental migrations of Phytophthora infestans. Annu Rev Phytopathol 30:107–29. doi: 10.1146/annurev.py.30.090192.000543.
Gavino PD, Fry WE. 2002. Diversity in and evidence for selection on the mitochondrial genome of Phytophthora infestans. Mycologia 94:781–93. doi: 10.2307/3761693.
Gebhardt C, Valkonen JP. 2001. Organization of genes controlling disease resistance in the potato genome. Annu Rev Phytopathol 39:79–102. doi: 10.1146/annurev.phyto.39.1.79.
Gilroy EM, Breen S, Whisson SC, Squires J, Hein I, Kaczmarek M, et al. 2011. Presence/absence, differential expression and sequence polymorphisms between PiAVR2 and PiAVR2-like in Phytophthora infestans deter-mine virulence on R2 plants. New Phytol 191:763–76. doi: 10.1111/j.1469-8137.2011.03736.x.
Goodwin SB, Cohen BA, Fry WE. 1994. Panglobal distribution of a single clonal lineage of the Irish potato famine fungus. Proc Natl Acad Sci USA 91:11591–5. doi: 10.1073/pnas.91.24.11591.
Green RE, Malaspinas AS, Krause J, Briggs AW, Johnson PL, Uhler C, et al. 2008. A complete Neandertal mitochondrial genome sequence determined by high-throughput sequencing. Cell 134:416–26. doi: 10.1016/j.cell.2008.06.021.
Grünwald NJ, Flier WG. 2005. The biology of Phytophthora infestans at its center of origin. Annu Rev Phytopathol 43:171–90. doi: 10.1146/annurev.phyto.43.040204.135906.
Haas BJ, Kamoun S, Zody MC, Jiang RH, Handsaker RE, Cano LM, et al. 2009. Genome sequence and analysis of the Irish potato famine pathogen Phytophthora infestans. Nature 461:393–8. doi: 10.1038/nature08358.
Hawkes JG. 1990. The potato: evolution, biodiversity and genetic resources. Washington: Smithsonian Institution Press.
Hofreiter M, Jaenicke V, Serre D, von Haeseler A, Pääbo S. 2001. DNA sequences from multiple amplifications reveal artifacts induced by cytosine deamination in ancient DNA. Nucleic Acids Res 29:4793–9. doi: 10.1093/nar/29.23.4793.
Hu X, Yuan J, Shi Y, Lu J, Liu B, Li Z, et al. 2012. pIRS: profile-based Illumina pair-end reads simulator. Bioinformatics 28:1533–5. doi: 10.1093/bioinformatics/bts187.
Huang S, van der Vossen EA, Kuang H, Vleeshouwers VG, Zhang N, Borm TJ, et al. 2005. Comparative genomics enabled the isolation of the R3a late blight resistance gene in potato. Plant J 42:251–61. doi: 10.1111/j.1365-313X.2005.02365.x.
Kamoun S, Hraber P, Sobral B, Nuss D, Govers F. 1999. Initial assessment of gene diversity for the oomycete pathogen Phytophthora infestans based on expressed sequences. Fungal Genet Biol 28:94–106. doi: 10.1006/fgbi.1999.1166.
Kircher M. 2012. Analysis of high-throughput ancient DNA sequencing data. Methods Mol Biol 840:197–228. doi: 10.1007/978-1-61779-516-9_23.
Kistler L. 2012. Ancient DNA extraction from plants. Methods Mol Biol 840:71–9. doi: 10.1007/978-1-61779-516-9_10.
Kroon LP, Bakker FT, van den Bosch GB, Bonants PJ, Flier WG. 2004. Phylogenetic analysis of Phytophthora species based on mitochondrial and nuclear DNA sequences. Fungal Genet Biol 41:766–82. doi: 10.1016/j.fgb.2004.03.007.
Lassmann T, Sonnhammer EL. 2005. Kalign—an accurate and fast multiple sequence alignment algorithm. BMC Bioinformatics 6:298. doi: 10.1186/1471-2105-6-298.
Li G, Huang S, Guo X, Li Y, Yang Y, Guo Z, et al. 2011. Cloning and characterization of R3b; members of the R3 superfamily of late blight resistance genes show sequence and functional divergence. Mol Plant Microbe Interact 24:1132–42. doi: 10.1094/MPMI-11-10-0276.
Li H, Durbin R. 2009. Fast and accurate short read alignment with Burrows-Wheeler transform. Bioinformatics 25:1754–60. doi: 10.1093/bioinformatics/btp324.
Li H, Handsaker B, Wysoker A, Fennell T, Ruan J, Homer N, et al. 2009. The sequence Alignment/Map format and SAMtools. Bioinformatics 25:2078–9. doi: 10.1093/bioinformatics/btp352.
Luo R, Liu B, Xie Y, Li Z, Huang W, Yuan J, et al. 2012. SOAPdenovo2: an empirically improved memory-efficient short-read de novo assembler. Gigascience 1:18. doi: 10.1186/2047-217X-1-18.
May KJ, Ristaino JB. 2004. Identity of the mtDNA haplotype(s) of Phytophthora infestans in historical specimens from the Irish potato famine. Mycol Res 108:471–9. doi: 10.1017/S0953756204009876.
Meyer M, Kircher M. 2010. Illumina sequencing library preparation for highly multiplexed target capture and sequencing. Cold Spring Harb Protoc 2010:pdb.prot5448. doi: 10.1101/pdb.prot5448.
Meyer M, Kircher M, Gansauge MT, Li H, Racimo F, Mallick S, et al. 2012. A high-coverage genome sequence from an archaic Denisovan individual. Science 338:222–6. doi: 10.1126/science.1224344.
Miller W, Drautz DI, Ratan A, Pusey B, Qi J, Lesk AM, et al. 2008. Sequencing the nuclear genome of the extinct woolly mammoth. Nature 456:387–90. doi: 10.1038/nature07446.
Pääbo S. 1989. Ancient DNA: extraction, characterization, molecular cloning, and enzymatic amplification. Proc Natl Acad Sci USA 86:1939–43. doi: 10.1073/pnas.86.6.1939.
Pääbo S, Poinar H, Serre D, Jaenicke-Despres V, Hebler J, Rohland N, et al. 2004. Genetic analyses from ancient DNA. Annu Rev Genet 38:645–79. doi: 10.1146/annurev.genet.37.110801.143214.
Perez WG, Gamboa JS, Falcon YV, Coca M, Raymundo RM, Nelson RJ. 2001. Genetic structure of peruvian populations of Phytophthora infestans. Phytopathology 91:956–65. doi: 10.1094/PHYTO.2001.91.10.956.
Potato Genome Sequencing Consortium. 2011. Genome sequence and analysis of the tuber crop potato. Nature 475:189–95. doi: 10.1038/nature10158.

Genomics and evolutionary biology
Yoshida et al. eLife 2013;2:e00731. DOI: 10.7554/eLife.00731 25 of 25
Research article
Raffaele S, Farrer RA, Cano LM, Studholme DJ, MacLean D, Thines M, et al. 2010a. Genome evolution following host jumps in the Irish potato famine pathogen lineage. Science 330:1540–3. doi: 10.1126/science.1193070.
Raffaele S, Win J, Cano LM, Kamoun S. 2010b. Analyses of genome architecture and gene expression reveal novel candidate virulence factors in the secretome of Phytophthora infestans. BMC Genomics 11:637. doi: 10.1186/1471-2164-11-637.
Rambaut A, Drummond A. 2007. Tracer v1.4. http://beast.bio.ed.ac.uk/Tracer.Rasmussen M, Li Y, Lindgreen S, Pedersen JS, Albrechtsen A, Moltke I, et al. 2010. Ancient human genome
sequence of an extinct Palaeo-Eskimo. Nature 463:757–62. doi: 10.1038/nature08835.Reader J. 2009. Potato: a history of the propitious esculent. New Haven: Yale University Press.Rice P, Longden I, Bleasby A. 2000. EMBOSS: the European Molecular Biology Open Software Suite. Trends
Genet 16:276–7. doi: 10.1016/S0168-9525(00)02024-2.Ristaino JB, Groves CT, Parra GR. 2001. PCR amplification of the Irish potato famine pathogen from historic
specimens. Nature 411:695–7. doi: 10.1038/35079606.Robinson JT, Thorvaldsdottir H, Winckler W, Guttman M, Lander ES, Getz G, et al. 2011. Integrative genomics
viewer. Nat Biotechnol 29:24–6. doi: 10.1038/nbt.1754.Stadler T. 2010. Sampling-through-time in birth-death trees. J Theor Biol 267:396–404. doi: 10.1016/j.
jtbi.2010.09.010.Stamatakis A. 2006. RAxML-VI-HPC: maximum likelihood-based phylogenetic analyses with thousands of taxa
and mixed models. Bioinformatics 22:2688–90. doi: 10.1093/bioinformatics/btl446.Suyama M, Torrents D, Bork P. 2006. PAL2NAL: robust conversion of protein sequence alignments into the
corresponding codon alignments. Nucleic Acids Res 34:W609–12. doi: 10.1093/nar/gkl315.Tamura K, Peterson D, Peterson N, Stecher G, Nei M, Kumar S. 2011. MEGA5: molecular evolutionary genetics
analysis using maximum likelihood, evolutionary distance, and maximum parsimony methods. Mol Biol Evol 28:2731–9. doi: 10.1093/molbev/mst012.
The Tomato Genome Consortium. 2012. The tomato genome sequence provides insights into fleshy fruit evolution. Nature 485:635–41. doi: 10.1038/nature11119.
Tooley PW, Fry WE, Gonzalez MJV. 1985. Isozyme characterization of sexual and asexual Phytophthora infestans populations. J Hered 76:431–5.
Turner RS. 2005. After the famine: plant pathology, Phytophthora infestans, and the late blight of potatoes, 1845-1960. Hist Stud Phys Biol Sci 35:341–70. doi: 10.1525/hsps.2005.35.2.341.
van Poppel PM, Guo J, van de Vondervoort PJ, Jung MW, Birch PR, Whisson SC, et al. 2008. The Phytophthora infestans avirulence gene Avr4 encodes an RXLR-dEER effector. Mol Plant Microbe Interact 21:1460–70. doi: 10.1094/MPMI-21-11-1460.
Vleeshouwers VG, Raffaele S, Vossen JH, Champouret N, Oliva R, Segretin ME, et al. 2011. Understanding and exploiting late blight resistance in the age of effectors. Annu Rev Phytopathol 49:507–31. doi: 10.1146/annurev-phyto-072910-095326.
Xu X, Liu X, Ge S, Jensen JD, Hu F, Li X, et al. 2012. Resequencing 50 accessions of cultivated and wild rice yields markers for identifying agronomically important genes. Nat Biotechnol 30:105–11. doi: 10.1038/nbt.2050.
Yang Z. 2007. PAML 4: phylogenetic analysis by maximum likelihood. Mol Biol Evol 24:1586–91. doi: 10.1093/molbev/msm088.