the rise of agrarian capitalism and the decline of family ... · 2 the rise of agrarian capitalism...
TRANSCRIPT

1
The rise of agrarian capitalism and the decline
of family farming in England
Part of an E.S.R.C. funded project: Male occupational change and economic growth
in England 1750-1850.
Leigh Shaw-Taylor
Mapping Phil Stickler
Data Collection
Amanda Jones
Joe Barker
Note: this is a preliminary report rather than a fully-fledged paper. Comments would be very welcome (to Leigh Shaw-Taylor: [email protected]) but please do not cite or reproduce this material without permission.

2
The rise of agrarian capitalism and the decline of family farming in England1
Leigh Shaw-Taylor
Cambridge Group for the History of Population and Social Structure Department of Geography, University of Cambridge
This article aims to document the timing of the shift to agrarian capitalism in England. By 1800 England’s agrarian social structure was very different from that which prevailed in most parts of Europe.2 The agrarian landscape was dominated by a tripartite social structure in which most of the land was owned by large landowners, rented to large-scale tenant capitalist farmers and worked by agricultural proletarians whereas small scale family or peasant farming generally predominated on the continent.3 English agriculture was also characterised by much higher levels of labour productivity than the rest of Europe.4 The high labour productivity of English agriculture is widely held to have been a consequence of its distinctive social structure. In two of the most influential recent accounts of the first industrial revolution both Tony Wrigley and Nick Crafts have attributed England’s precocious early industrialisation to the high labour productivity of its agriculture.5 More recently Crafts and Harley have explicitly argued that England’s agrarian capitalism is the key to understanding why England industrialised before other European countries.6
The rise of agrarian capitalism and the inter-related topics of the growth of large farms and the decline of the English peasantry have been the subject of very extensive investigations by historians of rural society since the early years of the twentieth century. The decade before the first world war saw a bumper crop of books investigating these issues over the period from the sixteenth to the early nineteenth centuries.7 Research on these issues has continued ever since.8
The key point to emerge from this literature, for present purposes, is that historians have found evidence of engrossment (the growth of larger farms through the absorption of smaller ones) in the fourteenth, fifteenth, sixteenth, seventeenth and 1 This work for this paper forms part of a larger project, entitled Male occupational change and economic growth 1750-1851 funded by the Economic and Social Research Council (RES000-23-0131). I am grateful to Phil Stickler for producing all of the maps accompanying this paper. This paper has benefited from useful comments from seminar audiences at the Institute of Historical Research, the British Agricultural History Society and the Universities of Cambridge and Yale and from Bas van Bavel, Chris Briggs, Mark Overton, Alexandra Shepard, Tony Wrigley and Jan Luiten van Zanden. The usual disclaimers apply. 2 Wrigley, ‘Urban change’; idem, Continuity, pp. 44-5. 3 Parts of the Low Countries had also experienced a transition to agrarian capitalism. See van Bavel, ‘Structures’; idem, ‘Land’. 4 Wrigley, ‘Urban change’; idem, Continuity, p. 35; Crafts, British economic growth, pp. 2., 40; 115-40. Allen, ‘Agriculture’, p. 100. 5 Wrigley, Continuity, pp. 34-46; Crafts, British economic growth, pp. 115-40. 6 Crafts and Harley, ‘Precocious British industrialization.’ This is not, in itself, a novel view. See, Brenner ‘Agrarian class structure’, Saville ‘Primitive accumulation.’ 7 Hasbach, English agricultural labourer; Johnson, Disappearance; Hammond and Hammond, Village labourer; Tawney, Agrarian problem. 8 More recent work includes: Allen, Enclosure; Glennie, ‘Agrarian capitalism’; Spufford, Contrasting communities; Whittle, Development; Kerridge, Agrarian problems. Although he has not made any empirical contribution to this body of work it is important to mention Robert Brenner’s theoretical contribution to the debate at a European level. Brenner’s views and those of some of his critics can conveniently be found in Aston and Philpin, Brenner debate. For a further critique see Hoyle, ‘Tenure’.

3
eighteenth centuries but there is no consensus as to when the critical developments occurred.9 Tawney, in the only study of the development of agrarian capitalism which makes use of data from all over England, whilst recognising the importance of engrossment during the fourteen and fifteenth centuries, identified the critical period as 1500-1640. Arguably he placed particular emphasis on the first half of the sixteenth century, though he combined this with a recognition that capitalist development was not complete by the time of the civil war.10 In a study of the Cambridgeshire villages of Chippenham and Orwell Margaret Spufford also found evidence of much engrossment before 1500 but identified the key period of change as the late sixteenth and early seventeenth centuries.11 Glennie found engrossment taking place in Cheshunt in Hertfordshire between 1450 and 1560 but did not study the period after 1560.12 Whittle in a study of North Norfolk manors found increasing polarisation of landholdings over the period 1480 to 1560 but argues that the critical developments occurred during the eighteenth century.13 Robert Allen found engrossment taking place in the South Midlands across the seventeenth and eighteenth centuries but identified the eighteenth century as the critical period though he did not investigate engrossment in either the fifteenth or the sixteenth centuries. Similarly John Broad found evidence of engrossment across the seventeenth and eighteenth centuries on the Verney estates in Buckinghamshire but again his study begins around 1600.14 Gordon Mingay and Ros Wordie found considerable increases in the size of farms on a number of estates during the eighteenth century but neither investigated the earlier period.15
As a result of these and other studies we now know much about the mechanisms underlying change but despite both the central importance of the development of agrarian capitalism and the quantity of research effort devoted to it we lack any consensus as to when the critical developments occurred though everyone agrees it was somewhere between 1500 and 1800. There are two fundamental reasons for this lack of agreement. One is the absence of an adequate body of statistical data. We have many local studies from different parts of the country covering a variety of chronological periods. But we do not have any consistent body of data that covers both a long time period and has wide geographical coverage. Tawney’s work provides the only national body of data but his data are cross-sectional rather than longitudinal. Robert Allen’s work in Enclosure and the Yeoman goes furthest in this regard by providing a substantial body of data on farm size distributions across a number of south Midland counties for the period from the early seventeenth century through to the late eighteenth century though the data only cover the period after 1600.
A second basic cause of disagreement is that historians have sometimes employed different conceptual categories and have sometimes used differing definitions of the same terms. Some historians have studied the decline of the small owner-occupier or 9 For further discussion of the same point see: French and Hoyle, ‘Slaidburn’, p. 350; Broad, ‘Midland yeoman’, p. 326. 10 Tawney, Agrarian problem, pp. 10, 58, 70, 400 and 403. 11 Spufford, Contrasting communities, pp. 47, 66. 70, 100, 118. In contrast Spufford argues that the nearby fen-edge village of Willingham had not undergone a comparable transition by 1700, ibid p. 161, 165. 12 Glennie, ‘Agrarian capitalism.’ 13 Whittle, Development. 14 Broad, Transforming. 15 Mingay, ‘Size of Farms’, pp. 480-482; Wordie, ‘Social change’, pp. 596, 605-607.

4
sometimes the small farmer, others the decline of the English peasantry whilst still others have focussed on the emergence of agrarian capitalism or the growth of large farms. On their own these differences might be manageable but historians have also differed as to the appropriate definitions of small farms, small owner-occupiers, peasants, large farms and capitalist farms.16 Worse still some writers have failed to be explicit about the meanings they attach to their preferred terms.
In addition to these causes of disagreement there is a further fundamental problem. Most of the data in studies pertaining to the period before the late eighteenth century are deeply problematic. Data which describe units of ownership have been deployed as if they described farms.17 In consequence we may know even less about the evolution of farm size over time than a casual acquaintance with the secondary literature might suggest.
Robert Allen’s work in Enclosure and the yeoman is arguably the most important contribution to the debate since Tawney’s. In addition to the large scale longitudinal data-sets already alluded to, the book is also unique in providing an unambiguous periodisation for the rise to dominance of agrarian capitalism. For these and other reasons, of which more shortly, Enclosure and the yeoman marks a watershed in the literature. It therefore looms large in the discussion of the literature here. However, it is the argument of this paper that Allen’s periodisation is in fact mistaken.
Much of this paper is taken up with a critical review of the existing historiography. Section one deals with terminological issues; section two sets out Allen’s thesis that agrarian capitalism replaced a previously dominant ‘peasantry’ during the eighteenth century; section three examines the geography of agrarian capitalism at the end of our period in the mid-nineteenth century; section four discusses the relationship between the size of farms and the mode of production. Section five concludes the discussion of the historiography by considering the fundamental methodological problems arising from the distinction between units of ownership and farms. Section six suggests that this and other problems may be sidestepped by ignoring farm sizes and using occupational data to assess the importance of capitalist farming. Sections seven to nine make use of occupational data to examine the relative importance of capitalist farms and family farms around 1700 and in 1851. Section ten concludes by arguing that agrarian capitalism was already dominant in southern and eastern England by the early years of the eighteenth but that in much of northern England family farming remained more important than capitalist farming until after 1700.
I Let us start by considering some terminological issues. Of all the conceptual categories used in the literature the ‘peasantry’ and ‘peasants’ are perhaps the most problematic. Different historians have used these terms to mean quite different things and there is no prospect that agreement will ever be reached over their ‘correct’ meaning or usage. The terms are far too deeply embedded in numerous discourses to be excised from public discussion and they are not without value. Nevertheless the wide range of entrenched connotations they carry makes them an obstacle to any clear discussion of the issues with which this paper is concerned.18 16 For further discussion of this point see French and Hoyle, ‘Slaidburn’, pp. 350-1 17 This relates to the confusion in the literature between the decline of small owners and the decline of small farmers. As French and Hoyle put it the former refer to units of property, the latter to units of production. Ibid, p. 350. 18 See Neeson, Commoners, chapter ten for a particularly tortured discussion of the term’s meaning.
5
The use of the terms ‘peasantry’ and ‘peasant’ have therefore been eschewed throughout this paper except to refer to the use of the concept by other historians.
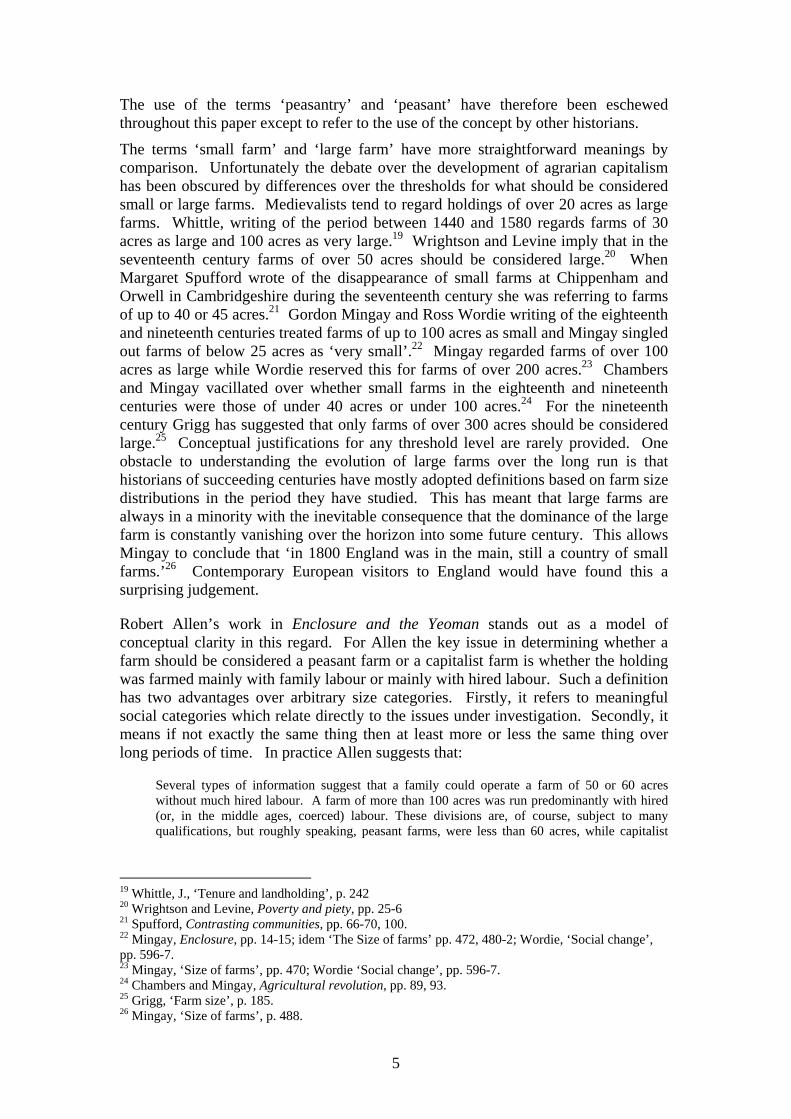
The terms ‘small farm’ and ‘large farm’ have more straightforward meanings by comparison. Unfortunately the debate over the development of agrarian capitalism has been obscured by differences over the thresholds for what should be considered small or large farms. Medievalists tend to regard holdings of over 20 acres as large farms. Whittle, writing of the period between 1440 and 1580 regards farms of 30 acres as large and 100 acres as very large.19 Wrightson and Levine imply that in the seventeenth century farms of over 50 acres should be considered large.20 When Margaret Spufford wrote of the disappearance of small farms at Chippenham and Orwell in Cambridgeshire during the seventeenth century she was referring to farms of up to 40 or 45 acres.21 Gordon Mingay and Ross Wordie writing of the eighteenth and nineteenth centuries treated farms of up to 100 acres as small and Mingay singled out farms of below 25 acres as ‘very small’.22 Mingay regarded farms of over 100 acres as large while Wordie reserved this for farms of over 200 acres.23 Chambers and Mingay vacillated over whether small farms in the eighteenth and nineteenth centuries were those of under 40 acres or under 100 acres.24 For the nineteenth century Grigg has suggested that only farms of over 300 acres should be considered large.25 Conceptual justifications for any threshold level are rarely provided. One obstacle to understanding the evolution of large farms over the long run is that historians of succeeding centuries have mostly adopted definitions based on farm size distributions in the period they have studied. This has meant that large farms are always in a minority with the inevitable consequence that the dominance of the large farm is constantly vanishing over the horizon into some future century. This allows Mingay to conclude that ‘in 1800 England was in the main, still a country of small farms.’26 Contemporary European visitors to England would have found this a surprising judgement.
Robert Allen’s work in Enclosure and the Yeoman stands out as a model of conceptual clarity in this regard. For Allen the key issue in determining whether a farm should be considered a peasant farm or a capitalist farm is whether the holding was farmed mainly with family labour or mainly with hired labour. Such a definition has two advantages over arbitrary size categories. Firstly, it refers to meaningful social categories which relate directly to the issues under investigation. Secondly, it means if not exactly the same thing then at least more or less the same thing over long periods of time. In practice Allen suggests that:
Several types of information suggest that a family could operate a farm of 50 or 60 acres without much hired labour. A farm of more than 100 acres was run predominantly with hired (or, in the middle ages, coerced) labour. These divisions are, of course, subject to many qualifications, but roughly speaking, peasant farms, were less than 60 acres, while capitalist
19 Whittle, J., ‘Tenure and landholding’, p. 242 20 Wrightson and Levine, Poverty and piety, pp. 25-6 21 Spufford, Contrasting communities, pp. 66-70, 100. 22 Mingay, Enclosure, pp. 14-15; idem ‘The Size of farms’ pp. 472, 480-2; Wordie, ‘Social change’, pp. 596-7. 23 Mingay, ‘Size of farms’, pp. 470; Wordie ‘Social change’, pp. 596-7. 24 Chambers and Mingay, Agricultural revolution, pp. 89, 93. 25 Grigg, ‘Farm size’, p. 185. 26 Mingay, ‘Size of farms’, p. 488.

6
farms were more than 100 acres. Farms of 60 to 100 acres were transitional, employing roughly equal amounts of family and hired labour.’27
Whether Allen’s size thresholds are appropriate or not is something to which we will return later.
To underpin a clear discussion of the issues we need a basic terminological framework which is capable of being applied to long periods of time in a consistent manner and which is itself internally consistent and capable of placing all agricultural holdings into one of its conceptual categories. This paper is concerned with the growth of capitalist agriculture and the decline of family farming. The conceptual categories which will be used to categorise different units of agricultural landholding are: small holding, family farm, transitional farm and capitalist farm. The way in which these terms are being used here requires definition. A small-holding should be understood to refer to a holding that was not sufficient to provide an adequate income to its holder who must therefore have had additional means of support from some other economic activity. A family farm refers to a holding large enough to support its holder, and perhaps other family members but small enough for family labour to have supplied most of the necessary labour. A capitalist farm refers to a farm sufficiently large that the majority of labour would have had to be supplied by wage labour. Transitional farms refer to those holdings on the border between family farms and capitalist farms but where it is not possible to allocate them definitively to either category. These categories refer only to the labour use characteristics of the holdings not to their degree of commercial orientation. Given the extent of commercialisation during the medieval period a high degree of commercialisation seems probable even for family farms. Whilst these are very crude definitions compared with those used by some other historians their very simplicity means it is straightforward to allocate holdings or farms to one category. Multi-element definitions, such as those employed by Whittle and on some occasions by Allen are more conceptually sophisticated but suffer from the disadvantage that many agricultural holdings cannot actually be accommodated anywhere in the scheme because one element of the definition puts them in one category whilst another element would have them defined quite differently.28 The definition used here is ideally adapted to measuring shifts in labour regime.29
II
A second outstanding feature of Allen’s study is that it contains the largest longitudinal data set yet assembled on the evolution of farm size over the early modern period. Drawing on estate surveys Allen compiled evidence on the size of units of land he describes as farms. His data set comprises 1,305 observations from the south Midlands between 1600 and 1800. Allen’s results are reproduced, in
27 Allen, Enclosure, p. 57 28 Thus on Allen’s definition large numbers of subsistence cultivators in the medieval period could not be considered as ‘peasants’ because they did not own their land. They could not, of course, be described as capitalist or intermediate producers. On Whittle’s definition on the other hand small scale but market orientated producers would be neither capitalist (since they were small scale) nor peasant (because they were market orientated). See the generally incisive discussion in Whittle, Development, pp. 10-16. 29 It could be argued that the term ‘capitalist’ should be avoided for the same reasons that the term ‘peasant’ has been eschewed. However, I have retained the term because the historiography with which this paper engages has been concerned with the rise of agrarian capitalism.

7
simplified form in table 1. The top panel shows trends in areas not yet enclosed and the bottom panel trends in areas already enclosed. The results are striking. Large-scale capitalist farms dominated in enclosed areas across the whole period. But in open-field regions farm area was split evenly between capitalist, transitional and peasant farms. By the end of the period capitalist farms were overwhelmingly dominant accounting for 85 per cent of all farmland. Allen puts it thus:
[In the early seventeenth century] Five-eighths of farms were family farms of less than 60 acres, while only one eighth were capitalist enterprises of more than one hundred acres. These large farms were probably demesnes (in terms of acreage, however, the family farm sector looks less substantial – about one third of the land was in family holdings, one third was in transitional holdings, and one third was in capitalist holdings.) 30
But a few pages later Allen describes his data rather differently:
We know from estate surveys how that land was organized. About one third of it was enclosed and divided into large capitalist farms; the rest was divided amongst small copyholders and beneficial leases. While some of these were capitalist farmers, most were not. In 1688, the peasantry of England occupied not a third of the country but closer to two-thirds. ... The eighteenth century witnessed not only change, but revolutionary change.31
However, Allen’s data do not show that one-third of the land in south Midlands was held by family farmers in the late seventeenth century. Allen’s data appear to show that in the early seventeenth century family farmers held one-third of the land, with capitalist farmers holding one-third and transitional farmers holding one third. On these data, the dominance of family farming had been broken before the beginning of the seventeenth century but agrarian capitalism had not yet achieved dominance. Again on Allen’s data, capitalist farmers held just over 50 per cent of the land in the early eighteenth century and family farmers only 25 per cent thus capitalist farming was in the ascendant at the beginning of the eighteenth century. Yet Allen uses these data to argue that seventeenth century agriculture was dominated by family farmers and that the development of agrarian capitalism was an essentially eighteenth century phenomena. But this is not what his data show, though his data do indicate a final collapse of the importance of family farming in the south Midlands during the eighteenth century.
There are three further problems with Allen’s account. Firstly, Allen’s data relate not to England but to the south Midlands and it is incorrect, as we shall see in the next section, to assume that the south Midlands was typical of England as a whole. Secondly, Allen’s view that farms below sixty acres were farmed with little recourse to wage labour is not sustainable. Thirdly, it is not clear that Allen’s data are a reliable guide to the evolution of farm size in the south Midlands. Fourthly, there are other data which tell a quite different and much more compelling story. The first two issues are discussed in sections four and five whilst the last is examined in sections six to nine.
III
Figure 1 shows the average farm size for every English county in 1851. The data underlying this figure derive from the published census report. The reliability of
30 Allen, Enclosure, p. 74 31 Allen, Enclosure, p. 85. My italics.
8
these data have been discussed elsewhere.32 It is immediately apparent that farm sizes varied considerably between different parts of the country. Average farm size in England as a whole in 1851 was 115 acres. The south Midlands were characterised by somewhat larger farms with an average figure typically around 170 acres. But in the north west and the far south-west much smaller farms prevailed with average figures often less than 70 acres.
The relative importance of family farms and capitalist farms varied even more because the scale of farm operations tended to be largest where cultivation was most intense and smallest where cultivation was least intense. In other words capitalist farms tended to be more important in areas characterised by good soils and hence more intensive cultivation while family farms tended to be more important in areas of poor soils characterised by less intensive agriculture. The census allows us to establish lower bound figures for the employment of adult males on census day which was the 31st March in 1851. Farms not employing anyone on census day, though they may have employed some hired labour at busier periods in the agricultural year, are likely to have been family farms. Figure 2 shows the percentage of farmland in farms reporting no employment on that day. In south-eastern England, south and east of a line from Dorset to the Wash, family farms were of minimal importance. With the exception of Cambridgeshire (presumably on account of the fens) such farms nowhere accounted for more than 5 per cent of the farmland. In much of northern England family farms remained important and farms employing no adult males on census day accounted for around one-third of all farm land. Everywhere else the proportion of land in such family farms lay between seven and nineteen percent. If family farms still survived in such strength in northern England in the middle of the nineteenth century they are unlikely to have been eliminated during the eighteenth century. Across much of the south Midlands family farms were less important than anywhere else in the country.
Conversely figure 3 shows the proportion of land in capitalist farms, taken as those employing two or more men on census day.33 Such farms were absolutely dominant south and east of line from the western end of Dorset to the Wash where they typically accounted for 95 per cent of all farmland. In the north west such farms were important but not dominant typically accounting for around half of all farmland. Capitalist farms occupied the overwhelming bulk of farmland in the south Midlands but not in all parts of the country.
The south Midlands was not representative of the whole country in 1851 in terms of either farm sizes or farm employment characteristics. Nor can we be sure that counties that looked similar in 1851 arrived at that position along the same chronological trajectories. It is clear that it is fundamentally improbable that the development of agrarian capitalism in the south Midlands typified England as a whole.
IV
The 1851 census material also allows us to examine the assumption that farms of up to sixty acres could be farmed without recourse to much hired labour and that full
32 Shaw-Taylor, ‘Family farms.’ 33 The argument underlying this choice of employment thresholds has been set out elsewhere. Ibid.

9
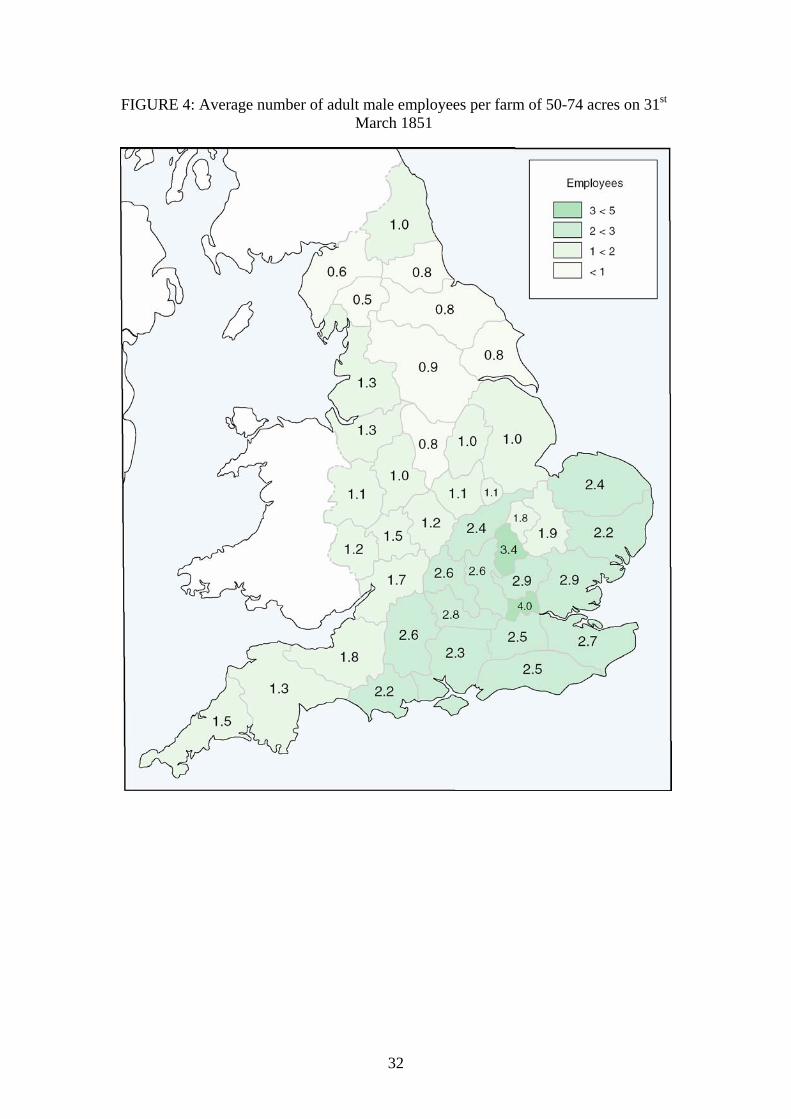
dependence on hired labour only kicked in on farms of one hundred acres and above. Figure 4 shows the average numbers of adult male waged employees reported on farms of between 50 and 74 acres on census day 1851 for every county in England. This size category straddles the upper end of Allen’s ‘peasant’ category and the lower end of his transitional category. It is immediately apparent that the amount of hired labour needed on farms in this size category varied very considerably around the country. The highest figure was in Middlesex where employment on such farms averaged four adult males. It is likely that this particularly intense labour usage relates to the proximity to London. The lowest figure was in Westmorland where farms of the same size category averaged only half an employee. With employment per acre varying by a factor of eight between the most and least intensively farmed counties it is obvious that a single set of acreage thresholds cannot meaningfully be used to predict the employment characteristics of farms across the whole country.
The average number of adult males employed per farm of 50-74 acres in Allen’s south Midlands was 2.1. This is a much higher figure than might be expected if farms of up to 60 acres were operated without ‘recourse to much hired labour.’ The average amount of male family labour per farm, according to the census was around 1.5. So farms of 50-74 acres were typically deploying more hired adult male than adult male family labour on census day. Census day in 1851 was March 31st. This was not a busy time of the agricultural year and many labourers were not reported as being employed in agriculture on that day. At busy times of year the ratio of employed to family adult male labour would have been higher.34 The south Midland farms in this size interval do not therefore appear to be on the boundary between family farms and transitional farms but on the boundary between transitional and capitalist farms.
Figure 5 shows the average number of adult males reported as being employed on farms of between 40 and 50 acres on 31st March 1851 for each English county. Again there is considerable variation with the employment levels varying by a factor of 8 between Westmorland and Hertfordshire. According to Allen, farms of 50 to 60 acres could be run ‘without much hired labour.’35 But on Census day in 1851 the average employment level on farms of 40 to 50 acres in the south Midlands was 1.6 adult males.
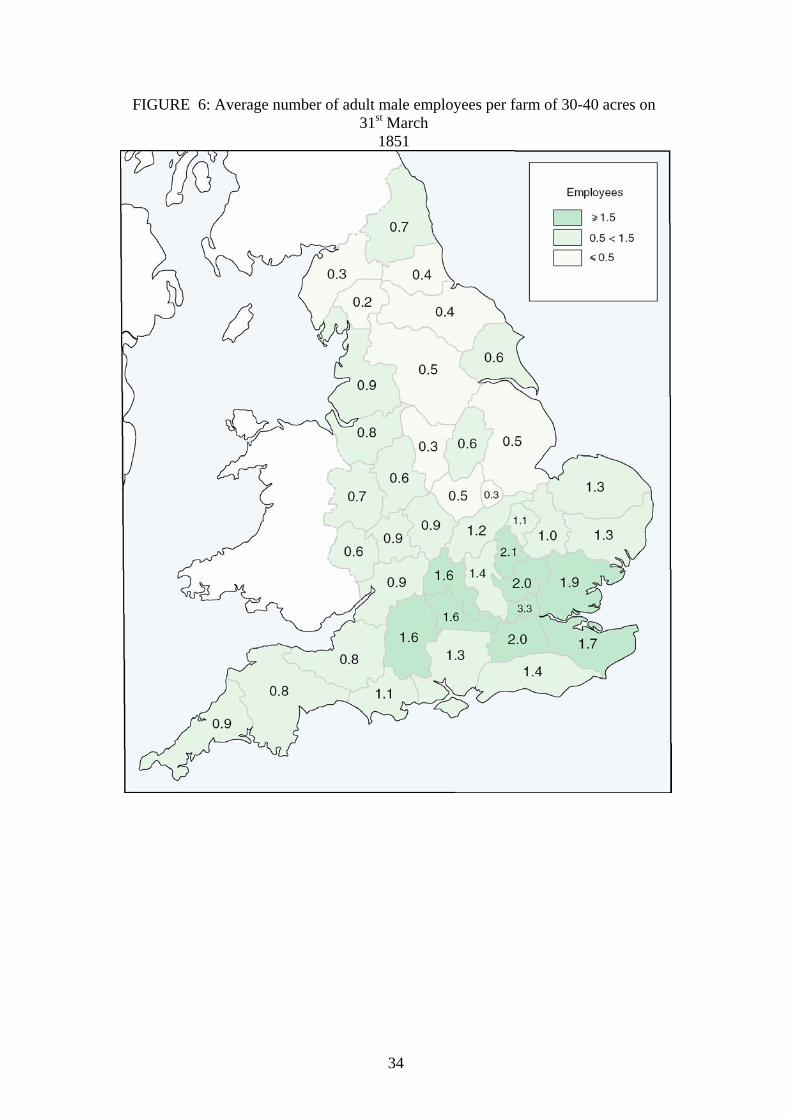
Figure 6 shows the average number of adult males reported as being employed on farms of between 30 and 40 acres on 31st March 1851 for each English county. Even on such small farms, well below the upper limit of Allen’s ‘peasant farms’, most south Midland farmers depended heavily on hired labour, reporting an average of 1.2 adult males employed on the 31st March. Such farms were certainly not being run without hired labour though they should perhaps be considered transitional rather than capitalist since it is not clear that hired labour would have exceeded family labour over the course of the year. On farms of between 20 and 30 acres in the south Midlands an average of 0.9 adult males were employed on 31st March 1851.
On the basis of these data it would seem that Allen seriously over-estimates the size of south Midland farms that could be run with family labour at least in the middle of the nineteenth century. Allen believes that the 60 acre threshold for family farms holds good over the period from the middle ages right through to the early twentieth century.36 But south Midland farms of 30 to 60 acres could clearly not be run without 34 For a rather fuller discussion of this issue see, Ibid. 35 Allen, Enclosure, p. 57. 36 Allen, Enclosure, pp. 57-58.

10
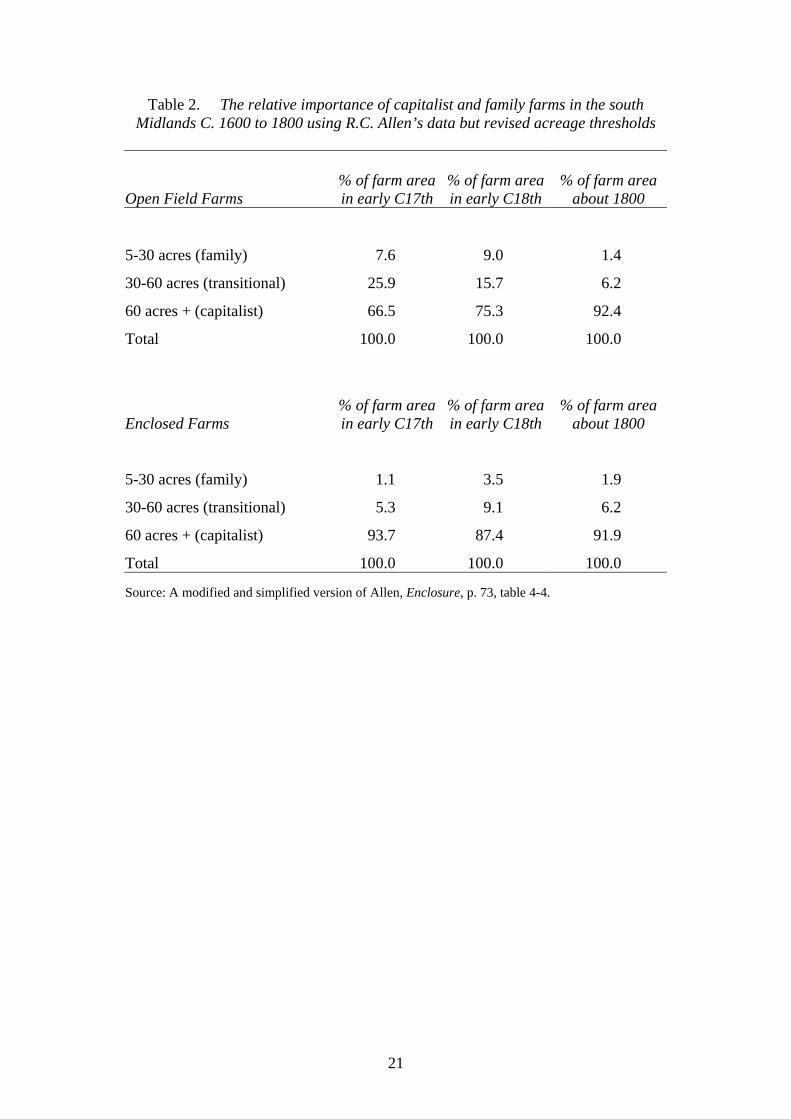
considerable wage labour in the middle of the nineteenth century. Whether farms needed more or less labour per acre in the seventeenth and eighteenth centuries than they did in the mid nineteenth century is difficult to assess. On the one hand the labouring population reached its peak in the mid nineteenth century. On the other hand the arable acreage is estimated to have been about 70 per cent greater in 1850 than it had been in 1700.37 If we follow Allen and suppose that labour requirements per acre were constant over time but conservatively revise the upper limit of a family farm in the south Midlands from 60 acres to 30 acres and the upper limit of a transitional farm from 100 acres to 60 acres we can apply these to Allen’s farm size data to produce a revised account of the growth of capitalist farming in the south Midlands. Table 2 shows the results. This tentative revision of Allen’s thresholds reveals a very different story.
Table 2 suggests that family farming was of only marginal importance even in the early seventeenth century. At this early date over two-thirds of all farm-land in the south Midlands lay in capitalist labour-employing farms. The importance of such farms increased over the course of the seventeenth and eighteenth centuries and they accounted for over 90 per cent of all farmland in the south Midlands by 1800. Family farms survived at stable but low levels across the seventeenth century but were virtually eliminated during the eighteenth century in a pale echo of Allen’s account of the destruction of a previously dominant peasant sector over the same period. Transitional farms declined steadily in importance over both the seventeenth and eighteenth centuries. Whether such an interpretation of Allen’s data is appropriate or not depends on how accurate these acreage thresholds are over the seventeenth and eighteenth centuries. Without better direct evidence no certainty is possible on this point.
V
There is also a serious question as to the reliability of Allen’s dataset as an account of the development of farm size in the south Midlands. It is not clear whether the units of land represented in Allen’s dataset were actually farms or units of ownership. This is a fundamentally important problem which Allen’s data share with virtually all studies of the growth of farm size over the early modern period.38
Allen’s data are derived from estate surveys covering three tenurial categories of land: demesnes, leaseholds and copyhold.39 The relative weight of these three categories in Allen’s sample is not stated. It is critically important however, because copyhold land could be sublet by the manorial tenants enumerated in the estate surveys. Copyhold tenures in the seventeenth, eighteenth and nineteenth centuries were, as Allen himself has argued, essentially units of ownership. Although the owners of copyholds were legally tenants of the manor they were free to sell or sublet their tenancies. Thus any manorial survey of copyhold lands is not a survey of farming units but of ownership units. Where copyholds were in owner occupation this distinction would be irrelevant. Of course some copyhold land was in owner occupation. If all land or the great bulk of it were in owner occupation then the 37 Allen, ‘Agriculture’; Overton, Agricultural revolution, p. 76. 38 This is probably not true of studies of aristocratic and gentry estates dominated by leasehold farms such as those by Wordie, Mingay and Broad. Of these, though, only Broad’s study reaches back into the seventeenth century: Wordie, ‘Social change’; Mingay ‘Size of farms’; Broad, Transforming. 39 For a clear introductory account of copyhold’s characteristics see Allen, Enclosure, pp. 66-72. For fuller discussions see Hoyle, ‘Tenure’ and Whittle, ‘Tenure and landholding’, p. 241.
11
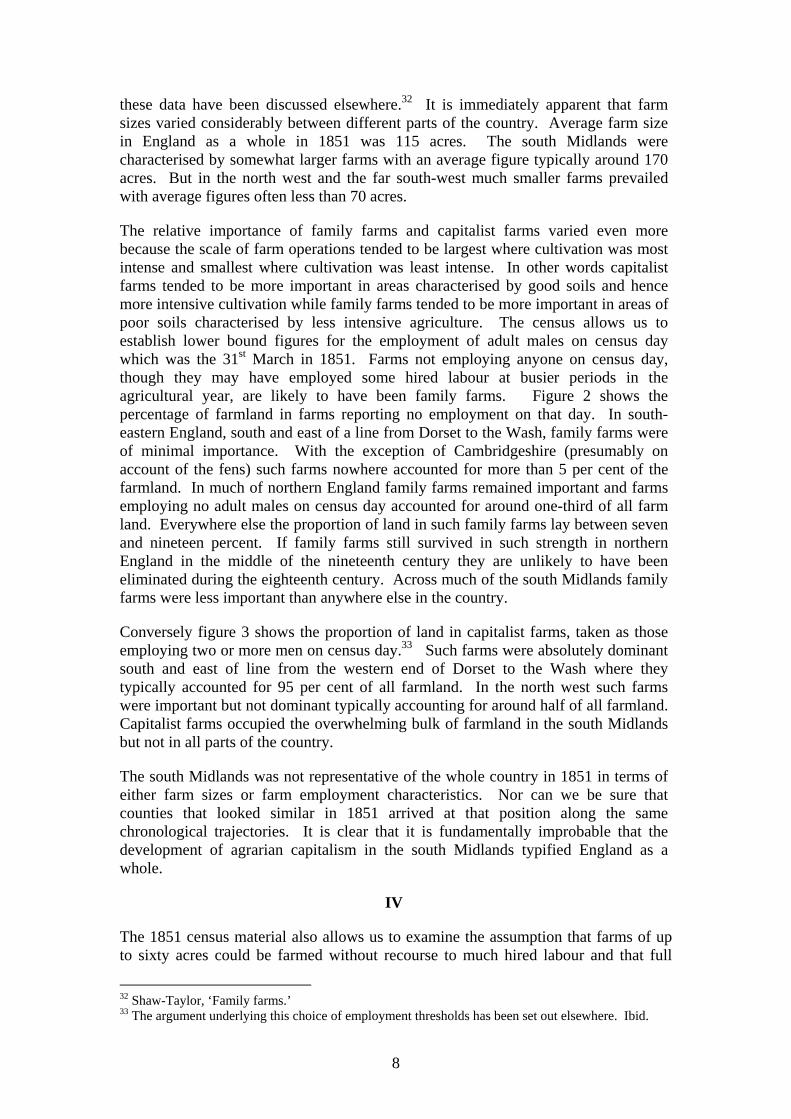
problems would be minor. But there is no a priori reason to assume that this was so. By the 1780s the surviving land-tax assessments allow ownership and occupation to be distinguished. Perhaps eighty per cent of land was occupied by tenant farmers, not owner-occupiers.40 There is no a priori reason to think that in the 1780s this was a very recent development. Moreover, on the rare occasions when sub-tenancy can be documented in earlier periods the evidence suggests it was widespread.
In the course of research on Cannock in Staffordshire during the sixteenth century C.J. Harrison came across an unusual manorial survey of 1554. The distinctive feature of this survey was that it listed both the manorial tenants and the actual occupiers. The survey revealed fifty-two tenants but seventy-three farmers. Sixteen of the fifty-two tenants sublet all their land. Of the seventy-three farmers, thirty-seven men had farms composed entirely of sublet land. If such discrepancies were widespread the historiographical implications are potentially far reaching.
Chibnall’s study of Sherington in Buckinghamshire showed that as early as 1650 the village had very low levels of owner-occupation and significant levels of sub-tenancy.41 Over the subsequent century the dominance of tenant farming increased still further.42 The year following Harrison’s paper, Marjorie McIntosh published a paper based on two manorial extents of the Royal Manor of Havering in Essex from 1251 and 1352/3. These surveys partially document sub-tenancy because the sub-tenants owed a small service to the King. In 1251 there were 254 customary tenants and at least a further 113 persons holding land as sub-tenants. In 1452/3 there were 192 tenants and 301 people who were sub-tenants only. The paper does not document the proportion of the land held in sub-tenancies.43
On the whole Harrison’s work has been ignored. Allen confronts it head-on and offers the following critique of Harrison’s work:
Harrison (1979) has argued that estate surveys give a highly distorted picture of the rural population since they ignore subtenancy. The conclusion is based on a unique field book of Cannock, Staffs, made in 1554, that distinguished manorial tenants from the actual occupiers. There was also a 1570 survey with which it could be compared. Harrison showed that there were many more occupiers than manorial tenants in Cannock. However, the size distribution he provides shows that most of the surplus was found in the smallest category (zero to 9 acres). The surplus were landless labourers who rented their cottages. Moreover, if we consider the farms with more than ten acres (which comprised most of the land), the average size was the same in all three sources – 51 acres for the 1554 list of occupations [sic] 56 acres for the 1554 list of manorial tenants, and 55 acres for the 1570 survey of manorial tenants. Relying on the surveys is, therefore, not misleading about the average size of a farm.44
The leap from the particular to the general in the last sentence is highly problematic. Harrison’s work establishes the possibility that sub-tenancy could be widespread at an early date. The fact that in this particular case in mid-sixteenth century Staffordshire the average size of farming units matched the average size of ownership units is not a sufficient reason for supposing that this fortuitous coincidence would be repeated all over the country for the following quarter of a millenium. The sub-tenancy problem plagues almost all studies of early modern land-holding in England.
40 Allen, Enclosure, p. 84; Overton, Agricultural revolution, p. 168; Thompson, ‘Social distribution’, p. 513; Clay, Economic expansion, pp. 142-143. 41 Chibnall, Sherington, pp. 196-197. 42 Ibid., p. 207. 43 McIntosh, ‘Land, tenure and population’. 44 Allen, Enclosure, pp. 75-76, fn 26, my italics.
12
Essentially sources which document units of ownership have been treated as if they documented farming units.
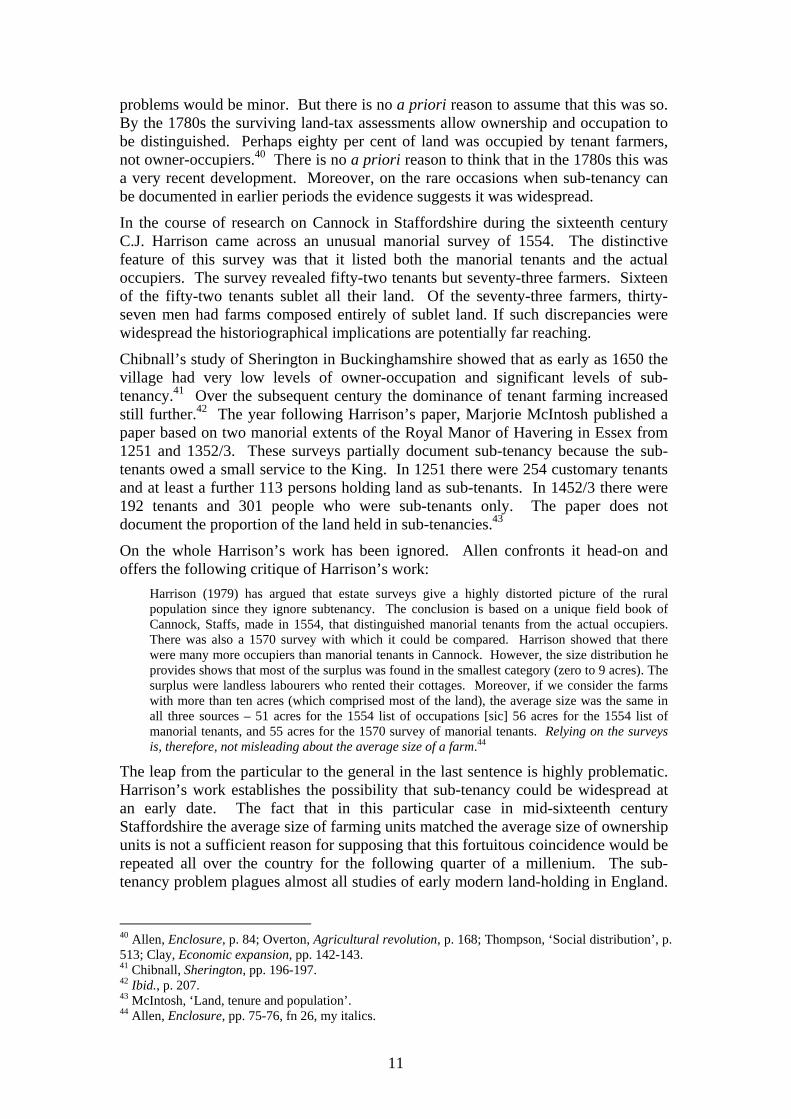
Studies of farm size before the late eighteenth century which are not based on sources suffering from the sub-tenancy problem are exceptionally rare. Recently Stephen Hipkin published two articles on land occupation in the Romney Marsh region of Kent between the late sixteenth and the early nineteenth century.45 Romney marsh required considerable drainage. The responsibility for this lay with the Commission for Sewers which levied a rate on all occupiers of land. Their surveys therefore record who occupied land rather than who owned it, though sometimes they recorded both. When they recorded both there were massive discrepancies between farming units and ownership units with a relatively small group of large tenants renting land from numerous small landowners.
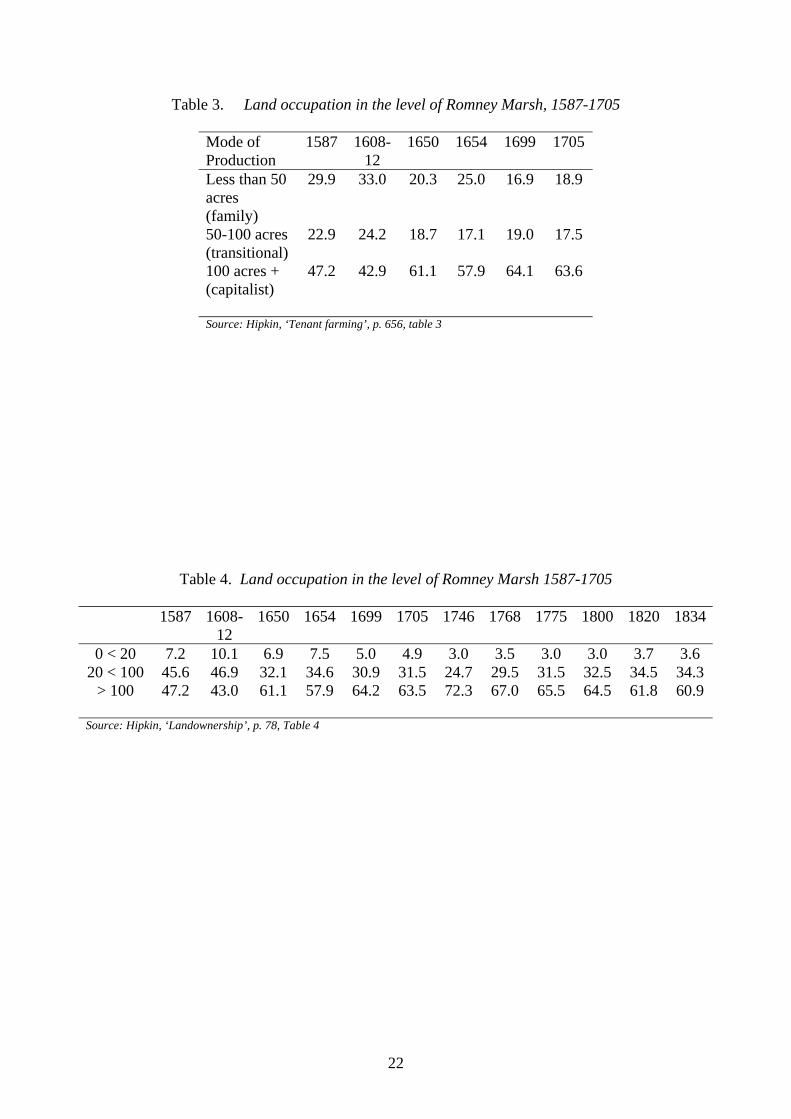
Table 3 shows Hipkin’s data on farm size on the level of Romney Marsh from 1587 to 1705 using Allen’s thresholds.46 If one uses Allen’s size intervals then family farms occupied only one-third of the land at the beginning of the seventeenth century and only about one fifth by its end. On this account family farms were a minor feature of the agrarian landscape by the beginning of the eighteenth century. On more realistic notions of what size of farm constituted a family farm, family farms were probably of minor importance as early as 1600 and a residual element of the landscape by 1700. Although the seventeenth century witnessed a decline in the importance of small farms on Romney Marsh table 4 indicates that there was remarkably little change in farm size distribution between the end of the seventeenth century and the middle of the nineteenth century.47
But, as Hipkin is at pains to point out, Romney Marsh although much larger than a single village is not a representative sample of England. And of course it was, in various respects, an inherently unusual environment. Unfortunately the source material that Hipkin used for Romney Marsh may be unique. If similar sources exist elsewhere they are likely to be restricted to areas of fen and marshland which are therefore also unlikely to be representative of the country as a whole.48 However, there are two categories of source material which might be used instead of manorial surveys in local studies to chart changes in farm size over time. Both tithes and poor rates were levies on the actual occupiers of land. Poor rate and tithe records can therefore be used to reconstruct farm sizes with a degree of confidence which cannot be vested in manorial surveys. However, one limitation of such sources needs to be acknowledged. They will only provide information about the size of holdings within a single parish. Any farmer with land in more than one parish will appear to have a smaller farm than was actually the case. Although this means that rate books and tithe accounts may not provide absolutely accurate pictures of farm size they should pick up changes over time in a reasonably satisfactory manner. Both suitable poor rate books and tithe accounts probably exist in significant numbers and should be capable of yielding farm size data for many parts of the country over the early modern period.
45 Hipkin, ‘Tenant farming’; idem, ‘The structure of landownership’. 46 Family farms have been taken as up to 50 acres (rather than 60) to accommodate the intervals in which Hipkin published the data. 47 The intervals used in table 4 were determined by the intervals Hipkin used to publish data from 1746 onwards. 48 Similar sources do not appear to exist for the Cambridgeshire Fens, Barker, ‘A reconsideration’, p. 15-17.

13
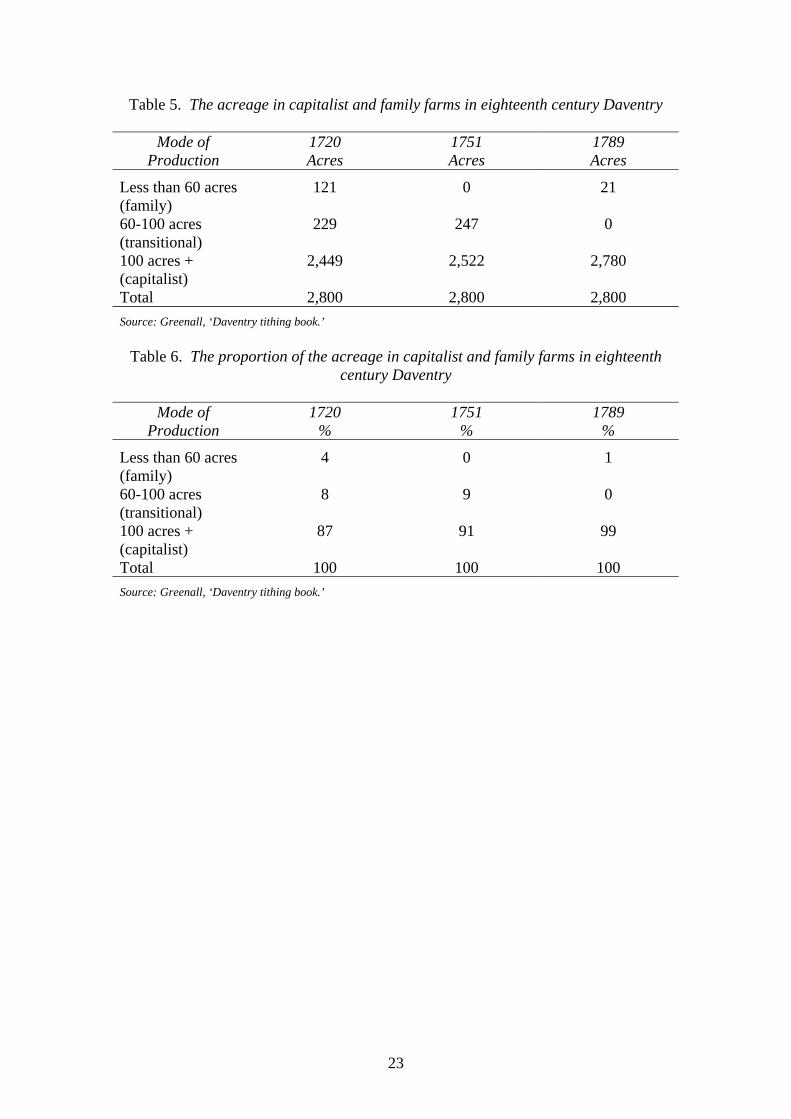
Tables 5 and 6 shows the farm size distribution for Daventry in Northamptonshire reconstructed from the extant tithe accounts. Even if one uses Allen’s farm size thresholds, family farms here, as on Romney Marsh, were a purely residual feature of the agrarian social structure by the beginning of the eighteenth century. Capitalist farms accounted for 87 per cent of the farm area at the beginning of the eighteenth century and increased their dominance to 99 per cent by the end of the century. Again if one were to use more appropriate thresholds the degree of capitalist dominance would be accentuated. Northamptonshire is, of course, in the heart of Allen’s south Midland region and the farms here are considerably larger than those he considers typical of the south Midlands on the basis of estate surveys. However, farms in Daventry were probably larger than in Northamptonshire as a whole. The average farm size in Daventry in 1789 was 233 acres, some 30 per cent higher than the county average in 1851. Nonetheless, it remains striking, that in the only open-field settlement in the south Midlands for which accurate farm sizes can, at present, be constructed, agrarian capitalism was already dominant at the opening of the eighteenth century.49
VI
The great difficulty of confronting the sub-tenancy problem means that at present we do not have a significant body of reliable data on the distribution of farm sizes for the eighteenth century, the early modern period or the medieval period. Whilst much very useful data may eventually be acquired from tithe documents and possibly from poor-rate assessments we are unlikely to ever acquire the kind of data which will allow us to map the distribution of farm sizes over space and time with a satisfactory level of precision. Even if we could there would remain very serious problems about the sizes of farms which should be categorised as family farms and capitalist farms in different regions at different times. But if what we are really interested in is the development of agrarian capitalism rather than the more abstract growth of ‘large’ farms then the problem may be sidestepped relatively easily, at least for the period after 1550. If what we really want to know is the relative numerical importance of individuals running their own farms compared with the size of the farm work-force then we can count the numbers of people in these categories. Such data are much more widely available than good data on farm sizes are every likely to be. In any pre-census source recording male occupations, individuals running farms are generally described as farmers, yeomen or husbandmen and less commonly as dairymen or graziers. Those who work for them are generally described as labourers, husbandmen or servants. The uncertainty over the meaning of the term ‘husbandman’ which was sometimes used to mean farmer and sometimes used to mean labourer is a major obstacle to the use of occupational descriptors in the early modern period. But it is not an insuperable obstacle because it is often possible to work out how the term was being used in particular local contexts.
When the ratio of farm workers to farmers is less than one farming may reasonably be characterised as dominated by family farms. Once it rises above this level and a majority of those working in agriculture are proletarian this is no longer the case. At what level one decides to label agriculture as ‘capitalist’ rather than transitional is a
49 Reliable data are also available for the enclosed estate village of Middle Claydon in Buckinghamshire where three-quarters of farmland was in farms of over 50 acres in 1688. Broad, Transforming, p. 140.

14
matter of taste. For present purposes any ratio above two to one will be treated as capitalist.
VII
The 1851 Census allows us to map the situation in the mid nineteenth century in some considerable detail. Figure 7 shows the ratio of male farmworkers (labourers, shepherds and agricultural servants) to farmers (farmers and graziers) for each English county. The regional contrasts are profound and correspond closely with those shown in figures 2 to 6. Everywhere south and east of a line from Dorset to the Wash the ratio of farmworkers to farmers exceeded 7 to 1. In the counties clustering around the Pennines and in Cornwall the ratio was below 3 to 1. In Northumberland and a band of counties from Devon in the south-west to the East Riding in the north-east the ratios ranged from a low of 3.7 to a high of 6.5. This confirms the picture painted by figures 1 to 6 that the south-east, generously defined, was dominated by large-scale agrarian capitalism while the Pennine counties and the far south-west were characterised by a mixture of family farms and small scale agrarian capitalism. In the rest of the country medium size capitalist operations predominated. The geography of agrarian capitalism in the mid nineteenth century is both clear and striking.50 But how long had these regional contrasts been in existence? The rest of this paper will examine some rather more patchy data available from the late seventeenth and early eighteenth centuries that allow a preliminary answer to this question.
VIII
Under the terms of Rose’s Act it became a legal requirement to record the occupation of fathers in Anglican baptism registers from 1813. At this date around 90 per cent of men married and the vast majority of these would have produced children.51 Such evidence as there is suggests that any differences in fertility between occupational groups remained muted over the period with which we are concerned here.52 Thus baptism registers from 1813 onwards can be used to generate snapshots of the occupational structure of more or less any parish in England and Wales. However, although it was not a legal requirement before 1813 some parishes and chapelries nevertheless chose to record the fathers’ occupation when recording a baptism.
It is fortunate for present purposes that many parishes in Bedfordshire recorded fathers’ occupations in their baptism registers in the late seventeenth and early eighteenth centuries. As Figure 7 shows, in 1851 Bedfordshire had 12.2 male farm workers to every farmer, making it the second most capitalistic county in the country. Table seven shows the ratios of farm workers to farmers recorded in the baptism registers of 26 rural parishes where 95 per cent of more or legitimate baptisms recorded an occupational descriptor for the father.53
At parish level there was considerable variation in farm worker to farmer ratios ranging from a low of 0.9 to a high of 5.3. This should not be surprising. 50 A more detailed discussion of these patterns can be found in Shaw-Taylor, ‘Family farms.’ 51 Wrigley and Schofield, Population history, p. 260. 52 Wrigley et al, English population, pp. 427-9. 53 Where the child was illegitimate the fathers’ occupations were not recoded. Parish registers where less than 95 per cent of legitimate births record the father’s occupation have been rejected.
15
Agricultural labour markets operated across parish boundaries. The system of open and closed parishes ensured that many agricultural labourers had to cross parish boundaries to find work each day.54 It therefore follows that farm worker to farmer ratios are not likely to be a reliable indicator of agrarian capitalism at the parish level. However, these ratios should be a good indicator at a somewhat more aggregated spatial level. Table 7 suggests that in Bedfordshire as a whole there were around 2.9 farm workers to every farmer at the beginning of the eighteenth century. Thus it would appear that agrarian capitalism was already dominant in Bedfordshire by the end of the seventeenth century.
Elsewhere in the south-eastern region that was characterised by large scale agrarian capitalism in the mid nineteenth century, only more scattered data are available at present. All the currently available data for this region are summarised in table 8. Again it should be emphasised that no significance should be attached to parish level observations. Table 8 suggests a farm worker farmer to ratio of around two and a half to one for the rest of south-eastern England around 1700. Whilst somewhat lower than the ratios prevailing in Bedfordshire in the early eighteenth century these data nevertheless also suggests the dominance of agrarian capitalism at the end of the seventeenth and the opening of the eighteenth century.
The first five lines in table 8 summarise data from parish listings. As such all labourers, farm servants and farmers, regardless of age or marital status are included. In contrast the baptismal data in the rest of the table relate only to married men and thus exclude farm servants. By this date the great majority of farm servants would have been men who upon marriage became farm workers. The baptismal data thus excludes the younger part of the farm workforce. Equally however, the data exclude young unmarried farmers as well. The ratios derived from listings which include servants and from baptism registers which do not are broadly similar to each other suggesting that each source provides a reliable guide to worker employer ratios. But if this is an over-optimistic assessment of the data it should be remembered that any under-recording of the farm work-force in the baptism data would simply lead to an understatement of the scale of agrarian capitalism.
It is worth noting that all of those described as husbandmen in the south-east have been treated as farmers rather than farm workers. Whilst in general this will be correct it is likely that some of these individuals were in fact agricultural labourers.55 The more this was the case the more the data presented in tables 7 and 8 understate the importance of agrarian capitalism in this region around 1700. In due course it may be possible to collect much more data and this would add considerable detail to the geography of agrarian capitalism in the early eighteenth century, but it is most unlikely that it would alter the basic story being told here. Further data on the period before 1700 may, however, reveal the key period of transition during the sixteenth and seventeenth centuries.
IX
54 Holderness, ‘“Open” and “close” parishes’; Song, ‘Landed interest’; Broad, Transforming, pp. 252-63, 272-4. 55 Alexandra Shepard found that around Lewes in East Sussex appearing before the Lewes Archdeaconry court in the period 1580-1640 who stated their occupation as ‘husbandmen’ nevertheless made it clear that they earned their living as day-labourers. Personal communication from Dr Shepard.
16
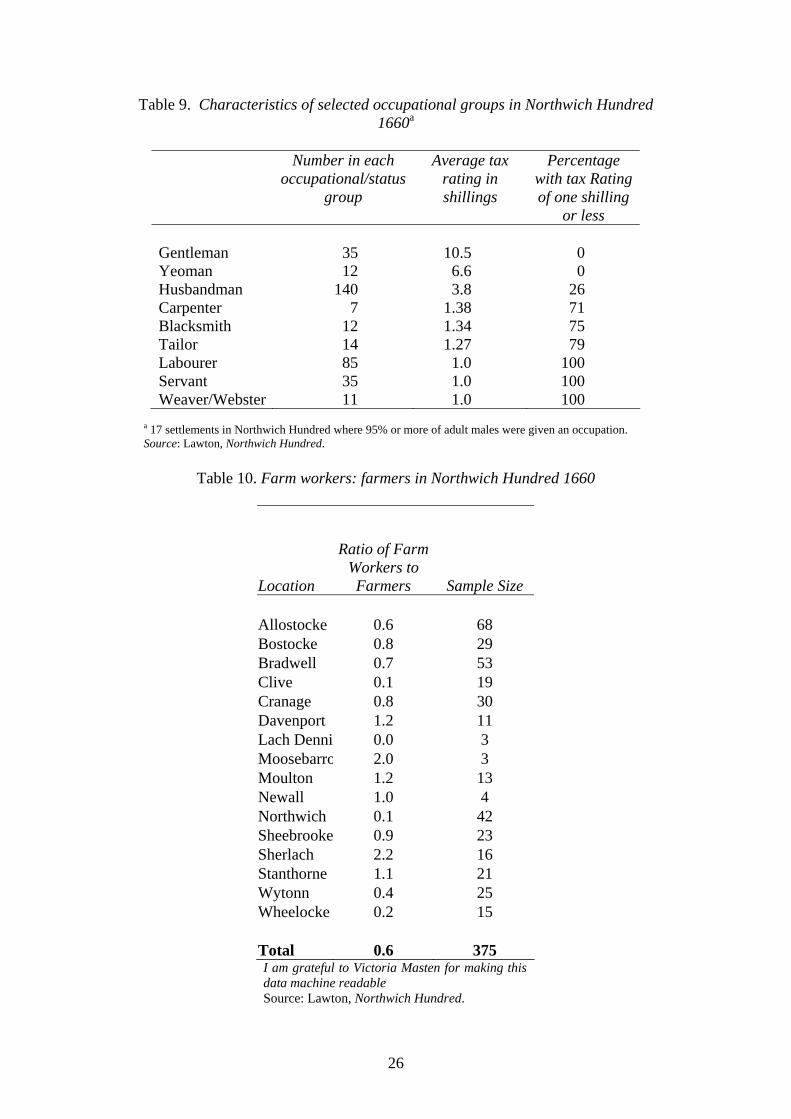
The survival of a 1660 poll tax return for the hundred of Northwich in Cheshire provides an opportunity to investigate the structure of agrarian social relations in the north-west in the late seventeenth century.56 All individuals of 16 years and over were liable to be taxed. Individuals without significant property were to be taxed at the rate of one shilling if they were single and at half that rate (six pence) if they were married. Individuals who had property (either in land or stocks of goods) were to be taxed at the rate of one shilling per five pounds of annual value. Property with an annual value of less than five pounds per year was not taxed. Where occupations were systematically recorded, as in parts of Northwich Hundred, this allows an examination of the property value characteristics of different occupational groups which sheds light on the meanings we should attribute to the terms yeoman, husbandman and labourer. In seventeen of the sixty-one distinct locations covered by the 1660 Northwich Poll Tax 95 per cent or more or men were ascribed an occupation or status descriptor.57 The characteristics of the largest occupational and status groups in these settlements are summarised in table 9.
There were 85 individuals described as labourers in these seventeen settlements. All of them were taxed at either six pence or one shilling depending on their marital status.58 Not one of them was taxed on property.59 In contrast the 140 Husbandmen were taxed an average 3.8 shillings. It is clear that in general husbandmen were a distinct social group from labourers holding significant amounts of taxable land. In other words, in this area in this period the term husbandman generally denoted farmer rather than labourer. However, some 26 per cent of those described as husbandmen were taxed at six pence or one shilling attracting no tax on property. It could be that these husbandmen were labourers rather than farmers. However, smaller farms, with annual values of £5 or less attracted no tax on property so it seems likely that most of these husbandmen were simply smaller farmers paying no tax, though they may have engaged in some day labouring. There were only 12 yeomen, less than one tenth of the number of husbandmen. Their average tax rate was nearly twice as high which suggests that the term yeoman was used by some of the larger farmers – though there were plenty of husbandmen assessed for similar or indeed higher amounts. In other words husbandman was the preferred local term for farmers of all sizes but some larger farmers favoured the term yeoman. Unsurprisingly gentlemen were richer than either yeomen or husbandmen. Three-quarters of blacksmiths, carpenters and tailors were assessed at the minimum rate of one shilling, though the remainder were assessed at somewhat higher levels. Weavers and servants universally shared the propertyless characteristics of labourers.
If we assume that those described as husbandmen and yeomen were basically farmers whilst those described as labourers and servants made up the farm workforce then we end up with 152 male farmers and 120 male farm workers over 16. The results are set out in table 9. With a ratio of 0.8 farm workers to farmers, family farms clearly dominated the local economy. This may somewhat understate the real ratio since some, or even most of the servants may in fact have been domestic servants and a
56 This is conveniently published in Lawton, ed. Northwich Hundred. 57 As before sources with less than 95% occupational coverage have been rejected. 58 In practice the tax amounts listed against the names of labourers was almost always one shilling because married women were listed on the same line as their husbands and their taxes were added together. 59 This was true of all 534 men described as labourers across the entire hundred.

17
few of the labourers may have worked outside agriculture so this figure will overestimate the size of the farm workforce. Furthermore some of the 35 men enumerated as gentleman were no doubt actively farming. However, if many of the husbandmen were in fact labourers, and table nine suggests that this could be a plausible interpretation for up to one quarter of husbandmen, then the dominance of family farming would be somewhat weakened.
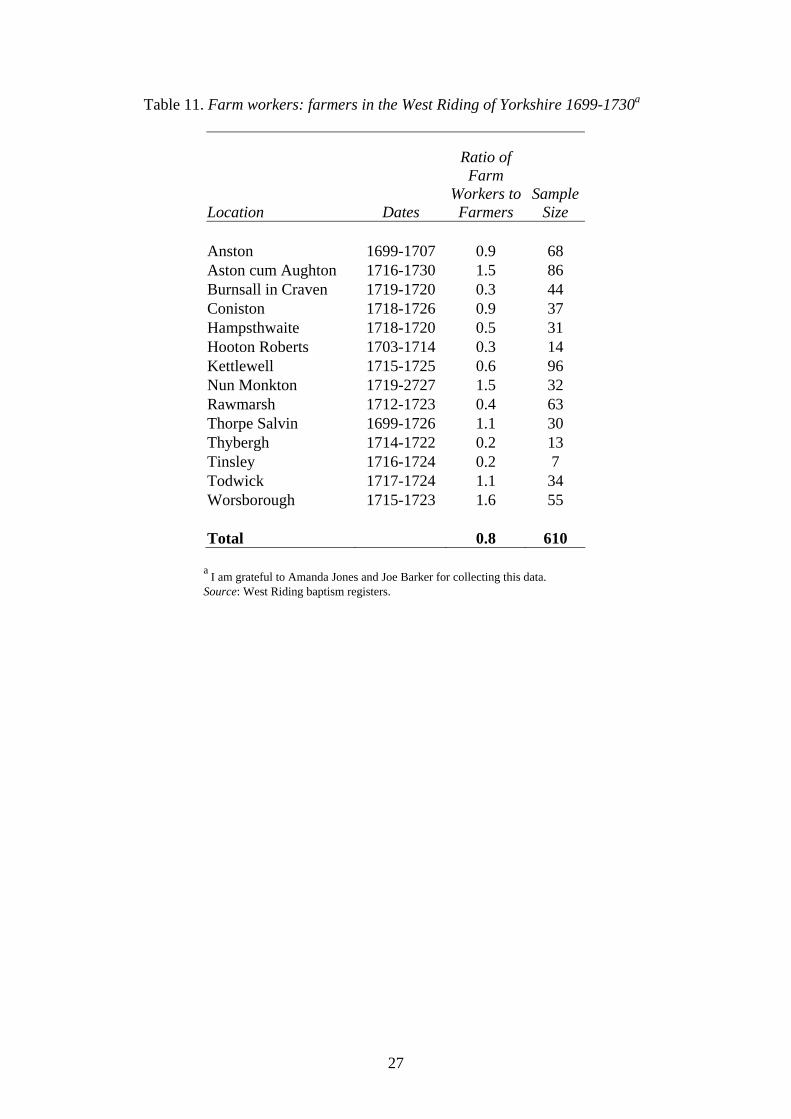
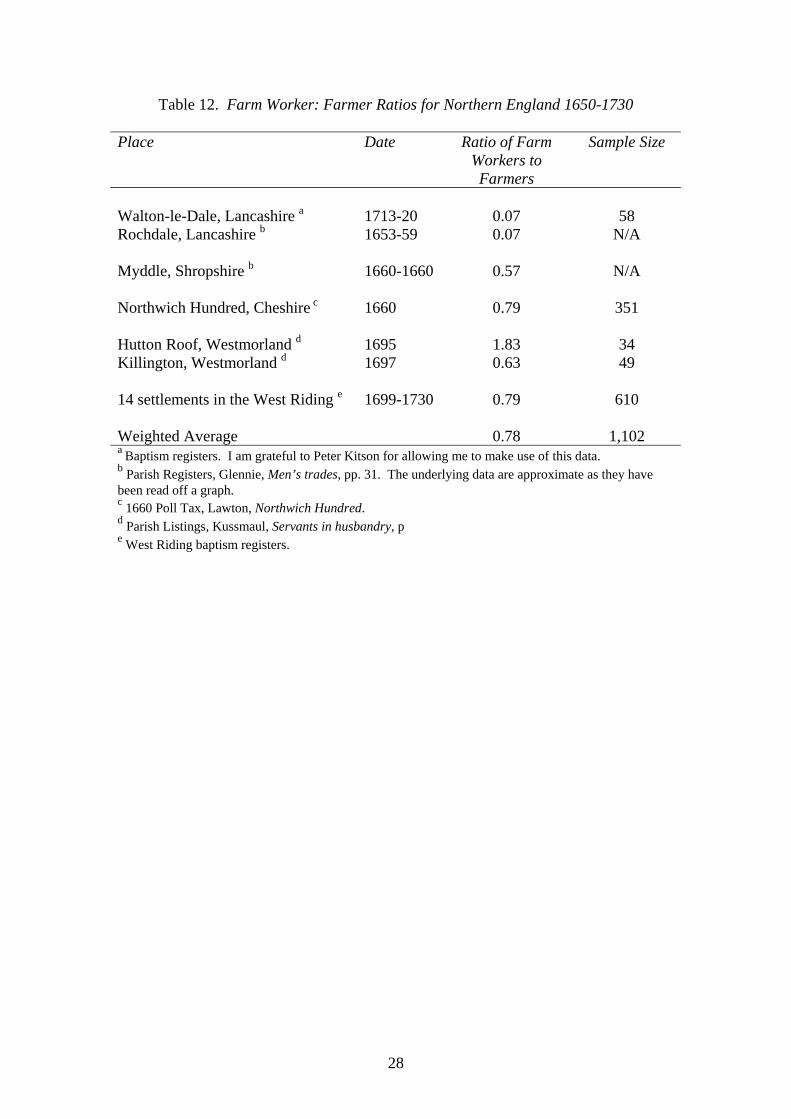
Table 11 shows baptismal data from 14 chapelries and parishes in the West Riding of Yorkshire between 1699 and 1730. Again there was much local variation but the average ratio was 0.8. Table 12 summarises the currently available data for those parts of northern England where family farms remained strong in 1851. Outside of Cheshire and the West Riding the amount of data is small but suggestive. On present evidence it would appear that family farming continued to be the dominant force in north-western agriculture at the beginning of the eighteenth century. However, even here it should be noted that the numbers of labourers were such that agrarian capitalism cannot have been absent. In short the growth of agrarian capitalism was already underway but it had not yet become dominant. However, if a substantial proportion of those described as husbandman were in fact earning a living primarily as wage labourers then the balance between family farming and capitalist farming would shift in the direction of agrarian capitalism.
X
Much more data will be needed before the decline of family farms and the concomitant rise to dominance of agrarian capitalism can be charted in full. But the occupational data necessary for that task exist in considerable abundance. Once a large body of suitable occupational data has been assembled it will be possible to trace both the geography and the chronology of development over several centuries in considerable detail. Even then we will be a long way from having the full story for such datasets can map geography and measure change over time but, on their own, they provide only indirect evidence as to the underlying causal mechanisms, though a clearer understanding of the timing and geography of change rules out some explanations of change whilst supporting others.
In the meantime some basic aspects of the story appear clear. By the middle of the nineteenth century agrarian capitalism and family farming had very distinctive regional geographies as mapped in figures 2, 3 and 7. Agrarian capitalism was more important than family farming everywhere. In the south-east, broadly defined, agrarian capitalism was utterly dominant and was practiced on a relatively large scale while family farming was almost insignificant. But across a broad swathe of northern England family farming survived in strength and in parts of the north-west came close to rivalling capitalist farming in importance. In those northern areas where family farming remained strong the scale of agrarian capitalism was more modest. In the rest of the country, Cornwall aside, family farming was of minor importance and agrarian capitalism was of an intermediate scale.
The evidence for the early eighteenth century is, at present, much more limited. But what there is suggests that in relative terms the mid nineteenth century relative geography was broadly already in place. In 1700 small scale agrarian capitalism predominated in the south-east. Further intensification was still to come but the decisive shift to agrarian capitalism took place before 1700. But in the north-west

18
family farms continued to predominate in 1700, though in some areas at least the shift towards capitalist farming was already well underway. But the transition to fully blown agrarian capitalism came after 1700. How far developments had progressed in 1700 in those intermediate regions, which in 1851 were characterised by smaller scale capitalist development, must await further occupational data.
This paper has been concerned with documenting the chronology of capitalist development and its geographical variation rather than with issues of causation. Before concluding two brief observations may be made on causation. Firstly, Tawney argued that commercialisation was the motivating force behind the growth of capitalist agriculture.60 If this was a key factor in the development of agrarian capitalism, and this is far from suggesting that it was the only factor, then one would expect agrarian capitalism to develop earliest and progress furthest in those parts of the country which were most commercialised at an early date. This appears to be the case. Richard Britnell’s work suggests that broadly speaking the south and east of England were far more commercialised at an early date than the north.61 In general one would also expect the wealthiest parts of the country to be the most commercialised. Throughout the medieval and early modern periods the southern and eastern parts of England were the wealthiest whilst the north was consistently poor.62 In other words the geography of agrarian capitalism after 1700 corresponds to the earlier geography of commercialisation.
Secondly there is an implicit but un-recognised consensus in the existing literature on the respective roles of the peasantry and landlords in driving the process of development forward. Whether the process was driven by landlords or peasants there would have been no motive to increase farm size without a market for surplus product. Before 1500 Tawney 1500 saw the process as primarily driven by the better-off amongst the peasantry but thereafter ‘grasping’ landlords took over the reins.63 Similarly Spufford identified the early agents of change as the peasants themselves with landlords entering the fray only at later stage.64 In the period covered by Whittle’s book, 1440-1580, engrossment was driven by peasants not landlords.65 However, as yet unpublished research by Whittle has revealed that landlords did subsequently become aggressive promoters of the drive towards engrossment.66 Each of these accounts suggests a somewhat different timing for the onset of landlord intervention. No doubt the exact timing varied from one place to another. Those studies which have looked at shorter periods are nevertheless consistent with the view that the early drive towards engrossment was driven by peasants and that the later developments were driven primarily by landlords. Thus Glennie’s study of the period 1450 to 1560 identified the peasantry rather than landlords as the agents of the change in Cheshunt while Allen’s study of the south Midlands in the seventeenth and eighteenth centuries revealed landlords as the driving force.67 Similarly Broad’s study
60 Tawney, Agrarian problem, pp. 46, 62, 66, 72, 84, 97 and p.172. 61 Britnell, Commercialisation. 62 Campell, ‘North-south’, Shaw-Taylor ‘Family farms.’ 63 Tawney, Agrarian problem, pp. 72-97, 98, 138-172, 182-230, 408. 64 Spufford, Contrasting communities, p. 103. 65 Whittle, Development, pp. 84, 167, 308. 66 Personal communication from Dr Whittle. 67 Glennie, ‘Agrarian capitalism’, p. 33. Allen, Enclosure.

19
of the period 1600-1820 identifies landlords as the driving force behind engrossment.68
Of all the local case studies on the development of agrarian capitalism, only French and Hoyle’s study of Slaidburn in Lancashire lies in the area where family farming remained strong in the mid-nineteenth century.69 They alone find a ‘peasant’ driven process of engrossment still operating in the eighteenth century. Case studies from the south and east suggest that early engrossment was often or generally ‘peasant’ or tenant driven with landlords taking over at a later stage. French and Hoyle find tenant driven engrossment taking place much later than in the south-eastern case studies which fits well with the account presented here. Since engrossment appears to have got underway much later at Slaidburn this may still fit a model where the early phases of engrossment were driven by tenants not landlords since engrossment would appear to have begun at a much later date.70
Tables
Table 1. The relative importance of capitalist and family farms in the south Midlands C. 1600 to 1800 according to R.C. Allen
Open Field Farms % of farm area in early C17th
% of farm area in early C18th
% of farm area about 1800
5-60 acres (family) 33.5 24.7 7.6
60-100 acres (transitional) 34.2 21.7 7.6
100 acres + (capitalist) 32.3 53.6 84.7
100 100 100
Enclosed Farms % of farm area in early C17th
% of farm area in early C18th
% of farm area about 1800
5-60 acres (family) 6.4 12.6 8.1
60-100 acres (transitional) 2.8 15.1 6.4
100 acres + (capitalist) 90.9 72.2 85.9
100 100 100
Source: A simplified version of Allen, Enclosure, p. 73, table 4-4.
68 Broad, Transforming English Rural Society. 69 French and Hoyle, ‘Slaidburn.’ 70 Their study ends in 1780 so it is not possible to ascertain whether or not landlords subsequently came to play a more significant tile in driving change.

20
21
Table 2. The relative importance of capitalist and family farms in the south Midlands C. 1600 to 1800 using R.C. Allen’s data but revised acreage thresholds
Open Field Farms % of farm area in early C17th
% of farm area in early C18th
% of farm area about 1800
5-30 acres (family) 7.6 9.0 1.4
30-60 acres (transitional) 25.9 15.7 6.2
60 acres + (capitalist) 66.5 75.3 92.4
Total 100.0 100.0 100.0
Enclosed Farms % of farm area in early C17th
% of farm area in early C18th
% of farm area about 1800
5-30 acres (family) 1.1 3.5 1.9
30-60 acres (transitional) 5.3 9.1 6.2
60 acres + (capitalist) 93.7 87.4 91.9
Total 100.0 100.0 100.0
Source: A modified and simplified version of Allen, Enclosure, p. 73, table 4-4.
22
Table 3. Land occupation in the level of Romney Marsh, 1587-1705
Mode of Production
1587 1608-12
1650 1654 1699 1705
Less than 50 acres (family)
29.9 33.0 20.3 25.0 16.9 18.9
50-100 acres (transitional)
22.9 24.2 18.7 17.1 19.0 17.5
100 acres + (capitalist)
47.2 42.9 61.1 57.9 64.1 63.6
Source: Hipkin, ‘Tenant farming’, p. 656, table 3
Table 4. Land occupation in the level of Romney Marsh 1587-1705
1587 1608-12
1650 1654 1699 1705 1746 1768 1775 1800 1820 1834
0 < 20 7.2 10.1 6.9 7.5 5.0 4.9 3.0 3.5 3.0 3.0 3.7 3.6 20 < 100 45.6 46.9 32.1 34.6 30.9 31.5 24.7 29.5 31.5 32.5 34.5 34.3
> 100 47.2 43.0 61.1 57.9 64.2 63.5 72.3 67.0 65.5 64.5 61.8 60.9
Source: Hipkin, ‘Landownership’, p. 78, Table 4
23
Table 5. The acreage in capitalist and family farms in eighteenth century Daventry
Mode of Production
1720 Acres
1751 Acres
1789 Acres
Less than 60 acres (family)
121 0 21
60-100 acres (transitional)
229 247 0
100 acres + (capitalist)
2,449 2,522 2,780
Total 2,800 2,800 2,800 Source: Greenall, ‘Daventry tithing book.’
Table 6. The proportion of the acreage in capitalist and family farms in eighteenth
century Daventry
Mode of Production
1720 %
1751 %
1789 %
Less than 60 acres (family)
4 0 1
60-100 acres (transitional)
8 9 0
100 acres + (capitalist)
87 91 99
Total 100 100 100 Source: Greenall, ‘Daventry tithing book.’

24
Table 7. Farm Workers: Farmers in Bedfordshire 1698-1720
Parish Dates Farm
Workers Farmers
Ratio of Farm Workers to Farmers Sample Size
Biddenham 1698-1705 24 6 4.0 30 Cardington 1701-1709 68 22 3.1 90 Clapham 1716-1723 5 2 2.5 7 Clifton 1715-1722 25 5 5.0 30 Eaton Bray 1716-1723 49 17 2.9 66 Henlow 1698-1705 37 11 3.4 48 Houghton Regis 1713-1720 57 25 2.3 82 Kempston 1709-1716 91 22 4.1 113 Keysoe 1707-1715 42 13 3.2 55 Langford 1712-1717 27 15 1.8 42 Little Barford 1698-1705 10 11 0.9 21 Little Staughton 1706-1711 33 5 6.6 38 Maulden 1704-1711 62 18 3.4 80 Mepershall 1698-1706 23 12 1.9 35 Odell 1704-1711 31 9 3.4 40 Podington 1704-1711 28 8 3.5 36 Potton 1698-1705 37 10 3.7 47 Pulloxhill 1713-1720 18 21 0.9 39 Renhold 1704-1712 19 21 0.9 40 Souldrop 1698-1705 26 20 1.3 46 Southill 1714-1721 117 20 5.9 137 Steppingly 1704-1711 3 4 0.8 7 Tilbrook 1699-1706 15 11 1.4 26 Tilsworth 1715-1722 21 4 5.3 25 Upper Gravenhurst 1714-1721 47 7 6.7 54 Wrestlingworth 1717-1724 46 14 3.3 60 Total 961 333 2.9 1294 Source: Bedfordshire parish registers. Note: Sample size refers to total number of baptisms for farmers, yeomen, husbandmen, labourers and shepherds. I am grateful to Peter Kitson for collecting this data.

25
Table 8. Farmer: Farm Worker Ratios for south-eastern England 1697-1720 Place Date Ratio of Farmers
to Labourers and Servants
Sample Size
Hothorpe, Northamptonshirea 1697 1.33 21 Donhead, Wiltshirea 1697 2.93 55 Adisham, Kenta 1705 3.89 44 Ash (Chilton) Kenta 1705 3.7 118 Ash (Overland) Kenta 1705 2.58 104 26 villages in Bedfordshireb 1698-1720 2.90 1,294 4 villages in Buckinghamshireb 1699-1720 1.68 130 Steeple Ashton, Oxfordshirec 1696-1708 1.75 55 Toseland, Huntingdonshirec 1703-14 1.08 27 Woodford Essexc 1695-1705 2.2 68 Weighted Average excluding Beds 2.5 622 Weighted Average 1695-1720 2.8 1,976 a Source: Parish listings, Kussmaul, Servants in Husbandry, pp. 11-12. b Source: Baptism Registers. I am grateful to Peter Kitson for collecting this data. c Source: Baptism Registers. I am grateful to Peter Kitson for generously allowing me to use this data
26
Table 9. Characteristics of selected occupational groups in Northwich Hundred 1660a
Number in each
occupational/status group
Average tax rating in shillings
Percentage with tax Rating of one shilling
or less
Gentleman 35 10.5 0 Yeoman 12 6.6 0 Husbandman 140 3.8 26 Carpenter 7 1.38 71 Blacksmith 12 1.34 75 Tailor 14 1.27 79 Labourer 85 1.0 100 Servant 35 1.0 100 Weaver/Webster 11 1.0 100
a 17 settlements in Northwich Hundred where 95% or more of adult males were given an occupation. Source: Lawton, Northwich Hundred.
Table 10. Farm workers: farmers in Northwich Hundred 1660
Location
Ratio of Farm Workers to Farmers Sample Size
Allostocke 0.6 68 Bostocke 0.8 29 Bradwell 0.7 53 Clive 0.1 19 Cranage 0.8 30 Davenport 1.2 11 Lach Denni 0.0 3 Moosebarro 2.0 3 Moulton 1.2 13 Newall 1.0 4 Northwich 0.1 42 Sheebrooke 0.9 23 Sherlach 2.2 16 Stanthorne 1.1 21 Wytonn 0.4 25 Wheelocke 0.2 15 Total 0.6 375 I am grateful to Victoria Masten for making this data machine readable Source: Lawton, Northwich Hundred.
27
Table 11. Farm workers: farmers in the West Riding of Yorkshire 1699-1730a
Location Dates
Ratio of Farm
Workers to Farmers
Sample Size
Anston 1699-1707 0.9 68 Aston cum Aughton 1716-1730 1.5 86 Burnsall in Craven 1719-1720 0.3 44 Coniston 1718-1726 0.9 37 Hampsthwaite 1718-1720 0.5 31 Hooton Roberts 1703-1714 0.3 14 Kettlewell 1715-1725 0.6 96 Nun Monkton 1719-2727 1.5 32 Rawmarsh 1712-1723 0.4 63 Thorpe Salvin 1699-1726 1.1 30 Thybergh 1714-1722 0.2 13 Tinsley 1716-1724 0.2 7 Todwick 1717-1724 1.1 34 Worsborough 1715-1723 1.6 55 Total 0.8 610
a I am grateful to Amanda Jones and Joe Barker for collecting this data. Source: West Riding baptism registers.
28
Table 12. Farm Worker: Farmer Ratios for Northern England 1650-1730
Place Date Ratio of Farm Workers to Farmers
Sample Size
Walton-le-Dale, Lancashire a 1713-20 0.07 58 Rochdale, Lancashire b 1653-59 0.07 N/A Myddle, Shropshire b 1660-1660 0.57 N/A Northwich Hundred, Cheshire c 1660 0.79 351 Hutton Roof, Westmorland d 1695 1.83 34 Killington, Westmorland d 1697 0.63 49 14 settlements in the West Riding e 1699-1730 0.79 610 Weighted Average 0.78 1,102 a Baptism registers. I am grateful to Peter Kitson for allowing me to make use of this data. b Parish Registers, Glennie, Men’s trades, pp. 31. The underlying data are approximate as they have been read off a graph. c 1660 Poll Tax, Lawton, Northwich Hundred. d Parish Listings, Kussmaul, Servants in husbandry, p e West Riding baptism registers.

29
FIGURE 1: Average farm size in acres on 31st March 1851

30
FIGURE 2: Percentage of farmland employing no adult males on 31st March 1851

31
FIGURE 3: Percentage of farmland with two or more employees on 31st March 1851
32
FIGURE 4: Average number of adult male employees per farm of 50-74 acres on 31st March 1851

33
FIGURE 5: Average number of adult male employees per farm of 40-50 acres on 31st March 1851
34
FIGURE 6: Average number of adult male employees per farm of 30-40 acres on 31st March
1851

35
FIGURE 7: Male farm workers per farmer in 1851

36
Footnote References
Allen, R.C., ‘Agriculture during the industrial revolution 1700-1850’ in Floud R., and Johnson, P., (eds.) The Cambridge economic history of modern Britain 1700-1860 (2004), pp. 96-116.
Allen, R.C., Enclosure and the yeoman: The agricultural development of the south Midlands 1450-1850 (Oxford, 1992).
Aston, T.H., and Philpin, C.H.E., eds., The Brenner debate: agrarian class structure and economic development in pre-industrial Europe (Cambridge, 1985).
Brenner, R., ‘Agrarian class structure and economic development in pre-industrial Europe’, in T.H. Aston and C.H.E. Philpin, eds., The Brenner debate: agrarian class structure and economic development in pre-industrial Europe (Cambridge, 1985).
Britnell, R.H., The commercialisation of English Society 1000-1500 (Manchester, 1996).
Broad, J., ‘The fate of the Midland yeoman 1620-1800’, Continuity and Change, 14 (1999), pp. 325-47.
Broad, J., Transforming English rural society: The Verneys and the Claydons (Cambridge, 2004).
Campbell, B.M.S., ‘North-South dichotomies, 1066-1550’ in A.R.H. Baker and M. Billinge, (eds.) Geographies of England: The North-South divide, material and imagined (2004), pp. 145-174.
Chambers, J.D. and Mingay, G.E., The agricultural revolution 1750-1880 (1966).
Chibnall, A.C., Sherington: fiefs and fields of a Buckinghamshire village (Cambridge, 1965).
Clay, C., Economic expansion and social change: England 1500-1700 (Cambridge, 1984).
Crafts, N.F.R., British economic growth during the industrial revolution (Oxford, 1985).
Crafts, N.F.R., and Harley, C.K., ‘Precocious British industrialization: A general equilibrium perspective’, in Prados de la Escocura, L., (ed.) British exceptionalism: A unique path to the industrial revolution (Cambridge, 2004), pp. 86-107.
Edwards, P.R., ‘The decline of the small farmer: The case of Rushock, Worcestershire’, Midland History, 32 (1996) pp. 73-100.
French, H.R., and Hoyle, R.W., ‘The land market of a Pennine manor: Slaidburn, 1650-1780’, Continuity and Change, 14 (1999) pp. 349-284.

37
Glennie, P., ‘In search of agrarian capitalism: Manorial land markets and the acquisition of land in the Lea valley c. 1450-c.1560’, Continuity and Change, 3 (1988), pp. 11-40.
Glennie, P., Distinguishing men’s trades: Occupational sources and debates for pre-census England, Historical Geography Research Series 1, 25 (1990).
Greenall, R.L., ‘The Daventry tithing book 1700-1818’ in King, E., ed. A Northamptonshire miscellany, Publications of the Northamptonshire record society Vol. XXXII (1983), pp. 59-108.
Grigg, D., ‘Farm size in England and Wales, from early Victorian times to the present’, Agricultural History Review 35, II (1987), pp. 179-189.
Hammond J.L. and Hammond, B., The village labourer, 1760-1832 (1912).
Harrison, C.J., ‘Elizabethan village surveys: A comment’, Agricultural History Review, 27 (1979) pp. 82-89.
Hasbach, W., A history of the English agricultural labourer (1908).
Hipkin, S., ‘Tenant farming and short-term leasing on Romney Marsh, 1587-1705’, Economic History Review, LIII, 4 (2000), pp. 646-67.
Hipkin, S., ‘The structure of landownership and land occupation in the Romney Marsh region, 1646-1834’, Agricultural History Review, 51, I (2003), pp. 69-94.
Holderness, B.A., ‘“Open” and “Close” parishes in England in the eighteenth and nineteenth centuries’, Agricultural History Review, 20 (1972), pp. 126-39.
Hoyle, R.W., ‘Tenure and the land market in early modern England: Or a late contribution to the Brenner debate’, Economic History Review, 43 (1990), pp. 1-20.
Johnson, A.H., The disappearance of the small landowner (Oxford, 1909).
Kerridge, E., Agrarian problems in the sixteenth century and after (1969).
Kussmaul, A., Servants in husbandry in early modern England (Cambridge, 1981).
Lawton, G.O., ed. Northwich Hundred: Poll tax and hearth tax 1664 (Liverpool, 1979)
McIntosh, M., ‘Land, tenure and population in the royal manor of Havering Essex, 1251-1352/3’, Economic History Review, XXXII (1984), pp. 17-31.
Mingay, G.E., ‘The size of farms in the eighteenth century’, Economic History Review, 14 (1962), pp. 469-88.
Mingay, G.E., Enclosure and the small farmer in the age of the industrial revolution (1968).

38
Neeson, J.M., Commoners: Common right, enclosure and social change in England 1700-1820 (Cambridge, 1993).
Overton, M., Agricultural revolution in England: The transformation of the agrarian economy 1500-1850 (Cambridge, 1996).
Saville,J., ‘Primitive accumulation and early industrialization in Britain’, Socialist Register (1969), pp. 247-71.
Shaw-Taylor, L., ‘Family farms and capitalist farms in mid-nineteenth century England’, forthcoming, Agricultural History Review.
Song, B.K. ‘Landed interest, local government, and the labour market in England 1750-1850’, Economic History Review, LI (1998), pp. 465-88.
Spufford, M., Contrasting communities: English villagers in the sixteenth and seventeenth centuries (Cambridge, 1974).
Tawney, R.H., The agrarian problem in the sixteenth century (1967, 1912).
Thompson, F.M.L., ‘The social distribution of landed property in England since the sixteenth century’, Economic History Review, 19 (1966), pp. 505-17.
van Bavel, B.J.P., ‘Structures of landownership, mobility of land and farm sizes. Diverging developments in the northern part of the Low countries, c. 1300 - c. 1650’ in B.J.P. van Bavel and P. Hoppenbrouwers, eds., Landholders and land transfer in the North Sea area: Late middle ages – 19th century (2004), pp. 131-48.
van Bavel, B.J.P., ‘Land, lease and agriculture: the transition of the rural economy in the Dutch river area from the fourteenth to the sixteenth century’, Past and Present, 172 (2001), pp. 3-43.
Whittle, J., ‘Tenure and landholding in England 1440-1580. A crucial period for the development of agrarian capitalism?’ in B.J.P. van Bavel and P. Hoppenbrouwers, eds., Landholders and land transfer in the North Sea area: Late middle ages – 19th century (2004), pp. 237-249.
Whittle, J., The development of agrarian capitalism: Land and labour in Norfolk 1440-1580 (Oxford, 2000).
Wordie, J.R., ‘Social change on the Leveson-Gower estates’, Economic History Review, 27 (1974), pp.593-609.
Wrightson, K., and Levine, D., Poverty and piety in an English village: Terling, 1525-1700 (1979).
Wrigley, E.A. and Schofield, R.S., The population history of England, 1541-1871: A reconstruction (Cambridge, 1981)
Wrigley, E.A., Davies, R.S., Oeppen, J.E., and Schofield, R.S., English population from family reconstitution 1580-1837 (Cambridge, 1997).

39
Wrigley, E.A., ‘Urban growth and agricultural change: England and the continent in the early modern period’, Journal of Interdisciplinary History, 15 (1985), pp. 683-728.
Wrigley, E.A., Continuity, chance and change: The character of the industrial revolution in England (Cambridge, 1988).
Official publications
PP, 1852-53, LXXXVIII, part I, Census of Great Britain 1851, Population Tables II, vols. I & 2, Farmers, with the numbers of labourers employed and of acres occupied, divisions 1-X.
PP, 1852-53, LXXXVIII, part I, Census of Great Britain 1851, Population Tables II, vol. I & 2, Occupations of the people, divisions 1-X.
Theses
Barker, J., ‘A Reconsideration of farm sizes in early Modern Cambridgeshire’, University of Cambridge, unpublished undergraduate dissertation.