the rise of intermarriage - social & demographic trends - pew research … · · 2012-02-154...
TRANSCRIPT
February 16, 2012
The Rise of Intermarriage Rates, Characteristics Vary by Race and Gender
Social &
Demographic
Trends
Paul Taylor, Director
Wendy Wang, Research Associate
Kim Parker, Associate Director
Jeffrey S. Passel, Senior Demographer
Eileen Patten, Research Assistant
Seth Motel, Research Assistant
FOR FURTHER INFORMATION, CONTACT
Pew Social & Demographic Trends
Tel (202) 419-4372
1615 L St., N.W., Suite 700
Washington, D.C. 20036
www.pewsocialtrends.org
The Rise of Intermarriage Rates, Characteristics Vary by Race and Gender
By Wendy Wang
Table of Contents
SECTION PAGE
Executive Summary 1
Chapter 1: Overview 5
Chapter 2: Characteristics of Intermarried Newlyweds 13
Chapter 3: Intermarried Couples of Different Cohorts 25
Chapter 4: Public Attitudes on Intermarriage 33
Appendices
1 Data & Methodology 41
2 State and Regional Rates 45
3 Detailed tables 47
1
PEW SOCIAL & DEMOGRAPHIC TRENDS
www.pewsocialtrends.org
EXECUTIVE SUMMARY
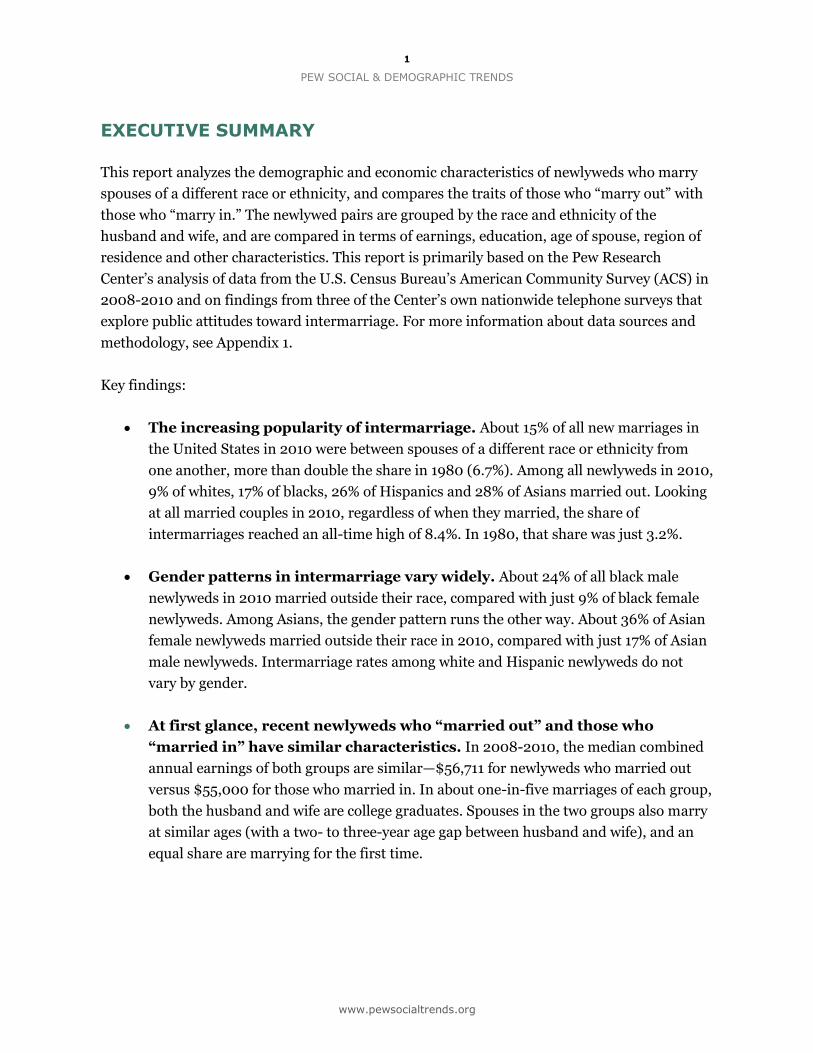
This report analyzes the demographic and economic characteristics of newlyweds who marry
spouses of a different race or ethnicity, and compares the traits of those who “marry out” with
those who “marry in.” The newlywed pairs are grouped by the race and ethnicity of the
husband and wife, and are compared in terms of earnings, education, age of spouse, region of
residence and other characteristics. This report is primarily based on the Pew Research
Center’s analysis of data from the U.S. Census Bureau’s American Community Survey (ACS) in
2008-2010 and on findings from three of the Center’s own nationwide telephone surveys that
explore public attitudes toward intermarriage. For more information about data sources and
methodology, see Appendix 1.
Key findings:
The increasing popularity of intermarriage. About 15% of all new marriages in
the United States in 2010 were between spouses of a different race or ethnicity from
one another, more than double the share in 1980 (6.7%). Among all newlyweds in 2010,
9% of whites, 17% of blacks, 26% of Hispanics and 28% of Asians married out. Looking
at all married couples in 2010, regardless of when they married, the share of
intermarriages reached an all-time high of 8.4%. In 1980, that share was just 3.2%.
Gender patterns in intermarriage vary widely. About 24% of all black male
newlyweds in 2010 married outside their race, compared with just 9% of black female
newlyweds. Among Asians, the gender pattern runs the other way. About 36% of Asian
female newlyweds married outside their race in 2010, compared with just 17% of Asian
male newlyweds. Intermarriage rates among white and Hispanic newlyweds do not
vary by gender.
At first glance, recent newlyweds who “married out” and those who
“married in” have similar characteristics. In 2008-2010, the median combined
annual earnings of both groups are similar—$56,711 for newlyweds who married out
versus $55,000 for those who married in. In about one-in-five marriages of each group,
both the husband and wife are college graduates. Spouses in the two groups also marry
at similar ages (with a two- to three-year age gap between husband and wife), and an
equal share are marrying for the first time.
2
The Rise of Intermarriage
www.pewsocialtrends.org
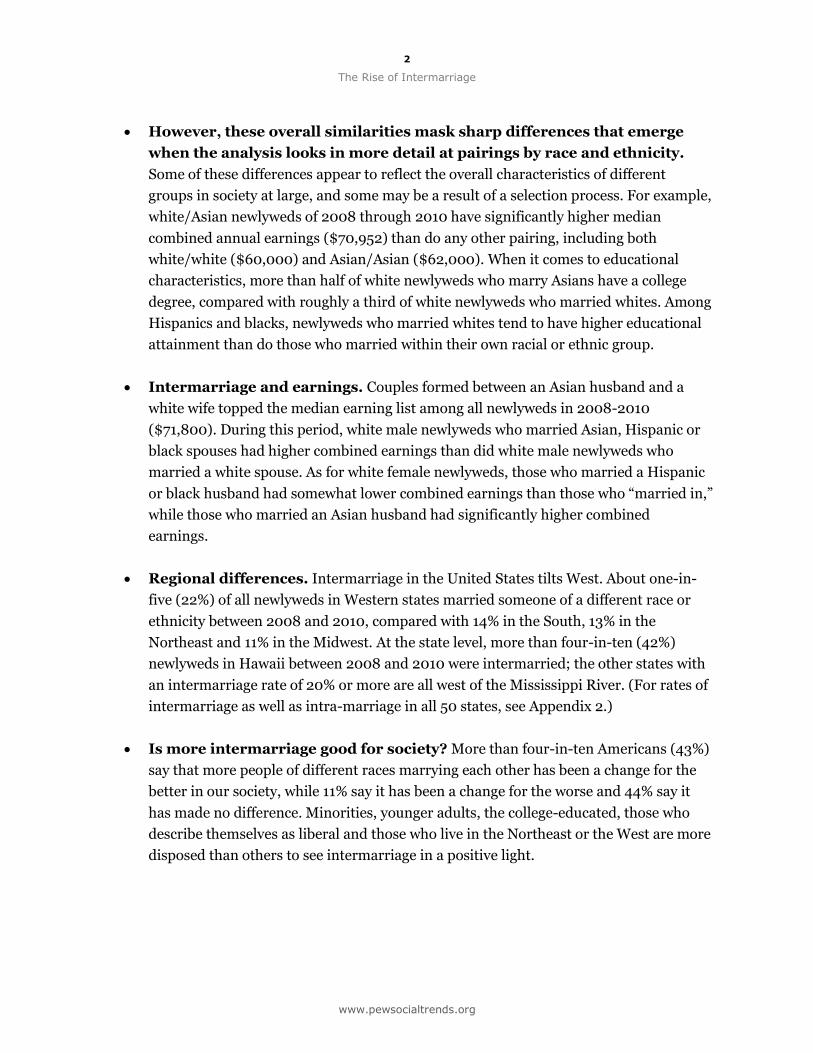
However, these overall similarities mask sharp differences that emerge
when the analysis looks in more detail at pairings by race and ethnicity.
Some of these differences appear to reflect the overall characteristics of different
groups in society at large, and some may be a result of a selection process. For example,
white/Asian newlyweds of 2008 through 2010 have significantly higher median
combined annual earnings ($70,952) than do any other pairing, including both
white/white ($60,000) and Asian/Asian ($62,000). When it comes to educational
characteristics, more than half of white newlyweds who marry Asians have a college
degree, compared with roughly a third of white newlyweds who married whites. Among
Hispanics and blacks, newlyweds who married whites tend to have higher educational
attainment than do those who married within their own racial or ethnic group.
Intermarriage and earnings. Couples formed between an Asian husband and a
white wife topped the median earning list among all newlyweds in 2008-2010
($71,800). During this period, white male newlyweds who married Asian, Hispanic or
black spouses had higher combined earnings than did white male newlyweds who
married a white spouse. As for white female newlyweds, those who married a Hispanic
or black husband had somewhat lower combined earnings than those who “married in,”
while those who married an Asian husband had significantly higher combined
earnings.
Regional differences. Intermarriage in the United States tilts West. About one-in-
five (22%) of all newlyweds in Western states married someone of a different race or
ethnicity between 2008 and 2010, compared with 14% in the South, 13% in the
Northeast and 11% in the Midwest. At the state level, more than four-in-ten (42%)
newlyweds in Hawaii between 2008 and 2010 were intermarried; the other states with
an intermarriage rate of 20% or more are all west of the Mississippi River. (For rates of
intermarriage as well as intra-marriage in all 50 states, see Appendix 2.)
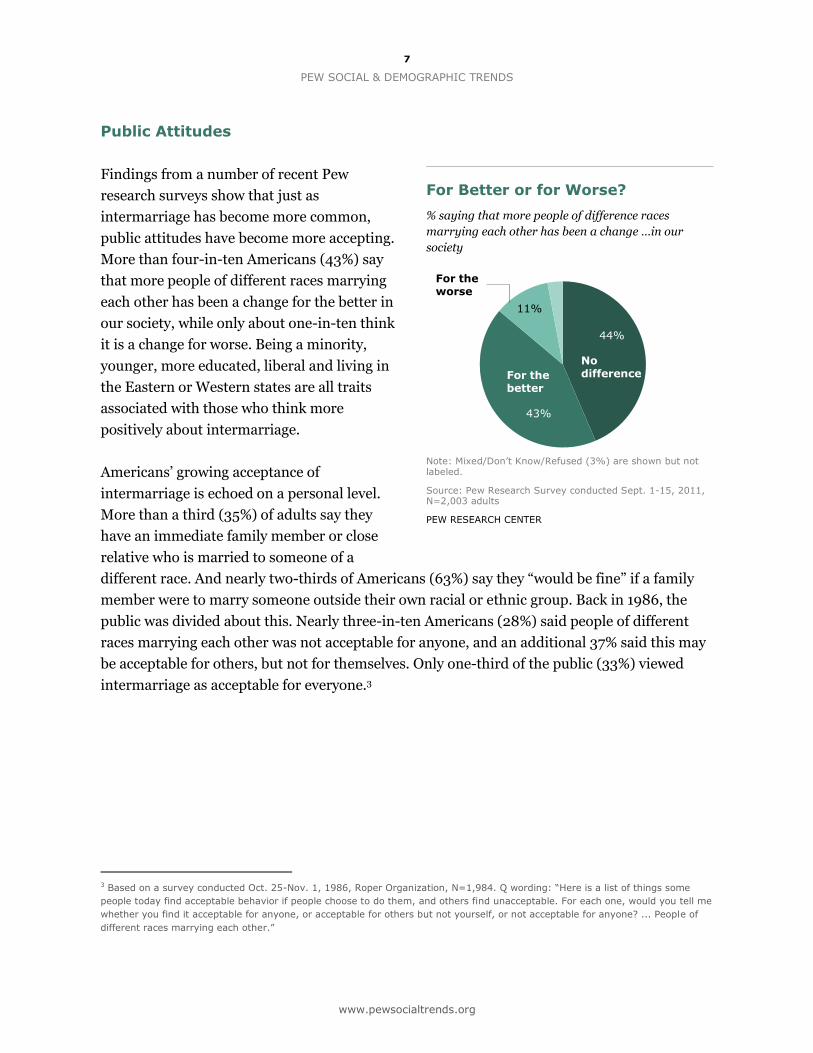
Is more intermarriage good for society? More than four-in-ten Americans (43%)
say that more people of different races marrying each other has been a change for the
better in our society, while 11% say it has been a change for the worse and 44% say it
has made no difference. Minorities, younger adults, the college-educated, those who
describe themselves as liberal and those who live in the Northeast or the West are more
disposed than others to see intermarriage in a positive light.
3
PEW SOCIAL & DEMOGRAPHIC TRENDS
www.pewsocialtrends.org
Public’s acceptance of intermarriage. More than one-third of Americans (35%)
say that a member of their immediate family or a close relative is currently married to
someone of a different race. Also, nearly two-thirds of Americans (63%) say it “would
be fine” with them if a member of their own family were to marry someone outside
their own racial or ethnic group. In 1986, the public was divided about this. Nearly
three-in-ten Americans (28%) said people of different races marrying each other was
not acceptable for anyone, and an additional 37% said this may be acceptable for
others, but not for themselves. Only one-third of the public (33%) viewed intermarriage
as acceptable for everyone.
Divorce. Several studies using government data have found that overall divorce rates
are higher for couples who married out than for those who married in – but here, too,
the patterns vary by the racial and gender characteristics of the couples. These findings
are based on scholarly analysis of government data on marriage and divorce collected
over the past two decades.
Notes and Terminology
In this report, the terms “intermarriage” and “marrying out” refer to marriages between a Hispanic and a non-Hispanic (interethnic) or marriages between non-Hispanic spouses who come from the following different racial groups (interracial): white, black, Asian, American Indian, mixed race or some other race. “Intra-marriage” and “marrying in” refer to marriages between spouses of the same race or ethnicity.
“Newly married” or “newlyweds” refer to couples who got married in the past 12 months prior to the survey date (American Community Survey). Newlywed couples in 2008-2010 combines three years’ data for newlyweds. Even though labeled as “newlyweds,” 42% of newly married couples in 2008-2010 have been married before (either husband or wife or both). Newlyweds are a subset of the “currently married” population, which includes individuals whose marital status is “married, spouse present.”
When comparing characteristics of detailed groups of newlyweds by race/ethnicity as well as gender patterns, only intermarried couples involving a white spouse are analyzed, and they represent about 68% of all intermarried newlywed couples between 2008 and 2010. For illustration purposes, “/” (not specifying gender) and “-” (specifying gender) are used to indicate different types of couples. For example, “White/Asian” indicates intermarried couples between whites and Asians. “White-Asian” means that the husband is white and the wife is Asian, in that order.
The term “Asian” includes native Hawaiians and other Pacific Islanders. “American Indian” includes Alaska Natives. The terms “black” and “African American” are used interchangeably in this report. All references in this report to whites, blacks, and Asians refer to the non-Hispanic portions of those groups. Hispanics are of any race. For more details, see Appendix 1.
4
The Rise of Intermarriage
www.pewsocialtrends.org
About the Report
This report was researched and written by Wendy Wang, research associate at the Social &
Demographic Trends project of the Pew Research Center. Jeffrey S. Passel, senior
demographer at the Pew Research Center, participated in the initial planning of the project
and prepared the couple-level ACS datasets for the analysis. Paul Taylor, director of the Pew
Research Center’s Social & Demographic Trends project, provided the editorial guidance and
also edited the report. Kim Parker, associate director of the Social & Demographic Trends
project, provided valuable comments and suggestions. Research Assistants Eileen Patten and
Seth Motel did the number checking, and Marcia Kramer copy-edited the report.
5
PEW SOCIAL & DEMOGRAPHIC TRENDS
www.pewsocialtrends.org
8.4 8.0 6.8
4.5 3.2
15.1 14.5
6.7
0
5
10
15
1980 1990 2000 2010
F
New marriages
All marriages
%
CHAPTER 1: OVERVIEW
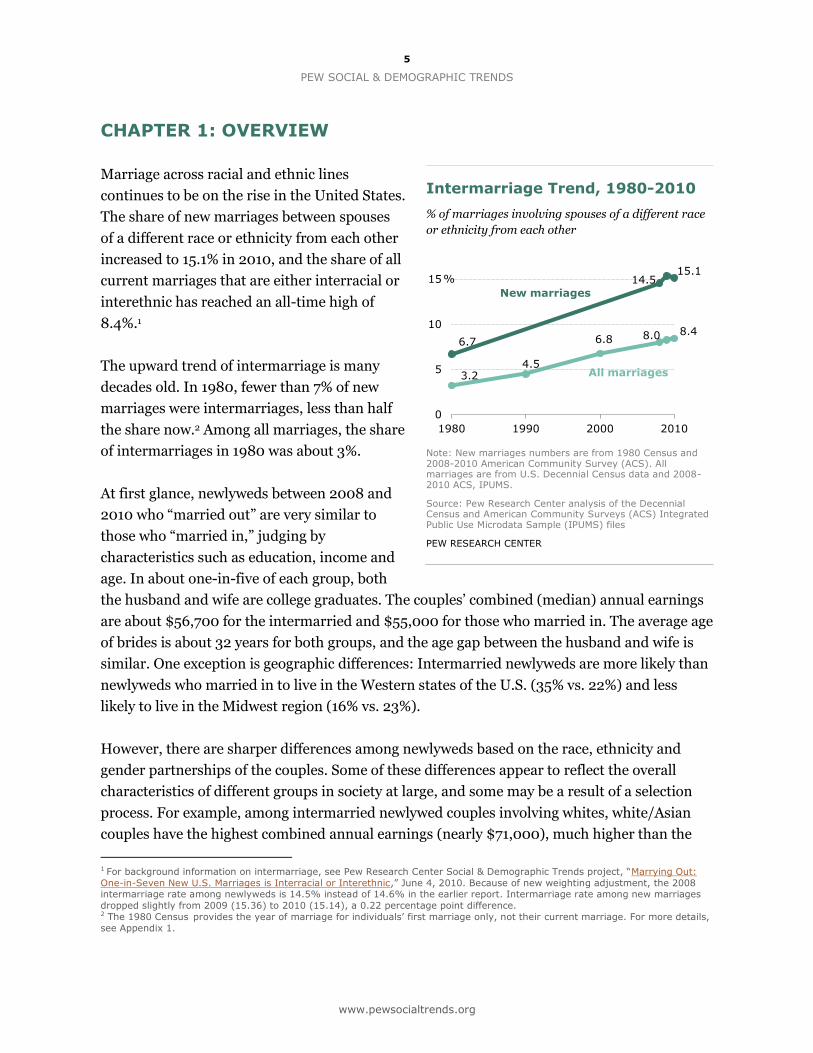
Marriage across racial and ethnic lines
continues to be on the rise in the United States.
The share of new marriages between spouses
of a different race or ethnicity from each other
increased to 15.1% in 2010, and the share of all
current marriages that are either interracial or
interethnic has reached an all-time high of
8.4%.1
The upward trend of intermarriage is many
decades old. In 1980, fewer than 7% of new
marriages were intermarriages, less than half
the share now.2 Among all marriages, the share
of intermarriages in 1980 was about 3%.
At first glance, newlyweds between 2008 and
2010 who “married out” are very similar to
those who “married in,” judging by
characteristics such as education, income and
age. In about one-in-five of each group, both
the husband and wife are college graduates. The couples’ combined (median) annual earnings
are about $56,700 for the intermarried and $55,000 for those who married in. The average age
of brides is about 32 years for both groups, and the age gap between the husband and wife is
similar. One exception is geographic differences: Intermarried newlyweds are more likely than
newlyweds who married in to live in the Western states of the U.S. (35% vs. 22%) and less
likely to live in the Midwest region (16% vs. 23%).
However, there are sharper differences among newlyweds based on the race, ethnicity and
gender partnerships of the couples. Some of these differences appear to reflect the overall
characteristics of different groups in society at large, and some may be a result of a selection
process. For example, among intermarried newlywed couples involving whites, white/Asian
couples have the highest combined annual earnings (nearly $71,000), much higher than the
1 For background information on intermarriage, see Pew Research Center Social & Demographic Trends project, “Marrying Out:
One-in-Seven New U.S. Marriages is Interracial or Interethnic,” June 4, 2010. Because of new weighting adjustment, the 2008 intermarriage rate among newlyweds is 14.5% instead of 14.6% in the earlier report. Intermarriage rate among new marriages
dropped slightly from 2009 (15.36) to 2010 (15.14), a 0.22 percentage point difference. 2 The 1980 Census provides the year of marriage for individuals’ first marriage only, not their current marriage. For more details,
see Appendix 1.
Intermarriage Trend, 1980-2010
% of marriages involving spouses of a different race
or ethnicity from each other
Note: New marriages numbers are from 1980 Census and 2008-2010 American Community Survey (ACS). All marriages are from U.S. Decennial Census data and 2008-2010 ACS, IPUMS.
Source: Pew Research Center analysis of the Decennial Census and American Community Surveys (ACS) Integrated Public Use Microdata Sample (IPUMS) files
PEW RESEARCH CENTER
6
The Rise of Intermarriage
www.pewsocialtrends.org
$70,952
$62,000
$60,000
$57,900
$53,187
$47,700
$35,578
White/Asian
Asian/Asian
White/White
White/Hispanic
White/Black
Black/Black
Hispanic/Hisp.
% both college educated
41.2
52.7
23.3
18.6
14.5
10.2
5.4
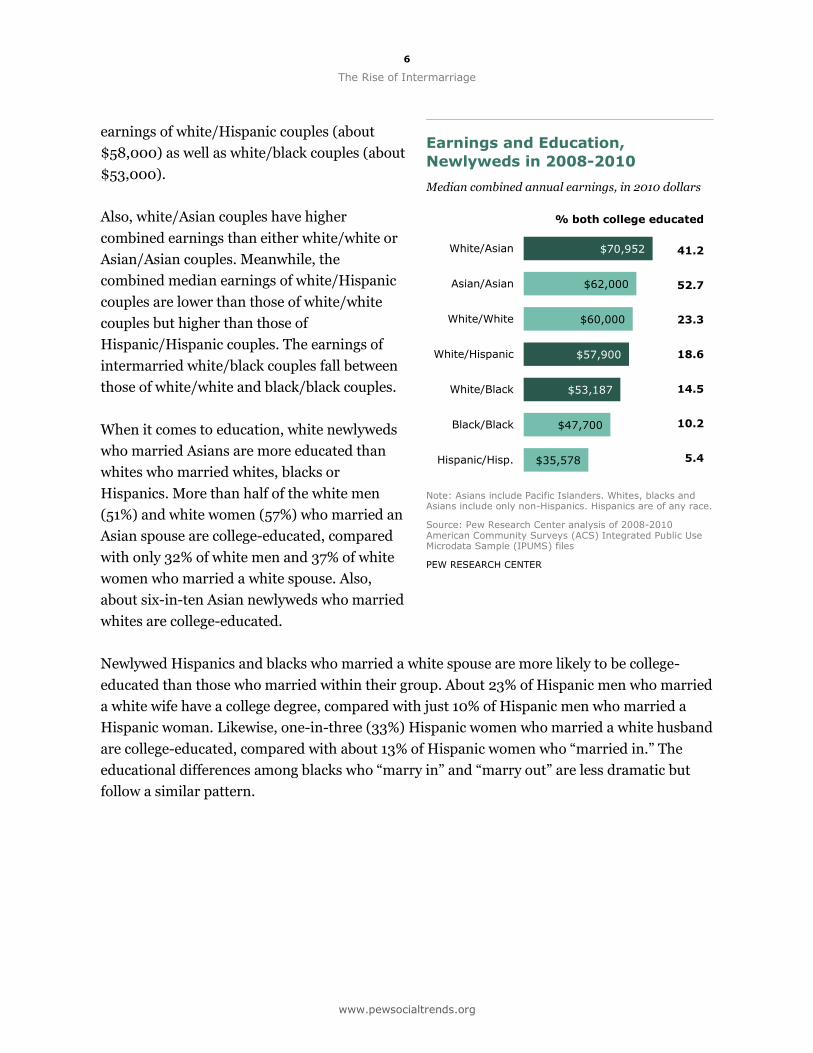
earnings of white/Hispanic couples (about
$58,000) as well as white/black couples (about
$53,000).
Also, white/Asian couples have higher
combined earnings than either white/white or
Asian/Asian couples. Meanwhile, the
combined median earnings of white/Hispanic
couples are lower than those of white/white
couples but higher than those of
Hispanic/Hispanic couples. The earnings of
intermarried white/black couples fall between
those of white/white and black/black couples.
When it comes to education, white newlyweds
who married Asians are more educated than
whites who married whites, blacks or
Hispanics. More than half of the white men
(51%) and white women (57%) who married an
Asian spouse are college-educated, compared
with only 32% of white men and 37% of white
women who married a white spouse. Also,
about six-in-ten Asian newlyweds who married
whites are college-educated.
Newlywed Hispanics and blacks who married a white spouse are more likely to be college-
educated than those who married within their group. About 23% of Hispanic men who married
a white wife have a college degree, compared with just 10% of Hispanic men who married a
Hispanic woman. Likewise, one-in-three (33%) Hispanic women who married a white husband
are college-educated, compared with about 13% of Hispanic women who “married in.” The
educational differences among blacks who “marry in” and “marry out” are less dramatic but
follow a similar pattern.
Earnings and Education,
Newlyweds in 2008-2010
Median combined annual earnings, in 2010 dollars
Note: Asians include Pacific Islanders. Whites, blacks and Asians include only non-Hispanics. Hispanics are of any race.
Source: Pew Research Center analysis of 2008-2010 American Community Surveys (ACS) Integrated Public Use Microdata Sample (IPUMS) files
PEW RESEARCH CENTER
7
PEW SOCIAL & DEMOGRAPHIC TRENDS
www.pewsocialtrends.org
44%
43%
11%
No difference For the
better
For the worse
Public Attitudes
Findings from a number of recent Pew
research surveys show that just as
intermarriage has become more common,
public attitudes have become more accepting.
More than four-in-ten Americans (43%) say
that more people of different races marrying
each other has been a change for the better in
our society, while only about one-in-ten think
it is a change for worse. Being a minority,
younger, more educated, liberal and living in
the Eastern or Western states are all traits
associated with those who think more
positively about intermarriage.
Americans’ growing acceptance of
intermarriage is echoed on a personal level.
More than a third (35%) of adults say they
have an immediate family member or close
relative who is married to someone of a
different race. And nearly two-thirds of Americans (63%) say they “would be fine” if a family
member were to marry someone outside their own racial or ethnic group. Back in 1986, the
public was divided about this. Nearly three-in-ten Americans (28%) said people of different
races marrying each other was not acceptable for anyone, and an additional 37% said this may
be acceptable for others, but not for themselves. Only one-third of the public (33%) viewed
intermarriage as acceptable for everyone.3
3 Based on a survey conducted Oct. 25-Nov. 1, 1986, Roper Organization, N=1,984. Q wording: “Here is a list of things some
people today find acceptable behavior if people choose to do them, and others find unacceptable. For each one, would you tell me
whether you find it acceptable for anyone, or acceptable for others but not yourself, or not acceptable for anyone? ... People of
different races marrying each other.”
For Better or for Worse?
% saying that more people of difference races
marrying each other has been a change …in our
society
Note: Mixed/Don’t Know/Refused (3%) are shown but not labeled.
Source: Pew Research Survey conducted Sept. 1-15, 2011, N=2,003 adults
PEW RESEARCH CENTER
8
The Rise of Intermarriage
www.pewsocialtrends.org
43.3%
14.4%
11.9%
30.4%
Other mixed
White/ Hispanic
White/Asian
White/ Black
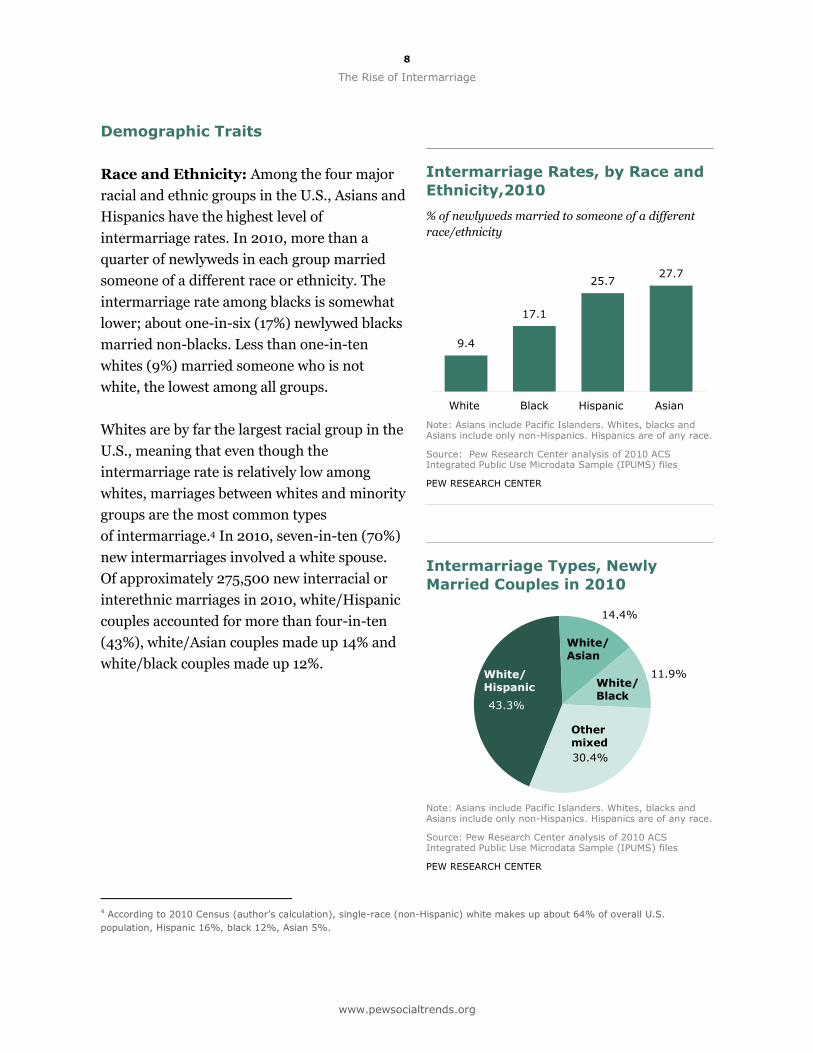
9.4
17.1
25.7 27.7
White Black Hispanic Asian
Demographic Traits
Race and Ethnicity: Among the four major
racial and ethnic groups in the U.S., Asians and
Hispanics have the highest level of
intermarriage rates. In 2010, more than a
quarter of newlyweds in each group married
someone of a different race or ethnicity. The
intermarriage rate among blacks is somewhat
lower; about one-in-six (17%) newlywed blacks
married non-blacks. Less than one-in-ten
whites (9%) married someone who is not
white, the lowest among all groups.
Whites are by far the largest racial group in the
U.S., meaning that even though the
intermarriage rate is relatively low among
whites, marriages between whites and minority
groups are the most common types
of intermarriage.4 In 2010, seven-in-ten (70%)
new intermarriages involved a white spouse.
Of approximately 275,500 new interracial or
interethnic marriages in 2010, white/Hispanic
couples accounted for more than four-in-ten
(43%), white/Asian couples made up 14% and
white/black couples made up 12%.
4 According to 2010 Census (author’s calculation), single-race (non-Hispanic) white makes up about 64% of overall U.S.
population, Hispanic 16%, black 12%, Asian 5%.
Intermarriage Rates, by Race and
Ethnicity,2010
% of newlyweds married to someone of a different
race/ethnicity
Note: Asians include Pacific Islanders. Whites, blacks and Asians include only non-Hispanics. Hispanics are of any race.
Source: Pew Research Center analysis of 2010 ACS Integrated Public Use Microdata Sample (IPUMS) files
PEW RESEARCH CENTER
Intermarriage Types, Newly
Married Couples in 2010
Note: Asians include Pacific Islanders. Whites, blacks and Asians include only non-Hispanics. Hispanics are of any race.
Source: Pew Research Center analysis of 2010 ACS Integrated Public Use Microdata Sample (IPUMS) files
PEW RESEARCH CENTER
9
PEW SOCIAL & DEMOGRAPHIC TRENDS
www.pewsocialtrends.org
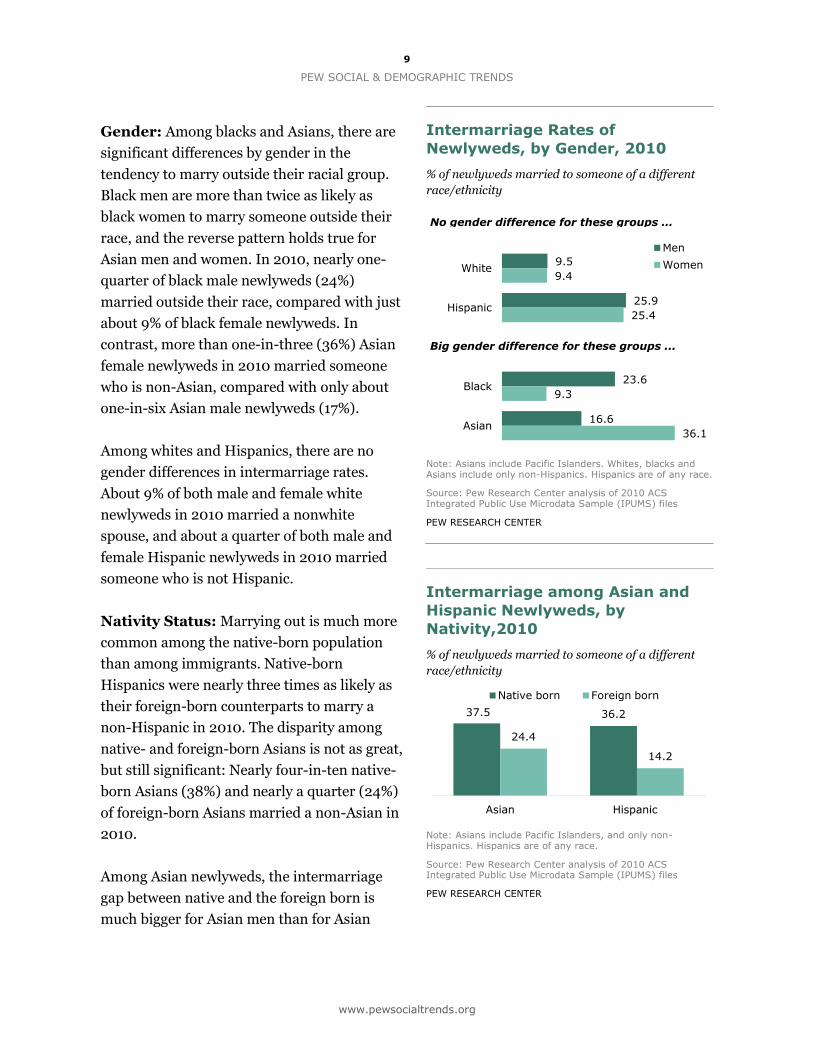
9.5
25.9
23.6
16.6
9.4
25.4
9.3
36.1
White
Hispanic
Black
Asian
Men
Women
No gender difference for these groups …
Big gender difference for these groups ...
37.5 36.2
24.4
14.2
Asian Hispanic
Native born Foreign born
Gender: Among blacks and Asians, there are
significant differences by gender in the
tendency to marry outside their racial group.
Black men are more than twice as likely as
black women to marry someone outside their
race, and the reverse pattern holds true for
Asian men and women. In 2010, nearly one-
quarter of black male newlyweds (24%)
married outside their race, compared with just
about 9% of black female newlyweds. In
contrast, more than one-in-three (36%) Asian
female newlyweds in 2010 married someone
who is non-Asian, compared with only about
one-in-six Asian male newlyweds (17%).
Among whites and Hispanics, there are no
gender differences in intermarriage rates.
About 9% of both male and female white
newlyweds in 2010 married a nonwhite
spouse, and about a quarter of both male and
female Hispanic newlyweds in 2010 married
someone who is not Hispanic.
Nativity Status: Marrying out is much more
common among the native-born population
than among immigrants. Native-born
Hispanics were nearly three times as likely as
their foreign-born counterparts to marry a
non-Hispanic in 2010. The disparity among
native- and foreign-born Asians is not as great,
but still significant: Nearly four-in-ten native-
born Asians (38%) and nearly a quarter (24%)
of foreign-born Asians married a non-Asian in
2010.
Among Asian newlyweds, the intermarriage
gap between native and the foreign born is
much bigger for Asian men than for Asian
Intermarriage Rates of
Newlyweds, by Gender, 2010
% of newlyweds married to someone of a different
race/ethnicity
Note: Asians include Pacific Islanders. Whites, blacks and Asians include only non-Hispanics. Hispanics are of any race.
Source: Pew Research Center analysis of 2010 ACS Integrated Public Use Microdata Sample (IPUMS) files
PEW RESEARCH CENTER
Intermarriage among Asian and
Hispanic Newlyweds, by
Nativity,2010
% of newlyweds married to someone of a different
race/ethnicity
Note: Asians include Pacific Islanders, and only non-Hispanics. Hispanics are of any race.
Source: Pew Research Center analysis of 2010 ACS Integrated Public Use Microdata Sample (IPUMS) files
PEW RESEARCH CENTER
10
The Rise of Intermarriage
www.pewsocialtrends.org
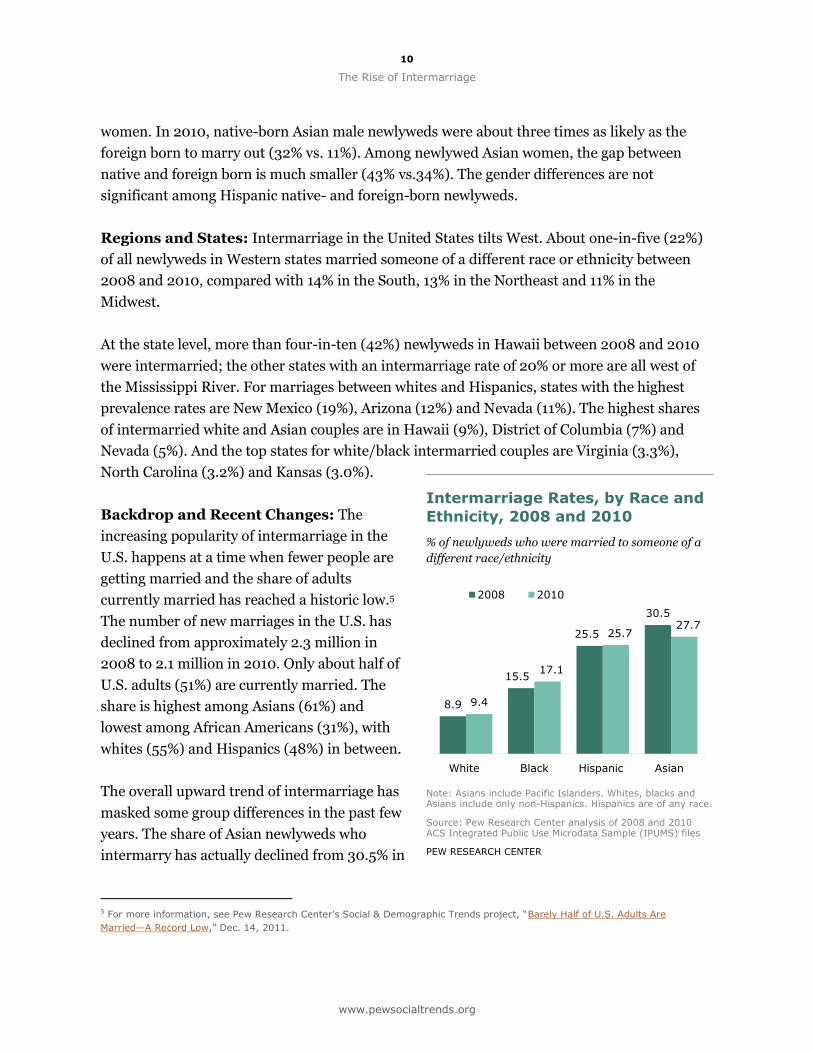
8.9
15.5
25.5
30.5
9.4
17.1
25.7 27.7
White Black Hispanic Asian
2008 2010
women. In 2010, native-born Asian male newlyweds were about three times as likely as the
foreign born to marry out (32% vs. 11%). Among newlywed Asian women, the gap between
native and foreign born is much smaller (43% vs.34%). The gender differences are not
significant among Hispanic native- and foreign-born newlyweds.
Regions and States: Intermarriage in the United States tilts West. About one-in-five (22%)
of all newlyweds in Western states married someone of a different race or ethnicity between
2008 and 2010, compared with 14% in the South, 13% in the Northeast and 11% in the
Midwest.
At the state level, more than four-in-ten (42%) newlyweds in Hawaii between 2008 and 2010
were intermarried; the other states with an intermarriage rate of 20% or more are all west of
the Mississippi River. For marriages between whites and Hispanics, states with the highest
prevalence rates are New Mexico (19%), Arizona (12%) and Nevada (11%). The highest shares
of intermarried white and Asian couples are in Hawaii (9%), District of Columbia (7%) and
Nevada (5%). And the top states for white/black intermarried couples are Virginia (3.3%),
North Carolina (3.2%) and Kansas (3.0%).
Backdrop and Recent Changes: The
increasing popularity of intermarriage in the
U.S. happens at a time when fewer people are
getting married and the share of adults
currently married has reached a historic low.5
The number of new marriages in the U.S. has
declined from approximately 2.3 million in
2008 to 2.1 million in 2010. Only about half of
U.S. adults (51%) are currently married. The
share is highest among Asians (61%) and
lowest among African Americans (31%), with
whites (55%) and Hispanics (48%) in between.
The overall upward trend of intermarriage has
masked some group differences in the past few
years. The share of Asian newlyweds who
intermarry has actually declined from 30.5% in
5 For more information, see Pew Research Center’s Social & Demographic Trends project, “Barely Half of U.S. Adults Are
Married—A Record Low,” Dec. 14, 2011.
Intermarriage Rates, by Race and
Ethnicity, 2008 and 2010
% of newlyweds who were married to someone of a
different race/ethnicity
Note: Asians include Pacific Islanders. Whites, blacks and Asians include only non-Hispanics. Hispanics are of any race.
Source: Pew Research Center analysis of 2008 and 2010 ACS Integrated Public Use Microdata Sample (IPUMS) files
PEW RESEARCH CENTER
11
PEW SOCIAL & DEMOGRAPHIC TRENDS
www.pewsocialtrends.org
2008 to 27.7% in 2010.6 In contrast, intermarriage has become more popular among blacks:
the share of black newlyweds who intermarry increased from 15.5% to 17.1% during the same
time period. The share among Hispanic newlyweds remains the same, and there is a slight
increase (0.5 percentage points) among whites who intermarried. Despite the small shifts of
intermarriage among Asians and blacks, the overall racial and ethnic composition in pairings
among intermarried newlyweds has been steady.
The slight decline of intermarriage rates among Asian newlyweds between 2008 and 2010 is
on a similar scale for both Asian males and females (about a 3-percentage-point drop for each).
However, the increase in the intermarriage rate among black newlyweds is slightly more
pronounced among males than females. The share of black male newlyweds marrying a non-
black spouse increased from 21.7% in 2008 to 23.6% in 2010, a rise of nearly 2 percentage
points. The rate for black female newlyweds increased by 1 percentage point.
Intermarriage rates for both native- and foreign-born Asians declined between 2008 and 2010,
but the drop is much more significant for native-born Asians (from 47% to 38%) than for
foreign-born Asian newlyweds (from 26% to 24%). In comparison, the intermarriage rate has
declined slightly for native-born Hispanics (from 39% to 36%) during the same period, but
increased slightly for foreign-born Hispanics (from 12% to 14%).
Looking back in time: Variances between newlywed couples who married out and those
who married in were also found among couples who married at an earlier time, but in a
somewhat different manner. For example, in the 2008 to 2010 period, there is virtually no
difference in the share of first-time marriages between those who married out and married in
(58% for those who married in; 59% for those who married out). However, among the couples
who got married prior to 1980 and are still married, the share of marriages between spouses
who married for the first time is higher among intra-married couples than intermarried
couples (84% vs. 74%).
Among couples who got married before 1980 and are still married, intermarried white/black
couples have somewhat higher education level than white/white couples: about 20% of
white/black couples are college-educated, compared with 18% of white couples. But about 17%
of white/back couples who got married in the past decade (2000-2010) are college-educated,
compared with 26% of white couples.
6 For more information about intermarriage rates in 2008 and long-term trends by race, gender and nativity, see Pew Research
Center’s Social & Demographic Trends project, “Marrying Out: One-in-Seven New U.S. Marriages is Interracial or Interethnic,”
June 4, 2010.

12
The Rise of Intermarriage
www.pewsocialtrends.org
As far as the age difference goes, intermarried white men are slightly older than their Asian
wives (1.2 years) for the cohort that got married prior to 1980; the age difference increases to
nearly five years (4.8) among the same type of couples who married in the past decade. The age
difference among white couples is the same for both cohorts.
Divorce. Several studies using government data have found that overall divorce rates are
higher for couples who married out than for those who married in—but here, too, the patterns
vary by the racial and gender characteristics of the couples. An analysis conducted a decade
ago found that 10 years after they married, interracial couples had a 41% chance of separation
or divorce, compared with a 31% chance among couples who married within their race,
according to a study based on the 1995 National Survey of Family Growth (NSFG).7 A
subsequent study which analyzed 2002 NSFG data found that “although interracial marriages
overall are more vulnerable to divorce, this reflects the experience of some but not all couples.”
It found that after 10 years of marriage, interracial marriages that are most vulnerable to
divorce involve white females and non-White males (with the exception of white females/
Hispanic white males) relative to white/white couples. Conversely, there is little or no
difference in divorce rates among white men/non-white women couples, and white men/black
women couples are actually substantially less likely than white/white couples to divorce by the
10th year of marriage. 8
Another study using 1990 to 2001 data from the Survey of Income and Program Participation
(SIPP) suggests that on the whole, interracial marriages are less stable than same-
race/ethnicity marriages, but marital dissolution was found to be strongly associated with the
race or ethnicity of the individuals in the union. The authors found that “the results failed to
provide evidence that interracial marriage per se is associated with an elevated risk of marital
dissolution.”9 Mixed marriages involving blacks and whites were the least stable followed by
Hispanics-white couples, whereas mixed marriages involving Asians and whites were even
more stable than same-race white marriages.
7 Bramlett, M.D. and W.D. Mosher. 2002. “Cohabitation, Marriage, Divorce, and Remarriage in the United States,” Vital and
Health Statistics, vol. 23, no. 22. Hyattsville, MD: National Center for Health Statistics. 8 Bratter, J.L. and R.B. King. 2008. “ ‘But Will It Last?’ Marital Instability Among Interracial and Same-Race Couples,” Family
Relations, vol. 57, no. 2: 160-171. 9 Zhang, Y. and J. Van Hook. 2009. “Marital Dissolution Among Interracial Couples,” Journal of Marriage and Family, vol. 71, no.
1.
13
PEW SOCIAL & DEMOGRAPHIC TRENDS
www.pewsocialtrends.org
CHAPTER 2: CHARACTERISTICS OF INTERMARRIED
NEWLYWEDS
This chapter provides a detailed look at the economic and demographic characteristics of
intermarried newlyweds in comparison with those who married in. To include a bigger sample
size for subgroups, analyses of characteristics of newlyweds in this report are based on a
combined three-year (2008-2010) dataset of newlyweds.
The analyses start with the overall comparison between intermarried and intra-married
couples, and then present a second layer of comparisons among seven pairs of newlyweds who
are either of same race/ethnicity or intermarried with whites (white/Hispanic, white/Asian,
white/black), and a third layer of comparisons among all newlyweds by the race or ethnicity of
the husband and wife. Only intermarried couples involving a white spouse were analyzed for
characteristic comparisons, and they represent about 68% of all intermarried newlyweds from
2008-2010.
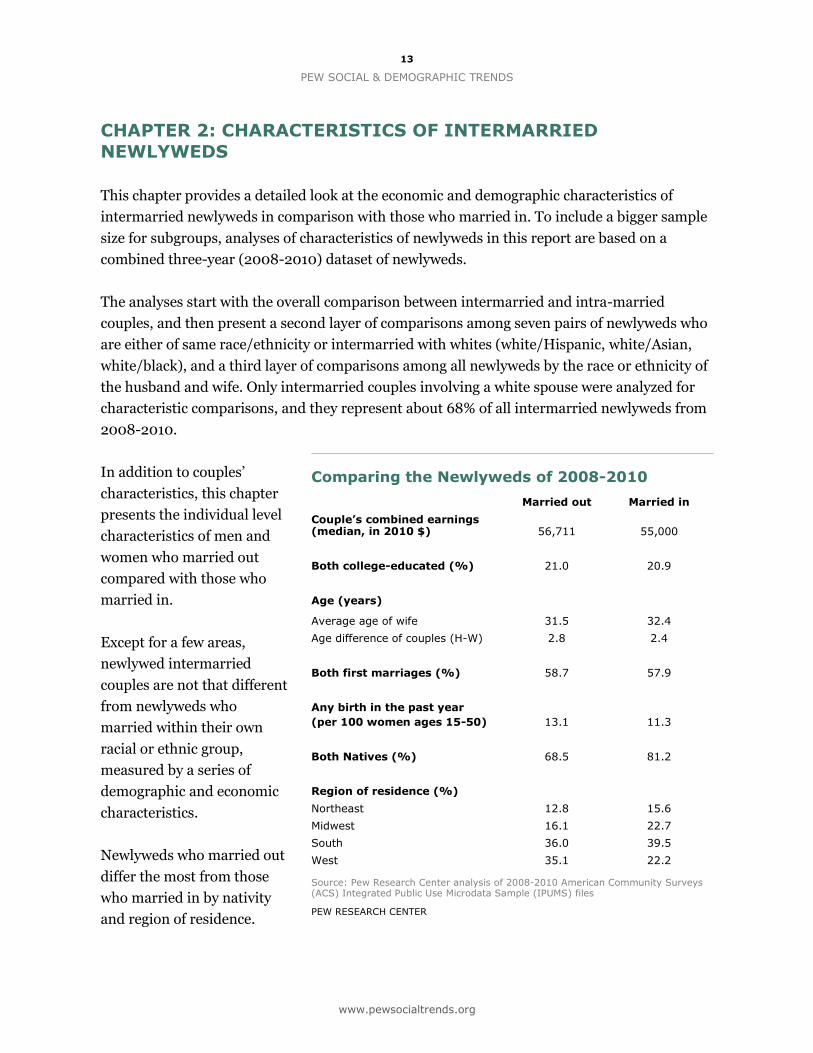
In addition to couples’
characteristics, this chapter
presents the individual level
characteristics of men and
women who married out
compared with those who
married in.
Except for a few areas,
newlywed intermarried
couples are not that different
from newlyweds who
married within their own
racial or ethnic group,
measured by a series of
demographic and economic
characteristics.
Newlyweds who married out
differ the most from those
who married in by nativity
and region of residence.
Comparing the Newlyweds of 2008-2010
Married out Married in
Couple’s combined earnings (median, in 2010 $) 56,711 55,000
Both college-educated (%) 21.0 20.9
Age (years)
Average age of wife 31.5 32.4
Age difference of couples (H-W) 2.8 2.4
Both first marriages (%) 58.7 57.9
Any birth in the past year
(per 100 women ages 15-50) 13.1 11.3
Both Natives (%) 68.5 81.2
Region of residence (%)
Northeast 12.8 15.6
Midwest 16.1 22.7
South 36.0 39.5
West 35.1 22.2
Source: Pew Research Center analysis of 2008-2010 American Community Surveys (ACS) Integrated Public Use Microdata Sample (IPUMS) files
PEW RESEARCH CENTER
14
The Rise of Intermarriage
www.pewsocialtrends.org
$70,952
$62,000
$60,000
$57,900
$53,187
$47,700
$35,578
White/Asian
Asian/Asian
White/White
White/Hispanic
White/Black
Black/Black
Hispanic/Hisp.
Mixed couples are less likely than non-mixed couples to be both native born. Nearly seven-in-
ten mixed couples (68.5%) are both native-born U.S. citizens, compared with 81% of non-
mixed couples who fall in the same category.
Geographically, mixed couples are more likely to live in the Western states of the U.S. and less
likely to live in the Midwest region than the same-group couples, perhaps in part because of
the population diversity of these regions.
However in many ways these two groups are not that different: Couples in a mixed union have
somewhat higher combined earnings than those who are from the same racial or ethnic group
($56,711 vs. $55,000). Newlyweds in mixed couples are equally likely as those in non-mixed
couples to be both college educated.
Age of the spouses in the two types of unions is similar, and the age difference between
husband and wife is only slightly bigger in mixed couples than for couples of same race and
ethnicity (2.8 years vs. 2.4),
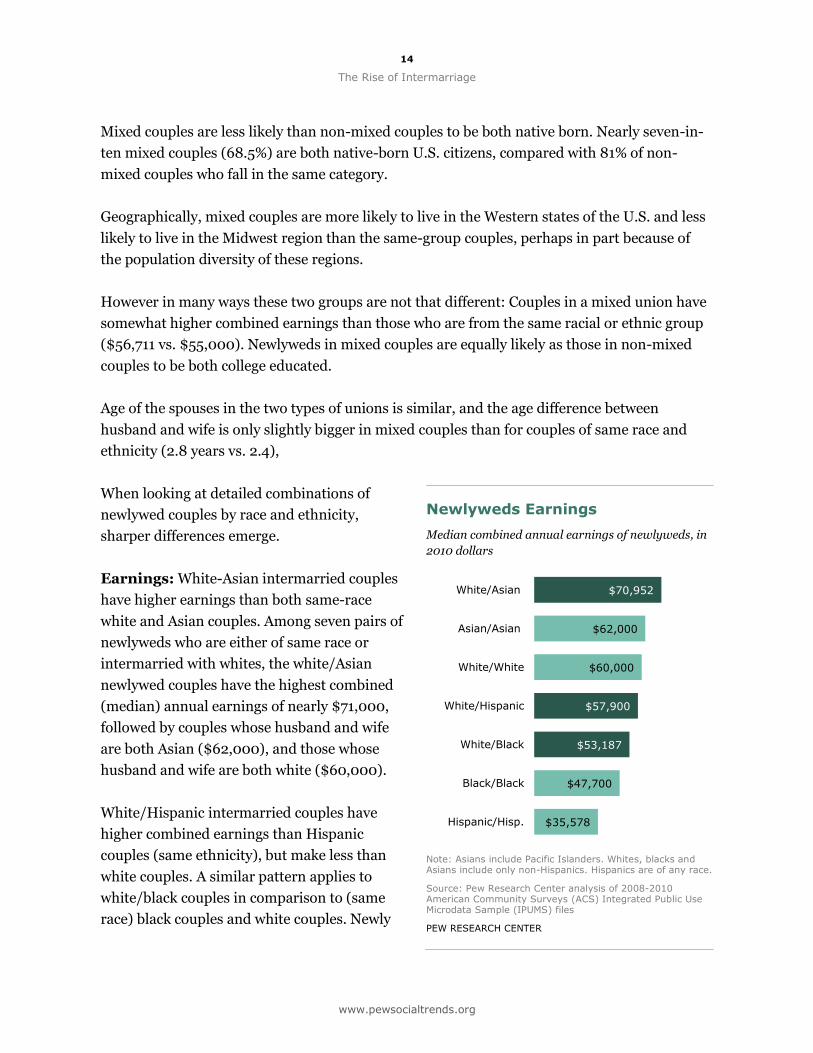
When looking at detailed combinations of
newlywed couples by race and ethnicity,
sharper differences emerge.
Earnings: White-Asian intermarried couples
have higher earnings than both same-race
white and Asian couples. Among seven pairs of
newlyweds who are either of same race or
intermarried with whites, the white/Asian
newlywed couples have the highest combined
(median) annual earnings of nearly $71,000,
followed by couples whose husband and wife
are both Asian ($62,000), and those whose
husband and wife are both white ($60,000).
White/Hispanic intermarried couples have
higher combined earnings than Hispanic
couples (same ethnicity), but make less than
white couples. A similar pattern applies to
white/black couples in comparison to (same
race) black couples and white couples. Newly
Newlyweds Earnings
Median combined annual earnings of newlyweds, in
2010 dollars
Note: Asians include Pacific Islanders. Whites, blacks and Asians include only non-Hispanics. Hispanics are of any race.
Source: Pew Research Center analysis of 2008-2010 American Community Surveys (ACS) Integrated Public Use Microdata Sample (IPUMS) files
PEW RESEARCH CENTER
15
PEW SOCIAL & DEMOGRAPHIC TRENDS
www.pewsocialtrends.org
52.7
41.2
23.3
18.6
14.5
10.2
5.4
Asian/Asian
White/Asian
White/White
White/Hispanic
White/Black
Black/Black
Hispanic/Hisp.
married couples whose husband and wife are both Hispanic make the lowest combined
earnings of about $35,600 per year. Black couples are doing better, with about $12,000 more
than the Hispanic couples. In contrast, Hispanics who married whites have a combined
earning of $57,900, much higher than Hispanics who married in. Similarly, black/white
couples make higher earnings than black/black couples (about $53,200 vs. $47,700).
Meanwhile, both white/Hispanic and white/black intermarried newlyweds have a lower
combined earning than newlyweds whose husband and wife are both white.
The earning differences of couples reflect the general pattern of income disparity among
families of different racial and ethnic background in the U.S. In 2009, the median family
income was $75,027 for Asians, $62,545 for whites, $39,730 for Hispanics, and $38,409 for
black families.10
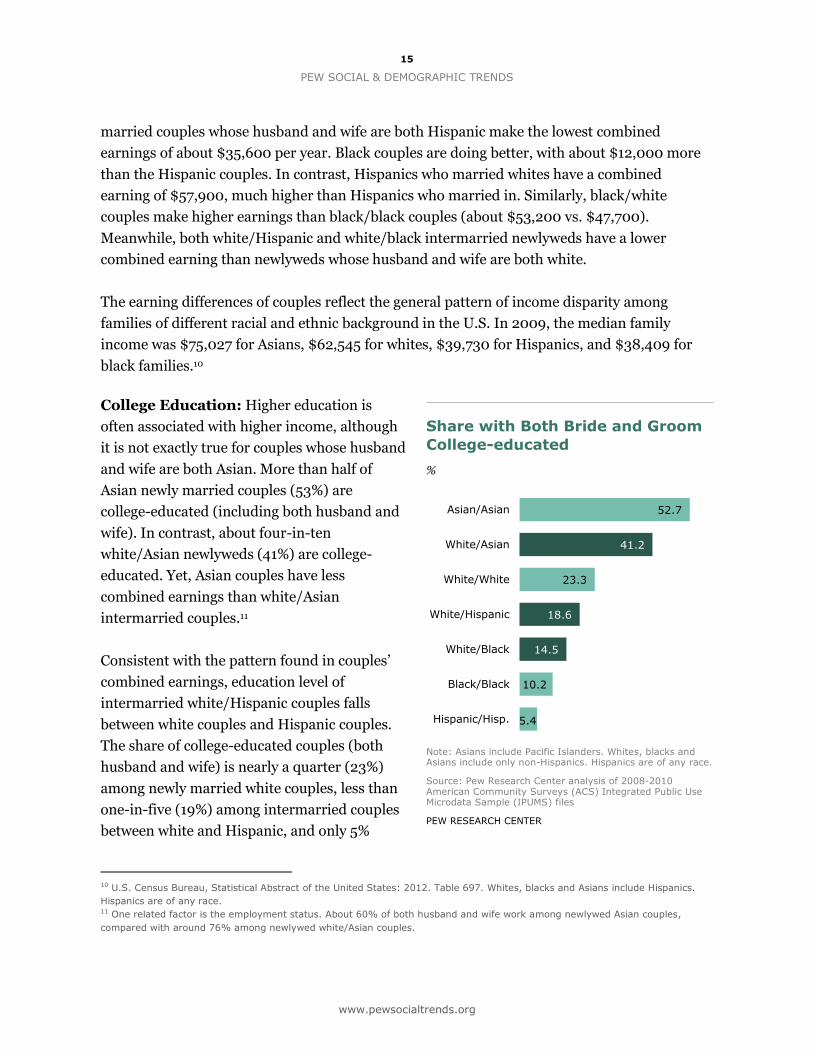
College Education: Higher education is
often associated with higher income, although
it is not exactly true for couples whose husband
and wife are both Asian. More than half of
Asian newly married couples (53%) are
college-educated (including both husband and
wife). In contrast, about four-in-ten
white/Asian newlyweds (41%) are college-
educated. Yet, Asian couples have less
combined earnings than white/Asian
intermarried couples.11
Consistent with the pattern found in couples’
combined earnings, education level of
intermarried white/Hispanic couples falls
between white couples and Hispanic couples.
The share of college-educated couples (both
husband and wife) is nearly a quarter (23%)
among newly married white couples, less than
one-in-five (19%) among intermarried couples
between white and Hispanic, and only 5%
10 U.S. Census Bureau, Statistical Abstract of the United States: 2012. Table 697. Whites, blacks and Asians include Hispanics.
Hispanics are of any race. 11 One related factor is the employment status. About 60% of both husband and wife work among newlywed Asian couples,
compared with around 76% among newlywed white/Asian couples.
Share with Both Bride and Groom
College-educated
%
Note: Asians include Pacific Islanders. Whites, blacks and Asians include only non-Hispanics. Hispanics are of any race.
Source: Pew Research Center analysis of 2008-2010 American Community Surveys (ACS) Integrated Public Use Microdata Sample (IPUMS) files
PEW RESEARCH CENTER
16
The Rise of Intermarriage
www.pewsocialtrends.org
78.9
68.4
58.7
58.6
55.3
54.1
53.7
Asian/Asian
Hispanic/Hisp.
White/Hispanic
White/Asian
White/White
Black/Black
White/Black
among Hispanic couples. Similarly, intermarried white/black newlyweds are more likely than
black couples to be college-educated (15% vs. 10%), but less likely than white couples (23%).
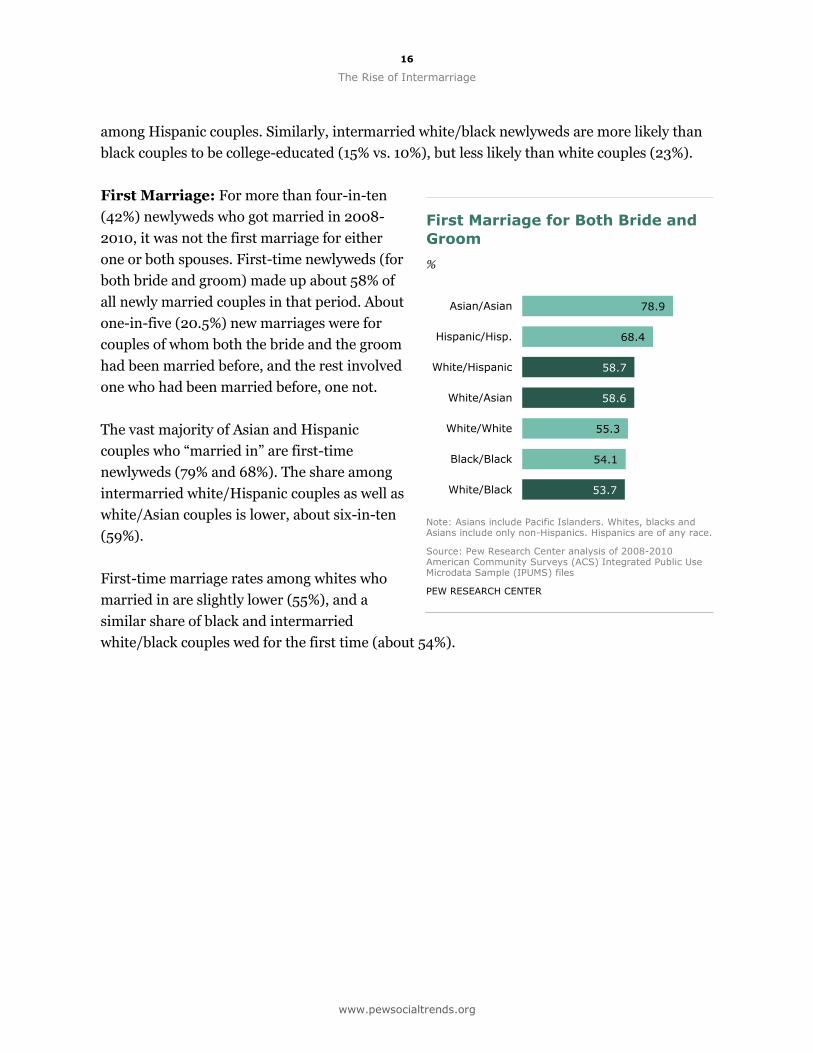
First Marriage: For more than four-in-ten
(42%) newlyweds who got married in 2008-
2010, it was not the first marriage for either
one or both spouses. First-time newlyweds (for
both bride and groom) made up about 58% of
all newly married couples in that period. About
one-in-five (20.5%) new marriages were for
couples of whom both the bride and the groom
had been married before, and the rest involved
one who had been married before, one not.
The vast majority of Asian and Hispanic
couples who “married in” are first-time
newlyweds (79% and 68%). The share among
intermarried white/Hispanic couples as well as
white/Asian couples is lower, about six-in-ten
(59%).
First-time marriage rates among whites who
married in are slightly lower (55%), and a
similar share of black and intermarried
white/black couples wed for the first time (about 54%).
First Marriage for Both Bride and
Groom
%
Note: Asians include Pacific Islanders. Whites, blacks and Asians include only non-Hispanics. Hispanics are of any race.
Source: Pew Research Center analysis of 2008-2010 American Community Surveys (ACS) Integrated Public Use Microdata Sample (IPUMS) files
PEW RESEARCH CENTER
17
PEW SOCIAL & DEMOGRAPHIC TRENDS
www.pewsocialtrends.org
39.0%
24.1%
21.7%
15.2%
North-east
South
West
Midwest 34.5%
37.1%
15.5%
13.0%
North-east
South
West
Midwest
26.7%
42.9%
15.5%
14.9%
North-east
South
West
Midwest
50.9
%
15.7
%
19.8
%
13.6
%
North-east
South West
Midwest
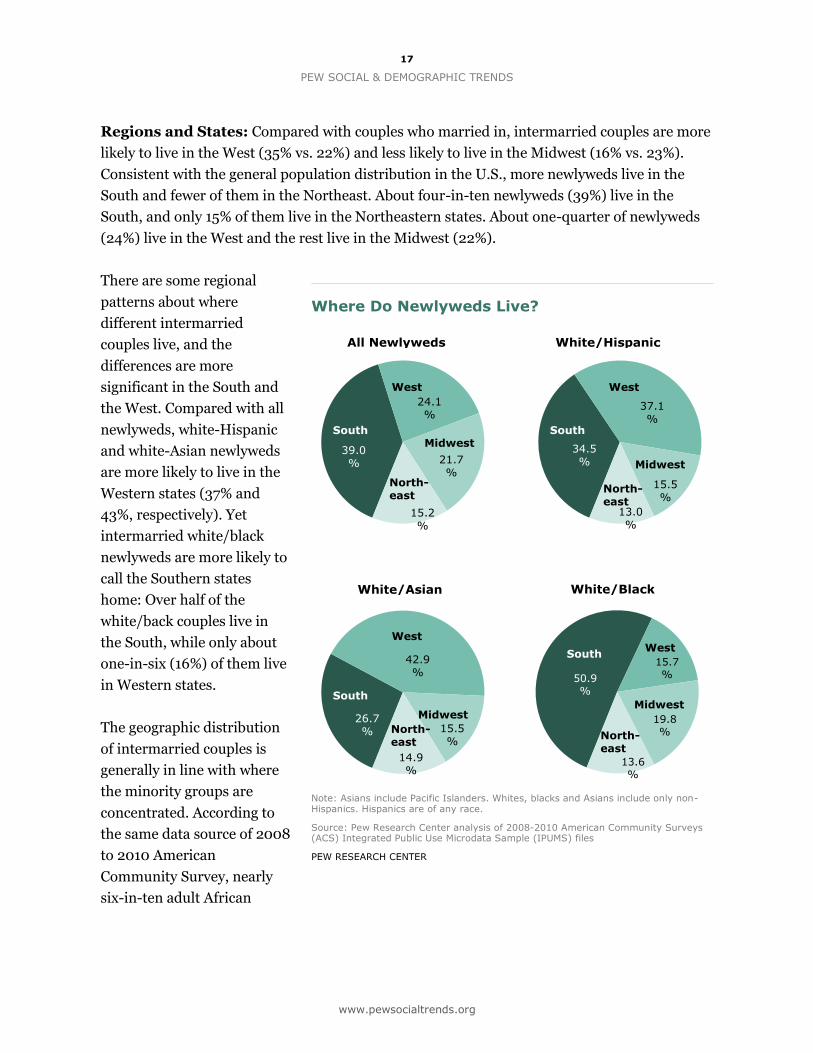
Regions and States: Compared with couples who married in, intermarried couples are more
likely to live in the West (35% vs. 22%) and less likely to live in the Midwest (16% vs. 23%).
Consistent with the general population distribution in the U.S., more newlyweds live in the
South and fewer of them in the Northeast. About four-in-ten newlyweds (39%) live in the
South, and only 15% of them live in the Northeastern states. About one-quarter of newlyweds
(24%) live in the West and the rest live in the Midwest (22%).
There are some regional
patterns about where
different intermarried
couples live, and the
differences are more
significant in the South and
the West. Compared with all
newlyweds, white-Hispanic
and white-Asian newlyweds
are more likely to live in the
Western states (37% and
43%, respectively). Yet
intermarried white/black
newlyweds are more likely to
call the Southern states
home: Over half of the
white/back couples live in
the South, while only about
one-in-six (16%) of them live
in Western states.
The geographic distribution
of intermarried couples is
generally in line with where
the minority groups are
concentrated. According to
the same data source of 2008
to 2010 American
Community Survey, nearly
six-in-ten adult African
Where Do Newlyweds Live?
Note: Asians include Pacific Islanders. Whites, blacks and Asians include only non-Hispanics. Hispanics are of any race.
Source: Pew Research Center analysis of 2008-2010 American Community Surveys (ACS) Integrated Public Use Microdata Sample (IPUMS) files
PEW RESEARCH CENTER
White/Hispanic All Newlyweds
White/Black White/Asian
18
The Rise of Intermarriage
www.pewsocialtrends.org
Americans (57%) live in the South, while almost half of Asian Americans (48%) and four-in-ten
Hispanics (41%) live in Western states.
The intermarriage rate in the United States tilts West as well, judging by the share of
intermarried newlyweds out of all newlyweds. About one-in-five (22%) of all newlyweds in the
Western states between 2008 and 2010 married someone of a different race or ethnicity,
compared with 14% in the South, 13% in the Northeast, and 11% in the Midwest.
At the state level, Hawaii has the highest intermarriage rate among newlywed couples. More
than four-in-ten (42%) newlyweds in Hawaii from 2008-2010 were intermarried. Out-
marriage rates of 20% or more occurred in Oklahoma (26%), Nevada (26%), New Mexico
(25%), Alaska (24%), California (23%), Arizona (22%), Washington (21%) and Oregon (20%)—
all situated west of the Mississippi River.
Nearly one-in-five (19%) of all newlyweds in New Mexico between 2008 and 2010 were
white/Hispanic couples, which makes New Mexico the No. 1 state in terms of the prevalence of
white/Hispanic couples. States with the next highest shares of newlywed white/Hispanic
couples were Arizona (12%) and Nevada (11%).
The highest rates of newlywed white/Asian couples are in Hawaii (9%), the District of
Columbia (7%) and Nevada (5%). And the top three states for white/black intermarried
couples are Virginia, North Carolina and Kansas, which all have rates of about 3%.
In contrast, white couples are more prevalent in the Midwest, where 77% of newlywed
husbands and wives from 2008 to 2010 were both white. Western states have the lowest share
of white couples among newlyweds; only about half of the newlyweds are white couples. On the
state level, Vermont has the highest proportion of newlywed white couples. Among newlywed
married in 2008-2010, 94% in Vermont were white couples, followed by Maine (92%) and
West Virginia (88%). At the same time, in Hawaii, only a quarter of newlyweds were white
couples, and the share in New Mexico and California was only 34% and 36%, respectively.
For more details about the state and region level information of newlyweds, see Appendix 2.
19
PEW SOCIAL & DEMOGRAPHIC TRENDS
www.pewsocialtrends.org
$71,800
$70,952
$62,000
$60,990
$60,762
$60,000
$53,000
$52,660
$47,700
$35,578
Asian-White
White-Asian
Asian-Asian
White-Hispanic
White-Black
White-White
Hispanic-White
Black-White
Black-Black
Hispanic-Hisp.
(Husband-Wife) % of all couples
0.6
1.6
3.5
3.1
0.4
62.0
3.2
1.3
7.7
11.1
Ranking the Newlyweds by Husband and Wife’s Race/Ethnicity
By husband and wife’s race or ethnicity, newlyweds are further divided into 10 groups,
including four groups of intra-married couples (white, Hispanic, Asian and black) as well as six
types of mixed couples involving a white husband or wife. The couple is indicated in the format
that the husband’s race/ethnicity goes first and the wife’s race/ethnicity goes second. For
example, “Asian/white” refers to couples in which the husband is Asian and the wife is white.
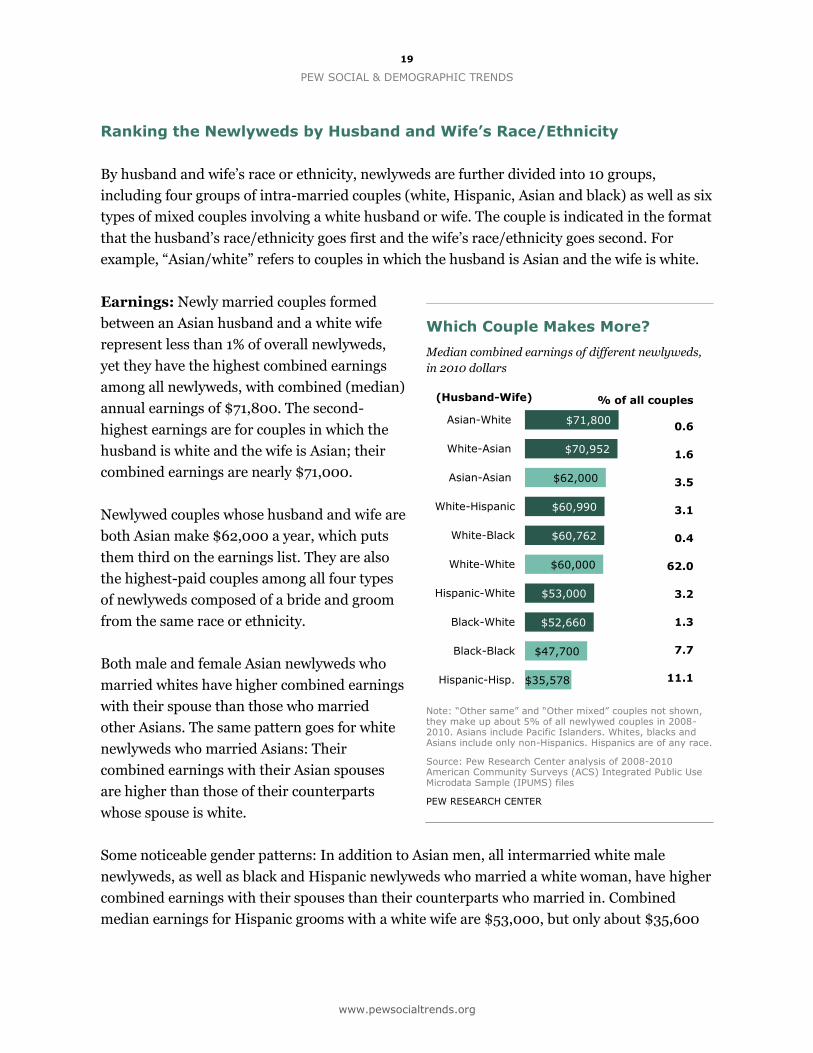
Earnings: Newly married couples formed
between an Asian husband and a white wife
represent less than 1% of overall newlyweds,
yet they have the highest combined earnings
among all newlyweds, with combined (median)
annual earnings of $71,800. The second-
highest earnings are for couples in which the
husband is white and the wife is Asian; their
combined earnings are nearly $71,000.
Newlywed couples whose husband and wife are
both Asian make $62,000 a year, which puts
them third on the earnings list. They are also
the highest-paid couples among all four types
of newlyweds composed of a bride and groom
from the same race or ethnicity.
Both male and female Asian newlyweds who
married whites have higher combined earnings
with their spouse than those who married
other Asians. The same pattern goes for white
newlyweds who married Asians: Their
combined earnings with their Asian spouses
are higher than those of their counterparts
whose spouse is white.
Some noticeable gender patterns: In addition to Asian men, all intermarried white male
newlyweds, as well as black and Hispanic newlyweds who married a white woman, have higher
combined earnings with their spouses than their counterparts who married in. Combined
median earnings for Hispanic grooms with a white wife are $53,000, but only about $35,600
Which Couple Makes More?
Median combined earnings of different newlyweds,
in 2010 dollars
Note: “Other same” and “Other mixed” couples not shown, they make up about 5% of all newlywed couples in 2008-2010. Asians include Pacific Islanders. Whites, blacks and Asians include only non-Hispanics. Hispanics are of any race.
Source: Pew Research Center analysis of 2008-2010 American Community Surveys (ACS) Integrated Public Use Microdata Sample (IPUMS) files
PEW RESEARCH CENTER
20
The Rise of Intermarriage
www.pewsocialtrends.org
52.7
47.1
39.0
23.3
20.5
20.5
16.8
12.5
10.2
5.4
Asian-Asian
Asian-White
White-Asian
White-White
White-Hispanic
White-Black
Hispanic-White
Black-White
Black-Black
Hispanic-Hisp.
(Husband-Wife)
for Hispanic grooms who married a Hispanic wife. Similarly, combined couple earnings for
black grooms who married a white wife (around $52,700) are higher than blacks who married
in ($47,700). The earning difference is less significant for white grooms, but those who
married a Hispanic or black wife still have slightly higher combined earnings with their wife
than their counterparts who married a white wife.
It is a somewhat different story for brides: Asian brides who married a white husband have
higher combined earnings than their counterparts who married an Asian husband. Hispanic
and black brides who married a white husband also have significantly higher combined
earnings with their husbands (around $61,ooo) than their counterparts who married within
their own racial or ethnic group (less than
$48,000). White brides who married Hispanic
or black husbands, on the other hand, have
slightly lower combined earnings than their
counterparts who married a white husband.
However, combined earnings for white brides
with an Asian husband are much higher than
for white brides who married in.
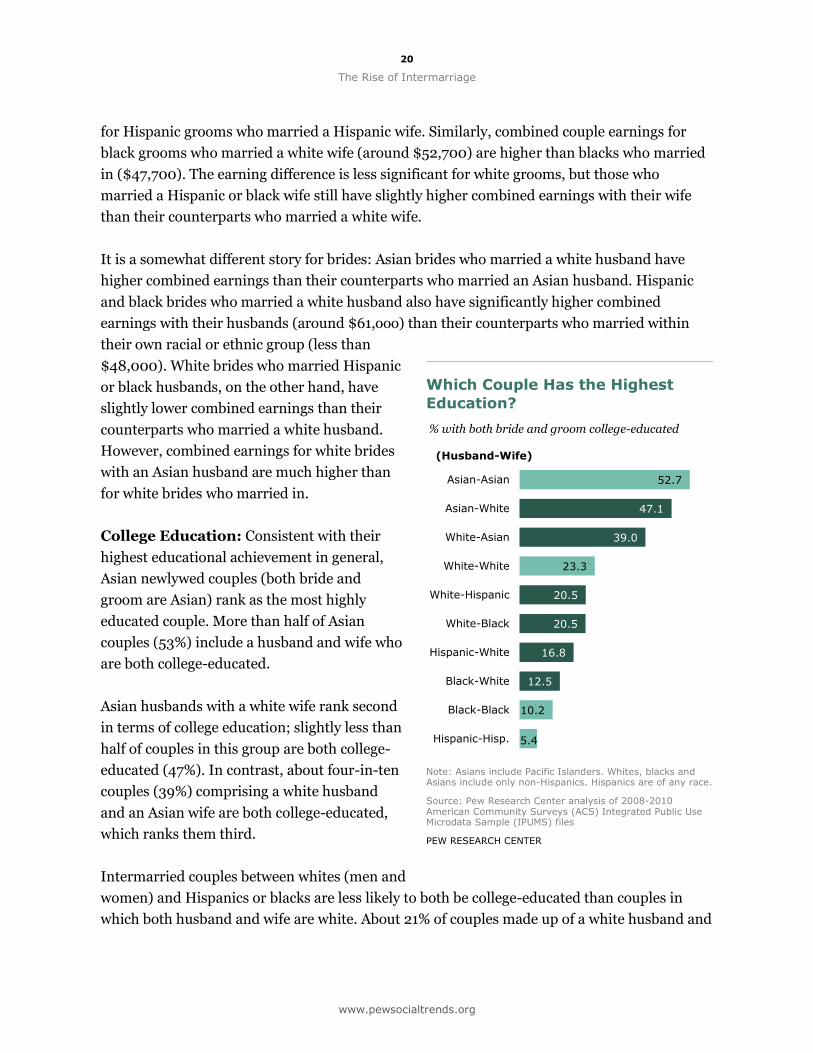
College Education: Consistent with their
highest educational achievement in general,
Asian newlywed couples (both bride and
groom are Asian) rank as the most highly
educated couple. More than half of Asian
couples (53%) include a husband and wife who
are both college-educated.
Asian husbands with a white wife rank second
in terms of college education; slightly less than
half of couples in this group are both college-
educated (47%). In contrast, about four-in-ten
couples (39%) comprising a white husband
and an Asian wife are both college-educated,
which ranks them third.
Intermarried couples between whites (men and
women) and Hispanics or blacks are less likely to both be college-educated than couples in
which both husband and wife are white. About 21% of couples made up of a white husband and
Which Couple Has the Highest
Education?
% with both bride and groom college-educated
Note: Asians include Pacific Islanders. Whites, blacks and Asians include only non-Hispanics. Hispanics are of any race.
Source: Pew Research Center analysis of 2008-2010 American Community Surveys (ACS) Integrated Public Use Microdata Sample (IPUMS) files
PEW RESEARCH CENTER
21
PEW SOCIAL & DEMOGRAPHIC TRENDS
www.pewsocialtrends.org
78.9
69.8
68.4
60.6
56.8
55.3
54.9
54.4
54.1
50.1
Asian-Asian
Asian-White
Hispanic-Hisp.
Hispanic-White
White-Hispanic
White-White
Black-White
White-Asian
Black-Black
White-Black
(Husband-Wife)
a Hispanic or black wife are college-educated, compared with 23% of white couples. And the
gaps between white couples and couples involving a white wife and a Hispanic or black
husband are bigger. Only about 17% of couples consisting of Hispanic men and white women
and 12% of couples consisting of black men and white women are college-educated, compared
with nearly a quarter of the white couples (23%).
On the flip side, compared with their counterparts who married in, Hispanics and blacks (both
men and women) who married whites are more likely to be in a union where both partners are
college-educated.
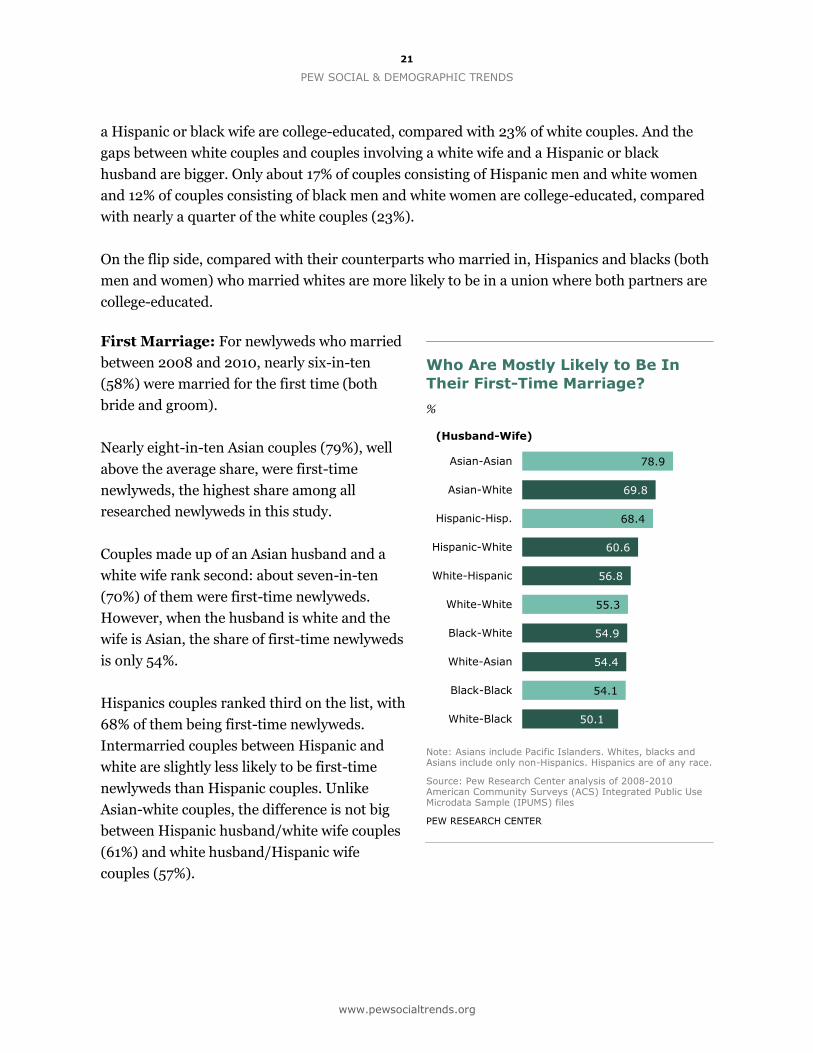
First Marriage: For newlyweds who married
between 2008 and 2010, nearly six-in-ten
(58%) were married for the first time (both
bride and groom).
Nearly eight-in-ten Asian couples (79%), well
above the average share, were first-time
newlyweds, the highest share among all
researched newlyweds in this study.
Couples made up of an Asian husband and a
white wife rank second: about seven-in-ten
(70%) of them were first-time newlyweds.
However, when the husband is white and the
wife is Asian, the share of first-time newlyweds
is only 54%.
Hispanics couples ranked third on the list, with
68% of them being first-time newlyweds.
Intermarried couples between Hispanic and
white are slightly less likely to be first-time
newlyweds than Hispanic couples. Unlike
Asian-white couples, the difference is not big
between Hispanic husband/white wife couples
(61%) and white husband/Hispanic wife
couples (57%).
Who Are Mostly Likely to Be In
Their First-Time Marriage?
%
Note: Asians include Pacific Islanders. Whites, blacks and Asians include only non-Hispanics. Hispanics are of any race.
Source: Pew Research Center analysis of 2008-2010 American Community Surveys (ACS) Integrated Public Use Microdata Sample (IPUMS) files
PEW RESEARCH CENTER

22
The Rise of Intermarriage
www.pewsocialtrends.org
5.3
3.3
2.9
2.7
2.5
2.5
2.4
2.4
2.3
2.1
White-Asian
Asian-Asian
Black-Black
White-Black
Asian-White
White-Hispanic
Black-White
Hispanic-Hisp.
White-White
Hispanic-White
(Husband-Wife)
For about 55% of white newlyweds (both husband and wife white), it was their first marriage.
This share is virtually equal among couples of black husband/white wife, white husband/Asian
wife, and black husband/black wife (black couples). The newlywed couples consisting of a
white man and a black woman have the lowest share of being first marriage for both (50%);
about half of them have at least one spouse who has been married before.
Age Difference: Among newlyweds married
between 2008 and 2010, the husband is on
average about 2.5 years older than his wife.
With an age difference of more than five years,
newlyweds involving a white husband and an
Asian wife top the list in terms of age
differences.
Asian and black newlywed couples who
“married in” also have a relatively larger age
difference between the husband and wife. On
average, an Asian husband is more than three
years (3.3) older than his wife who is also
Asian, and a black husband is nearly three
years (2.9) older than his wife of same race.
The age difference between husband and wife
is more similar among the rest of couples,
which ranges from 2.1 years (Hispanic
husband/white wife) to 2.7 years (white
husband/black wife).
Age Difference of the Newlyweds
in years (Husband minus wife)
Note: Asians include Pacific Islanders. Whites, blacks and Asians include only non-Hispanics. Hispanics are of any race.
Source: Pew Research Center analysis of 2008-2010 American Community Surveys (ACS) Integrated Public Use Microdata Sample (IPUMS) files
PEW RESEARCH CENTER
23
PEW SOCIAL & DEMOGRAPHIC TRENDS
www.pewsocialtrends.org
32.3 37.3
33.1 32.5
51.3 57.2
32.3 25.8
White men White women
White spouse Hispanic spouse
Asian spouse Black spouse
22.8
32.5
10.4 13.1
Hispanic men Hispanic women
White spouse Hispanic spouse
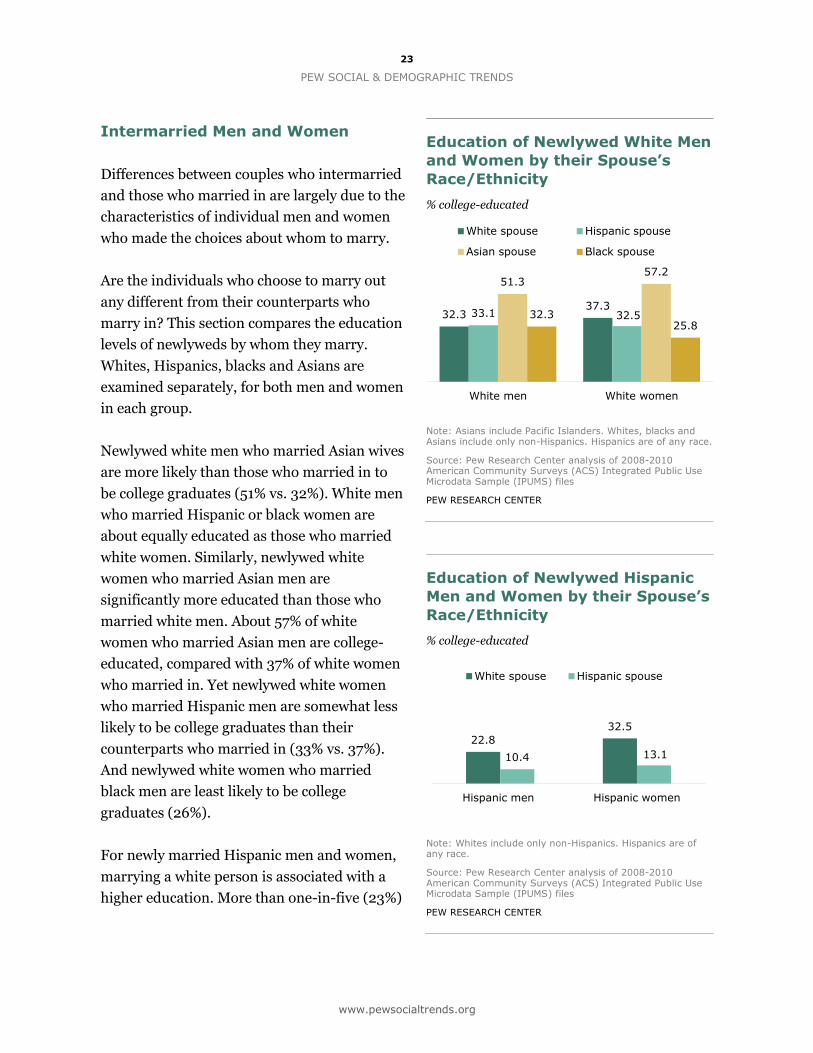
Intermarried Men and Women
Differences between couples who intermarried
and those who married in are largely due to the
characteristics of individual men and women
who made the choices about whom to marry.
Are the individuals who choose to marry out
any different from their counterparts who
marry in? This section compares the education
levels of newlyweds by whom they marry.
Whites, Hispanics, blacks and Asians are
examined separately, for both men and women
in each group.
Newlywed white men who married Asian wives
are more likely than those who married in to
be college graduates (51% vs. 32%). White men
who married Hispanic or black women are
about equally educated as those who married
white women. Similarly, newlywed white
women who married Asian men are
significantly more educated than those who
married white men. About 57% of white
women who married Asian men are college-
educated, compared with 37% of white women
who married in. Yet newlywed white women
who married Hispanic men are somewhat less
likely to be college graduates than their
counterparts who married in (33% vs. 37%).
And newlywed white women who married
black men are least likely to be college
graduates (26%).
For newly married Hispanic men and women,
marrying a white person is associated with a
higher education. More than one-in-five (23%)
Education of Newlywed White Men
and Women by their Spouse’s
Race/Ethnicity
% college-educated
Note: Asians include Pacific Islanders. Whites, blacks and Asians include only non-Hispanics. Hispanics are of any race.
Source: Pew Research Center analysis of 2008-2010 American Community Surveys (ACS) Integrated Public Use Microdata Sample (IPUMS) files
PEW RESEARCH CENTER
Education of Newlywed Hispanic
Men and Women by their Spouse’s
Race/Ethnicity
% college-educated
Note: Whites include only non-Hispanics. Hispanics are of any race.
Source: Pew Research Center analysis of 2008-2010 American Community Surveys (ACS) Integrated Public Use Microdata Sample (IPUMS) files
PEW RESEARCH CENTER

24
The Rise of Intermarriage
www.pewsocialtrends.org
61.3 60.3 61.8 62.8
Asian men Asian women
White spouse Asian spouse
20.3 31.2
18.0 24.3
Black men Black women
White spouse Black spouse
Hispanic men who married a white woman are
college-educated, compared with only 10% of
Hispanic men who married a Hispanic woman.
Similarly, nearly one-in-three (33%) Hispanic
women who married a white husband are
college-educated, compared with only 13% of
their counterparts who married a Hispanic
husband.
The education selection of those who married
out among newlywed Asian men and women
are minimal. About six-in-ten newly married
Asian men are college-educated, regardless of
whether their spouse is white or Asian. Asian
women who married whites are slightly less
likely than those who married Asians to be
college-educated (60% vs. 63%), even though
both groups of wives are highly educated.
Finally, newlywed black men and women who
married a white spouse are somewhat more
educated than their counterparts who married
a black spouse, but the difference is not as big
as among newlywed Hispanics. About one-in-
five (20%) black men who married white
women are college-educated, compared with
about 18% of black men who married in. For
black women, the education selection is a bit
more pronounced. More than three-in-ten
(31%) black women who married white men
are college-educated, compared with less a
quarter (24%) of black women who married in.
For more characteristics of individual men and
women who marry out, see Appendix 3.
Education of Newlywed Asian Men
and Women by their Spouse’s
Race
% college-educated
Note: Asians include Pacific Islanders. Whites and Asians include only non-Hispanics.
Source: Pew Research Center analysis of 2008-2010 American Community Surveys (ACS) Integrated Public Use Microdata Sample (IPUMS) files
PEW RESEARCH CENTER
Education of Newlywed Black Men
and Women by their Spouse’s
Race
% college-educated
Note: Whites and blacks include only non-Hispanics.
Source: Pew Research Center analysis of 2008-2010 American Community Surveys (ACS) Integrated Public Use Microdata Sample (IPUMS) files
PEW RESEARCH CENTER
25
PEW SOCIAL & DEMOGRAPHIC TRENDS
www.pewsocialtrends.org
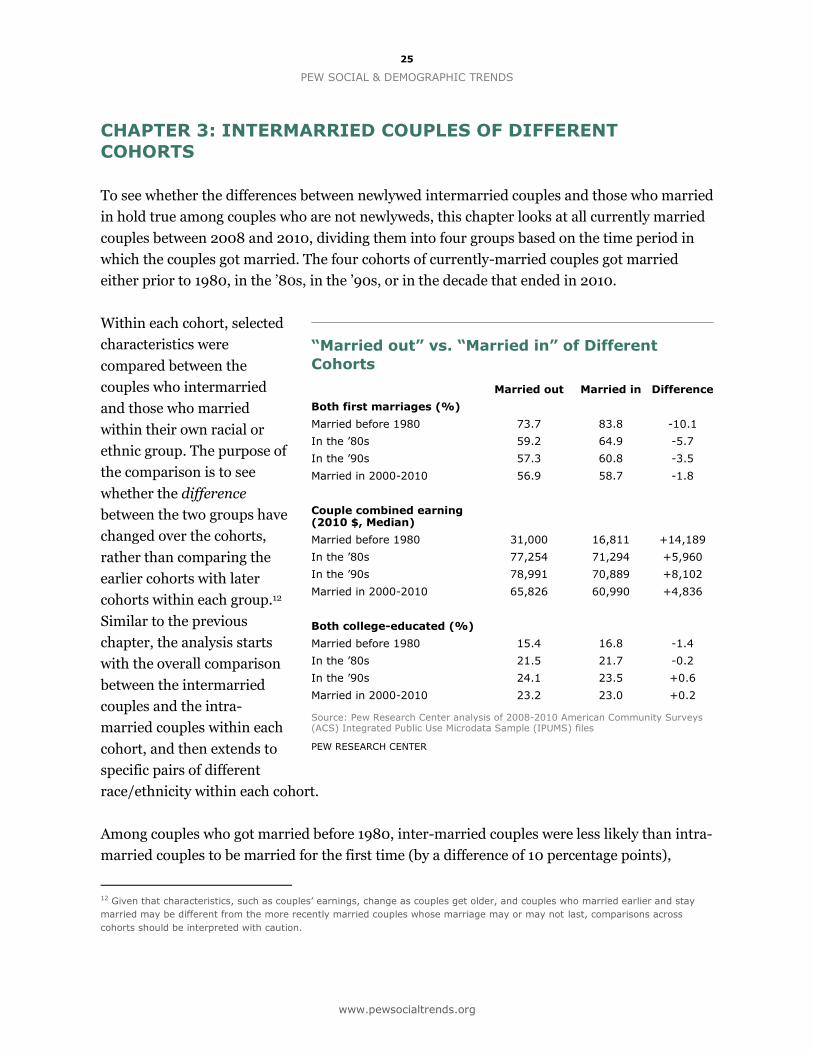
CHAPTER 3: INTERMARRIED COUPLES OF DIFFERENT
COHORTS
To see whether the differences between newlywed intermarried couples and those who married
in hold true among couples who are not newlyweds, this chapter looks at all currently married
couples between 2008 and 2010, dividing them into four groups based on the time period in
which the couples got married. The four cohorts of currently-married couples got married
either prior to 1980, in the ’80s, in the ’90s, or in the decade that ended in 2010.
Within each cohort, selected
characteristics were
compared between the
couples who intermarried
and those who married
within their own racial or
ethnic group. The purpose of
the comparison is to see
whether the difference
between the two groups have
changed over the cohorts,
rather than comparing the
earlier cohorts with later
cohorts within each group.12
Similar to the previous
chapter, the analysis starts
with the overall comparison
between the intermarried
couples and the intra-
married couples within each
cohort, and then extends to
specific pairs of different
race/ethnicity within each cohort.
Among couples who got married before 1980, inter-married couples were less likely than intra-
married couples to be married for the first time (by a difference of 10 percentage points),
12 Given that characteristics, such as couples’ earnings, change as couples get older, and couples who married earlier and stay
married may be different from the more recently married couples whose marriage may or may not last, comparisons across
cohorts should be interpreted with caution.
“Married out” vs. “Married in” of Different
Cohorts
Married out Married in Difference
Both first marriages (%)
Married before 1980 73.7 83.8 -10.1
In the ’80s 59.2 64.9 -5.7
In the ’90s 57.3 60.8 -3.5
Married in 2000-2010 56.9 58.7 -1.8
Couple combined earning (2010 $, Median)
Married before 1980 31,000 16,811 +14,189
In the ’80s 77,254 71,294 +5,960
In the ’90s 78,991 70,889 +8,102
Married in 2000-2010 65,826 60,990 +4,836
Both college-educated (%)
Married before 1980 15.4 16.8 -1.4
In the ’80s 21.5 21.7 -0.2
In the ’90s 24.1 23.5 +0.6
Married in 2000-2010 23.2 23.0 +0.2
Source: Pew Research Center analysis of 2008-2010 American Community Surveys (ACS) Integrated Public Use Microdata Sample (IPUMS) files
PEW RESEARCH CENTER
26
The Rise of Intermarriage
www.pewsocialtrends.org
83
61 56 55
73
61 58 57
88 81 79
72
Married before 1980
1980s 1990s 2000 and later
White/White White/Hispanic Hispanic/Hisp.
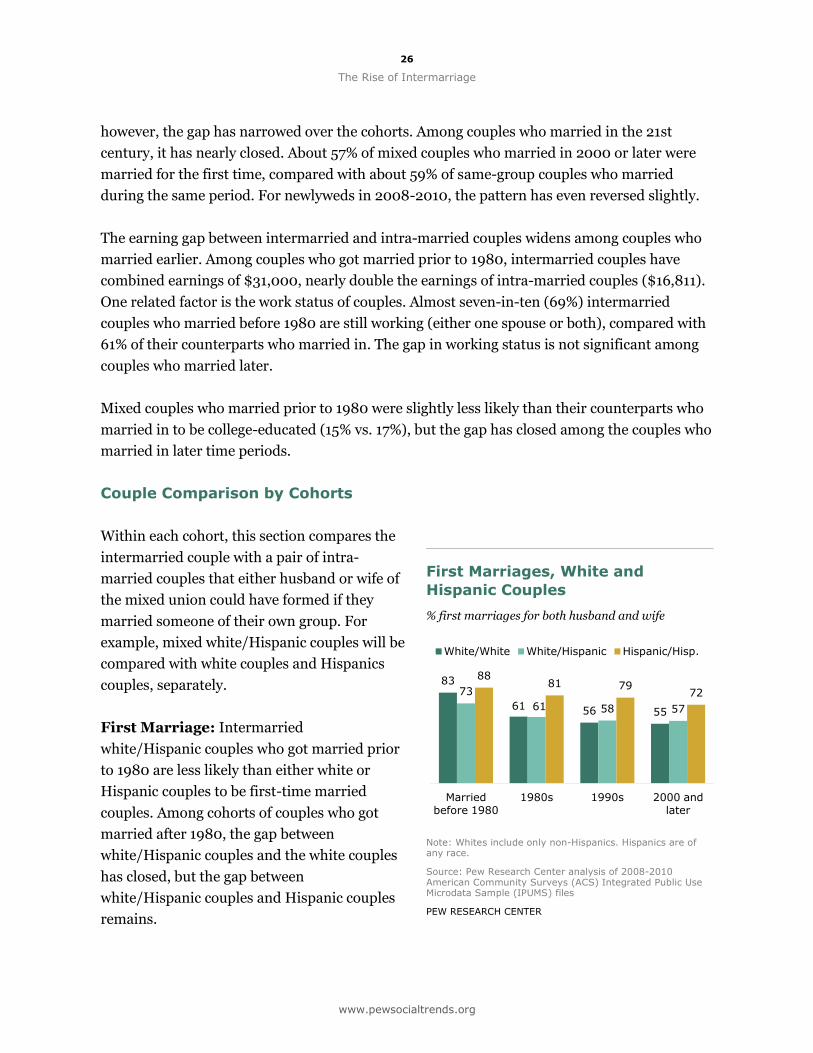
however, the gap has narrowed over the cohorts. Among couples who married in the 21st
century, it has nearly closed. About 57% of mixed couples who married in 2000 or later were
married for the first time, compared with about 59% of same-group couples who married
during the same period. For newlyweds in 2008-2010, the pattern has even reversed slightly.
The earning gap between intermarried and intra-married couples widens among couples who
married earlier. Among couples who got married prior to 1980, intermarried couples have
combined earnings of $31,000, nearly double the earnings of intra-married couples ($16,811).
One related factor is the work status of couples. Almost seven-in-ten (69%) intermarried
couples who married before 1980 are still working (either one spouse or both), compared with
61% of their counterparts who married in. The gap in working status is not significant among
couples who married later.
Mixed couples who married prior to 1980 were slightly less likely than their counterparts who
married in to be college-educated (15% vs. 17%), but the gap has closed among the couples who
married in later time periods.
Couple Comparison by Cohorts
Within each cohort, this section compares the
intermarried couple with a pair of intra-
married couples that either husband or wife of
the mixed union could have formed if they
married someone of their own group. For
example, mixed white/Hispanic couples will be
compared with white couples and Hispanics
couples, separately.
First Marriage: Intermarried
white/Hispanic couples who got married prior
to 1980 are less likely than either white or
Hispanic couples to be first-time married
couples. Among cohorts of couples who got
married after 1980, the gap between
white/Hispanic couples and the white couples
has closed, but the gap between
white/Hispanic couples and Hispanic couples
remains.
First Marriages, White and
Hispanic Couples
% first marriages for both husband and wife
Note: Whites include only non-Hispanics. Hispanics are of any race.
Source: Pew Research Center analysis of 2008-2010 American Community Surveys (ACS) Integrated Public Use Microdata Sample (IPUMS) files
PEW RESEARCH CENTER
27
PEW SOCIAL & DEMOGRAPHIC TRENDS
www.pewsocialtrends.org
83
61 56 55 62
52 54 53
79
65 59 56
Married before 1980
1980s 1990s 2000 and later
White/White White/Black Black/Black
83
61 56 55
74
62 60 57
95 89 87 82
Married before 1980
1980s 1990s 2000 and later
White/White White/Asian Asian/Asian
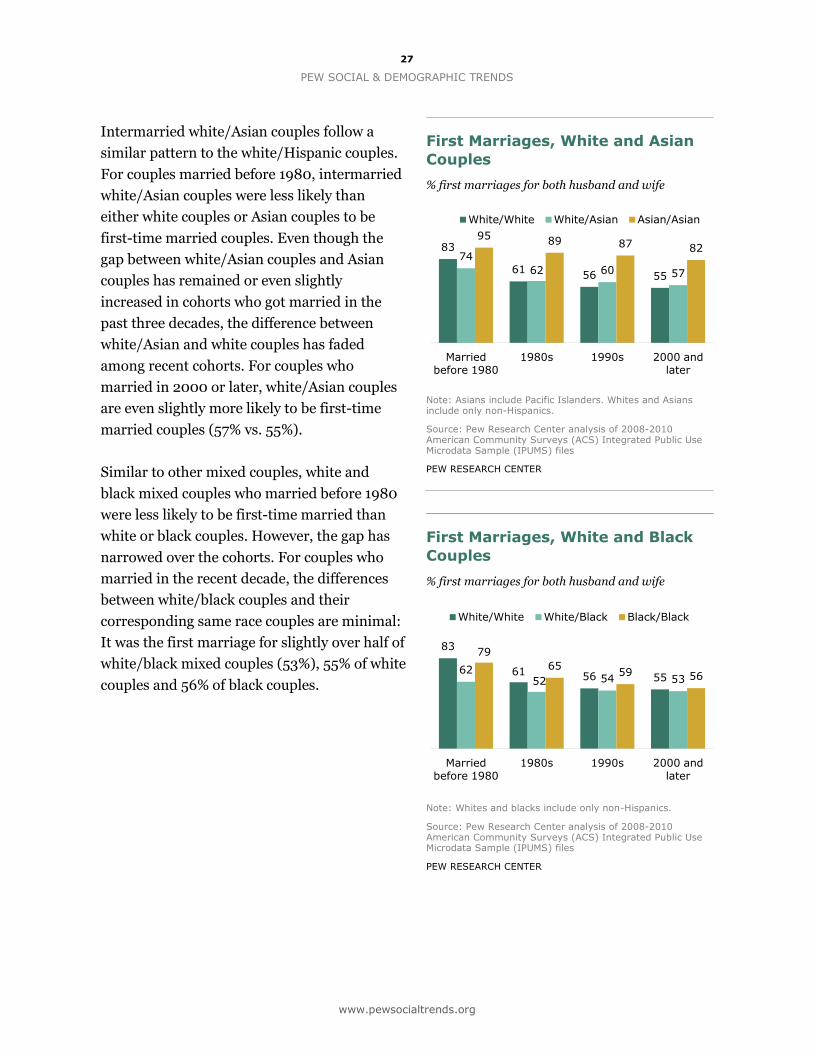
Intermarried white/Asian couples follow a
similar pattern to the white/Hispanic couples.
For couples married before 1980, intermarried
white/Asian couples were less likely than
either white couples or Asian couples to be
first-time married couples. Even though the
gap between white/Asian couples and Asian
couples has remained or even slightly
increased in cohorts who got married in the
past three decades, the difference between
white/Asian and white couples has faded
among recent cohorts. For couples who
married in 2000 or later, white/Asian couples
are even slightly more likely to be first-time
married couples (57% vs. 55%).
Similar to other mixed couples, white and
black mixed couples who married before 1980
were less likely to be first-time married than
white or black couples. However, the gap has
narrowed over the cohorts. For couples who
married in the recent decade, the differences
between white/black couples and their
corresponding same race couples are minimal:
It was the first marriage for slightly over half of
white/black mixed couples (53%), 55% of white
couples and 56% of black couples.
First Marriages, White and Asian
Couples
% first marriages for both husband and wife
Note: Asians include Pacific Islanders. Whites and Asians include only non-Hispanics.
Source: Pew Research Center analysis of 2008-2010 American Community Surveys (ACS) Integrated Public Use Microdata Sample (IPUMS) files
PEW RESEARCH CENTER
First Marriages, White and Black
Couples
% first marriages for both husband and wife
Note: Whites and blacks include only non-Hispanics.
Source: Pew Research Center analysis of 2008-2010 American Community Surveys (ACS) Integrated Public Use Microdata Sample (IPUMS) files
PEW RESEARCH CENTER
28
The Rise of Intermarriage
www.pewsocialtrends.org
18 24 26 26
15 20
22 20
4 5 5 6
Married before 1980
1980s 1990s 2000 and later
White/White White/Hispanic Hispanic/Hisp.
18 24 26 26
22
36
42 42
28
36
45
53
Married before 1980
1980s 1990s 2000 and later
White/White White/Asian Asian/Asian
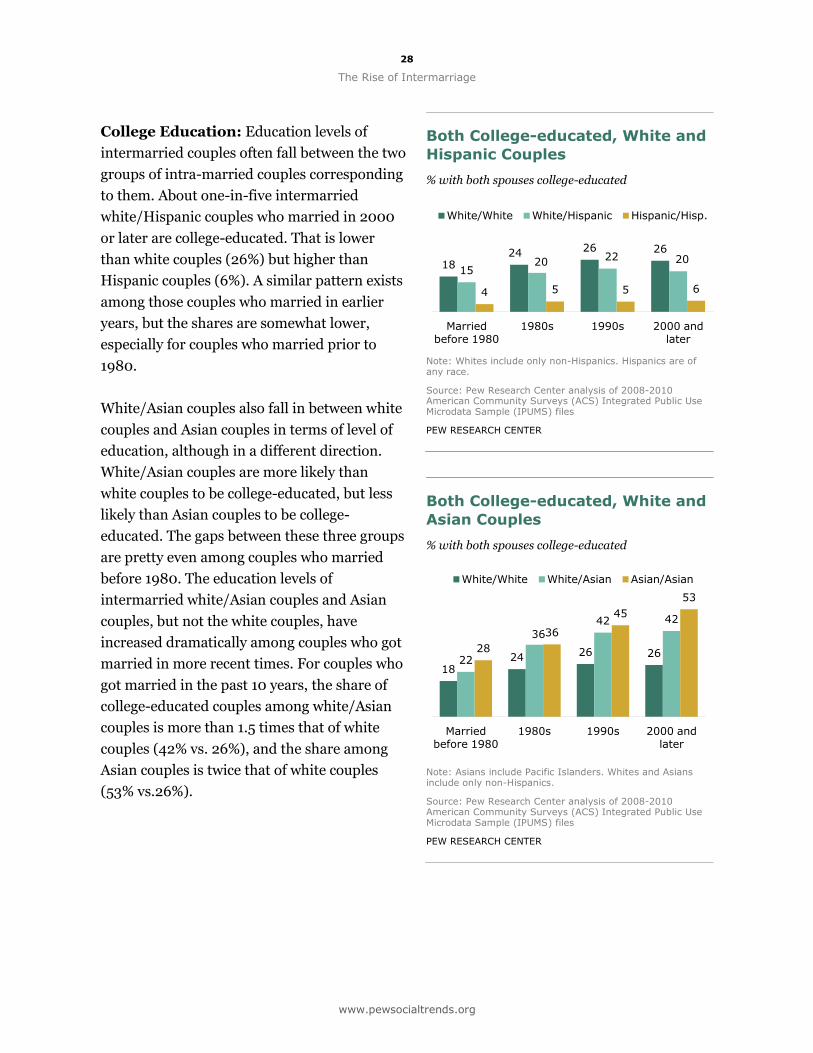
College Education: Education levels of
intermarried couples often fall between the two
groups of intra-married couples corresponding
to them. About one-in-five intermarried
white/Hispanic couples who married in 2000
or later are college-educated. That is lower
than white couples (26%) but higher than
Hispanic couples (6%). A similar pattern exists
among those couples who married in earlier
years, but the shares are somewhat lower,
especially for couples who married prior to
1980.
White/Asian couples also fall in between white
couples and Asian couples in terms of level of
education, although in a different direction.
White/Asian couples are more likely than
white couples to be college-educated, but less
likely than Asian couples to be college-
educated. The gaps between these three groups
are pretty even among couples who married
before 1980. The education levels of
intermarried white/Asian couples and Asian
couples, but not the white couples, have
increased dramatically among couples who got
married in more recent times. For couples who
got married in the past 10 years, the share of
college-educated couples among white/Asian
couples is more than 1.5 times that of white
couples (42% vs. 26%), and the share among
Asian couples is twice that of white couples
(53% vs.26%).
Both College-educated, White and
Hispanic Couples
% with both spouses college-educated
Note: Whites include only non-Hispanics. Hispanics are of any race.
Source: Pew Research Center analysis of 2008-2010 American Community Surveys (ACS) Integrated Public Use Microdata Sample (IPUMS) files
PEW RESEARCH CENTER
Both College-educated, White and
Asian Couples
% with both spouses college-educated
Note: Asians include Pacific Islanders. Whites and Asians include only non-Hispanics.
Source: Pew Research Center analysis of 2008-2010 American Community Surveys (ACS) Integrated Public Use Microdata Sample (IPUMS) files
PEW RESEARCH CENTER
29
PEW SOCIAL & DEMOGRAPHIC TRENDS
www.pewsocialtrends.org
18 24
26 26 20 21 19 17
11 13 14 13
Married before 1980
1980s 1990s 2000 and later
White/White White/Black Black/Black
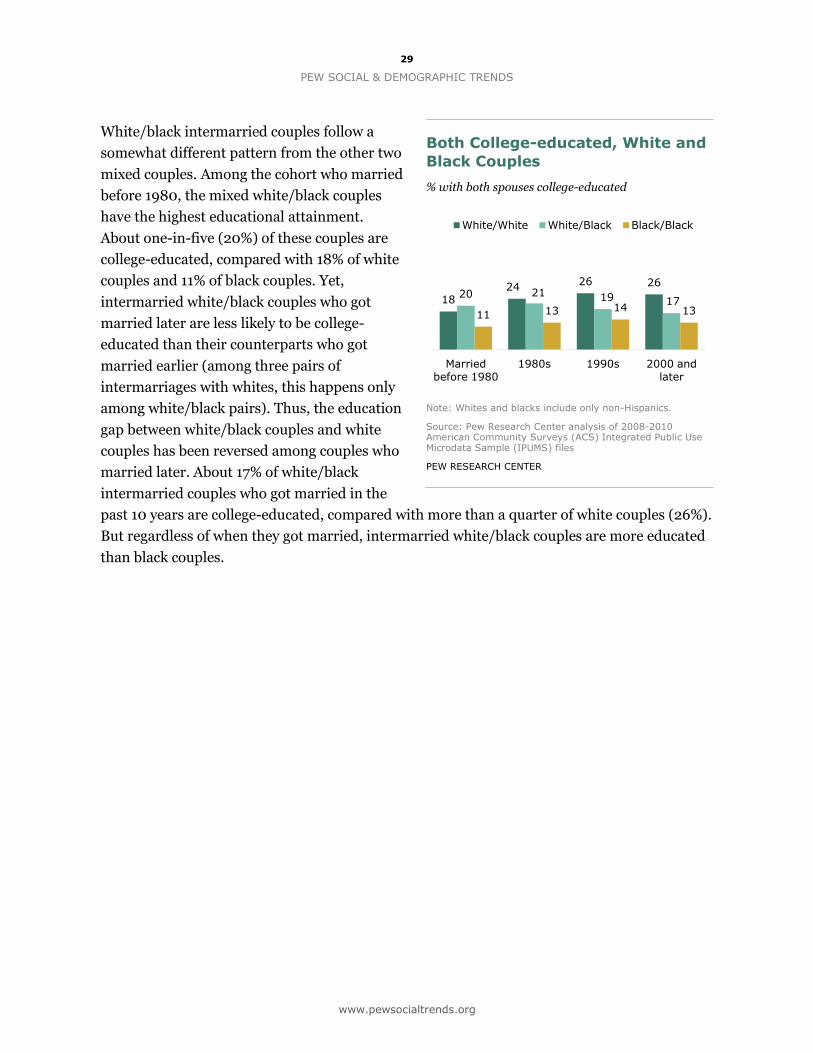
White/black intermarried couples follow a
somewhat different pattern from the other two
mixed couples. Among the cohort who married
before 1980, the mixed white/black couples
have the highest educational attainment.
About one-in-five (20%) of these couples are
college-educated, compared with 18% of white
couples and 11% of black couples. Yet,
intermarried white/black couples who got
married later are less likely to be college-
educated than their counterparts who got
married earlier (among three pairs of
intermarriages with whites, this happens only
among white/black pairs). Thus, the education
gap between white/black couples and white
couples has been reversed among couples who
married later. About 17% of white/black
intermarried couples who got married in the
past 10 years are college-educated, compared with more than a quarter of white couples (26%).
But regardless of when they got married, intermarried white/black couples are more educated
than black couples.
Both College-educated, White and
Black Couples
% with both spouses college-educated
Note: Whites and blacks include only non-Hispanics.
Source: Pew Research Center analysis of 2008-2010 American Community Surveys (ACS) Integrated Public Use Microdata Sample (IPUMS) files
PEW RESEARCH CENTER
30
The Rise of Intermarriage
www.pewsocialtrends.org
17.7 17.3
37.0
28.0
White-White
White-Asian
Asian-White
Asian-Asian
Married before 1980
25.6
41.3 45.9
53.1
White-White
White-Asian
Asian-White
Asian-Asian
Married in 2000 or later
17.7
32.8
16.2 10.7
White-White
White-Black
Black-White
Black-Black
Married before 1980
25.6 22.5
14.8 12.5
White-White
White-Black
Black-White
Black-Black
Married in 2000 or later
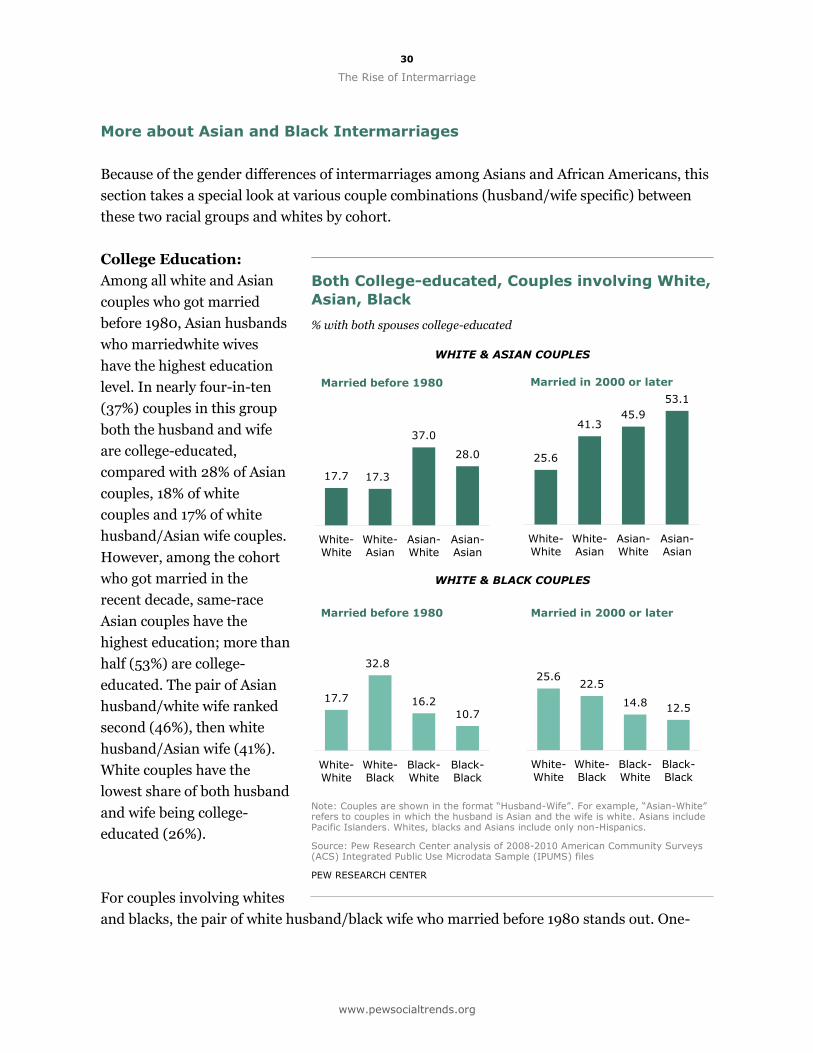
More about Asian and Black Intermarriages
Because of the gender differences of intermarriages among Asians and African Americans, this
section takes a special look at various couple combinations (husband/wife specific) between
these two racial groups and whites by cohort.
College Education:
Among all white and Asian
couples who got married
before 1980, Asian husbands
who marriedwhite wives
have the highest education
level. In nearly four-in-ten
(37%) couples in this group
both the husband and wife
are college-educated,
compared with 28% of Asian
couples, 18% of white
couples and 17% of white
husband/Asian wife couples.
However, among the cohort
who got married in the
recent decade, same-race
Asian couples have the
highest education; more than
half (53%) are college-
educated. The pair of Asian
husband/white wife ranked
second (46%), then white
husband/Asian wife (41%).
White couples have the
lowest share of both husband
and wife being college-
educated (26%).
For couples involving whites
and blacks, the pair of white husband/black wife who married before 1980 stands out. One-
Both College-educated, Couples involving White,
Asian, Black
% with both spouses college-educated
WHITE & ASIAN COUPLES
WHITE & BLACK COUPLES
Note: Couples are shown in the format “Husband-Wife”. For example, “Asian-White” refers to couples in which the husband is Asian and the wife is white. Asians include Pacific Islanders. Whites, blacks and Asians include only non-Hispanics.
Source: Pew Research Center analysis of 2008-2010 American Community Surveys (ACS) Integrated Public Use Microdata Sample (IPUMS) files
PEW RESEARCH CENTER
31
PEW SOCIAL & DEMOGRAPHIC TRENDS
www.pewsocialtrends.org
2.3
1.2
3.3 3.4
White-White
White-Asian
Asian-White
Asian-Asian
Married before 1980
2.3
4.8
2.0
3.4
White-White
White-Asian
Asian-White
Asian-Asian
Married in 2000 or later
2.3
1.7
3.0
2.5
White-White
White-Black
Black-White
Black-Black
Married before 1980
2.3
3.0 3.0 2.8
White-White
White-Black
Black-White
Black-Black
Married in 2000 or later
third (33%) of white husband/black wife couples who married before 1980 are college-
educated, compared with 18% of white couples, 16% of black husband/white wife couples and
about 11% of black couples who married during the same time period. In contrast, the more
recently married white husband/black wife couples are somewhat less educated than the
earlier cohort: Less than a quarter of the pair (22%) are college-educated. And their share of
college-educated is also lower than white couples (26%) who married in 2000 or later, even
though the white-black pair is still more educated than the black husband/white wife couple
(15%) and black couple
(13%).
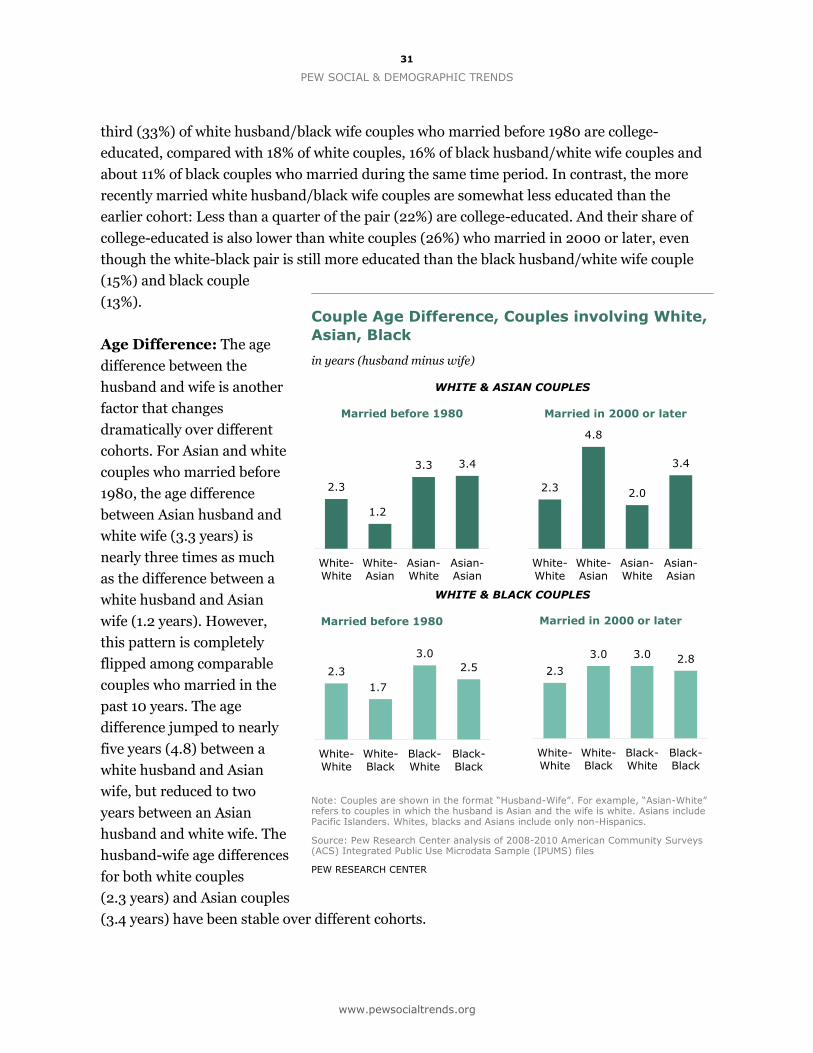
Age Difference: The age
difference between the
husband and wife is another
factor that changes
dramatically over different
cohorts. For Asian and white
couples who married before
1980, the age difference
between Asian husband and
white wife (3.3 years) is
nearly three times as much
as the difference between a
white husband and Asian
wife (1.2 years). However,
this pattern is completely
flipped among comparable
couples who married in the
past 10 years. The age
difference jumped to nearly
five years (4.8) between a
white husband and Asian
wife, but reduced to two
years between an Asian
husband and white wife. The
husband-wife age differences
for both white couples
(2.3 years) and Asian couples
(3.4 years) have been stable over different cohorts.
Couple Age Difference, Couples involving White,
Asian, Black
in years (husband minus wife)
WHITE & ASIAN COUPLES
WHITE & BLACK COUPLES
Note: Couples are shown in the format “Husband-Wife”. For example, “Asian-White” refers to couples in which the husband is Asian and the wife is white. Asians include Pacific Islanders. Whites, blacks and Asians include only non-Hispanics.
Source: Pew Research Center analysis of 2008-2010 American Community Surveys (ACS) Integrated Public Use Microdata Sample (IPUMS) files
PEW RESEARCH CENTER
32
The Rise of Intermarriage
www.pewsocialtrends.org
In contrast, the changes of age difference among different cohorts of black/white intermarried
couples are less dramatic. Among couples who got married prior to 1980, the age difference is
the largest for black husband/white wife couples (three years); the difference is 1.7 years for
the white husband/black wife pair, 2.5 years for black couples and 2.3 years for white couples.
For couples married in 2000 or later, the age difference between a white husband and black
wife is three years, which is almost double the age difference for their counterparts who
married earlier (1.7 years). But the age differences for other white and black couples have
hardly changed.
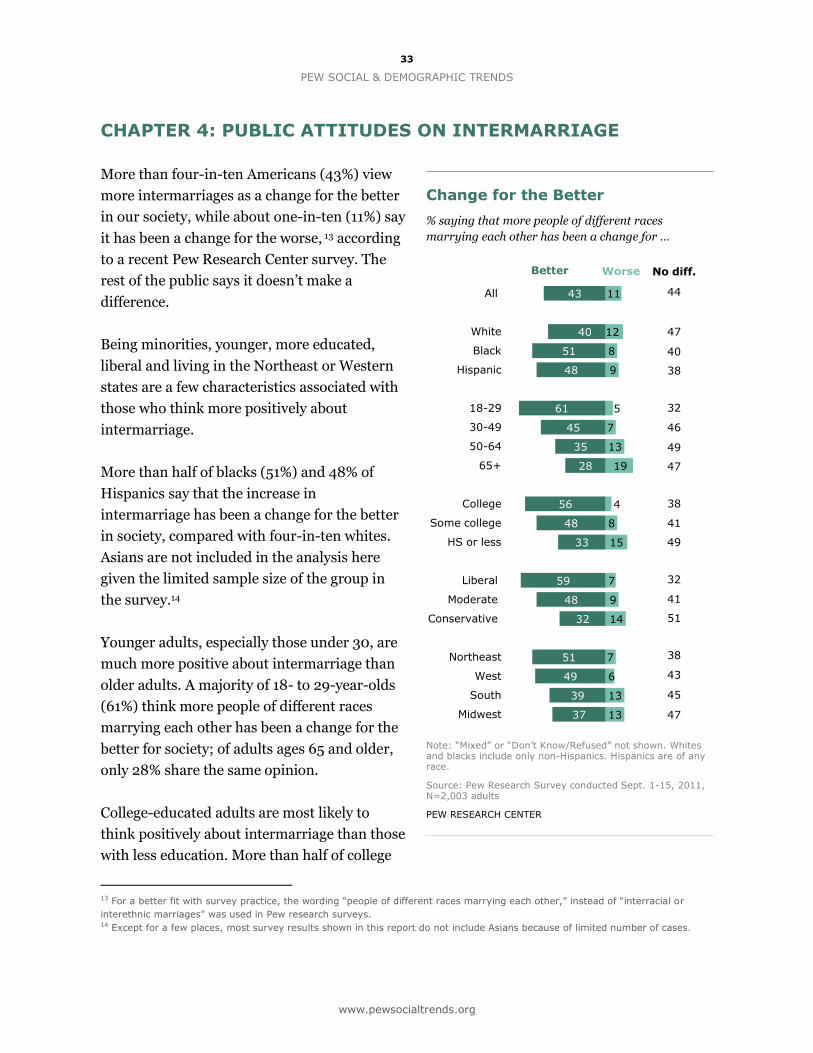
33
PEW SOCIAL & DEMOGRAPHIC TRENDS
www.pewsocialtrends.org
43
40
51
48
61
45
35
28
56
48
33
59
48
32
51
49
39
37
11
12
8
9
5
7
13
19
4
8
15
7
9
14
7
6
13
13
All
White
Black
Hispanic
18-29
30-49
50-64
65+
College
Some college
HS or less
Liberal
Moderate
Conservative
Northeast
West
South
Midwest
Worse Better No diff.
44
47
40
38
32
46
49
47
38
41
49
32
41
51
38
43
45
47
CHAPTER 4: PUBLIC ATTITUDES ON INTERMARRIAGE
More than four-in-ten Americans (43%) view
more intermarriages as a change for the better
in our society, while about one-in-ten (11%) say
it has been a change for the worse, 13 according
to a recent Pew Research Center survey. The
rest of the public says it doesn’t make a
difference.
Being minorities, younger, more educated,
liberal and living in the Northeast or Western
states are a few characteristics associated with
those who think more positively about
intermarriage.
More than half of blacks (51%) and 48% of
Hispanics say that the increase in
intermarriage has been a change for the better
in society, compared with four-in-ten whites.
Asians are not included in the analysis here
given the limited sample size of the group in
the survey.14
Younger adults, especially those under 30, are
much more positive about intermarriage than
older adults. A majority of 18- to 29-year-olds
(61%) think more people of different races
marrying each other has been a change for the
better for society; of adults ages 65 and older,
only 28% share the same opinion.
College-educated adults are most likely to
think positively about intermarriage than those
with less education. More than half of college
13 For a better fit with survey practice, the wording “people of different races marrying each other,” instead of “interracial or
interethnic marriages” was used in Pew research surveys. 14 Except for a few places, most survey results shown in this report do not include Asians because of limited number of cases.
Change for the Better
% saying that more people of different races
marrying each other has been a change for …
Note: “Mixed” or “Don’t Know/Refused” not shown. Whites and blacks include only non-Hispanics. Hispanics are of any race.
Source: Pew Research Survey conducted Sept. 1-15, 2011, N=2,003 adults
PEW RESEARCH CENTER
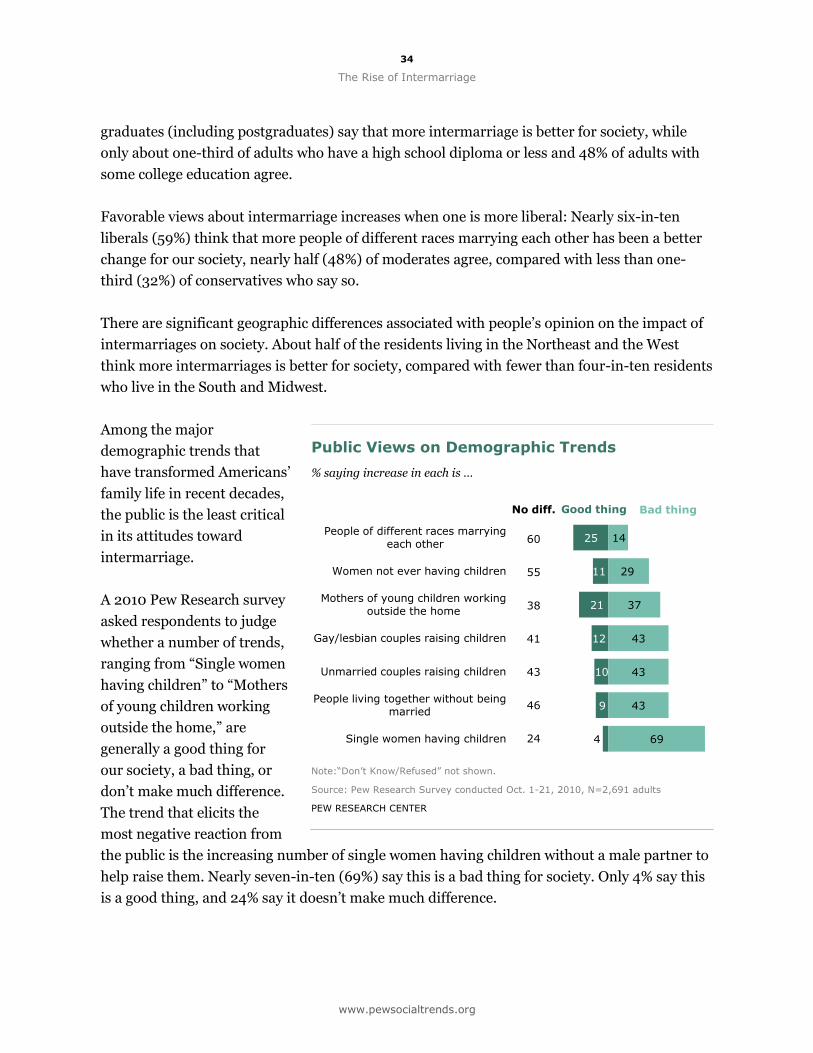
34
The Rise of Intermarriage
www.pewsocialtrends.org
25
11
21
12
10
9
4
14
29
37
43
43
43
69
People of different races marrying each other
Women not ever having children
Mothers of young children working outside the home
Gay/lesbian couples raising children
Unmarried couples raising children
People living together without being married
Single women having children
Bad thing Good thing No diff.
60
55
38
41
43
46
24
graduates (including postgraduates) say that more intermarriage is better for society, while
only about one-third of adults who have a high school diploma or less and 48% of adults with
some college education agree.
Favorable views about intermarriage increases when one is more liberal: Nearly six-in-ten
liberals (59%) think that more people of different races marrying each other has been a better
change for our society, nearly half (48%) of moderates agree, compared with less than one-
third (32%) of conservatives who say so.
There are significant geographic differences associated with people’s opinion on the impact of
intermarriages on society. About half of the residents living in the Northeast and the West
think more intermarriages is better for society, compared with fewer than four-in-ten residents
who live in the South and Midwest.
Among the major
demographic trends that
have transformed Americans’
family life in recent decades,
the public is the least critical
in its attitudes toward
intermarriage.
A 2010 Pew Research survey
asked respondents to judge
whether a number of trends,
ranging from “Single women
having children” to “Mothers
of young children working
outside the home,” are
generally a good thing for
our society, a bad thing, or
don’t make much difference.
The trend that elicits the
most negative reaction from
the public is the increasing number of single women having children without a male partner to
help raise them. Nearly seven-in-ten (69%) say this is a bad thing for society. Only 4% say this
is a good thing, and 24% say it doesn’t make much difference.
Public Views on Demographic Trends
% saying increase in each is …
Note:“Don’t Know/Refused” not shown.
Source: Pew Research Survey conducted Oct. 1-21, 2010, N=2,691 adults
PEW RESEARCH CENTER
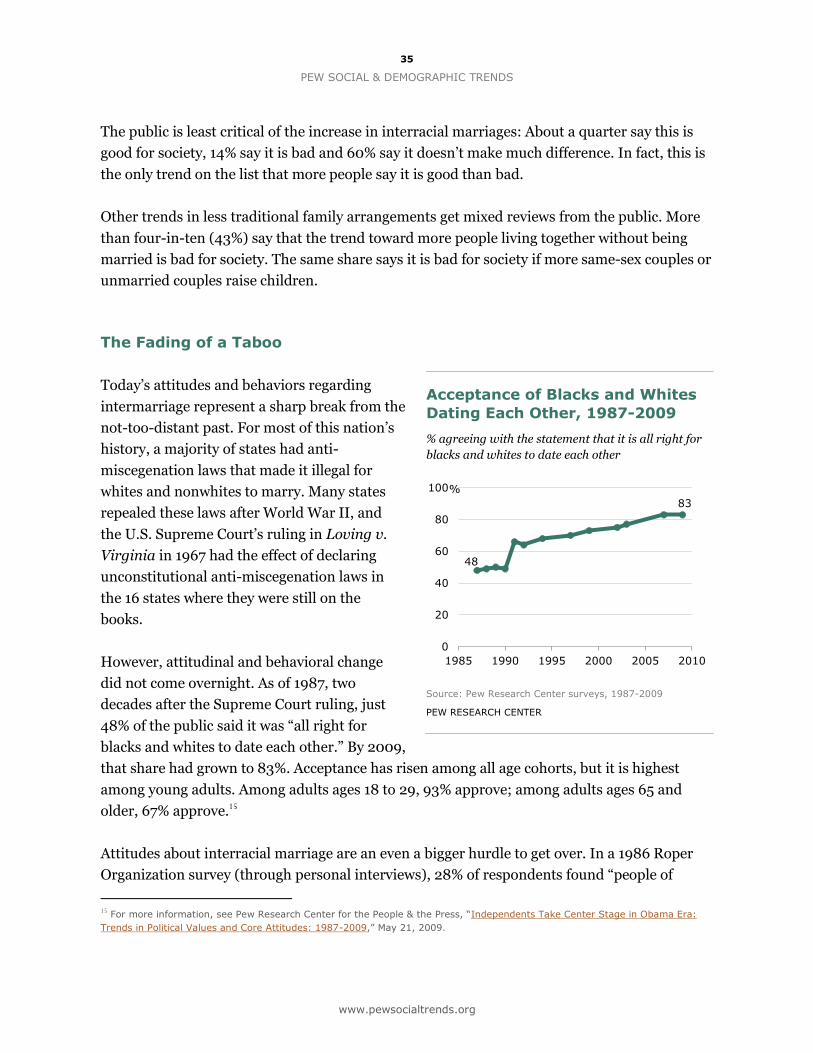
35
PEW SOCIAL & DEMOGRAPHIC TRENDS
www.pewsocialtrends.org
83
48
0
20
40
60
80
100
1985 1990 1995 2000 2005 2010
F
%
The public is least critical of the increase in interracial marriages: About a quarter say this is
good for society, 14% say it is bad and 60% say it doesn’t make much difference. In fact, this is
the only trend on the list that more people say it is good than bad.
Other trends in less traditional family arrangements get mixed reviews from the public. More
than four-in-ten (43%) say that the trend toward more people living together without being
married is bad for society. The same share says it is bad for society if more same-sex couples or
unmarried couples raise children.
The Fading of a Taboo
Today’s attitudes and behaviors regarding
intermarriage represent a sharp break from the
not-too-distant past. For most of this nation’s
history, a majority of states had anti-
miscegenation laws that made it illegal for
whites and nonwhites to marry. Many states
repealed these laws after World War II, and
the U.S. Supreme Court’s ruling in Loving v.
Virginia in 1967 had the effect of declaring
unconstitutional anti-miscegenation laws in
the 16 states where they were still on the
books.
However, attitudinal and behavioral change
did not come overnight. As of 1987, two
decades after the Supreme Court ruling, just
48% of the public said it was “all right for
blacks and whites to date each other.” By 2009,
that share had grown to 83%. Acceptance has risen among all age cohorts, but it is highest
among young adults. Among adults ages 18 to 29, 93% approve; among adults ages 65 and
older, 67% approve.15
Attitudes about interracial marriage are an even a bigger hurdle to get over. In a 1986 Roper
Organization survey (through personal interviews), 28% of respondents found “people of
15
For more information, see Pew Research Center for the People & the Press, “Independents Take Center Stage in Obama Era:
Trends in Political Values and Core Attitudes: 1987-2009,” May 21, 2009.
Acceptance of Blacks and Whites
Dating Each Other, 1987-2009
% agreeing with the statement that it is all right for
blacks and whites to date each other
Source: Pew Research Center surveys, 1987-2009
PEW RESEARCH CENTER
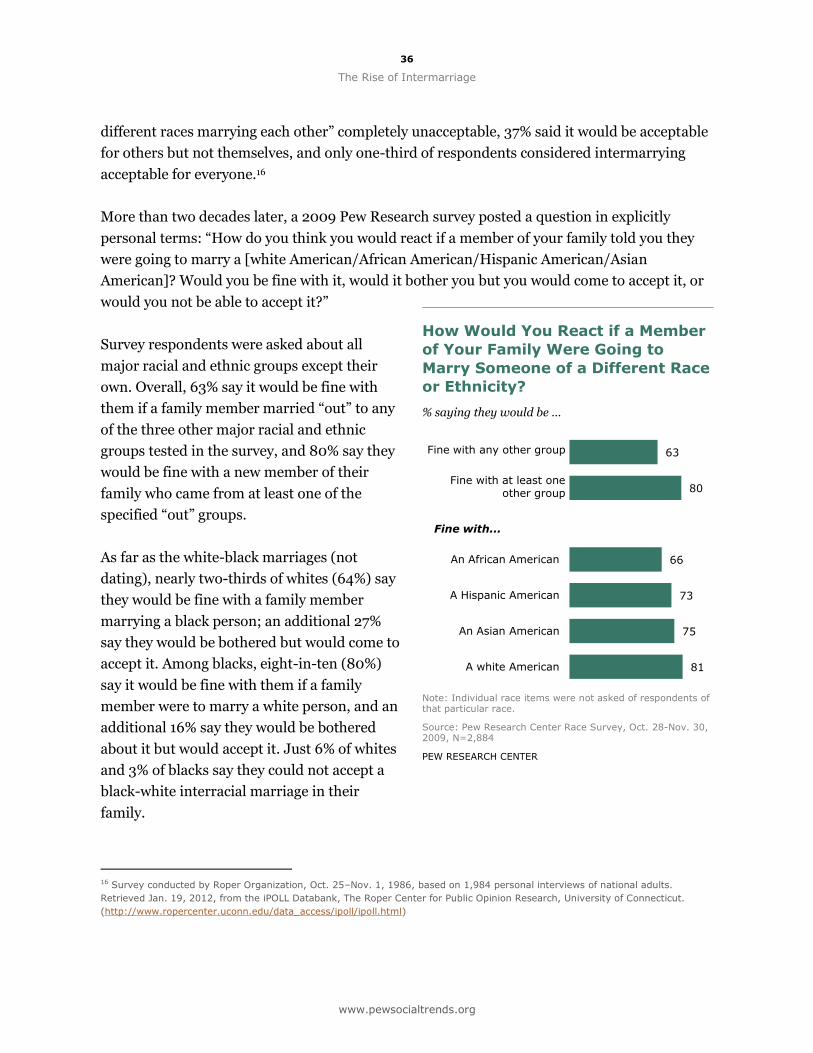
36
The Rise of Intermarriage
www.pewsocialtrends.org
63
80
66
73
75
81
Fine with any other group
Fine with at least one other group
An African American
A Hispanic American
An Asian American
A white American
Fine with...
Fine with any other group
Fine with at least one other group
different races marrying each other” completely unacceptable, 37% said it would be acceptable
for others but not themselves, and only one-third of respondents considered intermarrying
acceptable for everyone.16
More than two decades later, a 2009 Pew Research survey posted a question in explicitly
personal terms: “How do you think you would react if a member of your family told you they
were going to marry a [white American/African American/Hispanic American/Asian
American]? Would you be fine with it, would it bother you but you would come to accept it, or
would you not be able to accept it?”
Survey respondents were asked about all
major racial and ethnic groups except their
own. Overall, 63% say it would be fine with
them if a family member married “out” to any
of the three other major racial and ethnic
groups tested in the survey, and 80% say they
would be fine with a new member of their
family who came from at least one of the
specified “out” groups.
As far as the white-black marriages (not
dating), nearly two-thirds of whites (64%) say
they would be fine with a family member
marrying a black person; an additional 27%
say they would be bothered but would come to
accept it. Among blacks, eight-in-ten (80%)
say it would be fine with them if a family
member were to marry a white person, and an
additional 16% say they would be bothered
about it but would accept it. Just 6% of whites
and 3% of blacks say they could not accept a
black-white interracial marriage in their
family.
16 Survey conducted by Roper Organization, Oct. 25–Nov. 1, 1986, based on 1,984 personal interviews of national adults.
Retrieved Jan. 19, 2012, from the iPOLL Databank, The Roper Center for Public Opinion Research, University of Connecticut.
(http://www.ropercenter.uconn.edu/data_access/ipoll/ipoll.html)
How Would You React if a Member
of Your Family Were Going to
Marry Someone of a Different Race
or Ethnicity?
% saying they would be …
Note: Individual race items were not asked of respondents of that particular race.
Source: Pew Research Center Race Survey, Oct. 28-Nov. 30, 2009, N=2,884
PEW RESEARCH CENTER
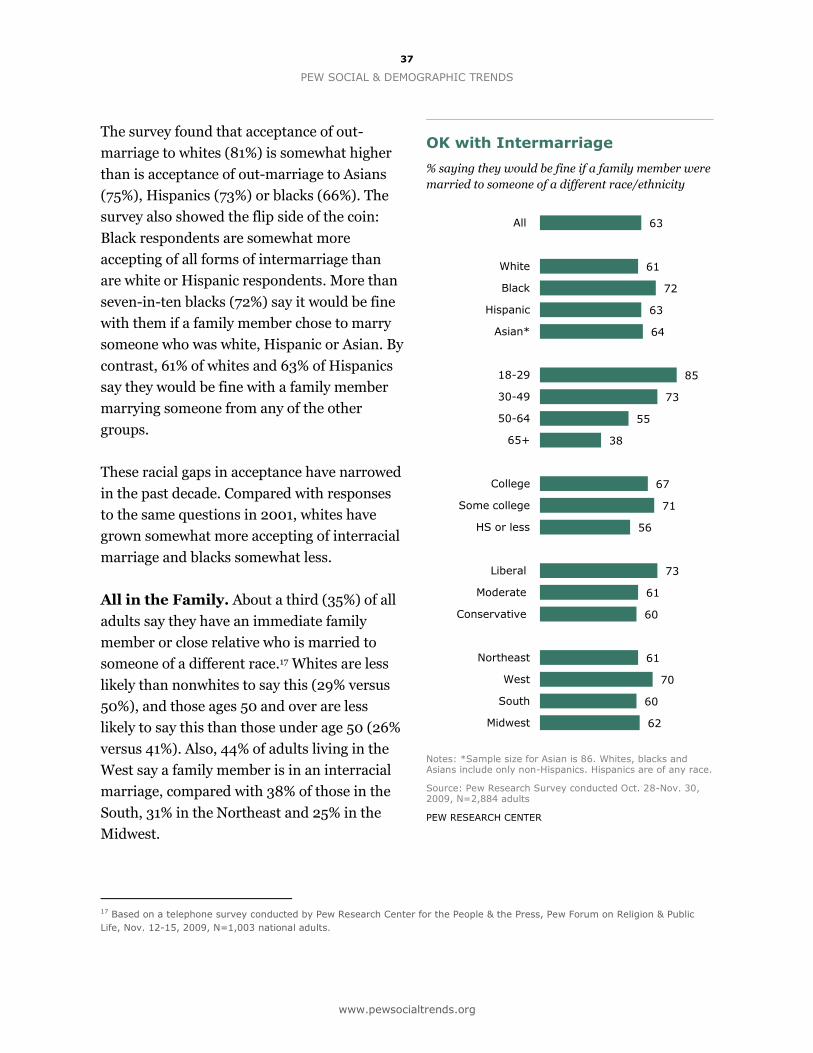
37
PEW SOCIAL & DEMOGRAPHIC TRENDS
www.pewsocialtrends.org
63
61
72
63
64
85
73
55
38
67
71
56
73
61
60
61
70
60
62
All
White
Black
Hispanic
Asian*
18-29
30-49
50-64
65+
College
Some college
HS or less
Liberal
Moderate
Conservative
Northeast
West
South
Midwest
The survey found that acceptance of out-
marriage to whites (81%) is somewhat higher
than is acceptance of out-marriage to Asians
(75%), Hispanics (73%) or blacks (66%). The
survey also showed the flip side of the coin:
Black respondents are somewhat more
accepting of all forms of intermarriage than
are white or Hispanic respondents. More than
seven-in-ten blacks (72%) say it would be fine
with them if a family member chose to marry
someone who was white, Hispanic or Asian. By
contrast, 61% of whites and 63% of Hispanics
say they would be fine with a family member
marrying someone from any of the other
groups.
These racial gaps in acceptance have narrowed
in the past decade. Compared with responses
to the same questions in 2001, whites have
grown somewhat more accepting of interracial
marriage and blacks somewhat less.
All in the Family. About a third (35%) of all
adults say they have an immediate family
member or close relative who is married to
someone of a different race.17 Whites are less
likely than nonwhites to say this (29% versus
50%), and those ages 50 and over are less
likely to say this than those under age 50 (26%
versus 41%). Also, 44% of adults living in the
West say a family member is in an interracial
marriage, compared with 38% of those in the
South, 31% in the Northeast and 25% in the
Midwest.
17 Based on a telephone survey conducted by Pew Research Center for the People & the Press, Pew Forum on Religion & Public
Life, Nov. 12-15, 2009, N=1,003 national adults.
OK with Intermarriage
% saying they would be fine if a family member were
married to someone of a different race/ethnicity
Notes: *Sample size for Asian is 86. Whites, blacks and Asians include only non-Hispanics. Hispanics are of any race.
Source: Pew Research Survey conducted Oct. 28-Nov. 30, 2009, N=2,884 adults
PEW RESEARCH CENTER
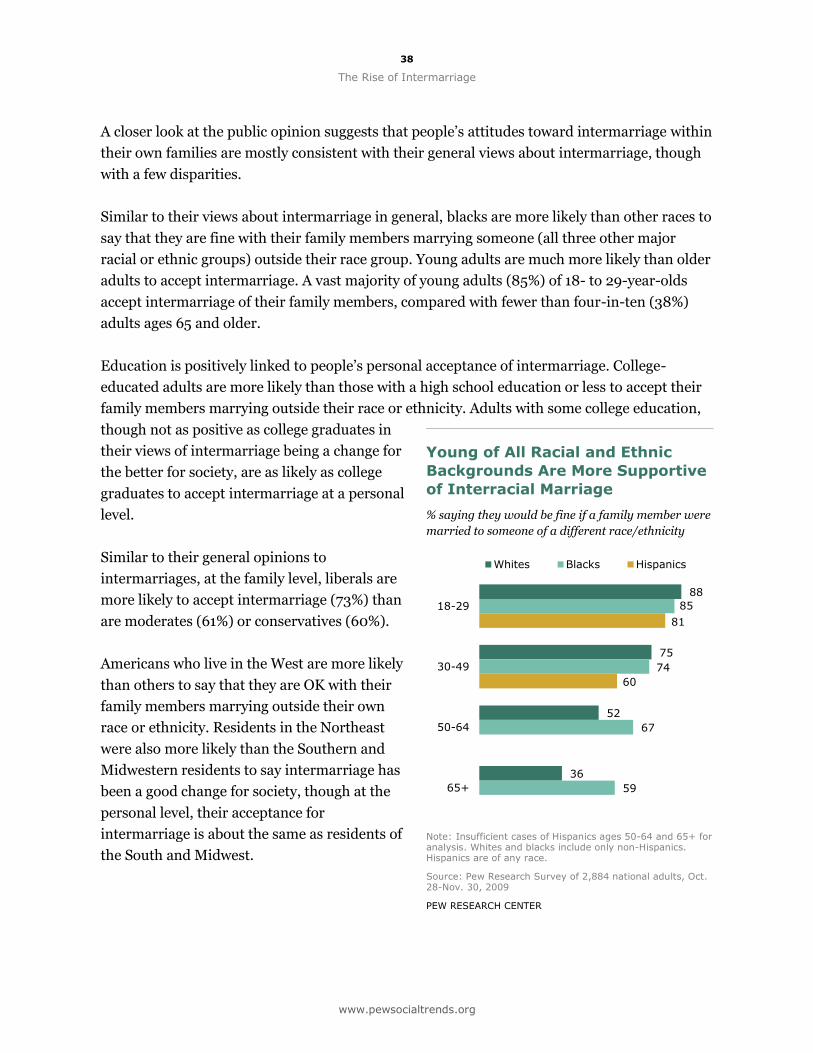
38
The Rise of Intermarriage
www.pewsocialtrends.org
88
75
52
36
85
74
67
59
81
60
18-29
30-49
50-64
65+
Whites Blacks Hispanics
A closer look at the public opinion suggests that people’s attitudes toward intermarriage within
their own families are mostly consistent with their general views about intermarriage, though
with a few disparities.
Similar to their views about intermarriage in general, blacks are more likely than other races to
say that they are fine with their family members marrying someone (all three other major
racial or ethnic groups) outside their race group. Young adults are much more likely than older
adults to accept intermarriage. A vast majority of young adults (85%) of 18- to 29-year-olds
accept intermarriage of their family members, compared with fewer than four-in-ten (38%)
adults ages 65 and older.
Education is positively linked to people’s personal acceptance of intermarriage. College-
educated adults are more likely than those with a high school education or less to accept their
family members marrying outside their race or ethnicity. Adults with some college education,
though not as positive as college graduates in
their views of intermarriage being a change for
the better for society, are as likely as college
graduates to accept intermarriage at a personal
level.
Similar to their general opinions to
intermarriages, at the family level, liberals are
more likely to accept intermarriage (73%) than
are moderates (61%) or conservatives (60%).
Americans who live in the West are more likely
than others to say that they are OK with their
family members marrying outside their own
race or ethnicity. Residents in the Northeast
were also more likely than the Southern and
Midwestern residents to say intermarriage has
been a good change for society, though at the
personal level, their acceptance for
intermarriage is about the same as residents of
the South and Midwest.
Young of All Racial and Ethnic
Backgrounds Are More Supportive
of Interracial Marriage
% saying they would be fine if a family member were
married to someone of a different race/ethnicity
Note: Insufficient cases of Hispanics ages 50-64 and 65+ for analysis. Whites and blacks include only non-Hispanics. Hispanics are of any race.
Source: Pew Research Survey of 2,884 national adults, Oct. 28-Nov. 30, 2009
PEW RESEARCH CENTER
39
PEW SOCIAL & DEMOGRAPHIC TRENDS
www.pewsocialtrends.org
Age and Marriage Outside One’s Own Racial/Ethnic Group
The overall differences between white and black attitudes toward intermarriage are primarily
driven by differences among older Americans. Regardless of race, younger Americans (18- to
29-year-olds) overwhelmingly say they would be fine with a family member’s marriage to
someone in another ethnic or racial group, with no significant racial differences among this age
group. And while 30- to 49-year-olds are somewhat less likely to be accepting of interracial
marriage than are younger people, the opinions of whites ages 30-49 are comparable to those
of blacks in that age group.
Across racial groups, racially conservative views about interracial marriage are strongly
correlated with age. Americans ages 50 and older, and particularly those 65 and older, are
considerably less accepting of interracial marriage than are those in younger age groups. While
this is true of blacks, it is more strongly pronounced among whites. Just over half of whites
ages 50-64 (52%) and only 36% of whites 65 and older say they would be fine with a relative
marrying someone from any other racial groups (this is 15 points and 23 points less than
blacks in their age groups, respectively).
For whites, blacks and Hispanics, older respondents express greater discomfort with the
possibility of a family member marrying someone of a difference race or ethnic group.
Resistance to a family member marrying an African American is especially strong among older
whites; just 55% of those ages 50-64 and 41% of those 65 and older say they “would be fine”
with this. By contrast, more than seven-in-ten older blacks (76% of those ages 50-64 and 71%
of those 65 and older) say they would be fine with a family member marrying a white
American; among blacks ages 18-29, 89% would be fine with it. And among older whites,
acceptance of a relative’s marriage to an African American lags behind acceptance of a family
member’s marriage to an Hsipanic or Asian spouse. Among 18- to 29-year-olds there are no
differences by race of respondent in the acceptance of marriage to those in other racial and
ethnic groups.
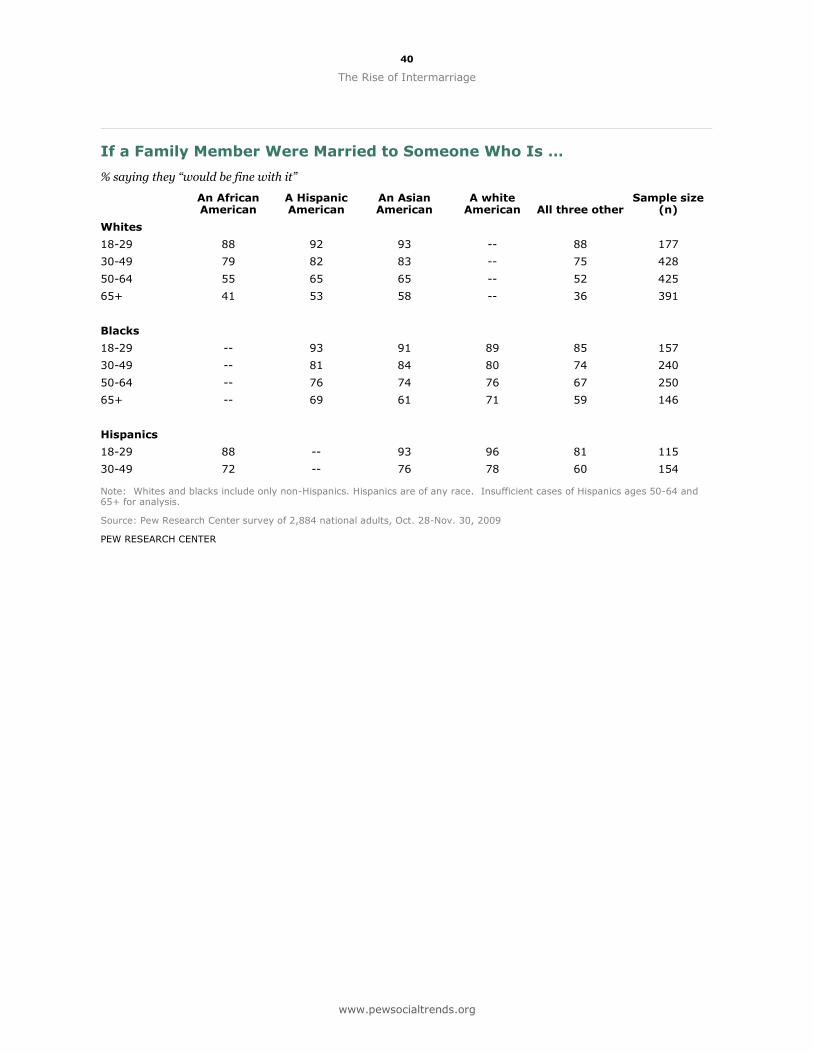
40
The Rise of Intermarriage
www.pewsocialtrends.org
If a Family Member Were Married to Someone Who Is …
% saying they “would be fine with it”
An African American
A Hispanic American
An Asian American
A white American All three other
Sample size (n)
Whites
18-29 88 92 93 -- 88 177
30-49 79 82 83 -- 75 428
50-64 55 65 65 -- 52 425
65+ 41 53 58 -- 36 391
Blacks
18-29 -- 93 91 89 85 157
30-49 -- 81 84 80 74 240
50-64 -- 76 74 76 67 250
65+ -- 69 61 71 59 146
Hispanics
18-29 88 -- 93 96 81 115
30-49 72 -- 76 78 60 154
Note: Whites and blacks include only non-Hispanics. Hispanics are of any race. Insufficient cases of Hispanics ages 50-64 and 65+ for analysis.
Source: Pew Research Center survey of 2,884 national adults, Oct. 28-Nov. 30, 2009
PEW RESEARCH CENTER
41
www.pewsocialtrends.org
APPENDICES:
1. DATA & METHODOLOGY
American Community Survey and Decennial Census
Analysis of the new marriages and currently married population are mainly based on the most
recent American Community Survey (ACS) data as well as a three-year (2008-2010) combined
ACS data set on the couple level, constructed by the Pew Research Center.
The American Community Survey is a household survey developed by the U.S. Census Bureau
to replace the long form of decennial census program. It is collected throughout the year using
mailed questionnaires, telephone interviews, and visits from Census Bureau field
representatives to about 3 million household addresses annually.
For historical trends on intermarriages, we used microdata from the Decennial Censuses of
1980, 1990, and 2000 and the American Community Surveys (ACS) of 2008 to 2010. The
microdata files were obtained from the IPUMS-USA database18 (http://www.ipums.org/). For
the three decennial censuses, the data are a 5% sample of the population; for the ACS, each is a
1% sample.19
Married Population: The currently married population is selected as individuals whose
marital status is “married, spouse present.” The spouse must be present in the data set to
ascertain his/her race, Hispanic origin and nativity. In these data sets all married couples
consist of a man and a woman. The unit of analysis in this report is the couple. The IPUMS
database includes linkages of spouse records and supplies “attached variables” that place the
value for the spouse’s variable on each record. Thus, by selecting only records of married,
spouse present males (or females) and “attaching” values of all variables for the spouse, we
constructed a data set where each record represents a married couple and the data set includes
all married couples in the sample. For the analyses in the current study, we included attached
variables such as the spouse’s age, race, Hispanic origin, nativity, year of immigration, other
social and economic variables and weighting information.
18 Steven Ruggles, J. Trent Alexander, Katie Genadek, Ronald Goeken, Matthew B. Schroeder and Matthew Sobek. Integrated
Public Use Microdata Series: Version 5.0 [Machine-readable database]. Minneapolis: University of Minnesota, 2010. 19 IPUMS files are available for earlier U.S. Censuses, but the 1980 Census is the first to collect information on Hispanic origin
from the entire population. This information is required for the intermarriage analyses reported here. For earlier censuses, IPUMS
has created a variable to identify the Hispanic origin population, but spouses are always assigned the same Hispanic category so
the data for 1970 and earlier cannot be analyzed in the same manner as subsequent censuses.
42
www.pewsocialtrends.org
Newly Married Population: The newly married population is a subset of the currently
married population drawn from ACS 2008 and later. The 2008 ACS was the first to include
questions relating to date of marriage. One question asked respondents if they had been
married (or divorced or widowed) in the “past 12 months.”20 Those saying they had married are
the basis for the analyses of “newlyweds” and “new marriages” in this report. Further questions
asked how many times the respondent has been married and in what year the most recent
marriage occurred. To increase the sample size of subgroups, analyses of characteristics of
newlyweds in this report were based on combined three-year data (2008-2010) for newlyweds.
A Note on Historical Intermarriage Trend: Because the information on new marriages
is available only starting in the 2008 ACS, historical comparisons of new marriage or
intermarriage rates can be challenging. Using unique information provided by the 1980
Census, we were able to estimate the newly married population in 1980, although the
definition of “newly married” is slightly different.
The 1980 Census asked respondents if they had been married once or more than once, the
month and year of marriage (first marriage in the case of multiple marriages), and if the first
marriage had ended by the death of the other spouse. With this information, we derived the
year in which the first marriage occurred and identified persons whose first marriage occurred
in the year before the 1980 Census. The newly married couples for 1980 reported here consist
only of those marriages in which either the bride or groom was marrying for the first time,
since marriages in which both spouses had been married more than once could not be assigned
a year of marriage (around 10% of the married population). While this means that the 1980
data do not include all new marriages that year, it is not likely to have a significant impact on
the comparisons presented between rates of intermarriage in 1980 and the present. About 90%
of the married population in 1980 included one or both spouses in a first marriage, and the
intermarriage rates for those in first marriages differed little from all married persons.
Weighting and Other Technical Issues: All of the estimates for marriages, currently
married population and people getting married are based on weighted data from the IPUMS
microdata files. The Census Bureau provides the weights based on a complicated weighting
process so that the resulting estimates reflect the actual population. In the data from the 1980
Census, the weights for each person in a husband-wife couple are forced to be equal. This is not
the case for the data files from the ACS or the 1990 and 2000 Censuses. Consequently, the
number and characteristics of wives estimated using their husbands’ weights will be different
from the same estimates based on the wives’ weights; similarly for characteristics of men
20 Because each year’s ACS is an aggregation of 12 monthly samples, responses to this question cannot be assigned to a specific
year or set of months. Thus, we report the marriages as occurring in the “previous year.”
43
www.pewsocialtrends.org
estimated from their wives’ weights. For this report, we created a “couple weight” as the
average of the husband’s weight and the wife’s weight (similar to the 1980 Census process).
This weight is used in all ACS analyses to ensure that the number of husbands equals the
number of wives.21
In processing the ACS data for this report, we identified a small percentage of couples (less
than 0.1% in each year) in which the year of marriage reported by the husband differed from
the wife’s report. In an even smaller share of cases (less than 0.01% each year or about 50
unweighted couples), the linkages supplied by IPUMS appear to have linked the wrong
individuals in households with two or more married couples, based on reported year of
marriage. In the data used for this report, these few cases have been corrected.22
Race and Ethnic Groups: Individuals are identified as Hispanic or non-Hispanic with a
direct question on Hispanic origin. The wording and placement of the question have changed
somewhat over the 1980-2010 period, but the underlying concept has remained essentially
unchanged. Individuals who are not Hispanic are further subdivided by race group.
Throughout the period of analysis, we use data for whites, black, Asians and Pacific Islanders23
(“Asians”), American Indians and Alaska natives (“American Indians”) and a residual category
usually labeled as “Some Other Race.”
Beginning with the 2000 Census, individuals could choose to identify with more than one
group in response to the race question; about 4.6 million non-Hispanics, or slightly less than
2% of the non-Hispanic population, chose more than one race. We treat these people as an
additional racial grouping and reserve the specific races listed above for persons identifying as
a single race only. This change in data collection methods may have accounted for a significant
share of the increase in intermarriage observed in the currently married population between
1990 and 2000. In the 2000 Census, about 720,000, or 19% of the 3.8 million marriages with
spouses of a different race, were between a non-Hispanic person reporting a single race and a
non-Hispanic person reporting more than one race. Had the race question remained the same
as in 1990, some of these interracial marriages in 2000 would not have been so classified. This
type of marriage accounted for almost half of the increase in interracial marriages between
1990 and 2000. In 2008, roughly the same number of interracial marriages, about 700,000,
21 In a previous report on intermarriages, ”Marrying Out: One-in-Seven New U.S. Marriages is Interracial or Interethnic,” June 4,
2010, we used a slightly different procedure of treating each gender separately and averaging the resulting estimates for couples.
The new procedure is easier to implement and interpret and provides a more accurate picture of married couples. 22 A few of these mismatched couples are newlyweds. As a result of the corrections the rate of intermarriage for 2008 (14.5%)
differs very slightly from the rate reported in our previous report (14.6%). 23
Beginning with the 2000 Census, these two groups were separated and labeled “Asian” and “Native Hawaiians and Other Pacific
Islanders.” For this report, these two groups are combined.
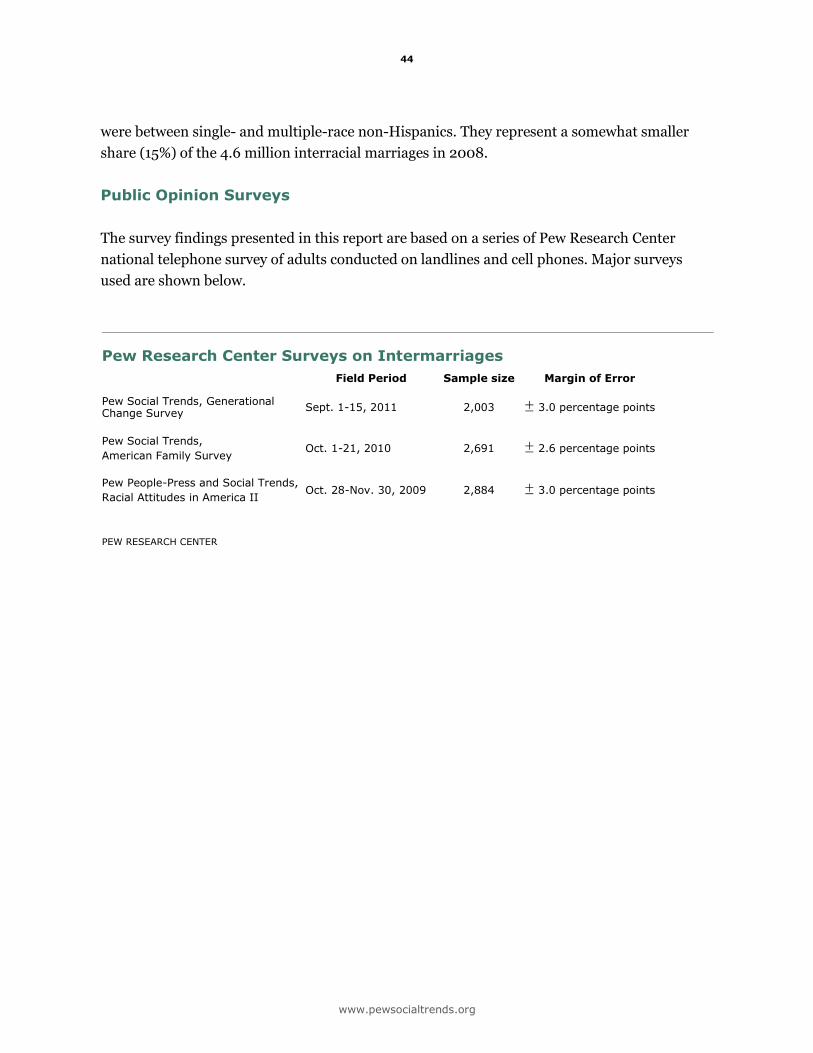
44
www.pewsocialtrends.org
were between single- and multiple-race non-Hispanics. They represent a somewhat smaller
share (15%) of the 4.6 million interracial marriages in 2008.
Public Opinion Surveys
The survey findings presented in this report are based on a series of Pew Research Center
national telephone survey of adults conducted on landlines and cell phones. Major surveys
used are shown below.
Pew Research Center Surveys on Intermarriages
Field Period Sample size Margin of Error
Pew Social Trends, Generational Change Survey
Sept. 1-15, 2011 2,003 ± 3.0 percentage points
Pew Social Trends,
American Family Survey Oct. 1-21, 2010 2,691 ± 2.6 percentage points
Pew People-Press and Social Trends,
Racial Attitudes in America II Oct. 28-Nov. 30, 2009 2,884 ± 3.0 percentage points
PEW RESEARCH CENTER
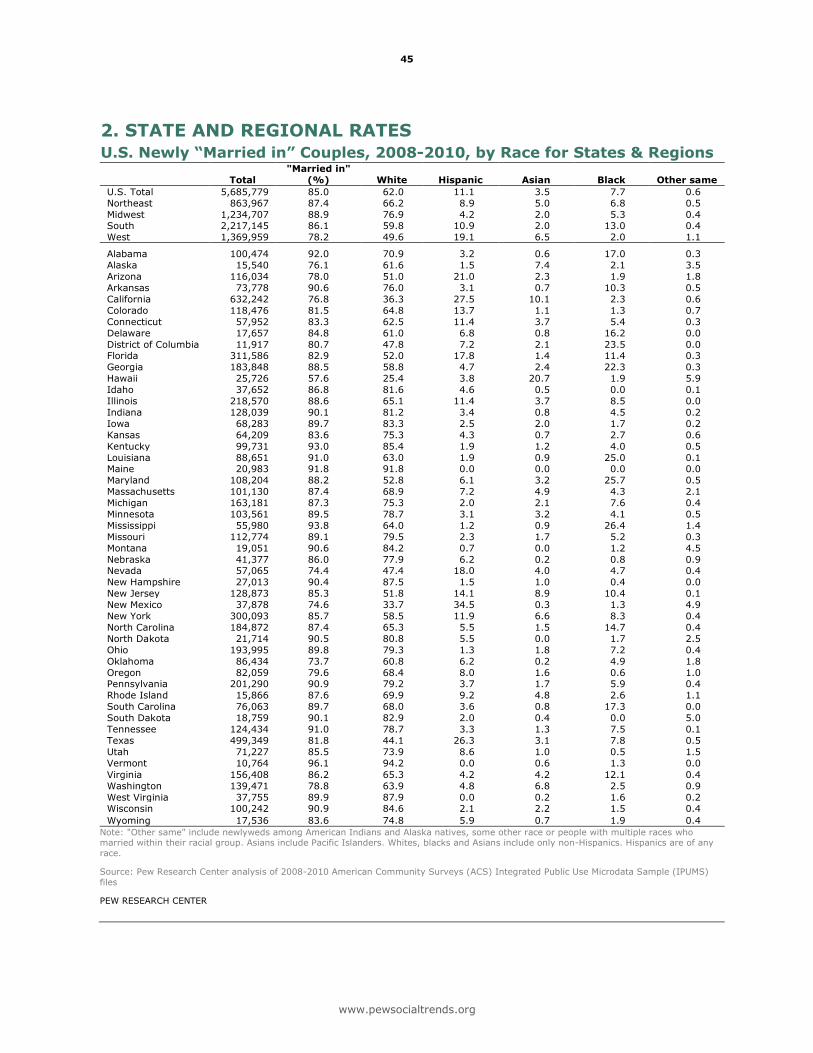
45
www.pewsocialtrends.org
2. STATE AND REGIONAL RATES
U.S. Newly “Married in” Couples, 2008-2010, by Race for States & Regions
Total
"Married in"
(%) White Hispanic Asian Black Other same
U.S. Total 5,685,779 85.0 62.0 11.1 3.5 7.7 0.6
Northeast 863,967 87.4 66.2 8.9 5.0 6.8 0.5
Midwest 1,234,707 88.9 76.9 4.2 2.0 5.3 0.4 South 2,217,145 86.1 59.8 10.9 2.0 13.0 0.4
West 1,369,959 78.2 49.6 19.1 6.5 2.0 1.1
Alabama 100,474 92.0 70.9 3.2 0.6 17.0 0.3
Alaska 15,540 76.1 61.6 1.5 7.4 2.1 3.5
Arizona 116,034 78.0 51.0 21.0 2.3 1.9 1.8
Arkansas 73,778 90.6 76.0 3.1 0.7 10.3 0.5
California 632,242 76.8 36.3 27.5 10.1 2.3 0.6
Colorado 118,476 81.5 64.8 13.7 1.1 1.3 0.7
Connecticut 57,952 83.3 62.5 11.4 3.7 5.4 0.3
Delaware 17,657 84.8 61.0 6.8 0.8 16.2 0.0
District of Columbia 11,917 80.7 47.8 7.2 2.1 23.5 0.0 Florida 311,586 82.9 52.0 17.8 1.4 11.4 0.3
Georgia 183,848 88.5 58.8 4.7 2.4 22.3 0.3
Hawaii 25,726 57.6 25.4 3.8 20.7 1.9 5.9
Idaho 37,652 86.8 81.6 4.6 0.5 0.0 0.1
Illinois 218,570 88.6 65.1 11.4 3.7 8.5 0.0
Indiana 128,039 90.1 81.2 3.4 0.8 4.5 0.2
Iowa 68,283 89.7 83.3 2.5 2.0 1.7 0.2
Kansas 64,209 83.6 75.3 4.3 0.7 2.7 0.6
Kentucky 99,731 93.0 85.4 1.9 1.2 4.0 0.5
Louisiana 88,651 91.0 63.0 1.9 0.9 25.0 0.1 Maine 20,983 91.8 91.8 0.0 0.0 0.0 0.0
Maryland 108,204 88.2 52.8 6.1 3.2 25.7 0.5
Massachusetts 101,130 87.4 68.9 7.2 4.9 4.3 2.1
Michigan 163,181 87.3 75.3 2.0 2.1 7.6 0.4
Minnesota 103,561 89.5 78.7 3.1 3.2 4.1 0.5
Mississippi 55,980 93.8 64.0 1.2 0.9 26.4 1.4
Missouri 112,774 89.1 79.5 2.3 1.7 5.2 0.3
Montana 19,051 90.6 84.2 0.7 0.0 1.2 4.5
Nebraska 41,377 86.0 77.9 6.2 0.2 0.8 0.9 Nevada 57,065 74.4 47.4 18.0 4.0 4.7 0.4
New Hampshire 27,013 90.4 87.5 1.5 1.0 0.4 0.0
New Jersey 128,873 85.3 51.8 14.1 8.9 10.4 0.1
New Mexico 37,878 74.6 33.7 34.5 0.3 1.3 4.9
New York 300,093 85.7 58.5 11.9 6.6 8.3 0.4
North Carolina 184,872 87.4 65.3 5.5 1.5 14.7 0.4
North Dakota 21,714 90.5 80.8 5.5 0.0 1.7 2.5
Ohio 193,995 89.8 79.3 1.3 1.8 7.2 0.4
Oklahoma 86,434 73.7 60.8 6.2 0.2 4.9 1.8
Oregon 82,059 79.6 68.4 8.0 1.6 0.6 1.0 Pennsylvania 201,290 90.9 79.2 3.7 1.7 5.9 0.4
Rhode Island 15,866 87.6 69.9 9.2 4.8 2.6 1.1
South Carolina 76,063 89.7 68.0 3.6 0.8 17.3 0.0
South Dakota 18,759 90.1 82.9 2.0 0.4 0.0 5.0
Tennessee 124,434 91.0 78.7 3.3 1.3 7.5 0.1
Texas 499,349 81.8 44.1 26.3 3.1 7.8 0.5
Utah 71,227 85.5 73.9 8.6 1.0 0.5 1.5
Vermont 10,764 96.1 94.2 0.0 0.6 1.3 0.0
Virginia 156,408 86.2 65.3 4.2 4.2 12.1 0.4
Washington 139,471 78.8 63.9 4.8 6.8 2.5 0.9
West Virginia 37,755 89.9 87.9 0.0 0.2 1.6 0.2 Wisconsin 100,242 90.9 84.6 2.1 2.2 1.5 0.4
Wyoming 17,536 83.6 74.8 5.9 0.7 1.9 0.4
Note: "Other same" include newlyweds among American Indians and Alaska natives, some other race or people with multiple races who married within their racial group. Asians include Pacific Islanders. Whites, blacks and Asians include only non-Hispanics. Hispanics are of any
race.
Source: Pew Research Center analysis of 2008-2010 American Community Surveys (ACS) Integrated Public Use Microdata Sample (IPUMS)
files
PEW RESEARCH CENTER
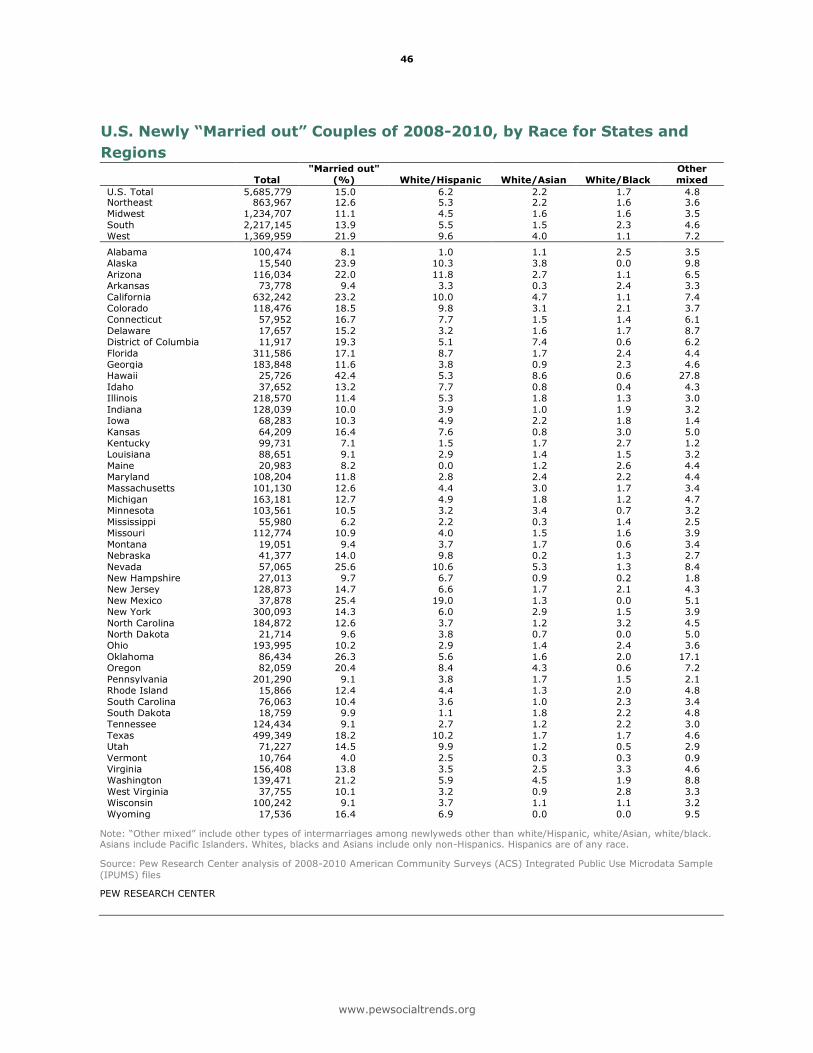
46
www.pewsocialtrends.org
U.S. Newly “Married out” Couples of 2008-2010, by Race for States and
Regions
Total
"Married out"
(%) White/Hispanic White/Asian White/Black
Other
mixed
U.S. Total 5,685,779 15.0 6.2 2.2 1.7 4.8 Northeast 863,967 12.6 5.3 2.2 1.6 3.6 Midwest 1,234,707 11.1 4.5 1.6 1.6 3.5
South 2,217,145 13.9 5.5 1.5 2.3 4.6 West 1,369,959 21.9 9.6 4.0 1.1 7.2
Alabama 100,474 8.1 1.0 1.1 2.5 3.5 Alaska 15,540 23.9 10.3 3.8 0.0 9.8
Arizona 116,034 22.0 11.8 2.7 1.1 6.5 Arkansas 73,778 9.4 3.3 0.3 2.4 3.3
California 632,242 23.2 10.0 4.7 1.1 7.4 Colorado 118,476 18.5 9.8 3.1 2.1 3.7 Connecticut 57,952 16.7 7.7 1.5 1.4 6.1
Delaware 17,657 15.2 3.2 1.6 1.7 8.7 District of Columbia 11,917 19.3 5.1 7.4 0.6 6.2
Florida 311,586 17.1 8.7 1.7 2.4 4.4 Georgia 183,848 11.6 3.8 0.9 2.3 4.6 Hawaii 25,726 42.4 5.3 8.6 0.6 27.8
Idaho 37,652 13.2 7.7 0.8 0.4 4.3 Illinois 218,570 11.4 5.3 1.8 1.3 3.0
Indiana 128,039 10.0 3.9 1.0 1.9 3.2 Iowa 68,283 10.3 4.9 2.2 1.8 1.4
Kansas 64,209 16.4 7.6 0.8 3.0 5.0 Kentucky 99,731 7.1 1.5 1.7 2.7 1.2 Louisiana 88,651 9.1 2.9 1.4 1.5 3.2
Maine 20,983 8.2 0.0 1.2 2.6 4.4 Maryland 108,204 11.8 2.8 2.4 2.2 4.4
Massachusetts 101,130 12.6 4.4 3.0 1.7 3.4 Michigan 163,181 12.7 4.9 1.8 1.2 4.7 Minnesota 103,561 10.5 3.2 3.4 0.7 3.2
Mississippi 55,980 6.2 2.2 0.3 1.4 2.5 Missouri 112,774 10.9 4.0 1.5 1.6 3.9
Montana 19,051 9.4 3.7 1.7 0.6 3.4 Nebraska 41,377 14.0 9.8 0.2 1.3 2.7
Nevada 57,065 25.6 10.6 5.3 1.3 8.4 New Hampshire 27,013 9.7 6.7 0.9 0.2 1.8 New Jersey 128,873 14.7 6.6 1.7 2.1 4.3
New Mexico 37,878 25.4 19.0 1.3 0.0 5.1 New York 300,093 14.3 6.0 2.9 1.5 3.9
North Carolina 184,872 12.6 3.7 1.2 3.2 4.5 North Dakota 21,714 9.6 3.8 0.7 0.0 5.0 Ohio 193,995 10.2 2.9 1.4 2.4 3.6
Oklahoma 86,434 26.3 5.6 1.6 2.0 17.1 Oregon 82,059 20.4 8.4 4.3 0.6 7.2
Pennsylvania 201,290 9.1 3.8 1.7 1.5 2.1 Rhode Island 15,866 12.4 4.4 1.3 2.0 4.8
South Carolina 76,063 10.4 3.6 1.0 2.3 3.4 South Dakota 18,759 9.9 1.1 1.8 2.2 4.8 Tennessee 124,434 9.1 2.7 1.2 2.2 3.0
Texas 499,349 18.2 10.2 1.7 1.7 4.6 Utah 71,227 14.5 9.9 1.2 0.5 2.9
Vermont 10,764 4.0 2.5 0.3 0.3 0.9 Virginia 156,408 13.8 3.5 2.5 3.3 4.6 Washington 139,471 21.2 5.9 4.5 1.9 8.8
West Virginia 37,755 10.1 3.2 0.9 2.8 3.3 Wisconsin 100,242 9.1 3.7 1.1 1.1 3.2
Wyoming 17,536 16.4 6.9 0.0 0.0 9.5
Note: “Other mixed” include other types of intermarriages among newlyweds other than white/Hispanic, white/Asian, white/black. Asians include Pacific Islanders. Whites, blacks and Asians include only non-Hispanics. Hispanics are of any race.
Source: Pew Research Center analysis of 2008-2010 American Community Surveys (ACS) Integrated Public Use Microdata Sample
(IPUMS) files
PEW RESEARCH CENTER
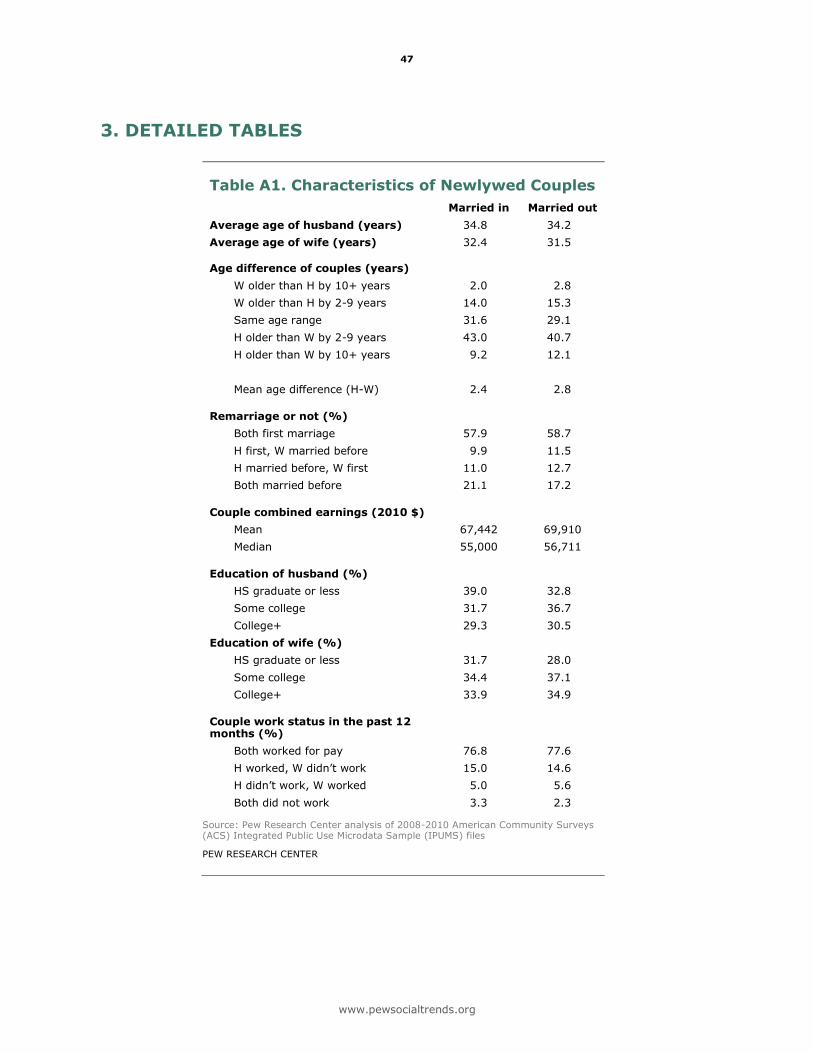
47
www.pewsocialtrends.org
3. DETAILED TABLES
Table A1. Characteristics of Newlywed Couples
Married in Married out
Average age of husband (years) 34.8 34.2
Average age of wife (years) 32.4 31.5
Age difference of couples (years)
W older than H by 10+ years 2.0 2.8
W older than H by 2-9 years 14.0 15.3
Same age range 31.6 29.1
H older than W by 2-9 years 43.0 40.7
H older than W by 10+ years 9.2 12.1
Mean age difference (H-W) 2.4 2.8
Remarriage or not (%)
Both first marriage 57.9 58.7
H first, W married before 9.9 11.5
H married before, W first 11.0 12.7
Both married before 21.1 17.2
Couple combined earnings (2010 $)
Mean 67,442 69,910
Median 55,000 56,711
Education of husband (%)
HS graduate or less 39.0 32.8
Some college 31.7 36.7
College+ 29.3 30.5
Education of wife (%)
HS graduate or less 31.7 28.0
Some college 34.4 37.1
College+ 33.9 34.9
Couple work status in the past 12 months (%)
Both worked for pay 76.8 77.6
H worked, W didn’t work 15.0 14.6
H didn’t work, W worked 5.0 5.6
Both did not work 3.3 2.3
Source: Pew Research Center analysis of 2008-2010 American Community Surveys (ACS) Integrated Public Use Microdata Sample (IPUMS) files
PEW RESEARCH CENTER
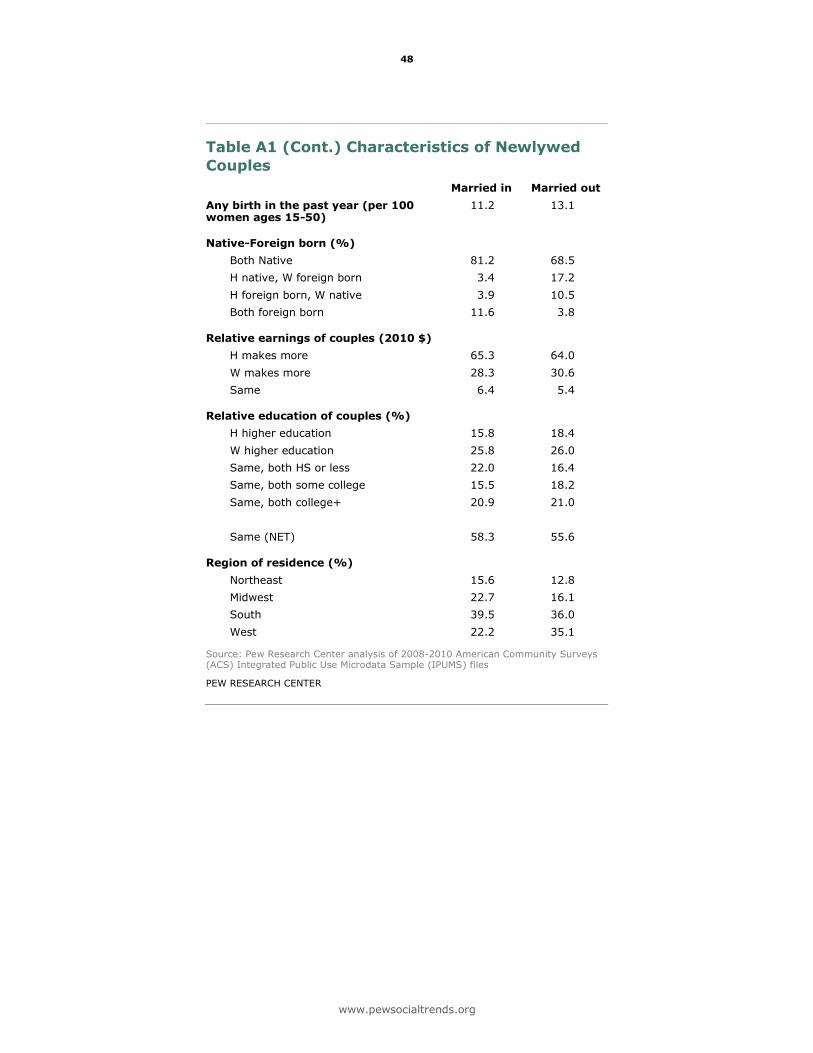
48
www.pewsocialtrends.org
Table A1 (Cont.) Characteristics of Newlywed
Couples
Married in Married out
Any birth in the past year (per 100 women ages 15-50)
11.2 13.1
Native-Foreign born (%)
Both Native 81.2 68.5
H native, W foreign born 3.4 17.2
H foreign born, W native 3.9 10.5
Both foreign born 11.6 3.8
Relative earnings of couples (2010 $)
H makes more 65.3 64.0
W makes more 28.3 30.6
Same 6.4 5.4
Relative education of couples (%)
H higher education 15.8 18.4
W higher education 25.8 26.0
Same, both HS or less 22.0 16.4
Same, both some college 15.5 18.2
Same, both college+ 20.9 21.0
Same (NET) 58.3 55.6
Region of residence (%)
Northeast 15.6 12.8
Midwest 22.7 16.1
South 39.5 36.0
West 22.2 35.1
Source: Pew Research Center analysis of 2008-2010 American Community Surveys (ACS) Integrated Public Use Microdata Sample (IPUMS) files
PEW RESEARCH CENTER

49
www.pewsocialtrends.org
Table A2. Characteristics of Newlywed Couples Involving Whites
White/White White/Hispanic White/Asian White/Black
Average age of husband (years) 34.9 33.2 37.8 35.3
Average age of wife (years) 32.6 30.9 33.2 32.8
Age difference of couples (years)
W older than H by 10+ years 1.8 2.5 2.4 4.2
W older than H by 2-9 years 14.1 16.3 13.9 17.1
Same age range 32.9 30.1 25.7 24.8
H older than W by 2-9 years 42.6 41.1 37.8 41.6
H older than W by 10+ years 8.6 10.0 20.1 12.3
Mean age difference (H-W) 2.3 2.3 4.6 2.4
Remarriage or not (%)
Both first marriage 55.3 58.7 58.6 53.7
H first, W married before 10.0 12.0 10.3 13.9
H married before, W first 10.6 12.1 16.9 13.3
Both married before 24.1 17.2 14.2 19.1
Couple combined earnings (2010 $)
Mean 72,791 69,501 93,001 62,651
Median 60,000 57,900 70,952 53,187
Education of Husband (%)
HS graduate or less 34.2 36.2 16.5 35.9
Some college 33.5 36.0 29.5 40.8
College+ 32.3 27.9 54.0 23.3
Education of Wife (%)
HS graduate or less 26.7 30.0 15.9 31.8
Some college 36.0 37.5 24.7 41.1
College+ 37.3 32.5 59.4 27.1
Couple work status in the past 12 months (%)
Both worked for pay 81.0 77.9 76.2 79.0
H worked, W didn’t work 11.5 15.2 17.5 10.3
H didn’t work, W worked 4.5 5.0 4.3 7.7
Both did not work 3.0 1.9 2.1 3.0
Note: Asians include Pacific Islanders. Whites, blacks and Asians include only non-Hispanics. Hispanics are of any race.
Source: Pew Research Center analysis of 2008-2010 American Community Surveys (ACS) Integrated Public Use Microdata Sample (IPUMS) files
PEW RESEARCH CENTER
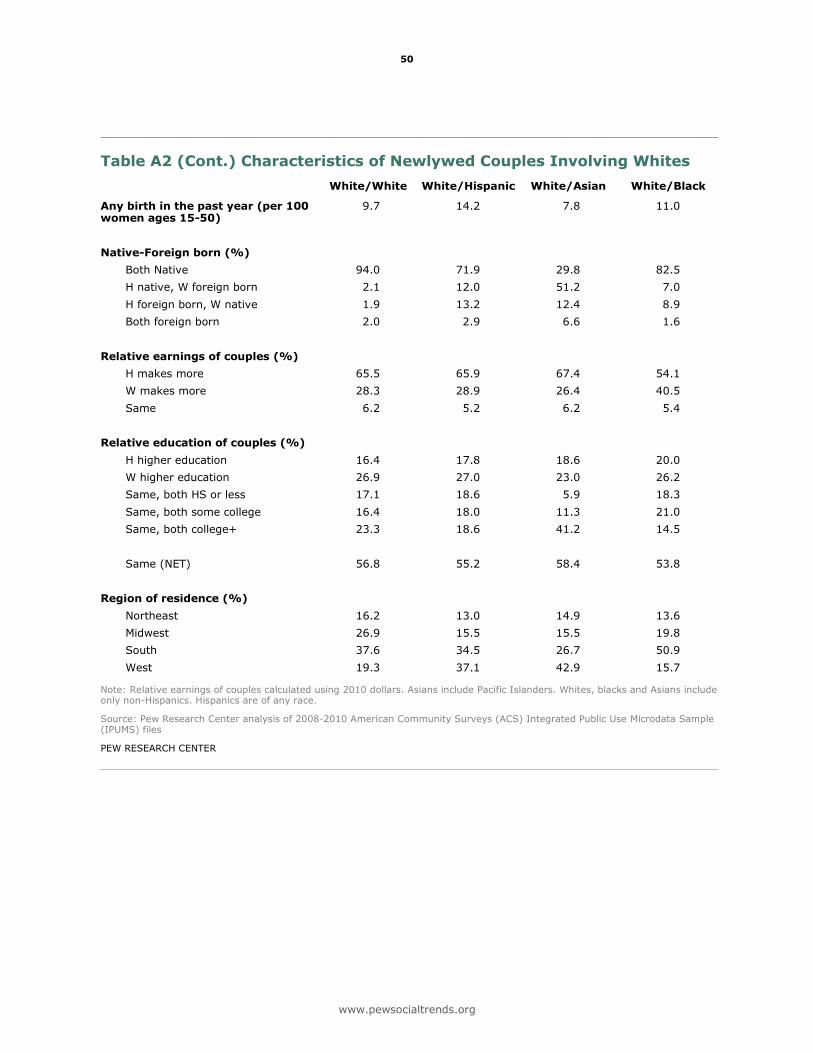
50
www.pewsocialtrends.org
Table A2 (Cont.) Characteristics of Newlywed Couples Involving Whites
White/White White/Hispanic White/Asian White/Black
Any birth in the past year (per 100 women ages 15-50)
9.7 14.2 7.8 11.0
Native-Foreign born (%)
Both Native 94.0 71.9 29.8 82.5
H native, W foreign born 2.1 12.0 51.2 7.0
H foreign born, W native 1.9 13.2 12.4 8.9
Both foreign born 2.0 2.9 6.6 1.6
Relative earnings of couples (%)
H makes more 65.5 65.9 67.4 54.1
W makes more 28.3 28.9 26.4 40.5
Same 6.2 5.2 6.2 5.4
Relative education of couples (%)
H higher education 16.4 17.8 18.6 20.0
W higher education 26.9 27.0 23.0 26.2
Same, both HS or less 17.1 18.6 5.9 18.3
Same, both some college 16.4 18.0 11.3 21.0
Same, both college+ 23.3 18.6 41.2 14.5
Same (NET) 56.8 55.2 58.4 53.8
Region of residence (%)
Northeast 16.2 13.0 14.9 13.6
Midwest 26.9 15.5 15.5 19.8
South 37.6 34.5 26.7 50.9
West 19.3 37.1 42.9 15.7
Note: Relative earnings of couples calculated using 2010 dollars. Asians include Pacific Islanders. Whites, blacks and Asians include only non-Hispanics. Hispanics are of any race.
Source: Pew Research Center analysis of 2008-2010 American Community Surveys (ACS) Integrated Public Use Microdata Sample (IPUMS) files
PEW RESEARCH CENTER
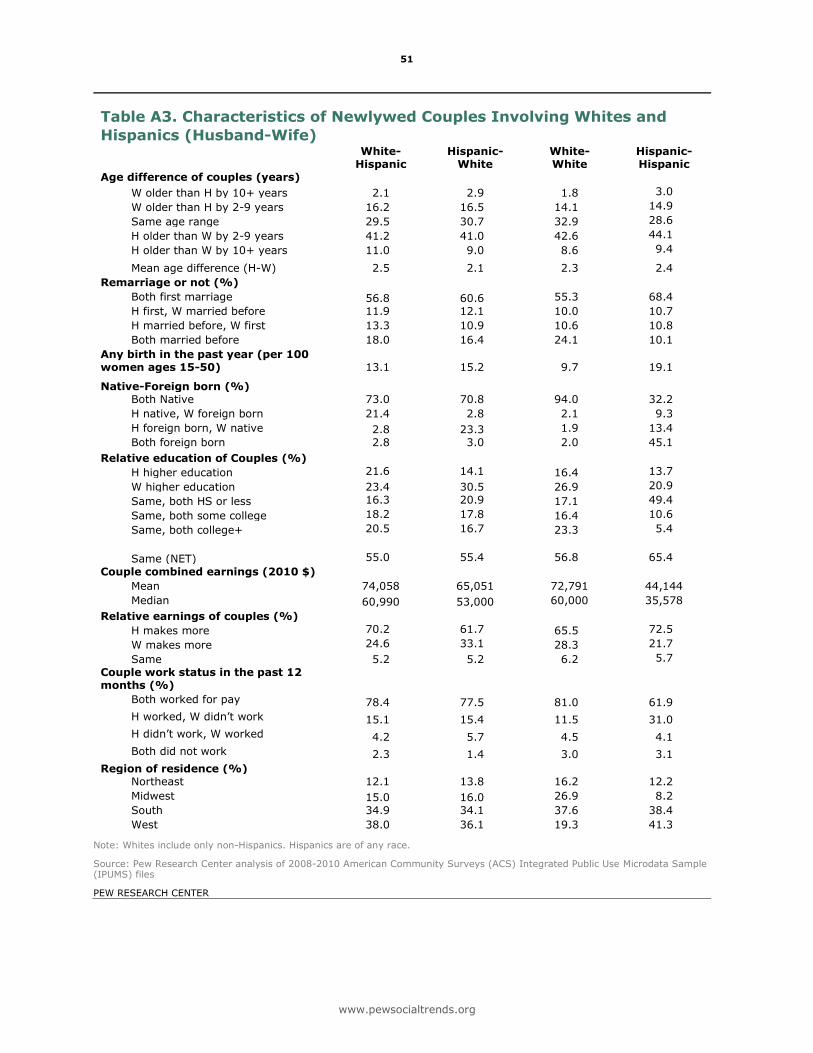
51
www.pewsocialtrends.org
Table A3. Characteristics of Newlywed Couples Involving Whites and
Hispanics (Husband-Wife) White-
Hispanic Hispanic-
White White- White
Hispanic-Hispanic
Age difference of couples (years)
W older than H by 10+ years 2.1 2.9 1.8 3.0
W older than H by 2-9 years 16.2 16.5 14.1 14.9
Same age range 29.5 30.7 32.9 28.6
H older than W by 2-9 years 41.2 41.0 42.6 44.1
H older than W by 10+ years 11.0 9.0 8.6 9.4
Mean age difference (H-W) 2.5 2.1 2.3 2.4
Remarriage or not (%)
Both first marriage 56.8 60.6 55.3 68.4
H first, W married before 11.9 12.1 10.0 10.7
H married before, W first 13.3 10.9 10.6 10.8
Both married before 18.0 16.4 24.1 10.1
Any birth in the past year (per 100 women ages 15-50) 13.1 15.2 9.7 19.1
Native-Foreign born (%)
Both Native 73.0 70.8 94.0 32.2
H native, W foreign born 21.4 2.8 2.1 9.3
H foreign born, W native 2.8 23.3 1.9 13.4
Both foreign born 2.8 3.0 2.0 45.1
Relative education of Couples (%)
H higher education 21.6 14.1 16.4 13.7
W higher education 23.4 30.5 26.9 20.9
Same, both HS or less 16.3 20.9 17.1 49.4
Same, both some college 18.2 17.8 16.4 10.6
Same, both college+ 20.5 16.7 23.3 5.4
Same (NET) 55.0 55.4 56.8 65.4
Couple combined earnings (2010 $)
Mean 74,058 65,051 72,791 44,144
Median 60,990 53,000 60,000 35,578
Relative earnings of couples (%)
H makes more 70.2 61.7 65.5 72.5
W makes more 24.6 33.1 28.3 21.7
Same 5.2 5.2 6.2 5.7
Couple work status in the past 12 months (%)
Both worked for pay 78.4 77.5 81.0 61.9 H worked, W didn’t work 15.1 15.4 11.5 31.0 H didn’t work, W worked 4.2 5.7 4.5 4.1 Both did not work 2.3 1.4 3.0 3.1
Region of residence (%)
Northeast 12.1 13.8 16.2 12.2
Midwest 15.0 16.0 26.9 8.2
South 34.9 34.1 37.6 38.4
West 38.0 36.1 19.3 41.3
Note: Whites include only non-Hispanics. Hispanics are of any race.
Source: Pew Research Center analysis of 2008-2010 American Community Surveys (ACS) Integrated Public Use Microdata Sample (IPUMS) files
PEW RESEARCH CENTER
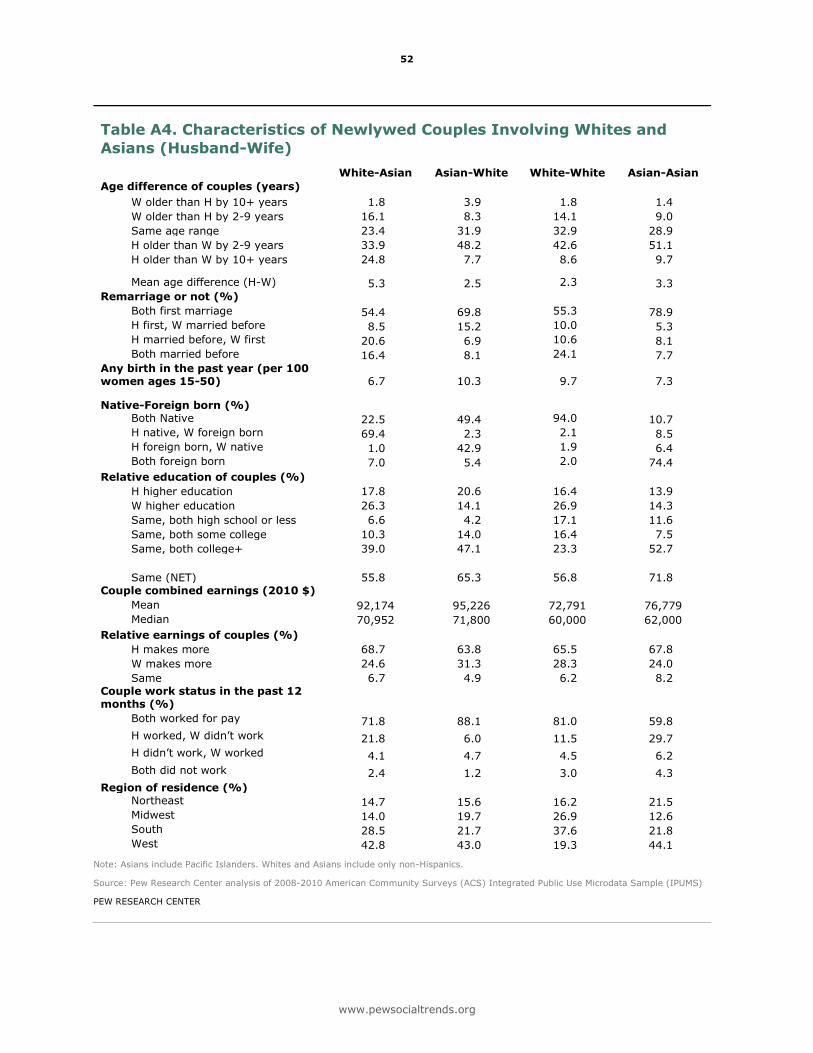
52
www.pewsocialtrends.org
Table A4. Characteristics of Newlywed Couples Involving Whites and
Asians (Husband-Wife)
White-Asian Asian-White White-White Asian-Asian
Age difference of couples (years)
W older than H by 10+ years 1.8 3.9 1.8 1.4 W older than H by 2-9 years 16.1 8.3 14.1 9.0 Same age range 23.4 31.9 32.9 28.9 H older than W by 2-9 years 33.9 48.2 42.6 51.1 H older than W by 10+ years 24.8 7.7 8.6 9.7
Mean age difference (H-W) 5.3 2.5 2.3 3.3 Remarriage or not (%)
Both first marriage 54.4 69.8 55.3 78.9 H first, W married before 8.5 15.2 10.0 5.3 H married before, W first 20.6 6.9 10.6 8.1 Both married before 16.4 8.1 24.1 7.7 Any birth in the past year (per 100 women ages 15-50) 6.7 10.3 9.7 7.3
Native-Foreign born (%)
Both Native 22.5 49.4 94.0 10.7
H native, W foreign born 69.4 2.3 2.1 8.5
H foreign born, W native 1.0 42.9 1.9 6.4
Both foreign born 7.0 5.4 2.0 74.4
Relative education of couples (%)
H higher education 17.8 20.6 16.4 13.9
W higher education 26.3 14.1 26.9 14.3
Same, both high school or less 6.6 4.2 17.1 11.6
Same, both some college 10.3 14.0 16.4 7.5
Same, both college+ 39.0 47.1 23.3 52.7
Same (NET) 55.8 65.3 56.8 71.8
Couple combined earnings (2010 $)
Mean 92,174 95,226 72,791 76,779
Median 70,952 71,800 60,000 62,000
Relative earnings of couples (%)
H makes more 68.7 63.8 65.5 67.8
W makes more 24.6 31.3 28.3 24.0
Same 6.7 4.9 6.2 8.2
Couple work status in the past 12 months (%)
Both worked for pay 71.8 88.1 81.0 59.8 H worked, W didn’t work 21.8 6.0 11.5 29.7 H didn’t work, W worked 4.1 4.7 4.5 6.2
Both did not work 2.4 1.2 3.0 4.3
Region of residence (%)
Northeast 14.7 15.6 16.2 21.5
Midwest 14.0 19.7 26.9 12.6
South 28.5 21.7 37.6 21.8
West 42.8 43.0 19.3 44.1
Note: Asians include Pacific Islanders. Whites and Asians include only non-Hispanics.
Source: Pew Research Center analysis of 2008-2010 American Community Surveys (ACS) Integrated Public Use Microdata Sample (IPUMS)
PEW RESEARCH CENTER
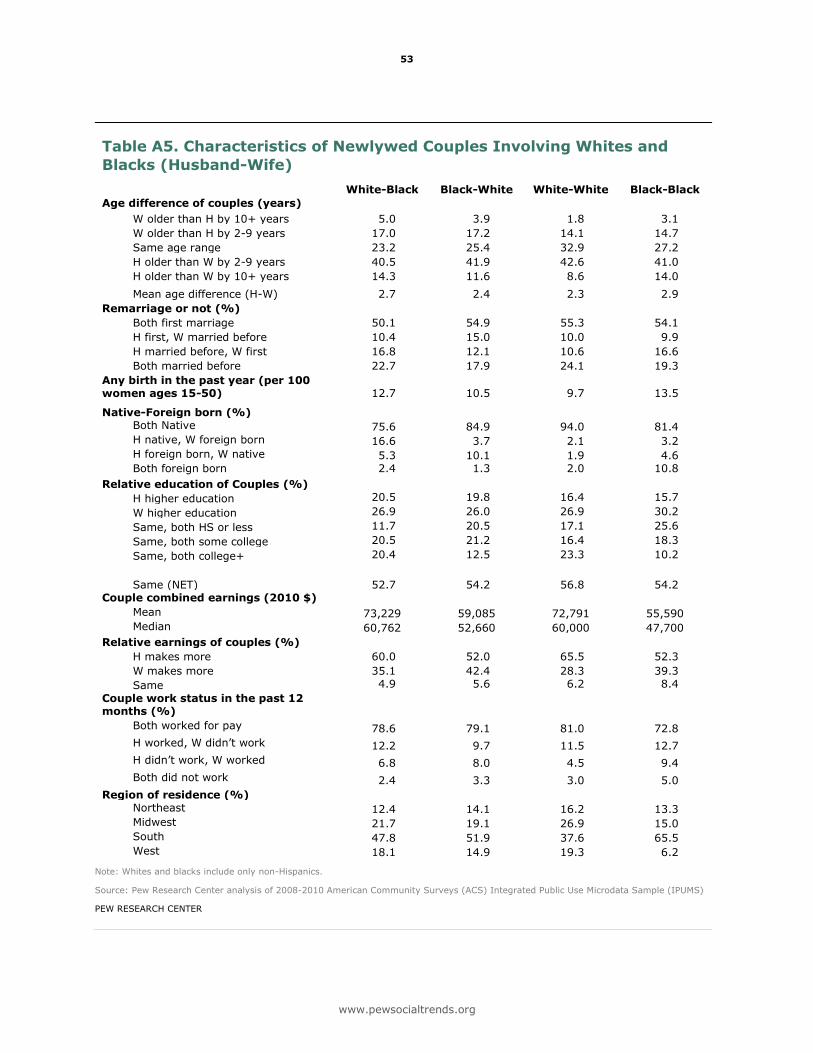
53
www.pewsocialtrends.org
Table A5. Characteristics of Newlywed Couples Involving Whites and
Blacks (Husband-Wife)
White-Black Black-White White-White Black-Black
Age difference of couples (years)
W older than H by 10+ years 5.0 3.9 1.8 3.1 W older than H by 2-9 years 17.0 17.2 14.1 14.7 Same age range 23.2 25.4 32.9 27.2 H older than W by 2-9 years 40.5 41.9 42.6 41.0 H older than W by 10+ years 14.3 11.6 8.6 14.0 Mean age difference (H-W) 2.7 2.4 2.3 2.9
Remarriage or not (%)
Both first marriage 50.1 54.9 55.3 54.1
H first, W married before 10.4 15.0 10.0 9.9
H married before, W first 16.8 12.1 10.6 16.6
Both married before 22.7 17.9 24.1 19.3
Any birth in the past year (per 100 women ages 15-50) 12.7 10.5 9.7 13.5
Native-Foreign born (%)
Both Native 75.6 84.9 94.0 81.4
H native, W foreign born 16.6 3.7 2.1 3.2
H foreign born, W native 5.3 10.1 1.9 4.6
Both foreign born 2.4 1.3 2.0 10.8
Relative education of Couples (%)
H higher education 20.5 19.8 16.4 15.7
W higher education 26.9 26.0 26.9 30.2
Same, both HS or less 11.7 20.5 17.1 25.6
Same, both some college 20.5 21.2 16.4 18.3
Same, both college+ 20.4 12.5 23.3 10.2
Same (NET) 52.7 54.2 56.8 54.2
Couple combined earnings (2010 $)
Mean 73,229 59,085 72,791 55,590 Median 60,762 52,660 60,000 47,700
Relative earnings of couples (%)
H makes more 60.0 52.0 65.5 52.3
W makes more 35.1 42.4 28.3 39.3
Same 4.9 5.6 6.2 8.4
Couple work status in the past 12 months (%)
Both worked for pay 78.6 79.1 81.0 72.8 H worked, W didn’t work 12.2 9.7 11.5 12.7 H didn’t work, W worked 6.8 8.0 4.5 9.4
Both did not work 2.4 3.3 3.0 5.0
Region of residence (%)
Northeast 12.4 14.1 16.2 13.3
Midwest 21.7 19.1 26.9 15.0
South 47.8 51.9 37.6 65.5
West 18.1 14.9 19.3 6.2
Note: Whites and blacks include only non-Hispanics.
Source: Pew Research Center analysis of 2008-2010 American Community Surveys (ACS) Integrated Public Use Microdata Sample (IPUMS)
PEW RESEARCH CENTER
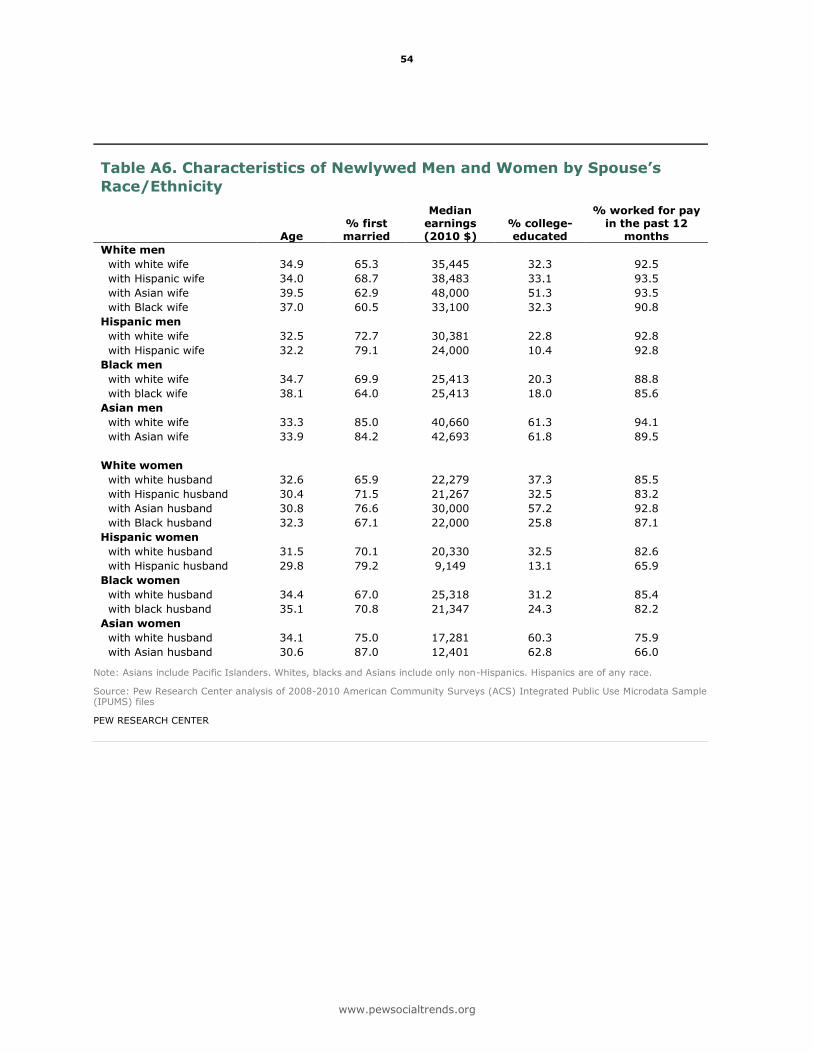
54
www.pewsocialtrends.org
Table A6. Characteristics of Newlywed Men and Women by Spouse’s
Race/Ethnicity
Age % first married
Median earnings (2010 $)
% college-educated
% worked for pay in the past 12
months
White men
with white wife 34.9 65.3 35,445 32.3 92.5
with Hispanic wife 34.0 68.7 38,483 33.1 93.5
with Asian wife 39.5 62.9 48,000 51.3 93.5
with Black wife 37.0 60.5 33,100 32.3 90.8
Hispanic men
with white wife 32.5 72.7 30,381 22.8 92.8
with Hispanic wife 32.2 79.1 24,000 10.4 92.8
Black men
with white wife 34.7 69.9 25,413 20.3 88.8
with black wife 38.1 64.0 25,413 18.0 85.6
Asian men
with white wife 33.3 85.0 40,660 61.3 94.1
with Asian wife 33.9 84.2 42,693 61.8 89.5
White women
with white husband 32.6 65.9 22,279 37.3 85.5
with Hispanic husband 30.4 71.5 21,267 32.5 83.2
with Asian husband 30.8 76.6 30,000 57.2 92.8
with Black husband 32.3 67.1 22,000 25.8 87.1
Hispanic women
with white husband 31.5 70.1 20,330 32.5 82.6
with Hispanic husband 29.8 79.2 9,149 13.1 65.9
Black women
with white husband 34.4 67.0 25,318 31.2 85.4
with black husband 35.1 70.8 21,347 24.3 82.2
Asian women
with white husband 34.1 75.0 17,281 60.3 75.9
with Asian husband 30.6 87.0 12,401 62.8 66.0
Note: Asians include Pacific Islanders. Whites, blacks and Asians include only non-Hispanics. Hispanics are of any race.
Source: Pew Research Center analysis of 2008-2010 American Community Surveys (ACS) Integrated Public Use Microdata Sample (IPUMS) files
PEW RESEARCH CENTER