the rise of the u.s. portland cement industry and the...
TRANSCRIPT
The rise of the U.S. Portland cement industry and the role of public
science.
David Prentice∗†
July 2011
Abstract
American portland cement rose spectacularly during the 1890s from being a niche product to domi-nating a much larger market. The contributions of innovations, factor endowments and public science —factors highlighted as contributing to the more general American industrialization occurring at the sametime — are analysed. The successful commercialization of the rotary kiln, enabled by abundant suppliesof fuel and minerals, played a key role, as did greater demand. Geological surveys, as highlighted byDavid and Wright, assisted in some states, but an econometric entry model does not demonstrate thatthey made a systematic significant contribution to the rise.
Keywords U.S. industrialization; Public science; Portland cement; entry models
JEL Codes: N61, N41.
∗Contact Details: School of Economics. La Trobe University VIC 3086. Australia. [email protected]†Accepted Manuscript. This paper began while visiting UCLA. Additional work was done at Lehigh University and
the author is most appreciative of the hospitality of both universities. The author is also grateful to Naomi Lamoreaux andJean-Laurent Rosenthal whose suggestions got this paper off the ground and gave it direction. The paper has also benefitedfrom comments from anonymous referees, Mary Beth Deily, Lionel Frost, Gary Magee, Simon Ville, Gavin Wright and fromparticipants at seminars at Deakin University, La Trobe University, Lehigh University and the Universities of Melbourne andSydney.
1

1 Introduction
In 1890 the American Portland cement industry supplied just 3% of the 2.3 million barrels of cement
consumed in the United States. By 1913, 99% of the 90 million barrels of cement consumed in the United
States, at nearly a third of the 1890 price, was American Portland cement. To analyze why this spectacular
change occurred it must be first noted that this occurred at the same time as many other American industries
were achieving international success (Wright, 1990). In a highly influential paper, Wright (1990) argues the
widespread industrialisation was based on exploiting abundant mineral resources rather than innovations or
relative labor scarcity highlighted in earlier work (Engerman and Sokoloff, 2000). This abundance resulted
from extensive exploration and rapid development of their resources due to a combination of liberal property
rights and public science in the form of public geological research and extensive university-industry links
(David and Wright, 1997). Portland cement is a minerals intensive industry as it is manufactured by burning
limestone and clay using mineral fuels in large kilns. Hence, is the rise of this industry another example
of a minerals abundant industry rising due to the institutions highlighted by David and Wright or were
innovations and factor scarcity responsible?
First the development of the Portland cement industry between 1870 and 1913 is reviewed using both
aggregate data and a new dataset on plant level entry, exit and other characteristics over this period. Three
sets of explanations for the rise of the industry are analysed: growth in demand due to the diffusion of
reinforced concrete as a building material and increased protection from imports; the successful commer-
cialization of the rotary kiln enabling American firms to produce cheaper high quality cement; and public
geological surveys reducing entry costs by providing information on raw material locations and other assis-
tance to entrants. Largely, to analyse the contribution of the geological surveys, a county-level entry model
is estimated. Entry is modeled as a function of a dummy variable identifying whether information on raw
materials was provided by the geological surveys, controlling for demand determinants, the extent of compe-
tition, availability of fuel oil and other sources of information about raw materials. Identification of a causal
effect requires that whether geological surveys reported cement raw materials is conditionally independent
of whether entry occurred at the county level. This assumption is supported by reference to the existence,
operation and publications of the state geological surveys being determined by state-level factors that vary
2

widely by state and over time, and by the fact that most information on materials was reported before the
entry period. The data does not, though, largely permit identifying the effects of changing demand and cost
conditions over time though.
As claimed in earlier work on the cement industry, such as Anderson (1988), Marchildon (1994) and
Lesley et al. (1924), the commercialization of the rotary kiln appears to be a central factor in the rise of the
American Portland cement industry. Unlike the recent work, it is demonstrated how this was enabled by
relatively cheap fuel oil following discoveries at Lima, Ohio. Furthermore, these claims are supported more
systematically by the substantial fall in the quality-adjusted price of Portland cement, the pattern of diffusion
of the rotary kiln across states and the results of estimating the entry model. Hence, as the successful diffusion
of the rotary kiln was based on cheap fuel oil and, then, coal, the American Portland cement industry does
provide another example an industry rising due to abundant mineral deposits consistent with Wright (1990).
And there are examples of the geological surveys and university-industry links, as highlighted by David and
Wright (1997), contributing to the diffusion of the industry. However, while the estimated entry model for
the boom period of the industry returned a positive relationship between raw materials being identified by
the geological surveys and the likelihood of entry, this relationship was not statistically significant (a p-value
of 20%). Hence it appears that these institutions did not not systematically increase the likelihood of entry
across the states. This could have been because of variation in the quality of information provided by the
surveys across states or that there were other, unobserved, factors affecting whether entrepreneurs chose to
begin cement production in regions identified as containing suitable raw materials, particularly before 1900.
Although this is just one case study, its findings are suggestive that further work is needed to determine
what makes institutions, like public science, effective in some circumstances but less so in others.
In the next section, the rise of the American Portland cement industry is reviewed and analysed. Section
three introduces the model that will be estimated, the data to be used and discusses identification issues.
Section four presents the results of estimating the entry model and section five concludes.
2 The rise of the American Portland cement industry
Cement is the powder which is combined with water to make a mortar and combined with sand and aggregate
to make concrete. It is manufactured by burning a mixture of limestone and clay, or similar materials, in
3

a large kiln. The burnt material, referred to as clinker, is then ground to make cement. The cement plant
is usually built right next to the raw materials within the same county. Hence, it is a mineral-intensive
industry, relying on both minerals for raw materials and mineral fuel for processing. In 1890 there were
three sets of sources of supply of cement to the United States. The largest supplier, 77% of consumption,
was the domestic natural cement manufacturers, who used raw materials found naturally mixed in roughly
the right proportions.1 The second largest supplier, 20% of consumption, were European manufacturers of
portland cement — mainly from England and Germany where Portland cement had been developed and
all technological innovations had been made til then. Manufacturing Portland cement requires combining
raw materials, not naturally mixed, in specific proportions and with more extensive processing than natural
cement. Portland cement was produced in the United States from around 1873 at Coplay in the Lehigh Valley,
Pennsylvania, followed by a few other locations, but Table 1 shows that in 1890 just 3% of the 10 million
barrels of cement consumed in the United States was portland cement manufactured there. Furthermore it
was manufactured using the same type of vertical kilns used in Europe.
However, by 1913 the American Portland cement industry supplied 99% of the 90 million barrels of cement
consumed in the United States. American natural cement and imported Portland cement supplied less than
1%. As discussed in more detail in section 2.3, vertical kilns are almost completely replaced by rotary kilns.
Based on estimates reported in the 1918 Cement chapter, in 1913 the United States was, internationally,
the single largest cement producer with 43% of international production, the next largest being Germany
with 19%.2 The fifth row demonstrates that the price of Portland cement fell by more than a half between
1890 and 1913, with most of the fall occurring by 1902. The real fall is even larger if quality improvements
are taken into account.3 The number of plants in the industry increased between 1890 and 1913 from 14 to
113 and the number of states operated in increased from 7 to 17 to 25.4 Also the average output per plant
increased from 24,000 barrels to 815,000 barrels. Despite its domestic success, as is discussed repeatedly in1All statistics reported in this section are compiled from the chapters on cement found in United States Geological Survey
(USGS) and Bureau of Mines publications (hereafter referred to as Cement chapters).2This lead was temporary. By 1999, the United States produced about only 5% of cement internationally, with China
producing about 35%.3The head of the testing laboratory in Philadelphia in 1898 states “The city is using to-day cement over 50 per cent stronger
than that used during 1892, and a cost of from 50 to 60 cents per barrel less. Nearly every barrel of this material is Americancement” (statement by Richard L. Humphrey in discussion accompanying Lesley (1898).
4Anderson (1999) argues the diffusion was associated with product standardization around 1904, but Table 1 suggestsdiffusion began much earlier. The discussion of Kelley (1923) suggests standardization may have broadened the set of usableraw materials too. See Slaton (2001) for further discussion of specifications in cement and concrete.
4
the Cement chapters from 1904 on, the ninth row demonstrates that cement never becomes a large export
industry. However, American influence on the international industry was greater than that suggested by
the export share. As highlighted in Lathbury & Spackman (1902) the rotary kiln quickly diffused around
the world. This would have removed most of the competitive advantage the American producers had in
exporting. So it was American developed technology rather than American cement that dominated the
world cement industry. This is consistent with the discussion in the 1914 Cement chapter of how German
cement prices had fallen below what American producers could match, suggesting a previous premium (on
German cement) had been lost.
2.1 The U.S. cement industry in 1890
The American cement industry in 1890 primarily produced natural cement as summarized in Table 2. The
two largest centers for natural cement production were around Rosendale, NY, in the Hudson Valley about
100 miles north of New York City, and around Louisville, KY. Though there were a large number of plants
in these regions, each region also contained some very large firms. The output of 450,000 barrels for the sole
plant in Milwaukee illustrates how large natural cement plants could be. Most natural cement plants were
in the manufacturing belt near large urban centers.5 There was also a scattering of smaller plants outside
of the belt also typically near urban centers.
Table 2 demonstrates that the American Portland cement industry was much smaller — total industry
output was less than the largest natural cement plants. Portland cement production was also concentrated,
albeit on a smaller scale, with most coming from five plants around Coplay, PA, in the Lehigh Valley. Various
sources suggest two of these plants were much larger than the other three. Other Portland cement plants
tended to be almost exclusively near urban centers in the manufacturing belt. Looking only at 1890 does not
reflect the multiple attempts to enter production in a wider range of locations during the birth stage of the
Portland cement industry. I estimate attempts at manufacturing Portland cement occurred in 24 different
locations between 1873 and 1890, including three attempts near Rosendale, NY. Many of the early attempts
ceased production within five years of commencing. It is interesting to note that many of the entrants,
confirmed by a search of patents, were associated with individuals who had patented inventions connected5The manufacturing belt in this paper following Meyer (1983) stretches west from New England and the Middle Atlantic
states to Eastern Minnesota, Iowa and Missouri.
5

with the cement industry. While relatively few of the entrants appear to have been directly associated with
natural cement producers, in the Lehigh Valley most of the natural cement would have been produced by
firms also making Portland cement. Though Table 1 suggests that with consumption of all types of cement
growing rapidly across the 1880s, even with the relatively rapid growth in consumption of imported Portland
cement and, to a lesser extent, domestic Portland cement the major changes that were going to occur would
not have been immediately obvious to the industry in 1890. Indeed natural cement firms continued to invest
and new firms entered through the 1890s, with domestic production of natural cement peaking in 1899 at 9.9
million barrels. We now review three sets of explanations about the rise of the American Portland cement
industry — growth in demand, the rotary kiln, and public science.
2.2 Growth in demand for Portland cement
From the 1890s the demand for cement appears to have increased substantially for two reasons. First, demand
was expanding due to the diffusion, primarily from Europe, of the technology required for construction using
reinforced concrete. Skempton (1963) argues that reinforced concrete, though developed in the 1850s, was
not really practical until the 1880s when German Portland cements reached a certain strength. Condit
(1960) documents the increasing range of applications to which concrete, and then reinforced concrete is
applied in the United States from the late 1870s, and particularly from the late 1880s — initially, mainly,
in non-building construction such as dams and bridges. In addition the work of Wermiel (2000) suggests
increasing urban demand for cement from the 1890s with the requirements by various cities that tall buildings
be fireproof. This results in the diffusion of the skeleton frame building, featuring concrete walls around
an iron or steel frame. As well as increasing demand for domestic cement, these developments may have
reduced the supply of cement from Europe. The 1897 Cement chapter refers to greater demand in Europe
reducing exports to the United States.
The second potential factor increasing demand was an increase in protection from international compe-
tition. Protection effectively fell from 1861 to 1890 for as while tariff rates remained constant, transport
costs fell considerably, as documented by Harley (1988). Furthermore Lesley et al. (1924) note that cement
imports came to California, relatively cheaply, as ballast for sailing ships. This trend, though is reversed
during the 1890s. Initially, in 1890 the ad valorem tariff of 20% is replaced by a tariff of 30.4 cents per barrel,
6
which at 1890 prices is a cut to 15%. But as the price of cement falls the equivalent tariff rate rises to over
30% by 1904. Furthermore, over the 1890s, transport costs may have risen. The 1894 Cement chapter notes
an increase in the transport cost of cement to Chicago. The literature on the transition from sail to steam
is suggestive that the use of sail for bulk freights (and therefore the use of solid ballast) ceased by the early
1900s at the latest and, for the Atlantic routes, possibly much earlier (Harley, 1971). Changes in protection,
though, only would have increased the share of American Portland cement, not total consumption of cement
as in Table 1.
However, an increase in demand is unlikely to be the sole explanation for the rise of the American industry
— otherwise prices should have increased or at least remained constant. It is only possible for prices to have
fallen if expansion was accompanied by economies of scale or some technological change.
2.3 The rotary kiln
Contemporary sources and technological histories all identify the successful commercialization and rapid
diffusion of the rotary kiln as the critical development in the rise of the American Portland cement industry
(Anderson, 1999; Lesley et al., 1924; Marchildon, 1994; Stanger and Blount, 1901). Although the rotary
kiln was first patented in England, in 1877, and further improvements made there during the 1880s — most
notably the Ransome kiln in 1885 — it still had not been adopted commercially in England or Europe even
by 1890 (Francis, 1977). There had also been three attempts to use either the Ransome kiln or US developed
rotary kilns by Mathey and Duryee at Oregon City, OR, and around Rosendale, NY, but these had not
been successful either. The first successful application of the Ransome kiln was in 1889, at Coplay, PA,
in the Lehigh Valley, by the Atlas Portland Cement Co (after an unsuccessful attempt near Rosendale).6
Following the adaption in the late 1890s, also at the Atlas Portland Cement Co., of the rotary kiln to replace
the increasingly expensive fuel oil with the much cheaper powdered coal as a fuel, the rotary kiln rapidly
diffused widely as the Atlas Portland Cement Co. was unable to prevent other companies from inventing
around their innovation (Hadley, 1945). The rotary kiln also quickly diffused back to Europe (Francis, 1977;
Lathbury and Spackman, 1902).
The top panel of Table 3 demonstrates the correlation between the diffusion of the rotary kiln and the6The Atlas Portland Cement Co. is the ultimate name of a series of firms with the same principals that operate from 1885
as extensively described in Hadley (1945).
7

expansion of American Portland cement production. The Cement chapters in 1893, 1896 and 1899 report
statistics on production by type of kiln and these demonstrate the rapid growth of cement production using
rotary kilns. In 1893, Portland cement from rotary kilns made up just 25% of 590,000 barrels of cement.
By 1899, cement from rotary kilns made up 66% of 5.7 million barrels of cement. After 1899 almost all new
plants were built with rotary kilns and by 1913 nearly all of the vertical kiln plants had either replaced their
kilns with rotary kilns or else had closed. It is also important to note that the diffusion was not a case of a
few large innovating firms building plants across the United States. Though there were connections between
some early firms these were mainly through promoters setting up new firms and moving on.
Why did the rotary kiln replace the vertical kiln and enable the rapid expansion of the American Portland
cement industry? The main advantage, cited by the Cement chapters in the early 1890s, Lesley et al. (1924)
and later by Anderson (1988), was that it substantially saved on labor — with repeated references to it being
suitable for an economy with cheap coal and expensive labor (like the US) compared with an economy with
cheap labor and expensive coal (Europe). Calculations by Stanger and Blount comparing manufacturing costs
between American rotary plants, American rotary technology using English prices and English technology
suggest that American firms had a cost advantage due to lower fuel costs (Stanger and Blount, 1901). Both
Skempton (1963) and Marchildon (1994) also note, though, that the rotary kiln produced a more uniform
and higher quality Portland cement than the vertical kilns as do Stanger and Blount (1901).
What has not been noted by more recent writers on the development of the cement industry was the
importance of cheap oil to the commercialization of the rotary kiln.7 Stanger and Blount, English engineers
who assisted with the unsuccessful attempts to develop the rotary kiln, when discussing why successful
commercialization of the rotary kiln happened in the United States and not England state:
In this task they were much aided by the fact they could use petroleum — a fuel too dear to be
employed here. The ease with which the temperature of the kiln could be controlled when a jet
of burning petroleum was the source of heat allowed many somewhat crude attempts to reach a
qualified success. (Stanger and Blount, 1901, p. 57)
The sources of this abundant and cheap crude oil were recent discoveries of oil fields at Lima, Ohio,7Though Lesley et al. (1924) does note the initial importance of oil for the early adopters.
8

and Los Angeles, California, where the oil contained impurities that made it unusable for illumination so it
was used for fuel (Williamson, 1963). Oil from Lima was piped east through Pennsylvania and New York
and west to Chicago. Giron, who worked for Atlas, notes that the dependence on using crude oil as a fuel
initially limited the diffusion of the rotary kiln (Giron, 1893, p. 213). In the second panel of Table 3 it is
demonstrated how the diffusion of the industry is consistent with these claims.
The second panel of Table 3 is compiled in two stages. First, the number of plants by state is taken from
the Cement chapters for these years. However, the Cement chapters do not list the specific plants counted
for all states or (except for 1899) the specific number of plants using rotary and vertical kilns. However,
nearly all of the plants that were most likely to have been counted by the USGS, and their technology, can
be identified from trade journals, newspaper articles and the Cement chapters. Hence the table reports the
number of plants in each of the major states using vertical or rotary kilns. In addition, the other states
containing each type of plant are listed.8
Table 3 shows that over the first half of the 1890s there is a general expansion of cement production with
new, usually small, plants mainly in the manufacturing belt. Between 1890 and 1893 only two new rotary
kiln plants open in New Jersey (in the Lehigh Valley) and in Northeastern Ohio. Both of these entrants
appear to have connections to earlier plants that used rotary kilns. By early 1894 both rotary kiln plants
around Syracuse, New York had closed following fires. By 1896, two more rotary kiln plants had entered in
the Lehigh Valley — both with connections to existing plants in the Valley — as well as a plant in Southern
California using the Duryee kiln. It is striking that the two plants outside of the Lehigh Valley are located
in areas close to fuel oil producers. While the operator of the Ohio plant (Spencer Newberry, who was
previously a professor at Cornell who had assisted with one of the Syracuse plants) had family connections
in Ohio, it is striking that the California plant was located outside of Los Angeles instead in the, at that
stage, more populous and urbanised Northern California. It is important to note though that by 1896 there
had been even more entrants using vertical kilns across a wider range of states and the two largest vertical
kiln plants in the Lehigh Valley continued to build more vertical kilns up to 1897. By 1899, more entry had
occurred, mainly in the Lehigh Valley — with most existing plants adding rotary kilns and all new plants8The main uncertainty is with respect to New York and Pennsylvania. However, we are unlikely to be out by more than one
or two plants in our breakdown.
9

using rotary kilns. The 1898 edition of an industry publication “The Minerals Industry” estimates output
for each firm in the Lehigh Valley. Atlas is reported to produce 1 million barrels out of 2.4 million barrels
with the other rotary kiln plants producing and vertical kiln plants producing 700,000 barrels each. Rotary
kiln plants were also added in Michigan, Ohio, Utah and (briefly) North Dakota. At least some entrants used
coal-fired rotary kilns and nearly all of the substantial number of rotary kiln plants reviewed in an industry
directory in 1901 were recorded as using coal-fired kilns (Brown, 1901).
Wright (1990) argues that the rise of American industry was based on abundant minerals rather than
innovations. And the American Portland cement industry provides another example of this. The development
of the industry happened at the same time (the 1890s) as many other American industries were becoming
successful internationally. The development was not based on an American innovation but the successful
commercialization of an English one. The reason the rotary kiln appears to have been commercialized in
the United States rather than Europe is that the US was relatively abundant in fuel oil and coal. David
and Wright (1997) suggest the American ability to develop their mineral resources resulted from three
institutional features of the US economy: liberal property rights on minerals; state and federal geological
surveys, and; an extensive mining education system with close industry links. However, the development of
the rotary kiln does not provide an example of where any of these institutions played a direct critical role
in the rise of the industry. There is no public evidence of connections between the geological surveys or
universities and the Atlas Portland Cement Co. There are a few examples of university professors helping
with new firms.9 But the decentralised development of the industry makes it very difficult to demonstrate
a substantial systematic direct role played by these institutions in industry development.
2.4 Did public science assist the rapid diffusion of the industry?
As noted in the introduction to this section, one of the features of the rise of the American Portland cement
industry was its rapid diffusion across many states without, in many cases, direct technological or corporate
links between entrants. As well as requiring fuel, Portland cement manufacturing requires suitable raw
materials. In this section we argue that geological surveys may have provided information that may have
assisted the industry to rapidly develop once production costs fell, due to the rotary kiln, and demand rose.9For example, Spencer Newberry, from Cornell, helped at Syracuse and then founded a plant in Northern Ohio. Prentice
(2006) reviews more examples.
10

Though modern accounts of the cement industry refer to raw materials being widely available there is
evidence that this was not the perception during the late nineteenth century in the United States. There
appears to be at least some demand for information on raw materials. Statements by cement manufacturers
to the 1883 Tariff Commission refer to claims by importers that Portland cement could not be produced in
the United States because of a lack of chalk (as used in Europe) though the manufacturers also state suitable
raw materials are believed to be widely available. Benjamin Miller also refers to the belief that there was no
chalk, or similar materials, as a reason for the slow development of the industry (Tariff Commission, 1883,
p. 705-708, p. 2275-2280; Miller, 1930). The building of a substantial plant in Yankton, South Dakota,
in 1890, which was at least a hundred miles from (not particularly large) urban areas like Omaha, Denver,
Minneapolis or Des Moines, but had chalk, is also consistent with this hypothesis. Once more plants were
built in states to the east and south like Iowa, Illinois and Missouri, the Yankton plant closed in 1909.
Numerous state geological surveys as well as the United States Geological Survey showed considerable
interest in providing information on the raw materials for cement manufacturing. State geological surveys
repeatedly included information on the location and nature of cement raw materials in their reports. A
search of 30 geological survey reports from 18 states from 1837 to 1878, before the industry developed on
any scale, for references to cement, hydraulic limestone and water-lime10 revealed some reference in 17 of
them (mainly in states in the Mid-Atlantic and Mid-West regions). Five of the reports included results
of chemical tests performed on the materials.11 We also found three examples of states where there were
direct links between geological surveys and entry. In Arkansas and Alabama, it is claimed such research
directly led to firms developing raw materials identified in geological reports.12 The Indiana State Geologist,
W.S. Blatchley, actively searched for raw materials for the industry, with these searches being referred to in
the trade journal, Municipal Engineering.13 In another trade journal, Stone, Blatchley states he discovered
the location of some raw materials used by a new plant.14 John W. Eckert worked on the Pennsylvania
Geological Survey, while a student at Lehigh University, Bethlehem Pa, before working for two of the largest
early Portland cement manufacturers in the Lehigh Valley (Lesley et al., 1924). Professor Lord from Ohio
10Common terms for materials suitable for cement making.11See Prentice (2006) for more details.12Taff (1902), Municipal Engineering, May, 1902, p. 311.13Blatchley (1901), Municipal Engineering, October, 1898, p. 264.14Stone, January, 1902, p. 37-38.
11

State University and Professor Erasmus Haworth from the University of Kansas, both associated with their
state Geological Surveys, were also associated with plants in these states.
While there are no examples of direct involvement of United States Geological Survey (USGS) researchers
in locating materials, the USGS certainly provided extensive general information on materials as well as
guides to other sources of information. From 1882, each USGS annual report includes short reports (which
expanded over time) on different mineral industries, including the cement industry. In addition, the 1882
and 1887 annual reports contain a substantial chapter on “Useful Minerals of the United States”, listing,
by state, locations of resources, including cement rock, water-lime and hydraulic limestone. The Cement
chapters for 1909-1911, 1914, 1916 and 1923, list USGS and state geological survey publications, as well as
other sources, with information on raw materials and the cement industry. These lists include 39 additional
USGS reports from between 1902 and 1913 including two large USGS Bulletins in 1905 and 1913 which
outline at length (including maps and test results) the location and nature of cement raw materials. Finally,
the 1910 Cement chapter extensively discusses cement raw material locations.
All of this information, therefore, had the potential to lower exploration and entry costs for firms enabling
quick entry when the general profitability of cement production rose. However, one can’t immediately
assume that all of this information was useful or new. First, the usefulness of information provided by
geological surveys may have varied over time and across states. During the 1890s, while some states had
recently published analyses of cement raw materials, in other states surveys had not operated since before
the Civil War. The extent of geological knowledge and the quality of geologists would have improved over the
nineteenth century suggesting the quality of research could have also improved. Furthermore, the resources
and expertise of the surveys varied across states. As discussed in Manning (1967) one reason the United
States Geological Survey extended its operations nationally, beyond the territories, was local dissatisfaction
with state surveys.
In addition, even if the research was well done geologically, the reports may have varied in their usefulness
for making commercial decisions about exploration and development. For example, the reports may have
had only limited or very general information on the size of the deposit or if there were problematic impurities
that made manufacture uneconomical. And even if a site did have suitable raw materials if it was not well
12

served by transportation it may still be uneconomic. For example, although the Arkansas Geological Survey
identified suitable raw materials at White Cliffs, and a plant was built in 1897, it proved unprofitable. It
was not until 1929 that successful cement manufacturing occurred in (a nearby county) in Arkansas.
Some of the information also may not have been new. Other industries, such as natural cement, lime
or stone-quarrying may have already discovered the material and its quality so the reports, which regularly
reported on such operations, may have not added new information. Finally, it should be noted that even if
the reports provided information it may not have been welfare improving to do so if the costs of locating the
information exceeded the benefits. Even if we find that the geological surveys had an effect it should not be
immediately concluded that it was economically efficient for them to do so.
3 Model and Data
In this section the economic model of entry used to analyse the questions raised in the previous section is
introduced. Then the data available to estimate this model is reviewed. This is followed by a more specific
discussion of the econometric model, descriptive statistics and identification issues.
3.1 A Model of Entry
At the microeconomic level, a rise of an industry can be analysed as a set of decisions by firms to build plants
and enter the industry. Each potential entrant builds a plant if they expect to earn at least enough profits
to cover any entry costs. A stylised version of this problem used in the entry literature from Bresnahan and
Reiss (1991) on is to specify profit as the product of Variable Profit per unit sold and market size less entry
costs. Hence entry occurs if:
E(Π) = E(Variable profit per unit ∗Market size− Entry costs) > 0 (1)
Variable profit per unit is modeled as a function of demand variables, cost variables and variables capturing
the extent and type of competition facing the plant. These variables include the demand and cost factors
explaining the rise of the Portland cement industry discussed in sections 2.2 and 2.3. Note also though this
discussion suggests that the relationship between some of these variables and expected profitability could
change substantially between 1889 and 1913. Entry costs include the costs of locating and developing raw
13

materials and building a plant. Public science, in the form of the geological surveys, is one of several potential
sources for information on the location and quality of raw materials for cement manufacturing.
Variable profit per unit is also determined by the extent of competition and this varies considerably
across counties and over time. Both theory and previous empirical work suggest a flexible functional form
be allowed for and that either positive or negative effects of competition could arise. Specifically, theory
suggests profitability is likely to be highest if an entrant is a monopolist or duopolist. During the early stages
of the rise of the industry many entrants may have found themselves to be local monopolists or duopolists,
at least temporarily. Theory suggests that margins decline as the number of competitors increase but it is
not obvious this relationship will be linear. Indeed, the approach taken in Bresnahan and Reiss (1991) and
successor papers is to let the data imply how margins vary with firm numbers. They, and other papers, have
found competitive conditions can be obtained with as few as three firms in a market. A further complication
is suggested by the results of Toivanen and Waterson (2005) who found that, for fast food restaurants, entry
in a market could increase the likelihood other firms entered the market. They interpreted this as successful
entry effectively signalled to other firms that local market conditions were profitable for further entry. If
such a result was found for a well-established industry like fast food, such a possiblity could certainly arise
in a market which is rapidly changing technologically and about which there is uncertainty about the supply
and demand side.
Before proceeding, note given a set of determinants of Variable Profit per Unit and Entry costs it is
possible to solve for the size of the market that would set the expected profit equal to zero. This market size
is referred to as the Entry Threshold and will be useful for analysing the effects of combinations of changes.
3.2 Data, Unit of Observation and Period
Though the theoretical model is at the firm level, we begin our defining the unit of observation with the
location at which each plant is built. This suggests that if entry is modeled as a discrete choice, the population
is the set of potential locations at which cement production using locally available raw materials could take
place between 1889 and 1913. While it is not possible to identify all possible sites with raw materials of a
suitable size and quality for cement production, as there have been no major scientific changes in what makes
a site useable for cement production, a good approximation is the set of all sites where cement production
14

occurred using local raw materials between 1889 and 2003. In effect we truncate the sample by not including
sites that have not been developed by 2003 — however it is likely that if a site had not been developed by
2003 it was unlikely to have been considered by 1913. As described in the data appendix we compile a list
of these sites using Cement chapters, industry directories and other sources. Though it is likely all locations
have been identified, for a small number of plants it was possible to only determine the entry or exit dates
within a few years or in a few cases, which decade the plant operated.
However, for the econometric analysis we define a location at the county level rather than site level. The
main reason for this is that we are primarily interested in estimating if public science reduced entry costs
and the variable used to capture publically provided information is defined at the county level. For the few
counties with multiple entrants, it also enables avoiding problems if the exact date or even order of entrants
within a county is uncertain. Furthermore, as it is analysed if entry by some firm takes place, rather than
entry by a specific firm, the analysis can be performed using county or market level variables rather than
firm specific variables (which there is only partial data on). Hence the dependent variable used is:
Entry ={
1 if at least one entry in the county occurs0 otherwise (2)
The second issue to be addressed is the period over which entry is measured. We focus on two periods —
1889-1899 and 1900-1913 — for three reasons. First, by considering two periods potential problems with
errors in entry dates are reduced. Secondly, as noted earlier, there are substantial changes between 1889 and
1913 in demand and cost conditions. Thirdly, it appears that the size of land purchased by entrants may
have increased compared in the later period compared with earlier entrants. The sample period commences
at 1889 as this was the first year the rotary kiln was successfully commercialized and breaks again at 1900 as
this is when the coal-fired rotary kiln becomes the technological standard. From around 1900 entry occurs
in a broader set of states than previously. Likelihood ratio tests for a reduced form probit support breaking
the sample period as a specification for a single period is always rejected when compared with an alternative
two period specification. We do not econometrically analyse the period before 1889 as the small number of
entrants and the pattern of entry suggests firm specific factors dominated.
15

3.3 Descriptive Statistics on the Data
In this subsection we report summary statistics for the dependent variable, Entry, the variable controlling
for information provided by the geological surveys, rmh, and the other control variables.
3.3.1 Entry Data
Table 4 summarizes entry in the American Portland cement industry for three periods — from 1870 to 1888,
1889-1899 and 1900 to 1913. Because cement can only be produced where raw materials in sufficient quantity
and quality exist, we report in column one, by census region, the number of counties in which Portland cement
has been produced at any time between 1870 and 2003.15 Then, in the second, third and fourth columns, we
report the number of counties in each region where there was at least one entrant between 1870 and 1888,
1889 and 1899 and from 1900 to 1913. For example, between 1870 and 1888, there was at least one entrant
in seven counties in the Mid-Atlantic states (NY, PA and NJ). First, we note that between 1870 and 1888,
before the successful commercialization of the rotary kiln, entry occurred in only 15 counties, this increased
somewhat to 23 counties during the 1890s, and then exploded to 78 out of 174 counties between 1900 and
1913. Furthermore, whereas most entry before 1900 occurred in the manufacturing belt from 1900 extensive
entry occurred right across the United States.
3.3.2 Information on cement raw materials provided by the geological surveys
To summarize the information provided by the state and US geological surveys, we draw on two reports by
the USGS in 1887 and 1905. In 1887, the USGS published a (very large) guide to “Useful Minerals of the
United States”. This summarized for each state and territory information on mineral deposits (both worked
and not being worked). The entries usually referred to specific counties or districts. Though the authors
state it is incomplete, and that it draws on non-geological survey sources, because it was published by the
USGS, it is potentially available nationally and is the best source available to us to capture the information
known before 1890. For 1887 we record all references to counties with cement raw materials, non-magnesian
limestone or marl where each deposit was subsequently used. For example, if a county is identified as having
limestone but only marl is used, this suggests that the geological survey information was not directly useful15We omit a few locations where cement production took place with materials shipped in from out of the county or even
state.
16
so the county is not recorded as having had its raw materials identified. For the second period, we use the
1905 USGS Bulletin on the location of Portland cement materials (Eckel, 1905). This publication has the
advantage of focussing specifically on materials for cement manufacture rather than being a general review.
For some states it provides county or district specific reports whereas for other states it may also provide
maps of the states illustrating the counties and the type of raw materials in there (if any). Even though it is
published in 1905, inspection of the sources used for each state revealed that about three quarters primarily
used sources from 1900 or earlier. Of the remaining eight states, most sources were closer to 1900 than 1905.
For both periods, in each county for which Portland cement manufacture had already occurred, we set rmh
equal to zero to reduce mixing information from geological surveys with specific information that could be
obtained from other sources.
In Table 5 we summarize information about the state geological surveys and the information contained on
cement raw materials for each region. The first column demonstrates that the state geological surveys began
earliest in the Atlantic and manufacturing belt states with the Mountain states being last of all. However,
although the number of years operated differed substantially across the Census regions. For the median
county state geological surveys operated almost continuously in the Mid Atlantic states of New York, New
Jersey and Pennsylvania. After them were the North and South East Central states from Illinois to Ohio and
Alabama to Mississippi, and Pacific (California). In the South Atlantic and Western Central States state
geological surveys typically operated for less than ten years before 1887. Examining the third column, it
seems for most states that about 30 to 50 per cent of counties with suitable raw materials had been identified
by 1887. By 1905, we see that for most regions that the geological surveys had continued to be active, the
median increasing for all except the Mid-Atlantic and Mountain states. The share of counties identified as
having cement raw materials had also increased. The two exceptions to this are the Mid-Atlantic and Pacific
states. In the Mid-Atlantic, this reflects that Portland cement production had actually begun in many of
the counties by 1900 and in the Pacific it reflects that there had been little exploratory work in Washington
or Oregon by 1900 so the shares for both periods largely reflect California. For all other regions we see
substantial increases in the share of counties though.
17
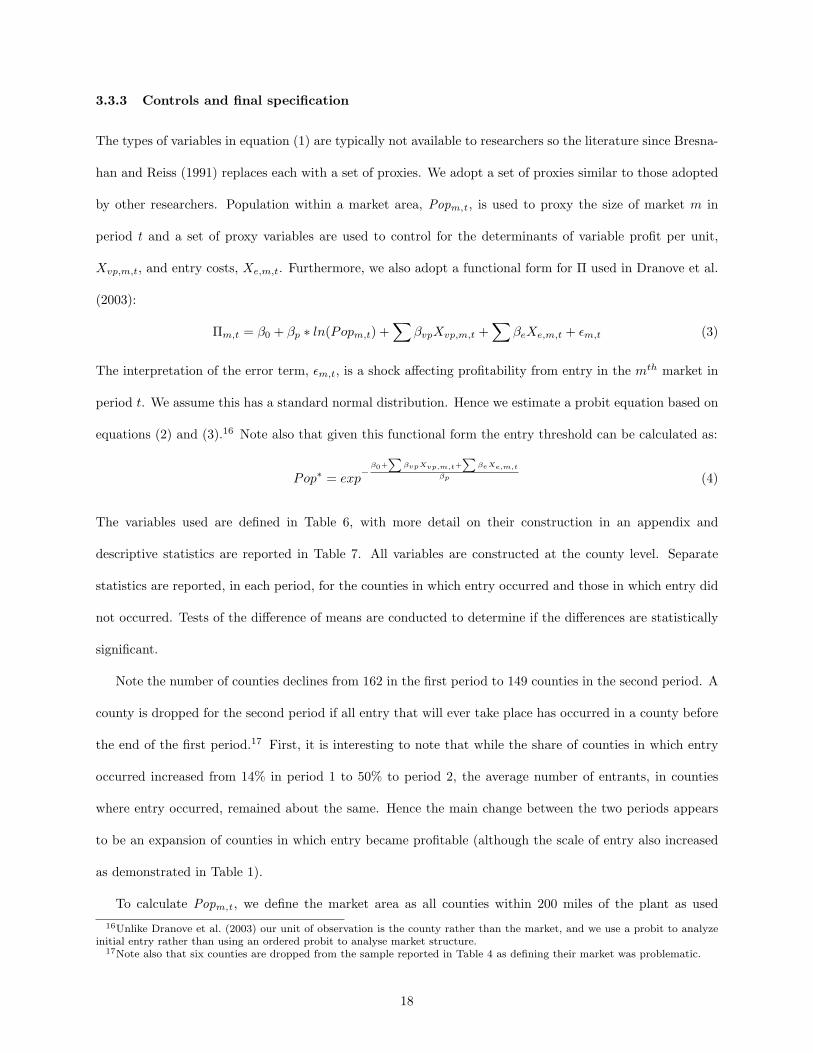
3.3.3 Controls and final specification
The types of variables in equation (1) are typically not available to researchers so the literature since Bresna-
han and Reiss (1991) replaces each with a set of proxies. We adopt a set of proxies similar to those adopted
by other researchers. Population within a market area, Popm,t , is used to proxy the size of market m in
period t and a set of proxy variables are used to control for the determinants of variable profit per unit,
Xvp,m,t, and entry costs, Xe,m,t. Furthermore, we also adopt a functional form for Π used in Dranove et al.
(2003):
Πm,t = β0 + βp ∗ ln(Popm,t) +∑
βvpXvp,m,t +∑
βeXe,m,t + εm,t (3)
The interpretation of the error term, εm,t, is a shock affecting profitability from entry in the mth market in
period t. We assume this has a standard normal distribution. Hence we estimate a probit equation based on
equations (2) and (3).16 Note also that given this functional form the entry threshold can be calculated as:
Pop∗ = exp−
β0+∑
βvpXvp,m,t+∑
βeXe,m,t
βp (4)
The variables used are defined in Table 6, with more detail on their construction in an appendix and
descriptive statistics are reported in Table 7. All variables are constructed at the county level. Separate
statistics are reported, in each period, for the counties in which entry occurred and those in which entry did
not occurred. Tests of the difference of means are conducted to determine if the differences are statistically
significant.
Note the number of counties declines from 162 in the first period to 149 counties in the second period. A
county is dropped for the second period if all entry that will ever take place has occurred in a county before
the end of the first period.17 First, it is interesting to note that while the share of counties in which entry
occurred increased from 14% in period 1 to 50% to period 2, the average number of entrants, in counties
where entry occurred, remained about the same. Hence the main change between the two periods appears
to be an expansion of counties in which entry became profitable (although the scale of entry also increased
as demonstrated in Table 1).
To calculate Popm,t , we define the market area as all counties within 200 miles of the plant as used
16Unlike Dranove et al. (2003) our unit of observation is the county rather than the market, and we use a probit to analyzeinitial entry rather than using an ordered probit to analyse market structure.
17Note also that six counties are dropped from the sample reported in Table 4 as defining their market was problematic.
18

in Rosenbaum and Sukharomana (2001) and other recent work on the cement industry. By the end of the
period this is probably about right as Lesley (1911) describes how Portland cement firms went from supplying
national markets to regional markets. In the early period, as described in the 1896 Cement chapter, some
firms in Pennsylvania, New York and Ohio supplied larger markets but others supplied only local markets. In
practice, as much of the population during this period is concentrated in the northeast, alternative definitions
of market size would probably yield similar relative outcomes to using 200 miles. Table 7 demonstrates that
the average market increased from 5.2 during 1889-1899 to 6.2 million people between 1900 and 1913. In
both periods, on average, markets in which entry occurred tended to be about 2 to 3 million people larger
and this difference was statistically significant at a 5% level.
The first set of variables included in Xvp,m,t control for differences in per-capita demand. We include
measures of the share of the population within the market area living in urban areas, urbshr, and population
growth of the market area, popgrwth as regions that are urbanized or rapidly growing are expected to have
greater demand for concrete and cement for pavements, sewers and buildings. Indeed, on average, countries
with entry were, on average, at least 10 percentage points more urbanized, with the difference statistically
significant in both periods at a 1% level. Population growth tended to be similar on average though. This
data suggests that, even apart from technological change in construction, demand was potentially increasing
for cement as markets became larger and more urbanized.
The only variable included in Xvp,m,t to control for cost differences is oil and while a greater share of
countries where entry occurred in the first period were near the Lima, Ohio and Los Angeles, California oil
fields, the difference across the two groups is not statistically significant.
The third set of variables included in Xvp,m,t control for differences in competition. Note that if entry
occurs, these variables are compiled as at the year entry occurred. If entry does not occur, then these
variables are calculated as at the last year of each period. The motivation for using the last year of each
period is that as demand is increasing over 1889 to 1913 and technology is improving, within each period
potential profitability is likely to be greatest in each period’s final year (1899 and 1913). Between 1889 and
1899 just over a third of potential entrants would have either one or zero Portland cement plants within 400
miles. Hence we include dummy variables for these cases to control for the greater profitability of entering
19
into a monopoly, pcmon, or duopoly market, pcone. A greater share of counties, where entry occurred,
resulted in a monopoly, than would have been the case where entry did not occur, though the difference
was not statistically significant. However, a statistically significantly greater share of markets where entry
did not occur would have resulted in a duopoly compared with where entry did occur. This latter result
is consistent with the prospect of competition deterring entry. In both periods there is no statistically
significant difference in the average number of competitors producing Portland cement faced by entrants and
non-entrants, pc400. We also consider potential competition from firms producing natural cement, nc400, and
from imported cement,import. In both periods, entrants faced competition from a statistically significantly
greater number of natural cement producing firms.18 Similarly (though not statistically significant) a greater
share of counties where entry occurred faced potential competition from imports. Examining the median
number of competitors suggests looking at averages may distort the perceived effect of competition as the
differences in medians is much greater than difference of means.
We also included a set of controls for Xe,m,t — specifically variables to control for information from non-
geological survey sources that firms may find useful in choosing locations thereby also lowering entry costs.
We include dummies for if there has previously been a Portland cement manufacturer in the county, prpc,
and if there is or has been natural cement production in the county without Portland cement production,
prnc. These variables, though, will also capture lagged effects of other causes, such as earlier geological
research. Table 7 demonstrates that in the first period, that it is more likely for counties with entry to have
one of these conditions hold than counties with no entry, and the difference was significantly positive for
previous Portland and natural cement production. In the second period, only previous Portland cement is
significantly greater. The number of years since 1780 that a county has been settled, agectye, is included to
control for other activities, like lime production or quarrying that might also reveal information about raw
materials — but this is never significantly different across the two groups.18It is important to note that the locations of the natural cement plants did not occur as a result of geological survey results.
Rather most large producing districts were associated with materials discovered in building canals. This point, which was earliermade by Cummings (1898), Lesley et al. (1924) and Hahn and Kemp (1994) is described in more detail in Prentice (2006).
20

3.4 Identification
With the available data the separate contributions of the rotary kiln and greater demand can only be
estimated to a very limited extent. Demand is particularly problematic as the relationship between our
observables and the demand for cement is likely to be changing over time. In the first period, because
distance to fuel oil is likely to be highly correlated with the price and availability of the fuel, and the location
of fuel oil is determined by nature, it is possible to get some estimate of the effect of adopting the rotary
kiln. However, in the second period, all entrants would have similar incentives to adopt the rotary kiln and
it is not possible to identify the effect from entry decisions alone.
However, it may be possible to identify a causal effect of the geological surveys on entry at the county level
as it can be argued that whether information was provided on raw materials was independent, conditional
on demand, cost and competitive conditions, on whether entry occurred or not. This condition would not
be satisfied if the state or US geological surveys tested and reported on counties for reasons correlated with
the entry decision but not captured by the controls.
The main general reason in support of this claim is that while locating materials for making cement
was of interest to the geological surveys, it was not the sole purpose for locating and testing raw materials
suitable for cement manufacture. Limestone has multiple uses including for lime-making and in steel making.
Discussion of limestone for cement manufacturing was often in included in general summaries of county
resources, general discussions of the use of limestone or just one of many minerals discussed in the typically
large reports. Similarly, whether a geological survey operated or not was not dependent on the attractiveness
of cement at the county (or even state level). The histories of all the state geological surveys included in
Socolow (1988) reveal wide variations in how they operated depending on local political and economic
conditions. Some surveys, such as New York, operated continuously, whereas others started and stopped
repeatedly and even had trouble publishing their research at all. The second reason in support of this claim
is that for both periods, the vast majority of reports are provided before or at the start of each period,
reducing the likelihood of correlation with subsequent shocks during the period. This is reinforced by setting
equal to zero any observations in which Portland cement was previously manufactured in a county.
However, we also need to consider if there are other institutions that might have affected the spatial
21

development of the industry. One complementary institution to those identified in David and Wright,
mentioned in Wright (1990), is that a transportation network is required before resources can be developed.
Meyer (1989) argues the development of the railroad network plays an important role in the industrialization
of the Midwest. Calculations from U.S. Department of Interior (1883, 1895) suggest total US railroad mileage
constructed doubles between 1870 and 1880 and almost doubles again between 1880 and 1890. In addition
Puffert (2000) argues the importance of, during this period, the railroad network adopting a standard gauge.
Contemporary accounts suggest access to transport could be important for the development of the cement
industry. Eckel (1905) in discussing the determinants of the value of raw materials, suggests that a plant
should be located near at least two transportation routes. Supporting this is the experience of two plants.
Distance from a railroad was cited in Burkenroad (1979) as one of the factors contributing to the failure of
an early Portland cement works near San Diego. The opening of a plant at Kingsport, Tennessee, is linked
directly to the building of a railroad through the area (Cement and Engineering News, 1916, January, p.
21). Hence, we include the growth in railroad mileage over the previous decade, rrdgr, as a control.
4 Econometric evidence
The results from estimating the entry model for both periods are reported in Table 8. Before discussing
the results in more detail it is worthwhile noting two general features. First, that the entry model seems
to perform much better for the second period, between 1900 and 1913, than for the earlier period, between
1889 and 1899. This suggests that in the earlier period firm specific characteristics might have been more
important in determining whether (and where) entry occurred rather than market level characteristics. Once
the industry was well established, with a standard low-cost technology, firm specific characteristics became
less important. If a market was profitable someone entered. The second feature of the results is that in
neither case was the growth of the state railroad system statistically significant so we can focus on the
contributions of demand, costs, competition and public science.
The first potential explanation of the rise of the Portland cement industry was that demand was increas-
ing. The results are consistent with this. The coefficient on market size is positive in both periods and is
smaller (and significant) in the later period. Surprisingly the urbanisation share variables are not signifi-
cant in either period. Given that, entry only increase with urbanisation around the larger urbanised areas
22

(around 38% in the first period (which is primarily New York City, Chicago and San Francisco), and around
32% in the second period which includes much of the manufacturing belt). Population growth increases the
likelihood of entry but significantly so only in the second period.
While we cannot directly test the effect of introducing the rotary kiln, the sign on the dummy for being
near fuel oil in the first period is positive and it is substantial and significantly different from zero. This is
consistent with the rotary kiln increasing the profitability of entry and the use of the kiln being constrained
in the first period until they were enabled to be fired with powdered coal.
Competition has substantial and significant effects on entry in both period. In the first period, the
prospect of being a monopolist has a large and significant effect on entry. As expected the effect of being
a duopolist has a smaller effect, though it is not statistically significant. Examining the coefficients on the
number of Portland cement firms within 400 miles, in the first period, outside of the manufacturing belt the
likelihood of entry increases with the number of competitors in the same way highlighted by Toivanen and
Waterson (2005). In the manufacturing belt, where there were more firms, competition reduces the likelihood
of entry as expected. In the second period, the competitive effects of entry outweigh any signalling effects
except for the densest part of the manufacturing belt with 121 of the 149 counties being to the left of
the turning point. In the first period, the number of natural cement producers within 400 miles may be
controlling for demand differences, as the counties to the right of the turning point tend to be around the
Rosendale and Louisville regions. In other parts of the U.S., increased numbers of natural cement plants has
the expected negative effect. In the second period the effects are reversed with 122 of the 149 counties to
the left of the turning point and so increased numbers of natural cement plants increases the likelihood of
entry except for near Rosendale.
Turning now to the proxies affecting entry costs, we fail to find a significant positive effect on entry of
the geological surveys reporting raw materials. In the first period, having raw materials reported had a
significantly negative effect on the likelihood of entry. This may be because although areas with materials
were known, entry was unprofitable due to other economic factors not captured in our model (such as quality
problems). In the later period the effect is positive but the coefficient has a p-value of just 20%. This could
be that the value of the information could have varied across states due to the quality of the geological
23

survey or that there were other important, but unobservable, factors that were more important barriers to
entry than information on raw materials. For example, complementary institutions like testing laboratories
or experts at local universities may have also been required for geological information to make entry more
likely. In the first period it is previous natural cement production that has a significantly positive effect on
entry, whereas in the second period it is previous Portland cement production. The insignificant effect of
previous Portland cement in the first period is probably not surprising given the poor profitability of the
early entrants. Finally, except for regions in the west (mainly Oklahoma and Texas) age of county has a
negative effect on the likelihood of entry as nearly all counties are to the right of the turning point. This
suggests that previous activity does not so much reveal raw materials as produce other activities that deter
entry — perhaps not surprising for an industry requiring large quarries. In addition, we also examine the
predicted entry thresholds in Table 9. In the first panel, for each county, for each period, the predicted entry
thresholds are compared with the actual market sizes. In the second panel, for each period, whether entry
occurred is matched up to whether the market size population exceeded the predicted entry threshold or not.
In the first panel, for the period after 1899, the entry thresholds are fairly similar to the actual populations
suggesting our model performs fairly well. Before 1900 a substantial proportion of the estimated thresholds
are implausibly high. Nevertheless, the second panel of Table 7 shows that in 18 out of 23 cases where
entry occurred, population exceeded the estimated entry threshold. The entry thresholds for each county
were compared across the two periods and for 132 out of the 149 counties the entry threshold was lower in
the second period. These results suggest that there was a general improvement in conditions for entry into
the Portland cement industry after 1899. Because we use proxies, we cannot determine whether this was
due primarily to lower entry costs, lower production costs or greater demand. Contributions by institutions
whose impacts are less geographically specific, such as greater training of engineers with experience in testing
(such as described in Slaton (2001)) may also contribute to this.
5 Conclusion
Between 1870 and 1913 the American Portland cement industry rose to dominate cement production, replac-
ing the natural cement industry that provided cement since the Erie Canal, and driving out imports from
the previous technological leaders in England and Germany. Cement consumption increased enormously
24

while the quality adjusted price fell substantially. The critical development in this rise was the successful
commercialization, in the United States, of the English invented rotary kiln. This paper provides more sys-
tematic evidence to support this claim made repeatedly since this period. Furthermore, additional evidence
is provided to demonstrate that this commercialization resulted from the development of fuel oil around, pri-
marily, Lima, OH. The results are also consistent with increased demand, due to innovation in construction
and demand for fireproof building also encouraging the general expansion of the industry. Hence, this paper
provides another example of an industry that achieved industrial success in a minerals abundant economy, as
argued more generally in Wright (1990). However, the origins of the abundance of raw materials could not
be linked beyond a few specific cases to the institutions suggested by David and Wright (1997). An entry
model was specified and estimated, including a control for information on raw materials provided by the
geological surveys, along with controls for demand determinants, cost differences and competition. However,
the coefficient on this control was never statistically significantly greater than zero (reaching only a p-value
of 20). Although this is just one case study, it does suggest further analysis is required for understanding
the conditions under which public science assisted industrialization during the late nineteenth century in the
United States.
Appendix: Construction of the Dataset
Plant Sites: The primary set of data used is the identities, operating dates and raw materials used by the
323 Portland cement plants operating in the continental US between 1870 and 2003. For each year between
1890 and 2003, the Cement chapter reports the number of Portland and natural cement plants operating
in each state, or group of states. The identity of the plants operating is determined using: accompanying
lists of plants for certain years, state reports published by the Bureau of Mines from 1952, and other
sources including state geological surveys, company annual reports, industry directories, newspapers and
trade journals. For our analysis we exclude plants not using raw materials located at the kiln site, plants
producing the specialty product white cement, a few sites in which all entry occurred before 1889 and six
sites for which it was difficult to describe their potential market due to their being on the water. More
information is provided on entry dates for natural and Portland cement in Table A.
Cement: Annual natural, Portland and puzzolan (a speciality cement) cement production from 1880-1924
25

and by decade from 1818-1829 to 1870-1879 is reported in the 1924 Cement chapter. The estimates from
1890 on are based on surveys conducted by the US Geological Survey, with earlier estimates made by
chapter authors. Consumption is equal to imports plus domestic production less exports. We follow the
contemporary practice of adding barrels unadjusted for differences in barrel sizes (which range considerably
from 240 pounds to 400 pounds) in the absence of detailed price data enabling weighting of what were
considerably differentiated products.
Market Size: Locational coordinates for the towns where the plants were located are collected from the
National Atlas of the United States and the US Gazetteer online. For the counties, coordinates for central
points, based on 2000 boundaries are collected from the Census 2000 Gazetteer of Locations of Counties. For
counties that did not exist in 2000, coordinates for counties that matched according to maps by Thorndale and
Dollarhide (1987). Indian Reservations in Oklahoma and South Dakota and Independent Cities in Virginia
are similarly treated. Bureau of the Census states that out of 3192 counties and Indian reservations, 2583
have had no significant change from 1880. The remaining 609 counties is an upper bound on the number
of problem counties, as mislocation of the centre of the county is only a problem if the county is on the
boundary of a market area.
We construct market size as the sum of the populations in all counties within 200 miles (U.S. Bureau
of the Census, 1996). A radius of 200 miles is used because the Census of Transportation in 1977, which is
the only comprehensive data on market sizes available, suggests most cement shipments take place within
this distance. This distance has been used in other studies including that of Rosenbaum and Sukharomana
(2001) and studies cited therein.
Urbanization: We define an area within a county as urbanized if it is a town or city and if its population is at
least 8000. We compiled all such towns from each Census of Population and calculated the urban population
for each county. The ratio of urban population to total population is used to calculate the urbanization rate.
Railroad Growth: We obtain railroad mileage by state from the Statistical Abstract of the United States.
State mileage is allocated by county using county population shares. Finally, we aggregate the estimated
mileage for all counties within 200 miles of the plant. The estimated growth rate is the exponential growth
rate over the previous decade.
26

Import: A county is defined to face import competition if on the coast, the Great Lakes, on or near the
inland river system up to Kansas City, St. Louis, Cincinatti, Columbus or Indianapolis (as indicated by
contemporary reports) or next to a customs district county on the coast, river or lake systems.
Oil: Two oil fields are identified as producing fuel oil: Los Angeles and Lima (which includes counties in
Ohio and Indiana). Counties were identified from Williamson (1963) and Oil chapters in USGS reports.
Geological Surveys: The main source for the starting dates and periods of operations for the geological
surveys is a valuable history of all the state geological surveys by Socolow (1988).
References
Anderson, Philip Calvin II, (1988), “On the Nature of Technological Progress and Industrial Dynamics”,
Doctoral Dissertation, Columbia University.
Anderson, Philip, 1999. “Collective Interpretation and Collective Action in Population-Level Learning: Tech-
nology Choice in the American Cement Industry.” Advances in Strategic Management 16, 277-307.
Blatchley, W.S., 1901. Twenty-Fifth Annual Report of the Indiana Department of Geology and Natural
Resources. Indiana Department of Geology and Natural Resources, Indianapolis.
Bresnahan, Timothy F. and Peter C. Reiss, 1991. “Entry and Competition in Concentrated Markets.” Journal
of Political Economy 99(5), 977-1009.
Brown, Charles Caroll, 1901, 1904, 1906, 1909. Directory of American Cement Industries and Handbook for
Cement Users. Municipal Engineering Co., New York NY.
Burkenroad, David, 1979. “Jamul Cement: Speculation in the San Diego Hinterland.” The Journal of San
Diego History 25(4), 273-286.
Condit, Carl W., 1960. American Building Art: The Nineteenth Century. Oxford University Press, New
York.
Cummings, Uriah, 1898. American Cements. Rogers & Manson, Boston MA.
David, Paul and Gavin Wright, 1997. “Increasing Returns and the Genesis of American Resource Abun-
dance.” Industrial and Corporate Change 6(2), 203-45.
27

Dranove, David, Anne Gron and Michael J. Mazzeo, 2003. “Differentation and Competition in HMO Mar-
kets.” Journal of Industrial Economics 51(4), 433-54.
Eckel, Edwin C., 1905. “Cement Materials and Industry of the United States.”, United States Geological
Survey Bulletin No. 243, Government Printing Office, Washington DC.
Engerman, Stanley L. and Kenneth L. Sokoloff, 2000. “Technology and Industrialization, 1790-1914.” In:
Engerman, Stanley L., Gallman, Robert E. (Eds.), The Cambridge Economic History of the United States,
Volume II. Cambridge University Press, Cambridge U.K., 367-401.
Francis, A. J., 1977. The Cement Industry 1796 - 1914: A History. David & Charles Ltd, Devon.
Giron, Pierre, 1893. “The Burning of Portland Cement.” Proceedings of the Engineers’ Club of Philadelphia
10(3), 197-213.
Hadley, Earl J., 1945. The Magic Powder: History of the Universal Atlas Cement Company and the Cement
Industry. Putnam, New York.
Hahn, Thomas F. and Emory L. Kemp, 1994. Cement Mills Along the Potomac River. Institute for the
History of Technology & Industrial Archaelogy Monograph Series 2(1). West Virginia Institute for the
History of Technology & Industrial Archaelogy, Morgantown WV.
Harley, C. Knick, 1971. “The shift from sailing ships to steamships, 1850-1890: a study in technological
change and its diffusion.” In: McCloskey, Donald N. (Ed.), Essays on a Mature Economy: Britan after
1840. Methuen & Co, London, 215-238.
Harley, C. Knick, 1988. “Ocean Freight Rates and Productivity, 1740-1913: The Primacy of Mechanical
Invention Reaffirmed.” Journal of Economic History 48(4), 851-76.
Kelley, Frederick W. (1923) “The Development of Standardization”, Cement and Engineering News, 35(6),
(1923, June), 38 - 39.
Lathbury & Spackman, 1902. American Engineering Practice in the Construction of Rotary Portland Cement
Plants. G.M.S. Armstrong, Philadelphia PA.
28
Lesley, Robert W, 1898. “History of the Portland Cement Industry in the United States.” Journal of the
Franklin Institute 146(5), 324-36.
Lesley, Robert W, 1911. “Cement.” In “The Mineral Industry during 1911”, Engineering and Mining Journal,
New York, 118-123.
Lesley, Robert W., John B. Lober and George S. Bartlett, 1924. History of the Portland Cement Industry
in the United States. International Trade Press, Chicago.
Manning, Thomas G., 1967. Government in Science: the U.S. Geological Survey, 1867-1894. University of
Kentucky Press, Lexington, KY.
Marchildon, Gregory P., 1994 “Portland Cement: Product and Process Upheaval during the Second In-
dustrial Revolution.” Revised version of a paper delivered at the Society for the History of Technology
Conference, 17 October, 1993.
Meyer, David R, 1983. “Emergence of the American manufacturing belt: an interpretation ” Journal of
Historical Geography, 9(2), 145-174.
Meyer, David R, 1989. “Midwestern Industrialization and the American Manufacturing Belt in the Nine-
teenth Century.” Journal of Economic History 49(4), 921-937.
Miller, Benjamin L., 1930. “The Contribution of David O. Saylor to Early History of the Portland Cement
Industry in America.” Pennsylvania German Society, Easton PA.
Prentice, David, 2006. “A re-examination of the origins of American industrial success”, La Trobe University
School of Economics and Finance Working Paper 2006.02, March 2006.
Puffert, Douglas J., 2000. “ The Standardization of Track Gauge on North American Railways, 1830-1890.”
Journal of Economic History 60(4), 933-960.
Rosenbaum, David I. and Supachat Sukharomana, 2001. “Oligopolistic Pricing over the Deterministic Mar-
ket Demand Cycle: Some Evidence from the US Portland Cement Industry.” International Journal of
Industrial Organization 19(6), 863-84.
29

Skempton, A.W., 1963. “Portland Cements, 1843-1887.” Transactions of the Newcomen Society 35 (1962-
1963), 117-51. Reprinted in Newby, Frank (Ed.), Early Reinforced Concrete. Studies in the History of Civil
Engineering, vol. 11. Ashgate Publishing, Aldershot UK.
Slaton, Amy E., 2001. Reinforced Concrete and the Modernization of American Building. John Hopkins
University Press, Baltimore MD.
Socolow, Arthur A. (Ed.), 1988, The State Geological Surveys A History. Association of American State
Geologists, Grand Forks ND.
Stanger, William H. and Bertram Blount, 1901. “The Rotatory Process of Cement Manufacture.” Minutes
of the Proceedings of the Institution of Civil Engineers 145, 44-72.
Taff, Joseph A., 1902. “The chalk of Southwestern Arkansas, with notes on its adaptability to the manufac-
ture of hydraulic cement.” Twenty-Second Annual Report of the United States Geological Survey to the
Secretary of the Interior, 1900-1901, Part III. GPO, Washington DC, 687-742.
Tariff Commission, 1883. Report of the Tariff Commission. GPO, Washington DC.
Toivanen, Otto and Michael Waterson, 2005. “Market structure and entry: where’s the beef?” RAND Journal
of Economics 36(3), 680-99.
Thorndale, William and William Dollarhide, 1987. Map Guide to the U.S. Federal Censuses, 1790-1920.
Genealogical Publishing Company, Baltimore MD.
United States Bureau of the Census, 1996. Population of the States and Counties of the United States: 1790
to 1990. GPO, Washington DC.
United States Department of the Interior, 1883. Report on the Agencies of Transportation in the United
States. GPO, Washington DC.
United States Department of the Interior, 1895. Report on Transportation Business in the United States at
the 11th Census 1890. GPO, Washington DC.
30

Wermiel, Sara, 2000. The Fireproof Building: Technology and Public Safety in the Nineteenth-Century
American City. John Hopkins University Press, Baltimore MD.
Williamson, Harold, 1963. The American Petroleum Industry. Northwestern University Press, Evanston IL.
Wright, Gavin, 1990. “The Origins of American Industrial Success, 1879-1940.” American Economic Review
80(4), 651-68.
Table 1Development of the U.S. Portland Cement Industry
1880 1890 1902 1913Cement consumption (millions of barrels) 2.26 9.72 27.38 90.07Share of cement consumption (%):- U.S. Portland cement 1.86 3.45 61.70 98.96- U.S. Natural cement 89.87 76.58 29.38 0.83- Imported cement 8.27 19.97 7.17 0.1Price of Portland cement (real) 11 8.43 4.86 3.34Number of Portland cement plants 9 14 65 113Number of States with Portland cement plants 7 5 17 25Average Portland cement plant output (millions of barrels) n.a. 0.024 0.265 0.815Exports of Portland cement (millions of barrels)1 n.a. 0 0.34 2.96Note: 1: Exports in 1891 used for 1890. Exports unavailable for 1880, 1890.
Source: Calculated from statistics in USGS Cement Chapters except for Number of Portland cement
plants and Number of States with Portland cement plants in 1880 which is the author’s estimate based
on sources in the Appendix.
Table 2Cement Industry in 1890
Region Number of Plants Production1
Natural cementUnited States 63 7,308,734Ulster County NY (Rosendale) 17 2,683,579Jefferson County KY, Clark County IN (Louisville) 11 1,533,579Buffalo and Akron, NY 4 765,734Lehigh Valley (Lehigh, Northampton counties) PA 6 555,000Milwaukee WI 1 450,000Onondaga County NY 8 281,086Other plants in GA, IL, KS, MN, MO, NM, NY, OH, TX, VA, WV.Portland cementUnited States 14 335,500Lehigh and Lawrence Counties PA 6 221,000Buffalo and Onondaga County NY 4 65,000Other plants in CO, IN, OH2
Note: 1. Production quantity is number of barrels (different sizes for Portland and natural cement).
Note: 2. Two small Portland cement plants in South Dakota and Texas are not included in Newberry’s estimates.
Source: All production statistics and plant numbers are Spencer Newberry’s estimates
reported in the 1889-1890 Cement chapter.
31

Table 3Diffusion of the Rotary Kiln
1890 1893 1896 1899Production1 0.34 0.59 1.54 5.65Production by kiln typeRotary Kiln n.a. 0.15 0.63 3.71Vertical Kiln n.a. 0.44 0.91 1.94Share by kiln typeRotary Kiln n.a. 25% 41% 66%Vertical Kiln n.a. 75% 59% 34%Number of Plants 14 19 26 36Number of Plants with Vertical Kilns by locationPA&NJ 5 5 5 1NY 2 3 7 7Other 4 6 8 8- States CO,IN,OH CO,IN,OH,SD IL,IN,MI,OH MI,SD,AR,NM
TX SD,TX NM,OHNumber of Plants with Rotary Kilns by locationPA& NJ 1 2 4 10NY 2 2 0 0Other 0 1 2 10-States OH OH,CA MI,ND,CA,OH,UTNote: 1. All quantities in millions of barrels.
Source: Production statistics from Cement Chapters. Plant numbers author’s estimate.
Table 4Entry by County by Period
Census Total Number of Counties with EntrantsRegion Counties1 1870- 1889- 1900-
1888 1899 1913North East 1 1 0 0Mid Atlantic 23 7 10 12East North Central 34 3 6 19West North Central 20 0 2 11South Atlantic 20 0 0 7East South Central 14 0 0 6West South Central 20 1 1 6Mountain 22 1 2 6Pacific 20 2 2 11Total 15 23 78Total 174 168 155Note: First column is the total number of counties within which Portland cement was produced with
local materials at some point between 1870 and 2005. The remaining columns report the number of
counties within which entry occurred during each period.
Source: Author’s estimate. See Table A in Appendix for information by state.
32

Table 5Knowledge of Raw Materials
1887 1905Census Median Median Share of Median Share ofRegion Year GS Year GS counties with Year GS counties with
Commenced1 Operated raw materials Operated raw materialsNorthEast
1836 5 0 22 0
Mid At-lantic
1836 52 0.43 51 0.24
EastNorthCentral
1837 21 0.49 35 0.69
WestNorthCentral
1864 2 0.45 20.5 0.67
SouthAtlantic
1835 9 0.35 18 0.51
EastSouthCentral
1843 25 0.43 43 0.79
WestSouthCentral
1858 9 0.05 21 0.63
Mountain 1919 0 0.29 0 0.47Pacific 1853 27 0.47 45 0.5Note: 1. First column median year State Geological Survey commenced in each region.
Second (fourth) columns median years State Geological Surveys operated by 1887 (1905).
Third (fifth) columns shares of counties stated having raw materials for cement in 1887 (1905).
Source: Author’s estimate. Starting dates by state in Table A of Appendix.
33

Table 6Definitions of the Variables
Variable DescriptionEntry Dummy variable = 1 if at least one entrant during the periodMarket Size and Variable Profit per UnitPop1 Population within market area at census date nearest the end of the period.urbshr2 Ratio of urban population to population in market area.3
popgrwth Growth in population in market area over the previous decade.import Dummy variable equals 1 if county located on border (including Great
Lakes) or on river system accessible by importspc4002 Number of firms producing Portland cement operating within 400 milesnc4002 Number of plants producing natural cement operating within 400 milespcmon Dummy variable equals 1 if no Portland cement production occurring
within 400 miles (Period One only)pcone Dummy variable equals 1 if one Portland cement manufacturer
within 400 miles (Period One only)oil Dummy variable equals 1 if county or a neighboring county produces
fuel oil (Period One only)Entry Costsrmh Dummy variable equals 1 if a USGS publication identified raw materials
subsequently used (and no previous Portland cement production)prpc Dummy variable equals 1 if Portland cement production occurred in the
county before the current entrant.prnc Dummy variable equals 1 if Natural cement production, and no Portland
cement production occurred in the county before the current entrantagectye2 Number of years the county (or its predecessor) settled since 1780Otherrrdgr Growth in the estimated railroad mileage in market area over previous decade.Note: 1. Logged version of this variable is used in estimation.
Note: 2. Squared versions of these variables are used in estimation.
Note: 3. Market area is within 200 miles of plant.
Source: See Appendix for details of calculations.
34
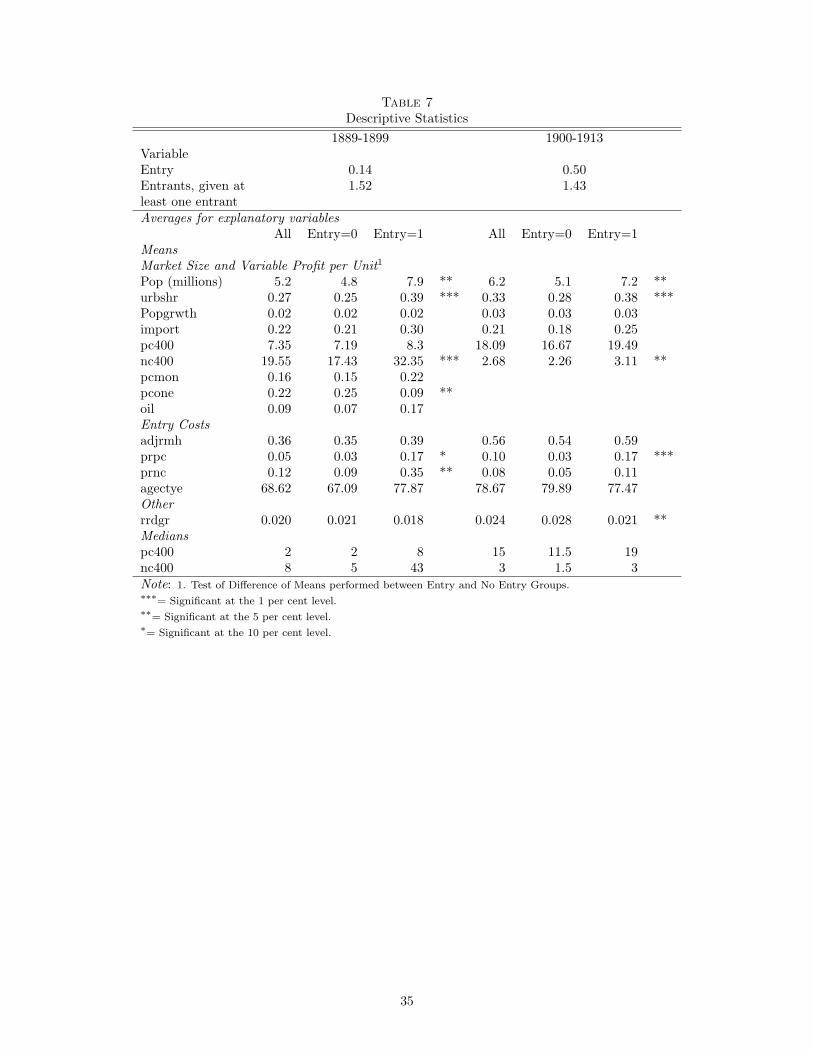
Table 7Descriptive Statistics
1889-1899 1900-1913VariableEntry 0.14 0.50Entrants, given at 1.52 1.43least one entrantAverages for explanatory variables
All Entry=0 Entry=1 All Entry=0 Entry=1MeansMarket Size and Variable Profit per Unit1
Pop (millions) 5.2 4.8 7.9 ** 6.2 5.1 7.2 **urbshr 0.27 0.25 0.39 *** 0.33 0.28 0.38 ***Popgrwth 0.02 0.02 0.02 0.03 0.03 0.03import 0.22 0.21 0.30 0.21 0.18 0.25pc400 7.35 7.19 8.3 18.09 16.67 19.49nc400 19.55 17.43 32.35 *** 2.68 2.26 3.11 **pcmon 0.16 0.15 0.22pcone 0.22 0.25 0.09 **oil 0.09 0.07 0.17Entry Costsadjrmh 0.36 0.35 0.39 0.56 0.54 0.59prpc 0.05 0.03 0.17 * 0.10 0.03 0.17 ***prnc 0.12 0.09 0.35 ** 0.08 0.05 0.11agectye 68.62 67.09 77.87 78.67 79.89 77.47Otherrrdgr 0.020 0.021 0.018 0.024 0.028 0.021 **Medianspc400 2 2 8 15 11.5 19nc400 8 5 43 3 1.5 3Note: 1. Test of Difference of Means performed between Entry and No Entry Groups.∗∗∗= Significant at the 1 per cent level.∗∗= Significant at the 5 per cent level.∗= Significant at the 10 per cent level.
35

Table 8Entry Model
Variables 1889-1899 1900-1913Dependant Entry EntryExplanatory Coefficients Standard Coefficients Standard
Errors Errorsconstant -6.46 ∗∗ 3.04 -1.11 1.10Market Size and Variable Profit per Unitlnpop 1.04 0.66 0.60 ∗∗ 0.28urbshr -7.68 6.91 3.63 4.01urbshrsq 10.22 10.23 -5.61 5.33popgrwth 32.87 46.54 47.28 ∗∗ 21.64import 0.37 0.66 0.41 0.33pc400 0.94 ∗∗ 0.44 -0.16 ∗∗∗ 0.06pc400sq -0.06 ∗∗∗ 0.02 0.002 ∗∗ 0.001nc400 -0.17 ∗ 0.09 1.09 ∗∗∗ 0.37nc400sq 0.008 ∗∗∗ 0.002 -0.10 ∗∗ 0.04pcmon 4.88 ∗∗ 2.14pcone 2.73 1.71oil 2.20 ∗∗ 0.97Entry Costsrmh -1.87 ∗∗ 0.90 0.35 0.27prpc 0.79 1.13 1.46 ∗∗∗ 0.57prnc 3.66 ∗∗∗ 1.30 0.67 0.47agectye 0.07 0.05 0.01 0.02agectyesq -0.001 ∗∗ 0.0005 -0.0002 ∗ 0.0001Otherrrdgr -0.82 43.79 -28.25 19.57sample 162 149Log likelihood -21.08 -73.28∗∗∗= Significant at the 1 per cent level.∗∗= Significant at the 5 per cent level.∗= Significant at the 10 per cent level.
Table 9Entry Thresholds
1889-1899 1900-1913First Median Third First Median Third
Quartile Quartile Quartile QuartileCounties in which entry occurredPopulation 2.46 9.09 10.12 1.85 6.19 10.78Thresholds 0.09 0.35 3.61 0.56 1.59 5.06Counties in which no entry occurredPopulation 0.73 3.93 7.88 0.83 3.83 6.71Thresholds 10.91 60.18 391.69 2.02 7.65 25.57
1889-1899 1900-1913Entry No Entry Entry No Entry
Population > Threshold 18 0 61 18Population < Threshold 5 139 14 56
36

Table AStatistics on the Geological Surveys and Cement Industry by State
State1 Year CountiesTotal Entered
State State First Entrant: 1873- 1889- 1900--hood Geological Natural Portland 1888 1899 1913
Survey Cement CementStarted
North EastMaine 1820 1836 n.a. 1879 1 1 0 0Mid AtlanticNew Jersey 1787 1835 Pre-1850 1892 1 0 1 1New York 1788 1836 1818 1875 14 5 6 6Pennsylvania 1787 1836 1826 1873 8 2 3 5East North CentralIndiana 1816 1837 1832 1877 7 1 1 4Illinois 1818 1851 1838 1893 2 0 1 2Michigan 1837 1837 1866 1876 14 1 1 10Ohio 1803 1837 1846 1884 11 1 3 3West North CentralIowa 1846 1855 Pre-1884 1908 3 0 0 1Kansas 1861 1864 1868 1900 6 0 0 6Missouri 1821 1853 Pre-1874 1902 6 0 0 4Nebraska 1867 1899 1873 1914 2 0 0 0North Dakota 1889 1895 1901 1899 1 0 1 n.a.South Dakota 1889 1893 n.a. 1890 2 0 1 0South AtlanticFlorida 1845 1907 1898 1927 5 0 0 0Georgia 1788 1876 1850 1902 3 0 0 2Maryland 1788 1834 1829 1908 3 0 0 2North Carolina 1789 1823 n.a. 1963 1 0 0 0South Carolina 1788 1825 Pre-1860 1948 2 0 0 0Virginia 1788 1835 1848 1900 3 0 0 2West Virginia2 1863 1835 1829 1903 3 0 0 1East South CentralAlabama 1819 1848 n.a. 1902 4 0 0 3Kentucky 1792 1838 1829 1905 1 0 0 1Mississippi 1817 1850 n.a. 1952 3 0 0 0Tennessee 1796 1831 1861 1908 6 0 0 2West South CentralArkansas 1836 1857 n.a. 1897 3 0 1 0Oklahoma 1907 1908 n.a. 1908 5 0 0 2Texas 1845 1858 1880 1880 12 1 0 4MountainArizona3 1912 1888 n.a. 1905 4 0 0 2Colorado 1876 1907 1882 1882 4 1 0 1Idaho 1890 1919 n.a. 1929 2 0 0 0Montana 1889 1919 n.a. 1910 3 0 0 1Nevada 1864 1866 n.a. 1941 2 0 0 0New Mexico 1912 1927 1884 1899 2 0 1 0Utah 1896 1931 1891 1891 4 0 1 2Wyoming 1890 1881 n.a. 1929 1 0 0 0PacificCalifornia 1850 1853 1860 1880 13 1 2 7Oregon n.a. 1859 1911 1888 2 1 0 0Washington 1889 1890 1869 1905 5 0 0 4Note: 1. Portland cement produced in Louisiana, Minnesota and Wisconsin using out-of-state raw materials.
Note: 2. West Virginia first surveyed as part of Virginia. First state survey was 1897.
Note: 3. First plant in Arizona was public. First private plant began operations in 1913.
Source: See Appendix for details.
37