the risk capital market in scotland - scottish enterprise · stage risk capital market in scotland...
TRANSCRIPT

The Risk Capital Market in Scotland
Annual Report 2017

2
Introduction The purpose of this report is to provide a detailed and comprehensive analysis of the early stage risk capital market in Scotland for the calendar year 2017. The report is one of a series dating back to 2003, which is intended to improve the understanding of the scale and characteristics of the early stage risk capital market in Scotland. To consider recent trends this report focuses on the growth in deals and investment levels from 2012, the year when deals over £10m started appearing in the Scottish market. The number of deals in 2017 was 2.5 times the number in 2012 and the amount of investment increased by 3.8 times. Average annual growth has been 20% in terms of the number of deals, and 31% in terms of the amount invested since 2012. This rapid increase in investment has been across all deal size bands; investment continues to be spread across a range of sectors, and there were more investors of different types in 2017 than in 2012. Investment remains focused on central belt regions (East and West taking almost half of the total in 2017), but increasing investment in innovative companies in the oil & gas sector has led Aberdeen to change the balance this year, taking a further third of the total. High value ‘megadeals’ (those over £10 million for the purposes of this report) remain infrequent but were virtually absent at the start of this period; in 2012, there was just one deal at this level, and in 2015 two megadeals accounted for over half the total investment in the year, making the year itself an outlier from the rest of the series. In 2017, with six deals over £10 million, we can see that there is a trend towards higher value deals, but without investments in the lower bands decreasing. Comparisons with other regions can be misleading. London is the magnet for risk capital investment in the UK, and together with the adjacent ‘golden triangle’ regions accounts for approximately 80% of total amounts invested. There are many more deals in the south east of England than in the rest of the UK by an order of magnitude, and many more larger deals above £10m. This imbalance, and the comparisons between other regions of the UK and the Republic of Ireland, are described in detail in the separate 2017 Investment Benchmarking Analysis report that helps to set Scotland’s risk market performance in this wider context1. The conditions present in London, such as the population size, cannot be replicated in Scotland, and it is essential to view the risk capital market in Scotland in its own terms rather than being overly reliant on comparisons with London or other hubs such as Boston, or San Francisco. However, it remains helpful to conduct comparative work to understand trends and issues such as changing investor preferences, that can potentially influence market trends in Scotland.
1 Investment Benchmarking Analysis 2017, Scottish Investment Bank (2018)

3
Table of contents
Introduction Table of Contents 3 Highlights 4 Background 5 Approach 6 1. Report Findings 7 1.1 Investment trends 7 1.2 Investment by size band 7
2. Investors 11 2.1 Business Angel Groups, Individuals and Crowdfunding 14 2.2 Venture capital and institutional investors 17 2.3 Corporate venturing 18
3. Companies 19 3.1 Location of investee companies 19 3.2 Market sectors 20 3.3 New and follow-on investments 21 3.4 Investment in start-ups 22 3.5 Time to investment 23 3.6 Spinouts 24 3.7 Exits 25
4. Conclusions 28 Reflections on the market 28 Issues arising 28
Appendix 1: Glossary of terms 33 Appendix 2: Methodology 34 Appendix 3: List of Investors by Type 36 Appendix 4: Authors 38

4
Highlights 2017 SAW NEW RECORDS IN INVESTMENT The investment trend for all deals of £10m and under - that points to the underlying health of Scotland’s risk capital market - was double that just five years ago in 2012. The overall level of investment for 2017 reached a new high, with the number of deals exceeding 2016’s ten-year high. MEGADEALS ABOUNDED There were six deals over £10m, compared with just 14 in aggregate over the previous five years. THERE WAS INCREASED ACTIVITY IN LARGER DEALS With 28 deals between £2m and £10m, compared to the previous high of 26 (2016), and taking this increase together with the megadeals indicates that more investors are entering this end of the market. THIS WAS NOT AT THE EXPENSE OF LOWER VALUE INVESTMENTS The number of deals under £100k increased by 57% from 2016 to 2017 (but as these deals were each of relatively low value compared with the set of larger deals, they do not make a significant difference to overall investment levels). BUSINESS ANGEL INVESTMENT REMAINED HIGH Angels raised substantial rounds – 15 of the 76 deals in which angel groups participated were for over £1 million; this increasing level of investment is a relatively new feature of the market for business angel investment. PATTERNS OF INSTITUTIONAL INVESTMENT HAVE VARIED Investment totals by VCs, corporates and other institutional investors are particularly subject to variation from year to year, affected by the number of megadeals. 2017 saw large increases from 2016 in the number of deals and the total value of investment by these institutional investors. MOST INSTITUTIONAL INVESTORS BACKING SCOTTISH COMPANIES ARE UK BASED There was an increase in UK based corporate investors since 2016, from 5 to 12 (VCs and others remained the same). There were approximately the same number of overseas investors as in 2016, with equal numbers of VC and corporate investors. Many of these investors participated in a single deal. THE EAST OF SCOTLAND CONTINUED TO SECURE MOST FUNDING With a revival of investment in oil & gas companies (and BrewDog’s Equity for Punks campaigns), Aberdeen is starting to rebalance the regions, taking 37% of total investment. Deal numbers in both the East and West of Scotland increased significantly; these two regions accounted for almost half of all investment in 2017 (East 39%, West 15%). EXITS REMAIN FEW AND FAR BETWEEN There was a decline in trade sales from the 13 in the 2016 report to just 6 in 2017. It is difficult to perceive trends, but there was also a sizeable reduction in the number of exits across the UK. The INFORMATION AND COMMUNICATIONS TECHNOLOGY (ICT) SECTOR REMAINS THE FOCUS WITH GREATEST NUMBER OF DEALS With 143 deals (38% of the total), ICT once again remained the focus for investors. With a lack of large deal sizes, ICT was only the fourth largest sector for level of investment (£79.9m). Life Sciences led the way with £169.7m invested, followed by the emergence of Food and Drink (£135.6m) that was largely due to two megadeals, and the re-emergence of the Energy sector (£105.8m), helped by the renewed interest in oil and gas propositions. FIRST TIME INVESTMENTS CONTINUE TO COMPRISE A LARGE PART OF THE MARKET First time investments in new companies (as opposed to follow-on rounds) accounted for 42% of all deals in 2017, a level which has remained consistent (36% plus or minus 6%) for the past six years. The influence on the total amount invested was less, with new companies securing 27% of total investment, up from 2016 (20%).

5
Background
Access to a strong supply of early stage risk equity capital is important for national and regional economies due to the catalytic role that it plays in the entrepreneurial process. UK and Scottish Government policy recognises that the market does not always enable SMEs to grow rapidly because of the imbalance between demand from entrepreneurs and the available supply of funding from investors. Early stage investment is inherently risky, and different types of investor have different motivations and external influences affect their willingness and ability to invest. Sometimes investment patterns are affected by favoured sectors, which can make it more difficult for companies in other market sectors to raise funds. This makes it important to track changes in the market, so that gaps in support can be identified and solutions developed. Scottish Enterprise commissions research to identify the investment activity of all participants and to estimate the total flow of risk capital investment into Scottish companies. This includes investigating the characteristics of the industry’s key players and beneficiary companies, the scale of the annual flow of new investment, and establishing whether there is evidence of gaps in the supply of risk capital. From this analysis, alongside independent evaluations, SE can better understand the impact on the market of its early stage equity investment funds to check if these interventions remain ‘fit for purpose’, if any changes are required and how best to optimise economic impact.

6
Approach This report seeks to cover only equity investments by independent (to the company) third party investors, omitting where possible non-independent investors (such as founders, friends and family) prior to the first round in which independent investors participate. While the data series started in 2003, this report will focus on more recent trends from 2012 (referred to as the reporting period). This report aims to capture investments of all sizes in the market, whereas the separate report (Investment Benchmarking Analysis1), which tracks investment across the UK and in the Republic of Ireland, omits deals below the £100k threshold. As far as possible, the data shows the actual flows of equity funds into companies rather than so-called ‘headline’ investments, which are the figures presented in press releases and other statements by investors and investees, and quote the total equity commitment (which is usually invested in tranches after the investee reaches agreed milestones and therefore might not be invested). These headline announcements often include non-equity finance such as bank facilities and grant awards. Where regular independent investors such as angel groups make a relatively small early investment in a company in the form of a convertible loan, this is included in the figures in this report in the same way as equity investments. Such loans are not structured with a fixed repayment schedule, but are usually set up to be converted to equity at a relatively early stage rather than repaid. As these investments have been included at the time of the loan, there is no further increase to the figures in this report at the time of conversion. Please note that due to rounding, some totals in the tables throughout this report may not correspond with the sum of the separate figures. Full details of the methodology adopted are given in Appendix 2.

7
1. Report findings 1.1 Investment trends 2017 saw a new record year in risk capital investment in Scottish companies. Figure 1 shows the trend in deal numbers, investment totals, and underlying investment (defined as below £10m) from 2012 to 2017. Last year we reported that the number of investment deals was the highest by some distance over the five years from 2012; in 2017, the number of deals increased by a further 30%, from 285 to 371. The total investment was also the highest over the same period, having increased by 60% over the previous year – from £336m to £538m - but unlike 2015 this was not simply because of a high level of ‘megadeals’ over £10 million. In recent years, the overall investment totals have been greatly influenced by outlier ‘megadeals’ (deals over £10 million for the purposes of this report), and the underlying investment trends, excluding these megadeals, is shown as a separate line. The underlying investment level reached £255m, an increase of 35% from the 2016 level (£189m) which itself was a new high.
Figure 1: Trends 2012-2017 - numbers and £m
1.2 Investments by size band In this section, we analyse investments by the number of deals and the total amount raised, in five separate bands as shown below in Figure 2.

8
Figure 2: Number of deals, and investment amounts £m, by size bands 2012-2017
There were just two deals over £10m in Scotland in 2016 – and just 14 in the five years from
2012 – so this year’s tally of six represents a significant advance. Figure 3, below provides a
list of these deals.
Deals in the next band down, from above £5m to £10m, saw the largest increases in 2017, up
by 333% in number and 437% in value, aided by three deals in this band at exactly £10m
(included in Figure 3). This band is again characterised by one-off investments by corporate
investors (together with one BGF investment, and another BrewDog Equity for Punks
crowdfunding campaign). The £5.2m investment in TV Squared by West Coast Capital, the
private investment vehicle set up by Sir Tom Hunter and his family in 2001, is the largest deal
in 2017 by business angels. While deals above £5m have seen substantial increases, the same is not true of the next band
down, from £2m to £5m, which saw deal numbers and investment at levels similar to 2012. The £100k to £2m band includes more than half the deals in 2017 (57%), but due to the
influence of higher value deals, just 21% of overall investment. Investment at this level is less
volatile than in the higher bands, where individual deals have a significant impact. Deal
numbers and amounts invested in this band were at record levels in 2017 for the past six
years, having increased by 18% in number and 21% in value from 2016, when there were 179
deals and £94m invested. Deals under £100k also reached a record level when compared with the past five years, and
increasing by more than half (57%) from 2016 to 2017, and by 19% in value. New and follow
on investments into companies (across all investment bands and stages of growth) is
considered further in section 3.3.

9
Figure 3: Investment deals of £10 million and over, 2017
Looking in more detail at the larger investments, these included Edinburgh-based pharmaceutical company NuCana listing on the NASDAQ exchange in the USA in September 2017, raising US$114 million (£85m) to support clinical trials and valuing the business at $463 million, with existing investors contributing to the IPO by acquiring new shares. Although brewery and pub chain BrewDog and remotely operated subsea vehicle firm ROVOP are examples of well established companies which are generating substantial revenue, Exscientia and Roslin Technologies are from the opposite end of the revenue generating spectrum – technology ventures (significantly both in the life sciences sector) which have convinced specialist investors of their potential. In each of these deals there was a single investor, or a single event with many investors, in the case of NuCana’s IPO and BrewDog’s Crowdcube campaign. BGF, with Scottish offices in Edinburgh and Aberdeen, features twice in the table above, and is one of the funds specialising in investing in companies which are already generating revenue, to help them scale up rapidly. Balmoral and Evotec are corporate investors, investing in companies which align with their own corporate strategies, and L Catterton is a US venture capital firm which specialises in investing in consumer brands; each of these cannot be regarded as regular investors in the Scottish market. The influence of these higher value deals in the market can be visualised in the following chart, which shows every investment over £2m from 2012 to 2017 against a logarithmic scale.

10
Figure 4: Deals over £2m 2012-2017
The chart shows three deals over £50m in 2017 (BrewDog, NuCana, and ROVOP, listed in Figure 3 above), which accounted for 45% of the total investment in the year. The Skyscanner investment of £128m in 2016 (38% of the market total) was the only deal that year over £50m. 2015 had two deals over £50m (FanDuel £176m and TauRx £88m), comprising 56% of the market. There were no deals at this level in the years 2012-2014. The spread of deals reflects the overall increase in deals sizes over the period from 2012 and the influence of a very few large deals on the total investment. In conclusion, the analysis of the market by size of deals indicates that the lower levels, the main province of business angel groups and early stage institutional investors, is continuing at a healthy rate, and higher value deals (over £5m) are more prevalent than they have been in previous years. The underlying market, that plots deals £10m and below (Figure 1), is a good measure of the health of the investment market as it avoids the skewing effects of the megadeals. This underlying market has grown to £255m for 2017, an increase of 35% on the previous year and a doubling in size from 2012.

11
2. Investors who is investing in Scottish companies?
There are several different types of investor active in the early stage capital market in Scotland. The first point to be made is that this is the higher risk end of the market; the investee companies often require funding well before they can demonstrate market acceptance and generate revenue. This is usually because they still need to prove that their technology works, either by means of prototyping or clinical trials, or other forms of preparation before being able to market a fully developed product or service. From the investor’s point of view, this means that a proportion of their investments will fail, and they must invest in a portfolio of companies to spread the risk. It also means that they must focus on companies with very high potential to return a large multiple of the funds invested, to generate returns which cancel out losses to give an ROI (return on investment) better than other asset classes such as investments in quoted companies, property, or commodities. The descriptions below and categories shown in Figure 5, demonstrates the range of different investor types active in the Scottish market.
Business angel groups Angels investing in young companies as members of groups in a deal under the same terms and conditions. There are over 20 angel groups operating in Scotland, well known examples being Archangel Investors, Par Equity Syndicate, and Equity Gap. These groups typically have a gatekeeper to filter applications for investment before selected proposals are put to the full group, and can have anything from a handful of 3 or more investors, to the more established groups which have up to 120 investors. Group members do not necessarily invest in every deal, but all usually take advantage of the tax breaks available from the EIS (Enterprise Investment Scheme) or SEIS (Seed Enterprise Investment Scheme). This entails certain restrictions, such as the obligation to invest in ordinary shares, without the protections offered by the preferential share structures usually required by venture capital and other institutional investors.
Individual angels (including High Net Worth Individuals)
In the UK, a High Net Worth Individual (HNWI) is an individual who has self-certified that: they had, during the financial year immediately preceding the date in question, an annual income to the value of £100,000 or more; or they held, throughout the financial year immediately preceding the date in question, net assets to the value of £250,000 or more. For the purposes of this report, we are not distinguishing between HNWI and other individual investors.
Crowdfunding Under this model, companies publicise their funding targets on a crowdfunding platform (the most active in the UK being CrowdCube and Seedrs), with a set closing date; campaigns which fail to achieve their target secure no funding, although campaigns which surpass their targets have the option of closing early, or extending to secure additional funds. Many investors in crowdfunding campaigns require the deals to be EIS or SEIS

12
compliant to justify the risk. Platforms vary considerably in the way they are set up and managed and they continue to evolve. VC firms Invest from funds raised from LLPs (limited liability partners) such as pension funds or insurance firms, which have large cash balances which they need to spread across many different asset classes. Such funds typically have a ten-year life, during which the VC fund manager aims to invest during the first five years, then ‘harvest’ returns by way of IPOs or trade sales during the remaining five years. There are few indigenous VC firms in Scotland – Scottish Equity Partners (SEP), Epidarex, and Pentech are examples - but YCF’s research has identified 40-50 VCs which have invested in Scottish companies over the past five years2.
Private equity companies Similar to VCs (the terminology is imprecise, with many commentators using the terms venture capital and private equity indeterminately), but focusing on investing in later stage companies which are already generating revenue, and pushing them towards a rapid exit (IPO or trade sale); examples in Scotland include Lloyds Development Capital (LDC) and Nevis Capital.
Corporates
Often investing through a specially established corporate venture fund, but sometimes investing from the corporate’s own balance sheet.
Other private This heading also covers investors who have been identified as co-investing in deals with other types of investor (angels, VCs, public) where we have no further information about the investor, and/or no breakdown of the amount contributed. This includes investors such as university funds, family offices and pension funds but in many cases the identities of these investors are undisclosed. Public This heading largely covers Scottish Enterprise’s co-investment funds delivered by their investment arm (Scottish Investment Bank), but also includes small investments by other parties such as Nesta.
IPO We have included a separate heading of IPO (Initial Public Offering) to cover the NuCana listing mentioned in section 1.2 above.
Appendix 4 lists all the investors known to have participated in equity funding rounds with Scottish companies in 2017. The first observation prompted by this list is that it includes a wide range of different investor types, and many different organisations from a variety of backgrounds. The angel groups listed tend to make regular investments in Scottish companies, and by co-investing with others can raise larger investment rounds. In Scotland, this bedrock of investment in emerging companies, largely knowledge or technology based,
2 www.ycfguide.com

13
has become a consistent part of the investment landscape. The same consistent level of early stage investment is by no means common in other regions of the UK, as evidenced by the data presented in the Investment Benchmarking Analysis 2017 Annual Report3. Although angel groups form the foundation of investment in the market, and can often work together to raise large rounds, the most ambitious companies need more investment than they can provide, and this is where institutional investors come in, able to raise large initial rounds and to follow their money with further rounds to take their investees to full commercialisation. At this level, there are VC and other investors backing companies which are relatively well-established and have achieved consistent revenue streams. Few institutional investors are regular backers of companies in Scotland, taking instead a company by company viewpoint and judging each business against international competition. The most common pattern is one of investing in one-off deals which makes it difficult to discern trends or patterns. The following figure traces the number and amounts of funding invested by different types of investors over the past six years. The total number of investor deals allows for the many situations where there is more than a single investor in a deal and hence the total number of deals shown here for 2017 (547) exceeds the 371 total deals recorded for the year.
Figure 5: Deal numbers (count of investor participation) and amounts invested £m, 2012-2017 by investor type
3 Op cit
20
12
20
13
20
14
20
15
20
16
20
17
20
12
20
13
20
14
20
15
20
16
20
17
type of investor
Angel Groups 75 70 86 72 80 119 £15.2 £14.0 £19.8 £20.5 £21.0 £27.0
Individual angels 25 22 45 64 133 140 £2.2 £2.1 £5.7 £15.5 £40.3 £28.9
Crow dfunding 0 0 5 13 6 13 £0.0 £0.0 £5.6 £7.5 £30.1 £19.0
VCs 43 39 68 62 61 91 £96.3 £155.9 £167.8 £388.8 £196.3 £317.0
Other private 48 55 51 36 37 62 £6.9 £22.4 £16.0 £8.5 £9.7 £26.9
Public 99 103 166 151 137 121 £20.6 £21.0 £49.1 £30.7 £38.3 £33.7
IPO 0 0 0 0 0 1 £0.0 £0.0 £0.0 £0.0 £0.0 £85.1
290 289 421 398 454 547 £141.2 £215.4 £264.0 £471.5 £335.7 £537.6
number of deals amount in £ millions

14
2.1 Business Angel Groups, Individuals and Crowdfunding This section looks at individual investors, whether investing alone, in groups, or on crowdfunding platforms. Figure 6 below shows the amounts invested by these three different types of investor from 2012 to 2017.
Figure 6: Investment breakdown for angel groups, individuals (including High Net Worth Individuals, and crowdfunding, 2012-2017, £ millions
In 2017, investments by these three investor categories comprised half the market in terms of deal numbers, but as these investors typically operate at the lower value end of the investment spectrum, they provided only 14% of the funding. - Business Angel Groups The investment by angel groups continued to grow, at a considerably higher level in the past four years than in the first two years of this survey, and showing a moderate increase in 2017. An important aspect of the market in Scotland is the role of Scottish Enterprise’s Co-investment funds, enabling many of these deals to take place at the appropriate levels. By syndicating deals, business angel groups can complete large investments; the £3.6m investment in ZoneFox in February 2017 led by Archangel Investors in syndication with TRI Capital, and with co-investment by Scottish Investment Bank, was claimed to be the largest angel investment round in Scotland to date.

15
Most but not all the angel groups in Scotland are members of LINC Scotland, the national business angel association. In 2017 these LINC Scotland member groups had a record year, leading 87 deals and investing £25.8m (a 33% increase from the previous year) in deals totalling £53.8m (42% increase). The angel groups contributed approximately half the funding to the totals of the deals in which they participated (2016:51%, 2017:47%), with the balance being co-investment from Scottish Investment Bank funds (2016:28% of investment totals, 2017:25%), and from venture capital or corporate VC funds, which do not invest frequently with angel groups but make large contributions when they do. Fifteen deals by angel groups (or with angel group participation) raised over £1 million, the largest being in Edinburgh adtech business TV Squared, a round of £5.2m led by Sir Tom Hunter’s special investment vehicle West Coast Capital, the £3.6m ZoneFox deal mentioned above, and an investment of £3m in Edinburgh 360o imaging company NC Tech, led by Archangel Investors. The median investment by syndicates in these 15 deals was £215k. According to LINC Scotland, its member groups work together, syndicating with each other to co-invest in approximately 60% of all deals. Anecdotally, this rate of syndication has increased over recent years, as some of the more mature groups seek co-investors to complete follow-on rounds, and rarely fund a new business alone. By contrast, newer member groups are more likely to make investments in new companies without looking for co-investment from elsewhere. This may change as their portfolios mature with increasing demand for follow on and larger investment rounds. - Individuals (including High Net Worth individuals) Individuals, as opposed to angels investing in groups, make a major contribution to the overall totals. Some invest in just a single company, and some invest via one or more syndicates or crowdfunding platforms as well as investing independently. We have tracked 140 deals in which individuals participated, contributing a total of over £29 million. Seven of these deals were over £1 million in total, the largest being the £5.2m investment in Edinburgh life sciences company Synpromics (alongside Calculus Capital), and the £5m investment in Edinburgh hospitality software company Criton Apps.
- Crowdfunding The growth in equity crowdfunding has been rapid in relation to amount of investment across relatively few deals. For 2012 and 2013 we were unable to trace any deals in this category, yet by 2016 crowdfunding investment reached £30 million (which included £19m for a BrewDog Equity for Punks campaign), before dropping back to £19m in 2017. Investments by individual angels have also dropped back from a 2016 total of £40m, of which £11m was invested in just three companies (Clydeside Distillery, Vascular Flow Technologies, and Houseology).
There were 13 successful equity crowdfunding campaigns in 2017.The BrewDog Equity for Punks round in August 2017 was the biggest crowdfunding campaign in Scotland in 2017, raising over £5m. Of the 12 remaining campaigns, seven were on the Seedrs platform, three on CrowdCube, and one on Syndicate Room and one on Crowdfunder; together these had an average value of £365k.

16
Figure 9: Crowdfunding campaigns by Scottish companies in 2017
The larger crowdfunded deals seen in London and the South East of England are not yet evident in Scotland, except for three companies in the table above which raised over £1 million – Edinburgh fintech company Money Dashboard, and waste plastic into road surfaces business MacRebur, based in Lockerbie. BrewDog is a unique case, with its successful series of tailor-made Equity for Punks campaigns. Compared with other countries and regions of the UK, equity crowdfunding in Scotland is a lower percentage of the overall risk capital market. Although difficult to verify from the data, this may be because of the role performed by the many active and visible angel groups in Scotland relative to other countries and regions of the UK.

17
2.2 Venture capital and institutional investors This category includes a range of different types of investor, from VC funds such as Albion Capital (investing in a £3.7m round in medical device company DySIS Medical) and Woodford Investment Management (investing £3m in therapeutics firm NovaBiotics), corporates such as Shell, E.ON, and Schlumberger (together investing £7m in renewable energy company Kite Power Systems), overseas firms such as Japan’s corporate investor Nipro (£6.3m investment in pharmaceutical developer TC BioPharm) and the US VC firm L Catterton (£15m in brewer Innis & Gunn). The combined picture, over several different metrics, is given in the table below. Figure 10: VC and other institutional investment by sector, investee region, and round 2012-2017
VCs and other institutional investors accounted for more than half of the total investment (59%) in 2017, a jump of 61% over the previous year, but still short of the £389m (82% of total) invested in 2015 (which included two investments totalling £264m – FanDuel and TauRx). As shown in Appendix 3, there have been many VCs and other institutional investors from elsewhere in the UK investing in Scottish companies in 2017. The number of investors from outside the UK has remained much the same as in 2016 – 14 non-UK VCs in 2017 compared with 15 in 2016, and 13 non-UK corporates in 2017 compared with 12 the year before. In 2017, with only two exceptions, investors from outside the UK acted alone whereas several of the investors from outside the UK listed in 2016 participated in the same few deals. Investments by VCs and other institutional investors are particularly subject to variation from year to year, with participation in the small number of megadeals affecting the total amounts raised. These megadeals tend to be one-off investments without any underlying pattern. It is recognised that many of the VCs and other institutional investors identified have invested in
2012
2013
2014
2015
2016
2017
2012
2013
2014
2015
2016
2017
Sector
Life Sciences 7 9 19 20 17 26 £5.3 £10.8 £53.4 £105.1 £9.7 £57.7
ICT 17 16 26 26 26 33 £19.3 £92.1 £56.5 £231.0 £160.0 £21.4
Renew ables 8 4 7 7 5 5 £20.3 £16.5 £17.3 £19.1 £7.9 £9.8
Energy 8 6 7 3 2 12 £45.0 £20.8 £13.8 £19.3 £3.3 £89.4
Food & Drink 0 0 3 1 3 3 £0.0 £0.0 £10.8 £0.5 £2.6 £115.5
Other 3 4 6 5 8 12 £6.3 £15.7 £16.2 £14.0 £12.9 £23.3
Total 43 39 68 62 61 91 £96.3 £155.9 £167.8 £389.0 £196.3 £317.0
Region
Aberdeen 8 10 5 7 3 10 £23.1 £48.8 £13.9 £118.1 £3.5 £191.3
East 18 16 34 31 30 47 £23.2 £79.7 £110.5 £211.0 £155.5 £67.2
Highlands & Islands 3 1 7 3 3 4 £28.3 £2.8 £11.3 £4.0 £5.4 £1.2
South 0 0 0 0 0 2 £0.0 £0.0 £0.0 £0.0 £0.0 £1.1
Tayside 4 6 3 3 5 3 £6.1 £16.2 £4.8 £2.1 £4.3 £17.5
West 10 6 19 18 20 25 £15.6 £8.5 £27.4 £53.8 £27.7 £38.8
Total 43 39 68 62 61 91 £96.3 £155.9 £167.8 £389.0 £196.3 £317.0
New/Follow-on
New 21 20 21 18 24 30 £62.1 £119.0 £80.7 £152.8 £32.4 £104.0
Follow -on 22 19 47 44 37 61 £34.2 £36.9 £87.1 £236.2 £164.0 £213.0
Total 43 39 68 62 61 91 £96.3 £155.9 £167.8 £389.0 £196.3 £317.0
number of deals Amount in £ millions
18
Scottish companies in previous years, frequently as follow-on investment into the same companies.
2.3 Corporate venturing
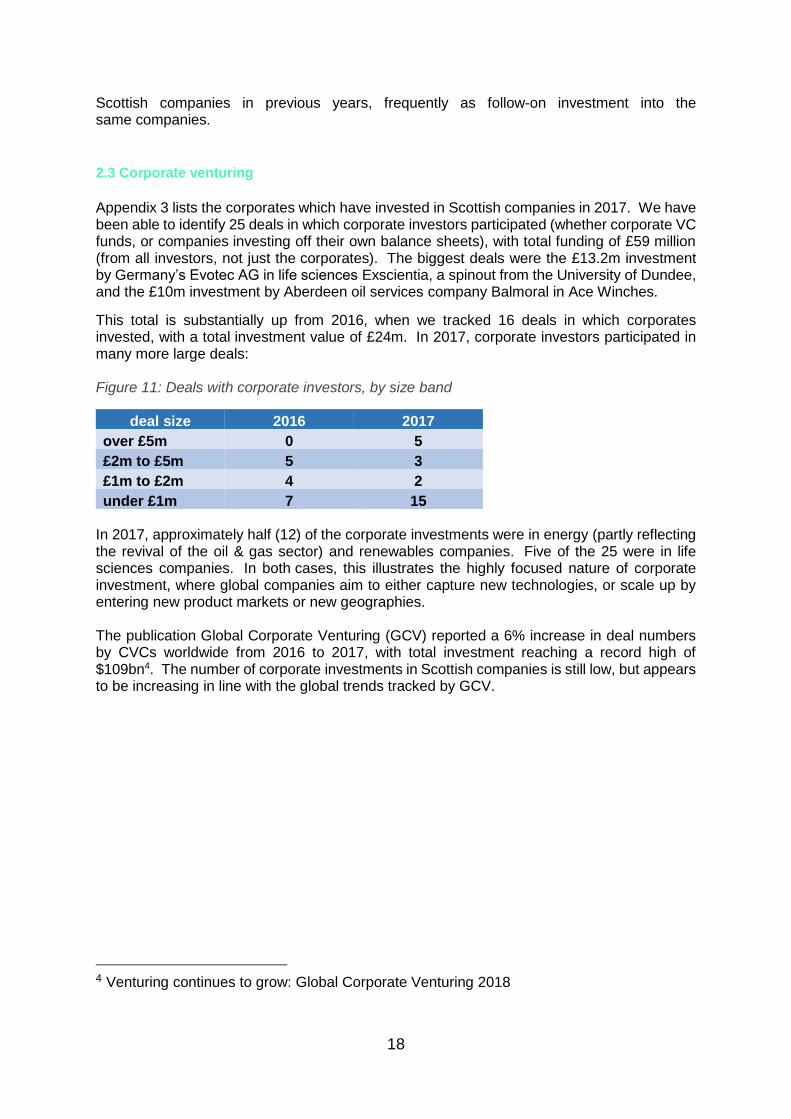
Appendix 3 lists the corporates which have invested in Scottish companies in 2017. We have been able to identify 25 deals in which corporate investors participated (whether corporate VC funds, or companies investing off their own balance sheets), with total funding of £59 million (from all investors, not just the corporates). The biggest deals were the £13.2m investment by Germany’s Evotec AG in life sciences Exscientia, a spinout from the University of Dundee, and the £10m investment by Aberdeen oil services company Balmoral in Ace Winches.
This total is substantially up from 2016, when we tracked 16 deals in which corporates invested, with a total investment value of £24m. In 2017, corporate investors participated in many more large deals: Figure 11: Deals with corporate investors, by size band
deal size 2016 2017
over £5m 0 5
£2m to £5m 5 3
£1m to £2m 4 2
under £1m 7 15 In 2017, approximately half (12) of the corporate investments were in energy (partly reflecting the revival of the oil & gas sector) and renewables companies. Five of the 25 were in life sciences companies. In both cases, this illustrates the highly focused nature of corporate investment, where global companies aim to either capture new technologies, or scale up by entering new product markets or new geographies. The publication Global Corporate Venturing (GCV) reported a 6% increase in deal numbers by CVCs worldwide from 2016 to 2017, with total investment reaching a record high of $109bn4. The number of corporate investments in Scottish companies is still low, but appears to be increasing in line with the global trends tracked by GCV.
4 Venturing continues to grow: Global Corporate Venturing 2018

19
3. Companies which companies are securing investment? The characteristics of the companies securing investment – where they are located, which sectors they operate in, whether they are first time investees or have come back for follow-on funding, time to investment, and if they are technology companies originating in universities – all help to define the market and highlight its positive and negative aspects. In this section, we look at each of these characteristics in turn, and address the question of exits, when companies reach a transition point – trade sale, or IPO – enabling their investors to realise a return on their investment.
3.1 Location of investee companies As Scotland’s population is concentrated in the central belt, it is not surprising that the companies securing risk capital investment are also concentrated in this area. The imbalance between East and West is less expected, and not proportionate to population sizes; Glasgow’s population is ~20% larger than Edinburgh’s (Glasgow: 621,020. Edinburgh: 513,210), and the larger conurbations differ by ~30% (Greater Glasgow & Clyde 1,169,110. Lothian 889,450)5. For most of the six-year period covered by this report however, companies in the East of Scotland have secured approximately half of all equity risk capital for the country, as shown in the following table, although in 2017 this share dropped to 39%. Figure 12: Deal numbers and amounts invested £m, 2012-2017, by region of investee company
In 2017 the East and West regions continued their dominance of the market, with large increases in deal numbers in both regions; deals numbers were up by 26% in the East, and 43% in the West of Scotland. This was not matched however by investment totals, where the value of investments only increased by 6% in the West of Scotland and just 2% in the East, (where the £128m investment in Skyscanner dominated the results in 2016). Aberdeen was the region with the largest increase in investment (largely due to BrewDog) – up eightfold on 2016 - which was a relatively poor year for the region - and up fourfold on the
5 Mid 2017 population estimates, National Records of Scotland www.nrscotland.gov.uk

20
average of the 5 years prior to 2017. Although the region counted only 28 deals (16 deals in 2016), or 8% of the total, it accounted for more than a third of investment (37%). The resurgence of the oil & gas industry in Aberdeen has been a major factor in the increasing number of large deals, including a £56m investment in oil & gas services company ROVOP, and a Balmoral investment of £10m in another oil & gas services company, Ace Winches. The investment total for Aberdeen was also strongly boosted by three investments in BrewDog totalling £115m.
Investment levels for Highlands & Islands have proven to be similar over the last three years (in the region of £14m). From 2016 to 2017 Tayside had an increase in investment thanks to the £13m investment by German life sciences firm Evotec in Dundee spinout Exscientia; without this deal, overall investment in Tayside companies would have remained at the 2016 level. 3.2 Market sectors Investee companies are allocated to five main sectors and an ‘other’ sector, shown in Figure 13 below. These each cover a range of different activities – for example, the life sciences category includes companies developing pharmaceuticals, medical device manufacturers, and healthcare businesses. This range of activities is particularly true of the ‘other’ sector, which largely includes companies which are not commercialising new technologies. Investors in early stage companies have often focused on technology companies which aim to disrupt a market and have intellectual property (IP) which can be protected; in recent years, companies such as Uber and Airbnb have been able to disrupt markets with innovative business models rather than technology, and these approaches have been attractive to investors. Figure 13: Deal numbers and amounts invested £m, 2012-2017, by market sector
In 2017 the ICT sector was the largest in terms of deal numbers (39% of the total), but came behind life sciences, energy, and food & drink in investment raised (15% of the total). Although deal numbers saw a modest increase (9%) from 2016, investment was down by 63%, due to the lower number of high value deals. There were just three deals of £5m or over this year – West Coast Capital’s £5.2m investment in adtech business TVSquared, a £5m investment by undisclosed angel investors in digital games producer Blazing Griffin, and another £5m investment by undisclosed angel investors in hospitality software business Criton Apps. In 2017 the energy sector had relatively few deals but many of these were of high value – the average investment for this sector was just under £4m, although the median was £560k. We
2012
2013
2014
2015
2016
2017
2012
2013
2014
2015
2016
2017
market sector
Life Sciences 34 41 60 58 59 66 £14.9 £26.1 £74.5 £123.3 £40.8 £169.7
ICT 79 70 105 106 131 143 £41.9 £110.5 £88.7 £261.1 £213.2 £79.9
Energy 9 9 8 6 9 26 £46.1 £24.8 £16.2 £21.4 £6.6 £98.8
Renew ables 15 9 20 14 23 20 £27.3 £22.1 £39.2 £28.3 £17.0 £17.2
Food & Drink 2 3 9 11 21 27 £2.4 £14.2 £23.4 £19.7 £34.7 £135.6
Other 10 17 22 19 42 89 £8.6 £17.7 £22.0 £17.7 £23.4 £36.4
149 149 224 214 285 371 £141.2 £215.4 £264.0 £471.5 £335.7 £537.6
amount in £ millionsnumber of deals

21
have commented in section 3.1 above on the resurgence of the oil & gas industry, which has had a major bearing on the total investment in this sector, with approximately 80% of the £99m investment in this sector going to companies which serve the oil industry either entirely or as a major part of their business. While the number of deals remained high, the renewables sector had another year of sub-£20m for total investment amount, compared with the higher totals from 2012 to 2015. The top deal was the £7m into Kite Power Systems (see Section 2.2 above) followed by two deals in energy saving – two rounds of £1.7m each by undisclosed investors in ‘vertical farming’ company Intelligent Growth Solutions, where crops are grown indoors in a vertically-arranged system. The life sciences sector also attracts proportionately more higher-level deals than the remaining sectors, with an average value of £2.6m and median £428k. Eleven of the 66 deals in 2017 were for over £2m, and averaged £5.5m; the top two, mentioned in section 1.2 above, were Exscientia (£13m) and Roslin Technologies (£10m). Investment into food & drink companies has been increasing since 2012 and in 2017 brewers BrewDog and Innis & Gunn accounted for 96% of total investment in this sector.
The ‘other’ sector includes companies in clothing, education, consultancy and business services and TV and films. 3.3 New and follow-on investments The following chart shows the number of investments and amounts invested in ‘new’ companies, being the first time that these companies have secured independent equity investment (i.e. excluding early investment by founders, family, and friends, the three FFFs), and follow-on investments where we are aware of previous equity investments in the company in earlier years. Figure 14: New and Follow on - Deal numbers and amounts invested £m, 2012-2017
There have been substantial increases in the number of new companies (those securing investment for the first time) – up by 38% from 2016 to 2017, compared with a 25% increase in follow-on deals. The largest deals, which move the dial furthest in measures of overall investment, are usually follow-on investments in established companies. In 2017 however, there were several large investments in new companies, most significantly the £13m secured by Dundee spinout Exscientia, which resulted in the total amount invested in new companies more than doubling from 2016 to 2017 (113% increase).

22
Seen as a proportion of total deal numbers, first time investment deals have been in the range 30% and 40% over the past six years, and reached a high point of 42% in 2017. Amounts invested in new companies (those receiving investment for the first time) have fluctuated more widely, influenced by the presence or absence of well-established firms turning to equity investment for the first time, but accounted for just over a quarter (27%) of total investment in 2017. Many of the deals which we have categorised as in new to investment companies, having not seen a previous investment, are by undisclosed investors, making it difficult to see patterns and trends. For investments by business angels however, LINC Scotland has figures for investments by its member groups, which also points to an increased number of companies receiving investment for the first time. In 2017, LINC member groups invested in 21 ‘new’ companies, representing 31% of all investee companies in the year, and 25% of all investment. These numbers are slightly up from 2016, when 28% of the companies receiving funding from LINC angel groups were first time investees, and the funding comprised 21% of total investment. Together, these figures demonstrate that although investors often voice concerns about the need to find more follow-on funding than anticipated, their ability to invest in follow-on rounds does not appear to be to the detriment of investing in new to investment companies; the number of new companies securing investment has increased appreciably over the past six years. 3.4 Investment in start-ups Not all companies receiving investment for the first time are start-ups – many are longer established businesses turning to equity investment for the first time. In this section we focus on start-ups, defining them by the age of the company and using two bands – under 3 years, and between 3 and 5 years – to analyse their place in the market. In a knowledge-based society, innovation is the driving force of the economy on all levels and in all types of organisations. Emerging companies are its life-blood, commercialising innovative ideas, and adding to the number of people in the population who have practical experience of running a high growth business. Besides creating more high-value jobs, start-ups bring new competitive dynamics into the economic system, affecting all the other organisations they deal with. The market needs a good flow of start-up companies if it is to grow, and make the most of the country’s economic potential. The following table shows the number of investments and the amounts secured by companies within 3 and 5 years of incorporation, including follow-on rounds as well as first time investments (new).

23
Figure 15: Deal numbers and amounts invested £m, companies under 3 and 5 years old, 2016 & 2017
Companies under 5 years old (taking together both the bands shown above) account for approximately half of all deals (2016:55% 2017:51%) and a quarter of all investment (2016:26%. 2017:23%). Although companies under 3 years old at the time of investment did not secure any more deals in 2017 than in 2016, the amounts invested increased considerably – average investment in this band increased from £421k to £665k. Companies between 3 and 5 years old on the other hand saw a large increase in deal numbers from 2016 to 2017, but not a commensurate increase in investment – indeed, average values fell from £851k to £659k. 3.5 Time to investment The nature of a company’s activities dictates how quickly it can raise first investment, and how long it needs ongoing funding before reaching profitability and can fund its own growth, or alternatively before reaching an exit point. The following table shows average times between date of incorporation and date of investment, for companies in four of the sectors (food & drink is not represented here due to the few number of companies). Figure 16: Average years from incorporation to first investment 2012-2017, by sector
The effect of later stage companies on the figures can be illustrated by the proportion of companies aged 10 years or more at the time of first investment; in life sciences this was 23%, in ICT 19%, in energy 15%, in renewables 21%, and in ‘other’ 14%.
2012
2013
2014
2015
2016
2017 Sector
average
Sector
Life Sciences 3.01 3.3 3.35 3.08 2.98 3.41 3.2
ICT 4.07 3.01 3.3 3.05 3.11 3.25 3.27
Renew ables 4.92 3.51 5 4.26 3.56 3.94 4.22
Energy 13.62 8.62 5.28 5.56 4.39 4.94 6.49

24
Moving on to look at the age of companies receiving investment in 2017 (whether first-time or follow-on), in the life sciences sector pharmaceutical business NuCana was the oldest company to secure investment in 2017 – it was over 20 years old at the time of its IPO on NASDAQ, but this period includes several years of development before commercialisation of its technology was started. Several well-known companies in this sector were in their mid-teens when raising investment in 2017 – Arrayjet (17), Ocutec (16), DySIS Medical (15), Ambicare (13) – illustrating the need of many life sciences companies for investment support throughout a long development process. The ICT sector covers a wide range of activities, and although there were several well-known businesses still raising funds into their teens – Reactec (15), CriticalBlue (15), Dimensional Imaging (14), Design LED, Dukosi, and Conjunct (all 13) – they were on average a little younger than the life sciences companies. In the energy sector, various well-established business, particularly in the oil & gas subsector, secured funding in 2017, including Petrotechnics (28), Ace Winches (21), and Aquaterra (12). This is likely to reflect the upsurge in the oil industry mentioned earlier in this report, leading to some older companies turning to equity investment to support new growth opportunities. 3.6 Spinouts Universities in Scotland score highly for the quality of their research, and are expected to be a principal source of technology companies. Definitions by HESA, the Higher Education Statistical Agency, address spinouts (established to commercialise intellectual property owned by the university), and start-ups (companies formed by members of staff or recent graduates who have not licensed university IP but are usually developing technology arising at the university). For the purposes of this report we have grouped both categories together under the generic term “spinout”. The following charts show the pattern of new and follow-on fundraising by technology spinouts over the past six years. Figure 17: Number of spinouts and non-spinouts as % of all deals 2012-2017

25
Figure 18: Investment in spinouts and non-spinouts as % of total investment 2012-2017
As a proportion of total deals, investments in spinouts (including the qualifying start ups) have remained reasonably constant during the period covered by these charts, although there was an increase of 30% from 2016 to 2017 in actual numbers. Investment levels have fluctuated considerably from year to year, and grew by 87% from 2016 to 2017, in part suggesting that spinouts enjoyed the increases in deal size seen elsewhere in the market. The value of investment in 2015 (the exceptional year in Figure 18), is partly due to the £88m investment in TauRx, a life sciences spinout from the University of Aberdeen.
3.7 Exits Exits for investors are a necessary feature of the market to ensure liquidity and hence the potential for re-investment; if there were none, investors would avoid this asset class. Equity investors have different motivations – for example many business angels refer to non-financial motives such as staying in the market they know, or ‘giving something back’ to the next generation of entrepreneurs, and corporate investors may be looking to get first sight of new technologies in development. All however aim to at least recover their money and if possible make a good return on investment. Many angel investments take advantage of the tax breaks under the EIS or SEIS schemes (see section 2 above), which provide not only an immediate benefit in the form of income tax relief, but also enable investors to write off against capital gains tax any losses they make if an investee company fails; for these investors, there may be different exit considerations with a more patient investment outlook than those expected from institutional investors such as VCs. There are three routes by which investors can exit and realise their investments; a flotation on a stock exchange, referred to as an initial public offering (IPO), or a trade sale to another (usually much larger) company or a sale to another investor to provide an exit for the earlier investors.

26
For an investee company, an exit can mean that it is able to accelerate its development, either by access to large amounts of funding on the public markets in the case of an IPO, or through existing sales channels and the benefits of greater administrative support in the case of a trade sale. The number of exits of Scottish companies which have had equity risk capital investment has been low for many years. In the period 2012 to 2016 we have tracked just two IPOs (Collagen Solutions in 2014, and FreeAgent in 2016), although there were several other IPOs by Scottish companies which had not secured external equity investment. In the same period, we found only one year with over ten trade sales – 13 plus a corporate-backed MBO in 2016, which included the £1.4bn acquisition of Skyscanner. While it can prove easier to find details of companies which have entered the public markets through an IPO, it is much more difficult to find details of trade sales, many of which are kept confidential by the participants, and even when information about a trade sale is available, the details of the company valuation are often not disclosed. The information which is announced in press releases can be picked up, but even those investors which publicise details of exits on their websites do not necessarily include them all, or all the relevant information. This means that the figures about trade sales collected for this report are likely to be understated, but it is unlikely that they are out by an order of magnitude. For 2017, we have reported on the NuCana IPO and the six trade sales listed in Figure 19 below. There were several other trade sales of early stage technology companies, such as the acquisition of customer experience reporting software Formatting: Watch this line space that has re-appeared in the PDF version developer SynGro by MARU Group in July 2017, but as we have not been able to identify any independent equity investors in these companies they are excluded from the list.
Figure 19: Exits by companies in Scotland, 2017
The values of the deals in this table are undisclosed in every case except Clyde Space, which secured £2 million in cash plus a shareholding in AAC worth approximately SEK294m (£26.2m) at the time of the transaction. Business angels, who accounted for 50% of all deals in 2017 (many of which will have been follow-on deals, involving an existing commitment rather than a completely new investment decision), have several motives for investing and not just for a financial return, and with the possibility of writing off losses under the EIS scheme in the case of company failures.

27
It is also possible to make good returns, better than other asset classes, from a carefully selected and managed portfolio of companies. Few investors make public any information about return on investment, and any such figures need to be treated with caution; to make a complete estimate of the return across a whole portfolio, it is necessary to value the investee companies which have not exited, either successfully in IPOs or trade sales, or by ceasing trading. While there are industry procedures for making these estimates, they are of necessity very approximate (as they depend upon assumptions of future trends in financial and even geopolitical markets). Archangel Investors, the oldest angel group in Scotland, reported in an Impact evaluation of activities 1992-20156, commissioned from the Hunter Centre for Entrepreneurship, that it had 18 successful exits in this period, covering 22.5% of its portfolio. For £37m invested in these companies, the group stated that this had returned just over £100m of value to investors which gives a rate of approximately 3x cash. Par Equity, another angel group based in Edinburgh with investments in Scotland and elsewhere in the UK, shows six trade sale exits on its website, and gives returns for four of them: Aircraft Medical (3.8x cash), Pathxl (Northern Ireland, 2.7x), Star Net Geomatics (2.4x), and Simple Audio (1.8x). Giving returns in terms of the cash multiple avoids the question of the time taken to exit, which can be long. According to the Archangels report cited above, the length of investment in the years up to 2005 averaged 8.28 years (and companies were just under 2 years old at time of investment), but this has subsequently dropped to an average of just over 5 years, with companies a little older (average 2.27 years) at time of investment. Fund performance is rarely published and details on returns from individual deals is not often publicly available. However, these figures suggest that done properly, with a portfolio investment approach, risk capital investment in early stage companies can generate returns which are better than other asset classes, but investors need to have patience to see their investee companies grow and succeed.
6 Archangels: Impact evaluation of activities 1992-2015, Hunter Centre for Entrepreneurship 2015

28
Conclusions
reflections on the market The risk capital market in Scotland continues to demonstrate impressive growth, reaching a new high in 2017 of £538m, across a record number of 371 deals. Trend analysis from 2012 confirms that for 2017 the number of deals has more than doubled, with an almost fourfold increase in levels of investment. Omitting the influence of periodic megadeals such as BrewDog and ROVOP in the North East to Exscentia in Tayside and NuCana and Innis & Gunn in the East, the underlying market (deals below £10m) more than doubled in size from £123m in 2012 to £255m in 2017. On this market evidence alone, it appears reasonable to conclude that the risk capital market in Scotland is in particularly good health or is, at least, moving impressively in that direction. Indeed, our UK & Ireland benchmarking report (also published during Autumn 2018) does little to refute such a claim. While the signs are positive, a more cautious outlook is warranted, especially given well reported economic headwinds, whether from Brexit concerns to what is regarded as an increasingly competitive and global equity market, where more companies are pitching for limited supplies of investment. issues arising The report has generated many findings that are worthy of further debate in the industry. A single conclusion to an issue is not always helpful. In the following piece, we explore these arising issues in the hope that further debate may be stimulated. For example, within Section 1 of the report, the deal size band from £5m to £10m experienced a significant uplift in activity with 13 deals (2016: 3 deals) and over £89m invested (2016: £17m). Positive results like this are welcome, yet, at the same time, demand further attention. For example, there was a decline in the adjacent deal size band of £2m to £5m, where there were 15 deals (2016: 23 deals) and £47m invested (2016: £74m). It would be wrong to draw any firm conclusions based on a single year’s results; however, this lower band also represents a key growth stage for a scaling company and may suggest further monitoring is merited. Alternatively, we could consider the decline in the £2m to £5m band to be combined with the greater growth in the £5m to £10m band, painting a unified picture with a highly positive message for scaling companies securing investment. The £100k to £2m band also witnessed significant growth in deal numbers and investment amounts of some 20%. With some 60% of the overall deals (211 against the 371 total), this band could be presented as a critical pipeline for future high growth deal activity. This ‘pipeline’ has been growing steadily over the last few years with investment totals for this band breaking through the £100m threshold in 2017. All other growth matters being equal, it is perhaps not too far a stretch to conclude that those companies will soon be pitching for £2m plus or £5m plus in the near term. In the lower band up to £100k, while we are seeing increased activity (plus 60% from 2016 on deal numbers and plus 20% on overall investment), it is difficult to draw too many conclusions. Again, more activity is welcome, some of which will almost certainly support the pipeline, however, we don’t know the mix. That’s to say we must conclude that many of these deals may prove to be short term capital requirements and where loan finance is unavailable and others may have been structured at this level to benefit from seed enterprise tax incentives.

29
In Section 2 of the report we considered who is investing in Scottish companies by investor type and whether 2017 was in any sense a departure from what we have witnessed over the last few years. We discovered that business angel groups, individuals (including high net worth individuals and crowdfunding platform investors) are even more active in the growth of Scottish small and medium size businesses, leading and supporting deals that without them would not happen. They are often defined as the bedrock of the Scottish investment scene, completing many more deals in 2017 than before, almost three times as many as 2012 and some 25% more than 2016 (2012: 100, 2016: 219 and 2017: 272). While these investors participated in almost as many deals as all the remaining investor types together, when it comes to investment amounts they provided less than 14% of the overall 2017 investment total (£74.8m against a total of £537.6m). While £74.8m from angels (whether groups, individuals or those using crowdfunding platforms) was a drop from the £91.4m recorded in 2016, it still amounted to almost double the average of the previous 5 years (2012-2016). We know from our partners at LINC Scotland that their angel members had a record year, leading 87 deals and investing close to £26m, often co-investing with Scottish Enterprise funds and that member groups work together to co-invest in some 60% of all deals. We also noted that syndication between formal angel groups, and with others (mainly other angel groups), has been rising. The report points to angel group finance as a fundamental component of the Scottish investment scene, and for some time, and more so than elsewhere in the UK. One conclusion is that more needs to be done to build solutions to secure the long-term sustainability of angel investing, recognising current constraints such as the trend towards fewer exits and with many years to an exit event (Section 3.7 of the report), allied to competition from other asset classes. While there is no documented evidence source it is possible that the relatively slow uptake in equity crowdfunding across Scotland is associated with the view that angels are already fulfilling that role (Section 2.2) through well structured and experienced angel groups. This interpretation does appear logical, although we may conclude the relatively low take up of crowdfunding – dominated by a few celebrated cases such as BrewDog - is also behavioural, reflecting limited awareness and hence a reluctance on the part of Scotland’s SMEs to engage with a relatively new source of growth funding that only recently has been subject to formal regulation. There is also evidence that angel groups are engaging with particular platforms to secure additional investment for some deals. VCs, corporates, private equity funds and other private funds (such as family offices, pension and university funds) provide for over half of the total investment into Scottish SMEs (2016: 58% and 2017: 59%). Overall, we may conclude that these investors are here for the long haul with twice as many investments into follow-on (61) compared to new (30) and £213m follow-on investment compared to £104m into new companies. Further analysis is merited to investigate recurring investors and the degree to which they may be attracted by new opportunities or are simply following earlier investments into the same companies. We may conclude that Scottish SMEs are on the radar and are successful in winning investment from elsewhere in the UK and that recent activity such as the creation of the London Hub8 by Scottish Government and its public sector partners, and investor events and showcases are playing a strong role. Further analysis will be required to segment the activity levels of overseas investors (deals, amounts by deal band, follow-on and new, and sectors) although we may conclude at this stage that Scottish SME investment opportunities remain attractive to overseas investors.

30
Similarly, there is a growing need to improve monitoring of corporate investment not least because of recent growth and record highs in Scotland (25 investors for 2017 compared to 17 for 2016) and globally (6% increase in deal numbers from 2016, reaching a high of $109Bn9). We can conclude that this is a growing source of investment for growth companies in Scotland and requires further attention. In Section 3 of the report we turned to the companies receiving investment by exploring their characteristics. The central belt continues to dominate the geographical spread of companies receiving investment, albeit with the largest focus in the East, however Aberdeen’s investment total increased eightfold (2016: £24m and 2017: £201m). Such an increase can be explained by BrewDog £115m, ROVOP £56m and Ace Winches £10m. The improving outlook for the oil & gas industry has no doubt played a part. While investment in the West reached a high (£80m in 2017 compared to the previous high of £74m in 2016), this left little impression on the East’s dominance. It has been mooted that angel groups prefer to invest in companies in proximity to their own locations; however, this has partly been challenged in earlier reports in this series when examining the extent to which angel groups invest close to home or further away: “Although by far the strongest correlation is between investors in the East of Scotland and companies in the same region, the figures show that angel groups are prepared to invest widely across the country. Companies in both the East of Scotland and the West have secured investment from angels in all other regions7.’’ Turning to the market sector analysis, once again the ICT sector dominated in relation to number of deals (143, over a third of total deals). However, the sector fell back when it comes to investment levels with the £80m total at its lowest level since 2012. This is attributed to the absence of megadeals (over £10m). There were still 3 deals of £5m and over and it is inadvisable to suggest any firm conclusions, despite 2017 being the first time over the last 5 years that ICT has not led the way on investment amounts. Despite half as many deals as ICT, investment in Life Sciences rebounded during 2017 (£170m) with a fourfold increase on the 2016 total and the highest recorded over the six-year period analysed. This translates into proportionately more higher-level deals, with a life sciences’ sector average value of £2.6m and a median investment level of some £430k. Investment in the energy sector (totalling £99m, of which 80% relates to oil & gas) also recovered and was more than double the previous high recorded during 2012, whereas renewables investment levels held at the £17m level recorded for 2016, down from the average of £30 across the period 2012 to 2015. It is encouraging to find that there were still 20 renewables’ deals against an average number of 16 during the previous 5 years. We can conclude that oil & gas is driving energy investment levels (3 times as many deals as any previous year, going back to 2012) and while renewables’ levels of investment (£m) are reducing, there remains healthy deal activity. For 2017 it is food & drink that stands out and notably the latter, with BrewDog (£115m) and Innis & Gunn (£15m) accounting for 96% of the total invested in this sector. The ‘other’ sector may soon create a need for more detailed reporting for us in the future, the reason being its journey from 10 deals and £8.6m invested in 2012 to 89 deals and £36.4m invested in 2017. Deals are spread across many industries, from textiles to tourism and clothing to consultancy.
7 The Risk Capital Market in Scotland, 2009-2011

31
The number of companies receiving investment for the first time continues to grow and is up by 38% on 2016, with follow-on investment deals into companies increasing by 25%. Following the drop in ‘new’ to 30% of total deals in both 2014 and 2015, the number of companies receiving investment for the first time has jumped back to 42% of the total number of deals for both 2016 and 2017, which is similar to pre-2014 levels. Looking at investment share (£m) into companies receiving investment for the first time, this has been on the decline since 2013 and reached a low of 20% during 2016. There has been a reversal of this downward trend for 2017 with 27% of the total invested and the second highest amount (£144m) in the series from 2012. While investors understandably continue to highlight the pressures of supporting follow-on needs, companies in Scotland looking for first time investment do not appear to be missing out when attempting to raise investment. An area for further research is the influence of established firms seeking investment for the first time. The report (Section 3.3) points to the presence or absence of established firms, receiving equity for the first time, as a reason for the fluctuations in the number of new companies in any single year. For the first time in the report series (and to help address the issue of established firms) we looked at investment in start-ups, using 3 and 5 years from company incorporation as an answer to the lack of an agreed definition over what constitutes a ‘start-up’. Despite similar numbers of deals between 2016 and 2017 for companies under 3 years old, investment levels increased significantly, by over 50%. Those in the next band (over 3 years and under 5 years old) witnessed a 30% increase in investment amounts. As expected, follow-on begins to dominate after a company is more than 3 years old, taking 60% of the investment total during 2017. There appears to be strong investment activity to support start-ups, although we require longer trends to make any firm comment on patterns of investment for this cohort of companies. The report also took the opportunity to look at the age of companies when first securing investment. In any single year and on average, a company falls into what appears to be a very tight range of three and a half to four and a half years old when achieving investment for the first time. This average range tends to mask the variation at sector level with Energy based companies averaging over six years and Life Sciences companies closer to 3 years. We can conclude that while start up companies up to 3 years old are able to secure investment and are a feature of deals in the lower investment bands, more established companies are a growing influence within the investment landscape as we move up the deal bands. The other category of new and innovative companies is the spin out category, with the last 6 years appearing to be reasonably stable in relation to share of total numbers of deals. Isolating 2015 as an exception (due to the £88m invested into TauRx spin out), it can be concluded that spin out success has tended to follow overall market trends. This section of the report also throws up an interesting direction of travel with the relatively larger increase in investment activity into what can be regarded as more traditional industries (such as food & drink) compared to the disruptive high technology companies in sectors such as life sciences and ICT which we have come to be more familiar with. Further research is required to better understand the motivations driving this trend. Finally, the report examines the seemingly low level of exit activity, with only 6 trade exits identified during 2017and it seems to be of little comfort that exits, in the shape of trade sales, were also substantially down across the UK8. There is only one occasion in Scotland when trade exits exceeded ten (2016 recorded 13 trade deals plus a corporate backed MBO). While
8 Investment Benchmarking Analysis, Annual Report 2017 (Scottish Enterprise, Summer
2018)

32
the report acknowledges that the count may be understated, the issue remains high on the agenda of investors and is likely acting as a constraint on liquidity and any significant potential to increase activity further. Our Investment Benchmarking Analysis (cited above) calculated an average time from incorporation to exit of 12.6 years for the UK; this time period has been increasing over recent years, but the sample size is small. While the Scotland sample is particularly small, the result is very similar and can be reported in the range of 11 years to 13 years (Section 3.7, Figure 19). We may conclude that investors have proven to be resilient in the face of long periods to exit, yet liquidity remains a significant threat to continuing growth in Scotland’s Risk Capital Market.

33
Appendix 1: Glossary of terms
Term Definition
angels Private individuals who invest their own capital either alone or part of a syndicate, and who personally own the equity they purchase.
corporate venturing Investment by large (often global) non-financial companies, for the
purpose of building innovative capacity which might give the investor competitive value.
deal The transaction between an investor and a company, which may be
standalone or part of an investment involving other investors. equity investment A discrete purchase of share capital in a company by one or more
investors at a given time. institutional investors Organisations which invest on behalf of others. These include Venture
Capital companies, partnerships, corporations and corporate venture firms, banks and investment trusts.
ICT information and communications technology IP intellectual property LS life sciences new investment The first significant external equity investment in a company, excluding
early small scale investment by founders, friends, and family. Often referred to in the industry as a Series A round.
others The category ‘others’ refers to individual investors who are not part of an
angel group (and are not ‘founders, family, or friends’), but also includes investors whose identity it has not been possible to determine.
public Public sector investments include those by the Scottish Investment Bank
funds, Highlands and Islands Enterprise, and other public sector agencies. SE Scottish Enterprise SIB Scottish Investment Bank, a division of Scottish Enterprise that provides
investment funds to support company growth in Scotland. spinout spinout - a company emerging from a university or research institution,
whether created to commercialise IP owned by the institution, or started by a member of staff or recent graduate.
syndication Investment by two or more groups or firms, investing under the same
terms and conditions in order to increase the total deal size. VC Venture capital, or venture capital firm. Typically, VCs are investing funds
with a specified time scale, often ten years, within which they aim to generate returns on the investments of the fund’s LLP (limited liability partner) stakeholders.

34
Appendix 2: Methodology Data collection by Beauhurst Beauhurst collects, collates and structures data on all equity investment deals into private UK companies, the companies receiving the investments, and the investors involved in the deals, using a variety of resources and techniques for this purpose. 1) announced deals Beauhurst has developed a proprietary application to automatically read thousands of web-pages each day on websites that are likely sources for deal announcements; this includes national newspapers and trade press, as well as a myriad of less common sources. Using machine learning the application flags to the Beauhurst research team all press releases it has identified as containing mention of an investment. The research team reads these releases to determine what type of finance was involved, the company involved, the investors involved and all other relevant details. 2) unannounced deals The majority of equity transactions in the UK are unannounced: in 2016 59% of the equity deals in Scotland were not announced in any press release or other news source. Beauhurst identifies these deals by looking at SH01 forms filed at Companies House, which indicate the issue of new shares in a company; all UK companies are required to file these returns, which are usually an indicator of new investment in the business. Beauhurst has developed proprietary software that reads all SH01s filed at Companies House. The research team is able to determine the value of the investment and, where the data is available, the investors involved. This allows Beauhurst to identify all equity deals in the UK except for the very small percentage of deals into companies which fail to file SH01 returns. 3) further sources Beauhurst also receives submissions from funds and equity crowdfunding platforms detailing their investments, which enables the matching deals found through SH01s with their investors. Beauhurst also incorporates data supplied by YCF, LINC Scotland and the Scottish Investment Bank. 4) ongoing tracking Receipt of an equity deal is only one of the triggers for including a company in the Beauhurst database. It also includes all companies that have graduated from an incubator or accelerator, achieved scale-up status, or received an Innovate UK grant. Once companies have met one of these triggers, Beauhurst continues to track them, looking for further deals, acquisitions, IPOs etc.
Further research by YCF YCF tracks investments in Scotland on its own account, to be able to provide deals reports in its monthly publication. YCF has a number of approaches: Access in confidence to deals listings by angel group members of LINC Scotland;

35
Monthly ‘news reminders’ to investors and intermediaries (legal and corporate finance) for deals reports to be included in YCF’s monthly publication; Tracking of emerging companies which have participated in one or more of the many start-up level programmes in Scotland – for example SMART and RSA grants, Scottish EDGE, Converge Challenge, EIE, SIE, Shell Springboard, High Growth Spinout Programme, Saltire Fellowships, RSE Fellowships. The tracking includes some desk research, and some direct contact.

36
Appendix 3: List of investors by type The following investors all made investments in Scottish companies in 2017. ANGEL GROUPS Scotland
Angel Investment Solutions
Apollo Informal Investment
Archangel Investors
Barwell plc
ChimaeraBio
Discovery Investment Fund
EOS Technology Investment
Equity Gap
ESM Investments
Gabriel Investments
Galvanise Capital
Highland VC
Investing Women
Kelvin Capital
Lancaster Capital
London & Scottish Investment Partners
Par Equity Syndicate
Seed Haus
TRI Capital
West Coast Capital
outside Scotland 24Haymarket Aero-Den London Business Angels
CROWDFUNDING
Crowdcube
SyndicateRoom
Equity for Punks
Seedrs
VCs AND INSTITUTIONAL INVESTORS
Epidarex
JB Equity
Maven Capital Partners
OGTC
Old College Capital
Par Equity
Pentech Ventures
Scottish Enterprise
Scottish Investment Bank
Strathclyde Entrepreneurs Fund
Strathclyde Innovation Fund
StrathclydeUniversity Incubator
Strathtay Ventures (Braveheart)
other UK
Accelerated Digital Ventures (ADV)
Albion Ventures/Capital
Barclays Ventures
BGF Growth Capital
BGF Ventures
Blue Water Energy
British Innovation Fund
Calculus Capital
Clarendon Fund
Deepbridge Capital
Downing Ventures
Enso Ventures
Greencoat Capital (ESB Novusmodus)
Herald Ventures
Invesco
IP Group
Mediqventure
Mercia Fund Management/Technologies
Mobius Technology Ventures
Newable Fund
Percipient Capital
Rain Dance Investments
Royal County of Berkshire Pension Fund
Satellite Applications Catapult Services
Schneider Investment Associates
SEA Equity
Sussex Place Ventures
Velocity EIS Consumer Fund
Woodford Investment Management

37
outside UK
Data Collective
DP Energy
Dreamlab Finance
EV Private Equity
Frontline Ventures
Julz
Keiretsu Capital (Fifth Era Fund)
LanzaTech Ventures
Lundbeckfond Ventures
Mangrove Capital Partners
NBGI Private Equity
Truffle Capital
VilCap
Weisz Investments
CORPORATE VC
ABB Technology Ventures
Aggregated Micro Power Holdings
AMP Solar Group
Ark Genomics
Balmoral
bluebirdbio.Inc
BP Ventures
Castle View Ventures
Schlumberger
Schottel Hydro
Shell Technology Ventures
Southern Cross Beverages
Statoil Technology Invest
TSG Consumer Partners
Waracle
Channel 4 Growth Fund
ConocoPhilips
Croda International
DC Thomson Ventures
E.ON
Evotec AG
Exception
IKEA Greentech
L Catterton Europe
Nipro

Appendix 4: Authors
Jonathan Harris, Editor, YCF
Jonathan is the publisher and editor of Young Company Finance (YCF) a monthly review of early stage high growth companies in Scotland which focuses particularly on the issues of how to fund growth. Since acquiring the business in November 2000, Jonathan has subsequently expanded it to encompass special reports on specific market sectors (to date Life Sciences, Digital Entertainment, and Renewable Energy), a very successful annual conference now in its 15th year, and in 2006 a new edition of YCF, a monthly publication tracking young companies in the North of England, subsequently discontinued after four years of publication. In 2011 Jonathan started Spinouts UK, a new project managed by Young Company Finance which is based upon a database of spinout and start-up companies from universities across the whole of the UK. Spinouts UK has been supported by prestigious partners including universities (Oxford, Cambridge, Edinburgh, Manchester, UCL, Imperial, Nottingham, and Loughborough), public sector agencies (Scottish Enterprise, Finance Wales, Nesta), and several other organisations with a close involvement in the university commercialisation sector (PraxisUnico, BBSRC, Royal Society of Chemistry, Marks & Clerk, MFL Science & Technology, and Winning Pitch).
Henry Whorwood, Senior Consultancy Associate, Beauhurst Henry leads Beauhurst’s bespoke projects. He has experience writing content for academic, commercial and consumer audiences, including the British Business Bank and Innovate UK. He has been quoted in the UK media and is the lead author of Beauhurst’s industry report, The Deal. Jake Ford, Consultancy Associate, Beauhurst Jake has worked on a variety of projects for clients in the public and private sectors, ranging from CEO surveying to analyses of markets, investment trends and the wider high-growth ecosystem in the UK.