the risk & return of sei metric equity...
TRANSCRIPT

This project has received funding from the European Union’s Horizon 2020 research and
innovation programme under grant agreement No 649982.
EUROPEAN UNION
H2020 – Grant Agreement No 649982
FINAL REPORT
THE RISK & RETURN
OF SEI METRIC
EQUITY PORTFOLIOS
February 2018

Disclaimer
This Project is funded by the European Commission. It reflects only the views of the
authors and the agency is not responsible for any use that may be made of the
information it contains.
Authors: Dr. Anne Michaels, Prof. Dr. Ulf Moslener, Menglu Zhuang
About the Sustainable Energy Investing Metrics (SEI Metrics) project:
The project aims to develop a climate performance framework and associated investment
products that measure the exposure of financial portfolios to the 2°C economy. The
metrics, benchmarks, and tools will enable investors to align their portfolio with
decarbonization roadmaps. The project runs from March 2015 to March 2018 and
mobilizes over €2.5m in funding. Consortium members in the project include the 2°
Investing Initiative, CIRED, WWF Germany, Kepler-Cheuvreux, Climate Bonds Initiative,
Frankfurt School of Finance & Management, CDP, WWF European Policy Office and the
University of Zurich.

List of Abbreviations and Acronyms
2ii 2 Degree Investing Initiative
CAPM Capital Asset Pricing Model
Dvd Dividend
G20 Group of Twenty
GICS Global Industry Classification Standard
HLEG High-level Expert Group on Sustainable Finance
ICE Internal Combustion Engine
IEA International Energy Agency
kWh Kilowatt Hour
PORT Portfolio & Risk Analytics
P / B Price / Book
P / CF Price / Cash Flow
P / E Price / Earnings
P / S Price / Sales
RV Relative Valuation
SEI Sustainable Energy Investment
Wght Weighted
TABLE OF CONTENTS
1. Introduction ........................................................................................................................1
2. Back-testing the 2 °C Screened Portfolio ..........................................................................3
3. Back-testing the High-carbon Portfolio ..........................................................................13
4. Conclusion and Outlook ...................................................................................................20
5. Bibliography ......................................................................................................................23
ANNEXES
ANNEX 1: CLIMATE IMPACT OF THE 2°C PORTFOLIO
ANNEX 2: METHODOLOGY
ANNEX 3: PORTFOLIO ANALYSIS TOOL

LIST OF FIGURES
FIGURE 1: SECTORIAL DISTRIBUTION OF THE 2 °C SCREENED PORTFOLIO VS. MSCI WORLD .................. 5
FIGURE 2: TOP 15 COUNTRY DISTRIBUTION OF THE 2 °C SCREENED PORTFOLIO VS. MSCI WORLD ....... 5
FIGURE 3: COMPARISON GROUP VALUE MEASURES ................................................................................. 7
FIGURE 4: TOTAL RETURN (%) OF THE 2 °C SCREENED PORTFOLIO .......................................................... 8
FIGURE 5: QUARTERLY TOTAL RETURNS CHART OF THE 2 °C SCREENED PORTFOLIO ............................. 9
FIGURE 6: COMPARISON GROUP FUND SHARPE RATIOS ......................................................................... 11
FIGURE 7: SECTORIAL DISTRIBUTION OF THE HIGH-CARBON PORTFOLIO VS. MSCI WORLD ................ 14
FIGURE 8: TOP 10 COUNTRY DISTRIBUTION OF THE HIGH-CARBON PORTFOLIO VS. MSCI WORLD ..... 15
FIGURE 9: TOTAL RETURN (%) OF THE HIGH-CARBON PORTFOLIO ........................................................ 16
FIGURE 10: QUARTERLY TOTAL RETURNS CHART OF THE HIGH-CARBON PORTFOLIO ......................... 17
LIST OF TABLES
TABLE 1: TOP 15 HOLDINGS OF THE 2 °C SCREENED PORTFOLIO ............................................................. 3
TABLE 2: TOP 5 EXCLUDED STOCKS WEIGHTS IN THE MSCI WORLD PORTFOLIO .................................... 4
TABLE 3: VALUE & GROWTH MEASURES OF THE 2 °C SCREENED PORTFOLIO ......................................... 6
TABLE 4: HISTORICAL MEAN RETURNS (ANNUALIZED): MEDIUM-TERM .................................................. 8
TABLE 5: DEVIATION, SKEWNESS, AND BETA IN THE PERIOD 31.10.2012-31.10.2017 ........................... 10
TABLE 6: DOWNSIDE RISKS IN THE PERIOD 31.10.2012-31.10.2017 ........................................................ 10
TABLE 7: RISK-ADJUSTED RETURNS OF THE 2 °C SCREENED PORTFOLIO ............................................... 11
TABLE 8: TOP 15 HOLDINGS OF THE HIGH-CARBON PORTFOLIO ............................................................ 13
TABLE 9: VALUE & GROWTH MEASURES OF THE HIGH-CARBON PORTFOLIO ....................................... 15
TABLE 10: HISTORICAL MEAN RETURNS (ANNUALIZED): MEDIUM-TERM .............................................. 16
TABLE 11: DEVIATION, SKEWNESS, AND BETA IN THE PERIOD 31.10.2012-31.10.2017 ......................... 18
TABLE 12: DOWNSIDE RISKS IN THE PERIOD 31.10.2012-31.10.2017 ...................................................... 18
TABLE 13: RISK-ADJUSTED RETURNS OF THE HIGH-CARBON PORTFOLIO .............................................. 19

1
1. INTRODUCTION
A new climate change framework has been agreed to slow down climate change
and adapt to its already unavoidable consequences in December 2015 in Paris.
Substantial efforts from various economic sectors are required to achieve a real
economy transition and the goal of the Paris Agreement. In this context, the role
of the financial sector in relation to climate-related issues draws more and more
attention.1 The underlying assumption that the financial sector should take an
active role to support the real economy transition by its financing and investment
decision is controversially discussed. However, many institutions in the financial
sector expressed willingness to contribute to the long-term climate goals. In
particular, 15 financial centres agreed to drive action on climate change and
sustainable development in the Casablanca statement in September 2017;2 5 more
financial centres joined in December in the same year.3
Mechanisms estimating and analysing the required transition is also a central
subject of interdisciplinary research. The International Energy Agency (IEA)
roadmaps mapped 2 °C pathways that limit global temperature to 2 °C above pre-
industrial level by 2050 based on technologies on the production level. The
“Sustainable Energy Investment (SEI) Metrics Project” financed by the European
Commission proposes a type of metric measuring the consistency of financial
markets with climate goals.
There is a general consent that the consequences of climate change do not only
affect our environment but will also impair the productivity of the global
economy, in particular a number of sectors highly vulnerable to the global
transformation e.g. automotive, energy etc. If this assumption holds true,
investments into conventional assets would signify a higher risk for all kinds of
1 Various activities that urge or require the financial sector to take actions on climate-related issues are on-going, e.g. the
recommendations on the climate-related financial disclosures from the Group of Twenty (G20) Task Force, the French Act 173 energy transition law and the EU strategy on sustainable finance proposed by the High-level Expert Group on
Sustainable Finance (HLEG). 2 The 15 centres include Astana, Casablanca, Dublin, Hong Kong, Milan, London, Luxembourg, Milan, Paris, Qatar,
Shanghai and Stockholm. Source: Lebada, A. M., 2017. Financial Centres, Social Enterprise World Forum Launch New Initiatives on Sustainable Finance. [Online]
Available at: http://sdg.iisd.org/news/financial-centers-social-enterprise-world-forum-launch-new-initiatives-on-
sustainable-finance/ 3 The 5 centres are Frankfurt, Geneva, Shenzhen, Toronto and Zurich. Source: United Nations Environment Programme,
2017. Accelerating Financial Centre Action on Sustainable Development: How International Cooperation Can Scale Up Green and Sustainable Finance, Switzerland: UN Environment.

2
investors. Thus, there is a natural interest to compare the risk / return profiles of
conventional portfolios with those consistent with a 2 °C scenario. This will help to
understand how risk and return patterns will shift and facilitate improved
investment strategies. There might be financial interests for the investors to
evaluate the climate impacts of the investments.
Though it is currently not known how big the impact of climate-related risks on
investment portfolios is, it is likely that the climate-related risks on portfolios
could be mitigated by making investment portfolios consist with 2 °C compatible
pathways. As part of the SEI project, this report compares the performance of a
more 2 °C compatible portfolio (named as 2 °C screened portfolio) to a
conventional benchmark (MSCI World).4 We use the Bloomberg Risk & Portfolio
Analytics tool for a period of 5 years. The aim is to measure the price (in terms of
additional risk or reduced return) of making the MSCI World portfolio consistent
with a 2 °C pathway.
This report shows that climate-related risks in the investment portfolios could be
mitigated at a small price, if any at all in an example of a more consistent
portfolio in the back-testing period. Results indicate that there is no observed
trade-off between climate impacts and risk-adjusted returns between the 2 °C
screened portfolio and the MSCI World portfolio taken as benchmark.5 In addition,
our analysis shows the difference of climate impacts between the 2 °C screened
portfolio and the MSCI World portfolio in terms of their 2 degree consistency. In
Annex I, we show that the 2 °C screened portfolio is substantially more consistent
with a 2 °C pathway than its benchmark.
In the following, Chapter 2 presents the back-testing results of the 2 °C screened
portfolio compared to the benchmark MSCI World portfolio. Chapter 3 presents
the back-testing results of a portfolio composed of the stocks that are selected out
(named as high-carbon portfolio) compared to the same benchmark. The last
chapter gives a summary and an outlook into future research areas.
4 The 2 °C screened portfolio is constructed by the 2 Degree Investing Initiative. 5 Based on the previous work of the 2 Degree Investing Initiative, it is shown that the 2 °C screened portfolio is sectorial compatible with a 2 °C pathway as indicated in the IEA roadmaps with the exception in the automobile sector. The MSCI
World portfolio is not sectorial compatible with 2 degree pathways.

3
2. BACK-TESTING THE 2 °C SCREENED PORTFOLIO
THE 2 °C SCREENED PORTFOLIO AND THE BENCHMARK
The 2 °C screened portfolio is a fictional portfolio that allocates 100% of the
portfolio assets in equity. The portfolio is constructed by excluding 6 fossil fuel
company stocks, 25 power company stocks and 23 automotive company stocks
from the MSCI World constituents in December 2015 based on a number of
exclusion rules.6 The 2 °C screened portfolio consists of 1595 stocks and has a total
asset value of $ 1.26 billion as of 31.10.2017. The 2 °C screened portfolio is
assumed to be a fixed portfolio that an investor holds continuously across the
back-testing period without rebalancing (31.10.2012 – 31.10.2017).
The 2 °C screened portfolio is compared to the MSCI World portfolio (benchmark).
The market capitalisation of the MSCI World portfolio is of $ 1.32 billion as of
31.10.2017. In the context of this report, the MSCI World portfolio is a portfolio
obtained in December 2015 where the free-float shares from Bloomberg terminal
database are used for each constituent in MSCI World; the benchmark is also
assumed to be fixed without rebalancing during the period from 31.10.2012 to
31.10.2017.7
This report uses the Bloomberg Risks & Portfolio Analytics tool to analyse the 2 °C
screened portfolio’s returns over the medium term (5 years) and the risk-adjusted
return of the 2 °C portfolio against the benchmark MSCI World portfolio.8
CHARACTERISTICS
Table 1 shows the top 15 holdings of the 2°C screened portfolio and MSCI World
portfolio. The top 15 holdings are identical and have only implicit weight
differences in the 2°C screened portfolio and MSCI World portfolio.
Table 1: Top 15 Holdings of the 2 °C Screened Portfolio
2°C Screened MSCI World
6 Please see Annex 2: Methodology for more information on portfolio construction. 7 It is important to note that the MSCI World portfolio constructed here have fixed constituents throughout the back-testing period, and thus differs from the MSCI World index, whose constituents are adjusted periodically by MSCI. Some
instruments could appear inactive in certain periods in the MSCI World portfolio; no proxy is used in any period to
replace the inactive instruments in that period. We thank 2 Degree Investing Initiative for providing MSCI constituents of
December 2015. 8 The period 31.10.2012 to 31.10.2017 covers both bull markets and bear markets in the economic cycles, e.g. 2013 (up)
and 2015 (down).

4
APPLE INC 2.54% 2.44%
MICROSOFT CORP 1.68% 1.61%
AMAZON.COM INC 1.16% 1.11%
FACEBOOK INC-A 1.03% 0.98%
JOHNSON & JOHNSON 1.02% 0.98%
JPMORGAN CHASE & CO 1.00% 0.96%
EXXON MOBIL CORP 0.93% 0.89%
ALPHABET INC-CL C 0.84% 0.80%
ALPHABET INC-CL A 0.80% 0.76%
BANK OF AMERICA CORP 0.76% 0.73%
WELLS FARGO & CO 0.74% 0.71%
NESTLE SA-REG 0.71% 0.68%
PROCTER & GAMBLE CO/THE 0.62% 0.60%
CITIGROUP INC 0.59% 0.57%
PFIZER INC 0.58% 0.56%
Total 15.01% 14.38% Note: The figures are calculated based on asset value of active stocks as of 31.10.2017.9
The 2°C screened portfolio is constructed by excluding 54 stocks from the MSCI
World portfolio. The weight of the Top 5 excluded stocks in the MSCI World
portfolio is presented in Table 2. The Top 5 excluded stocks are in the range of
18th to 51th place in MSCI World portfolio holdings. In total, all excluded stocks
represent 4.21% of weight in the MSCI World portfolio.
Table 2: Top 5 Excluded Stocks Weights in the MSCI World Portfolio
2°C Screened MSCI World
CHEVRON CORP 0% 0.56%
ROYAL DUTCH SHELL PLC-B SHS 0% 0.32%
BP PLC 0% 0.31%
ROYAL DUTCH SHELL PLC-A SHS 0% 0.31%
TOTAL SA 0% 0.30%
… … …
Total (all excluded stocks) 0% 4.21% Note: The figures are calculated based on asset value of active stocks as of 31.10.2017. “Total” is the sum of all
the stocks excluded from the MSCI World portfolio.
The sectorial distribution of the 2°C screened portfolio and MSCI World portfolio is
presented in Figure 1. The differences of sectorial distribution between the
screened portfolio and the benchmark come from the following three categories:
power (in the utilities sector in Figure 1), fossil fuels (in the energy sector), and
automobile (in the consumer discretionary and industrials sectors) as a number of
9 The differences between the weight of the remaining stocks in the MSCI World portfolio after exclusion and the 2°C screened portfolio is small. On average, the weight difference for each stock is 0.3 basis point with a standard deviation
of 0.6 basis point.

5
stocks in the power, fossil fuel, and automobile categories are excluded based on
defined portfolio construction rules in the 2°C screened portfolio.10
Figure 1: Sectorial Distribution of the 2 °C Screened Portfolio vs. MSCI World
Note: Sector classification based on Global Industry Classification Standard (GICS) sectors. The figures are
calculated based on asset value as of 31.10.2017.
Figure 2: Top 15 Country Distribution of the 2 °C Screened Portfolio vs. MSCI
World
10 Please see Annex 2: Methodology for more information on portfolio construction.
0% 5% 10% 15% 20%
Financials
Information Technology
Industrials
Consumer Discretionary
Health Care
Consumer Staples
Energy
Materials
Utilities
Real Estate
Telecommunication Services
2°C Screening MSCI World
0% 10% 20% 30% 40% 50% 60%
United States
Japan
United Kingdom
France
Switzerland
Germany
Canada
Australia
Netherlands
Spain
Hong Kong
Sweden
Italy
Ireland
Denmark
2°C Screening MSCI World
6
Note: Top 15 countries account for 98% weight in the 2 °C screened portfolio and MSCI World. The figures are
calculated based on asset value as of 31.10.2017.
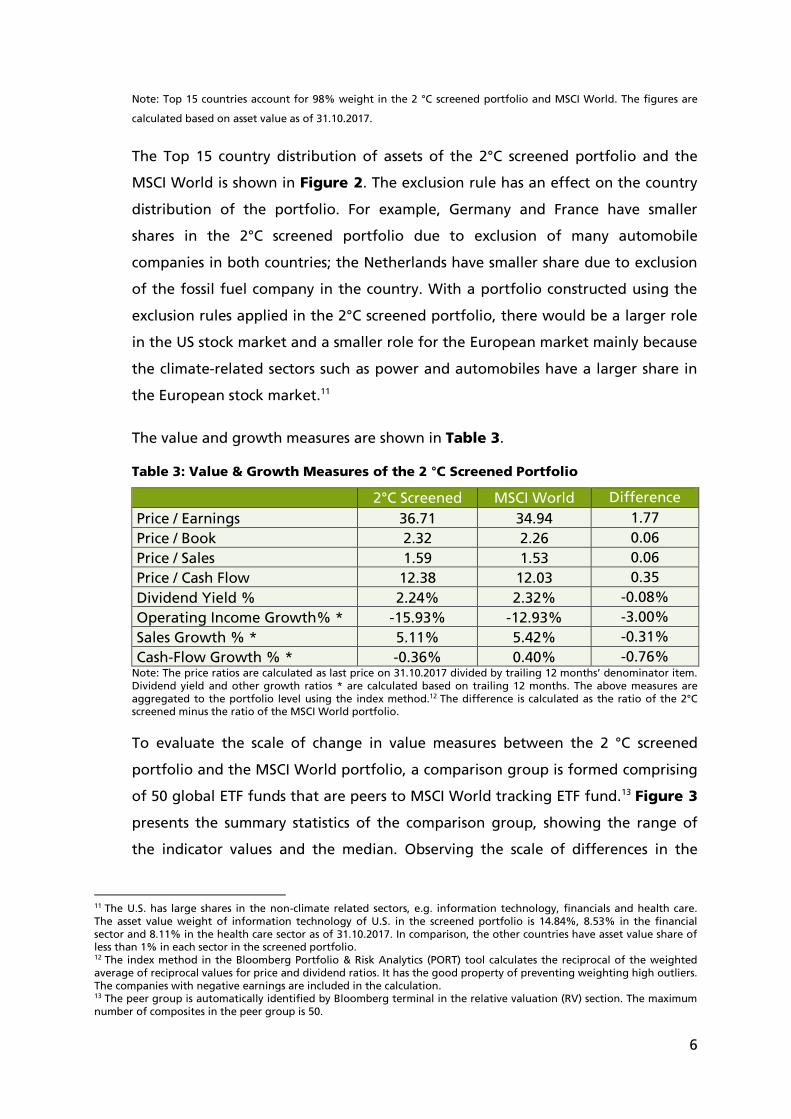
The Top 15 country distribution of assets of the 2°C screened portfolio and the
MSCI World is shown in Figure 2. The exclusion rule has an effect on the country
distribution of the portfolio. For example, Germany and France have smaller
shares in the 2°C screened portfolio due to exclusion of many automobile
companies in both countries; the Netherlands have smaller share due to exclusion
of the fossil fuel company in the country. With a portfolio constructed using the
exclusion rules applied in the 2°C screened portfolio, there would be a larger role
in the US stock market and a smaller role for the European market mainly because
the climate-related sectors such as power and automobiles have a larger share in
the European stock market.11
The value and growth measures are shown in Table 3.
Table 3: Value & Growth Measures of the 2 °C Screened Portfolio
2°C Screened MSCI World Difference
Price / Earnings 36.71 34.94 1.77
Price / Book 2.32 2.26 0.06
Price / Sales 1.59 1.53 0.06
Price / Cash Flow 12.38 12.03 0.35
Dividend Yield % 2.24% 2.32% -0.08%
Operating Income Growth% * -15.93% -12.93% -3.00%
Sales Growth % * 5.11% 5.42% -0.31%
Cash-Flow Growth % * -0.36% 0.40% -0.76% Note: The price ratios are calculated as last price on 31.10.2017 divided by trailing 12 months’ denominator item.
Dividend yield and other growth ratios * are calculated based on trailing 12 months. The above measures are
aggregated to the portfolio level using the index method.12 The difference is calculated as the ratio of the 2°C screened minus the ratio of the MSCI World portfolio.
To evaluate the scale of change in value measures between the 2 °C screened
portfolio and the MSCI World portfolio, a comparison group is formed comprising
of 50 global ETF funds that are peers to MSCI World tracking ETF fund.13 Figure 3
presents the summary statistics of the comparison group, showing the range of
the indicator values and the median. Observing the scale of differences in the
11 The U.S. has large shares in the non-climate related sectors, e.g. information technology, financials and health care.
The asset value weight of information technology of U.S. in the screened portfolio is 14.84%, 8.53% in the financial
sector and 8.11% in the health care sector as of 31.10.2017. In comparison, the other countries have asset value share of less than 1% in each sector in the screened portfolio. 12 The index method in the Bloomberg Portfolio & Risk Analytics (PORT) tool calculates the reciprocal of the weighted
average of reciprocal values for price and dividend ratios. It has the good property of preventing weighting high outliers.
The companies with negative earnings are included in the calculation. 13 The peer group is automatically identified by Bloomberg terminal in the relative valuation (RV) section. The maximum
number of composites in the peer group is 50.

7
comparison group, it could be said that the difference in value measures between
the 2°C screened portfolio and the MSCI World portfolio is comparatively small.
Figure 3: Comparison Group Value Measures14
Note: The price ratios are calculated as last market value on 10.01.2018 divided by trailing 12 months’ denominator item.15 The fund P / E, P / B, P / S and P / CF ratios range from 13.91 to 72.73, 1.26 to 10, 0.56 to 9.63,
and 6.56 to 30.32 respectively. The fund dividend yield% ranges from 0.1% to 8.2% with median 2.3%.
RETURNS
Figure 4 compares the total return (%)16 of 2 °C screened portfolio and the
benchmark across the 5 - year period from 31.10.2012 to 31.10.2017. In the report,
transaction costs are assumed to be zero for the 2 °C screened portfolio. The
performance of the 2 °C screened portfolio closely tracks the MSCI World portfolio
benchmark across the period of evaluation. At the end of October 2017, the
period end total return is 149% for the 2 °C screened portfolio, and 144% for the
MSCI World portfolio benchmark. Thus, ignoring the risk profile, the 2 °C screened
portfolio slightly outperforms its benchmark. Suppose the investor has an initial
investment of $10.000 on 31.10.2012 invested in the 2 °C screened portfolio, the
initial investment would have given a total gain of $ 14.90017 if the portfolio is
14 Abbreviations: Price / Earnings (P / E), Price / Book (P / B), Price / Sales (P / S), Price / Cash Flow (P / CF), Dividend Yield
(Dvd Yield). In Bloomberg terminal, the Bloomberg fields are FUND_PE_RATIO, FUND_PB_RATIO,
FUND_AVG_PRICE_SALES_RATIO, FUND_AVG_PRICE_CASH_FLOW and FUND_AVG_DVD_YLD. 15 It is not possible to customize period for the fund aggregate value measures. 16 Total return includes capital gains, dividends realized over a given period assuming all dividends received are
reinvested. It does not take into account any risk factor. 17 The assumptions behind total return % calculation: No transaction or tax costs; daily dividend information available. The total return index chart is calculated based on: Total Return Index at the End of the Period=Total Return Index at the
Beginning of the Period * (1 + Total Return Cumulative from the Beginning to the End of the Period). For more
-5
5
15
25
35
45
55
65
75
Price / Earnings Ratio Price to Book Ratio Price to Sales Ratio Price to Cash Flow Ratio
Median

8
bought on 31.10.2012 and sold on 31.10.2017 with distributions all reinvested. In
comparison with the same amount of initial investments invested in the MSCI
World portfolio benchmark, the investor could have expected a total gain of $
14.400.
Figure 4: Total Return (%) of the 2 °C Screened Portfolio
The historical mean returns of the 2 °C screened portfolio and MSCI World
portfolio benchmark are compared in Table 4. Investment period of medium-
term: 1 year, 3 years and 5 years are considered.18 Consistent with the result of the
analysis of the total return, the 2 °C screened portfolio would have outperformed
the MSCI World portfolio benchmark looking at periods 1 year, 3 years and 5
years.
Table 4: Historical Mean Returns (annualized): Medium-term
1 Year 3 Years 5 Years
2 °C screened portfolio 34.78% 14.11% 30.50%
MSCI World 34.62% 13.83% 29.75% Note: 1 year (31.10.2016-31.10.2017); 3 years (31.10.2014-31.10.2017); 5 years (31.10.2012-31.10.2017)
Quarterly total returns (%) for the 2 °C screened portfolio and the MSCI World
portfolio benchmark are presented in Figure 5. The 2 °C screened portfolio would
methodological information on total return index, please see Morningstar, 2011. Total Return Index, Morningstar
Methodology Paper, s.l.: s.n. 18 We do not report the short-term results on 3-month and 6-month period results because short-term changes are
volatile.
-20%
0%
20%
40%
60%
80%
100%
120%
140%
160%
31.1
0.2
012
31.1
2.2
012
28.0
2.2
013
30.0
4.2
013
30.0
6.2
013
31.0
8.2
013
31.1
0.2
013
31.1
2.2
013
28.0
2.2
014
30.0
4.2
014
30.0
6.2
014
31.0
8.2
014
31.1
0.2
014
31.1
2.2
014
28.0
2.2
015
30.0
4.2
015
30.0
6.2
015
31.0
8.2
015
31.1
0.2
015
31.1
2.2
015
29.0
2.2
016
30.0
4.2
016
30.0
6.2
016
31.0
8.2
016
31.1
0.2
016
31.1
2.2
016
28.0
2.2
017
30.0
4.2
017
30.0
6.2
017
31.0
8.2
017
31.1
0.2
017
2 °C Screening MSCI World

9
have outperformed the benchmark in 12 out of 19 quarters. There were 3 quarters
in the period of 31.10.2012 to 31.10.2017 when the returns employing 2 °C
screened portfolio would have been negative. The strongest outperformance in
the back-test period would have been in the 1st Quarter of 2013. Looking at
different short-term time spans in the past, the 2 °C screened portfolio almost
consistently outperforms the benchmark.
Figure 5: Quarterly Total Returns Chart of the 2 °C Screened Portfolio
Note: The x-axis refers to the closing date of the quarterly period, e.g. 2013.03.29 refers to the 1st Quarter of
2013.
RISKS
The risks associated with the 2 °C screened portfolio compared with the MSCI
World portfolio benchmark are presented in Table 5. The annualized standard
deviation based on the daily returns in the assessed back-test period for the 2 °C
screened portfolio is about 9 basis points higher than the benchmark. The
skewness of the 2 °C screened portfolio is 0.03, a right skewness below noticeable
skewness threshold.19 The beta of the 2 °C screened portfolio is 1.01, indicating
that the returns using the strategy have a high correlation with the benchmark
returns. Given a beta of 1.01, it means that the 2 °C screened portfolio returns on
19 Skewness describes the degree of asymmetry of the distribution of the daily return in a given period. A skewness value larger than 0.2 is used as a rule of thumb for noticeable skewness. See more in Hildebrand, K. D., 1986. Statistical
thinking for behavioural scientists, s.l.: Brooks/Cole.
-10.00%
-5.00%
0.00%
5.00%
10.00%
15.00%
20.00%
25.00%
30.00%
35.00%
40.00%
2013.0
3.2
9
2013.0
6.2
8
2013.0
9.3
0
2013.1
2.3
1
2014.0
3.3
1
2014.0
6.3
0
2014.0
9.3
0
2014.1
2.3
1
2015.0
3.3
1
2015.0
6.3
0
2015.0
9.3
0
2015.1
2.3
1
2016.0
3.3
1
2016.0
6.3
0
2016.0
9.3
0
2016.1
2.3
0
2017.0
3.3
1
2017.0
6.3
0
2017.0
9.2
9
2 °C screening portfolio MSCI World
10
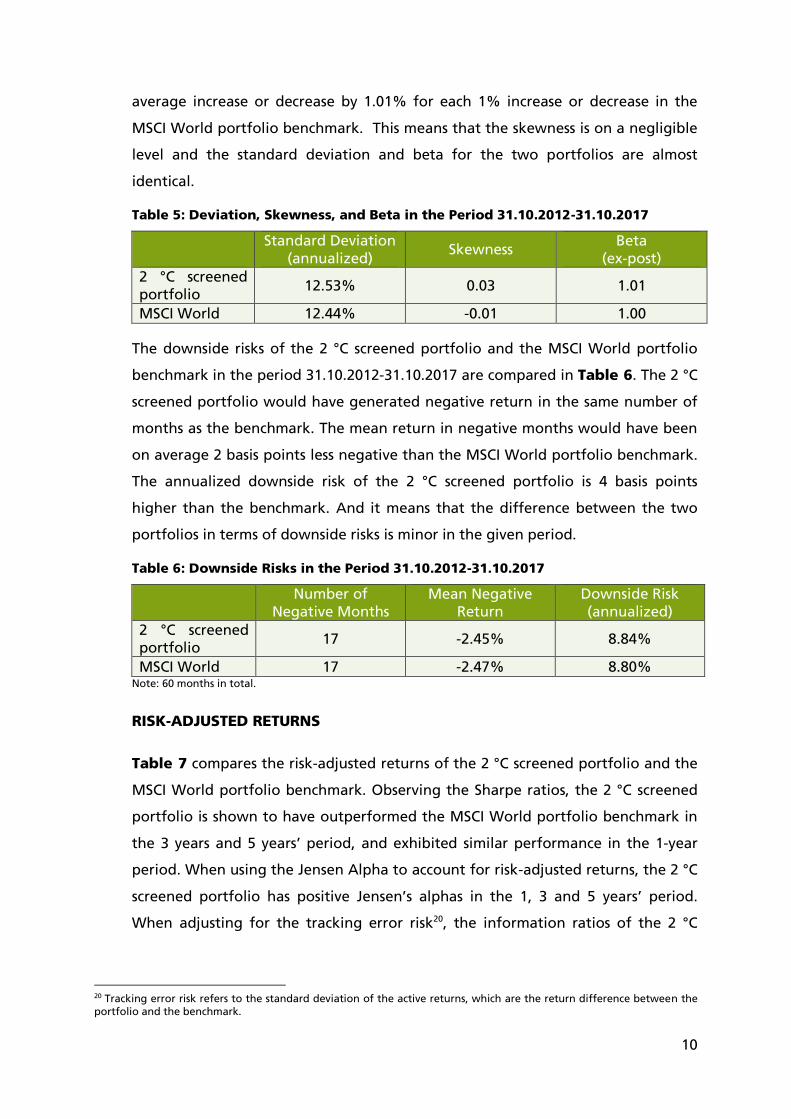
average increase or decrease by 1.01% for each 1% increase or decrease in the
MSCI World portfolio benchmark. This means that the skewness is on a negligible
level and the standard deviation and beta for the two portfolios are almost
identical.
Table 5: Deviation, Skewness, and Beta in the Period 31.10.2012-31.10.2017
Standard Deviation
(annualized) Skewness
Beta
(ex-post)
2 °C screened
portfolio 12.53% 0.03 1.01
MSCI World 12.44% -0.01 1.00
The downside risks of the 2 °C screened portfolio and the MSCI World portfolio
benchmark in the period 31.10.2012-31.10.2017 are compared in Table 6. The 2 °C
screened portfolio would have generated negative return in the same number of
months as the benchmark. The mean return in negative months would have been
on average 2 basis points less negative than the MSCI World portfolio benchmark.
The annualized downside risk of the 2 °C screened portfolio is 4 basis points
higher than the benchmark. And it means that the difference between the two
portfolios in terms of downside risks is minor in the given period.
Table 6: Downside Risks in the Period 31.10.2012-31.10.2017
Number of
Negative Months
Mean Negative
Return
Downside Risk
(annualized)
2 °C screened
portfolio 17 -2.45% 8.84%
MSCI World 17 -2.47% 8.80% Note: 60 months in total.
RISK-ADJUSTED RETURNS
Table 7 compares the risk-adjusted returns of the 2 °C screened portfolio and the
MSCI World portfolio benchmark. Observing the Sharpe ratios, the 2 °C screened
portfolio is shown to have outperformed the MSCI World portfolio benchmark in
the 3 years and 5 years’ period, and exhibited similar performance in the 1-year
period. When using the Jensen Alpha to account for risk-adjusted returns, the 2 °C
screened portfolio has positive Jensen’s alphas in the 1, 3 and 5 years’ period.
When adjusting for the tracking error risk20, the information ratios of the 2 °C
20 Tracking error risk refers to the standard deviation of the active returns, which are the return difference between the
portfolio and the benchmark.

11
screened portfolio are positive in the 1, 3 and 5-year period.21 Consistent with the
quarterly returns in Figure 5, the 2 °C screened portfolio seems to consistently
over-perform the benchmark in the given period.
Table 7: Risk-Adjusted Returns of the 2 °C Screened Portfolio
Sharpe Ratio
(2 °C screened)
Sharpe Ratio
(benchmark)
Jensen
Alpha22
Information
Ratio23
1 Year 3.63 3.63
0.01
0.35
3 Years 0.84 0.82
0.23
0.48
5 Years 1.66 1.63
0.37
1.10 Note: 1 year (31.10.2016-31.10.2017); 3 years (31.10.2014-31.10.2017); 5 years (31.10.2012-31.10.2017)
Figure 6: Comparison Group Fund Sharpe Ratios
Note: The Fund Sharpe ratio is calculated based on gross monthly returns on a trailing basis. The trailing end date
is 10.01.2018.24 The ranges of the Sharpe ratio in 1 year, 3 years and 3 years are 0.42 to 8.24, -0.24 to 1.13 and
0.02 to 1.25 respectively.
The Sharpe ratios in 1-year, 3-year and 5-year period in the comparison group as
discussed in the value & growth measures above are shown in Figure 6. Observing
the scale of differences in the comparison group, it could be again said that the
difference between the Sharpe ratios of the two portfolios is small. In particular,
21 A rule of thumb suggests that information ratio higher than 0.5 is considered to be good. See more in Goodwin, T. H.,
1998. The information ratio. Financial Analysts Journal, 54(4), pp. 34-43. 22 The Jensen alpha calculates the actual return of the portfolio above the return indicated by the Capital Asset Pricing Model (CAPM). It is calculated as „return of the portfolio – [(risk free rate + beta * (return of the benchmark – risk free
rate)]“. The returns are annualized mean of daily returns. 23 The information ratio calculates the excess return over the benchmark per unit of tracking error volatility. It is
calculated as „ annualized mean excess return / annualized tracking error“. It measures the consistency with which the portfolio is beating the benchmark. 24 It is not possible to customize period for the fund Sharpe ratio.
-1
0
1
2
3
4
5
6
7
8
9
Sharpe Ratio (1 year) Sharpe Ratio (3 years) Sharpe Ratio (5 years)
Median

12
the 2 °C screened portfolio outperforms the MSCI World portfolio in the 3-year
and 5-year period on a small scale.
Taking the above ratios into consideration, the risk-adjusted returns generated by
the 2 °C screened portfolio is more favourable in 3 years and 5 years’ time frames
in the back-testing period compared to the MSCI World portfolio benchmark.
SUMMARY
The 2 °C screened portfolio would have generated an annualized mean return of
30.50% in the period 31.10.2012-31.10.2017, while the MSCI World portfolio
benchmark would have generated an annualized mean return of 29.73% in the
same period.25 The 2 °C screened portfolio has slightly higher risks (9 basis points
higher in standard deviation and 4 basis points higher in downside risk) than the
MSCI World portfolio benchmark. The risk-adjusted returns that would have
generated by the 2 °C screened portfolio are more favourable in the 3-year and 5-
year time frames in comparison to the benchmark in the back-testing period.
In the back-testing period 31.10.2012-31.10.2017, there is no observed trade-off
between climate impacts and risk-adjusted returns. The 2 °C screened portfolio
shows similar performance in the 1-year period, and better performance
compared to the benchmark in the 3-year and 5-year periods on a small scale.
In total, results indicate that the difference between risk / return profile of the 2
°C screened portfolio and the benchmark are rather marginal. Based on this
empirical analysis, it could be confirmed that there are measures to make a
portfolio substantially more consistent with (2 °C target) which do not come at the
cost of a significant less attractive risk-return profile.
25 Comparing total return% in the period 31.10.2012-31.10.2017, it is 149% (2 °C screened) to 144% (benchmark).

13
3. BACK-TESTING THE HIGH-CARBON PORTFOLIO
THE HIGH-CARBON PORTFOLIO
The high-carbon portfolio is a fictional portfolio that allocates 100% of its
portfolio assets in the asset class: equity. The portfolio consists of the 6 fossil fuel
company stocks, 25 power company stocks and 23 automotive company stocks
which are excluded from the MSCI World portfolio described in Chapter 2 to form
the 2 °C screened portfolio.26
The high-carbon portfolio consists of 54 stocks. It has a total asset value of $ 55.46
million as of 31.10.2017. The high-carbon portfolio is assumed to be a fixed
portfolio that an investor holds continuously across the back-testing period
without rebalance (31.10.2012 – 31.10.2017). The MSCI World portfolio as
described in the last chapter is used as back-testing benchmark. The Bloomberg
Risks & Portfolio Analytics tool is used to analyse the high-carbon portfolio’s
returns over the medium term (5 years) and the risk-adjusted return of the high-
carbon portfolio against the benchmark MSCI World portfolio.
CHARACTERISTICS
Table 8 shows the top 15 holdings of the high-carbon portfolio and the MSCI
World portfolio. The top 15 holdings in the two portfolios are completely
different, which is a direct result of the exclusion rule. In addition, the high-carbon
portfolio exhibits higher concentration in top holdings than the high-carbon
portfolio, with Top 15 holdings comprising 72% of the total assets in the portfolio.
Table 8: Top 15 Holdings of the High-carbon Portfolio
High-carbon portfolio MSCI World
CHEVRON CORP 13.18% APPLE INC 2.44%
ROYAL DUTCH SHELL PLC-B
SHS 7.55%
MICROSOFT CORP 1.61%
BP PLC 7.35% AMAZON.COM INC 1.11%
ROYAL DUTCH SHELL PLC-A
SHS 7.31%
FACEBOOK INC-A 0.98%
TOTAL SA 7.19% JOHNSON & JOHNSON 0.98%
DAIMLER AG-REGISTERED
SHARES 4.85%
JPMORGAN CHASE & CO 0.96%
26 Please see Annex 2: Methodology for more information on portfolio construction.

14
GENERAL MOTORS CO 3.69% EXXON MOBIL CORP 0.89%
DUKE ENERGY CORP 3.63% ALPHABET INC-CL C 0.80%
HONDA MOTOR CO LTD 3.01% ALPHABET INC-CL A 0.76%
SOUTHERN CO/THE 2.84% BANK OF AMERICA CORP 0.73%
FORD MOTOR CO 2.71% WELLS FARGO & CO 0.71%
ENI SPA 2.46% NESTLE SA-REG 0.68%
AMERICAN ELECTRIC
POWER 2.17%
PROCTER & GAMBLE CO/THE 0.60%
BAYERISCHE MOTOREN
WERKE AG 2.02%
CITIGROUP INC 0.57%
VOLKSWAGEN AG-PREF 1.98% PFIZER INC 0.56%
Total 71.93% Total 14.38% Note: The figures are calculated based on asset value as of 31.10.2017.
The sectorial distribution of the high-carbon portfolio and MSCI World portfolio is
presented in Figure 7. The high-carbon portfolio is distributed in the following
three categories: power (in the utilities sector in Figure 7), fossil fuels (in the
energy sector), and automobile (in the consumer discretionary and industrials
sectors). The energy sector has the majority share with 46% asset value in the
portfolio, followed by 29% in the consumer discretionary sector and 24% in the
utilities sector.
Figure 7: Sectorial Distribution of the High-carbon Portfolio vs. MSCI World
Note: Sector classification based on GICS sectors. The figures are calculated based on asset value as of 31.10.2017.
The Top 10 country distribution of assets of the high-carbon portfolio and the
MSCI World is shown in Figure 8. The high-carbon portfolio has assets allocated
0% 10% 20% 30% 40% 50%
Financials
Information Technology
Industrials
Consumer Discretionary
Health Care
Consumer Staples
Energy
Materials
Utilities
Real Estate
Telecommunication Services
Differential portfolio MSCI World

15
exclusively in the United States, the Netherlands, Germany, Japan, United
Kingdom, France, Italy, Hong Kong, Canada and Australia.27 The top 3 countries
are United States with 41% of asset value, the Netherlands with 15% and
Germany with 10% asset value in the portfolio.
Figure 8: Top 10 Country Distribution of the High-carbon Portfolio vs. MSCI World
Note: Top 10 countries account for 100% weight in the high-carbon portfolio and 90% weight in the MSCI World.
The figures are calculated based on asset value as of 31.10.2017.
The value and growth measures are shown in Table 9.
Table 9: Value & Growth Measures of the High-carbon Portfolio
High-carbon
Portfolio MSCI World Difference
Price / Earnings 16.55 34.94 -18.39
Price / Book 1.39 2.26 -0.87
Price / Sales 0.79 1.53 -0.74
Price / Cash Flow 7.46 12.03 -4.57
Dividend Yield % 4.16% 2.32% 1.84%
Operating Income Growth% * 88.34% -12.93% 101.27%
Sales Growth % * 9.08% 5.42% 3.66%
Cash-Flow Growth % * 10.68% 0.40% 10.28% Note: The price ratios are calculated as last price on 31.10.2017 divided by trailing 12 months’ denominator item.
Dividend yield and other growth ratios * are calculated based on trailing 12 months. The above measures are
aggregated to the portfolio level using the index method. The difference is calculated as the ratio of the 2°C
screened minus the ratio of the MSCI World portfolio.
27 The country list is ranked / ordered from the highest share of asset value to the least share of asset value in the
portfolio.
0% 10% 20% 30% 40% 50% 60%
United States
Japan
United Kingdom
France
Germany
Canada
Australia
Netherlands
Hong Kong
Italy
Differential portfolio MSCI World

16
RETURNS
Figure 9 compares the total return (%) of high-carbon portfolio and the
benchmark across 5-year period from 31.10.2012 to 31.10.2017. In this analysis,
transaction costs are assumed to be zero for the high-carbon portfolio. The
performance of the high-carbon portfolio differs largely from the MSCI World
portfolio across the period of evaluation. At the end of October 2017, the period
end total return is 43% for the high-carbon portfolio, and 144% for the MSCI
World portfolio. Thus, the high-carbon portfolio importantly underperforms
compared to the benchmark.
Suppose the investor has an initial investment of $10.000 on 31.10.2012 invested
in the high-carbon portfolio, the initial investment would have given a total gain
of $ 4.300 on 31.10.2017 after holding it across the 5 years’ periods. In comparison
with the same amount of initial investments invested in the MSCI World portfolio
benchmark, the investor could have expected a total gain of $ 14.400.
Figure 9: Total Return (%) of the High-carbon Portfolio
The historical mean returns of the high-carbon portfolio and MSCI World portfolio
are compared in Table 10. Investment period of medium-term: 1 year, 3 years and
5 years are considered. The high-carbon portfolio would have underperformed the
benchmark in all periods.
Table 10: Historical Mean Returns (annualized): Medium-term
-20%
0%
20%
40%
60%
80%
100%
120%
140%
160%
31.1
0.2
012
31.1
2.2
012
28.0
2.2
013
30.0
4.2
013
30.0
6.2
013
31.0
8.2
013
31.1
0.2
013
31.1
2.2
013
28.0
2.2
014
30.0
4.2
014
30.0
6.2
014
31.0
8.2
014
31.1
0.2
014
31.1
2.2
014
28.0
2.2
015
30.0
4.2
015
30.0
6.2
015
31.0
8.2
015
31.1
0.2
015
31.1
2.2
015
29.0
2.2
016
30.0
4.2
016
30.0
6.2
016
31.0
8.2
016
31.1
0.2
016
31.1
2.2
016
28.0
2.2
017
30.0
4.2
017
30.0
6.2
017
31.0
8.2
017
31.1
0.2
017
Differential portfolio MSCI World

17
1 Year 3 Years 5 Years
High-carbon Portfolio 31.64% 8.57% 11.79%
MSCI World 34.62% 13.83% 29.75% Note: 1 year (31.10.2016-31.10.2017); 3 years (31.10.2014-31.10.2017); 5 years (31.10.2012-31.10.2017)
The quarterly returns for the high-carbon portfolio and the MSCI World portfolio
benchmark are presented in Figure 10. The high-carbon portfolio would have
outperformed the benchmark in 7 out of 19 quarters. There were 6 quarters in the
period of 31.10.2012-31.10.2017 when the returns employing the high-carbon
portfolio would have been negative. The strongest outperformance in the back-
test period would have been the 4th Quarter of 2016.
Figure 10: Quarterly Total Returns Chart of the High-carbon Portfolio
Note: The x-axis refers to the closing date of the quarterly period, e.g. 2013.03.29 refers to the 1st Quarter of
2013.
RISKS
The risks associated with the high-carbon portfolio compared with the MSCI World
portfolio benchmark are presented in Table 11. The annualized standard
deviation based on the daily returns in the assessed back-test period for the high-
carbon portfolio is about 76 basis points higher than the benchmark. The
-15.00%
-5.00%
5.00%
15.00%
25.00%
35.00%
2013.0
3.2
9
2013.0
6.2
8
2013.0
9.3
0
2013.1
2.3
1
2014.0
3.3
1
2014.0
6.3
0
2014.0
9.3
0
2014.1
2.3
1
2015.0
3.3
1
2015.0
6.3
0
2015.0
9.3
0
2015.1
2.3
1
2016.0
3.3
1
2016.0
6.3
0
2016.0
9.3
0
2016.1
2.3
0
2017.0
3.3
1
2017.0
6.3
0
2017.0
9.2
9
The Differential Portfolio MSCI World

18
skewness of the high-carbon portfolio is -0.53, a left skewness above noticeable
skewness threshold.28
The beta of the high-carbon portfolio is 0.76, indicating that the returns using the
strategy have a relatively high correlation with the benchmark returns. Given a
beta of 0.76, it means that the high-carbon portfolio returns on average increase
or decrease by 0.76% for each 1% increase or decrease in the MSCI World
portfolio benchmark.
Table 11: Deviation, Skewness, and Beta in the Period 31.10.2012-31.10.2017
Standard Deviation
(annualized) Skewness
Beta
(ex-post)
High-carbon
Portfolio 13.20% -0.53 0.76
MSCI World 12.44% -0.01 1.00
The downside risks of the high-carbon portfolio and the MSCI World portfolio
benchmark in the period 31.10.2012-31.10.2017 are compared in Table 12. The
high-carbon portfolio would have generated 25 compared with 17 negative
returns in months. The mean return in negative months would have been 15 basis
points more negative than the MSCI World portfolio benchmark.
The annualized downside risk of the high-carbon portfolio is 92 basis points
higher than the benchmark.
Table 12: Downside Risks in the Period 31.10.2012-31.10.2017
Number of
Negative Months
Mean Negative
Return
Downside Risk
(annualized)
High-carbon
Portfolio 25 -2.62% 9.72%
MSCI World 17 -2.47% 8.80% Note: 60 months in total.
RISK-ADJUSTED RETURNS
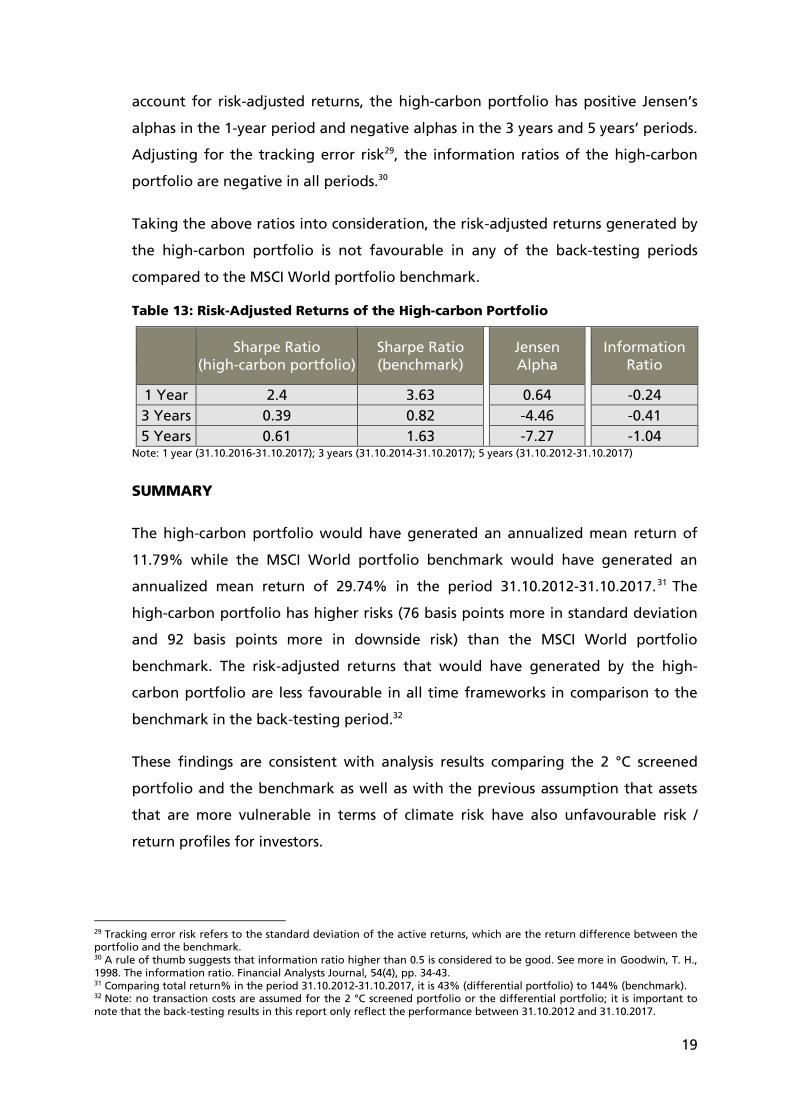
Table 13 compares the risk-adjusted returns of the high-carbon portfolio and the
MSCI World portfolio benchmark. Observing the Sharpe ratios, the high-carbon
portfolio is shown to have underperformed the MSCI World portfolio benchmark
in the 1 year, 3 years and 5 years’ periods. When using the Jensen’s Alpha to
28 Skewness describes the degree of asymmetry of the distribution of the daily return in a given period. A skewness value larger than 0.2 is used as a rule of thumb for noticeable skewness. See more in Hildebrand, K. D., 1986. Statistical
thinking for behavioural scientists, s.l.: Brooks/Cole.
19
account for risk-adjusted returns, the high-carbon portfolio has positive Jensen’s
alphas in the 1-year period and negative alphas in the 3 years and 5 years’ periods.
Adjusting for the tracking error risk29, the information ratios of the high-carbon
portfolio are negative in all periods.30
Taking the above ratios into consideration, the risk-adjusted returns generated by
the high-carbon portfolio is not favourable in any of the back-testing periods
compared to the MSCI World portfolio benchmark.
Table 13: Risk-Adjusted Returns of the High-carbon Portfolio
Sharpe Ratio
(high-carbon portfolio)
Sharpe Ratio
(benchmark)
Jensen
Alpha
Information
Ratio
1 Year 2.4 3.63 0.64 -0.24
3 Years 0.39 0.82 -4.46 -0.41
5 Years 0.61 1.63 -7.27 -1.04 Note: 1 year (31.10.2016-31.10.2017); 3 years (31.10.2014-31.10.2017); 5 years (31.10.2012-31.10.2017)
SUMMARY
The high-carbon portfolio would have generated an annualized mean return of
11.79% while the MSCI World portfolio benchmark would have generated an
annualized mean return of 29.74% in the period 31.10.2012-31.10.2017.31 The
high-carbon portfolio has higher risks (76 basis points more in standard deviation
and 92 basis points more in downside risk) than the MSCI World portfolio
benchmark. The risk-adjusted returns that would have generated by the high-
carbon portfolio are less favourable in all time frameworks in comparison to the
benchmark in the back-testing period.32
These findings are consistent with analysis results comparing the 2 °C screened
portfolio and the benchmark as well as with the previous assumption that assets
that are more vulnerable in terms of climate risk have also unfavourable risk /
return profiles for investors.
29 Tracking error risk refers to the standard deviation of the active returns, which are the return difference between the portfolio and the benchmark. 30 A rule of thumb suggests that information ratio higher than 0.5 is considered to be good. See more in Goodwin, T. H.,
1998. The information ratio. Financial Analysts Journal, 54(4), pp. 34-43. 31 Comparing total return% in the period 31.10.2012-31.10.2017, it is 43% (differential portfolio) to 144% (benchmark). 32 Note: no transaction costs are assumed for the 2 °C screened portfolio or the differential portfolio; it is important to
note that the back-testing results in this report only reflect the performance between 31.10.2012 and 31.10.2017.

20
4. CONCLUSION AND OUTLOOK
Portfolio performance has two aspects, namely the portfolio manager’s ability to
increase portfolio return via future security price prediction, and the portfolio
manager’s ability to minimize the insurable risk born by the portfolio holders.33 In
this report, we neglect the first aspect and solely investigate how the risk / return
profile of a portfolio changes if it is consistent with a 2 °C scenario in one
particular way.34
Consistent with prior research on similar topics 35 that analysed green or
environmental friendly portfolios, the results of this report reveal basically two
major findings. First, a portfolio example which is more consistent with a 2 °C
pathway has a similar risk / return profile as the conventional benchmark. It is
even indicated that the portfolio slightly outperforms the benchmark while
showing nearly identical values across different risk indicators.36 As a consequence,
there is hope that 2 °C compatible or green investments would become
mainstream investment practices. Results indicate that such investments are not
necessarily riskier or less profitable as frequently proclaimed in public.
Second, industries extremely vulnerable to a 2 °C transition already today
underperform the conventional benchmark. Further research is required to verify
to what extent this underperformance is related to the material environmental
risk associated to these assets. Accordingly, the part of the portfolio in the original
portfolio that has been selected out in the screening process (which is particularly
33 Jensen, M. C., 1968. The performance of mutual funds in the period 1945–1964. The Journal of finance, 23(2), pp. 389-
416. 34 Namely by selection based on the methodology detailed in Annex 2 35 There is currently no other comparable literature that compares the performance of 2 °C compatible portfolios with conventional benchmarks because constructing 2 °C compatible portfolios is a relatively new trend. Nevertheless, we
found some literature on the similar topics: Cohen, Fenn & Konar (1997) finds either no penalty for green portfolio or a
positive return from investing in green. A study by Climent & Soriano (2011) focuses exclusively on the performance of
environmental funds. In their study, a matched-pair analysis with Carhart (1997) four-factor model shows that environmental funds underperformed conventional funds in the period 1987-2009, but then the environmental funds
caught up and achieved adjusted returns not different from the conventional mutual funds in 2001-2009. Sources:
Cohen, M. A., Fenn, S. A. & Konar, S., 1997. Environmental and Financial performance: are they related, mimeo, s.l.: s.n. Climent, F. & Pilar, S., 2011. Green and good? The investment performance of US environmental mutual funds. Journal of
Business Ethics, pp. 275-287. And Carhart, M. M., 1997. On persistence in mutual fund performance. The Journal of
finance, 52(1), pp. 57-82. 36 The results could be further contextualized in the general literature on divestment. According to Ritchie & Dowlatabadi (2015), there may be substantial investment risks in investing in conventional energy companies subject to
changes in climate policies and market conditions. This is an important economic argument for divestment. Among
others, index data providers such as MSCI, FTSE, and S&P Global offer fossil fuel free indexes to benchmark the
performance of companies that do not have fossil fuel reserves in the respective investment universe. Source: Ritchie, J. & Dowlatabadi, H., 2015. Fossil Fuel Divestment: Reviewing Arguments, Implications & Policy Opportunities, s.l.: University
of British Columbia.

21
incompatible with a 2 °C target) does not perform better than the benchmark; in
fact it performs worse in our example. Further research could look into the sub-
sectors within the high-carbon portfolio (power, fossil fuel and automobile
sectors). In particular, there might be various factors driving the performance such
as the oil price. Oil price shocks should explain about 6% of the volatilities in the
stock returns.37 However, the interaction between oil price fluctuations and stock
market is complex. Sectorial differences responding to the oil price fluctuations
exist. The sector stock indices respond to the changes in oil prices with temporary
heterogeneities but the heterogeneities do not persist across time. 38 The
relationship between oil price fluctuation and the mid- to long-term stock
performance of high carbon sectors could be further studied to gain more insights
in the driving factors in the high-carbon portfolio performance.
As with all empirical studies, the analysis presented in this report is subject to a
number of limitations. We analysed a stylized 2 °C portfolio which is constructed
based on selection only. Looking forward, future work could focus on the risk and
return characteristics of various stylized 2 °C portfolios. 2 °C portfolios are not
unique and there are different portfolio construction methods that could align
portfolios with a 2 °C transition pathway by sector. Complete divestment may not
be realisable for all investors. Given the different needs of various types of
investors, it is of value to construct and test 2 °C portfolios that have a mixture of
screened rules and reweighting and match different stylized 2 °C portfolios with
investor types.39
Furthermore, this research was limited to the use of the standard Bloomberg Risk
& Portfolio Analytics tool in order to produce a piece of applied science. The
application of different analytical tools commonly used in academic research could
be considered to refine the results. One major challenge was signified by the
unavailability of an environmental risk factor within Bloomberg terminal tool that
would allow us to also compare the individual risk factors to each other.
37 Park, J. & Ratti, R. A., 2008. Oil price shocks and stock markets in the US and 13 European countries. Energy economics,
30(5), pp. 2587-2608. 38 Huang, S., An, H., Huang, X. & Wang, Y., 2017. Do all sectors respond to oil price shocks simultaneously?. Applied
Energy. 39 With regard to constructing stylized 2 °C portfolios, it could be achieved via 100% screened, via 100% reweighting,
and via mixed approach (e.g. 𝛼% via reweighting and 1- 𝛼% via screened).

22
This report examined just one portfolio that claims to be more consistent with a
long-term sustainable path (namely the 2 °C screened portfolio). There are many
different ways to construct such a more consistent portfolio. For example, one
could use not only avoiding investment in high carbon assets, but also selecting
firms which are expected to benefit from a 2 °C compatible pathway. This report
does not claim that all of the 2 °C compatible portfolios come at insignificant extra
cost or risk. What it does suggest, however, is that there is a way to substantially
improve the 2 °C compatibility of the benchmark at insignificant (or in fact
negative) costs in terms of risk and return.

23
5. BIBLIOGRAPHY
Carhart, M. M., 1997. On persistence in mutual fund performance. The Journal of
finance, 52(1), pp. 57-82.
Climent, F. & Pilar, S., 2011. Green and good? The investment performance of US
environmental mutual funds. Journal of Business Ethics, pp. 275-287.
Cohen, M. A., Fenn, S. A. & Konar, S., 1997. Environmental and Financial
performance: are they related, mimeo, s.l.: s.n.
Goodwin, T. H., 1998. The information ratio. Financial Analysts Journal, 54(4), pp.
34-43.
Hildebrand, K. D., 1986. Statistical thinking for behavioral scientists, s.l.:
Brooks/Cole.
Huang, S., An, H., Huang, X. & Wang, Y., 2017. Do all sectors respond to oil price
shocks simultaneously?. Applied Energy.
Jensen, M. C., 1968. The performance of mutual funds in the period 1945–1964.
The Journal of finance, 23(2), pp. 389-416.
Lebada, A. M., 2017. Financial Centers, Social Enterprise World Forum Launch New
Initiatives on Sustainable Finance. [Online]
Available at: http://sdg.iisd.org/news/financial-centers-social-enterprise-world-
forum-launch-new-initiatives-on-sustainable-finance/
Morningstar, 2011. Total Return Index, Morningstar Methodology Paper, s.l.: s.n.
Park, J. & Ratti, R. A., 2008. Oil price shocks and stock markets in the US and 13
European countries. Energy economics, 30(5), pp. 2587-2608.
Ritchie, J. & Dowlatabadi, H., 2015. Fossil Fuel Divestment: Reviewing Arguments,
Implications & Policy Opportunities, s.l.: University of British Columbia.
United Nations Environment Programme, 2017. Accelerating Financial Centre
Action on Sustainable Development: How International Cooperation can Scale Up
Green and Sustainable Finance, Switzerland: UN Environment.

24
Annex 1: Climate Impact of the 2°C
Portfolio
The 2 °C screened portfolio is sectorial compatible with a 2 °C pathway indicated
by the IEA roadmaps.40 More concretely, it means that the sectorial production in
the portfolio matches that of the 2 °C compatible sectorial production (consistent).
This section illustrates the methodology behind exposure and consistency
calculation by sub-sectors in the investment portfolios. In addition, an aggregate
climate impact indicator is developed to approximately measure the climate
impact differences between the 2 °C screened portfolio and the MSCI World
portfolio.
Box i shows the mathematical formulation on the 2 °C portfolio exposure and
consistency calculation.
Box i: 2 °C Portfolio Exposure and Consistency Calculation
2 °C PORTFOLIO EXPOSURE CALCULATION
The main assumptions of the 2 °C portfolio exposure calculation are 1) Fair
share approach: the economic entity is responsible for the percentage of the
market share it has in the build-out/retirement of green/brown productions. 2)
Starting point of the benchmark is adjusted to the current market mix to correct
the laggard in the listed equity market.
Exposure (in %) =PPortfolio − P2°C−Consistent
P2°C−Consistent
PPortfolio = Production of the portfolio
P2°C−Consistent = Production needed under a 2°C transition41
2 °C PORTFOLIO CONSISTENCY CALCULATION
The 2°C portfolio consistency is equal to a technology exposure of 0%. The
consistency is thus calculated as follows where high-carbon and carbon-
40 The exception is the automobile sector (sub-sector hybrid, electric and ICE) where under the restriction of owning 2%
as maximum in the screened rule, it is not possible to bring the consistency to 100% for each sub-sector.

25
intensive technologies need to be treated separately:
For low − carbon technologies: 𝐴𝑙𝑖𝑔𝑛𝑚𝑒𝑛𝑡 = 𝐸𝑥𝑝𝑜𝑠𝑢𝑟𝑒 + 1
For carbon − intensive technologies: 𝐴𝑙𝑖𝑔𝑛𝑚𝑒𝑛𝑡 = 1 − 𝐸𝑥𝑝𝑜𝑠𝑢𝑟𝑒
High-carbon technologies include renewables, hydro, nuclear in the power
sector, hybrid and electric autos in the automotive sector. Carbon intensive
technologies include gas, coal in the power sector, Internal Combustion Engine
(ICE) in the automotive sector, and coal, gas, oil production in the fossil fuel
sector.
Table i: Technology Share and Consistency to a 2 °C Pathway by Sub-
sector
Sector Sub-sector Tech
Share (1)
Consistenc
y (1)
Tech Share
(2)
Consistenc
y (2)
Consistenc
y
Difference
Utility
Power
Renewables 18% 107.80% 11.5% 67.20% 40.60%
Hydro 16% 145.10% 11.5% 100.90% 44.20%
Nuclear 10% 113.00% 10.2% 117.50% -4.50%
Gas 38% 101.00% 42.0% 93.60% 7.40%
Coal 17% 121.10% 24.7% 91.20% 29.90%
Auto
Electric 1% 52.70%* 0.4% 22.80% 29.90%
Hybrid 13% 90.70%* 4.5% 31.20% 59.50%
ICE 86% 95.80%* 95.1% 80.70% 15.10%
Fossil
Fuels
Gas
Production 40% 127.20% 43% 73.50% 53.70%
Oil
Production 42% 127.10% 47% 69.00% 58.10%
Coal
Production 18% 142.80% 10% 140.70% 2.10%
Source: Data provided by 2 Degree Investing Initiative. “(1)” refers to the 2 °C screened portfolio and “(2)” refers
to the MSCI World portfolio. * Exceptions in the automobile sector under the restriction of owning 2% as
maximum in the screened rule. High-carbon technologies are marked green and carbon intensive technologies
are marked grey.
Consistency value < 100 % means under-consistency (the portfolio is not consistent with the 2 °C climate target in
the sector). Consistency value ≥ 100% means the portfolio is consistent with the 2 °C climate target in this sector
(100 % means exact consistency and >100% implies over-consistency).
Table i above shows the technology share and consistency to a 2 °C pathway by
sub-sector. The environmental impacts difference between the 2 °C screened
portfolio and the MSCI World portfolio by sector is calculated with the formula:
41 Using the IEA 450S scenario and the current market production mix/intensity scaled to the portfolio size.

26
Δ𝐴𝑙𝑖𝑔𝑛𝑚𝑒𝑛𝑡 = 𝐴𝑙𝑖𝑔𝑛𝑚𝑒𝑛𝑡𝑆𝑐𝑟𝑒𝑒𝑛𝑖𝑛𝑔– 𝐴𝑙𝑖𝑔𝑛𝑚𝑒𝑛𝑡𝑀𝑆𝐶𝐼 . 42 The column “consistency
difference” shows that in the large majority of the sub-sectors, the 2 °C screened
portfolio is more consistent with the 2°C climate target than the MSCI World
portfolio. For example, the 2 °C screened portfolio is 59.5% more consistent with
the 2°C climate target in the hybrid automobiles.43 And it is 58.1% more consistent
with the 2°C climate target in the oil production than the MSCI World portfolio.
An aggregate climate impact indicator for each portfolio can be calculated using a
weighted technology share approach. The sub-sectors within a sector have the
same unit count, which makes it possible to use production data to calculate the
technology share of each sub-sector within the sector.44 For example, in the utility
power sector there are five sub-sectors: renewables, hydro, nuclear, gas and coal,
whose production has the unit, kilowatt hour (kWh). The technology share data
for both portfolios are shown in Table i columns “Tech Share (1)” and “Tech
Share (2)”. The consistency to a 2 °C pathway by sub-sector for both portfolios are
calculated based on the methodology illustrated in Box i and displayed in the
columns “Consistency (1)” and “Consistency (2)” in Table i. Using the technology
share as weight, the sector weighted average of consistency is calculated by
∑ 𝑇𝑒𝑐ℎ𝑛𝑜𝑙𝑜𝑔𝑦 𝑠ℎ𝑎𝑟𝑒𝑖 × 𝐴𝑙𝑖𝑔𝑛𝑚𝑒𝑛𝑡𝑖 where i refers to the sub-sectors within a specific
sector.
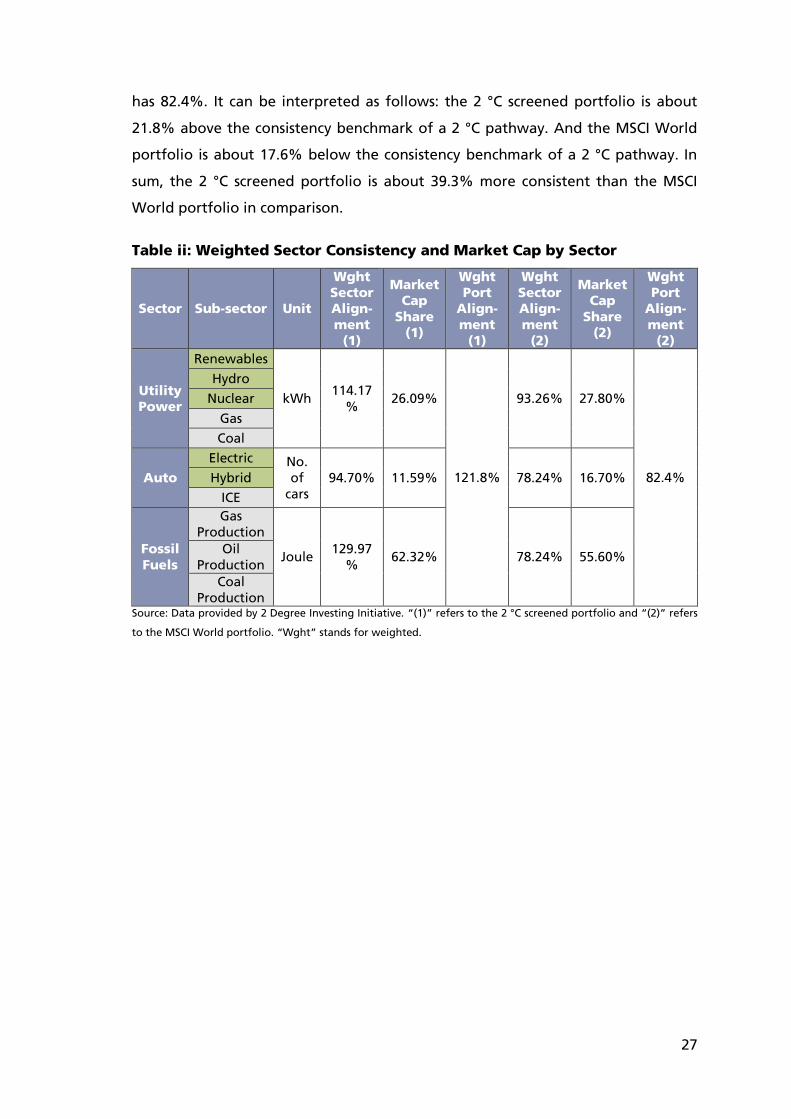
The weighted consistency by sector results for both portfolios is presented in the
columns “Wght Sector Consistency (1)” and “Wght Sector Consistency (2)” in
Table ii. The market capitalisation share of the sectors in the portfolios is given in
the columns “Market Cap Share (1)” and “Market Cap Share (2)”. Using the
market capitalisation share as weight, the aggregate weighted average of
consistency is calculated for each portfolio by ∑ 𝑊𝑔ℎ𝑡 𝑠𝑒𝑐𝑡𝑜𝑟 𝑎𝑙𝑖𝑔𝑛𝑚𝑒𝑛𝑡𝑗 ×
𝑀𝑎𝑟𝑘𝑒𝑡 𝑐𝑎𝑝 𝑠ℎ𝑎𝑟𝑒𝑗, where j refers to the sectors within a portfolio.45
The results are presented in the columns “Wght Port Consistency (1)” and “Wght
Port Consistency (2)” in Table ii. It shows that the 2 °C screened portfolio has an
aggregate weighted average indicator of 121.8% while the MSCI World portfolio
42 We thank Klaus Hagedorn from the 2 Degree Investing Initiative for his valuable ideas in the climate impact
measurement calculation, and his inputs in the 2 °C exposure and consistency calculation. 43 Note that the hybrid automobiles in the 2 °C screened portfolio have 90.7% alignment, which is < 100%. This is an
exception in the screened rule. 44 Note that the calculation needs to be done separately for the 2 °C screened portfolio and the MSCI World portfolio. 45 Note that the calculation needs to be done separately for the 2 °C screened portfolio and the MSCI World portfolio.
27
has 82.4%. It can be interpreted as follows: the 2 °C screened portfolio is about
21.8% above the consistency benchmark of a 2 °C pathway. And the MSCI World
portfolio is about 17.6% below the consistency benchmark of a 2 °C pathway. In
sum, the 2 °C screened portfolio is about 39.3% more consistent than the MSCI
World portfolio in comparison.
Table ii: Weighted Sector Consistency and Market Cap by Sector
Sector Sub-sector Unit
Wght
Sector
Align-
ment
(1)
Market
Cap
Share
(1)
Wght
Port
Align-
ment
(1)
Wght
Sector
Align-
ment
(2)
Market
Cap
Share
(2)
Wght
Port
Align-
ment
(2)
Utility
Power
Renewables
kWh 114.17
% 26.09%
121.8%
93.26% 27.80%
82.4%
Hydro
Nuclear
Gas
Coal
Auto
Electric No.
of
cars
94.70% 11.59% 78.24% 16.70% Hybrid
ICE
Fossil
Fuels
Gas
Production
Joule 129.97
% 62.32% 78.24% 55.60%
Oil
Production
Coal
Production Source: Data provided by 2 Degree Investing Initiative. “(1)” refers to the 2 °C screened portfolio and “(2)” refers
to the MSCI World portfolio. “Wght” stands for weighted.

28
Annex 2: Methodology
PORTFOLIO CONSTRUCTION
The 2° screened portfolio is constructed by the 2° Investing Initiative. The MSCI
World portfolio is formed based on constituents obtained in December 2015
where the free-float shares out from Bloomberg are used for each constituent in
MSCI World without rebalancing.46 Based on the 2° screened portfolio and the
MSCI World portfolio, the high-carbon portfolio is built, which consists of the
stocks in the MSCI world portfolio but not in the screened portfolio. The goal of
the report is to analyse and compare the characteristics and risk-adjusted
performance of the 2° screened portfolio vs. MSCI World portfolio, and the high-
carbon portfolio vs. MSCI World portfolio.
THE 2° SCREENED PORTFOLIO
In the portfolio construction process, a set of rules is defined. These are exclusion
strategies, in which certain companies in the fossil fuel, power and automobile
sectors are excluded from the MSCI World portfolio to generate the 2° screened
portfolio. The climate implication of the 2° screened portfolio is that it is a
portfolio which is sectorial more compatible to a 2 degree transition pathway.47
Ranking criteria to screen companies that are not consistent with climate goals are
defined. For each sector, there is a specified ranking criterion. Table iii presents a
summary on ranking criterion and screened results.
Table iii : Screened Rules in the 2° Screened Portfolio
Sector Ranking Criterion Exclusion Results
Fossil fuel sector
fossil fuel additions =
∑ Production2020 (J)Oil,Gas -
∑ Production2015 (J)Oil,Gas where J
is the company constituent in the MSCI world
Excluding the Top 5
companies with higher
fossil fuel additions
Power sector TechShareBrown = Excluding the Top 25
utilities with highest
brown tech share
46 This portfolio differs from the MSCI World index whose constituents are adjusted periodically. We thank 2 Degree
Investing Initiative for providing the MSCI constituents of December 2015. 47 The automobile sector will be an exception. Under the restriction of owning maximum about 2% of companies, while still holding a significant percentage of the portfolio in car manufacturers, it is not possible to reach 100% alignment in
the automotive sector.

29
Capacity2020Coal + Capacity2020
Gas
Capacity2020RE + Capacity2020
Hydro
Automobile sector
Best in Class Hybrid Cars
=Production2020
Hybrid
∑ Production2020Technology
Technology
Bet in Class Electric Cars
=Production2020
Hybrid
∑ Production2020Technology
Technology
Keeping best in class
automobile companies in
terms of hybrid and
electric cars
Source: 2 Degree Investing Initiative
Companies that are not compatible with the climate goals by definition of the
criteria in Table iii are excluded. At the same time, the portfolio’s consistency to a
2 degree trajectory is monitored by sector. 48 The value weight of the sector
allocation is kept as close to MSCI world as possible.49
THE HIGH-CARBON PORTFOLIO
The high-carbon portfolio consists of the fossil fuel, power and automobile sector
stocks that are screened out of the MSCI World portfolio for the construction of
the 2° screened portfolio. The difference of stock composition between the MSCI
World portfolio and the 2° screened portfolio is identified. The list of the 54 stocks
identified is shown below in Table iv. The stock position in the high-carbon
portfolio (in terms of number of shares) is taken directly from the allocated
portfolio weight in the MSCI World portfolio.
Table iv: Composition of the High-carbon Portfolio
Sector Stock Tickers Summary
Fossil Fuel
CHEVRON CORP
5 fossil fuel companies
6 fossil fuel company stocks
ROYAL DUTCH SHELL A *
ROYAL DUTCH SHELL B *
BP
ENI
TOTAL
Power
AES CORP
25 power companies
25 power company stocks
ALLIANT ENERGY CORP
AMERICAN ELECTRIC POWER
ATCO I
CALPINE CORP
CANADIAN UTILITIES A
48 There might be digits differences so “close to” or “meet” the 2° target. 49 This result is based on the previous work by the 2 Degree Investing Initiative. It is possible for the fossil fuel and the
power sectors, but not really possible for the automobile sector.

30
CHUBU ELECTRIC POWER CO
CLP HOLDINGS
DTE ENERGY
DUKE ENERGY CORP
ENDESA
ENTERGY CORP
EVERSOURCE ENERGY
FIRSTENERGY CORP
FORTIS
NRG ENERGY
ORIGIN ENERGY
PINNACLE WEST CAPITAL
PPL CORP
PUBLIC SERVICE ENT GRP
SCANA CORP
SOUTHERN COMPANY (THE)
TOHOKU ELECTRIC POWER CO
WEC ENERGY GROUP
XCEL ENERGY
Automotive
BMW STAMM *
21 automotive
companies
23 automotive company stocks
BMW VORZUG *
CNH INDUSTRIAL
DAIHATSU MOTOR CO
DAIMLER
FERRARI (IT)
FIAT CHRYSLER AUTOMOBILE
FORD MOTOR CO
FUJI HEAVY INDUSTRIES
GENERAL MOTORS
HARLEY-DAVIDSON
HONDA MOTOR CO
ISUZU MOTORS
MAZDA MOTOR CORP
MITSUBISHI MOTORS CORP
NISSAN MOTOR CO
PEUGEOT SA
PORSCHE AUTOMOBIL VZG
RENAULT
SUZUKI MOTOR CORP
VOLKSWAGEN STAMM *
VOLKSWAGEN VORZUG *
YAMAHA MOTOR CO Note: *Some companies have more than one type of stocks

31
Annex 3: PORTFOLIO ANALYSIS
TOOL
The portfolio analysis in this report is conducted in the Bloomberg Portfolio & Risk
Analytics tool.50 It is a tool that helps portfolio managers to analyse portfolio’s
performance, characteristics and market-related as well as security-specific risks
compared to a benchmark portfolio. In this report, the portfolios analysed are i)
the 2 °C screened portfolio and ii) the high-carbon portfolio against the MSCI
World portfolio as benchmark. We compare the performance of the 2 °C screened
portfolio and the high-carbon portfolio to the benchmark with respect to the
following aspects: i) holdings, ii) characteristics (e.g. dividend yield, price / earnings
ratio), iii) tracking error / volatility, and iv) performance. Here we give a brief
introduction to each of the aspect.51
Holdings: The holdings section provides an overview of the assessed portfolio on
its current positions, weights, and allocations across sector and country compared
to a selected benchmark.
Characteristics: The characteristics section presents the fundamental
characteristics of the assessed portfolio. Measures include dividend yield, price /
earnings ratio, debt / equity ratio, etc.
Tracking error / volatility: The tracking error / volatility section analyses the
predicted risk of the assessed portfolio with a multi-factor risk model. Tracking
error is the annualized volatility of active returns in percentage absolute or
relative to a selected benchmark. The analysis can be broken down by factor and
by exposure.
Performance: The performance section analyses the historical performance of the
assessed portfolio with 1-day return, 1-month return, and Year-to-Date Return.
The statistical summary presents risk / return calculations for the assessed portfolio
and the benchmark in various periods.
50 The tool can be accessed in the Bloomberg terminal via PORT <GO>. In the portfolio uploading phase, the portfolio data are cleaned and in particular, outdated Bloomberg tickers are updated. 51 The descriptions are adapted from Bloomberg manual on using the Portfolio Risks & Analytics tool.

UNEP Collaborating Centre Frankfurt School of Finance & Management Sonnemannstrasse 9-11 60314 Frankfurt am Main http://fs-unep-centre.org www.frankfurt-school.de E-Mail: [email protected] Phone: +49 (0)69 154008-614 Fax: +49 (0)69 154008-670