the role and effect of remedial education in two-year … role... · the role and effect of...
TRANSCRIPT

DO NOT CITE WITHOUT PERMISSION COMMENTS WELCOME
The Role and Effect of Remedial Education in Two-Year Colleges*
Eric Bettinger Case Western Reserve University and NBER
Bridget Terry Long Harvard Graduate School of Education and NBER
September 2003
ABSTRACT
Remediation has become an important part of American higher education with over one-third of students requiring remedial or developmental courses. At community colleges in particular, over half of entering students are placed into the courses, and in many states, two-year colleges serve as the primary providers of remediation. With the costs of remedial education amounting to over $1 billion each year, many policymakers have become critical of the practice. In contrast, others argue that these courses provide important opportunities for underprepared students. Despite the growing debate and the thousands of underprepared students who enter the community college system each year, little research exists on the role or effects of remediation on student outcomes. This paper addresses these critical issues by examining how community colleges attempt to assimilate students in need of remediation and to prepare them for future college-level work and labor market success. Using a unique dataset of students in Ohio’s public higher education system, the papers explores the characteristics and features of remedial education at community colleges, examines participation within the programs, and analyzes the effects of remedial education on collegiate outcomes.
* Please send comments to [email protected] and [email protected]. The authors thank the Ohio Board of Regents for their support during this research project. Dr. Robert Sheehan, former Associate Vice Chancellor for Performance Reporting and Analysis, and Andy Lechler, HEI Senior Analyst, provided invaluable help with the data. In addition, Cathy Wegmann and Karen Singer Smith provided excellent research assistance. All opinions and mistakes are our own.

2
I. Introduction
Remediation has become an important part of American higher education. According to a
1996 study by the National Center for Education Statistics (NCES), nearly 30 percent of all incoming
first-year students require remedial (or developmental) education in reading, writing, or mathematics,
and there is some evidence that remedial enrollments are increasing.1 Community colleges play a
special role in remediation as they provide services to over 60 percent of their first-year students.
Many remedial students are underprepared recent high school graduates who leave secondary school
without grade-level competency or the proper preparation for college-level material. In addition,
large numbers of non-traditional students require remediation and enter higher education to improve
their basic skills after being displaced in the labor market. While proponents argue that remediation
provides opportunities for underprepared students to gain the competencies necessary for college-
level work and skilled employment, critics suggest that it provides disincentives for high school
students to adequately prepare for college and that remedial courses may unnecessarily impede
individual progress. Others argue that higher education is fundamentally not an appropriate place for
precollege-level courses. With an estimated annual cost over $1 billion annually (Breneman and
Haarlow 1997), the debate about the merits of investing in remediation has intensified.
In recent years, several major states have argued that community colleges should be the
principal provider of remedial courses. However, this is a controversial stance as illustrated by the
experience of the CUNY system when it tried to restructure its remedial programs in 1998. With 70
percent of entering freshman failing at least one of the three placement tests and nearly 20 percent of
all CUNY students taking remedial basic-skills courses, then-Mayor Rudolph Giuliani argued that
the “CUNY university system currently devotes far too much money and effort to teaching skills that
students should have learned in high school” (Schmidt, 1998). After much debate and revision to the
original proposal, the final decision was made in November 1999 to phase out most remedial
education at the system’s four-year colleges and focus the courses at community colleges (Hebel,
1999a).

3
Recent developments suggest more systems are moving more towards this model of
concentrating remediation in the community college system. Several other states (Arizona, Florida,
Montana, South Carolina, and Virginia) prohibit public universities from offering remediation
education (Shedd, Redmond, and Lucy-Allen, 2002). Likewise, during the fall of 2001, the four-year
California State University system “kicked out more than 2,200 students – nearly 7 percent of the
freshman class – for failing to master basic English and math skills” (Trounson, 2002). This is part
of a larger effort in California to encourage students to complete their remediation in the two-year
colleges before entering the four-year system.
Within the debate on the provision of remediation, states and higher education institutions
even question whether colleges or governments should cover any of the costs of remedial education.
For example, in Florida, the legislature elected to require college students to pay the full cost of their
remedial course work, an expense estimated to be four times greater than the regular tuition rate
(Ignash, 1997). There is also growing support for efforts focused on high schools. Some school
districts in Virginia, for example, have taken this so far as to “guarantee” their diplomas. Hanover
County pays the remedial expenses of its former students, and the Virginia legislature is trying to get
other districts to adopt similar programs (Wheat, 1998). However, even with reform, secondary
schools would be unable to prepare all students for postsecondary education. Only 64 percent of
students earn a standard high school diploma and many argue that graduation standards do not
coincide with the competencies needed in college (McCabe, 2001).
Despite the growing debate on remediation and the thousands of underprepared students who
enter the nation’s higher education institutions each year, little is known about the effects of
remediation on student outcomes. NCES (1996) suggests that freshmen enrolled in remedial classes
are less likely to persist into their second year, but this evidence is based on institutional surveys and
likely overstates the true effects of remediation by not controlling for student ability and student
mobility. The researchers compare students with different backgrounds and fail to track students
who stay in academia but transfer to another school. In another study the Ohio Board of Regents
1 Most scholars define “remediation” as courses students need to re-take while defining courses that are new

4
(2001) finds that almost 40 percent of remedial math students never take an additional math course
and are less likely to succeed in subsequent math courses. However, this work does not attempt to
explain how and why these outcomes differ across students. After assessing the literature on
remediation, the Ohio Board of Regents concluded, “there are no known benchmark indicators
addressing the success rates of higher education’s remediation efforts.”
The lack of analysis on the effects of remediation is likely due to the fact that few student-
level datasets exist which might shed light on this issue. The ideal dataset should contain extensive
information on a student’s background, including high school preparation and performance, as well
as information about students’ progress through college including their experiences with remediation
and transfer behavior between schools. Furthermore, detailed knowledge about institutional
remediation policies is necessary to understand how individuals are placed into the courses. Using a
unique, longitudinal dataset that meets these requirements, this paper explores the characteristics and
features of remedial education at community colleges, examines participation in the courses, and
analyzes the effects of remediation on student decisions and outcomes. In this way, this paper
addresses a hole in the literature and reflects on how higher education attempts to assimilate
underprepared students and prepare them for future college-level work and labor market success.
Focusing on math remediation, the paper examines three sets of questions. First, what are the
characteristics of remedial education in community colleges and how do community colleges
determine who needs to be remediated? Second, who participates in remedial education? How does
participation vary by race, gender, income, and high school, and are there any factors that seem to
predict the need for remediation? Finally, how does remediation affect student outcomes? How does
the college performance, persistence, and transfer behavior of those in remediation compare to other
students? Because our analysis is based on placement into a remedial course but not necessarily
completion of that course, these results should be interpreted as the effect of the “intention to treat,”
the primary focus of policymakers.
material as “developmental.” In this paper, we will refer to both types of courses as being remedial.

5
The data for this analysis are from the Ohio Board of Regents (OBR). Since 1998, the OBR
has collected comprehensive information on college enrollment at Ohio’s public colleges and
universities and linked it with standardized test scores and student questionnaires. For first-time
freshmen of 1998-99, the focus of this paper, the data provide extensive information on each
student’s family background, high school preparation, postsecondary intentions, and progress
through college. In addition to the wealth of information available, the data allow one to distinguish
between students who withdraw from school altogether and those who transfer to other Ohio public
colleges. Therefore, we are better able to measure dropout and transfer rates more effectively than
other datasets where such level of detail is not available.
Measuring the effects of remediation on student outcomes can be difficult since students
placed into remediation may not be comparable to other students. To avoid such selection bias, we
exploit both exogenous variation in college choice and institutional remediation policies. After
controlling for selection bias, the results suggest that remedial students have lower GPA's and are
less likely to attain a two-year degree within three years of their initial enrollment.
The paper is organized in the following manner. Section 2 describes the data and provides
background on the supply and demand for remediation. We discuss the organization, delivery, and
placement process into remediation along with the characteristics of students who take remedial
courses. Section 3 describes the empirical framework, which is designed to exploit variation in
remediation across colleges, and presents evidence about the validity of this strategy. Section 4
presents empirical findings, and Section 5 concludes.
II. The Community College System in Ohio
The Data
The analysis is based on administrative and transcript data available through a collaborative
agreement with the Ohio Board of Regents (OBR). We track the over 14,000 first-time, degree-

6
seeking students at 19 state and local public, two-year colleges in Ohio.2 The paper focuses on the
cohort that began in Fall 1998 due to the availability of information on remedial course-taking from
the OBR. The students are followed throughout the Ohio public higher education system until
Winter 2002. The data include information on students’ academic intent, course-taking behavior,
and performance. Moreover, if a student took a college entrance exam, which is most likely to be the
ACT, then there is self-reported information on high school preparation and performance from the
accompanying student survey.
Summary statistics of the student sample can be found in Table 1a. Community college
students are on average older, more likely to be minority students, and are less likely to intend on
completing a college degree than students enrolling in other campuses. In the Ohio public higher
education system, nearly two-thirds of community college students intend to get a two-year or four-
year degree, and this group is the focus of this paper. Unfortunately, after three and a half years (Fall
1998 to Winter 2002), many degree-seeking students have dropped out of the system without any
award. The last two columns separate the sample by age group.3 Traditional college students are
more likely to want a four-year degree, and therefore, intend to transfer to a four-year college. The
younger students are also more likely to have taken the ACT and be placed in remediation.
In Ohio, there are two kinds of community colleges: state and local. Table 1b displays the
summary statistics of the students at each type of college. While the oldest community college was
founded in 1887, most were established in the 1960s by county governments or local school boards
(Education Commission of the States, 2003). Today, each community college services a geographic
area made up of several counties. However, as shown in the table, there is a slight difference in the
student bodies attracted to each type. Students at the local community colleges are more likely to be
pursuing a four-year degree. Their ACT scores are also slightly higher. For this reason, we break the
analysis down by type of college.
2 Two-year technical colleges are excluded due to their special nature and the differences in the academic intent of their students. 3 As is common in the literature, we refer to younger students who enter college within two years of graduate as “traditional” college students (i.e. ages 18, 19, or 20). Nontraditional students are defined as being any other age.

7
One limitation of the data is that they only include students attending Ohio public colleges
and universities. Students from Ohio that attend colleges in other states or that attend private schools
in Ohio are excluded from the sample. This omission could affect the measurement of dropout rates
because students who transfer from community colleges to institutions located in other states or
private colleges are indistinguishable in the data from students who withdraw from higher education
completely. This potential bias, however, should be very small since this group makes up a small
fraction of the total number of observed dropouts.4 Furthermore, this data is a large improvement
over other sources which do not allow one to track students across any schools.
Although this paper focuses on remediation in Ohio community colleges, the results should
have external validity for several reasons. First, Ohio is a significant state in terms of size and
diversity. It has three large cities as well as rural areas and so it reflects the complete spectrum of
communities and labor markets that exist across the nation. In addition, Ohio is the sixth largest state
in terms of its number of college students and seventh in terms of population.5 The only states with
greater numbers of students in public higher education are California, Texas, New York, and Illinois.
Second, the array of public choices in Ohio also reflects the options students face in many other
states. Ohio has a mixture of selective and nonselective four-year institutions as well as two-year
community and technical colleges spread geographically across the state.
Another compelling reason to study Ohio is that its college enrollment and remediation rates
are similar to national patterns. The percentage of Ohio public students that graduate from high
school and the percent that enter higher education the following fall are near the national averages.6
4 While it is the case that we cannot track students who transfer to private institutions or public out-of-state institutions, this is not likely to be a large group. Using data from the Integrated Postsecondary Education Data System on the number of transfers at each institution and assuming that transfer students are geographically representative of the incoming freshman class, then one would expect around 650 Ohio students to transfer to non-Ohio schools each year. If we further assume that all 650 transfer students just finished their first year of school, then about 4.3 percent of observed dropouts are actually transfer students. 5 Source on college enrollment: Digest of Education Statistics (2000). Ohio is the fifth largest state in terms of students at public institutions. Source on population information: Population Division, U.S. Census Bureau, Table ST-2001EST-01 - Time Series of State Population Estimates. The only states larger than Ohio in 2000 population are California, Texas, New York, Florida, Illinois, and Pennsylvania. 6 The percent that graduate from high school is 69.6 in Ohio compared to the national average of 66.1. The percent that continue on to college is 56.1 percent compared to a national average of 56.7 (Mortenson, 2002). However, in

8
Furthermore, while the NCES reported that 20 percent of all first-time freshmen in 1995 enrolled in
remedial reading and 25 percent enrolled in remedial writing, the OBR found one-fifth of Ohio
students did so during the summer or fall of 2000. Nationally 27 percent enrolled in remedial math
in 1995 while 29 percent did so in the state. Finally, Ohio is an exemplary case because it is
confronting the many concerns highlighted above in the debate about remediation. In 2000, Ohio
public colleges spent $15 million teaching 260,000 credit hours of high school-level courses to
freshman; another $8.4 million was spent on older students. These courses, which do not count
towards a college degree, cost the 20,000 remedial freshman students an additional $15 million. The
magnitude of the number of students involved and the costs of remediation have parents, students,
and policymakers in Ohio concerned (Sternberg and Thomas, 2002).
The Organization and Delivery of Remedial Education at Community Colleges
The purpose of remedial education is to provide underprepared students the skills necessary
to succeed in college and gain skilled employment in the labor market. This practice has been
around as early as the 17th century when Harvard College assigned tutors to underprepared students
studying Latin (IHEP, 1998). However, during the 20th century, the increased demand for higher
education by students from all backgrounds accelerated the need for remediation in higher education.
By 1995, 81 percent of public four-year colleges and 100 percent of two-year colleges offered
remediation (NCES, 1996).
With the exception of two campuses (Miami University and Central State University), all
public colleges in Ohio offer remedial courses to entering freshmen. However, most remedial
students take their courses at the community colleges. For example, about 55 percent of
traditionally-aged, first-time freshman at community colleges enroll in remedial courses (OBR,
2001). In additional to their traditional students, half of two-year colleges provide remedial or
developmental courses to local business and industry (NCES, 1996). As noted above, the practice of
focusing remediation at the community colleges is similar to the experience in other states.
Ohio, fewer students enter the two-year rather than four-year public system than is found nationally (38 percent in

9
Institutional policy towards remediation varies. However, often remedial courses do not
count toward degree or certification credits. Therefore, remediation frequently lengthens the time
necessary to complete a degree, and this can have implications on financial aid due to time
limitations. Moreover, remedial courses are often the gateway for students to enroll in upper level
courses. About two-thirds of campuses nationally restrict enrollment in some classes until
remediation is complete (NCES, 1996). This is also the case in Ohio where, similar to national
trends, campuses vary in the extent to which they require versus suggest that under-prepared students
enroll in remedial or developmental work (OBR, 2002). Often institutional rules prevent students
from taking college-level classes until they have completed remedial education. These requirements
may restrict students’ class schedules and impede students’ abilities to transfer to four-year
institutions. To the extent that remediation affects the classes that students can take, it may also
influence what major students can select. For example, some majors are extremely demanding in
terms of required credit hours and have little leeway for students to enroll in non-required classes. In
turn, students' labor market outcomes may worsen compared to other students.
The Selection Process into Remedial Education
While there are statewide standards in Ohio to distinguish between remedial and college-
level work, institutions differ in how they interpret these standards at the campus level. There is also
a great deal of variation across colleges as to what constitutes a remedial course and how students are
selected into remedial courses. Institutional rules on placement into remediation might differ for
several reasons. Schools may differ in their rates of remediation due to differences in their student
bodies. For example, due to their localized nature, one community college may cater more to
nontraditional, older students than another school or may have students interested in particular fields
due to the demands in the local labor market.
Across schools with similar student bodies, there may be variation in remediation policies for
a myriad of reasons. First, the preferences of the administration are likely to influence the role of
Ohio compared to 48 percent nationally).

10
remediation at a school. For example, the University of Toledo recently decided not to offer
remediation courses due a change in the college leadership. Students requiring remediation are now
referred to Owens Community College, which has had to cope with the increase in students (Sheehan
2002). The preferences of the departments responsible for remediation courses are also likely to be
important in determining an institution’s view of remediation. Colleges may use different placement
tests or decide to weight various criteria differently in determining remediation. For example, high
school background and preparation often play a role in placement into remediation. The
measurement error in the tests and the difference in weighting procedures create variation across
similar students at different universities. Remediation may also differ across colleges due to costs. If
the cost of remediation differs across schools, then colleges will vary in their placement policies.
Particularly over time, as college budgets become more or less stringent, institutions may be more or
less willing to spend money on remediation. Finally, the political economy of the surrounding area
could explain differences in remediation if some communities are more or less likely to support
remediation in college.
Selection into remediation is usually determined with a combination of measures. While
most students are identified using placement exams in reading, writing, and mathematics, some
schools also use standardized test scores and high school transcripts to make assignments.
Interestingly, the Ohio Board of Regents records that 36 percent of first-year students age 19 or
younger attending any public Ohio campus graduated from high school without a college prep
curriculum. This is exactly the same proportion of students who enrolled in at least one remedial
course in their first year of college (OBR 2001).
At most schools, the placement exam is taken at the beginning of students’ freshman years.
All community colleges in Ohio use the Computerized Adaptive Placement Assessment and Support
Systems (COMPASS) as a placement exam with some also using the Assessment of Skills for
Successful Entry and Transfer (ASSET), each published by the ACT, Inc. The tests consist of a
variety of sections to measure students’ skill level. For example, the Asset exam is a written exam
with as many as 12 subsections, including in depth assessment of students’ writing, numerical, and

11
reading skills.7 As noted above, colleges vary in which parts of the COMPASS and ASSET they use.
After taking the exam, the college assigns students to a specific math course, oftentimes a remedial
course, based on their scores. Typically, colleges make these designations based on “hard” cutoffs –
students scoring below a given threshold are assigned to a remedial course.
Participation in Remedial and Developmental Education
The first major group of students in remedial education is underprepared, recent high school
graduates, many of whom exit secondary school without grade-level competency or the proper
preparation for college-level material. In Ohio, 37 percent of first-year students under the age of 19
fit into this category having graduated from high school without a college-prep curriculum (OBR,
2002). In addition, a substantial number of adult students enroll in developmental courses. Many of
these workers were displaced by structural shifts in the labor market and seek developmental courses
to acquire the skills necessary for re-employment. Others are often recent immigrants or welfare
recipients. Nationally, about 27 percent of remedial students are over the age of 30 (IHEP, 1998),
and this is similar to the pattern in Ohio. Table 2 provides describes the characteristics of students in
and out of math remediation. As suspected, students placed in remediation have lower ACT scores.
Moreover, they are more likely to be female and African-American. Not surprisingly, a simple
tabulation of college outcomes also suggests that remediated students have lower college GPAs, are
more likely to drop out, and less likely to complete a degree or transfer to a four-year school. The
rest of the analysis will attempt to control for the ability bias plaguing these correlations.
Past research has found that the need for remediation in college is closely tied to the high
school course of study of a student. A 2002 study by the Ohio Board of Regents found that students
who had completed an academic core curriculum in high school were half as likely to need
remediation in college when compared to students without this core. Hoyt and Sorensen (1999)
found a similar pattern when examining the need for remediation at Utah Valley State College.
Similar evidence is presented in Table 2. Students in remediation report lower high school GPAs in
7 Complete information on both the Asset and Compass exams is available at http://www.act.org.

12
math and fewer years of math courses. However, in previous studies, many students who had
successfully completed upper level math courses still required remedial math courses or needed to
repeat subjects in college. In Ohio, 25 percent of those with a known core high school curriculum
still required remediation in either math or English (OBR, 2002).
III. Estimating the Impact of Remediation using Across-College Variation
To assess the effects of remedial education, we use regression analysis to compare the
outcomes of remedial students to each other as well as to non-remediated students. However, since
students who take remedial education differ systematically from other college students, additional
effort is necessary to deal with selection issues. There are a number of sources of variation that may
be exploited to identify the effects of remediation. For example, there may be comparable students at
different universities who did or did not take remedial classes respectively. In addition, within each
school there may be comparable students who the university did or did not assign to remediation
respectively. This section discusses an identification strategy designed to take advantage of the first
kind of variation.8 It involves exploiting differences across colleges using an instrumental variable
approach.
Across-College Variation
As in other states, community colleges in Ohio have different remediation programs in terms
of the types of classes offered, the method of assignment, the cutoff point on placement test, and so
on. Because of this variation across institutions, similar students attending different universities
might have different remediation experiences. In some cases, a student might attend remedial
courses at one college while similar students at other institutions do not. However, a straightforward
comparison of similar students across schools is problematic for several reasons. First, community
college attendance is an endogenous choice reflecting among other things student ability. Students

13
may choose a college (and remediation policy) that fits their abilities. As a result, students may not
be perfectly comparable across schools. Additionally, variation in remediation across colleges may
be endogenous to the students attending the college. For example, students attending a community
college in one part of the state may be better prepared than students in another city. Finally, using
variation across schools may reflect differences that are due to things other than remediation such as
other campus-level interventions (e.g. advising or academic support).
To address the endogeneity of college choice and placement in remediation, we employ an
instrumental variable approach. Since the key endogenous, right-hand-side variable is whether
students take remediation or not, one needs an instrument that is related to the likelihood of taking
remediation but not related to students’ outcomes (e.g. persistence, grade point average) in college.
We use an instrument that combines both the likelihood of a student choosing a given institution and
the likelihood of taking remediation at this college. Previous research has shown that students are
more likely to attend one school over another depending on how close the college is to a student’s
residence (Rouse, 1995; Card, 1995). In essence, students prefer to attend colleges closer to their
home. Coupled with the fact that colleges have different remediation policies, the likelihood of
remediation will depend on the policies of nearby colleges. If the college closest to a student tends to
do more remediation, then the student is more likely to be remediated than a similar student who
happens to live closer to a school, which does very little remediation. In short, if distance
exogenously predicts the college of attendance and each college has a different remediation policy
(which for the moment we will assume to be exogenous), then the interaction of these variables
exogenously predicts remediation.
Estimating College Choice
To approximate the likelihood that an individual will attend a specific college, we estimate
the probability of attendance conditional on that individual attending a community college. For
8 To best exploit within-college variation, it would be necessary to have information on students’ placement test scores, but unfortunately, these data are not available at this time.

14
example, a student who attended Cuyahoga Community College would be assigned 19 different
probabilities each corresponding to a different community college.
The conditional logistic regression model is well-suited for this framework since it both
allows for multiple alternatives and can be used to exploit match-specific information such as
distance. Also known as McFadden’s choice model (1973), the conditional logit has been used to
study choice behavior with such applications as choice of travel mode and occupation. While the
form of the likelihood function is similar to that of the multinomial logistic regression, the variables
are choice-specific attributes rather than individual-specific characteristics. If the independent
variables were instead attributes of the individuals rather than alternatives, then the models would be
the same.
For this model, the data are organized as pair-wise combinations of each student i with each
community college j so that there are a total of i × j observations. These observations are stratified
by individual into groups of j with each stratum constituting all possible college matches with one
individual. Using these combinations, the conditional logit model is made up of j equations for each
individual i, with each equation describing one of the alternatives. The conditional logit model then
calculates the probability of enrollment at each of the colleges in the stratum (i.e. it considers the
probability of a person attending any one of the community colleges). It does this by computing the
likelihood of enrollment at each school relative to all alternatives so that the probabilities sum to one
for each individual (or within one stratum).
The format of the conditional logit allows for a variable that describes the distance to each
college for each individual (indexed as ij to denote individual i and school j).9 The dependent
variable, signifying the choice of the individual, equals one for the alternative that was chosen.
Under the assumption that the εij’s are independent and identically distributed with the extreme value
distribution, we get the conditional logit functional form:
9 Distance is calculated using the zip code on the student’s college application and the zip code of the institution.

15
ijijjij
j
XB
XB
i
DSXB
eejY
ij
ij
εγβα +++=
==∑
'
)Pr( '
'
where Sj is a series of fixed effects for each school, and Dij is the distance that student i lives from
university j. The format allows for maximum likelihood estimates of the coefficients, and the
probability of any particular choice can be calculated using the conditional logit specification.
Since the likelihood of attendance at each college is calculated relative to the alternatives
within each stratum, there must be variation within the strata for estimation purposes. For this
reason, student characteristics cannot be included independently in the estimation.10 The estimation
does not identify the causal effect of a student’s attributes on enrollment. Instead, the estimates
indicate how school characteristics affect the likelihood of a particular individual to enroll at the
school. If the Independence of Irrelevant Alternatives (IIA) condition is met, the estimates will be
consistent even if the decision to attend college at all is endogenous.11
Table 3 reports the conditional logit estimates for the 19 community colleges in our data.
Each row represents a separate sample of colleges. Row 1, for example, shows the conditional logit
results for the 9,641 who enrolled as freshman in 1998-99 at any of Ohio's 19 community colleges.
The conditional logit suggests that the farther a student lives from a college the less likely he or she is
to choose that institution. The relationship is statistically significant over a 99 percent confidence
interval. The reported coefficient is not the marginal probability of distance on choice, but it clearly
reflects the sign of the relationship between distance and college choice. The other rows of Table 3
show conditional logit estimates for state and local community colleges respectively. In both of
10 The j equations within a stratum are not independent, and a person’s gender, for example, would difference out of all the equations within one stratum since each contains data on only one individual. Therefore, unlike the multinomial regression model, non-college alternatives such as local labor market conditions cannot be included within the model since they are individual-specific. 11 As long as students apply to schools that they determine to be most preferred, estimation will retain good statistical properties due to the IIA property. See Manski and Wise (1983) for further discussion. Also see Luce (1959) and McFadden (1979).

16
these cases, the coefficient shows a strong and statistically significant effect on college choice. Once
estimating the conditional logit, we save the predicted probabilities of attendance at each community
college conditional on the student attending one of the community colleges. These predicted
probabilities are determined solely on the basis of the distance students live from a college and are an
essential component of our instrumental variable strategy.
The Probability of Remediation
Our identification strategy uses distance as a predictor of college of attendance and uses
variation in remediation policies across universities to predict the likelihood of remediation at any
given institution. Variation in remediation policies among similar types of schools is the focus of
this study to avoid unwanted variation due to differences in the quality of a student body.12 As
discussed above, these differences may be due to the preferences of the administration or department
providing remediation, differences in the costs of remediation from school to school, or the political
economy of the surrounding community. We use this variation to identify and compare similar
students with different remediation experiences. The first-best solution would be to observe the
placement exam that universities use to assign remediation, but we do not have the data to do this.
However, we do have information on a substantial number of measures that help to predict that test
score. For students who took the ACT, we know their scores, which is highly related and in some
cases used to designate placement. Additionally, we have information from the student questionnaire
that accompanies the ACT and details the types of high school classes taken as well as the grades
received. The predicted probabilities that we estimate are based on these data, and we generate
substantial variation for a single individual across colleges.
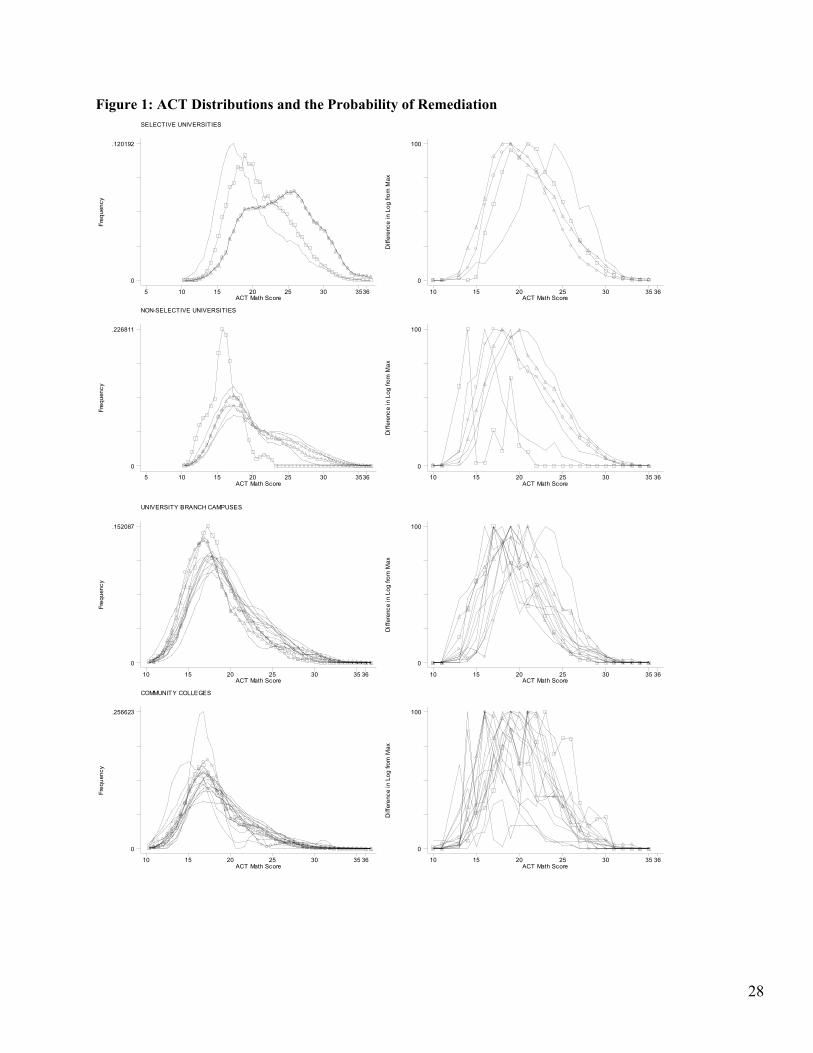
Using ACT scores as a predictor of placement into remediation, Figure 1 demonstrates how
similar colleges have heterogeneous remediation policies. While the focus of this paper is on
community colleges, for comparison we show ACT distributions and remedial cutoffs for both four-
12 Variation arising from differences in the types of students attending the respective institutions is problematic since the remediation policies may simply identify different types of students making comparisons difficult to interpret.

17
year and two-year campuses. Each row represents a different type of college. In each row, the left-
hand graph shows the distribution of ACT scores at each community college. The right-hand graph
shows the likelihood functions for ACT cutoffs. These likelihood functions come from a series of
regressions we use to estimate the likely cutoff points. For each possible ACT score, we estimate the
following probit model:
Pr (Remediation) = f (a + b * I(ACT>J) + e)
where I(ACT>J) is an indicator for whether the ACT score of student i is greater than J, and J varies
over the possible range of the ACT math score (1-36). We estimate this model for each possible
cutoff point within each college. Then we compare the likelihood functions generated by these 36
regressions. The right-hand graphs show these likelihood functions.13 To the extent that community
colleges use the ACT score to assign remediation, these likelihood plots should show a spike next to
the most likely cutoff value used by an individual school.
The first row shows the test score distributions for selective four-year, public institutions in
Ohio. There is a good deal of heterogeneity in the ACT test score distributions and not surprisingly,
more heterogeneity in the likely ACT remediation cutoffs. Schools have different test score
distributions as well as differences in the most likely cutoff value used by the schools. The other
rows show the ACT distributions and remedial cutoffs other types of colleges. Row 4 shows the
results for community colleges in Ohio. Similar to these other rows, the ACT distributions look
more homogeneous while the remediation cutoffs in the right-hand column show much greater
heterogeneity. ACT cutoffs vary across these institutions between 14 and 24.
To exploit the differences across each institution, we follow a two-step procedure. First, we
estimate the "Community College Remediation Rule" for each community college. To do this, we
model the likelihood of taking remediation at a particular community college as a probit.14 We do so
To avoid this type of variation, we estimate the effect of remediation by comparing students from one institution with students from other institutions with similar students attending. 13 A similar methodology is used in Kane (2002). 14 We also estimate the model using a linear probability model. We did this because we did not want identification of the endogenous parameter to be made by the non-linearity in the model.

18
with two separate models. In the first, we control for both students' overall and math ACT scores. In
the second, we include controls for race, gender age, students post-secondary degree goal, general
ACT score, math ACT score, high school GPA, family financial background, students' high school
math grades and number of classes taken, the type of high school that students attend, and similar
variables for SAT score. 15 To control for non-linearities, we saturate the model with dummy
variables. Students' test scores enter the model linearly. We run this model for each community
college in our sample using data on students who attend each institution.
The probit models generate 19 sets of coefficients or remediation "rules," one for each
community college. For each set of coefficients, we generate a predicted probability of remediation
for each student in the sample. In the end, for each student and for every school, we obtain estimates
of the likelihood that the student would have taken remediation at that specific school.
Within subsamples of schools, there is substantial variation across these probabilities. Table
4 reports the average range of these probabilities for the first of our two models and the standard
deviation of these ranges. We compute this by taking the difference in an individual's maximum and
minimum predicted probability across the community colleges. For example, while an individual
might have a 20 percent chance of remediation at one community college, they may have a 90
percent chance at another. We then compute the average of these ranges across individuals and
report it in Table 4. For example, at state community colleges, the average range is 75.2 percent with
a standard deviation of 9.8 percent. Attending a different university can dramatically change the
likelihood that an individual student attends remediation. Local community colleges have less
variation with an average range of 38.1 and a standard deviation of 5.2. In Column 2 of Table 4, we
report likelihood ratio tests where we test whether the coefficients in our individual rules are equal.
For every subsample, the likelihood ratio rejects the hypothesis that the coefficients across colleges
are the same. Clearly, substantial variation exists across the data.
We interpret these results as meaning that remediation policies vary substantially across
colleges. If this is the case, then our identification strategy should identify the effects of remediation.
15 Because some community college students do not take the ACT or SAT, we create a dummy variable equal to one

19
However, there remains the possibility that the results simply mean the ACT math score is a poor
predictor of the likelihood of remediation. As Figures 2A and 2B demonstrate, this is clearly not
the case. Figure 2A plots the distribution of ACT math scores for state community colleges in Ohio.
In almost every case, the distribution of ACT math scores for remedial students is below the
distribution of ACT math scores for non-remedial students. Clearly, ACT math scores are correlated
with the likelihood of remediation. Figure 2B presents similar results for all of the community
colleges in Ohio.
Building the Instrumental Variable
We combine the probabilities of attendance and of remediation to build our instrument for
remediation. From the conditional logit results, we have an estimate of the probability of attendance
at any particular community college conditional on attending one of them. From the remediation
probabilities, we know the probability of remediation at an individual institution conditional on
attending that community college. Therefore, our instrument is calculated:16
Since we created the probabilities of remediation conditional on students' backgrounds, we include
all of the variables used in the probability estimation as covariates in our instrumental variables. As
a result in our first stage regressions, the instrument picks up the portion of the remediation
probability that varies according to distance and differences in colleges' remediation policies.
Intuitively, our instrument is a correction in the probability of remediation based on distance
to schools with different remediation policies. If we were to estimate a regression of the likelihood
of taking remediation on all covariates, we could generate predicted values for every person. If we
if the score is missing so that we may keep them in the analysis. 16 We have also estimated results using a second instrument based on the remediation probability at the school nearest to a given student as the instrument for that student. The results are similar.
∑ ∈==
Jj i
i
]collegeommunity any Attends| CC s]Pr[Attend CC Attends|RemedPr[ ]collegeommunity any Attends|RemedPr[
cjjcZ

20
ran similar regressions including our instrument, we could generate a second set of predicted values.
The difference between these two predicted values is the correction based on distance and different
remediation policies. This procedure is similar mathematically to what the first-stage does and may
be more intuitive.
Table 5 reports the first-stage estimates for each subsample of universities reporting the
coefficients and standard errors on our instrument in the respective models. The coefficients correct
for heteroskedasticity and show the coefficient for the instrument based on distance and the different
community college remediation rules. Among community colleges, the predicted probability of
remediation has a coefficient of .711 and is highly significant. The closer that a student lives to a
school with an expansive remediation policy, the more likely the student is to take remediation. Each
of the subsamples shows similar effects of our instrument on the likelihood of completing
remediation.
IV. The Effects of Remediation using Across-University Variation
We estimate the effects of the “intention to treat” on four related outcomes: drop-out rates,
GPA, degree completion, and transfer behavior to four-year institutions. The effects are estimated
using administrative data covering students' college experiences through the end of the winter
semester 2002. Since these students initially enrolled in fall 1998, these students should have
completed three years of college.
To measure the effects of remediation, we run the following regression model
Outcomei = α + β Remedi + γ Xi + e
where X is a matrix of individual characteristics that may influence both assignment to remediation
and students’ outcomes. Remediation enters the model as a dummy variable equal to one if the

21
person enrolled in any remedial math course.17 We report basic results using linear regression (OLS)
and the instrumental variable (IV) approach to deal with ability bias.
Tables 6a and 6b report the estimated effects of remediation on drop-out rates for traditional
and non-traditional students respectively.18 At all community colleges, about 61 percent of
traditional students and 50 percent of non-traditional students attended remedial courses. About 68
percent of traditional students who initially enrolled in 1998 have withdrawn from school by 2002.
About 79 percent of non-traditional students have also withdrawn.
The OLS estimates show at most a one percentage point effect although the estimated effects
are not significant. By contrast, the IV estimates suggest that remediated students are more likely to
withdraw from college than their counterparts. Since these estimates are due to exogenous variation
in college choice and institutional rules, this effect should not be due to selection issues. Across all
community colleges, the estimate is significant over a 95 percent confidence interval. This effect is
driven largely by the local community colleges where the estimated effect (13 percentage points) is
significant over a 95 percent confidence interval.
Interestingly, the OLS estimates are smaller in magnitude than the IV estimates. Since the
estimates are insignificant across most samples, this is not troubling; however, as will be seen below,
this is a consistent trend in our estimation strategy. We discuss possible reasons for it below.
Table 7a and 7b report the IV and OLS estimates for the effects of remediation on grade
point averages of traditional and non-traditional students.19 In this case, both the IV and OLS
estimates suggest that remediated students achieve lower grade point averages. The OLS estimates
suggest significant differences ranging from one-tenth of a GPA point to as much as four-tenths of a
GPA point. In every case, the OLS estimates are significant. For the IV estimates, the results are
similar in magnitude but insignificant. The estimated impact (0.2 points lower) is marginally
17 We focus on math remediation at this time. Later analysis will attempt to differentiate between students with varying amounts of remediation and include those in remedial writing or reading courses. 18 Students are considered “drop-outs” if they are no longer at any public, Ohio college at the end of the time period and have not received a degree. Since our data allows us to track students across public colleges in Ohio, we are confident that most of these students have indeed left higher education. Students who transferred to other colleges are not considered dropouts in this study as they have been in other work on the subject. 19 The GPA measure includes all courses taken at Ohio public institutions since Fall 1998.

22
significant in the sample of non-traditional students. This is roughly equivalent to non-remediated
students achieving one letter grade higher in one three-credit class in each of the six semesters that
these students attended.
Table 8a and 8b show the IV and OLS estimates of the effects of remediation on degree
completion while Tables 9a and 9b show the estimates for "transferring up" behavior. The OLS and
IV results suggest that traditional-age, remediated students are significantly less likely to complete a
degree within the period studied in this paper than non-remediated students. The estimated effect in
the IV specifications suggests an overall effect of 12 percentage points. The IV results also suggest
that non-traditional students in remediation are less likely to complete a degree than non-remediated
students. The estimates in Tables 9a and 9b suggest that remediation may lead to a small increase in
student transfer rates. Traditional-age students at both state and local community colleges are
significantly more likely to transfer to a four-year campus than non-remediated students.
As mentioned, one of the interesting features of Tables 6 through 9 is that the IV estimates
are often higher than the OLS estimates. For example, in Table 6 the estimated IV effects on drop-
out rates is much higher than the OLS estimates. Given that the possible selection bias is thought to
be negative (i.e. remediated students are more likely to perform worse than others), one might have
thought that the IV estimates would be smaller than the OLS estimates. There are several possible
reasons for this result.
One reason that IV may be greater than OLS is based on the fact that we are using cross-
university variation in remediation policies. For example, when examining the effect of remediation
on drop out behavior, the IV estimate is related to both the strength of the relationship between these
policies and dropout rates and the relationship between differences in remediation policies and
student characteristics. The weaker the latter relationship, the larger in magnitude the IV estimate
should be. Moreover, there may be compositional issues related to the size of community colleges
and the strength of their remediation policies that may lead OLS to be smaller than one might expect.
Large community colleges that unnecessarily remediate a large number of students may in part drive

23
the OLS estimate. The more that schools unnecessarily remediate students, the smaller the OLS
estimate.
Another reason that the OLS results may be smaller in magnitude than the IV results relates
to our instrument. Our instrument uses geographical variation to identify the probability of
remediation. The OLS estimates are largely based on comparisons of students within geographical
areas while the IV estimates are based on comparisons across geographical areas. If differences in
students across geographical areas are larger than differences within geographical areas, then IV
estimates may be larger than OLS estimates. While our analysis limits the sample to students who
are attending a community college, unobserved geographical heterogeneity within these students may
still account for the estimates.
Table 10 attempts to control for some of the heterogeneity between students. As mentioned
earlier, community college students at their initial enrollment declared whether or not they wanted to
attempt a degree. The analysis in this paper focuses on the set of students who declared that they
wanted to complete any degree – whether two-year or four-year. In Table 10, we control more
differences that may exist between students who intend to get different degrees. Specifically, we
estimate the following specification:
Outcomei = α + β1 Remedi + β2 (Intent=2yr) + β3 Remedi *(Intent=2yr) + γ Xi + e.
The specification controls for existing differences between students with different degree intentions
and allows remediation to affect them differently. The reported estimates are based on an IV
specification where our instrument is also interacted with the degree intent variable to create a second
instrument. The sample sizes are identical to those reported in other tables.
As Table 10 shows, the effect of remediation on stop-out behavior is largely focused on
students who intended to complete a two-year degree. The estimated effect is much larger and
suggests that remediation may derail their plans. The estimated effects on degree completion show
similar results. While remediation does decrease the likelihood that students finish a degree within
3.5 years of their initial enrollment it is event stronger for those students whose degree intention was

24
only two years. There are little significant differences in the effect of remediation on GPA or on
transfer behavior when comparing students with different degree intentions..
V. Conclusions
In summation, the IV estimates based on across-college variation suggests that students in
remediation at community colleges are more likely to withdraw from college and more likely to fail
to complete a degree within 3.5 years of their initial enrollment. Traditional-age students may be as
much as 12 percentage points less likely to graduate within 3.5 years if they took remediation. There
is mixed evidence on the effects of remediation on college GPA's. The IV estimates are all negative
but are not significant. Once we control for additional student heterogeneity, we find that remediated
students tend to have GPA's that are about 0.1 GPA points lower than non-remediated students. The
estimates for non-traditional students are similar. Finally, we do find some evidence remediation
improves the likelihood that traditional students transfer to four-year campuses. These IV estimates
depend on the assumptions that colleges are exogenously located and that they adopt remediation
policies that are unrelated to the geographic region where they are located.
Interestingly, the results are much weaker when we control for student heterogeneity in
degree intent. The observed negative effects are strongest for students who had an intention of
completing a two-year degree. While there are still some negative effects for other degree-seeking
remedial students (e.g. lower GPA and less degree completion), there is no increase in stop-out rates
for students who intended to complete a four-year degree. Remediation appears to discourage
students seeking two-year degrees but not students attempting four-year degrees.
These results contrast previous work (Bettinger and Long 2002) where remediation was
found to generate negative effects for students at four-year institutions. Students in remedial courses
at public four-year colleges in Ohio on average were more likely to drop-out, less likely to graduate,
and had lower college GPAs. This may suggest that while remediated students at four-year colleges
“mis-sorted” into the four-year system and then performed poorly, community college students do

25
not have the same problem. However, a story about negative peer effects in remedial courses could
explain the negative impact of remediation on some student outcomes at both four- and two-year
institutions.
REFERENCES
ACT (2002). http://ww.act.org/research/services/crsplace/index.html. Accessed on 2 Oct 2002.
Barron’s Educational Series. Barron’s Profiles of American Colleges. 21st Edition. Hauppauge, New York: Barron’s Educational Series, 1997.
Breneman, David W. and William N. Haarlow (1997) “Remedial Education: Costs and Consequences.” Remediation in Higher Education. Washington, D.C.: Thomas B. Fordham Foundation.
Card, David (1995) "Using Geographic Variation in College Proximity to Estimate the Return to Schooling". In L.N.Christofides, E.K. Grant, and R. Swidinsky, editors, Aspects of Labor Market Behaviour: Essays in Honour of John Vanderkamp. Toronto: University of Toronto Press, 1995.
Crowe, Edward (1998) “Statewide Remedial Education Policies—State Strategies that Support Successful Student Transitions from Secondary to Postsecondary Education.” Denver: SHEEO and ACT, Inc., September.
Education Commission of the States (2003). http://www.communitycollegepolicy.org/html/top.asp?page=/html/state_files_main.asp. Accessed on 13 September 2003.
Greene, Jay P. (2000) “The Cost of Remedial Education: How much Michigan Pays when Students fail to learn basic skills.” Mackinac: Mackinac Center for Public Policy, September.
Healy, Patrick. “CUNY Board Finds Itself Unable to Reach a Decision on Remedial Education.” The Chronicle of Higher Education 44:35 (8 May 1998): A37.
Healy, Patrick. “CUNY’s four-year Colleges Ordered to Phase Out Remedial Education.” The Chronicle of Higher Education 44:39 (5 June 1998): A26-A27.
Healy, Patrick and Sara Hebel. “Debate over CUNY’s Future Intensifies.” The Chronicle of Higher Education 45:40 (11 June 1999): A34.
Hebel, Sara (1999a) “N.Y. Board of Regents Approves CUNY Plan to Limit Remedial Education.” The Chronicle of Higher Education 46:15 (3 Dec. 1999): A33.
26
Hebel, Sara (1999b) “In CUNY Remediation Debate, the Numbers—and the Strategy—are in Dispute.” The Chronicle of Higher Education, vol. 46, no. 16, December 10, pp. A36-A37.
Higbee, Jeanne L. (1996) “Defining Developmental Education: A Commentary.” Chicago: National Association for Developmental Education.
Higbee, Jeanne L. and Patricia L. Dwinell (1997) “Do Developmental Education Programs Enhance Retention? A Commentary.” Chicago: National Association for Developmental Education.
Hoyt, Jeff E. and Colleen T. Sorensen (1999) “Promoting Academic Standards?: The Link between Remedial Education in College and Student Preparation in High School.” Department of Institutional Research & Management Studies, May.
Hoyt, Jeff E. (1999) “Remedial Education and Student Attrition.” Community College Review, vol. 27, no. 2.
Ignash, Jay (1997) “Who Should Provide Postsecondary Remedial/Developmental Education?” In J. Ignash, ed. Implementing Effective Policies for Remedial and Developmental Education. New Directions for Community Colleges No. 100. San Francisco: Jossey-Bass Publishers.
Kane, Tom (2002) “A Quasi-Experimental Estimate of the Impact of Financial Aid on College-Going.”
Koski, William S. and Henry Levin (1998) “Replacing Remediation with Acceleration in Higher Education: Preliminary Report on Literature Review and Initial Interviews.” Washington, D.C.: National Center for Postsecondary Improvement.
Lewis, Laurie, Elizabeth Farris, and Westat, Inc. (1996) Remedial Education at Higher Education Institutions in Fall 1995. Washington, D.C.: U.S. Department of Education, Office of Educational Research and Improvement.
McCabe, Robert H. (2001) “Developmental Education: A Policy Primer.” League for Innovation in the Community College, vol. 14, no. 1, February.
Mortenson, Tom (2002) “Chance for College by Age 19 by State in 2000.” Oskaloosa, IA: Postsecondary Education OPPORTUNITY, no. 123, September.
Ohio Board of Regents (2001) Ohio Colleges and Universities 2001: Profile of Student Outcomes, Experiences and Campus Measures. Columbus, O.H.: Ohio Board of Regents.
Ohio Board of Regents (2002) Making the Transition from High School to College in Ohio 2002. Columbus, O.H.: Ohio Board of Regents.
Phipps, Ronald (1998) College Remediation – What it is, What it costs, What’s at Stake. Washington, D.C.: Institute for Higher Education Policy.

27
Rouse, Cecilia (1995) "Democratization or Diversion? The Effect of Community Colleges on Educational Achievement." Journal of Business and Economic Statistics, vol. 13, no. 2, April, pp. 217-24.
Schmidt, Peter (1998) “A Clash of Values at CUNY over Remedial Education.” The Chronicle of Higher Education, vol. 44, no.28, March 20, pp. A33-A34.
Sheehan, Robert (2002). Personal Communication, 18 Sep 2002.
Sternberg, Ruth E. and Alice Thomas (2002) “Ohio’s Remedial College Courses costs Millions.” The Columbus Dispatch, August 12, pg. 01A.
Trounson, Rebecca (2002) “Cal State Ouster Rate Rises Slightly.” Los Angeles: The Los Angeles Times, Jan 31.
Wheat, I. David (1998) "Deficient Diplomas: Is it time for a Graduate Warranty Program?" Working Paper Thomas Jefferson Institute for Public Policy.
28
Figure 1: ACT Distributions and the Probability of Remediation SELECTIVE UNIVERSITIES
Freq
uenc
y
ACT Math Score5 10 15 20 25 30 3536
0
.120192
Diff
eren
ce in
Log
from
Max
ACT Math Score10 15 20 25 30 35 36
0
100
NON-SELECTIVE UNIVERSITIES
Freq
uenc
y
ACT Math Score5 10 15 20 25 30 3536
0
.226811
Diff
eren
ce in
Log
from
Max
ACT Math Score10 15 20 25 30 35 36
0
100
UNIVERSITY BRANCH CAMPUSES
Freq
uenc
y
ACT Math Score10 15 20 25 30 35 36
0
.152087
Diff
eren
ce in
Log
from
Max
ACT Math Score10 15 20 25 30 35 36
0
100
COMMUNITY COLLEGES
Freq
uenc
y
ACT Math Score10 15 20 25 30 35 36
0
.256623
Diff
eren
ce in
Log
from
Max
ACT Math Score10 15 20 25 30 35 36
0
100

29
Figure 2A. ACT Test Score Distributions by Remedial Status, State Community Colleges
0.0
5.1
.15
.2ac
t_rc
lrk/
act_
nrcl
rk
5 10 15 20 25 30 36ACT M ath Score
Clark
0.0
5.1
.15
.2ac
t_rc
nst/a
ct_n
rcns
t5 10 15 20 25 30 36
ACT M ath Score
Cincinnati
0.0
5.1
.15
.2ac
t_rc
scc/
act_
nrcs
cc
5 10 15 20 25 30 36ACT M ath Score
Columbusi
0.0
5.1
.15
act_
rnsc
c/ac
t_nr
nscc
5 10 15 20 25 30 36ACT M ath Score
Northwest
0.0
5.1
.15
act_
rosc
f/act
_nro
scf
5 10 15 20 25 30 36ACT M ath Score
Owens-Findlayi
0.0
5.1
.15
.2ac
t_ro
sct/a
ct_n
rosc
t
5 10 15 20 25 30 36ACT M ath Score
Owens-Toledo
0.0
5.1
.15
.2ac
t_rs
scl/a
ct_n
rssc
l5 10 15 20 25 30 36
ACT M ath Score
Southern-Central
0.1
.2.3
.4ac
t_rs
scn/
act_
nrss
cn
5 10 15 20 25 30 36ACT M ath Score
Southern-North
0.1
.2.3
act_
rssc
s/ac
t_nr
sscs
5 10 15 20 25 30 36ACT M ath Score
Southern-South
0.0
5.1
.15
.2.2
5ac
t_rt
rra/
act_
nrtr
ra
5 10 15 20 25 30 36ACT M ath Score
Terra
0.0
5.1
.15
act_
rwsc
c/ac
t_nr
wsc
c
5 10 15 20 25 30 36ACT M ath Score
Washington

30
Figure 2B. ACT Test Score Distributions by Remedial Status, Local Community Colleges
0.0
5.1
.15
act_
rccc
e/ac
t_nr
ccce
5 10 15 20 25 30 36ACT Math Score
Cuyahoga-East
0.0
5.1
.15
.2ac
t_rc
ccm
/act
_nrc
ccm
5 10 15 20 25 30 36ACT Math Score
Cuyahoga-Main
0.0
5.1
.15
.2ac
t_rc
ccw
/act
_nrc
ccw
5 10 15 20 25 30 36ACT Math Score
Cuyahoga-West
0.0
5.1
.15
.2ac
t_rje
ff/ac
t_nr
jeff
5 10 15 20 25 30 36ACT Math Score
Jef ferson0
.05
.1.1
5.2
act_
rlkcc
/act
_nrlk
cc
5 10 15 20 25 30 36ACT Math Score
Lakeland
0.0
5.1
.15
.2ac
t_rlc
cc/a
ct_n
rlccc
5 10 15 20 25 30 36ACT Math Score
Lorain
0.0
5.1
.15
act_
rrgcc
/act
_nrrg
cc
5 10 15 20 25 30 36ACT Math Score
Rio Grande
0.0
5.1
.15
.2ac
t_rs
ncl/a
ct_n
rsnc
l
5 10 15 20 25 30 36ACT Math Score
Sinclair

31
Table 1a: Students in the Ohio Community College System
All Students All degree-seeking students
Traditional-aged degree-seeking
students
Nontraditional degree-seeking
students
Age in 1998 24.39 (9.67)
[22,380]
21.53 (6.58)
[14,189] 18.63
(0.68) 27.88 (8.87)
Percent Female 50.5 53.8 52.5 56.7
Percent Black 14.2 14.4 12.5 18.4
Percent Hispanic 2.5 2.7 2.5 2.9
Percent Asian 1.2 1.2 1.0 1.6
Percent Ohio Resident 95.5 97.3 97.6 96.5
Intention to complete a Two-year Degree 28.6 45.3 39.1 59.0
Intention to complete a Four-year Degree 34.4 54.7 60.9 41.0
Enrolled in Remedial Math 45.7 57.2 60.9 49.1
Credits of Remedial Math attempted 4.175
(6.29) 5.33 (6.75) 5.71
(6.87) 4.52
(6.42)
Credits of Remedial Math Completed 2.55
(4.52) 3.29 (4.93) 3.54
(5.02) 2.75
(4.69)
Total Credit Hours (Fall98 – Winter02) 32.38
(33.70) 38.73 (34.86) 41.85
(34.72) 31.95
(34.19)
College GPA 2.23
(1.21) [10,566]
2.13
(1.15) [7,258]
2.04
(1.08) [5,230]
2.35 (1.28) [2,021]
Dropped Out before Winter 2002 76.1 70.9 67.5 78.4
Completed a Two- or Four-year degree 6.1 8.1 9.2 5.6
Transferred Up 6.1 8.3 9.8 5.1
Percent Took ACT 32.2 42.5 55.0 15.2
ACT Math Score (36 maximum)
18.75 (3.80) [7,270]
18.78 (3.82) [6,040]
18.61 (3.66) [5,358]
20.14 (4.65) [676]
ACT Overall Score (36 maximum)
19.14 (3.76) [7,270]
19.18 (3.76) [6,040]
18.97 (3.62) [5,358]
20.85 (4.40) [676]
Observations 22,557 14,213 9,742 4,447 Sample: First-time students entering the Ohio community college system in fall 1998. Notes: Standard deviations are shown in the parentheses. The number of observations for variables with less than the total is shown in brackets. “Degree-seeking” students denoted on their applications a desire to get an Associates or Bachelor degree or transfer to another institution (presumably a four-year institution). “Traditional” college students began when they were age 18, 19 or 20. Individuals without valid zip code information from their applications were dropped.

32
Table 1b: Students in State versus Local Community Colleges
All Degree-seeking Students Traditional-aged degree-
seeking students
Nontraditional degree-seeking students
State CC Local CC State CC Local CC State CC Local CC
Age in 1998 21.99 (6.89) [6,601]
21.14 (6.28) [7,588]
18.65 (0.69)
18.62 (0.67) 28.17
(8.72) 27.57 (9.02)
Female 52.9 54.7 51.8 53.1 55.1 58.5
Black 12.5 16.1 10.7 14.0 15.8 21.3
Hispanic 2.6 2.7 2.3 2.8 3.2 2.6
Asian 1.1 1.3 1.2 0.9 1.0 2.2
Ohio Resident 95.6 98.7 95.9 99.0 95.0 98.1
Intention: Two-year Degree 60.1 32.5 54.1 27.3 71.2 45.9
Intention: Four-year Degree 39.9 67.5 45.9 72.7 28.8 54.1
Took ACT 43.3 41.8 58.8 52.0 14.7 15.8
ACT Math Score (36 max)
18.63 (3.59) [2,866]
18.91 (4.01) [3,174]
18.54 (3.49) [2,523]
18.67 (3.81) [2,835]
19.35 (4.24) [339]
20.93 (4.91) [337]
ACT Overall Score (36 max)
18.97 (3.52) [2,866]
19.36 (3.96) [3,174]
18.83 (3.41) [2,523]
19.09 (3.79) [2,835]
20.02 (4.10) [339]
21.67 (4.53) [337]
Enrolled in Remedial Math 57.9 56.6 60.8 61.0 52.7 45.2
Observations 6,618 7,595 4,290 5,452 2,311 2,136 Sample: First-time, degree-seeking students entering the Ohio community college system in fall 1998. Notes: Standard deviations are shown in the parentheses. The number of observations for variables with less than the total is shown in brackets. “Traditional” college students began when they were age 18, 19 or 20. Individuals without valid zip code information from their applications were dropped.

33
Table 2: Students in Remediation at Ohio Community Colleges
All Degree-seeking Students Traditional-aged degree-
seeking students
Nontraditional degree-seeking students
No Remediation
Enrolled in Remediation No
Remediation Enrolled in
Remediation
No Remediation
Enrolled in Remediation
Age in 1998 22.04 (7.48) [6,070]
21.15 (5.80) [8,119]
18.60 (0.67)
18.66 (0.68) 27.83
(9.79) 27.93 (7.80)
Female 50.2 56.6 48.7 55.0 52.7 60.9
Black 8.9 18.5 6.6 16.4 12.9 24.2
Hispanic 2.1 3.1 1.5 3.2 3.1 2.7
Asian 1.3 1.1 1.0 1.0 1.7 1.4
Ohio Resident 96.5 97.8 96.9 98.1 95.9 97.0 Intention: Two-year Degree 46.6 44.4 41.8 37.3 54.5 63.7
Intention: Four-year Degree 53.4 55.6 58.2 62.7 45.5 36.3
Took ACT 45.3 40.4 59.4 52.2 21.7 8.5
ACT Math Score (36 max)
20.50 (4.13) [2,756]
17.33 (2.82) [3,284]
20.34 (3.98) [2,262]
17.34 (2.80) [3,096]
21.25 (4.67) [491]
17.18 (3.06) [185]
ACT Overall Score (36 max)
20.72 (3.91) [2,756]
17.88 (3.09) [3,284]
20.49 (3.75) [2,262]
17.86 (3.07) [3,096]
21.80 (4.37) [491]
18.32 (3.33) [185]
Average HS Math GPA
2.91 (0.75) [2,584]
2.43 (0.76) [2,967]
2.89 (0.75) [2,112]
2.44 (0.76) [2,783]
3.00
(0.78) [469]
2.30 (0.83) [181]
Number of years of Math in HS
7.16 (1.25) [2,635]
6.80 (1.40) [3,094]
7.17 (1.24) [2,162]
6.82 (1.40) [2,915]
7.10
(1.30) [471]
6.57 (1.41) [176]
Total Credit Hours (Fall98 – Winter02)
39.38 (37.07)
38.25 (33.09) 44.54
(37.27) 40.13
(32.87) 30.80 (35.10)
33.15 (33.18)
College GPA 2.36
(1.16) [3,136]
1.95 (1.10)
2.26 (1.09) [2,031]
1.91 (1.05) [3,199]
2.55
(1.26) [1,102]
2.11 (1.25) [919]
Dropped Out before Winter 02 68.4 72.8 64.1 69.7 75.7 81.3
Completed at least 2yr degree 11.5 5.5 14.7 5.7 6.2 5.0
Transferred Up 9.7 7.3 11.0 9.1 7.5 2.6
Observations 6,086 8,127 3,806 5,936 2,264 2,183 Sample: First-time, degree-seeking students entering the Ohio community college system in fall 1998. Notes: Standard deviations are shown in the parentheses. The number of observations for variables with less than the total is shown in brackets. “Traditional” college students began when they were age 18, 19 or 20. Individuals without valid zip code information from their applications were dropped.

34
Table 3: Conditional Logit & Distance
Sample Coefficient on Distance from
Conditional Logit
Number of Colleges
Number of Students
All Community Colleges -.1028 (.0015) 19 9,641
State Community Colleges -.0905 (.0020) 11 4,199
Local Community Colleges -.1503 (.0037) 8 5,442
Standard errors are in parentheses. Sample includes all students aged 18-20 who declared intent to pursue either an associates degree or transfer and get a bachelors degree. Table 4: Ranges of Predicted Probabilities of Remediation within University Groupings
Mean Range of
Predicted Probabilities within College Group
LR Test for Equality of Coefficients
(Chi-sq df)
All Community Colleges 74.5 (9.8)
1254.8 (54df)
State Community Colleges 75.2 (9.8)
939.2 (30df)
Local Community Colleges 38.1 (5.2)
288.2 (21df)
Notes: The mean range is computed by taking the difference in an individual's maximum and minimum predicted probability across the community colleges. For example, while an individual might have a 20 percent chance of remediation at one community college, they may have a 90 percent chance at another. The average of these ranges across individuals is reported. The likelihood ratio tests whether the “remediation rules” for each college are equal. Table 5: First-stage Estimates of Effect of Distance and Differences in Policies on Remediation Probabilities
Coefficient on Distance/Remediation Instrument
Traditional Students Nontraditional Students
All Community Colleges .711** (.018)
.593** (.028)
State Community Colleges .778** (.024)
.644** (.038)
Local Community Colleges .675** (.028)
.574** (.047)
** Significant at the 5% level

35
Table 6a: IV Estimates of Effect of Remediation on Dropout – Traditional Students Coefficient on Remediation Sample Percent in
Remediation Percent Dropout OLS IV
Community Colleges (N=8503) .6060 .6826 .0091
(.0107) .0660** (.0262)
State Community Colleges (N=3721) .6031 .6348 .0115
(.0167) .0515
(.0346)
Local Community Colleges (N=4782) .6081 .7200 .0035
(.0141) .1335** (.0423)
** Significant at the 5% level * Significant at the 10% level Notes: “Dropout” is defined as not being part of the Ohio public higher education system after three and a half years. Table 6b: IV Estimates of Effect of Remediation on Dropout – Nontraditional Students
Coefficient on Remediation Sample Percent in Remediation
Percent Dropout OLS IV
Community Colleges (N=4325) .4969 .7896 .0015
(.0129) .0842** (.0409)
State Community Colleges (N=2252) .5311 .7722 .0081
(.0186) .0572
(.0524)
Local Community Colleges (N=2073) .4597 .8085 .0041
(.0179) .2228** (.0689)
** Significant at the 5% level * Significant at the 10% level Notes: “Dropout” is defined as not being part of the Ohio public higher education system after three and a half years.

36
Table 7a: IV Estimates of Effect of Remediation on College GPA– Traditional Students Coefficient on Remediation
Sample Pct in Remediation
Mean College
GPA OLS IV
Community Colleges (N=8030) .6060 2.140 -.1322**
(.0241) -.0848 (.0583)
State Community Colleges (N=3445) .6031 2.291 -.1509**
(.0355) -.1275* (.0722)
Local Community Colleges (N=4585) .6081 2.026 -.1117**
(.0330) -.1390 (.0972)
** Significant at the 5% level * Significant at the 10% level Notes: Outcome is defined three and a half years after college entry. Table 7b: IV Estimates of Effect of Remediation on College GPA – Nontraditional Students
Coefficient on Remediation Sample Percent in
Remediation
Mean College
GPA OLS IV
Community Colleges (N=3952) .4969 2.4318 -.2786**
(.0389) -.214* (.122)
State Community Colleges (N=1991) .5311 2.5261 -.3665**
(.0535) .0295
(.1495)
Local Community Colleges (N=1961) .4597 2.3360 -.0671*
(.0353) -.5773** (.2139)
** Significant at the 5% level * Significant at the 10% level Notes: Outcome is defined three and a half years after college entry.

37
Table 8a: IV Estimates of Effect of Remediation on Degree Completion– Traditional Students Coefficient on Remediation
Sample Pct in Remediation
Pct Complete Degree OLS IV
Community Colleges (N=8503) .6060 .0929 -.06234**
(.0066) -.1213** (.0162)
State Community Colleges (N=3721) .6031 .1174 -.0944**
(.0110) -.1804** (.0229)
Local Community Colleges (N=4782) .6081 .0721 -.0353**
(.0081) -.0832** (.0242)
** Significant at the 5% level * Significant at the 10% level Notes: The outcome measures whether a students has received an Associates or Bachelor degree and is defined three and a half years after college entry. Table 8b: IV Estimates of Effect of Remediation on Degree Completion – Nontraditional Students
Coefficient on Remediation Sample Percent in
Remediation
Pct Complete Degree OLS IV
Community Colleges (N=4325) .4969 .0569 -.0074
(.0075) -.0952** (.0240)
State Community Colleges (N=2252) .5311 .0644 -.0087
(.0111) -.0828** (.0315)
Local Community Colleges (N=2073) .4597 .0487 -.0097
(.0102) -.0700* (.0381)
** Significant at the 5% level * Significant at the 10% level Notes: The outcome measures whether a students has received an Associates or Bachelor degree and is defined three and a half years after college entry.

38
Table 9a: IV Estimates of Effect of Remediation on Transfer Behavior– Traditional Students Coefficient on Remediation Sample Pct in
Remediation Pct Transfer
Up OLS IV
Community Colleges (N=8503) .6060 .0941 .0082*
(.0067) .0216
(.0164)
State Community Colleges (N=3721) .6031 .0989 .0200*
(.0104) .0315** (.0125)
Local Community Colleges (N=4782) .6081 .0901 .0017
(.0089) .0519* (.0266)
** Significant at the 5% level * Significant at the 10% level Notes: “Transfer Up” is defined as a transfer to any four-year institution within three and a half years of college entry. Table 9b: IV Estimates of Effect of Remediation on Transfer Behavior – Nontraditional Students
Coefficient on Remediation Sample Percent in Remediation
Pct Transfer Up OLS IV
Community Colleges (N=4325) .4969 .0462 -.0053
(.0061) -.0259 (.0193)
State Community Colleges (N=2252) .5311 .0435 -.0093
(.0083) -.0283 (.0234)
Local Community Colleges (N=2073) .4597 .0492 -.0030
(.0085) .0185
(.0316)
** Significant at the 5% level * Significant at the 10% level Notes: “Transfer Up” is defined as a transfer to any four-year institution within three and a half years of college entry.
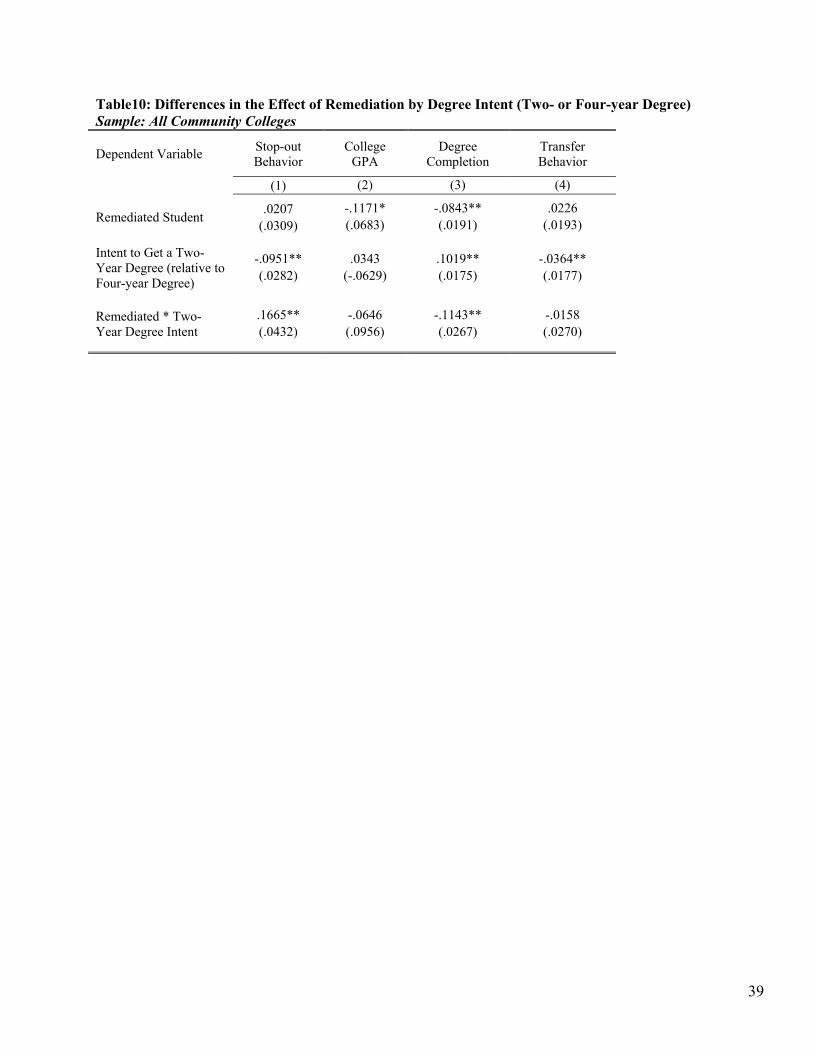
39
Table10: Differences in the Effect of Remediation by Degree Intent (Two- or Four-year Degree) Sample: All Community Colleges
Dependent Variable Stop-out Behavior
College GPA
Degree Completion
Transfer Behavior
(1) (2) (3) (4)
Remediated Student .0207 (.0309)
-.1171* (.0683)
-.0843** (.0191)
.0226 (.0193)
Intent to Get a Two-Year Degree (relative to Four-year Degree)
-.0951** (.0282)
.0343 (-.0629)
.1019** (.0175)
-.0364** (.0177)
Remediated * Two-Year Degree Intent
.1665** (.0432)
-.0646 (.0956)
-.1143** (.0267)
-.0158 (.0270)