the role of (alpha)s1-casein in the formation of the
TRANSCRIPT

Rochester Institute of TechnologyRIT Scholar Works
Theses Thesis/Dissertation Collections
8-1-1997
The Role of (alpha)s1-Casein in the formation ofthe Casein MicelleChinchi Chen
Follow this and additional works at: http://scholarworks.rit.edu/theses
This Thesis is brought to you for free and open access by the Thesis/Dissertation Collections at RIT Scholar Works. It has been accepted for inclusionin Theses by an authorized administrator of RIT Scholar Works. For more information, please contact [email protected].
Recommended CitationChen, Chinchi, "The Role of (alpha)s1-Casein in the formation of the Casein Micelle" (1997). Thesis. Rochester Institute ofTechnology. Accessed from

THE ROLE OF usi-CASEIN IN THE FORMATION
OF THE CASEIN MICELLE
by
Chinchi C. Chen
Submitted to the Graduate School
of the Rochester Institute of Technology
in partial fulfillment of the Requirements
of the degree
Master of Science
August 1997
Dr. Andreas Langner
Project Advisor
Dr. Gerald A. Takacs
Chair, Department of Chemistry
Rochester Institute of Technology
Rochester, New York 14623
Department of Chemistry

Statement of Authorization
Title of thesis: The Role of aSl-Casein in The Fonnation of the Casein
Micelle
I, Chinchi C. Chen, hereby grant pennission to the Wallace Memorial
Library of the Rochester Institute of Technology to reproduce my thesis in
whole or in part. Any reproduction will not be for commercial use or
profit.
Author: _
Date:
11

Dedicated to Mr. and Mrs. Chung-Shinn Chen
My dear parents
in

Acknowledgments
First, I would like to thank Dr. Andreas Langner for providing me
the opportunity to do my thesis work in his laboratory. His endless
support and enthusiasm during the past several years were invaluable to the
successful completion of this thesis. I will forever treasure his friendship.
I would like to thank the members of my family, especially my
parents. Their support and encouragement assisted me in becoming what I
am today.
Finally, I would like to thank my husband, Daniel, for his patience
and understanding during my frustrations, and for his excitement during
my success.
iv

THE ROLE OF asl-CASEIN IN THE FORMATION
OF THE CASEIN MICELLE
ABSTRACT
Caseins are the major protein components of milk. Bovine caseins
have been the most thoroughly studied and serve as the principal area of
research for the dairy industry. Bovine caseins are composed of several
major polypeptide families, ocsr, 0Cs2->P- and K-caseins. The ccsi-caseins
constitute 30.6% of bovine milk protein. The distribution of polar and
apolar amino acids within each asi -casein molecule tends to be
asymmetric, yielding protein molecules with hydrophobic and hydrophilic
domains that give the caseins excellent functional properties. Moreover,
the phosphoserine groups of ocsi-casein associate with calcium phosphate
complexes in milk to form loosely ordered aggregates, termed casein
micelles. This conformational feature renders asi-casein with great
capacity fkor the delivery of a highly nutritious solution of protein,
carbohydrate, phosphate, calcium and other minerals.
In this study, we have investigated the physical properties ofasi-
casein under different pHs and/or various concentration of calcium. The
fluorescence studies suggested that a decrease in pH and an increase of
calcium concentration switch the surrounding environment of Trp 164
from hydrophilic to hydrophobic. The results, obtained from the studies
of viscosity, phase separation and isoelectric point calculations, suggested
that phosphorylated asi -casein forms micelles at a pH of -5.5. This is
consistent with the pH where milk micelles form and; therefore, lends
evidence to the hypothesis that the main component of the micelle
framework in milk is asi-casein. In conjunction and our results with the
predicted secondary structure, we proposed that, at a pH -5.5, the negative
charges in the hydrophobic domain of asl -casein are neutralized and the
electrostatic repulsion of the hydrophilic domain is reduced. Therefore,
the protein-protein interaction is promoted and micelle formation is
favored.
vi

Tables of Contents
Title
Statement of Authorization ii
Dedication iii
Acknowledgments iv
Abstract of Thesis v
Table of Contents vii
List of Tables ix
List of Figures x
Introduction 1
Experimental 16
Reagents 1 6
Fluorescence Measurements 1 6
Phase Separation Measurements 1 9
ViscosityMeasurements 1 9
Results and Discussion 22
Binding Preference 22
Isoelectric Points of the Hydrophobic and Hydrophilic Domain 2 7
Phase Separation Studies 3 1
Viscosity Studies 3 6
Tryptophan in ccsi- and aS2-casein 38
Fluorescence Studies 4 0
Conclusion 53
References 56
vn

List of Tables
Table 1 . The approximate concentration of casein in mature human
milk and bovine milk 2
Table 2. Amount of calcium chloride added to a 3 mL cuvette for
each measurement for study of calcium binding effects on
the conformations of phosphorylated and dephosphorylated
a-casein 17
Table 3. pH of 0.5 g/L phosphorylated a-casein solution in 10 mM
pH 6.5 HEPES after addition of each drop of 0. 1 M HC1 20
Table 4. The pis of asi- and aS2-caseins: hydrophobic and
hydrophilic domains and the whole proteins 28
Table 5. The phase separation pHs obtained from HC1 titration 32
Table 6. Viscosity studies of 0.5 g/L phosphorylated a-casein 37
Table 7. The results of titration of a-casein with calcium chloride at
pH 7.4 43
Table 8. The wavelength of maximum emission of a-casein at pH 5
and 8 from a two Gaussian curve model 49
Table 9. The wavelength of maximum emission of a-casein at pH 5
and 8 from a single Gaussian curve model 50
vm
List of Figures
Figure 1. The primary sequence of asi -casein 6
Figure 2. The secondary structure of asi-casein 7
Figure 3. The primary structure of aS2-casein 8
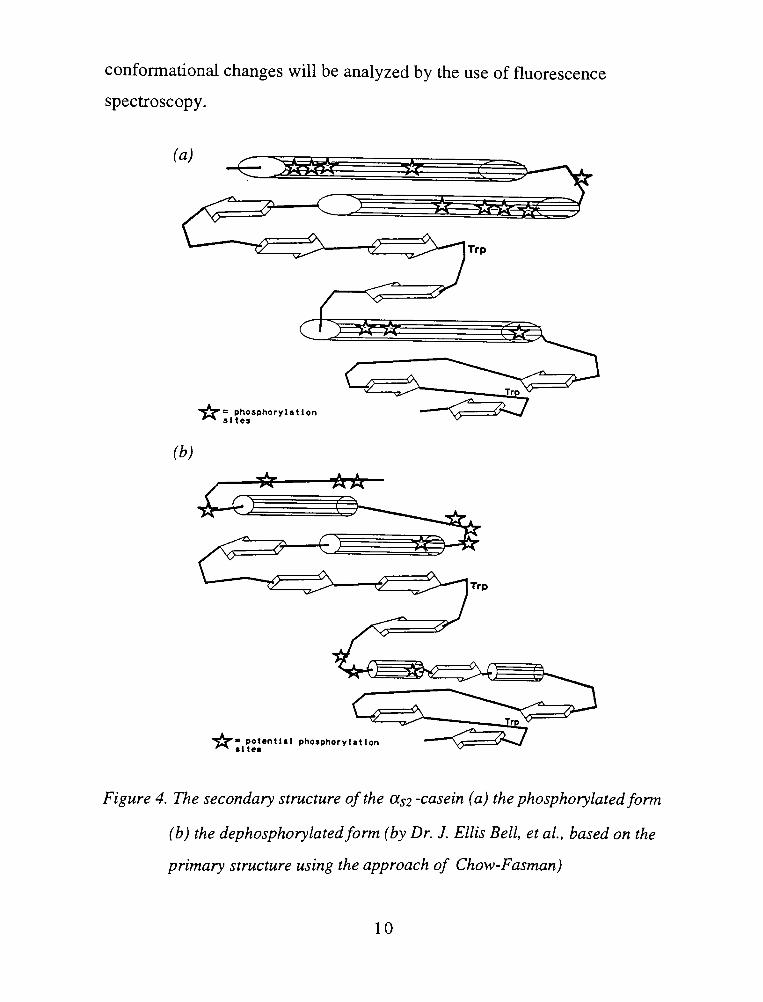
Figure 4. The secondary structure of the aS2-casein (a) the
phosphorylated form (b) the dephosphorylated form (by
Dr. J. Ellis Bell, et al., based on the primary structure using
the approach of Chow-Fasman) 10
Figure 5. Capillary viscometry. (a) A typical Ostwald viscometer (b)
Enlarged view of the capillary 12
Figure 6. UV absorption curves of the amino acids phenylalanine
(Phe), tyrosine (Tyr) and tryptophan (Tip) 14
Figure 7. The charge distribution of (a) phosphorylated and (b)
dephosphorylated asi-casein at various pHs: the
hydrophobic and hydrophilic domains and the total protein 29
Figure 8. The charge distribution of (a) phosphorylated and (b)
dephosphorylated aS2-casein at various pHs: the hydrophobic
and hydrophilic domains and the whole protein 30
Figure 9. Viscosity of a 0.5 g/L solution of phosphorylated a-casein
in varying pH 38
Figure 10. The tryptophan fluorescence spectra of the phosphorylated
and dephosphorylated a-casein at pH 7 41
Figure 1 1 . The effects of pH on the fluorescence emission spectra of
the phosphorylated a-casein 44
Figure 12. The effects of pH on the fluorescence emission spectra of
the dephosphorylated a-casein 45
ix

Figure 13. The effects of pH on the fluorescence emission spectra of
the dephosphorylated a-casein in the presence of calcium 46
Figure 14. The effects of pH on the fluorescence emission spectra of
the phosphorylated a-casein in the presence of calcium 47
Figure 15. The formation mechanism of a_i -casein micelles 55

INTRODUCTION
Milk is a highly nutritious substance. The composition of milk differs
among the various mammalian species. The fat content can range from a
trace amount to about 500 gram per liter (g/L), and the carbohydrate content
ranges from zero to about 100 g/L. All milk, however, contains a
considerable concentration of proteins. The protein content ofmilk of
various species ranges from 10 to 200 g/L. Casein forms the major protein
fraction in the milk of most mammalian species.
Mature human milk contains 0.9% protein. 30-35% of this
component is casein(l). Bovine milk contains 3.3% protein, of which the
casein fraction comprises 79.9%. The caseins are subdivided into several
classes on the basis of their electrophoretic mobility in alkaline-urea media.
a-, P-, and k- caseins are classified in order of decreasing mobility. The
relative molecular masses (Mr) of caseins generally range from 20 kDa to 43
kDa (2). Table 1 shows the approximate concentration of casein in mature
human and bovine milk.
a-casein consists of two components: as-casein which is sensitive to
precipitation by calcium and y-casein which is insensitive to calcium
precipitation. as-casein has been found to be non-homogenous and is
further designated into two classes which are asi and aS2- The two
members of the asi-class, asi and aso, differ by only one phosphate group,
with eight and nine phosphate groups respectively. 30.6% of the protein
fraction in bovine milk is asi- casein.(3) The four members of the aS2-class
are aS2, s3, aS5 and aS6 which have the same amino acid sequence(4), but
each has 13, 12, 11 and 10 phosphoserine residues, respectively. These
1

potential phosphorylation sites, as will be discussed later, play an important
role in establishing conformation. P-casein also has five potential
phosphorylation sites. Both a- and P-casein exist in extensively
phosphorylated forms, while K-casein contains only a single
phosphorylation site.
Human Milk Bovine Milk
mg/ml % of total protein mg/ml % of total protein
Total protein 9.0 100.0 33.0 100.0
Total casein 2.7 30.0 26.0 79.7
asi -casein not present not present 10.0 30.6
as2-casein not present not present 2.6 8.0
P-casein _ _ 9.3 28.4
y-casein _ _ _
K-casein - 3.3 10.1
-: data not available
Table 1. The approximate concentration of casein in mature human milk and
bovine milk
The primary structures of asi-, aS2-, P and K-caseins indicate that
specific residues in the molecules are phosphorylated. Most of the
phosphorylated residues are serine. Occasionally a few phosphothreonine
residues appear in the molecule. From a comparison of a number of such
sequences, a particular anionic triplet of amino acid residues has been
suggested to act as a signal to a specific kinase, to indicate which residue is

to be phosphorylated. All the serine/threonine residues which are converted
to phosphorus monoesters are located two amino acid residues away from
the N-terminal side of a negatively charged residue.
Four recognition amino acid triplets have been arranged in terms of
decreasing potential for phosphorylation (5): Ser-x-Glu > Thr-x-Glu > Ser-
x-Asp > Thr-x-Asp. The residue x can be any amino acid but some are
more suitable than others. For example, an acid residue at x, such as
glutamic or aspartic acid, enhances phosphorylation, whereas basic or bulky
residues tend to inhibit this reaction. The phosphorylated serine/threonine
can also act as the negatively charged residue similar to glutamic or aspartic
acid, to signal the site of phosphorylation.
Although the phosphorylated residues are primarily serine, many of
the serines remain unphosphorylated. The extent of phosphorylation of the
casein molecule affects its molecular conformation. The phosphoserine
residues contribute to the stability of casein micelles. Formation of casein
micelles will be discussed later. In fact, as little as 10% dephosphorylation
was found (6) to reduce markedly the amount of as-casein that could be
incorporated into micelles and, in comparison with normal milk, the
micelles were much smaller.
The casein molecules have hydrophobic regions whose distribution
vary in each of the individual classes.as\- and aS2- caseins show an even
distribution of hydrophilic residues but still contain large sections of
hydrophobic regions. P-casein is the most hydrophobic of the caseins. The
hydrophobic regions of p-casein are distributed along most of its chain, with
only the 50 N-terminalresidues containing an appreciable portion of
charged and hydrophilic residues. The large hydrophobic region in a- and

P- casein molecules prevent them from forming globular particles in which
the hydrophobic regions are buried in the interior (7). K-casein has most of
its basic and hydrophobic residues in the two-thirds ofmolecule near the N-
terminal and the bulk of the acid residues are present in the C-terminal
region. Only K-casein can exist by itself in the form of a rigid globular
structure, two-thirds of the molecule forms the core and the remaining
portion composes a highly solvated tail (6).
To lower the free energy, it is favorable for the non-polar area in
casein to cluster with similar residues in other molecules. This enables the
casein molecules to associate. In milk, the bulk casein aggregates as
colloidal complexes of protein and salts, which are constituted by a dense
hydrophobic core and a more hydrophilic outer layer, commonly believed to
be casein micelles. These micelles are made up of all four casein classes,
approximately in the ratio of asi : (P+y) : K : a_2 = 8:8:3:2 (8).
Although both asr and P-casein are the major components of milk micelles,
their structural features suggested that asi-casein may provide the main
framework of the micelles. The other caseins are also involved to a lesser
extent. The hydrophobic regions are buried in the interior of the complex,
leaving hydrophilic regions and the highly solvated segment of K-casein
exposed to the solution.
Naturally occurring micelles are formed at biological pH in the
presence of low concentrations of calcium and other cations. Calcium binds
to the phosphoserine or phosphothreonine residues, reducing the
electrostatic repulsion between the proteins and promoting interactions
between the hydrophobic regions. The remaining negative charges on the
surfaces of the casein micelles, help to prevent them from aggregating to

each other. As the concentration of calcium is increased, precipitation can
occur. For example, studies show that asi- and P- casein precipitate from
solution when the concentration of calcium is greater than 10 mM (9).
Any factor which reduces these negative charges will tend to allow
the caseins to associate (10, 11, 12), and precipitate from solution. For
example, lowering the pH of the solution reduces the ionization of the serine
phosphates, and encourages protein-protein interaction and therefore
precipitation. Previous studies have shown that, in the range of pH 4-6, the
caseins became insoluble, formed a curd and precipitated from solution (10).
The biological function of milk is to provide efficient nutrition for
young animals. The conformation of the micelle is ideally suited for this
purpose. The casein permits secretion of a highly concentrated solution of
protein, calcium, phosphate, and carbohydrates. The availability of minerals
from milk is known to be higher than from other foods. In addition, the
open sponge-like construction allows digestive enzymes to interact with the
protein chains to generate the individual amino acid residues, required for
maintaining life.
The complete structure of the micelle is still a matter of conjecture.
Although the mechanism of casein micelle formation has not been
elucidated in detail, there is little doubt that the formation of the micelle
correlates with the structures of asi -casein proteins, as described earlier.
Structures derived from X-ray crystallography are extremely useful in
elucidating functional relationships for many proteins. However,
mammalian asi -caseins are one class of noncrystalizable proteins. Thus, the
three dimensional structure of the caseins has not been measured. Several

research groups have tried to resolve as-casein structures by sequence-based
predictions of their secondary structure (13).
The primary sequence of asi-casein is known, shown in Figure 1 (13).
Kumosinski, et al. have assigned the secondary structure of a_i-casein by
comparing the results from several different sequence-based techniques,
including Chow and Fasman (14), Gamier, et al. (15), and Cohen, et al. (16,
17). They have adapted the secondary structural assignment of asi-casein
that had been reconciled with spectrophotometry data as a point of departure
for the generation of a three-dimensional model (18). Using Raman
spectroscopy, a three-dimensional structure for asi-casein protein was
proposed using the molecularmodeling program Sybyl from Triops. From
this, the secondary structure was predicted.
l 21RPKHPIKHQGLPQEVLNENLLRFFVAPFPQVFGKEKVNEL
41 61
SKDIGSESTEGDAMEDIKQMEAESISSSEEIVPNSVEQKH
81 101
IQKEDVPSERYLGYLEQLLRLKKYKVPQLEIVPNSAEERL
121 141
HSMKEGIHAQQKEPMIGVNQELAYFYPELFRQFYQLDAYP
161 181
SGAWYYVPLFGTQYTDAPSFSDIPNPIGSENSEKTTMPLW
Figure 1. The primary sequence of asi-casein
The best representation revealed the molecule to be composed
(right to left) of a short hydrophilic ammo-terminal portion, a segment of
rather hydrophobic p-sheet, the phosphopeptide region, and a short portion

of a-helix, which connects this N-terminal portion to the very hydrophobic
carboxyl-terminal domain which contains extended P-strands (Figure 2).
Seven out of the nine phosphoserine residues were clustered in an acidic
portion of the molecule bounded by residues 43 and 80 (the second fifth of
the molecule from the amino-terminal end). Both tryptophan (Tip164 and
Trpl99) were located near the hydrophobic C-terminal domain.
Figure 2. The secondary structure of asi-casein (Kumosinski, et al., Journal of
Dairy Science, vol. 74: 2889-2895)
Kumosinski, et al. have suggested that the high degree of
hydrophobicity exhibited by the carboxyl terminal half of the molecule
(residues 100 to 199) is probably responsible for the pronouncedself-
association of the Osi-casein chain in aqueous solution. Thisself-
association approaches a limiting size under conditions of low ionic
strength. The highly charged phosphopeptide region can readily account for
this phenomenon, as a consequence of charge repulsion.

Dr. J. Ellis Bell, et al. have predicted the secondary structure of
bovine aS2-casein based on its primary sequence, shown in Figure 3 (19).
The algorithm based on the approach of Chow and Fasman was
employed(20). For the dephosphorylated form of the aS2-casein molecule,
the conformational preference parameters of the normal amino acids were
used. For the phosphorylated form, the conformational parameter of
phosphoserine has been modeled using the Alchemy software. Modeling of
the structure of phosphoserine and various other amino acids have suggested
that aspartate or glutamate might be the most appropriated choices to use in
predictions in place of serine for sites containing phosphoserine. Careful
comparison of the minimized structures of phosphoserine, glutamate and
aspartate, indicated that glutamate was the closest to phosphoserine in terms
of both steric hindrances and charge distribution, and hence Bell et al. have
used the conformational preference parameters of glutamate in their
predictions of secondary structure for resides containing phosphoserine.
1 21
KNTMEHVSSSEESIISQETYKQEKNMAINPSKENLCSTC
41 61
LEVVRNANEEEYSIGSSSEESAEVATEEVKITVDDKHYK
81 101
ALNEINEFYQKFPQYLQYLYQGPIVLNPWNQVKRNAVPIT
121 141
PTLNREQLSTSEENSKKTVDMESTEVFTKKTKLTEEKNR
161 181
LNFLKKISQRYQKFALPQYLKTVYQHQKAMKPWIQPKTKV
201
IPYVRYL
Figure 3. The primary sequence of as2-casein

The predictions for asi-casein are shown in Figure 4 (on page 10). In
the dephosphorylated form there are two relatively large a-helices in theN-
terminal region of the molecule. The first a-helix begins just after the first
group of the phosphorylation sites in the molecule. The second region of
potential phosphorylation is located in a random turn. Upon
phosphorylation this region appears to form longer helices connected via a
shorter turn. This region in both forms is followed by a segment containing
several P-strands or other extended structures. Trpl09 is located in this
region. In the dephosphorylated form, this P-strand, or extended structure,
after the second potential phosphorylation site is followed by a turn-helix-
sheet-helix motif. In the phosphorylated form, the correspondent region to
this motif has a high helix potential. In either form, this region is followed
by another strand or extended structure where tryptophan 193 (Trpl93) is
located.
We have been interested in the mechanism involved in the formation
of casein micelles in bovine milk. We suspected that the asi -casein could
play an important role in casein micelle formation and its intramolecular and
intermolecular conformational changes are involved in this mechanism. In
this work we will examine these changes of asi -casein, in the
phosphorylated and dephosphorylated forms. A number of techniques will
be employed. The intermolecular conformational change will be studied
using ion titration methods. In addition, viscosity studies will be applied to
further identify the intermolecular conformational changes of asi -casein and
the pH dependence of casein aggregation. The intramolecular
conformational changes will be analyzed by the use of fluorescence
spectroscopy.
"_?_* = phosphorylation*^
sites^
(b)
^
"__' = potential phosphor**
sites<
Figure 4. The secondary structure of the (Xs2 -casein (a) the phosphorylatedform
(b) the dephosphorylatedform (by Dr. J. Ellis Bell, et al., based on the
primary structure using the approach of Chow-Fasman)
10

Formation of colloidal micelles and/or their complexes, termed phase
separation here, is expected when the negative charge density is reduced by
calcium binding or protonation. Further increases of calcium concentration
or a decrease in pH can cause casein precipitation. Although previous
studies have suggested that casein precipitated from solution occurs in the
range of pH 4-6, the precise pH at which casein forms micelles has not been
reported. Since asi-casein is the major component of bovine milk and, it is
believed to form the framework of the milk micelles, the exact pH at which
asi-casein micelles occur thereby should reflect the pH at which micelle
form in milk. Measurement of phase separation will be achieved by pH
titration studies where the intermolecular conformational changes can be
monitored directly by visual observation.
A more exact measurement ofmicelle formation can be performed by
the use of viscometry measurements. According to Newton's law of
viscosity, the frictional force, F, resisting the relative motion of two adjacent
layers in a liquid, is proportional to the cross-section area, A, and the
velocity gradient perpendicular to the flow, dv/dx.
.dv
F= riA
dx
The "viscosity coefficient", 77 , is a hydrodynamic property of the fluid. It
depends strongly on the geometric structure of, and the interactions between,
its molecules.
The contribution to viscosity by a solute polymer of concentration, c,
is characterized by its "viscosity number",?] v.
1(77-77.) 17]v.= - =
-Vsc r]0 c
11

or by its"intrinsic"
viscosity
lim r\v=
[77 ]c-0
where 77 0ts the viscosity of the solvent and 77 . is the specific viscosity of
the solute.
The appealing feature of viscosity measurements is their experimental
simplicity. In many cases, an inexpensive piece of glass apparatus, the
capillary viscometer, suffices for an accurate measurement of the viscosity
of a solution. Figure 5 represents a typical Ostwald viscometer.
^
v
(a) (b)
Figure 5. Capillary viscometry. (a) a typical Ostwald viscometer (b) Enlarged
view of the capillary
12

The cross-sectional area, A, is the area of the fluid parallel to the flow.
Hydrostatic pressure provides the motive force in a capillary viscometer. By
measuring the volume flux, dV/dx, the viscosity can be obtained from:
dt 8 77/
The conformational change or concentration change of as-casein will be
reflected by the elution time, t, for the solution to move from hltoh2 on the
Ostwald viscometer. Here V is proportional to t.
The intramolecular conformational changes of as-casein, as
mentioned above, will be studied using fluorescence spectroscopy.
Fluorescence spectra are characteristic of a substance. In many cases,
fluorescence may be detected even at very low concentrations
(10"
Mol/Liter). Fluorescence spectra are generally very sensitive to the
environment of the emitting chromophore. This sensitivity is a consequence
of the relatively long time a molecule stays in an excited singlet state before
deexcitation. Absorption is a process that is over in 1015second. On this
time scale, the molecule and its environment are effectively static. Another
environmental effect is the accessibility of a fluorescent chromophore to
collisional quenching by solute molecules. Therefore, fluorescence is
thought of as one of the most effective technique for following
conformational (environmental) changes.
The UV absorption of proteins is mainly caused by the aromatic
amino acid side-chains phenylalanine (Phe), trypotophan (Trp) and tyrosine
(Tyr) ,of which trypotophan is the most intensely fluorescent residue. The
absorption spectra of these three amino acid residues are shown in Figure 6.
Studies of the fluorescence of a typical protein with that expected from
13

tryptophan have shown that, except for a spectral shift, the spectrum of the
protein closely resembles that of pure tryptophan (19).
40000
2000 2200 2400 2600 2800
Wavelength [A)
3000 3200
Figure 6. UV absorption curves of the amino acids phenylalanine (Phe), tyrosine
(Tyr) and tryptophan (Trp).
The wavelength ofmaximum fluorescence emission is dependent on
the polarity of the environment of the chromophore. By examining the
fluorescence of the as-casein tryptophan in various buffers with different pH
and calcium concentrations, the relevant structure of asi-casein can be
deduced. The tryptophan fluorescence technique will be applied to monitor
the conformational (environmental) changes of as-casein. Using this
technique, the effects of phosphorylation, calcium binding and protonation
on the conformation (environment) of as-casein will be investigated.
14

The results of the above-mentioned experimental approaches, in
conjunction with the predicted secondary structure, will be used to propose a
model for the formation of the casein micelles which accounts for the
experimental observations.
15
EXPERIMENTAL
Reagents
All the buffer solutions with varied pHs were prepared from
imidazole, HEPES, sodium dihydrogen phosphate (NaH2P04) and calcium
chloride (CaCl2). Sources of materials were as follows : a-Casein, obtained
from bovine milk, was purchased from Sigma, Product Number (P.N.) C-
6780. Dephosphorylated a-casein, obtained from bovine milk, was
purchased from Sigma, P.N. C-8032. Imidazole (l,3-Diaza-2,4-cyclopenta-
diene), molecular weight equals 68.08 g/mol, Sigma P.N.I-0125. HEPES
(N-[ 2-Hydroxyethyl ] piperazine-N'-[ 2-ethanesulfonic acid ]), molecular
weight equals 119.98 g/mol, was purchased from Aldrich P.N. 22,990-3.
CaCl2 ,molecular weight equals 110.99 g/mol, was purchased from Aldrich
P.N. 22,992-4.
Fluorescence Measurements
The conformations of both phosphorylated and dephosphorylated a-
casein were examined in fluorescence studies. All fluorescence
measurements were obtained using a Jasco-FP550 spectrofluorometer
located at the Department of Oral Biology, Eastman Dental Center in
Strong Memorial Hospital. For all experiments, a three mL sample in a
quartz cuvette with a 1 cm path length was excited at 280 nm and the
emission was scanned between 300 nm and 400 nm, at room temperature.
Slit widths of 5 nm were used. All the data obtained from the tryptophan
16

fluorescence studies were analyzed using Peakfit software From Jandel
Scientific. The blank reference was subtracted from each measured
spectrum.
Stock solutions of 10 |iM imidazole buffer, 1 mM calcium chloride,
100 mM calcium chloride, 1 mg/mL of phosphorylated and 1 mg/mL
dephosphorylated a-casein were prepared for the studies of the effects of
calcium binding on the conformation (environment) of a-casein. 1 mg/mL
phosphorylated a-casein stock solutions were prepared using 10 (iM
imidazole, pH 7.4 as a solvent. Phosphorylated and dephosphorylated a-
caseins were stored in the freezer and then allowed to equilibrate to room
temperature before use.
Experiment Number Amount of added CaCl2 Final concentration of CaCl2
1 20 uL of 1 mM CaCl2 6uM
2 80 uL of 1 mM CaCl2 22 uM
3 100 uL of 1 mM CaCl2 28 uM
4 2 uL of 100 mM CaCl2 57 uM
5 35 uL of 100 mM CaCl2 990 uM
Table 2. Amount ofcalcium chloride added to a 3 mL cuvette for each
measurementfor study ofcalcium binding effects on the conformations of
phosphorylated and dephosphorylated a-casein
For measurements of tryptophan fluorescence, three mL of 10 |iM
imidazole pH 7.4 buffer was pipetted into the cuvette and the emission
spectrum determined as the blank reference. 500 (iL of a 1 mg/mL
17

phosphorylated a-casein stock solution was added in another cuvette with
the appropriate quantity of calcium chloride stock solution (Table 2, on page
18) to give the desired calcium chloride concentration. The calcium ion
concentration ranged from 6 uM to 990 uM. The fluorescence emission
spectrum was measured for each concentration. The same procedures were
followed for measurements of the dephosphorylated a-casein.
To determine the effects of pH, 1 mg/mL of the phosphorylated or
dephosphorylated a-casein were prepared with varied pH buffer solutions.
HEPES and phosphate buffers were employed. The HEPES was used for
pH 5, 6, 7 and 8 buffered solutions. The phosphate buffer was used for pH
7, 8 and 10 buffered solutions. Three mLs of each buffer solution was
pipetted into a cuvette and the emission spectrum was determined as a
blank. 200 uX of 1 mg/mL phosphorylated or dephosphorylated a-casein
stock solution was added into the cuvette to give a final a-casein
concentration of 0.062 mg/mL and the emission spectrum was recorded. 30
}lL of 100 mM CaCl2 stock solution was then added to have a final calcium
concentration of 0.93 mM. The emission spectrum was recorded again.
Studies of the effects of pH and calcium binding on the conformations
of a-casein were reproduced three times. The experiments were performed
at pH 5 and pH 8 respectively, using HEPES as the buffer solution. The
concentration of a-casein was 2.1 uM. and the calcium concentration was
0.93 mM for these two experiments. Measurements for each set of
experiments were repeated three times. The average data from the three
experiments were used for data analysis.
18

Phase SeparationMeasurements
The aggregation of a-casein was examined by monitoring the
appearance of colloidal complexes. 5 g/L of phosphorylated or
dephosphorylated a-casein stock solution were prepared using 10 mM
HEPES pH 8 buffer solution as the solvent. The stock a-casein solutions
were then diluted to the following desired concentrations: 5, 2, 1, 0.5, 0.2,
0.1, 0.05, 0.02, and 0.01 g/L. The casein solutions with the above
concentrations were titrated with 0. 1 M hydrochloric acid. The pH of each
sample was monitored by a Beckman pH meter. Titration was continued
until the appearance of colloidal complexes or precipitation was observed.
The pH of the phase separation event for each sample was recorded. The
measurements at each a-casein concentration were also conducted in a
0.93mM calcium chloride solution. Each measurement was repeated at least
twice.
ViscosityMeasurements
The aggregation of phosphorylated a-casein was investigated using
dilute solution viscosity. Stock solutions of 0.5 g/L phosphorylated a-
casein were prepared using 10 mM HEPES pH 7 stock buffer as the solvent.
The casein solution was titrated with 0. 1 M hydrochloric acid and its
viscosity was measured after eachtitration. The pH of each measurement is
listed in Table 3. The solutions were stored in the freezer, and allowed to
equilibrate to room temperature before taking measurements. The
19

experiments were performed on the Cannon-Fenske Routine Viscometer, an
Ostwald-type viscometer.
DropofHCl pH of PaC pH of 10 mM HEPES
0 6.28 6.50
1 6.13 6.35
2 5.97 6.06
3 5.72 5.63
4 5.39 4.98
Table 3. pH of0.5 g/L phosphorylated CC-casein(PccC) solution in 10 mMpH 6.50
HEPES after addition ofeach drop of0.1MHCl
15 mL of the sample solution were used for each measurement. The
viscometer was equilibrated in a 30C water bath. All solutions were
filtered through a 0.2 |iL microdisc to get rid of lint, dust, bacteria or other
solid materials in the sample solutions. After addition of the sample
solution, the viscometer was given approximately 15 minutes to equilibrate
to the bath temperature. The elution time, t, measured from position h1 to
position h2 was recorded. While measuring the time, the agitator of the
water bath was shut off in order to reduce the effects of vibrations. Our
experiments were performed at the Plasma Science Laboratory, A2 13, in the
Science Building.
After the elution time was measured, the sample was drawn back
above h, for the next measurement. Each sample was repeatedly measured
until three consistent data points were obtained whose elution times differed
20
by less than 0.05 seconds. All the samples were measured in the order of
high pH to low pH. After each measurement, the viscometer was cleaned by
eluting with distilled water followed by acetone and then dried by passing
dry, filtered air through the viscometer. Traces of the sample deposits on
the viscometer were removed with No-Cromix cleaning solution when
necessary.
21

RESULTS AND DISCUSSION
Binding Preference
As mentioned in the introduction, both calcium and pH can affect the
formation ofmicelles. In our experiments, calcium ions and protons were
both added in samples for studies of casein fluorescence and of phase
separation. It is important to know the binding preference of calcium and
protons to the target groups in the casein molecule, e.g. phosphate groups,
negatively charged amino acids. The following calculations were conducted
to decipher the binding preference results.
I. The binding preference of phosphate groups to calcium ions and
protons: The pKa ofH2PO4-
andHPO42-
are 7.2 and 3.0 respectively.
Under our experimental conditions, the phosphate groups can appear in the
form ofPO43-
,
H2PO4-and HPO42-. Thus, the binding preference of
phosphate groups,H2PO4-
andHPO42"
to calcium ions and protons must be
considered.
1-1. The monophosphate on the casein molecule (casein-HPO^r)
prefers to bind with the calcium ion rather than proton.
//-
ttha ^ +^?_-
um-x , ?+ rr[Casein - HPO4] [Ca2+]
(Casein - HP04 - Ca+) <- (Casein HP04) + Ca^+, Kca = :
*JL J
[Casein HP O4 - Ca+]
,-, Tt -.^ x ,-, m^an tt+ T^[Casein - HPOi]
[H+1 ,
1rNo*
(Casein - H2P04) <-> (Casein HP04) +H+
, Ka =^ : tt;V
J= 7.6 x
10"3
[Casein - H2P04]
*Ka here is assumed to equal the dissociation constant of the
individualH2PO4-
.
22

Assuming that, based on the considerations of the charge interaction, the
free energy change of calciumbound to (casein-HP04-) is twice that of
protons bound to(casein-HP04-
). Thus,
AGC_+ = 2AG_r
AGCaz+ : free energy change of calcium ion bound
to (Casein-HP04)
AGir : free energy change ofH+
bound to (Casein- HP04 )
Kca=e-AGca2+/RT
_e-2AGH*/RT
=(Ka)2
[Casein - HPQ4 - Ca+]_
[Casein HPQ4 Ca+] [Casein - HPQ4] [Ca2+]
[Casein - H2P04]
~
[Casein - HP04j [Ca2+1 [Casein - H2P04]
[Casein - HPO4] [H+]x
[Casein - HPO4] [H+]
1 K[Ca2+]
1 J^aKCa [H+]
1 [ Ca2+1-J- 1, under our experimental conditions
Ka [H+]
Thus, [Casein - HPO4- Ca+] [Casein - H P04]. This demonstrated that,
theoretically, monophosphate groups on the casein molecule prefer to be
bound to calcium.
23

1-2. Phosphate groups on casein molecule prefers to bind with Ca2+
rather thanH*
(Casein - P04 - Ca) <-> (Casein - PCJ") + Ca2+, Kca =[Casein - P(f] [Ca2+]
[Casein -P04 Ca]
(Casein -HPO4) <-> (Casein PC*) +H+
,Ka=
[Casein ' PQ^"] [H+]= 6.17 x
10"8*
[Casein - HPO4]
**K'a here was regarded as the Ka for the individual monophosphate.
Based on the assumption proposed above, K'ca = (K'a)2
[Casein - P04 - Ca] 1 /-fl2+ .
, .
,_ . . = 1, under our experimental conditions[Casein - HPO4] k
H+
Thus, [Casein - P04 - Ca] [Casein - HPO4]. This indicated that phosphate
groups on casein molecules prefer to be bound by Ca2+.
1-3. The ratio of rCasein-HPOa-Cal to [Casein-POd-Cal in the
solution: Based on the above calculations, both phosphate and
monophosphate groups on casein molecules are preferably bound by Ca2+-
It is necessary to know whether calcium ions prefer to bind with phosphate
or monophosphate groups.
[Casein - HPQ4 - Ca+]_
[Casein - HPQ4 - Ca2+] [Casein - HPQ4] [Ca*+]
[Casein - P04 - Ca ]
~
[Casein - HPO4] [Cif] [Casein - P04 - Ca ]
[Casein - K)l] [Ca2+]X
[Casein - Pd2/ ] [Ca2+]
24

1 [Casein HP04]^ca
KCa [Casein -P04]
"^(K'a)^H+]
(KaF"
K'a
= -L Ka [H+]^a
[Casein HP04 Ca+]_ ,n3ru+1
[Casein P04 Ca]
" 107 X 10 LH 1 , 1 under our experimental
conditions
Thus, [casein-HP04-Ca ] [casein-P04-Ca]. The results indicate that
calcium bound phosphate groups are more prevalent than calcium bound
monophosphate groups.
II. The binding preference of the charged amino acid residues to
calcium ions or proton: In addition to binding with the phosphate groups,
calcium ions and protons may also bind with the negatively charged amino
acids on the casein molecules. The selectivity of the amino acids between
calcium and proton must also be considered.
/?-, a * ^ +x / -1 a a n /-. ?-ut^- [Casein AA"] [Ca2+]
(Casein AA -Ca+) <- (Casein AA) + Ca2+, Kca =^ :_ A V. .
[Casein- AA-Ca+]
.-. TT1 a , /-, * ax + T^[Casein - AAT [H+]
(Casein HAA )<-> (Casein - AA) +H+ Kaa= ~
=,T A -,
[Casein HAA ]
9
Again, based on the assumption that was made previously, K"ca = (Kaa)
25
[Casein -AA Ca+]_ 1
__ [Ca2+]_ { [Ca2+]
KAA[Casein HAA] }Q [H+] Kaa [H+]
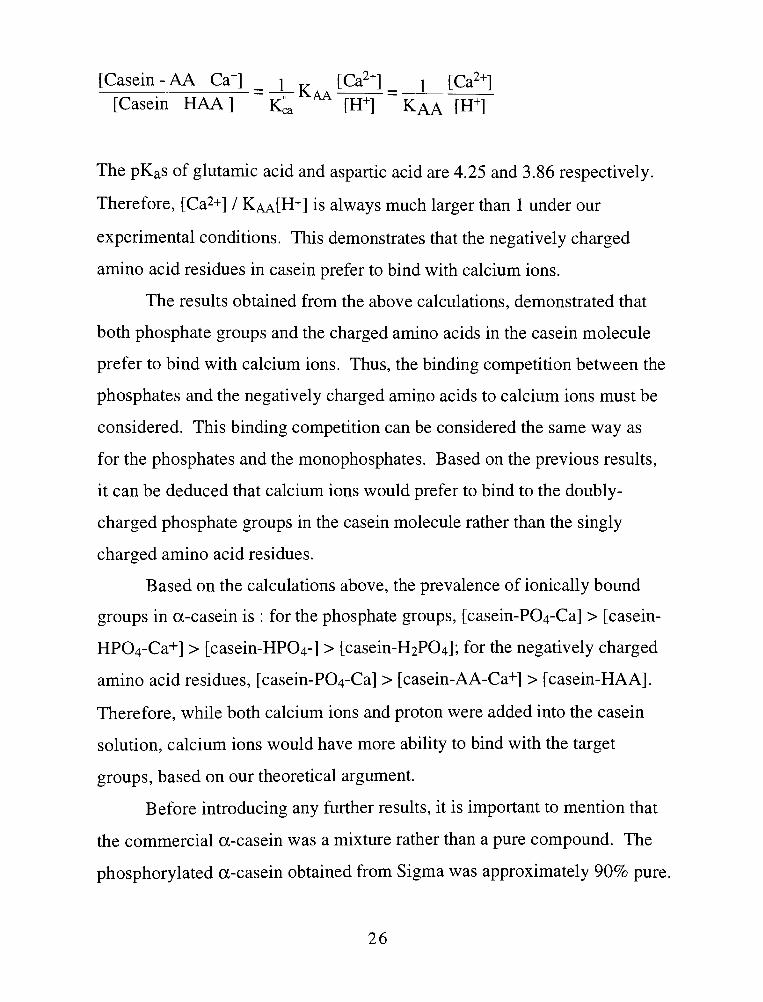
The pKas of glutamic acid and aspartic acid are 4.25 and 3.86 respectively.
Therefore, [Ca2+] / Kaa[H+] is always much larger than 1 under our
experimental conditions. This demonstrates that the negatively charged
amino acid residues in casein prefer to bind with calcium ions.
The results obtained from the above calculations, demonstrated that
both phosphate groups and the charged amino acids in the casein molecule
prefer to bind with calcium ions. Thus, the binding competition between the
phosphates and the negatively charged amino acids to calcium ions must be
considered. This binding competition can be considered the same way as
for the phosphates and the monophosphates. Based on the previous results,
it can be deduced that calcium ions would prefer to bind to the doubly-
charged phosphate groups in the casein molecule rather than the singly
charged amino acid residues.
Based on the calculations above, the prevalence of ionically bound
groups in a-casein is : for the phosphate groups, [casein-P04-Ca] > [casein-
HP04-Ca+] > [casein-HP04-] > [casein-H2P04]; for the negatively charged
amino acid residues, [casein-P04-Ca] > [casein-AA-Ca+] > [casein-HAA].
Therefore, while both calcium ions and proton were added into the casein
solution, calcium ions would have more ability to bind with the target
groups, based on our theoretical argument.
Before introducing any further results, it is important to mention that
the commercial a-casein was a mixture rather than a pure compound. The
phosphorylated a-casein obtained from Sigma was approximately 90% pure.
26

As mentioned in the introduction, as-casein has been further designated into
two classes : asi- and aS2- casein. Both of these components were present
in the a-casein obtained from Sigma. The structures of these two classes of
casein based on sequence-based modeling techniques (17) were quite
different and, thus, expected to exhibit different physical properties. This
was taken into consideration before conducting any experiments and while
analyzing and interpreting the results in the following calculations,
measurements and analyses.
Isoelectric Points of the Hydrophobic and Hydrophilic Domains
For molecules to form micelles, their structures must contain a
hydrophobic domain at one end of the molecule and a hydrophilic domain at
the other end. The hydrophobic domain interacts with similar residues in
other molecules when it gets neutralized and the hydrophilic domain
interacts with solvent to stabilize the micelle conformation. Therefore, the
isoeletric point (pi) of the hydrophobic domain can give an approximate
indication of the pH at which the molecules form micelles.
In order to calculate the pis, the location of the hydrophobic domains
of asi- and aS2- caseins had to be defined. However, there is no clear
definition of a hydrophobic domain for either asi-casein or aS2-casein. We
roughly estimated the location of the hydrophobic domain based on the
currently available literature. For asi-casein, observations of the
distribution of the charged amino acids, computer modeling of three
dimensional structure of asi-casein (18), and enzyme digestion by chymosin
(20) all suggested that the carboxyl terminal half of the molecule, residue
27

100 199, could be involved in hydrophobic sheet to sheet interactions. The
hydrophobic domain of aS2-casein was estimated based on the distribution
of the charged amino acids in the sequence and its three dimensional
structure based on computer modeling. The estimated hydrophobic domain
of aS2-casein was also located at the carboxyl terminal half of the molecule,
residue 103-207.
Total Hydrophobic Hydrophilic
asi- Casein Phosphorylated 4.2 5.2 3.4
Dephosphorylated 4.8 5.5 4.3
ocs2- Casein Phosphorylated 4.5*
3.3
Dephosphorylated 5.7*
4.3
*. never attains the neutral point at the pH range of our experiment
Table 4. The pis ofasj-
and aS2 -casein : hydrophobic and hydrophilic domains
and the total protein
Based on reported pKa values for the amino acids, the charge
distribution of the hydrophobic and hydrophilic domains of asi- and aS2~
caseins at various pHs were calculated and are shown in Figures 7 and 8 (on
page 29 and 30), respectively, pi values for both asi- and aS2-caseins are
listed in Table 4 (above). The pi of the hydrophobic domain of asi-casein
was found to be at pH 5.2. For the dephosphorylated asi-casein, the
calculated pi of the hydrophobic domain was found to be at pH 5.5. For
aS2-casein, the pis of the hydrophobic domains for both phosphorylated and
28

dephosphorylated forms were greater than 10. As mentioned before,
previous studies suggested that the caseins became insoluble, formed a curd
(a) phosphorylated
03
O)i_
CO
O
(b) dephosphorulated
25
CD
Oj
CO
x:
O
6.5 7 7.5 8
Hydrophobic Hydrophilic Total
Figure 7. The charge distributionfor {a) phosphorylated and (b)dephosphorylated
asj-casein at various pHs: hydrophobic and hydrophilic domains and
the total protein
29

(a) phosphorylated
(b) dephosphorulated
30
0
-5
-10
-15
^%^
'^^^e^^::oiooi::icx:HOOo
' I i i i
3 a5 4 4^5 5 5!5 6 63 7 7\5 8
pH
-- Hydrophobic Hydrophilic Total
Figure 8. The charge distributionfor (a) phosphorylated and (b)dephosphorylated
aS2-casein at various pHs: hydrophobic and hydrophilic domains and
the total protein
30

and precipitated from solution in the range of pH 4-6. The calculated charge
distributions correlate with this reported observation. The charging of the
hydrophobic domain of asl -casein could be used to predict micelle
formation.
Phase Separation Studies
As mention earlier, the bulk of the casein molecules occur in milk in
the form of micelles. This colloidal micelle complex is in dynamic
equilibrium with its environment (21,23). The precise pH at which casein
micelles form has not been reported. We conducted the phase separation
experiments to determine the pH at which formation of a-casein micelles
occurs. During the experiments, while the pH was lowered, the electric
repulsion between the casein molecules was reduced and, thus, the protein
molecules started to aggregate in solution. The aggregated a-casein
molecules refracted the light and were clearly visible.
In the phase separation studies, a wide concentration range (0.01 5.0
g/L) of a-casein was examined. The solutions were titrated with 0. 1 M
hydrochloric acid. The initial casein solutions were transparent and during
titration with hydrochloric acid they became cloudy. The pH of each
solution at this point was referred to as the phase separation pH. The effects
of calcium on formation of a-casein micelles was also investigated. The
results of the phase separation studies are listed in Table 5.
For phosphorylated a-casein, the phase separation pH values were
observed at pH 5.4 - 5.7 under all investigated concentrations. This
31

indicated that phosphorylated a-casein molecules aggregated to form
micelles at pH 5.4 -5.7. Whereas with the addition of calcium, the phase
separation pH values decreased with decreasing concentration of casein in
solution. Similar phenomena were also observed for dephosphorylated a-
casein. The phase separation pH values decreased with a decrease in
concentration of protein with/without the addition of calcium. A detailing of
this behavior follows.
Material Cone. (g/L) PH Solution
PaCa5.0-0.01 5.7-5.4 Cloudy
5.0- 1.0 5.5 5.4 Cloudy
PaC +Ca2+
0.5-0.2 -5.2 Slightly cloudy
0.1 -0.01 4.4 - 4.0 Slightly cloudy
5.0-0.5 6.10-5.8 Cloudy
DPaCb 0.2 5.11 Cloudy
0.1 -0.02 4.4 - 4.2 Slightly cloudy
0.01 No change
5.0-0.5 6.10-5.8 Cloudy
DPaC+ Ca2+ 0.2-0.1 5.5 5.3 Cloudy
0.05 - 0.02 4.9-4.5 Slightly cloudy
0.01 No change
a: PaC: Phosphorylated a - Casein
b: DPaC: Dephosphorylated a - Casein
Table 5. The phase separation pHs obtainedfrom HCl titration
32

For dephosphorylated a-casein, phase separations appeared between
pH 6. 10 to 4.20 and varied with the protein concentration. At the
concentration range of 5.0 to 0.5 g/L, a milky casein solution was observed
around pH 6.0. With the addition of 0.93mM calcium chloride, the phase
separation pH values did not change; but it remained around pH 6.0. Thus,
we can speculate that, under the two highest concentration conditions, the
observed phase separation occurred owing to the precipitation of the protein
rather than the formation of micelles.
As the concentration of the dephosphorylated a-casein was decreased,
the phase separation pH value also decreased. The phase separation points
were observed at pH -5.1 and pH -4.3 corresponding to the concentrations
of the dephosphorylated a-casein at 0.2 and 0.1- 0.02 g/1 respectively. We
can speculate that, unlike the case of phosphorylated a-casein, the milky
solution observed here was actually caused by aggregation of the micelles of
the dephosphorylated a-casein, referred to as a "multi-micelle complex".
The size of the micelle of the dephosphorylated a-casein was believed to be
smaller than those of the phosphorylated one since less negative charges are
distributed on the surface of the micelles. These micelles were too small to
be visualized by light refraction. Decreasing the pH, neutralized the
negative charges on the surface of the micelles, enabled the micelle to
coagulate with each other and form a "multi-micelle complex". This
complex was large enough to be visualized by refracting light. No colloidal
mixture was observed at a concentration of 0.01 g/1 of dephosphorylated a-
casein solution. That was because this concentration was too dilute for
dephosphorylated casein micelles to form a "multi-micelle complex".
33

The phase separation pH values for dephosphorylated a-casein in the
presence of calcium were higher than those in the absence of calcium, under
the same casein concentration ranges. The phase separation points were
observed at pH -5.4 and pH - 4.7 corresponding to the dephosphorylateda-
casein concentration of 0.2 0. 1 g/Land 0.05 - 0.02 g/L in the presence of
calcium. This showed that the addition of calcium into the
dephosphorylated as-casein solution made the outer part of the micelle
become more positive. Thus, the "multi-micellecomplex"
can be formed at
higher pH. No phase separation was observed at very dilute concentrations
of dephosphorylated as-casein, 0.01 g/L, even with the addition of calcium.
In our experiments, the physical properties of phosphorylated asi-
casein with the addition of calcium were similar to those of
dephosphorylated a-casein. The phase separation pH values of
phosphorylated a-casein in the presence of calcium chloride were also
decreased with a decrease in concentration. The phase separation pH values
were observed at pH - 5.2 and pH - 4.2 corresponding to the concentrations
of phosphorylated a-casein at 0.5 0.2 g/L and 0. 1 0.01 g/L respectively.
This phenomena can be explained by the argument stated previously for
dephosphorylated a-casein. Addition of calcium chloride neutralized the
negative charges on the phosphate groups, reducing the overall charges on
the surface of the micelle, thus, producing small invisible micelles. Phase
separation was not observed until the pH of the solution decreased to a point
at which the small, invisible micelles aggregated and became visible.
Notice that, unlike dephosphorylated a-casein, the phosphorylated a-
casein micelles that formed in the presence of calcium can be observed at
pH - 4.2 at the dilute concentration 0.01 g/L. In spite of the fact that the
34

phosphorylated a-casein with the addition of calcium formed smaller
micelles, these micelles must be larger than those of dephosphorylated a-
casein.
The behavior of phosphorylated a-casein was similar to that of
dephosphorylated a-casein only in the low concentration range, 0.5 0.01
g/L. At the higher protein concentration solutions, 5.0 -1.0 g/L, phase
separation was caused by a salting-out precipitation of the protein-calcium
binding complexes rather than the "multi-micelle complex".
The results of the phase separation studies can be summarized as
follows. For phosphorylated as-casein, the micelles formed at pH 5.4 -5.7.
This was consistent with the pH where milk micelles form. With the
addition of calcium ions, phosphorylated as-casein molecules are salted out
at high concentrations. At the lower concentrations, the phosphorylatedas-
casein molecules behaved similarly to dephosphorylated a-casein. The
phase separation pH values decreases as the casein concentration decreases.
Dephosphorylated a-casein precipitated out of solution at high protein
concentration through protein aggregation. At low protein concentration,
the micelle could only be seen in the form of multi-micelle complexes at pH
-5.1, lower than the phase separation pH of phosphorylated a-casein. With
addition of calcium ions, the multi-micelle complex could be visualized at
higher pH values compared to those in the absence of calcium.
Our results from phase separation studies seemed more consistent
with the calculated pi of the hydrophobic domain of the asi-casein than that
of the aS2-casein. This lends evidence to the hypothesis that the main
component of the micelle framework in milk is asi-casein. The pi of the
hydrophobic domain of the phosphorylated asi -casein was calculated to be
35

pH 5.2. In the phase separation studies, the formation of a-casein micelles
was found to occur at pH -5.5. For dephosphorylated asi -casein, the
calculated pl of the hydrophobic domain was calculated to be pH 5.5. As
we have learned from the phase separation studies, the multi-micelle
complex of the dephosphorylated a-casein could be observed at pH -5.1. A
possible reason for the difference in calculated and experimental results,
may lie in the fact that the pi calculations were based on the individual pKas
of the side chain of each individual amino acid and the monophosphoric
groups. The overall trend observed for the calculations, however, is
consistent with the experimental results.
For aS2-casein, the pis of the hydrophobic domains of both
phosphorylated and dephosphorylated forms were greater than 10. Those of
the hydrophilic domains were pH 3.3 and 4.3 respectively. The pi of the
whole molecule of phosphorylated aS2-casein was pH 4.5 which was lower
than the pH of formation of asi -casein micelles. Therefore, our results both
for the pi calculations and the phase separation studies suggested that it is
likely that aS2-casein molecules is not as an important component
participating in the formation of milk micelles.
Viscosity Studies
As suggested above, both pi calculations and phase separation studies
suggest that asi-casein forms the main component of milk micelles. For
further evidence to substantiate this suggestion, viscosity experiments were
performed on a-casein to monitor the pH at which the micelles form.
36

0.5 g/L of phosphorylated a-casein was prepared using HEPES (10
mM pH 6.5) as a solvent. At pH 6.5, phosphorylated a-casein should be
randomly distributed in the solution. The pH of the protein solution was
increased through dropwise addition of 0. 1M hydrochloric acid. The
Ostwald viscometer (Figure 5) was used to measure the elution time of the
solution. 15 mL of the protein solution was loaded into the viscometer. The
time was measured for the protein solution to travel through the capillary of
the viscometer, from position \ to \ , under the force of its own weight.
The results of the viscosity studies are listed in Table 6.
PH Elution (sec)
6.35 228.15
6.06 228.47
5.63 229.26
4.98 231.36
PH Elution (sec)
6.28 227.41
6.13 228.05
5.97 228.75
5.72 225.62
5.39 227.53
(a) 10 mMpH 6.5 HEPES (b) 0.5 g/L phosphorylated a-casein
Table 6. Viscosity studies of0.5 g/L phosphorylated a-casein
In the control experiments, the elution time of the HEPES always
increased with decreasing pH. The elution time of the casein solution only
increased when the pH decreased to pH 5.97. Continued lowering of the pH
resulted in the decrease of the elution time. Further decrease of pH
increased the elution time again. As shown in Figure 9, the viscosity of
phosphorylated as-casein suddenly dropped at a pH of about 5.7. This
37

observation conflicts with the property of the globular proteins that,
regardless of size, globular proteins have essentially the same intrinsic
viscosity. Therefore, the drop in viscosity, implied that the phosphorylated
a-casein micelles did not exist as globular conformation above this point.
The decrease in viscosity can be interpreted by a change to a globular
structural, either single chain or micelle, between pH 5.9 and 5.7.
1.015
1.01
1 .005
CO
o
CO l
i>
T3CD
g 0.995
TJCU
rr
0.99
0.985
0.98
0.5 g/L Phosphorylated a-Casein
5.3 5.4 5l5 5l6 5J 5!8 5^9 6 6A 6^2 6.3
Solution pH
Figure 9. Viscosity ofa 0.5 g/L solution ofphosphorylated a-casein in varying pH
Tryptophan in asi-Casein and aS2-Casein
It was clearly demonstrated that intrinsic protein fluorescence
originated from the aromatic amino acids, phenylalanine, tyrosine, and
tryptophan. In most proteins, the fluorescence is dominated by tryptophan.
38

It has been extensively reported that tryptophan fluorescence can be used to
monitor the structure of the protein. We applied tryptophan fluorescence
measurements to monitor the conformational (environmental) changes ofa-
casein which occurs with changing pH and calcium concentration. Both
asi- and aS2- casein contain two tryptophans per molecule. It was important
to know where the tryptophans were located in the molecule in order to
interpret the fluorescence results.
The asi -casein molecule shows a high degree of hydrophobicity at the
carboxyl terminal half of the molecule, residues 100-199 (21). A short
segment of a-helix connects the C-terminal portion to the hydrophilic
amino-terminal portion. Seven out of eight phosphoserine are clustered
within this highly charged domain. This specific feature of the structure of
asi-casein prevents the problems associated with precipitation from
solution.
The two tryptophans of asi-casein are both located within the
hydrophobic carboxyl terminal end, one at position 164 (Trpl64) and
another at position 199 (Trpl99) (Figure 2). Both Trp 164 and Trp 199 are
buried in the hydrophobic C-terminal domain predicted by the three-
dimensional molecular model of asi-casein by Kumosinski, et al. (18).
Thus both the tryptophan fluorescence spectra must exhibit hydrophobic
character.
However, some experimental evidence demonstrated that the
fluorescence change in casein solutions induced by proteolytic enzymes was
due to the existence of Tip164 that, upon hydrolysis, became exposed to a
more hydrophilic environment (22). Therefore, Ostoa-Saloma, et al.
39

suggested that the region surrounding Trp 164 could behave paradoxically
as a hydrophilic segment as a consequence of conformational constraints.
aS2-casein shows a more even distribution of hydrophilic residues as
indicated by its primary structure. Its tendency to form micelles is not as
pronounced as asi-casein. There are also two tryptophans in each aS2-
casein molecule. Both tryptophans are located in the regions containing
charged residues, one at position 109 (Trpl09) and the other at position 193
(Trpl93). According to Dr. Ellis Bell's secondary structure prediction of
aS2-casein, given in Fig 4, Tip109 is located between two a-helices which
contain four and three potential phosphorylation sites, respectively. Once
these potential phosphorylation sites have been phosphorylated, the
electrostatic repulsion between the negative charges on the phosphate
groups of the two helices are predicted to force the two helices to "open".
Thus, Tip 109 becomes more hydrophilic. Reducing these negative charges
is expected to make the two helices "close", making Trpl09 becomes less
solvent-accessible. Therefore, Trpl09 in aS2-casein has similar
characteristics to Tip164 in asi -casein upon the conformational changes of
the casein molecule.
Fluorescence Studies
We applied tryptophan fluorescence measurements to monitor the
conformational (environmental) changes of a-casein upon the change in pH
and calcium concentration. In the following fluorescence studies,
measurements were made with the excitation wavelength at 280 nm, the
40

wavelength of maximum absorption of tryptophan. The emissions were
monitored between 300 nm and 400 nm.
The Effects of Phosphorylation on Casein Fluorescence Spectra: The
tryptophan fluorescence of both phosphorylated and dephosphorylated a-
casein were measured. The tryptophan fluorescence was measured at a
protein concentration of 1 mg/mL in imidazole buffer (10 pM, pH 7.4).
Based on our previous results of phase separation and viscosity studies, both
phosphorylated and dephosphorylated a-casein exist as single chains rather
than a micellular structure under these conditions. The differences in
fluorescence between phosphorylated and dephosphorylated a-casein are
shown in Figure 10.
90
80 -
70
60
o
G
S 50co
0)
I 40
30
20
10
I k I I/~\, Phosphorylated
: /^xN/ Phosphorylated \
7:-:tv
/ | ! ; Xi -i i i
300 400320 340 360 380
Emission Wavelength, nm
Figure 10. The tryptophan fluorescence spectra of the phosphorylated and
dephosphorylated a-casein at pH 7. [a-casein]: 1 mg/mL.
41

When a-casein is dephosphorylated the wavelength ofmaximum
emission is shifted to a smaller wavelength, from 345 nm to 339 nm, this
will be termed as blue shifted. The blue shift indicated that the surrounding
environment of one or both tryptophans in the a-casein molecule was/were
shifted from an"open"
structure, i.e. a more solvent-accessible, to a"closed"
structure, i.e. a more solvent-inaccessible one. This indicated that the extent
of phosphorylation of the casein molecule affects the molecular
conformation. The tryptophans of a-casein were in a more hydrophobic
form than that of the phosphorylated one. The more hydrophilic structure of
the phosphorylated a-casein may be caused by the electrostatic repulsion of
the negative charges of the phosphate groups or by the increased local
dielectric constant caused by the phosphates.
The Effects of Calcium on Casein Fluorescence Emission Spectra: To
determine the effects of calcium binding on the conformation of a-casein,
the tryptophan fluorescence spectra have been recorded under various
calcium concentrations, ranging from 0.006 mM to 0.99 mM (Table 7),
using an imidazole buffer (10 mM pH 7.4) as the solvent. The results show
the shifts of the wavelength ofmaximum emission of both the
phosphorylated and dephosphorylated a-casein. For phosphorylated a-
casein, the wavelength ofmaximum emission was slightly shifted to a
smaller wavelength in the presence of 0.057 mM calcium chloride and the
shift increased to a lower wavelength, 341 nm, at 0.99 mM. For the
dephosphorylated form, the shift only occurred at 0.99 mM and it is not as
striking as the one observed in the phosphorylated form. Thus, calcium
binding had a more obvious effect on the tryptophan fluorescence of
42

phosphorylated a-casein than that of dephosphorylated a-casein. These
results indicate that the calcium ions do bind to the phosphate groups on the
casein molecule. Upon binding, the electrostatic repulsion of the phosphate
groups are reduced and the environments of the tryptophan residues become
more hydrophobic.
Experiment
Number
Concentration of
CaCl2
Phosphorylated
a-Casein
Dephosphorylated
a-Casein
1 ~ 6,_M _ _
2 ~22,uM _ _
3 ~28|iM _ .
4 ~57uM V _
5 ~990,uM vv vv
v : spectral change
w : obvious spectral change
Table 7. The results of titration of a-casein with calcium chloride at pH 7.4.
concentration of a-casein: 3.4 fjM
The Effects of pH on Casein Fluorescence Emission Spectra: The
effect of pH on the environment of the tryptophan of casein has been
determined by measuring the fluorescence at pH 5, 6, 7, 8 and 10. A
concentration of 2.1 (iM (0.0462 g/L) of casein was employed for all
measurements. The casein solutions were prepared using 10 mM HEPES as
the solvent at pH 5, 6, 7 and 8 and using 10 mM phosphate as the solvent at
pH 7, 8 and 10. Both 10 mM HEPES and 10 mM phosphate were used as
43

buffer solutions at pH 7 and 8. The resulting spectra had the same
wavelength ofmaximum emission at both pHs as shown in Figure 11. This
indicated that the casein fluorescence was independent of the buffer
employed
150
100-
50
HEPES unless indicated
r
pH 10 Pi
pH 6 .'\P^^^^~\
///''
pH..7&8->,
'\d/iph 7&gfe^\
'/ =?;^-..>V-
<y "''"^SVfe
Excitation at 280nm
1 1 1 1 ^ 1 1 1 10
300 310 320 330 340 350 360 370 380 390 400
Emission Wavelength, nm
Figure 11. The effects ofpHon the fluorescence emission spectra of
phosphorylated a-casein, (concentration of a-casein: 2. 1 pM, Pi:
phosphate buffer, no indication: HEPES)
The protein molecule had the same wavelength ofmaximum emission
response of 346 nm at pHs of 7, 8 and 10. The spectra at pH 5 and 6 also
showed nearly the same wavelength of maximum emission at 336 nm.
There was about a 10 nm blue shift from pH 10 to pH 6. This can be
attributed to the nerutalization of negatively charged groups on the casein as
the pH is decreased. As a result, the environment of the tryptophans
44

becomes more hydrophobic. Protonation did not have such an obvious
effect on the signal of dephosphorylated a-casein. Except slight shift for pH
5 and pH 6, no discernible shift was observed over the selected pH range, as
shown in Figure 12. This result was expected since fewer anionic groups
are contained in the dephosphorylated a-casein.
140
120
100
<u
o
c<u
o
c/i
0)
u
o
3
80 -
60
40
20
300
I ! !1 1
-H-
--P
! \^ \
j
| !
^, \\ i
///i
^ -
\
\1
\
*^
1i
j
i
ii
320 340 360 380
Emission Wavelength, nm
400
Figure 12. The effects ofpHon the fluorescence emission spectra of the
dephosphorylated a-casein (concentration ofdephosphorylated a-
casein : 2.1 pM, symbolfor buffer, A: phosphate pH 10, ?; phosphate
pH8, M.-phosphate pH 7, V: HEPES pH8, W: HEPES pH7, :
HEPESpH 6, O: HEPESpH 5)
The effects of pH on Casein Fluorescence in the Presence of Calcium:
pH titration of casein was also performed in the presence of 0.93 mM of
45

calcium. For dephosphorylated a-casein, the spectra are similar to those
measured in the absence of calcium. No obvious shift in the wavelengths of
the maximum emission was observed under all investigated pH5 (Figure
13). For phosphorylated a-casein, as shown in Figure 14, the wavelengths
ofmaximum emission at pH 7, 8 and 10, all occurred below 340 nm in the
presence of calcium. In comparison with the results observed in the absence
of calcium, the wavelength of maximum emission was shifted to the lower
wavelength by greater than 6 nm. This further reinforced the suggestion that
calcium binding caused the change of the a-casein structure from amore
hydrophilic structure to a more hydrophobic one.
100
80 -
Fluorescence
excitation @
280nm 60
40
20
300 320 340 360 380
Emission Wavelength, nm
400
Figure 13. The effects ofpHon thefluorescence emission spectra of the
dephosphorylated a-casein in the presence ofcalcium ([-casein]:
2.1 juM, [calcium]: 0.93 mM)
46

100
o
/ s \
0 y X-Vv
4.
^
300 320 340 360 380
Emission Wavelength, nm
400
Figure 14. The effects ofpHon the fluorescence emission spectra of the
phosphorylated a-casein in the presence ofcalcium (concentration of
casein: 2.1 pM, O: pH 10, V. pH 8, U:pH 7, : pH 6, V. pH 5)
The wavelength ofmaximum emission observed at pH 5 and 6
remained unchanged from the ones observed in the absence of calcium ions.
This is seemingly contradictory with the results of our binding preference
calculations. It was suggested by our calculations that , in terms of energy,
when both calcium ions and protons are added into the casein solution, the
calcium ions would bind preferentially. However, steric effects were not
taken into account in the calculation. The above florescence results suggests
47

that, some negatively charged groups buried inside the protein, may not be
able to interact with calcium ions. Protons are smaller than calcium ions and
thus may be able to access the folded casein and bind with the buried
glutamate, aspartate or other negatively charged amino acids.
The studies of the effect of pH and calcium binding on the structure of
a-casein were repeated. The experiments were performed at both pH 5 and
pH 8, under which conditions the tryptophan residues were suspected to be
in hydrophobic and hydrophilic environments, respectively. The
concentration of a-casein 2. 1 U.M (0.0462g/l) was used. The concentration
of the phosphate groups in casein molecules under these conditions is 16.8
(iM, and the calcium concentration was 0.93mM. Under these experimental
conditions, the calcium ions were in excess with respect to phosphate
groups. Measurements for each set of experiments have been repeated three
times. The average of the data from the three sets of experiments were
analyzed using the Peakfit software (Jandel Scientific).
Each spectrum profile was statistically fitted to a two Gaussian curve
model. Since there were two tryptophan per a-casein molecule, these two
Gaussian curves could be considered to represent the two tryptophans in the
molecule, i.e. a blue tryptophan with a lower wavelength ofmaximum
emission and a red tryptophan with a higher wavelength of maximum
emission. The blue tryptophan was expected to reside in a more
hydrophobic environment than the red one. As you can see in Table 8, the
emission maximum of the red tryptophan was about the same under all the
measurement conditions.
48

PaCa DPccCb
Blue Red Blue Red
withoutCa2+
pH5 329 356 330 357
pH8 339 355 336 363
withCa2+
pH5 329 355 331 358
PH8 337 358 334 360
a: PaC: Phosphorylated a-casein
b: DPaC: Dephosphorylated a-casein
Table 8. The wavelength ofmaximum emission of a-casein at pH5 and pH8from
a two Gaussian curve model (concentration ofCasein: 2.1 pM,
concentration ofcalcium: 0.93 mM)
By comparing the three dimensional structure with other experimental
results, we speculated that only Trpl64 in asi-casein or Trpl09 in aS2-
casein could be responsible for the alteration of the casein fluorescence upon
environmental changes. Trpl99 in asi-casein and Trp 193 in aS2-casein are
located in a more hydrophobic environments and so their fluorescence
response would change little over the course of the experiment.
Based on our previous assumptions and the results of fluorescence
spectra, the behavior of the casein fluorescence could be attributed by either
Tip 164, Trp 109 or both. We speculate, however, that Tip 164 in asi-
casein was responsible for the major shift of the overall fluorescence
spectrum. Similar results have been reported by Ostoa-Saloma et al. (20). In
their studies it was suggested that tryptophan 164 contributed approximately
49

70% to the overall fluorescence, while tryptophan 199 contributes the
remainder. In addition, as mentioned previously, asi -casein forms the
framework of the milk micelle (22,23), and, it has been shown that asi-
casein is quantitatively the main component of commercially available
casein (20). This fact was reinforced by our phase separation studies.
Although the environmental changes of the hydrophobic and
hydrophilic domains of the casein molecule could be observed by using the
two Gaussian curve model, the standard errors were too large to interpret the
results definitively. Instead of using the two Gaussian curve model, a single
Gaussian curve model was applied to analyze the data in the following
discussion. The results are listed in Table 9. All the results obtained here
are consistent with the results obtained previously in the calcium and pH
studies.
PaCa DPaCb
Without Ca2+ pH5
pH8
334.0 0.5C
343.5 0.9
334.8 0.4
340.9 0.4
With Ca2+pH5
pH8
333.6 0.3
341.4 0.6
335.00.3
339.6 0.3
a: PaC: Phosphorylated a-casein
b: DPaC: Dephosphorylated a-casein
c: the standard error of calculation software
Table 9. The wavelength ofmaximum emission of a-casein pH 5 andpH 8 from a
single Gaussian curve model (concentration ofcasein: : 2.1 pM,
concentration ofcalcium: 0.93 mM)
50

At pH 8, where the phosphate groups are negatively charged, the
wavelength ofmaximum emission was shifted by 3 nm from 344 nm
(phosphorylated form) to 341 nm (dephosphorylated form). At pH 5,
phosphorylated a-casein had about the same wavelength ofmaximum
emission at 334 nm as the dephosphorylated form. Addition of calcium in
both of phosphorylated and dephosphorylated a-casein at pH 5 did not
affect their wavelengths ofmaximum emission. The blue shift caused by
calcium binding was only observed in phosphorylated a-casein at pH 8.
The wavelength of maximum emission of phosphorylated a-casein at pH 8
was shifted by ~ 3 nm in the presence of calcium.
Of special mention is the observation that all the casein solutions at
pH 6 or higher, remained transparent irrespective of the presence of calcium.
At pH 5, however, the solution turned cloudy. We speculate that the
detected fluorescence change at pH 6 or higher is caused by intramolecular
conformational changes of the a-casein molecule. The fluorescence spectral
change at pH 5 is caused by the intra- and/or inter- molecular structural
changes. The term intramolecular structural change means that the tertiary
structure of a-casein alters or packs into a more hydrophobic structure. As
for intermolecular structural change, this refers to the association of casein
molecules to a more hydrophobic quaternary structure, for example,
aggregation in the form ofmicelles.
Overall, the results of the fluorescence studies have demonstrated
that: 1) Dephosphorylated a-caseins have a more hydrophobic structure in
comparison with the phosphorylated form. 2) Both calcium and protons can
bind to the phosphate groups on phosphorylated molecules and change the
tryptophan to a more hydrophobic one. 3) Protons bind to the buried
51

glutamate and aspartate residues in casein molecule, but calcium can not. 4)
Tip 164 in asi-casein is responsible for the major shift of the overall
fluorescence spectrum. 5) The conformational change of as-casein at higher
pH is caused by the alteration of its tertiary structure. The change at lower
pH, is due to intermolecular and/or intramolecular interactions.
52

CONCLUSION
From the pi calculations, the phase separation studies and the
viscosity measurements, the results all indicate that the phosphorylated asi-
casein forms micelles at pH -5.5. At pH 8, the casein molecules are
individually scattered in the solution. The fluorescence changes observed at
pH 8 upon dephosphorylation or calcium addition were caused by an
intramolecular conformational change of asi-casein. The casein molecules
at this pH still remained independent from each other. The blue shift that
was observed from pH 8 to pH 5 was caused by both intra- and inter
molecular structural changes. The structure of asi-casein was altered to a
conformation that promoted intermolecular interactions which help in the
formation of milk micelles.
As discussed in the results section, Tryptophan 164 is the most
important residue involved in this fluorescence study. From the spectra of
this particular residue it was speculated that the electrostatic repulsion
caused by the phosphate groups on asi-casein molecules leads to its
conformation being in a more"open"
structure. Upon the addition of
calcium or dephosphorylation, the Trp 164 fluorescence is consistent with a
"closed"
conformation, and is therefore blue shifted
Both calcium ions and protons had more obvious effects on the
conformation of phosphorylated asi-casein. Calcium ions hardly had any
effect on the conformation of dephosphorylated asi -casein, although its
binding strength to the negatively charged amino acid residues was stronger
than that of protons (based on our theoretical calculations), it seems that
calcium ions can only reduce part of the negative charges on the casein
53

molecule. Perhaps the calcium ions are too large to reach some negatively
charged amino acid residues located deep in the interior of the casein
molecules. The neutralization of accessible anions by calcium may lead to
aggregation and phase separation rather than micelle formation. Addition of
too many calcium ions leads to casein precipitation. An appropriate pH
environment is necessary for micelle formation.
The extent of phosphorylation of asi -casein molecules affects their
molecular conformation (as shown by fluorescence studies) and the size of
asi-casein micelles (as shown by the phase separation studies). Removal of
phosphate from asi-casein reduces the stability of the casein micelle, i.e. it
reduces the ability to aggregate, and the micelles that do form are smaller in
size.
Based on the experimental evidence obtained in our studies, a model
for the formation mechanism of asi-casein micelles, is proposed. This is
presented on Figure 15. At pH7 or higher, both hydrophobic and
hydrophilic domains of asi-casein are negatively charged. Therefore,asi-
casein molecules are freely scattered in solution. At lower pH, around 5.5,
the negative charges in the hydrophobic domain are neutralized and the
electrostatic repulsion of the hydrophilic domain is reduced. Therefore, the
protein-protein interaction is promoted and micelle formation is favored.
Once the framework of the casein micelle is formed, aS2-, (3- and K-caseins
participate in and further stabilize the structure. At pH4 or lower, the
negative charges distributed on the surface of the outer layer of asi-casein
micelle are diminished. The asi-casein micelles start to aggregate and form
a multi-micelle complexes. The multi-micelle complexes precipitate out of
the solution when they reach a sufficient size.
54

pH>7.0
hydrophilic domain
U hydrophobic domain
monomer
pH~5.5
monomermicelle pH<4.0
^C>
Figure 15. The formation mechanism of asj-casein micelles
55

REFERENCES
1. Davis, D. T.; Law, A. J. R. /. Dairy Res. 1977, 44, 213-221.
2. Whitney, R. McL.; Brunner, J. U; Enner, K. E.; Farrell, J. N. Jr.;
Josephson, R. V.; Morr, C. V.; Swaisgood, H. E. /. Dairy Sci. 1976,
59,795-815.
3. Ribadeau-Dumas, B. Biochem. Biophys. Acta. 1968, 168, 274-280.
4. Annan, W. D.; Manson, W. J. Dairy Res. 1969, 36, 259-265.
5. Mercier, J. -C. Biochimie 1981, 63, 1-17.
6. Whikehart, D. R.; Rafter, H. W. /. Dairy Sci. 1970, 53, 1 170-1 176.
7. Schmidt, D. G.; Payens, T. A. J. In Surface and Colloid Science
Matiuevic, E.,Ed.; Wiley: New York, 1976; Vol. 9, ppl65-229.
8. McMahon, D. J.; Brown, R. J. J. Dairy Sci. 1984, 67, 499-506.
9. Pepper, L.; Thompson, M. P. /. Dairy Sci. 1963, 46, 764-767.
10. Bloomfield, V. A.; Mead, R. J. J. Dairy Sci. 1975, 58, 592-601.
1 1 . Schmidt. K. G. Netherlands Milk and Dairy J. 1980, 34, 42-64.
12. Swaisgood, H. E. In Developments in Dairy Chemistry-1: Proteins
Fox, P. F. Ed.; Applied Science: London, 1982, 1-59.
13. Mercier, J. D.; Frosclaude, F.; Ribadeau-Dumas, B. Eur. J. Biochem.
1971, 23, 41-47.
14. Byler, D. M.; Farrell, H. M., Jr.; Susi, H. J. Dairy Sci. 1988, 71, 2622-
2628.
15. Gamier, J.; Osguthorpe, D. J.; Robson, B. J. Mol. Bio. 1978, 120, 97-
103.
16. Cohen, F. E.; Abarbamel, R. M.; Kuntz, I. D.; Fletterick, R. J.
Biochem. 1983, 22, 4894-4900.
56

17. Cohen, F. E.; Abarbamel, R. M.; Kuntz, I. D.; Fletterick, R. J.
Biochem. 1986, 25, 266-272.
18. Kumosinski, T. F.; Brown, E. M.; Farrell, H. M. Jr. J. Dairy Sci. 1991,
74, 2889-2895.
19. Chou, P. Y.; Fasman, G. D. Adv. Enzymol. 1978, 47, 45-66
20. Ostoa-Saloma, P.; Ramirez, J.; Perez-Montfort, R. Biochim.
BiophysicaActa. 1990, 1041, 146-152.
21. Schmidt, D. G. In Developments in Dairy Chemistry-1 Fox, P. F. Ed.;
Applied Science: Essex, Engl., 1982; 61-67
22. Lakowicz, J. R. In Principles ofFluorescence Spectroscopy, Plenum:
New York, 1983, 341-382.
23. Farrell, H. M. Jr. In Fundamentals ofDairy Chemistry 3rd ed. Wong,
N. Ed.; Van Nostrand-Reinhold: New York, 1988, 461-467
57