the role of arizona cities and towns in … · the role of arizona cities and towns in the ......
TRANSCRIPT
THE ROLE OF ARIZONA CITIES
AND TOWNS IN THE STATE’S
ECONOMY
Prepared forThe League of Arizona Cities and Towns
ByTanis J. Salant, D.P.AAlberta Charney, Ph.D.Marshall J. Vest, Director,
Business Research Center
Economic and Business Research CenterEller College of ManagementThe University of ArizonaTucson, Arizona
October 2006
Table of Contents
INTRODUCTION . . . . . . . . . . . . . . . . . . . . . . . . . . . . . . . . . . . . . . . . . . . . . . . . . . . 3
ARIZONA’S ECONOMY FOR FY 2004-2005 . . . . . . . . . . . . . . . . . . . . . . . . . . . . . . 5State Budget Revenues . . . . . . . . . . . . . . . . . . . . . . . . . . . . . . . . . . . . . . . . . . 5State Population Estimates . . . . . . . . . . . . . . . . . . . . . . . . . . . . . . . . . . . . . . . 5Arizona’s Non Farm Employment . . . . . . . . . . . . . . . . . . . . . . . . . . . . . . . . . . 6State Individual Income Tax . . . . . . . . . . . . . . . . . . . . . . . . . . . . . . . . . . . . . . 6Arizona’s Transaction Privilege Tax (TPT) . . . . . . . . . . . . . . . . . . . . . . . . . . . . 7
City of Phoenix . . . . . . . . . . . . . . . . . . . . . . . . . . . . . . . . . . . . . . . . . . . . . 7
STATE REVENUE SHARING TO CITIES AND TOWNS . . . . . . . . . . . . . . . . . . . . . . . 8Urban Revenue Sharing. . . . . . . . . . . . . . . . . . . . . . . . . . . . . . . . . . . . . . . . . . 8
Transaction Privilege Tax . . . . . . . . . . . . . . . . . . . . . . . . . . . . . . . . . . . . . 8
THE ROLE OF CITIES AND TOWNS IN TAX GENERATION . . . . . . . . . . . . . . . . . . 10
ECONOMIC DEVELOPMENT IN ARIZONA’S CITIES AND TOWNS . . . . . . . . . . . . 11Basic Services . . . . . . . . . . . . . . . . . . . . . . . . . . . . . . . . . . . . . . . . . . . . . . . . 11Optional Services and Tools . . . . . . . . . . . . . . . . . . . . . . . . . . . . . . . . . . . . . 12
Small cities and towns . . . . . . . . . . . . . . . . . . . . . . . . . . . . . . . . . . . . . . 13Medium rural cities. . . . . . . . . . . . . . . . . . . . . . . . . . . . . . . . . . . . . . . . . 13Suburban cities. . . . . . . . . . . . . . . . . . . . . . . . . . . . . . . . . . . . . . . . . . . . 14Metropolitan cities . . . . . . . . . . . . . . . . . . . . . . . . . . . . . . . . . . . . . . . . . 14
Service Reductions in the Face of Budget Reductions. . . . . . . . . . . . . . . . . . 15
SUMMARY AND CONCLUSIONS . . . . . . . . . . . . . . . . . . . . . . . . . . . . . . . . . . . . . 16
SOURCES. . . . . . . . . . . . . . . . . . . . . . . . . . . . . . . . . . . . . . . . . . . . . . . . . . . . . . . 17
THE ROLE OF ARIZONA CITIESAND TOWNS IN THE STATE’SECONOMY
page 1
THE ROLE OF ARIZONA CITIES
AND TOWNS IN THE STATE’S
ECONOMY
List of Tables
Table 1: Gross State Revenues for FY 2004-2005 . . . . . . . . . . . . . . . . . . . . . . . . . 5
Table 2: Arizona’s Population Estimates for 2005 . . . . . . . . . . . . . . . . . . . . . . . . . 5
Table 3: Arizona’s Non Farm Employed . . . . . . . . . . . . . . . . . . . . . . . . . . . . . . . . . 6
Table 4: Gross Individual Income 2000 (FAGI) . . . . . . . . . . . . . . . . . . . . . . . . . . . 6
Table 5: State Individual Income Tax Generation FY 2004-2005 . . . . . . . . . . . . . . 6
Table 6: TPT Base and Gross Collections FY 2004-2005 . . . . . . . . . . . . . . . . . . . . 7
Table 7: Income Taxes and Urban Revenue Sharing FY 2004-2005 . . . . . . . . . . . 8
Table 8: TPT and State Revenue Sharing FY 2004-2005. . . . . . . . . . . . . . . . . . . . 8
Table 9: Summary with Select Cities and Towns FY 2004-2005 . . . . . . . . . . . . . . 9
Table 10: Cities and Towns and State Tax Revenues FY 2004-2005. . . . . . . . . . . 10
Table 11: Basic and Optional Services and Tools Vital to Economic Development . . . 12
page 2
page 3
In 2004 the nation’s 361 metropolitan areas generated 86.3 percent of the U.S. gross domestic product (GDP), producing goods and services with a total value of$10.1 trillion. That percentage is forecast to increase to 88.5 percent by 2015, dou-bling in value to $21 trillion. In Arizona and 26 other states, the economies in met-ropolitan areas contributed 75 percent or more of the state’s total economic output.1
Arizona’s economic surge in 2005 went into the record books as the largest in statehistory, stronger even than originally reported, according to Arizona’s Economy.2That surge was reflected in tax revenues worth $11.3 billion to state coffers. Whatrole did Arizona’s cities and towns play in Arizona’s record-setting economic out-put? Gross Metropolitan Product (GMP) is a term used to measure economic ac-tivity in metro areas in the United States. In the 2005 “State of the State Report:Arizona,” statistics illustrate that Arizona’s metro areas---Flagstaff, Phoenix-Mesa-Scottsdale, Prescott, Tucson, and Yuma---produced 92.2 percent of Arizona’sGross State Product (GSP), far higher than the average in 26 other states. Employ-ment growth, total value added of goods and services, and wages are indicators ofGSP. How did cities and towns contribute to Arizona’s “galloping economy?”
Aristotle noted centuries ago that “The city is a partnership for living well.” SinceAristotle weighed in on the role of cities in Greek society, American cities have un-dertaken many different roles. Created originally as places where people couldmake money, cities had to become involved in routine service delivery, the com-plexities of governance, and serve as centers of economic activity as well.3 Theirroles have shifted back and forth between serving as islands of prosperity and ad-dressing social problems, and they continue to do so. Crises arising from the in-dustrial revolution forced cities to assume increasingly complex responsibilities---to supply water and dispose of wastes, to fight fires and crime, to build andmaintain streets and bridges, to quell riots and contagious disease outbreaks, andaddress other “calamities brought on by unrestrained private activity.” Cities alsobuild parks, adopt building codes, pave streets and alleys, write health and sanita-tion codes, grant franchises for utilities, expand public transportation, and influ-ence the location of homes, factories, office buildings, restaurants, parking lots,and schools. Through building codes they regulate plumbing, wiring, building ma-terials, structural heights and architectural styles. They also poison rats and con-trol pigeons. As Judd and Swanstrom conclude, “Without cities life would becomenot only dangerous but also intolerable.”4
Since the 1990s, however, it is in the arena of economic development that citieshave adopted the most significant role in the national economy. If metro areasgenerated 86.3 percent of the nation’s GDP in 2004, what activities did they pursueto insure economic growth and continued success? Cities float bonds to buildnew sports stadiums, they offer tax abatements and hand out subsidies to encour-age the construction of enclosed malls. They run convention and tourism bu-reaus, repair fountains, plant flowers, restore historic buildings and intensify crimecontrol in areas used by tourists. In these and other ways, cities use their publicpowers and resources to promote local economic prosperity. Seven out of 10
1 “Key Findings.” U.S. Metro Economies 2004-2005: GMP, The Engine That Drives the Nation’s Economy. The UnitedState Conference of Mayors, January 2006.
2 Marshall J. Vest. “It’s Time to Dust Off Those Contingency Plans,” Arizona’s Economy, Tucson: The University of Arizona,Eller College of Management, Economic and Business Research.
3 Dennis Judd and Todd Swanstrom, City Politics: Private Power and Public Policy, New York: Harper Collins College Pub-lisher, 1994, p. 39.
4 Judd and Swanstrom, 39.
Introduction
... Arizona’s metroareas ... produced 92.2percent of Arizona’sGross State Product(GSP), far higher thanthe average in 26other states.
page 4
Americans in the U.S. live in cities and towns. Municipalities not only provide pub-lic employment, but they also purchase 7 percent of all the goods and services inthe country.5 In 2002 the combined budget of all U.S. municipalities was $376.4billion, much of which generated federal and state income taxes, school propertytaxes and state sales taxes. Not only the expenditures but also the services andactivities of municipalities are critical factors in national and state economies.
This report examines the roles that cities and towns played in Arizona’s economyin fiscal year 2004-2005. It reviews data on jobs, state transaction privilege taxesand income taxes generated within municipal boundaries, and describes featuresand policies of Arizona’s municipalities that are crucial to attracting, retaining andcreating jobs, businesses and firms.
5 National League of Cities, “Why Cities Matter: Municipal Employees: Working for YOU!” (Talking Points and Data.)Washington, D.C., 2004.
THE ROLE OF ARIZONA CITIES
AND TOWNS IN THE STATE’S
ECONOMY
“Without cities lifewould become not onlydangerous but also intolerable.”
Arizona’s Economy forFY 2004-2005
page 5
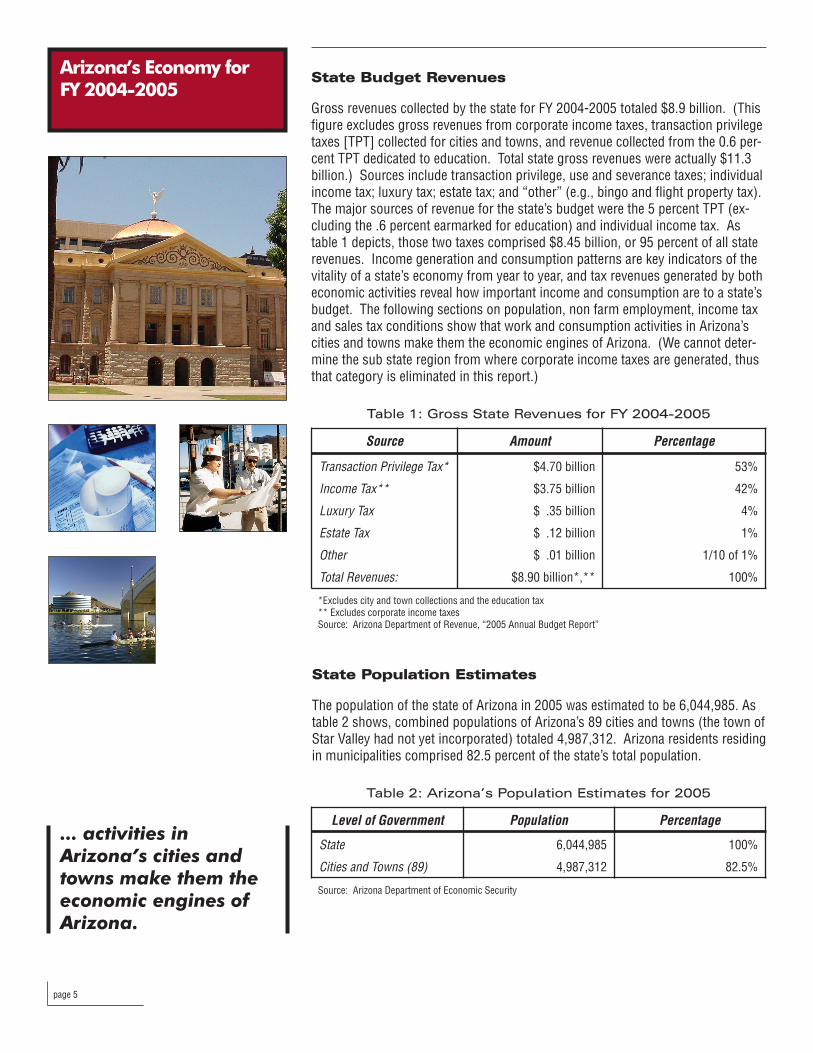
State Budget Revenues
Gross revenues collected by the state for FY 2004-2005 totaled $8.9 billion. (Thisfigure excludes gross revenues from corporate income taxes, transaction privilegetaxes [TPT] collected for cities and towns, and revenue collected from the 0.6 per-cent TPT dedicated to education. Total state gross revenues were actually $11.3billion.) Sources include transaction privilege, use and severance taxes; individualincome tax; luxury tax; estate tax; and “other” (e.g., bingo and flight property tax).The major sources of revenue for the state’s budget were the 5 percent TPT (ex-cluding the .6 percent earmarked for education) and individual income tax. Astable 1 depicts, those two taxes comprised $8.45 billion, or 95 percent of all staterevenues. Income generation and consumption patterns are key indicators of thevitality of a state’s economy from year to year, and tax revenues generated by botheconomic activities reveal how important income and consumption are to a state’sbudget. The following sections on population, non farm employment, income taxand sales tax conditions show that work and consumption activities in Arizona’scities and towns make them the economic engines of Arizona. (We cannot deter-mine the sub state region from where corporate income taxes are generated, thusthat category is eliminated in this report.)
Source Amount Percentage
Transaction Privilege Tax* $4.70 billion 53%
Income Tax** $3.75 billion 42%
Luxury Tax $ .35 billion 4%
Estate Tax $ .12 billion 1%
Other $ .01 billion 1/10 of 1%
Total Revenues: $8.90 billion*,** 100%
Table 1: Gross State Revenues for FY 2004-2005
*Excludes city and town collections and the education tax** Excludes corporate income taxesSource: Arizona Department of Revenue, “2005 Annual Budget Report”
State Population Estimates
The population of the state of Arizona in 2005 was estimated to be 6,044,985. Astable 2 shows, combined populations of Arizona’s 89 cities and towns (the town ofStar Valley had not yet incorporated) totaled 4,987,312. Arizona residents residingin municipalities comprised 82.5 percent of the state’s total population.
Level of Government Population Percentage
State 6,044,985 100%
Cities and Towns (89) 4,987,312 82.5%
Table 2: Arizona’s Population Estimates for 2005
Source: Arizona Department of Economic Security
... activities in Arizona’s cities andtowns make them theeconomic engines ofArizona.

page 6
THE ROLE OF ARIZONA CITIES
AND TOWNS IN THE STATE’S
ECONOMY
Arizona’s Non Farm Employment
As shown in the table above, 82.5 percent of Arizona residents reside within cityand town boundaries. An even greater percentage of Arizona’s non farm employed(excludes unemployed) resides---and files taxes---within city and town boundariesas well, 88 percent. Table 3 presents statistics from the Department of EconomicSecurity on the residence of non farm employed. This figure represents the num-ber and location of employed from January 2006 to May 2006:
The state collected $3.75 billion in income tax in FY 2004-2005. The percentage ofstate income taxes generated from cities and towns---assuming the percentageshown in table 4 has held steady---is 91.4 percent, or $3.43 billion. The assumptionis made that the percentage of taxable income corresponds to the percentage of statetax liability. Table 5 below displays these income tax revenues and percentages:
State 2,796,633 100%
Cities and Towns 2,471,580 88%
Table 3: Arizona’s Non Farm Employed
Source: “Arizona Unemployment Statistics Program: Special Unemployment Report 2006” Arizona Departmentof Economic Security www.workforce.az.gov
State Individual Income Tax
Arizona collected $3.75 billion in income tax revenues in FY 2004-2005, excludingcorporate. What percentage of taxes from the individual income tax was gener-ated from within cities and towns? The most recent year for which income taxesby city and town have been reported is calendar year 2000. We will use those sta-tistics and make the assumption that the percentage of revenues from cities andtowns has remained stable in the interim. Table 4 presents those figures, whichare based on the federally-adjusted gross income (FAGI):
Arizona $92 billion* 100%
Cities and Towns (87)** $84.1 billion 91.4%
Table 4: Gross Individual Income 2000 (FAGI)
* Excludes corporate**The city of Maricopa and towns of Dewey-Humboldt and Star Valley had not yet incorporated.Source: 2000 Individual Income Tax Statistics (Phoenix: Arizona Department of Revenue 2004)
State Income Taxes $3.75 billion* 100%
Income Taxes generated within Cities and Towns $3.43 billion 91.4%
Table 5: State Individual Income Tax Generation FY 2004- 2005
*Excludes corporate income taxes
These tables show that Arizona’s cities and towns contain 82.5 percent of the state’spopulation and 88 percent of the state’s non farm employed, generate 91.4 percentof the state’s taxable income, and thus pay 91.4 percent of the state’s income taxes.
Arizona residents re-siding in municipalitiescomprised 82.5 per-cent of the state’s totalpopulation ... and thuspay 91.4 percent of thestate’s income taxes.

Arizona’s Economy forFY 2004-2005 (cont.)
page 7
Arizona’s Transaction Privilege Tax (TPT)
Arizona’s net taxable sales (TPT, use and severance tax) in FY 2004-2005 were$93.1 billion. Total tax collections were $4.635 billion, or just under 5 percent oftaxable sales. The classes of retail, contracting, restaurant/bar, communicationsand use comprise 83 percent of revenue collections, amounting to $3.85 billion;retail sales account for half of all TPT tax revenues.6 This section examines thetaxable sales in cities and towns and state sales tax revenues collected from trans-actions in cities and towns.
According to the Department of Revenue and the Department of Commerce, totaltaxable sales in municipalities for FY 2004-2005 amounted to $98.65 billion. Thesales tax base for municipalities would therefore be greater than the state’s salestax base by roughly $4.5 billion. An explanation for the greater municipal tax basecould be that some cities and towns tax food for home preparation as well ascommercial leasing, two classes not taxed by the state. The city of Phoenix provides an example.
City of Phoenix
To get a more accurate base and collection figure, we looked at the sales tax sta-tistics for the city of Phoenix for FY 2004-2005. Taxable sales for Phoenixamounted to $32.62 billion (the city’s local sales tax revenues were $587.2 mil-lion). Transaction privilege tax revenues for that year were determined by multi-plying municipal tax base collections by the state transaction privilege tax rate of 5percent. (Revenues from the additional .6 percent tax rate are dedicated to educa-tion and are excluded in this report.) This formula would suggest that $1.63 bil-lion in TPT revenues were generated within the boundaries of the city of Phoenix(over 35 percent of total state tax collections). An analyst in the city’s budget andresearch department provided some clarification. The city’s TPT tax base was re-calculated by eliminating the elements of the base that are not taxed by the state.Applying the city’s sales tax rate of 1.8 percent on a more limited tax base, it ap-pears that the state collected about $1.34 billion within the boundaries of Phoenix,a reduction of 12 percent from the original $1.63 billion estimate.
Assuming that the TPT tax base in other cities and towns is 12 percent less thanoriginally determined, we therefore recalculated the municipal TPT base to be$86.8 billion. To determine an approximate contribution to state coffers, the taxbase multiplied by the state rate of 5 percent amounts to $4.34 billion, or roughly93 percent of gross TPT revenues. Statistics concerning the TPT are arrayed intable 6 below.
Level of Government Tax Base/% Gross Collections/%
State $93.1 billion/100% $4.66 billion*/100%
Cities and Towns (89) $86.8 billion/93% $4.34 billion/93%
Table 6: TPT Base and Gross Collections FY 2004-2005
*This is an approximate collection figure calculated by multiplying the tax base by the state rate of 5 percent
6 Arizona Department of Revenue, Annual Report 2005.
Urban Revenue Sharingrepresents an 11 per-cent return to munici-palities on the $3.43billion in income taxesgenerated within theirboundaries.

page 8
State Revenue Sharingto Cities and Towns
Urban Revenue Sharing
The state of Arizona returns a portion of its income tax revenues to cities andtowns. Called Urban Revenue Sharing (URS), the amount totaled $373,072,580 inFY 2004-2005. (Urban Revenue Sharing was implemented in 1972 through avoter initiative to share the income tax with cities and towns under the conditionthat cities and towns not levy a local income tax.) Urban Revenue Sharing repre-sents an 11 percent return to municipalities on the $3.43 billion in income taxesgenerated within their boundaries. Table 7 shows income tax revenues generatedin municipalities and income tax revenues returned to municipalities in the form ofstate revenue sharing.
Cities and Towns to State $3.43 billion/100%
State Share to Cities and Towns* $373.1 million/11%
Table 7: Income Taxes and Urban Revenue Sharing FY 2004-2005
*Source: Arizona Department of Revenue 2005 Annual Report
Transaction Privilege Tax
For FY 2004-2005, the state of Arizona returned a portion of its TPT revenues tocities and towns. The amount totaled $376,213,000. As shown in table 8 below,transaction privilege tax sharing represents an 8.5 percent return to municipalitieson the $4.34 billion collected in their jurisdictions.
Cities and Towns to State $4.34 billion/100%
State Share to Cities and Towns* $376.2 million/8.6%
Table 8: TPT and State Revenue Sharing FY 2004-2005
*Source: Arizona Department of Revenue 2005 Annual Report
... transaction privilegetax sharing representsan 8.5 percent return tomunicipalities on the$4.34 billion collectedin their jurisdictions.

State Revenue Sharingto Cities and Towns (cont.)
page 9
A summary table follows which shows estimated state transaction privilege andincome taxes (excluding corporate) generated within the boundaries of a ruraltown, a rural city, a suburban town, a suburban city, and a metro city. It alsoshows the revenues from both taxes that were distributed to these jurisdictions.The income tax estimate was based on 2000 tax returns presented in the Depart-ment of Revenue’s 2000 Individual Income Tax Statistics.
Type/Population* TPT toState
TPT fromState**
Income TaxesPaid
URS**
Rural Town:Payson/14,000
$14 million $1.3 million $11.3 million $1.3 million
Rural City: Kingman/ 21,000
$30.2 million $1.9 million $18.8 million $1.84 million
Suburban Town:Marana/15,000
$48 million $1.3 million $7.5 million $1.3 million
Suburban City: Peoria/108,000
$152 million $10 million $112.5 million $10 million
Metro City:Tucson/486,000
$442 million $45 million $520 million*** $45 million
Table 9: Summary with Select Cities and Towns FY 2004-2005
*Sharing is based on 2000 population estimates**Source: Arizona Department of Revenue 2005 Annual Report** Includes the town of Oro Valley and the city of South Tucson
Note that the TPT to state and from state are not proportional from jurisdiction tojurisdiction. The same holds for income tax and URS. The reason for this is thatTPT and URS paid to the state are based on taxable sales and taxable income thatoccur within municipal limits, and revenues shared are based on population (TPT)and population relative to total incorporated population (URS).
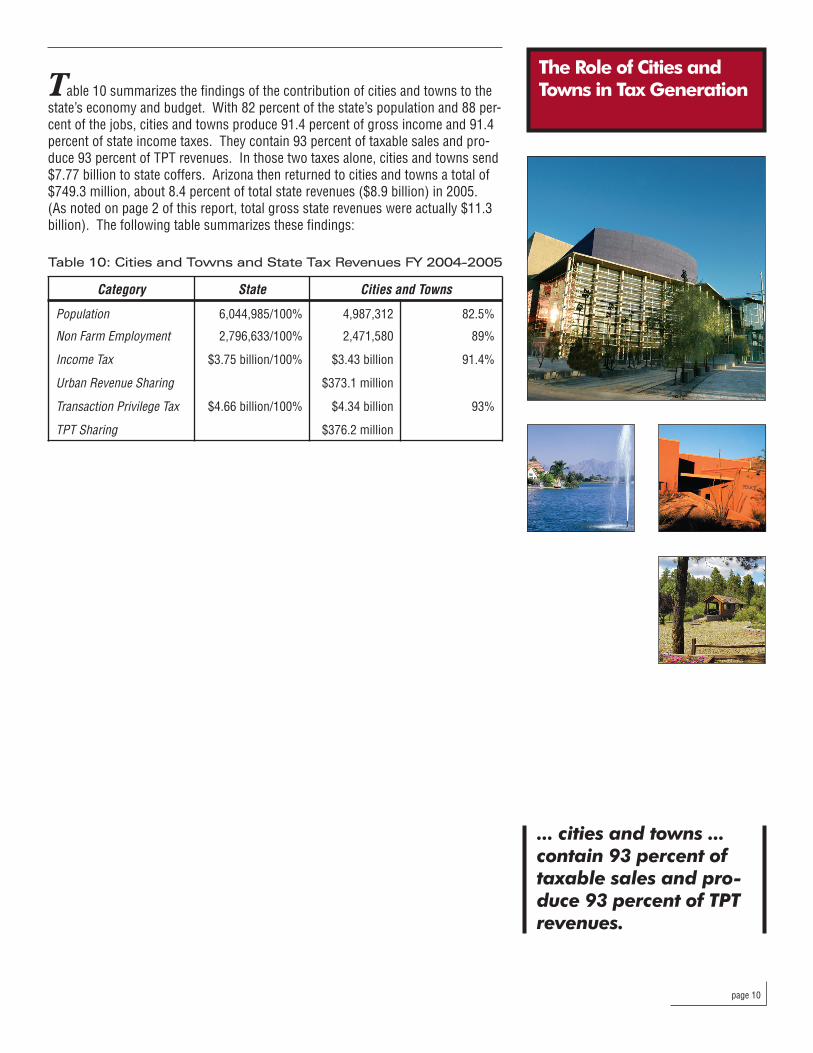
Table 10 summarizes the findings of the contribution of cities and towns to the state’s economy and budget. With 82 percent of the state’s population and 88 per-cent of the jobs, cities and towns produce 91.4 percent of gross income and 91.4percent of state income taxes. They contain 93 percent of taxable sales and pro-duce 93 percent of TPT revenues. In those two taxes alone, cities and towns send$7.77 billion to state coffers. Arizona then returned to cities and towns a total of$749.3 million, about 8.4 percent of total state revenues ($8.9 billion) in 2005.(As noted on page 2 of this report, total gross state revenues were actually $11.3billion). The following table summarizes these findings:
Category State Cities and Towns
Population 6,044,985/100% 4,987,312 82.5%
Non Farm Employment 2,796,633/100% 2,471,580 89%
Income Tax $3.75 billion/100% $3.43 billion 91.4%
Urban Revenue Sharing $373.1 million
Transaction Privilege Tax $4.66 billion/100% $4.34 billion 93%
TPT Sharing $376.2 million
Table 10: Cities and Towns and State Tax Revenues FY 2004-2005
page 10
The Role of Cities andTowns in Tax Generation
... cities and towns ...contain 93 percent oftaxable sales and pro-duce 93 percent of TPTrevenues.
Economic Developmentin Arizona’s Cities andTowns
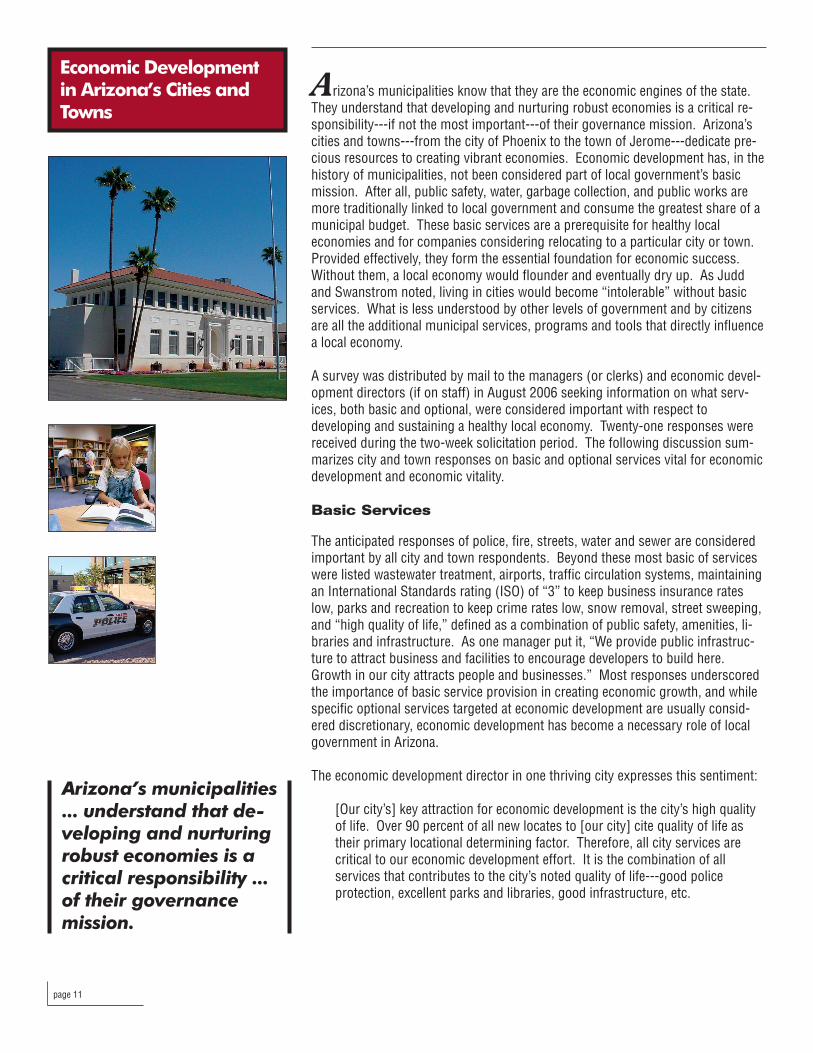
Arizona’s municipalities know that they are the economic engines of the state. They understand that developing and nurturing robust economies is a critical re-sponsibility---if not the most important---of their governance mission. Arizona’scities and towns---from the city of Phoenix to the town of Jerome---dedicate pre-cious resources to creating vibrant economies. Economic development has, in thehistory of municipalities, not been considered part of local government’s basicmission. After all, public safety, water, garbage collection, and public works aremore traditionally linked to local government and consume the greatest share of amunicipal budget. These basic services are a prerequisite for healthy localeconomies and for companies considering relocating to a particular city or town.Provided effectively, they form the essential foundation for economic success.Without them, a local economy would flounder and eventually dry up. As Juddand Swanstrom noted, living in cities would become “intolerable” without basicservices. What is less understood by other levels of government and by citizensare all the additional municipal services, programs and tools that directly influencea local economy.
A survey was distributed by mail to the managers (or clerks) and economic devel-opment directors (if on staff) in August 2006 seeking information on what serv-ices, both basic and optional, were considered important with respect todeveloping and sustaining a healthy local economy. Twenty-one responses werereceived during the two-week solicitation period. The following discussion sum-marizes city and town responses on basic and optional services vital for economicdevelopment and economic vitality.
Basic Services
The anticipated responses of police, fire, streets, water and sewer are consideredimportant by all city and town respondents. Beyond these most basic of serviceswere listed wastewater treatment, airports, traffic circulation systems, maintainingan International Standards rating (ISO) of “3” to keep business insurance rateslow, parks and recreation to keep crime rates low, snow removal, street sweeping,and “high quality of life,” defined as a combination of public safety, amenities, li-braries and infrastructure. As one manager put it, “We provide public infrastruc-ture to attract business and facilities to encourage developers to build here.Growth in our city attracts people and businesses.” Most responses underscoredthe importance of basic service provision in creating economic growth, and whilespecific optional services targeted at economic development are usually consid-ered discretionary, economic development has become a necessary role of localgovernment in Arizona.
The economic development director in one thriving city expresses this sentiment:
[Our city’s] key attraction for economic development is the city’s high quality of life. Over 90 percent of all new locates to [our city] cite quality of life as their primary locational determining factor. Therefore, all city services are critical to our economic development effort. It is the combination of all services that contributes to the city’s noted quality of life---good police protection, excellent parks and libraries, good infrastructure, etc.
page 11
Arizona’s municipalities... understand that de-veloping and nurturingrobust economies is acritical responsibility ...of their governancemission.
page 12
THE ROLE OF ARIZONA CITIES
AND TOWNS IN THE STATE’S
ECONOMY
Optional Services and Tools
Responses to the question of optional services and tools integral to economic de-velopment efforts revealed the breadth and scope of municipal activities devotedto creating and sustaining healthy and growing economies. One manager ex-plained:
Economic development is now considered to be an integral part of our policy calculations in areas of local government responsibility previously considered separate and unrelated, such as arts/cultural/recreation programs (e.g., libraries, parks and recreation, performing arts facilities), environmental management, housing, neighborhood services, and redevelopment.
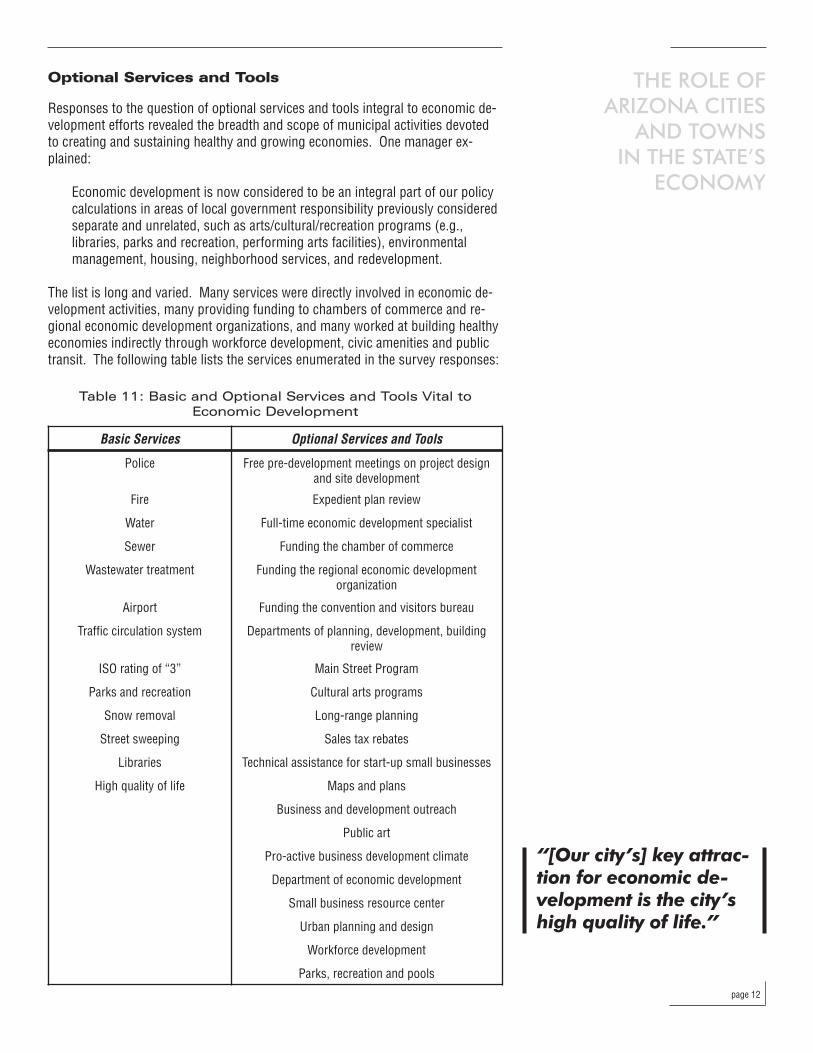
The list is long and varied. Many services were directly involved in economic de-velopment activities, many providing funding to chambers of commerce and re-gional economic development organizations, and many worked at building healthyeconomies indirectly through workforce development, civic amenities and publictransit. The following table lists the services enumerated in the survey responses:
Basic Services Optional Services and Tools
Police Free pre-development meetings on project designand site development
Fire Expedient plan review
Water Full-time economic development specialist
Sewer Funding the chamber of commerce
Wastewater treatment Funding the regional economic development organization
Airport Funding the convention and visitors bureau
Traffic circulation system Departments of planning, development, buildingreview
ISO rating of “3” Main Street Program
Parks and recreation Cultural arts programs
Snow removal Long-range planning
Street sweeping Sales tax rebates
Libraries Technical assistance for start-up small businesses
High quality of life Maps and plans
Business and development outreach
Public art
Pro-active business development climate
Department of economic development
Small business resource center
Urban planning and design
Workforce development
Parks, recreation and pools
Table 11: Basic and Optional Services and Tools Vital to Economic Development
“[Our city’s] key attrac-tion for economic de-velopment is the city’shigh quality of life.”
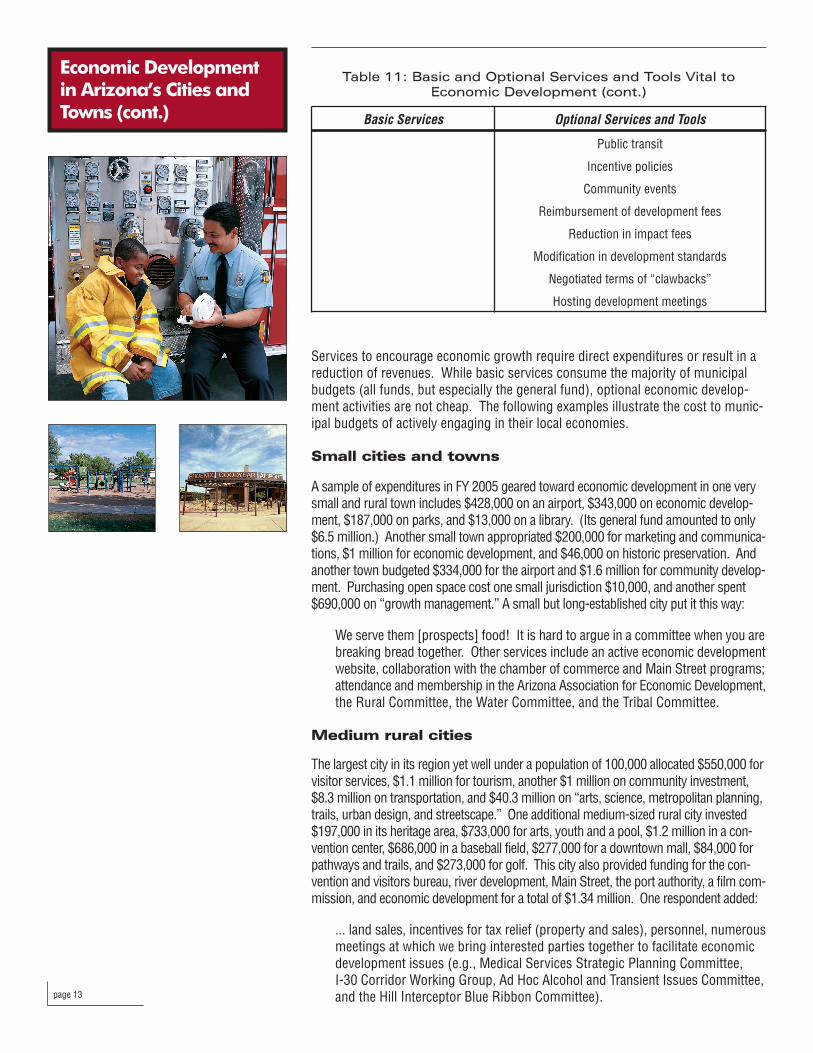
Basic Services Optional Services and Tools
Public transit
Incentive policies
Community events
Reimbursement of development fees
Reduction in impact fees
Modification in development standards
Negotiated terms of “clawbacks”
Hosting development meetings
Table 11: Basic and Optional Services and Tools Vital to Economic Development (cont.)
Economic Developmentin Arizona’s Cities andTowns (cont.)
page 13
Services to encourage economic growth require direct expenditures or result in areduction of revenues. While basic services consume the majority of municipalbudgets (all funds, but especially the general fund), optional economic develop-ment activities are not cheap. The following examples illustrate the cost to munic-ipal budgets of actively engaging in their local economies.
Small cities and towns
A sample of expenditures in FY 2005 geared toward economic development in one verysmall and rural town includes $428,000 on an airport, $343,000 on economic develop-ment, $187,000 on parks, and $13,000 on a library. (Its general fund amounted to only$6.5 million.) Another small town appropriated $200,000 for marketing and communica-tions, $1 million for economic development, and $46,000 on historic preservation. Andanother town budgeted $334,000 for the airport and $1.6 million for community develop-ment. Purchasing open space cost one small jurisdiction $10,000, and another spent$690,000 on “growth management.” A small but long-established city put it this way:
We serve them [prospects] food! It is hard to argue in a committee when you arebreaking bread together. Other services include an active economic developmentwebsite, collaboration with the chamber of commerce and Main Street programs;attendance and membership in the Arizona Association for Economic Development,the Rural Committee, the Water Committee, and the Tribal Committee.
Medium rural cities
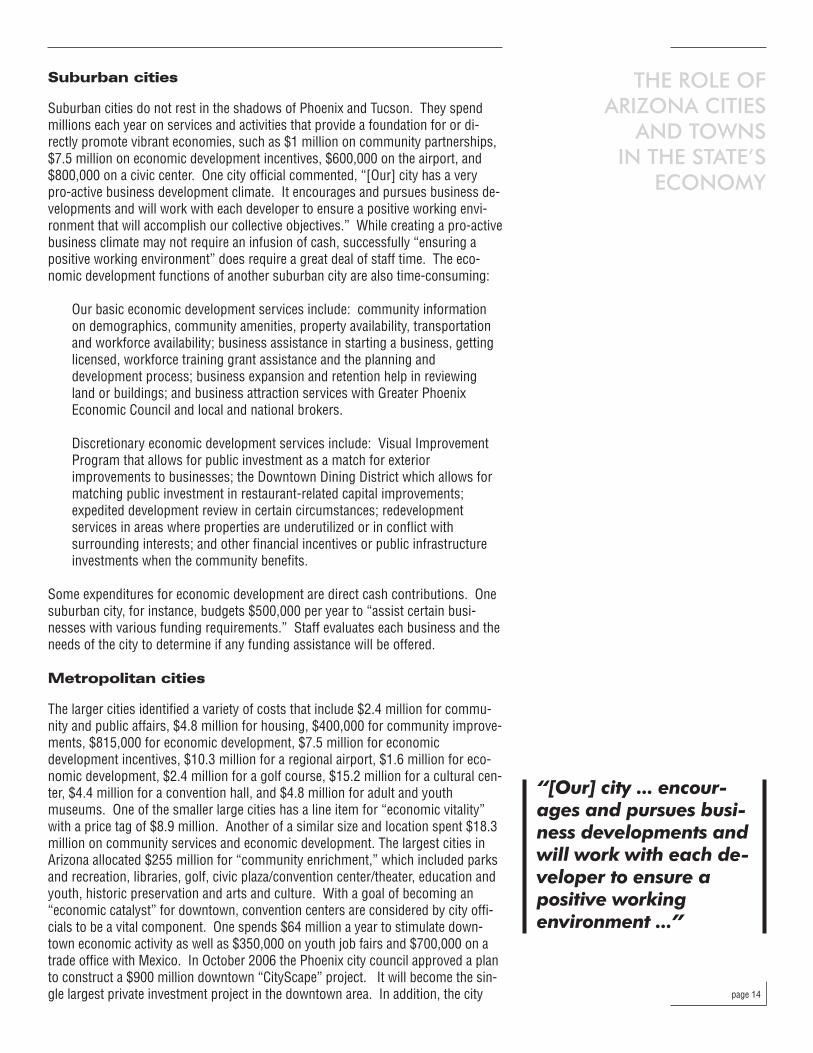
The largest city in its region yet well under a population of 100,000 allocated $550,000 forvisitor services, $1.1 million for tourism, another $1 million on community investment,$8.3 million on transportation, and $40.3 million on “arts, science, metropolitan planning,trails, urban design, and streetscape.” One additional medium-sized rural city invested$197,000 in its heritage area, $733,000 for arts, youth and a pool, $1.2 million in a con-vention center, $686,000 in a baseball field, $277,000 for a downtown mall, $84,000 forpathways and trails, and $273,000 for golf. This city also provided funding for the con-vention and visitors bureau, river development, Main Street, the port authority, a film com-mission, and economic development for a total of $1.34 million. One respondent added:
... land sales, incentives for tax relief (property and sales), personnel, numerousmeetings at which we bring interested parties together to facilitate economic development issues (e.g., Medical Services Strategic Planning Committee, I-30 Corridor Working Group, Ad Hoc Alcohol and Transient Issues Committee,and the Hill Interceptor Blue Ribbon Committee).
THE ROLE OF ARIZONA CITIES
AND TOWNS IN THE STATE’S
ECONOMY
page 14
Suburban cities
Suburban cities do not rest in the shadows of Phoenix and Tucson. They spendmillions each year on services and activities that provide a foundation for or di-rectly promote vibrant economies, such as $1 million on community partnerships,$7.5 million on economic development incentives, $600,000 on the airport, and$800,000 on a civic center. One city official commented, “[Our] city has a verypro-active business development climate. It encourages and pursues business de-velopments and will work with each developer to ensure a positive working envi-ronment that will accomplish our collective objectives.” While creating a pro-activebusiness climate may not require an infusion of cash, successfully “ensuring apositive working environment” does require a great deal of staff time. The eco-nomic development functions of another suburban city are also time-consuming:
Our basic economic development services include: community information on demographics, community amenities, property availability, transportation and workforce availability; business assistance in starting a business, getting licensed, workforce training grant assistance and the planning and development process; business expansion and retention help in reviewing land or buildings; and business attraction services with Greater Phoenix Economic Council and local and national brokers.
Discretionary economic development services include: Visual Improvement Program that allows for public investment as a match for exterior improvements to businesses; the Downtown Dining District which allows for matching public investment in restaurant-related capital improvements; expedited development review in certain circumstances; redevelopment services in areas where properties are underutilized or in conflict with surrounding interests; and other financial incentives or public infrastructure investments when the community benefits.
Some expenditures for economic development are direct cash contributions. Onesuburban city, for instance, budgets $500,000 per year to “assist certain busi-nesses with various funding requirements.” Staff evaluates each business and theneeds of the city to determine if any funding assistance will be offered.
Metropolitan cities
The larger cities identified a variety of costs that include $2.4 million for commu-nity and public affairs, $4.8 million for housing, $400,000 for community improve-ments, $815,000 for economic development, $7.5 million for economicdevelopment incentives, $10.3 million for a regional airport, $1.6 million for eco-nomic development, $2.4 million for a golf course, $15.2 million for a cultural cen-ter, $4.4 million for a convention hall, and $4.8 million for adult and youthmuseums. One of the smaller large cities has a line item for “economic vitality”with a price tag of $8.9 million. Another of a similar size and location spent $18.3million on community services and economic development. The largest cities inArizona allocated $255 million for “community enrichment,” which included parksand recreation, libraries, golf, civic plaza/convention center/theater, education andyouth, historic preservation and arts and culture. With a goal of becoming an“economic catalyst” for downtown, convention centers are considered by city offi-cials to be a vital component. One spends $64 million a year to stimulate down-town economic activity as well as $350,000 on youth job fairs and $700,000 on atrade office with Mexico. In October 2006 the Phoenix city council approved a planto construct a $900 million downtown “CityScape” project. It will become the sin-gle largest private investment project in the downtown area. In addition, the city
“[Our] city ... encour-ages and pursues busi-ness developments andwill work with each de-veloper to ensure apositive working environment ...”
Economic Developmentin Arizona’s Cities andTowns (cont.)
page 15
will work with the public to redesign the park and will also retain ownership of theopen space surrounding the development. The city will purchase an undergroundparking structure and pay for repairs on a parking garage at a cost of $96.5 million.As an incentive (resulting in loss of city revenues), Phoenix will also waive propertytaxes for eight years7. The respondent from another large city explains:
In economic, socio-political, and environmental terms, there are four key building blocks of economic development: infrastructure, labor force quality, quantity and cost; capital formation; and the state of technological advance. These are the foundations upon which the process of economic development at the municipal level has been based. Our basic services that impact these four building blocks include economic development (business recruitment, retention/expansion, small and minority business development, tourism); finance (licensing, tax and utility services); human resources (employee recruitment and training); information technology (on-line services, public relations and telecommunications); planning and development (plan review, permit processing, zoning); public safety (police and fire); and public works (airport operations, solid waste, streets, utilities, wastewater and water services).
Service Reductions in the Face of Budget Reductions
The third question asked city and town officials where reductions in serviceswould occur if revenues were reduced. While mayors and councils would ulti-mately make that determination, of course, some offered these suggestions forplacing services on the cutting block:
• Economic development• Parks, recreation and pools• Libraries: reduce hours and/or days• Community events• Capital improvement programs which will affect transportation, water and
sewer, and utility improvements• Code enforcement• Public works• Administration and director of the courts• New capital improvement• Staffing levels• Quality of life services: parks, infrastructure, recreation, library, maintenance,
neighborhood services, codes, plan review, and arts• Parks (“We have the only golf course between Flagstaff and Gallup”)• Beautification• Airport• Planning• Cemetery maintenance• Membership dues• Pace of road improvements
With the exception of cemetery maintenance, membership dues, and reductions incourt personnel, all service reductions are directly or indirectly tied to economicdevelopment. As one official explained when asked which cuts would be made, hereplied “…economic development as a general rule, since that is an auxiliary func-tion…all beautification [activities] and other grant funding that requires matchingfunds (e.g., TEAM grants, ADOT at 50%, FAA and ADOT Airport Grant at 5%).”
7 “Phoenix City Council approves $900 million downtown CityScape,” Arizona Daily Star, Tucson, October 6, 2006, B4.
Cities and towns arethe engines of eco-nomic growth through-out the U.S. andparticularly Arizona.
Cities and towns are the engines of economic growth throughout the U.S. and particularly in Arizona. In Arizona, 92.2 percent of Arizona’s Gross State Productis produced in the state’s five major metro areas alone. This is an astoundinglyhigh percentage, considering that only 86.3 percent of the U.S. Gross DomesticProduct is produced in metropolitan areas of the U.S.
Approximately 82.5 percent of Arizona’s population lives in cities and towns alongwith 88 percent of our workforce. But the high level of production in cities andtowns results in their contributing proportionally more to Arizona’s Income Taxrevenues (91.4 percent) and Transaction Privilege Tax collections (93 percent)than their population shares would imply.
Through the Urban Revenue Sharing and state-shared sales tax programs,cities and towns get back a relatively small 11 percent of state income tax rev-enues and 8.6 percent of state Transaction Privilege Tax revenues that theycontribute. These state tax revenues (income and TPT) returned to them repre-sent a small portion of state revenues but finance a big portion---if not all---ofdirect economic activities.
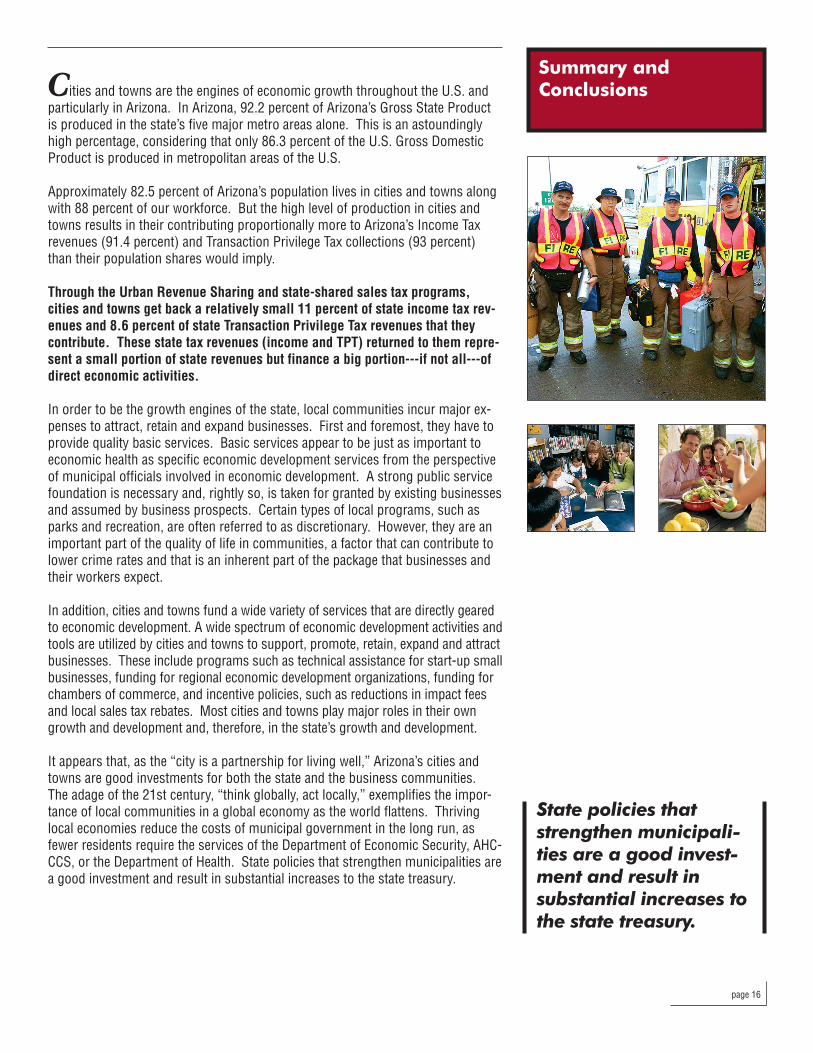
In order to be the growth engines of the state, local communities incur major ex-penses to attract, retain and expand businesses. First and foremost, they have toprovide quality basic services. Basic services appear to be just as important toeconomic health as specific economic development services from the perspectiveof municipal officials involved in economic development. A strong public servicefoundation is necessary and, rightly so, is taken for granted by existing businessesand assumed by business prospects. Certain types of local programs, such asparks and recreation, are often referred to as discretionary. However, they are animportant part of the quality of life in communities, a factor that can contribute tolower crime rates and that is an inherent part of the package that businesses andtheir workers expect.
In addition, cities and towns fund a wide variety of services that are directly gearedto economic development. A wide spectrum of economic development activities andtools are utilized by cities and towns to support, promote, retain, expand and attractbusinesses. These include programs such as technical assistance for start-up smallbusinesses, funding for regional economic development organizations, funding forchambers of commerce, and incentive policies, such as reductions in impact feesand local sales tax rebates. Most cities and towns play major roles in their owngrowth and development and, therefore, in the state’s growth and development.
It appears that, as the “city is a partnership for living well,” Arizona’s cities andtowns are good investments for both the state and the business communities.The adage of the 21st century, “think globally, act locally,” exemplifies the impor-tance of local communities in a global economy as the world flattens. Thrivinglocal economies reduce the costs of municipal government in the long run, asfewer residents require the services of the Department of Economic Security, AHC-CCS, or the Department of Health. State policies that strengthen municipalities area good investment and result in substantial increases to the state treasury.
Summary and Conclusions
page 16
State policies thatstrengthen municipali-ties are a good invest-ment and result insubstantial increases tothe state treasury.

page 17
Sources
Arizona Department of Commerce. “Community Profiles.” www.azcommerce.com
Arizona Department of Revenue. 2000 Individual Income Tax Statistics, ArizonaDepartment of Revenue 2004. www.azdor.state.us
“Arizona Unemployment Statistics Program: Special Unemployment Report2006.” Arizona Department of Economic Security. www.azdes.state.us.
City and Town Budgets. FY 2004-2005. Phoenix: League of Arizona Cities andTowns.
Judd, Dennis and Todd Swanstrom, City Politics: Private Power and Public Policy.New York: Harper Collins College Publishers, 1994, Chapter 1.
“Managing Assets,” The Arizona Republic, Friday, March 18, 2005, B10.
“Phoenix City Council approves $900 million downtown CityScape.” Arizona DailyStar, October 6, 2006, B4.
U.S. Metro Economies 2004-2005: GMP, The Engine That Drives the Nation’sEconomy. The United States Conference of Mayors, January 2006. www.usmayors.org/metroeconomies
Vest, Marshall J. “It’s Time To Dust Off Those Contingency Plans.” Arizona’sEconomy. The University of Arizona, Eller College of Management, Economic andBusiness Research. www.ebr.eller.arizona.edu.
THE ROLE OF ARIZONA CITIESAND TOWNS IN THE STATE’SECONOMY


1820 West Washington StreetPhoenix, Arizona 85007Phone: (602) 258-5786
Fax: (602) [email protected]
www.azleague.org