the role of bank credit enhancements in securitization · 36 the role of bank credit enhancements...
TRANSCRIPT
FRBNY Economic Policy Review / July 2012 35
The Role of Bank Credit Enhancementsin Securitization
1. Introduction
oes the advance of securitization—a key element in the evolution from banking to “shadow banking” (Pozsar et al.
2010)1—signal the decline of traditional banking? Not necessarily, for banks play a vital role in the securitization process at a number of stages, including the provision of credit enhancements.2 Credit enhancements are protection, in the form of financial support, to cover losses on securitized assets in adverse conditions (Standard and Poor’s 2008). They are in effect the “magic elixir” that enables bankers to convert pools of even poorly rated loans or mortgages into highly rated securities. Some enhancements, such as standby letters of credit, are very much in the spirit of traditional banking and are thus far from the world of shadow banking.
This article looks at enhancements provided by banks in the securitization market. We start with a set of new facts on the evolution of enhancement volume provided by U.S. bank holding companies (BHCs). We highlight the importance of bank-provided enhancements in the securitization market by comparing their market share with that of financial guaranties sold by insurance companies, one of the main sellers of credit protection in the securitization market. Contrary to the notion
1 According to Federal Reserve Chairman Bernanke (2012), “Examples of important components of the shadow banking system include securitization vehicles.”2 See Cetorelli and Peristiani (2012) for analysis of banks’ role in other steps in the securitization process.
that banks were being eclipsed by other institutions in the shadow banking system, we find that banks have held their own against insurance firms in the enhancement business. In fact, insurers are forthright about the competition they face from banks:
Our financial guaranty insurance and reinsurance businesses also compete with other forms of credit enhancement, including letters of credit, guaranties and credit default swaps provided, in most cases, by banks, derivative products companies, and other financial institutions or governmental agencies, some of which have greater financial resources than we do, may not be facing the same market perceptions regarding their stability that we are facing and/or have been assigned the highest credit ratings awarded by one or more of the major rating agencies (Radian Groups 2007, form 10-K, p. 46).
Given the steady presence of bank-provided enhance-ments in the securitization market, we next study exactly what role enhancements play in banks’ securitization process. The level of credit enhancements necessary to achieve a given rating is determined by a fairly mechanical procedure that reflects the rater’s estimated loss function on the underlying collateral in the securitization (Ashcraft and Schuermann 2008). If estimated losses are high, then—all else equal—more enhancements are called for to achieve a given rating. Those mechanics suggest a negative relationship between
Benjamin H. Mandel is a former assistant economist and Donald Morgan an assistant vice president at the Federal Reserve Bank of New York; Chenyang Wei is a senior economist at the Federal Reserve Bank of Philadelphia.
Correspondence: [email protected]
The authors thank Nicola Cetorelli, Ken Garbade, Stavros Peristiani, and James Vickery for helpful comments and Peter Hull for outstanding research assistance. The views expressed are those of the authors and do not necessarily reflect the position of the Federal Reserve Bank of New York or the Federal Reserve System.
Benjamin H. Mandel, Donald Morgan, and Chenyang Wei
D
36 The Role of Bank Credit Enhancements in Securitization
the level of enhancements on a deal and the performance of securitized assets. Note that in this scenario, enhancements serve as a buffer against observable risk (as embodied in the estimated loss function).
We are interested in the idea that enhancements might also be used to solve part of the asymmetric information problems that may plague the securitization process. If banks are better informed than outside investors about the quality of the assets they are securitizing, as they almost certainly are, banks that are securitizing higher-quality assets may use enhancements as a signal of their quality. In other words, by their willingness to keep “skin in the game” to retain some risk, banks can signal their faith in the quality of their assets. Such signaling implies a positive relationship between the level of enhancements and the performance of securitized assets, just the opposite of the buffer explanation. Obviously, enhancements could, and probably do, serve both as a buffer against observable risk and a signal against unobservable (to outsiders) quality. However, since the buffer role is almost self-evidently true, we are interested in whether we can detect any evidence for the role of securitization enhancements as a signal.
Others have also considered the hypothesis that enhancements might play a signaling role. Downing, Jaffee, and Wallace (2009) observe that asymmetric information about prepayment risk in the government-sponsored-enterprise (GSE) mortgage-backed-security market should motivate the use of signaling devices.3 Albertazzi et al. (2011) note the potential centrality of asymmetric information to the securitization process and conjecture that a securitizing sponsor can keep a junior (equity) tranche “as a signaling” device of its (unobservable) quality or as an expression of a commitment to continue monitoring. James (2010) comments that if asset-backed securities include a moral hazard (or “lemons”) discount due to asymmetric information, issuers have an incentive to retain some risk “as a way of demonstrating higher underwriting standards.” 4
A variant of the question we are asking about credit enhancements showed up in earlier literature on the role of collateral in traditional (on-the-books) bank lending. A theoretical literature in the 1980s predicted that in the context of asymmetric information, safer borrowers were more likely to pledge collateral to distinguish themselves from riskier ones (Besanko and Thakor 1987; Chan and Kanatas 1985). However, an empirical study by Berger and Udell (1990) found strong evidence against the signaling hypothesis: that is,
3 Because the mortgage-backed securities that the authors study are guaranteed, prepayment risk is the only risk investors need to worry about. 4 In a paper that is somewhat related to ours, Erel, Nadauld, and Stulz (2011, p. 37) investigate why banks hold highly rated tranches of securitizations, and conclude that their doing so may partly serve as “a credible signal of deal quality to potential investors.”
collateral was associated with riskier borrowers and loans. In other words, when it comes to loans on the books, collateral seems to serve more as a buffer against observable risk than as a signal of unobservable quality.
We found only one other paper that looks at the relationship between enhancements and the performance of securitized assets. Using loan-level data, Ashcraft, Vickery, and Goldsmith-Pinkham (2010) find that delinquency on underlying subprime and Alt-A mortgage pools is positively associated with the amount of AAA subordination.5 Those results are consistent with the hypothesis that subordination is used as a buffer against observable credit risk. Interestingly, however, the authors find that BBB subordination is negatively associated with mortgage performance on Alt-A deals, which they consider more opaque (hard to rate). The latter result seems consistent with the signaling hypothesis: the issuer of an opaque security submits to a high degree of subordination to signal its confidence in the quality of the assets it is selling.
We investigate our question from two angles. First, we look directly at the relationship between the performance of securitized assets and total enhancements in a panel analysis where we regress the fraction of securitized assets that are severely delinquent (delinquent for ninety or more days or charged off) on total enhancements per unit of securitized assets. We estimate the regression for seven categories of credit: residential real estate loans, home equity loans, credit card loans, auto loans, other consumer loans, all other loans, and total securitizations. We are not able to detect any evidence for the signaling hypothesis; when we find a significant relationship between delinquency on securitized assets and enhancements, the relationship is positive, consistent with the buffer hypothesis.
In the second part of our article, we test the hypotheses from the perspective of market participants. Specifically, we investigate how stock investors and the option market reacted when BHCs detailed for the first time their securitization activity in their 2001:Q2 regulatory reports, which include enhancements and aggregate loan performance (delinquencies) of the assets that BHCs securitized. We calculate the cumulative abnormal stock return around that date for each BHC that had positive securitization activity. We find first that abnormal returns are highly positively correlated with the extent of securitization activity at a BHC. That comes as no surprise, since securitization was presumably viewed at the time as positive net-present-value (NPV) activity. More interestingly, we find that the relationship between total credit enhancements and
5 The amount of subordination at a given rating is the fraction of bonds that absorb losses before the bond in question. If 90 percent of the bonds in a deal are senior AAA bonds and 10 percent are junior, subordination of the AAA bonds is 10 percent.
FRBNY Economic Policy Review / July 2012 37
cumulative abnormal returns depends on the delinquency rate on securitized assets; when the rate is below some threshold, cumulative abnormal returns are positively correlated with total credit enhancements. This result suggests that when the delinquency rate is relatively low, enhancements serve as a signal of quality (hence, the high cumulative abnormal return). However, when the rate is above that threshold, the relationship between enhancements and cumulative abnormal returns becomes negative. This finding suggests that when the delinquency rate is relatively high—meaning that securitized assets are demonstrably risky—enhancements serve as a buffer against observable risk.
We also examine how securitization activity and enhancements are related to BHC risk, as measured by the implied volatility of BHC stock prices. We find that securitization activity is positively correlated with implied volatility, suggesting that markets view securitization as a risky activity. We also find that total enhancements are positively related to implied volatility. This result implies that just as traditional originate-and-hold banking exposed bank shareholders to risk, so does banks’ provision of credit enhancements.
2. Background on Bank-Provided Credit Enhancements
While credit enhancements can take many forms, Schedule HC-S, on which BHCs report on their securitization activity, includes fields for three types of enhancements.6 The first is credit-enhancing, interest-only strips. Schedule HC-S instructions define these strips as:
an on-balance-sheet asset that, in form or in substance, 1) represents the contractual right to receive some or all of the interest due on the transferred assets; and 2) exposes the bank to credit risk that exceeds its pro-rata share claim on the underlying assets whether through subordination provisions or other credit-enhancing techniques.
Elsewhere, the HC-S instructions note that the field for credit-enhancing, interest-only strips can include excess spread accounts.7 Excess spread is the monthly revenue remaining on
6 To be clear, our article focuses on the three types of enhancements reported by bank holding companies on Schedule HC-S. For a more general discussion of enhancements, see Ashcraft and Schuermann (2008).7 Levitin (2011, p. 16) asserts that, in the context of credit card securitization, excess spread accounts are also referred to as credit-enhancing, interest-only strips.
a securitization after all payments to investors, servicing fees, and charge-offs. As such, excess spread—a measure of how profitable the securitization is—provides assurance to investors in the deal that they will be paid as promised. Excess spread accounts are the first line of defense against losses to investors, as the accounts must be exhausted before even the most subordinated investors incur losses.
The second class of enhancements, subordinated securities and other residual interest, is a standard-form credit enhancement. By holding a subordinated or junior claim, the bank that securitized the assets is in the position of being a first-loss bearer, thereby providing protection to more senior claimants. In that sense, subordination serves basically as a buffer or collateral. However, in the asymmetric information context, holding a subordinate claim gives the bank the stake that can motivate it to screen the loans carefully before it securitizes them and to continue monitoring the loans after it securitizes them. The bank’s willingness to keep some risk may serve as a signal that it has screened loans adequately and plans to monitor diligently.
The third class of enhancements, standby letters of credit, obligates the bank to provide funding to a securitization structure to ensure that investors receive timely payment on the issued securities (for example, by smoothing timing differences in the receipt of interest and principal payments) or to ensure that investors receive payment in the event of market disruptions. The facility is counted as an enhancement if and only if advances through the facility are subordinate to other claims on the cash flow from the securitized assets.8
Although not technically classified as an enhancement, a fourth item on Schedule HC-S that we consider is unused commitments to provide liquidity. Unused commitments represent the undrawn balance on previous commitments. We include this variable simply as a control; we do not venture a hypothesis about how it will enter any of our regressions.
It is important to note that the HC-S data we study, particularly subordination, are measures of risk retention by BHCs and not necessarily a total credit enhancement for a securitization deal. For example, a deal could have 20 percent subordination (say, a $1 billion mortgage pool divided into an $800 million senior bond and a $200 million junior bond) without the BHC holding (retaining) any of the subordinated piece. In that case, the enhancement would not show up in our data. Our basic question, however, remains: Is risk retention important because it is a buffer against observable risk or because it is a signal of unobservable quality? Indeed, Title 9 of the Dodd-Frank Act requires federal regulators to set
8 Note that banks also provide enhancements in the form of representation and warranties that obligate the issuer to take back the loan if it defaults early in its life.
38 The Role of Bank Credit Enhancements in Securitization
Source: Federal Reserve System, Form FR Y-9C, Schedule HC-S.
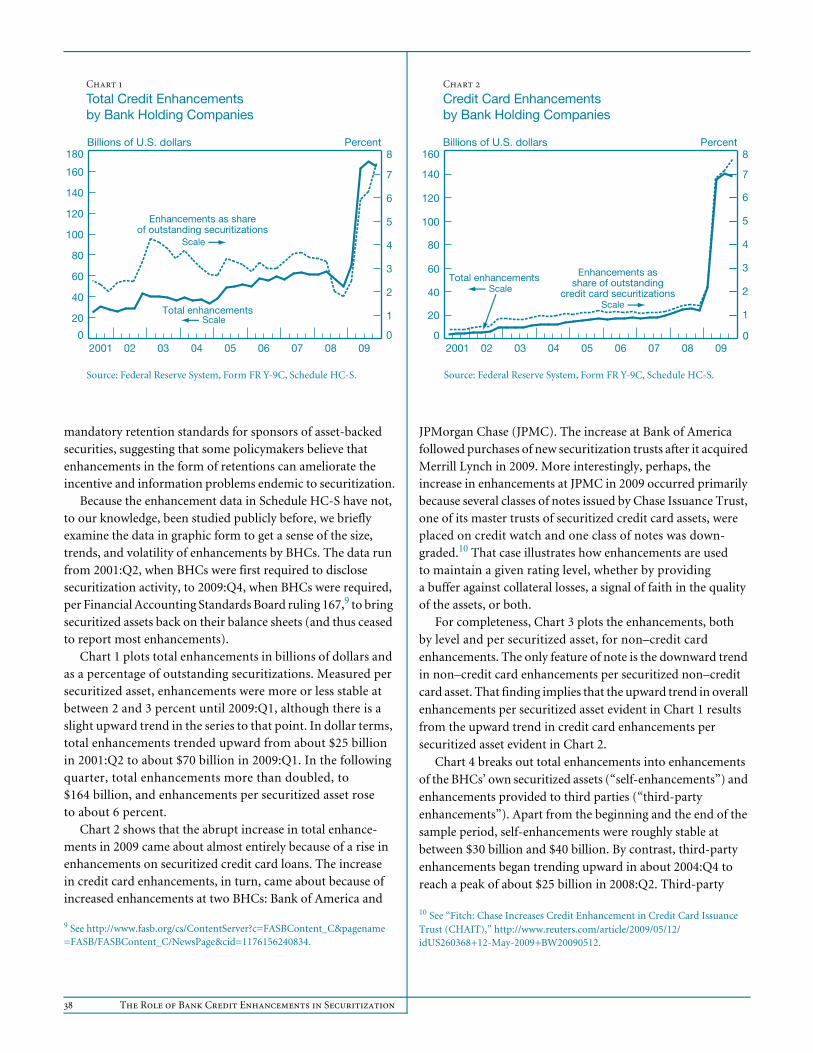
Chart 1
Total Credit Enhancements by Bank Holding Companies
Billions of U.S. dollars Percent
Enhancements as shareof outstanding securitizations
Scale
Total enhancementsScale
0
20
40
60
80
100
120
140
160
180
090807060504030220010
1
2
3
4
5
6
7
8
Source: Federal Reserve System, Form FR Y-9C, Schedule HC-S.
Chart 2
Credit Card Enhancements by Bank Holding Companies
Billions of U.S. dollars Percent
Enhancements asshare of outstanding
credit card securitizationsScale
Total enhancementsScale
0
20
40
60
80
100
120
140
160
090807060504030220010
1
2
3
4
5
6
7
8
mandatory retention standards for sponsors of asset-backed securities, suggesting that some policymakers believe that enhancements in the form of retentions can ameliorate the incentive and information problems endemic to securitization.
Because the enhancement data in Schedule HC-S have not, to our knowledge, been studied publicly before, we briefly examine the data in graphic form to get a sense of the size, trends, and volatility of enhancements by BHCs. The data run from 2001:Q2, when BHCs were first required to disclose securitization activity, to 2009:Q4, when BHCs were required, per Financial Accounting Standards Board ruling 167,9 to bring securitized assets back on their balance sheets (and thus ceased to report most enhancements).
Chart 1 plots total enhancements in billions of dollars and as a percentage of outstanding securitizations. Measured per securitized asset, enhancements were more or less stable at between 2 and 3 percent until 2009:Q1, although there is a slight upward trend in the series to that point. In dollar terms, total enhancements trended upward from about $25 billion in 2001:Q2 to about $70 billion in 2009:Q1. In the following quarter, total enhancements more than doubled, to $164 billion, and enhancements per securitized asset rose to about 6 percent.
Chart 2 shows that the abrupt increase in total enhance-ments in 2009 came about almost entirely because of a rise in enhancements on securitized credit card loans. The increase in credit card enhancements, in turn, came about because of increased enhancements at two BHCs: Bank of America and
9 See http://www.fasb.org/cs/ContentServer?c=FASBContent_C&pagename=FASB/FASBContent_C/NewsPage&cid=1176156240834.
JPMorgan Chase (JPMC). The increase at Bank of America followed purchases of new securitization trusts after it acquired Merrill Lynch in 2009. More interestingly, perhaps, the increase in enhancements at JPMC in 2009 occurred primarily because several classes of notes issued by Chase Issuance Trust, one of its master trusts of securitized credit card assets, were placed on credit watch and one class of notes was down-graded.10 That case illustrates how enhancements are used to maintain a given rating level, whether by providing a buffer against collateral losses, a signal of faith in the quality of the assets, or both.
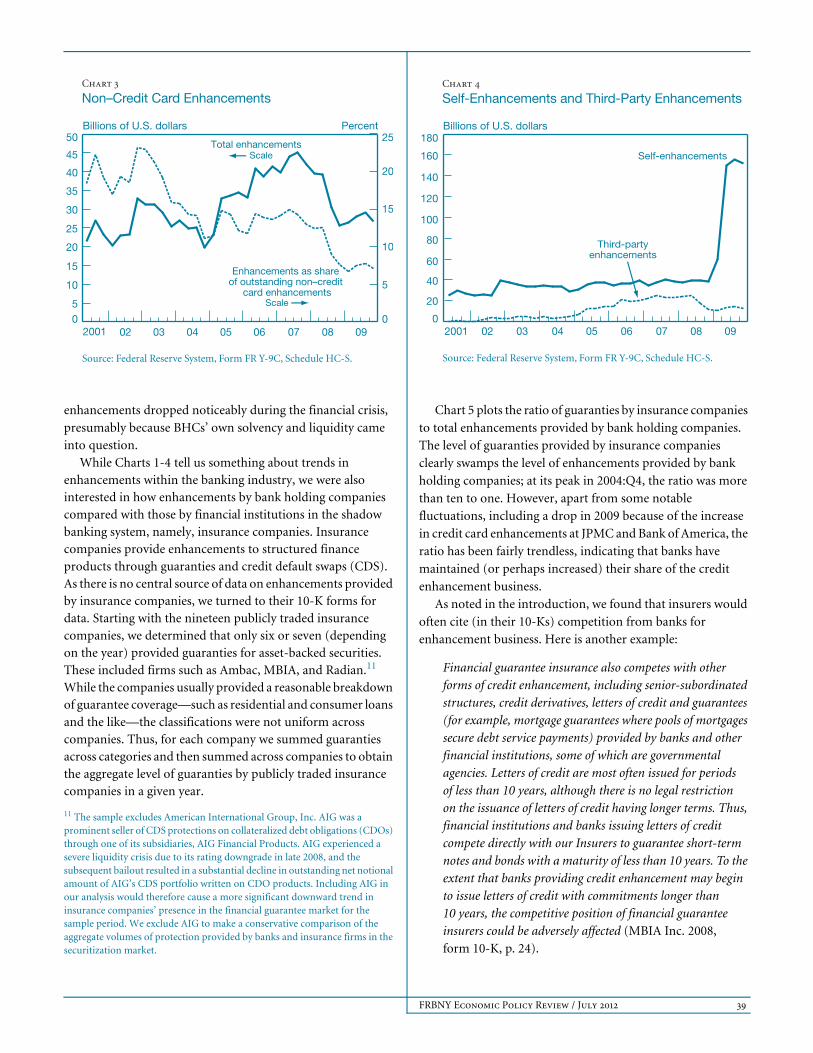
For completeness, Chart 3 plots the enhancements, both by level and per securitized asset, for non–credit card enhancements. The only feature of note is the downward trend in non–credit card enhancements per securitized non–credit card asset. That finding implies that the upward trend in overall enhancements per securitized asset evident in Chart 1 results from the upward trend in credit card enhancements per securitized asset evident in Chart 2.
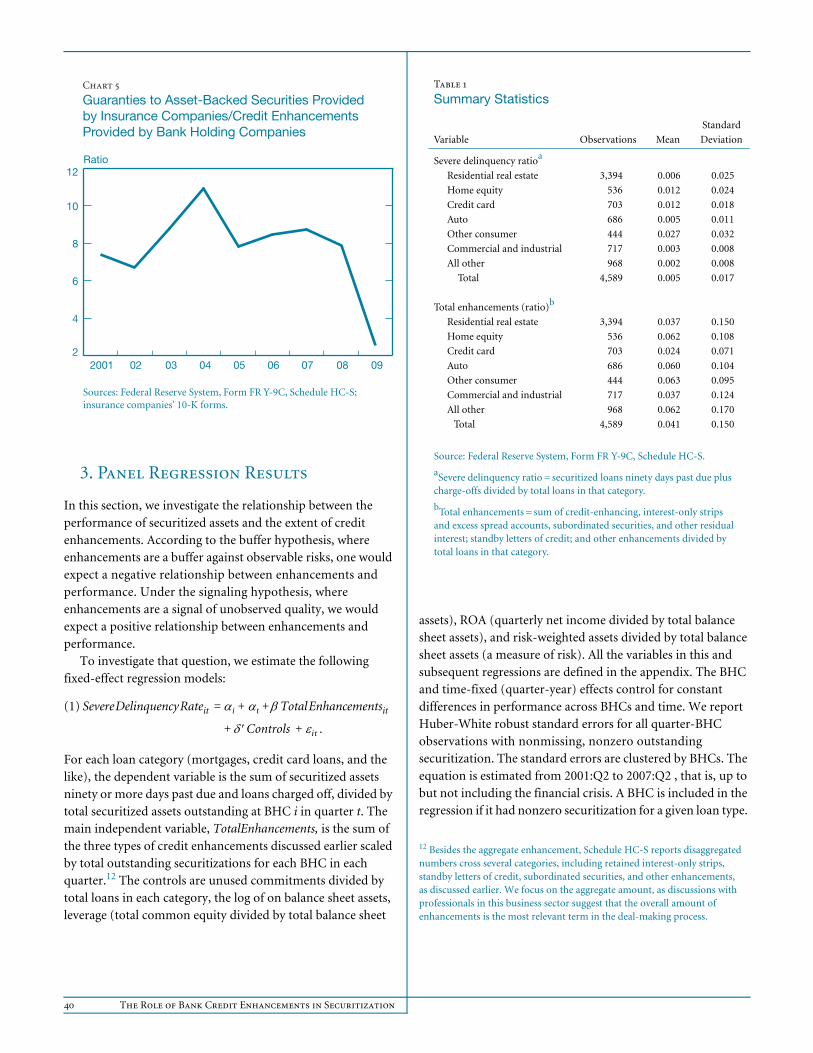
Chart 4 breaks out total enhancements into enhancements of the BHCs’ own securitized assets (“self-enhancements”) and enhancements provided to third parties (“third-party enhancements”). Apart from the beginning and the end of the sample period, self-enhancements were roughly stable at between $30 billion and $40 billion. By contrast, third-party enhancements began trending upward in about 2004:Q4 to reach a peak of about $25 billion in 2008:Q2. Third-party
10 See “Fitch: Chase Increases Credit Enhancement in Credit Card Issuance Trust (CHAIT),” http://www.reuters.com/article/2009/05/12/idUS260368+12-May-2009+BW20090512.
FRBNY Economic Policy Review / July 2012 39
Source: Federal Reserve System, Form FR Y-9C, Schedule HC-S.
Chart 3
Non–Credit Card Enhancements
Billions of U.S. dollars Percent
Enhancements as share of outstanding non–credit
card enhancementsScale
Total enhancementsScale
05
10
15
20
25
30
35
40
45
50
090807060504030220010
5
10
15
20
25
Source: Federal Reserve System, Form FR Y-9C, Schedule HC-S.
Chart 4
Self-Enhancements and Third-Party Enhancements
Billions of U.S. dollars
Third-partyenhancements
Self-enhancements
0
20
40
60
80
100
120
140
160
180
09080706050403022001
enhancements dropped noticeably during the financial crisis, presumably because BHCs’ own solvency and liquidity came into question.
While Charts 1-4 tell us something about trends in enhancements within the banking industry, we were also interested in how enhancements by bank holding companies compared with those by financial institutions in the shadow banking system, namely, insurance companies. Insurance companies provide enhancements to structured finance products through guaranties and credit default swaps (CDS). As there is no central source of data on enhancements provided by insurance companies, we turned to their 10-K forms for data. Starting with the nineteen publicly traded insurance companies, we determined that only six or seven (depending on the year) provided guaranties for asset-backed securities. These included firms such as Ambac, MBIA, and Radian.11 While the companies usually provided a reasonable breakdown of guarantee coverage—such as residential and consumer loans and the like—the classifications were not uniform across companies. Thus, for each company we summed guaranties across categories and then summed across companies to obtain the aggregate level of guaranties by publicly traded insurance companies in a given year.
11 The sample excludes American International Group, Inc. AIG was a prominent seller of CDS protections on collateralized debt obligations (CDOs) through one of its subsidiaries, AIG Financial Products. AIG experienced a severe liquidity crisis due to its rating downgrade in late 2008, and the subsequent bailout resulted in a substantial decline in outstanding net notional amount of AIG’s CDS portfolio written on CDO products. Including AIG in our analysis would therefore cause a more significant downward trend in insurance companies’ presence in the financial guarantee market for the sample period. We exclude AIG to make a conservative comparison of the aggregate volumes of protection provided by banks and insurance firms in the securitization market.
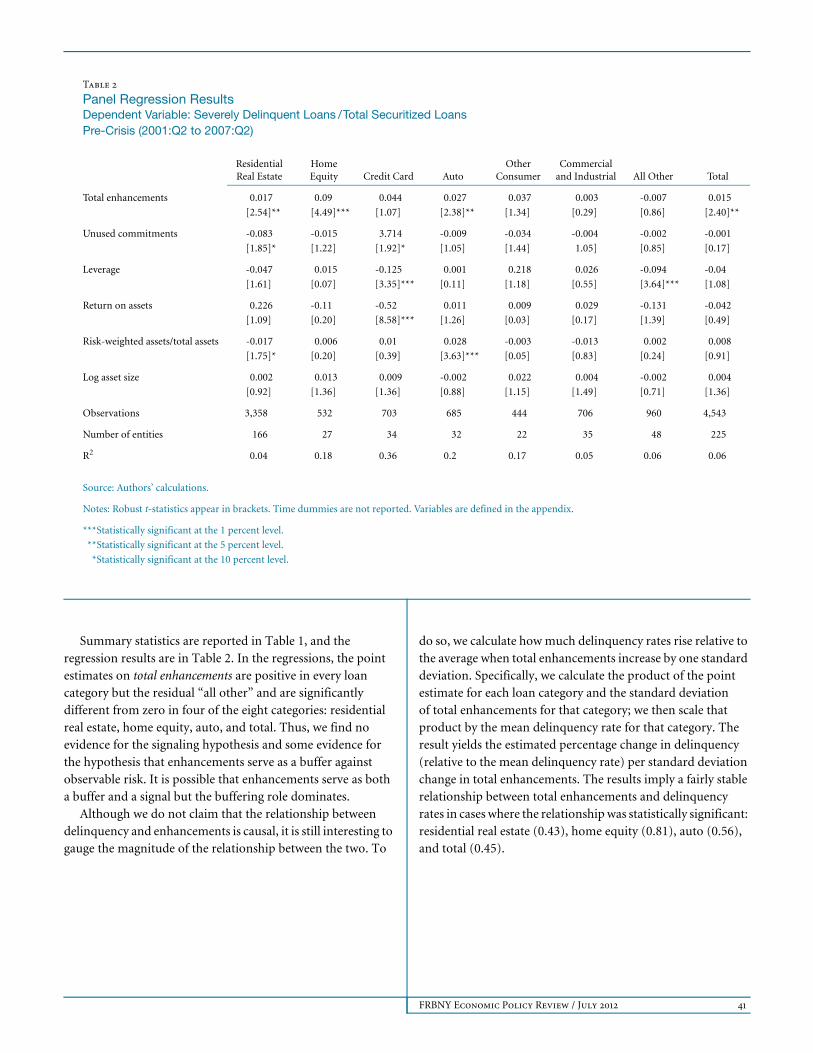
Chart 5 plots the ratio of guaranties by insurance companies
to total enhancements provided by bank holding companies.
The level of guaranties provided by insurance companies
clearly swamps the level of enhancements provided by bank
holding companies; at its peak in 2004:Q4, the ratio was more
than ten to one. However, apart from some notable fluctuations, including a drop in 2009 because of the increase
in credit card enhancements at JPMC and Bank of America, the
ratio has been fairly trendless, indicating that banks have
maintained (or perhaps increased) their share of the credit
enhancement business.
As noted in the introduction, we found that insurers would
often cite (in their 10-Ks) competition from banks for enhancement business. Here is another example:
Financial guarantee insurance also competes with other forms of credit enhancement, including senior-subordinated structures, credit derivatives, letters of credit and guarantees (for example, mortgage guarantees where pools of mortgages secure debt service payments) provided by banks and other financial institutions, some of which are governmental agencies. Letters of credit are most often issued for periods of less than 10 years, although there is no legal restriction on the issuance of letters of credit having longer terms. Thus, financial institutions and banks issuing letters of credit compete directly with our Insurers to guarantee short-term notes and bonds with a maturity of less than 10 years. To the extent that banks providing credit enhancement may begin to issue letters of credit with commitments longer than 10 years, the competitive position of financial guarantee insurers could be adversely affected (MBIA Inc. 2008, form 10-K, p. 24).
40 The Role of Bank Credit Enhancements in Securitization
Sources: Federal Reserve System, Form FR Y-9C, Schedule HC-S; insurance companies’ 10-K forms.
Chart 5
Guaranties to Asset-Backed Securities Provided by Insurance Companies/Credit Enhancements Provided by Bank Holding Companies
Ratio
2
4
6
8
10
12
09080706050403022001
3. Panel Regression Results
In this section, we investigate the relationship between the performance of securitized assets and the extent of credit enhancements. According to the buffer hypothesis, where enhancements are a buffer against observable risks, one would expect a negative relationship between enhancements and performance. Under the signaling hypothesis, where enhancements are a signal of unobserved quality, we would expect a positive relationship between enhancements and performance.
To investigate that question, we estimate the following fixed-effect regression models:
(1) Severe Delinquency Rateit Total Enhancementsit
Controls .
For each loan category (mortgages, credit card loans, and the like), the dependent variable is the sum of securitized assets ninety or more days past due and loans charged off, divided by total securitized assets outstanding at BHC i in quarter t. The main independent variable, TotalEnhancements, is the sum of the three types of credit enhancements discussed earlier scaled by total outstanding securitizations for each BHC in each quarter.12 The controls are unused commitments divided by total loans in each category, the log of on balance sheet assets, leverage (total common equity divided by total balance sheet
i t + +=
+ it+
assets), ROA (quarterly net income divided by total balance sheet assets), and risk-weighted assets divided by total balance sheet assets (a measure of risk). All the variables in this and subsequent regressions are defined in the appendix. The BHC and time-fixed (quarter-year) effects control for constant differences in performance across BHCs and time. We report Huber-White robust standard errors for all quarter-BHC observations with nonmissing, nonzero outstanding securitization. The standard errors are clustered by BHCs. The equation is estimated from 2001:Q2 to 2007:Q2 , that is, up to but not including the financial crisis. A BHC is included in the regression if it had nonzero securitization for a given loan type.
12 Besides the aggregate enhancement, Schedule HC-S reports disaggregated numbers cross several categories, including retained interest-only strips, standby letters of credit, subordinated securities, and other enhancements, as discussed earlier. We focus on the aggregate amount, as discussions with professionals in this business sector suggest that the overall amount of enhancements is the most relevant term in the deal-making process.
Table 1
Summary Statistics
Variable Observations Mean
Standard
Deviation
Severe delinquency ratioa
Residential real estate 3,394 0.006 0.025
Home equity 536 0.012 0.024
Credit card 703 0.012 0.018
Auto 686 0.005 0.011
Other consumer 444 0.027 0.032
Commercial and industrial 717 0.003 0.008
All other 968 0.002 0.008
Total 4,589 0.005 0.017
Total enhancements (ratio)b
Residential real estate 3,394 0.037 0.150
Home equity 536 0.062 0.108
Credit card 703 0.024 0.071
Auto 686 0.060 0.104
Other consumer 444 0.063 0.095
Commercial and industrial 717 0.037 0.124
All other 968 0.062 0.170
Total 4,589 0.041 0.150
Source: Federal Reserve System, Form FR Y-9C, Schedule HC-S.
aSevere delinquency ratio = securitized loans ninety days past due plus charge-offs divided by total loans in that category.
bTotal enhancements = sum of credit-enhancing, interest-only strips and excess spread accounts, subordinated securities, and other residual interest; standby letters of credit; and other enhancements divided by total loans in that category.
FRBNY Economic Policy Review / July 2012 41
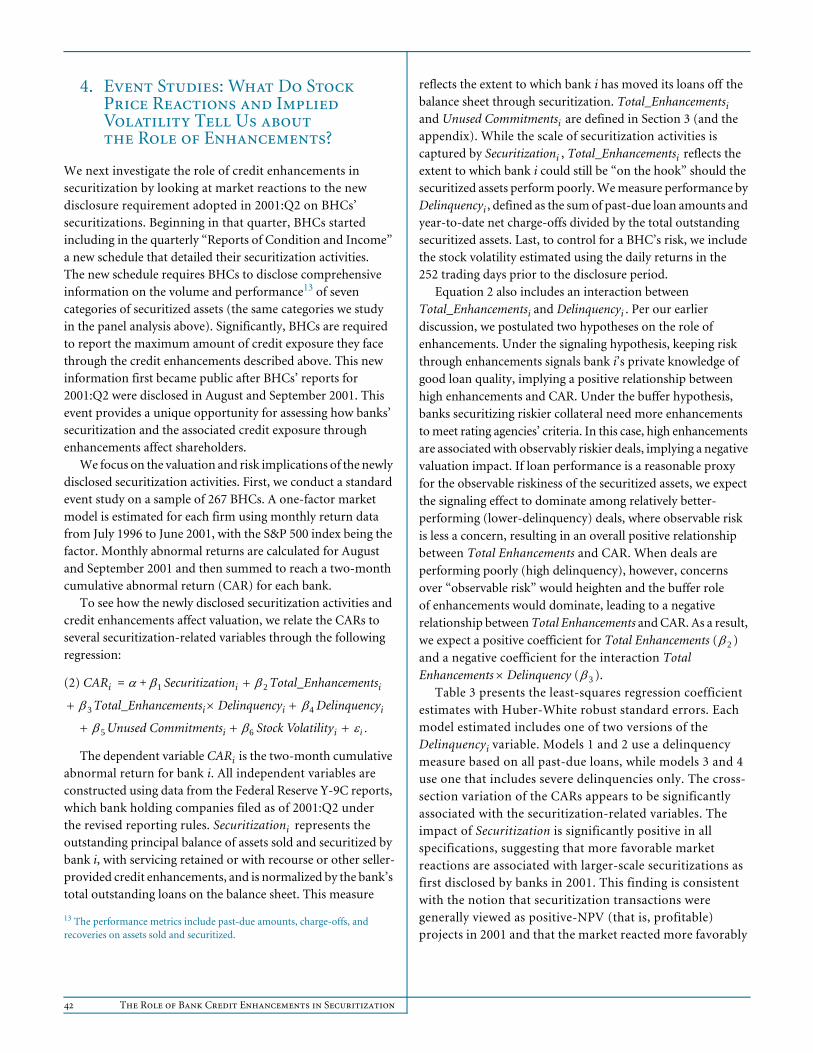
Summary statistics are reported in Table 1, and the regression results are in Table 2. In the regressions, the point estimates on total enhancements are positive in every loan category but the residual “all other” and are significantly different from zero in four of the eight categories: residential real estate, home equity, auto, and total. Thus, we find no evidence for the signaling hypothesis and some evidence for the hypothesis that enhancements serve as a buffer against observable risk. It is possible that enhancements serve as both a buffer and a signal but the buffering role dominates.
Although we do not claim that the relationship between delinquency and enhancements is causal, it is still interesting to gauge the magnitude of the relationship between the two. To
do so, we calculate how much delinquency rates rise relative to the average when total enhancements increase by one standard deviation. Specifically, we calculate the product of the point estimate for each loan category and the standard deviation of total enhancements for that category; we then scale that product by the mean delinquency rate for that category. The result yields the estimated percentage change in delinquency (relative to the mean delinquency rate) per standard deviation change in total enhancements. The results imply a fairly stable relationship between total enhancements and delinquency rates in cases where the relationship was statistically significant: residential real estate (0.43), home equity (0.81), auto (0.56), and total (0.45).
Table 2
Panel Regression ResultsDependent Variable: Severely Delinquent Loans / Total Securitized LoansPre-Crisis (2001:Q2 to 2007:Q2)
Residential Real Estate
Home Equity Credit Card Auto
Other Consumer
Commercial and Industrial All Other Total
Total enhancements 0.017 0.09 0.044 0.027 0.037 0.003 -0.007 0.015
[2.54]** [4.49]*** [1.07] [2.38]** [1.34] [0.29] [0.86] [2.40]**
Unused commitments -0.083 -0.015 3.714 -0.009 -0.034 -0.004 -0.002 -0.001
[1.85]* [1.22] [1.92]* [1.05] [1.44] 1.05] [0.85] [0.17]
Leverage -0.047 0.015 -0.125 0.001 0.218 0.026 -0.094 -0.04
[1.61] [0.07] [3.35]*** [0.11] [1.18] [0.55] [3.64]*** [1.08]
Return on assets 0.226 -0.11 -0.52 0.011 0.009 0.029 -0.131 -0.042
[1.09] [0.20] [8.58]*** [1.26] [0.03] [0.17] [1.39] [0.49]
Risk-weighted assets/total assets -0.017 0.006 0.01 0.028 -0.003 -0.013 0.002 0.008
[1.75]* [0.20] [0.39] [3.63]*** [0.05] [0.83] [0.24] [0.91]
Log asset size 0.002 0.013 0.009 -0.002 0.022 0.004 -0.002 0.004
[0.92] [1.36] [1.36] [0.88] [1.15] [1.49] [0.71] [1.36]
Observations 3,358 532 703 685 444 706 960 4,543
Number of entities 166 27 34 32 22 35 48 225
R2 0.04 0.18 0.36 0.2 0.17 0.05 0.06 0.06
Source: Authors’ calculations.
Notes: Robust t-statistics appear in brackets. Time dummies are not reported. Variables are defined in the appendix.
***Statistically significant at the 1 percent level.
***Statistically significant at the 5 percent level.
***Statistically significant at the 10 percent level.
42 The Role of Bank Credit Enhancements in Securitization
4. Event Studies: What Do Stock Price Reactions and Implied Volatility Tell Us about the Role of Enhancements?
We next investigate the role of credit enhancements in securitization by looking at market reactions to the new disclosure requirement adopted in 2001:Q2 on BHCs’ securitizations. Beginning in that quarter, BHCs started including in the quarterly “Reports of Condition and Income” a new schedule that detailed their securitization activities. The new schedule requires BHCs to disclose comprehensive information on the volume and performance13 of seven categories of securitized assets (the same categories we study in the panel analysis above). Significantly, BHCs are required to report the maximum amount of credit exposure they face through the credit enhancements described above. This new information first became public after BHCs’ reports for 2001:Q2 were disclosed in August and September 2001. This event provides a unique opportunity for assessing how banks’ securitization and the associated credit exposure through enhancements affect shareholders.
We focus on the valuation and risk implications of the newly disclosed securitization activities. First, we conduct a standard event study on a sample of 267 BHCs. A one-factor market model is estimated for each firm using monthly return data from July 1996 to June 2001, with the S&P 500 index being the factor. Monthly abnormal returns are calculated for August and September 2001 and then summed to reach a two-month cumulative abnormal return (CAR) for each bank.
To see how the newly disclosed securitization activities and credit enhancements affect valuation, we relate the CARs to several securitization-related variables through the following regression:
(2) CARi Securitizationi Total_Enhancementsi
Total_Enhancementsi Delinquencyi Delinquencyi
Unused Commitmentsi Stock Volatilityi
The dependent variable CARi is the two-month cumulative abnormal return for bank i. All independent variables are constructed using data from the Federal Reserve Y-9C reports, which bank holding companies filed as of 2001:Q2 under the revised reporting rules. Securitizationi represents the outstanding principal balance of assets sold and securitized by bank i, with servicing retained or with recourse or other seller-provided credit enhancements, and is normalized by the bank’s total outstanding loans on the balance sheet. This measure
13 The performance metrics include past-due amounts, charge-offs, and recoveries on assets sold and securitized.
1+= 2
3 4
5 6 i
reflects the extent to which bank i has moved its loans off the balance sheet through securitization. Total_Enhancementsi and Unused Commitmentsi are defined in Section 3 (and the appendix). While the scale of securitization activities is captured by Securitizationi , Total_Enhancementsi reflects the extent to which bank i could still be “on the hook” should the securitized assets perform poorly. We measure performance by Delinquencyi , defined as the sum of past-due loan amounts and year-to-date net charge-offs divided by the total outstanding securitized assets. Last, to control for a BHC’s risk, we include the stock volatility estimated using the daily returns in the 252 trading days prior to the disclosure period.
Equation 2 also includes an interaction between Total_Enhancementsi and Delinquencyi . Per our earlier discussion, we postulated two hypotheses on the role of enhancements. Under the signaling hypothesis, keeping risk through enhancements signals bank i’s private knowledge of good loan quality, implying a positive relationship between high enhancements and CAR. Under the buffer hypothesis, banks securitizing riskier collateral need more enhancements to meet rating agencies’ criteria. In this case, high enhancements are associated with observably riskier deals, implying a negative valuation impact. If loan performance is a reasonable proxy for the observable riskiness of the securitized assets, we expect the signaling effect to dominate among relatively better-performing (lower-delinquency) deals, where observable risk is less a concern, resulting in an overall positive relationship between Total Enhancements and CAR. When deals are performing poorly (high delinquency), however, concerns over “observable risk” would heighten and the buffer role of enhancements would dominate, leading to a negative relationship between Total Enhancements and CAR. As a result, we expect a positive coefficient for Total Enhancements ( ) and a negative coefficient for the interaction Total Enhancements Delinquency ( ).
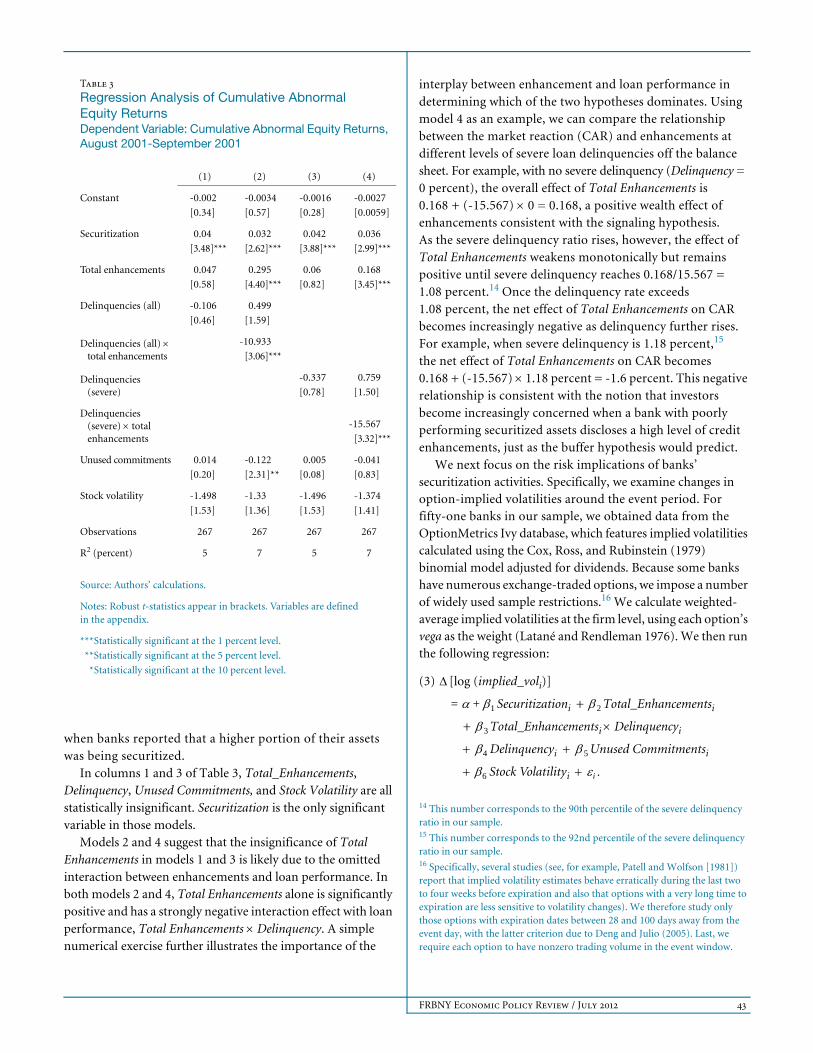
Table 3 presents the least-squares regression coefficient estimates with Huber-White robust standard errors. Each model estimated includes one of two versions of the Delinquencyi variable. Models 1 and 2 use a delinquency measure based on all past-due loans, while models 3 and 4 use one that includes severe delinquencies only. The cross-section variation of the CARs appears to be significantly associated with the securitization-related variables. The impact of Securitization is significantly positive in all specifications, suggesting that more favorable market reactions are associated with larger-scale securitizations as first disclosed by banks in 2001. This finding is consistent with the notion that securitization transactions were generally viewed as positive-NPV (that is, profitable) projects in 2001 and that the market reacted more favorably
2
3
FRBNY Economic Policy Review / July 2012 43
when banks reported that a higher portion of their assets was being securitized.
In columns 1 and 3 of Table 3, Total_Enhancements, Delinquency, Unused Commitments, and Stock Volatility are all statistically insignificant. Securitization is the only significant variable in those models.
Models 2 and 4 suggest that the insignificance of Total Enhancements in models 1 and 3 is likely due to the omitted interaction between enhancements and loan performance. In both models 2 and 4, Total Enhancements alone is significantly positive and has a strongly negative interaction effect with loan performance, Total Enhancements Delinquency. A simple numerical exercise further illustrates the importance of the
interplay between enhancement and loan performance in determining which of the two hypotheses dominates. Using model 4 as an example, we can compare the relationship between the market reaction (CAR) and enhancements at different levels of severe loan delinquencies off the balance sheet. For example, with no severe delinquency (Delinquency = 0 percent), the overall effect of Total Enhancements is 0.168 + (-15.567) 0 = 0.168, a positive wealth effect of enhancements consistent with the signaling hypothesis. As the severe delinquency ratio rises, however, the effect of Total Enhancements weakens monotonically but remains positive until severe delinquency reaches 0.168/15.567 = 1.08 percent.14 Once the delinquency rate exceeds 1.08 percent, the net effect of Total Enhancements on CAR becomes increasingly negative as delinquency further rises. For example, when severe delinquency is 1.18 percent,15 the net effect of Total Enhancements on CAR becomes 0.168 + (-15.567) 1.18 percent = -1.6 percent. This negative relationship is consistent with the notion that investors become increasingly concerned when a bank with poorly performing securitized assets discloses a high level of credit enhancements, just as the buffer hypothesis would predict.
We next focus on the risk implications of banks’ securitization activities. Specifically, we examine changes in option-implied volatilities around the event period. For fifty-one banks in our sample, we obtained data from the OptionMetrics Ivy database, which features implied volatilities calculated using the Cox, Ross, and Rubinstein (1979) binomial model adjusted for dividends. Because some banks have numerous exchange-traded options, we impose a number of widely used sample restrictions.16 We calculate weighted-average implied volatilities at the firm level, using each option’s vega as the weight (Latané and Rendleman 1976). We then run the following regression:
(3) [log (implied_voli)]
Securitizationi + Total_Enhancementsi
+ Total_Enhancementsi Delinquencyi
Delinquencyi Unused Commitmentsi
Stock Volatilityi
14 This number corresponds to the 90th percentile of the severe delinquency ratio in our sample. 15 This number corresponds to the 92nd percentile of the severe delinquency ratio in our sample.16 Specifically, several studies (see, for example, Patell and Wolfson [1981]) report that implied volatility estimates behave erratically during the last two to four weeks before expiration and also that options with a very long time to expiration are less sensitive to volatility changes). We therefore study only those options with expiration dates between 28 and 100 days away from the event day, with the latter criterion due to Deng and Julio (2005). Last, we require each option to have nonzero trading volume in the event window.
1+= 2
3
4 5
6 i
Table 3
Regression Analysis of Cumulative Abnormal Equity ReturnsDependent Variable: Cumulative Abnormal Equity Returns, August 2001-September 2001
(1) (2) (3) (4)
Constant -0.002 -0.0034 -0.0016 -0.0027
[0.34] [0.57] [0.28] [0.0059]
Securitization 0.04 0.032 0.042 0.036
[3.48]*** [2.62]*** [3.88]*** [2.99]***
Total enhancements 0.047 0.295 0.06 0.168
[0.58] [4.40]*** [0.82] [3.45]***
Delinquencies (all) -0.106 0.499
[0.46] [1.59]
Delinquencies (all) total enhancements
-10.933
[3.06]***
Delinquencies (severe)
-0.337
[0.78]
0.759
[1.50]
Delinquencies (severe) total enhancements
-15.567
[3.32]***
Unused commitments 0.014 -0.122 0.005 -0.041
[0.20] [2.31]** [0.08] [0.83]
Stock volatility -1.498 -1.33 -1.496 -1.374
[1.53] [1.36] [1.53] [1.41]
Observations 267 267 267 267
R2 (percent) 5 7 5 7
Source: Authors’ calculations.
Notes: Robust t-statistics appear in brackets. Variables are defined in the appendix.
***Statistically significant at the 1 percent level.
***Statistically significant at the 5 percent level.
***Statistically significant at the 10 percent level.
44 The Role of Bank Credit Enhancements in Securitization
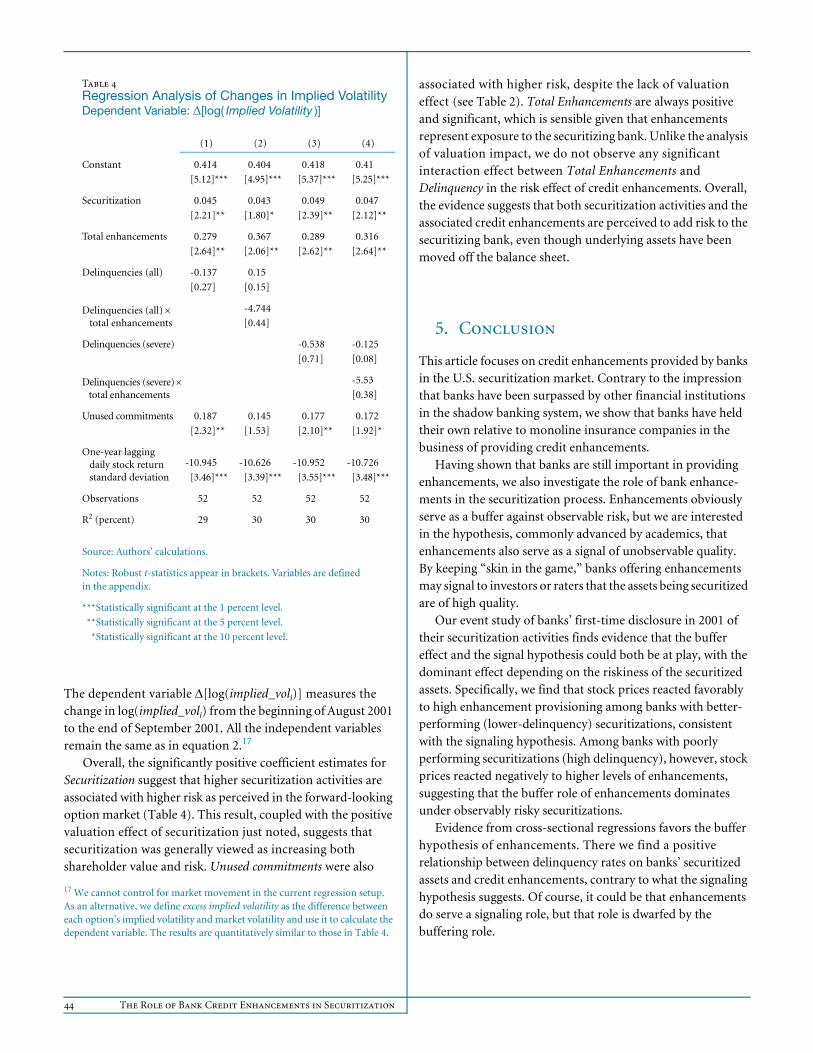
The dependent variable [log(implied_voli)] measures the change in log(implied_voli) from the beginning of August 2001 to the end of September 2001. All the independent variables remain the same as in equation 2.17
Overall, the significantly positive coefficient estimates for Securitization suggest that higher securitization activities are associated with higher risk as perceived in the forward-looking option market (Table 4). This result, coupled with the positive valuation effect of securitization just noted, suggests that securitization was generally viewed as increasing both shareholder value and risk. Unused commitments were also
17 We cannot control for market movement in the current regression setup. As an alternative, we define excess implied volatility as the difference between each option’s implied volatility and market volatility and use it to calculate the dependent variable. The results are quantitatively similar to those in Table 4.
associated with higher risk, despite the lack of valuation effect (see Table 2). Total Enhancements are always positive and significant, which is sensible given that enhancements represent exposure to the securitizing bank. Unlike the analysis of valuation impact, we do not observe any significant interaction effect between Total Enhancements and Delinquency in the risk effect of credit enhancements. Overall, the evidence suggests that both securitization activities and the associated credit enhancements are perceived to add risk to the securitizing bank, even though underlying assets have been moved off the balance sheet.
5. Conclusion
This article focuses on credit enhancements provided by banks in the U.S. securitization market. Contrary to the impression that banks have been surpassed by other financial institutions in the shadow banking system, we show that banks have held their own relative to monoline insurance companies in the business of providing credit enhancements.
Having shown that banks are still important in providing enhancements, we also investigate the role of bank enhance-ments in the securitization process. Enhancements obviously serve as a buffer against observable risk, but we are interested in the hypothesis, commonly advanced by academics, that enhancements also serve as a signal of unobservable quality. By keeping “skin in the game,” banks offering enhancements may signal to investors or raters that the assets being securitized are of high quality.
Our event study of banks’ first-time disclosure in 2001 of their securitization activities finds evidence that the buffer effect and the signal hypothesis could both be at play, with the dominant effect depending on the riskiness of the securitized assets. Specifically, we find that stock prices reacted favorably to high enhancement provisioning among banks with better-performing (lower-delinquency) securitizations, consistent with the signaling hypothesis. Among banks with poorly performing securitizations (high delinquency), however, stock prices reacted negatively to higher levels of enhancements, suggesting that the buffer role of enhancements dominates under observably risky securitizations.
Evidence from cross-sectional regressions favors the buffer hypothesis of enhancements. There we find a positive relationship between delinquency rates on banks’ securitized assets and credit enhancements, contrary to what the signaling hypothesis suggests. Of course, it could be that enhancements do serve a signaling role, but that role is dwarfed by the buffering role.
Table 4Regression Analysis of Changes in Implied VolatilityDependent Variable: [log( Implied Volatility )]
(1) (2) (3) (4)
Constant 0.414 0.404 0.418 0.41
[5.12]*** [4.95]*** [5.37]*** [5.25]***
Securitization 0.045 0.043 0.049 0.047
[2.21]** [1.80]* [2.39]** [2.12]**
Total enhancements 0.279 0.367 0.289 0.316
[2.64]** [2.06]** [2.62]** [2.64]**
Delinquencies (all) -0.137 0.15
[0.27] [0.15]
Delinquencies (all) total enhancements
-4.744
[0.44]
Delinquencies (severe) -0.538 -0.125
[0.71] [0.08]
Delinquencies (severe) total enhancements
-5.53
[0.38]
Unused commitments 0.187 0.145 0.177 0.172
[2.32]** [1.53] [2.10]** [1.92]*
One-year lagging daily stock return standard deviation
-10.945
[3.46]***
-10.626
[3.39]***
-10.952
[3.55]***
-10.726
[3.48]***
Observations 52 52 52 52
R2 (percent) 29 30 30 30
Source: Authors’ calculations.
Notes: Robust t-statistics appear in brackets. Variables are defined in the appendix.
***Statistically significant at the 1 percent level.
***Statistically significant at the 5 percent level.
***Statistically significant at the 10 percent level.

FRBNY Economic Policy Review / July 2012 45
Delinquencies (All): Securitized loans thirty or more days past due plus charge-offs divided by total securitized loans in the category.
Delinquencies (All) (Total Enhancements): Delinquencies (all) times total credit enhancements.
Delinquencies (Severe): Securitized loans ninety days past due plus charge-offs divided by total securitized loans in the category.
Delinquencies (Severe) (Total Enhancements): Delinquencies (severe) times total credit enhancements.
Leverage: Total common equity divided by total balance sheet assets.
Log Asset Size: Natural log of total balance sheet assets.
Risk-Weighted Assets/Total Assets: Total risk-weighted assets divided by total balance sheet assets.
ROA: Quarterly net income divided by total balance sheet assets.
Securitization: Total securitized loans divided by total balance sheet loans.
Severely Delinquent Loans/Total Securitized Loans: Securitized loans ninety days past due plus charge-offs divided by total securitized loans in the category.
Stock Volatility: One-year lagging daily stock return standard deviation.
Total (Credit) Enhancements: Sum of interest-only strips, subordinated securities, and other residual interest; standby letters of credit; and other enhancements divided by total loans in the category.
Unused Commitments: Unused commitments to provide liquidity divided by total loans in the category.
Appendix: Variable Definitions

References
46 The Role of Bank Credit Enhancements in Securitization
Albertazzi, U., G. Eramo, L. Gambacorta, and C. Salleo. 2011.
“Securitization Is Not that Evil after All.” BIS Working Paper
no. 341, March.
Ashcraft, A. B., and T. Schuermann. 2008. “Understanding the
Securitization of Subprime Mortgage Credit.” Federal Reserve
Bank of New York Staff Reports, no. 318, March.
Ashcraft, A. B., J. Vickery, and P. Goldsmith-Pinkham. 2010. “MBS
Ratings and the Mortgage Credit Boom.” Federal Reserve Bank
of New York Staff Reports, no. 449, May.
Berger, A. N., and G. F. Udell. 1990. “Collateral, Loan Quality, and
Bank Risk.” Journal of Monetary Economics 25, no. 1
(January): 21-42.
Bernanke, B. S. 2012. “Some Reflections on the Crisis and the Policy
Response.” Remarks delivered at the Russell Sage Foundation
and Century Foundation Conference on “Rethinking Finance,”
New York City, April 13.
Besanko, D., and A. Thakor. 1987. “Collateral and Rationing: Sorting
Equilibria in Monopolistic and Competitive Credit Markets.”
International Economic Review 28, no. 3 (October): 671-89.
Cetorelli, N., and S. Peristiani. 2012. “The Role of Banks in Asset
Securitization.” Federal Reserve Bank of New York Economic
Policy Review 18, no. 2 (July): 47-63.
Chan, Y., and G. Kanatas. 1985. “Asymmetric Valuations and the Role
of Collateral in Loan Agreements.” Journal of Money, Credit,
and Banking 17, no. 1 (February): 84-95.
Cox, J. C., S. A. Ross, and M. Rubinstein. 1979. “Option Pricing:
A Simplified Approach.” Journal of Financial Economics 7,
no. 3 (September): 229-63.
Deng, Q., and B. Julio. 2005. “The Informational Content of Implied
Volatility around Stock Splits.” University of Illinois at
Urbana-Champaign working paper, September.
Downing, C., D. Jaffee, and N. Wallace. 2009. “Is the Market for
Mortgage-Backed Securities a Market for Lemons?” Review
of Financial Studies 22, no. 7 (July): 2457-94.
Erel, I., T. D. Nadauld, and R. M. Stulz. 2011. “Why Did U.S. Banks
Invest in Highly Rated Securitization Tranches?” Fisher College
of Business Working Paper no. 2011-03-016, July 25.
James, C. M. 2010. “Mortgage-Backed Securities: How Important Is
‘Skin in the Game’?” Federal Reserve Bank of San Francisco
Economic Letter, no. 2010-37, December 13.
Latané, H. A., and R. J. Rendleman, Jr. 1976. “Standard Deviations
of Stock Price Ratios Implied in Option Prices.” Journal
of Finance 31, no. 2 (May): 369-81.
Levitin, A. J. 2011. “Skin in the Game: Risk Retention Lessons from
Credit Card Securitization.” Georgetown Law and Economics
Research Paper no. 11-18, August 9.
Patell, J. M., and M. A. Wolfson. 1981. “The Ex Ante and Ex Post Price
Effects of Quarterly Earnings Announcements Reflected in Option
and Stock Prices.” Journal of Accounting Research 19, no. 2
(autumn): 434-58.
Pozsar, Z., T. Adrian, A. Ashcraft, and H. Boesky. 2010. “Shadow
Banking.” Federal Reserve Bank of New York Staff Reports,
no. 458, July.
Standard and Poor’s. 2008. “The Basics of Credit Enhancement
in Securitizations.” June 24.
The views expressed are those of the authors and do not necessarily reflect the position of the Federal Reserve Bank of New York or the Federal Reserve System. The Federal Reserve Bank of New York provides no warranty, express or implied, as to the accuracy, timeliness, completeness, merchantability, or fitness for any particular purpose of any information contained in documents produced and provided by the Federal Reserve Bank of New York in any form or manner whatsoever.