the role of berp in mammalian systems
TRANSCRIPT

The Role of BERP in Mammalian Systems
by
Carol C. Cheung
A thesis submitted in conformity with the requirements for the degree ofDoctor of Philosophy
Department of Medical BiophysicsFaculty of Medicine
School of Graduate StudiesUniversity of Toronto
Copyright by Carol C. Cheung 2009

i i
Thesis Abstract
The Role of BERP in Mammalian SystemsCarol C. Cheung
Doctor of Philosophy, Department of Medical Biophysics, University of Toronto, 2009
p53 functions as an important tumour suppressor through its ability to regulate a number of
important cellular processes such as cell cycle arrest, apoptosis, DNA repair, senescence, and
angiogenesis. An in vivo genetic modifier screen performed using Drosophila melanogaster
resulted in the identification of D. melanogaster brain tumour (brat) as a putative modifier of
the p53 small eye phenotype. Mammalian homologs of brat are members of the tripartite
motif family that contain a c-terminal NHL domain. We focus on elucidating the in vivo role
of one such homolog, BERP, through the generation and characterization of a classical gene-
deletion mouse mutant. We report that BERP-deficient mice exhibit enhanced
learning/memory, increased fear, impaired motor coordination, and increased resistance to
PTZ -induced seizures. Electrophysiological and biochemical studies show a decrease in
mIPSC amplitude along with a decrease in cell surface expression of gamma2 subunit-
containing GABA A receptors in the brains of BERP-deficient mice. In addition, no effect of
genotype is apparent when examining BERP mRNA levels in the brain. This suggests that
the decreased cell surface expression of gamma2 subunit-containing GABA A receptors is
likely a posttranscriptional phenomenon and supports the possibility that BERP may be
involved in the intracellular trafficking of GABA A receptors. In investigating the possible
relationship between BERP and p53, we identify the presence of a transcriptionally
competent p53 response element within the first intron of the human BERP genomic locus
and demonstrate that the BERP expression is up regulated in a p53-dependent manner both in

iii
vitro and in vivo. These results support the interpretation that BERP is a novel p53-regulated
gene and suggest a new role for p53 in the regulation of GABA A receptor trafficking and
epileptogenesis.

iv
Acknowledgements
My eternal gratitude to the people who made this journey possible:
To Dennis, Harrison and Leonardo…for being the reasons that make life worth living.
To my parents, my brother, and my parents-in-law…for their constant support and love.
To all the members of the Mak Lab for their help and friendship over the years. My sincerethanks to Scott Pownall who pointed the way for me during the earliest stages of this project.And to Thorsten Berger, Andrew Elia, Jillian Haight, Dave McIlwain, Patrick Reilly, CaimeiYang, and Kathrin Zaugg...I cannot even begin to thank them for their scientific guidance, theirunwavering support, and their unconditional friendship.
To Qi Wan, Ning Chang, and Lijun Li...for sharing their expertise on ion channel functionswith me.
To members of the Van der Kooy lab, especially Sue Runciman and Brenda Coles-Takabe, forsharing their expertise on neural stem cell biology with me.
To Tom Ferraro...for sharing his expertise in seizure susceptibility testing with me.
To Avrum Gottlieb and the Canadian Instititues of Health Research...for their financialsupport that has made this work possible.
To Yvonne Bedford, Runjan Chetty, Andrew Evans, Roni Sambas, Joan Sweet, and Theo vander Kwast, of the Department of Pathology at the Universitiy Health Network...for theirsupport in allowing me to complete the work of this thesis.
To Sylvia Asa, Pathologist-in-Chief and clinician-scientist extraordinaire, for her mentorshipover the years and for being a truly inspiring real-life example of “The Triple Threat“.
To the members of my supervisory committee, Sam Benchimol and James Woodgett...forsharing their time and scientific ideas with me. I realize just how lucky I was to have twosuch incredible minds guiding my scientific progress. I shall miss their wise counsel.
And last but certainly not least, to my supervisor Tak Mak…for his support, encouragement,and guidance…for teaching me the importance of perseverance….and for allowing me theopportunity, if only for a little while, to walk in the land of the giants.
v
Table of Contents
THESIS ABSTRACT................................................................................................................... II
ACKNOWLEDGEMENTS.......................................................................................................... IV
TABLE OF CONTENTS...............................................................................................................V
LIST OF ABBREVIATIONS.....................................................................................................VIII
LIST OF FIGURES................................................................................................................... XII
1 INTRODUCTION................................................................................................................. 1
1.1 OPENING REMARKS ......................................................................................................... 11.2 P53 - MOLECULE OF THE YEAR (1993, SCIENCE MAGAZINE) ................................................... 2
1.2.1 p53 – The protein ....................................................................................................... 21.2.2 p53 and Cancer.......................................................................................................... 31.2.3 p53-deficient mice ....................................................................................................... 41.2.4 p53 - The Transcription Factor ..................................................................................... 41.2.5 The p53 Network ........................................................................................................ 51.2.6 In search of novel p53 targets: In vivo genetic screen using Drosophila melanogaster ............. 9
1.3 B RAIN E XPRESSED R ING FINGER P ROTEIN (BERP)...............................................................111.3.1 D. melanogaster Brain Tumour (brat) suppresses the eye phenotype of dp53 ........................111.3.2 Mammalian homologs of D. melanogaster brat ...............................................................11
1.3.2.1 BERP/TRIM3........................................................................................................................................................151.3.2.2 NARF/TRIM2.......................................................................................................................................................161.3.2.3 HT2A/TRIM32.....................................................................................................................................................17
1.4 OVERVIEW OF NEURONAL FUNCTION IN THE MAMMALIAN CNS.............................................181.4.1 Anatomy of the Neuron ...............................................................................................181.4.2 Neuronal membrane potentials .....................................................................................21
1.4.2.1 Resting potential ................................................................................................................................................211.4.2.2 Action potential ..................................................................................................................................................21
1.4.3 Overview of the synapse ..............................................................................................221.4.4 Overview of general neuroreceptor functions...................................................................221.4.5 Overview of Neurotransmitter Systems...........................................................................23
1.5 GABAA RECEPTOR SIGNALING WITHIN THE MAMMALIAN CNS.............................................241.5.1 GABA - The Neurotransmitter ......................................................................................241.5.2 GABA Receptor Family ...............................................................................................251.5.3 GABA A Receptors .....................................................................................................25
1.5.3.1 The GABAA Receptor in Human Disease......................................................................................................301.5.3.1.1 Epilepsy...........................................................................................................................................................301.5.3.1.2 Schizophrenia ................................................................................................................................................311.5.3.1.3 Anxiety Disorders.........................................................................................................................................31
1.5.3.2 The GABA A Receptor Lifecycle.....................................................................................................................321.5.3.2.1 Assembly of GABAARs...............................................................................................................................321.5.3.2.2 Trafficking of the GABAAR to the cell surface.....................................................................................331.5.3.2.3 Synpatic Clustering of GABAARs...........................................................................................................341.5.3.2.4 Endocytosis of GABAARs..........................................................................................................................351.5.3.2.5 Post-endocytic recycling and degradation of GABAARs..................................................................36
1.5.4 GABAB Receptors ......................................................................................................36

vi
1.5.5 GABAC Receptors......................................................................................................371.6 THESIS RATIONALE AND OBJECTIVES.................................................................................37
2 BERP IS A NOVEL P53 TARGET GENE.............................................................................38
2.1 INTRODUCTION..............................................................................................................382.2 MATERIALS AND METHODS..............................................................................................40
2.2.1 DNA sequences and prediction of p53-binding sites .........................................................402.2.2 Cell culture...............................................................................................................402.2.3 ChIP assay ...............................................................................................................402.2.4 Luciferase assay ........................................................................................................412.2.5 Real time RT-PCR......................................................................................................412.2.6 Genotyping of p53-deficient mice ..................................................................................422.2.7 In-situ hybridization...................................................................................................42
2.3 RESULTS.......................................................................................................................442.3.1 The BERP promoter region contains multiple potential p53 response elements .....................442.3.2 p53 can bind BERP p53REs in vivo and regulate transcription..........................................472.3.3 BERP expression is p53-dependent in vitro .....................................................................502.3.4 BERP expression is p53-dependent in vivo......................................................................53
3 THE ROLE OF BERP IN THE MAMMALIAN CNS .............................................................56
3.1 INTRODUCTION..............................................................................................................563.2 MATERIALS AND METHODS..............................................................................................57
3.2.1 ES cell culture ...........................................................................................................573.2.2 Generation of BERP-deficient mice................................................................................573.2.3 Genotyping of BERP-deficient mice by PCR and Southern Blotting.....................................583.2.4 Generation and genotyping of BERP-/-;p53-/- mice ..........................................................593.2.5 Histological analysis ..................................................................................................593.2.6 Western blot analysis..................................................................................................603.2.7 Behavioural characterization .......................................................................................603.2.8 Pentylenetetrazol seizure susceptibility testing.................................................................643.2.9 Hemi-brain slice preparation .......................................................................................653.2.10 Electrophysiology...................................................................................................663.2.11 Murine cortical neuron cultures................................................................................663.2.12 Biotinylation Assay ................................................................................................673.2.13 Real time RT-PCR..................................................................................................683.2.14 Neurite Outgrowth Assay ........................................................................................683.2.15 Neurosphere formation and differentiation assays .......................................................693.2.16 Neurosphere differentiation assay.............................................................................703.2.17 Thymidine incorporation assay.................................................................................71
3.3 RESULTS.......................................................................................................................723.3.1 Generation of BERP-deficient mice................................................................................723.3.2 Behavioural characterization of BERP-/- mice.................................................................77
3.3.2.1 SHIRPA Neurological Screen in BERP-deficient mice .............................................................................773.3.2.2 BERP-/- mice exhibit increased freezing in fear conditioning tests ....................................................803.3.2.3 BERP-/- mice exhibit abnormalities in the open field test for exploration and generallocomotion; however, no effect of BERP is seen in the elevated plus maze test ......................................................843.3.2.4 BERP-/- mice exhibit abnormalities in the accelerating rotarod test...................................................923.3.2.5 No effect of BERP in tests for sensorimotor gating ..................................................................................953.3.2.6 No effect of BERP in tail suspension test (depression-related behaviour). .......................................983.3.2.7 No effect of BERP in grip test (neuromuscular function)......................................................................1013.3.2.8 No effect of BERP in tail flick test (nociception) ....................................................................................101

vii
3.3.3 Increased resistance to PTZ-induced seizures in Berp-/- mice........................................... 1013.3.4 The amplitude of mIPSCs is decreased in BERP-/- mice.................................................. 1053.3.5 Decreased surface expression of GABAAR gamma2 subunit in BERP-/- mice ...................... 1083.3.6 GABA A receptor gamma2 subunit mRNA levels are unchanged in BERP-/- mice................. 1113.3.7 Cortical neurons from BERP-/- embryos show an increase in total neurite length ............... 1113.3.8 BERP-deficiency has no impact on the self-renewal, differentiation, proliferation, viability andsize of murine neural stem cells .............................................................................................. 114
4 DISCUSSION.................................................................................................................... 118
4.1 WHAT IS THE NEUROLOGICAL PHENOTYPE OF BERP-DEFICIENT MICE?.................................... 1184.2 INVOKING OCCAM'S RAZOR: THE BERP-DEFICIENT MOUSE AS A MODEL FOR NON-ATAXICCEREBELLAR DYSFUNCTION?....................................................................................................... 1224.3 WHAT IS THE POSSIBLE ROLE OF BERP IN THE CNS?........................................................... 1274.4 IS BERP INVOLVED IN NEURITE OUTGROWTH?.................................................................. 1284.5 IS BERP A FUNCTIONAL HOMOLOG OF D. MELANOGASTER BRAT? ........................................... 1294.6 WHY DO KNOCKOUT MICE FROM THE TRIM-NHL FAMILY NOT DEVELOP BRAIN TUMOURS? ........ 1314.7 THE P53/BERP /GABAAR RELATIONSHIP - A NOVEL ROLE FOR P53 IN THE BRAIN?................. 1334.8 PTZ – A NOVEL THERAPY IN THE BATTLE AGAINST CANCER? ............................................... 1344.9 CLOSING REMARKS ...................................................................................................... 136
5 REFERENCES.................................................................................................................. 137
viii
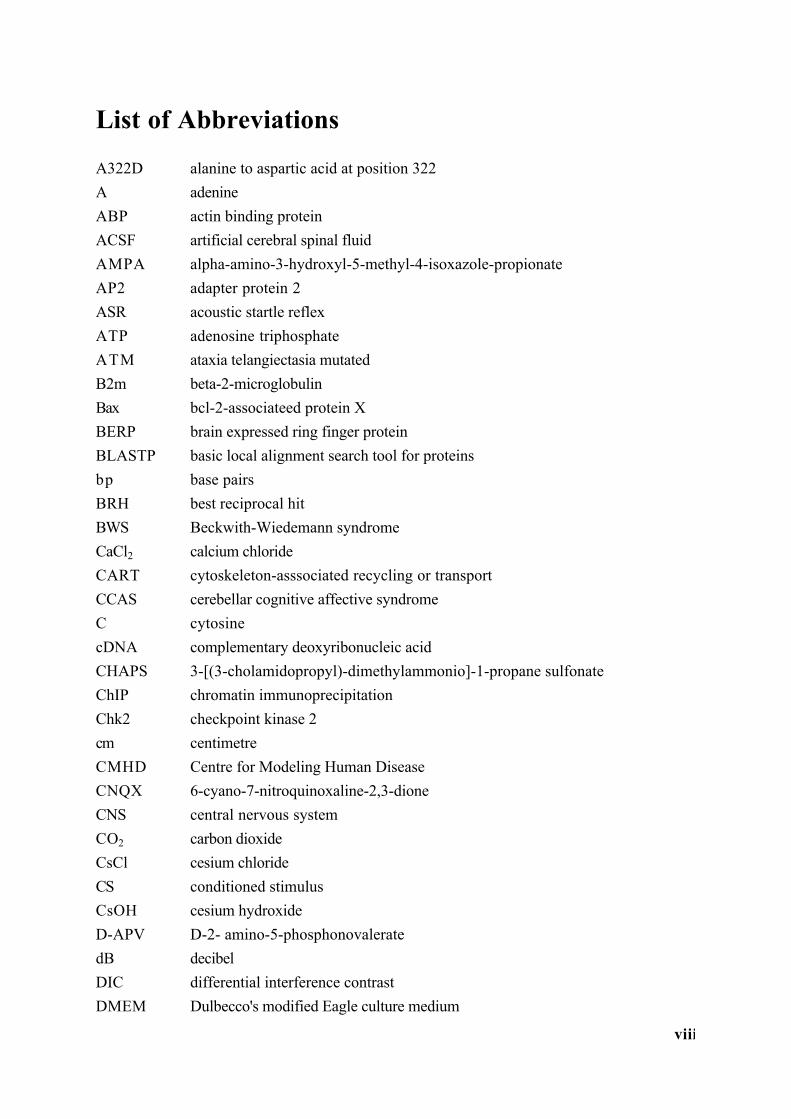
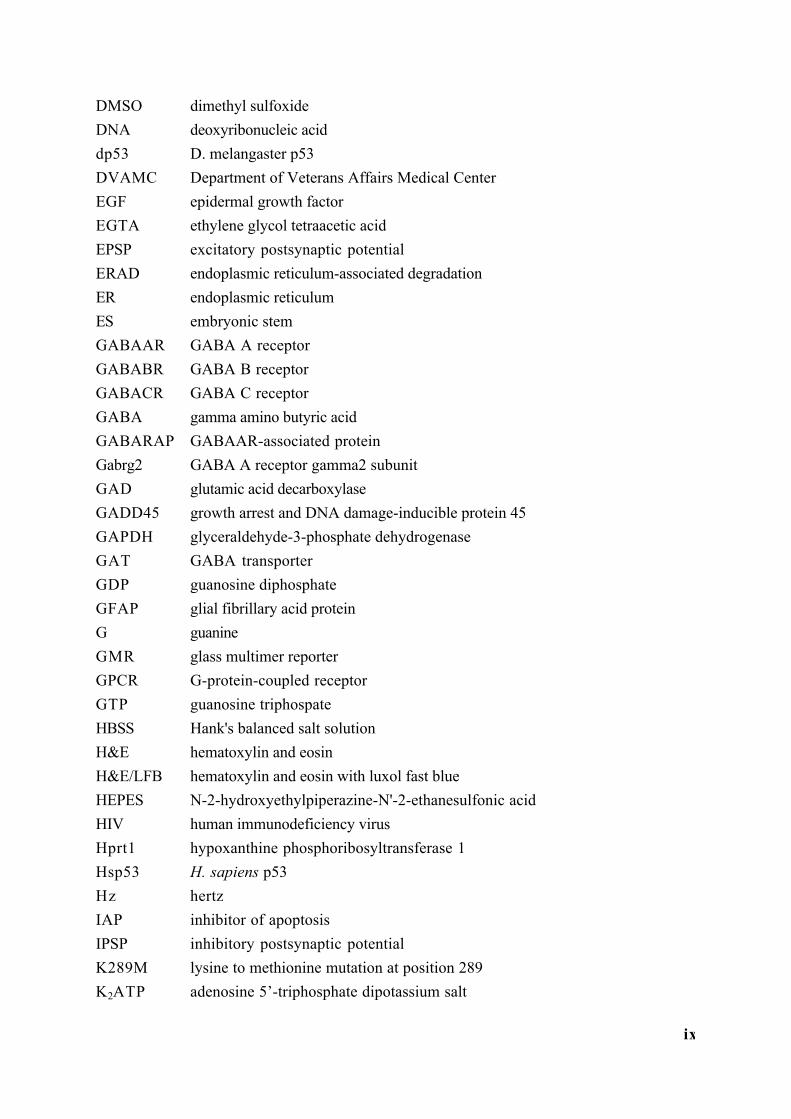
List of Abbreviations
A322D alanine to aspartic acid at position 322A adenineABP actin binding proteinACSF artificial cerebral spinal fluidAMPA alpha-amino-3-hydroxyl-5-methyl-4-isoxazole-propionateAP2 adapter protein 2ASR acoustic startle reflexATP adenosine triphosphateATM ataxia telangiectasia mutatedB2m beta-2-microglobulinBax bcl-2-associateed protein XBERP brain expressed ring finger proteinBLASTP basic local alignment search tool for proteinsbp base pairsBRH best reciprocal hitBWS Beckwith-Wiedemann syndromeCaCl2 calcium chlorideCART cytoskeleton-asssociated recycling or transportCCAS cerebellar cognitive affective syndromeC cytosinecDNA complementary deoxyribonucleic acidCHAPS 3-[(3-cholamidopropyl)-dimethylammonio]-1-propane sulfonateChIP chromatin immunoprecipitationChk2 checkpoint kinase 2cm centimetreCMHD Centre for Modeling Human DiseaseCNQX 6-cyano-7-nitroquinoxaline-2,3-dioneCNS central nervous systemCO2 carbon dioxideCsCl cesium chlorideCS conditioned stimulusCsOH cesium hydroxideD-APV D-2- amino-5-phosphonovaleratedB decibelDIC differential interference contrastDMEM Dulbecco's modified Eagle culture medium
ix
DMSO dimethyl sulfoxideDNA deoxyribonucleic aciddp53 D. melangaster p53DVAMC Department of Veterans Affairs Medical CenterEGF epidermal growth factorEGTA ethylene glycol tetraacetic acidEPSP excitatory postsynaptic potentialERAD endoplasmic reticulum-associated degradationER endoplasmic reticulumES embryonic stemGABAAR GABA A receptorGABABR GABA B receptorGABACR GABA C receptorGABA gamma amino butyric acidGABARAP GABAAR-associated proteinGabrg2 GABA A receptor gamma2 subunitGAD glutamic acid decarboxylaseGADD45 growth arrest and DNA damage-inducible protein 45GAPDH glyceraldehyde-3-phosphate dehydrogenaseGAT GABA transporterGDP guanosine diphosphateGFAP glial fibrillary acid proteinG guanineGMR glass multimer reporterGPCR G-protein-coupled receptorGTP guanosine triphospateHBSS Hank's balanced salt solutionH&E hematoxylin and eosinH&E/LFB hematoxylin and eosin with luxol fast blueHEPES N-2-hydroxyethylpiperazine-N'-2-ethanesulfonic acidHIV human immunodeficiency virusHprt1 hypoxanthine phosphoribosyltransferase 1Hsp53 H. sapiens p53Hz hertzIAP inhibitor of apoptosisIPSP inhibitory postsynaptic potentialK289M lysine to methionine mutation at position 289K2ATP adenosine 5’-triphosphate dipotassium salt

x
KCl potassium chloridekDA kilodaltonkg kilogramK+ potassiumLOH loss of heterozygosityLTD long-term depressionLTP long-term potentiationmA milliampMAP2 microtubule-associated protein 2mCi millicurieMdm2 mouse double minute 2MgCl2 magnesium chloridemg milligrammIPSC miniature inhibitory postsynaptic currentmL millilitremm millimetremM millimolarmOsm milliosmolmRNA messenger ribonucleic acidmV millivoltNa3VO4 sodium orthovanadateNaCl sodium chlorideNaF sodium flourideNaH2PO4 sodium dihydrogenphosphateNaHCO3 sodium bicarbonateNARF neural activity-related RING finger proteinNa+ sodiumNCBI National Center for Biotechnology InformationNHL ncl-1, HT2A, lin41NMDA N-methyl-D-aspartic acidO2 oxygenp53RE p53 response elementPAC P1-derived artificial chromosomepA pulse amplitudePBS phosphate buffered salinePBS phosphate buffered salinePCR polymerase chain reactionPKA protein kinase A

xi
PKC protein kinase CPNS peripheral nervous systemPP1alpha protein phosphatase 1 alphaPPIA peptidylprolyl isomerase APPI prepulse inhibitionPRIP phospholipase-C-related catalytically inactive proteinPTZ pentylenetetrazolPu purinePy pyrimidineQ351X glutamine to unspecified amino acid at position 351R43Q arginine to glutamine mutation at position 43RBCC RING finger, b-box, coiled-coilRING really interesting new geneRNA ribonucleic acidrpm revolutions per minuteSEM standard error of the meanSFM serum free mediaSHIRPA Smithkline Beecham, MRC Harwell, Imperial College, the Royal London hospital Phenotype AssessmentSVZ sub-ventricular zoneTBP TATA binding proteinTLE temporal lobe epilepsyTRIM tripartite motifTris 2-amino-2-(hydroxymethyl)-1,3-propanediolT thymineTTX tetrodotoxinUAS upstream activating sequenceuM micromolarUS unconditioned stimulusUTP uridine triphosphateVGAT vesicular neurotransmitter transporterv/v volume to volume5FU 5-fluorouracil

xii
List of Figures
Chapter 1Figure 1 Structure and Functions of p53…………………………..………………. 8Figure 2 Mammalian homologs of brat…………………………………………… 14Figure 3 Anatomy of the neuron……………………………………………………20Figure 4 The GABA A Receptor……………………………………………….…..28Chapter 2Figure 5 Predicted p53REs within the BERP genomic locus……………………… 46Figure 6 In vivo binding and transcriptional competence of predicted BERP p53REs…………………………………………………………… 49Figure 7 BERP expression in HCT116 p53-/- and HCT116 p53+/+ cells………… 52Figure 8 BERP expression in p53-/- and p53+/+ mice…………………………….. 55Chapter 3Figure 9 Targeted disruption of the murine BERP locus…………………….…….. 74Figure 10 General phenotypic assessment of BERP-deficient mice…………………76Figure 11 SHIRPA neurological assessment for body weight in BERP-deficient mice…………………………………………………... 79Figure 12 Fear conditioning in BERP-deficient mice……………………………….. 83Figure 13 Open field exploration in BERP-deficient mice………………………….. 87Figure 14 Elevated plus maze test in BERP-deficient mice………………………….89Figure 15 General locomotor activity in BERP-deficient mice……………………... 91Figure 16 Accelerating rotarod test in BERP-deficient mice………………………... 94Figure 17 Prepulse inhibition of the acoustic startle response in BERP-deficient mice…………………………………………………... 97Figure 18 Tail suspension test in BERP-deficient mice……………………………...100Figure 19 PTZ seizure susceptibility testing in BERP-deficient mice……………….104Figure 20 Electrophysiological measurements in BERP-deficient mice…………….. 107Figure 21 GABA A receptor expression in BERP-deficient mice…………………...110Figure 22 Neurite outgrowth measurements in BERP-deficient mice………………. 113Figure 23 Analysis of neural stem cells in BERP-deficient and p53-deficient mice... 117Chapter 4Figure 24 Neuroanatomical structures………………………………………………..125
1
1 Introduction
1.1 Opening Remarks
BERP, p53, GABA - three apparent strangers in an incredibly small yet infinitely complex
domain known as the cell. Now trapped together in the same thesis, their confusion is
understandable. However, in the realm of scientific endeavour anything is possible. And
soon, these strange bedfellows will realize they are headed for a collision course and that the
world as they know it will change forever. So read on, for in this study of BERP, we will
venture from the fruit fly to the field mouse and encounter famous names such as 5FU and
PTZ. The remainder of chapter 1 is a review of the background information necessary to
comprehend the scientific foundations upon which this work is based. Chapter 2 is an
examination of the evidence to determine whether BERP will be admitted as a new member
into the esteemed club of p53-regulated genes. In chapter 3, the role of BERP in the
mammalian central nervous system and its possible relationship to the GABAergic signaling
pathway is examined. Chapter 4 involves a discussion that will integrate the new knowledge
gained from chapters 2 and 3 with the foundations presented in chapter 1. And if BERP is
indeed a novel p53-regulated gene, then its functions may point to an entirely new and
previously unreported role for one of the most famous molecules in present-day biomedical
research.

2
1.2 p53 - Molecule of the Year (1993, Science Magazine)
1.2.1 p53 – The protein
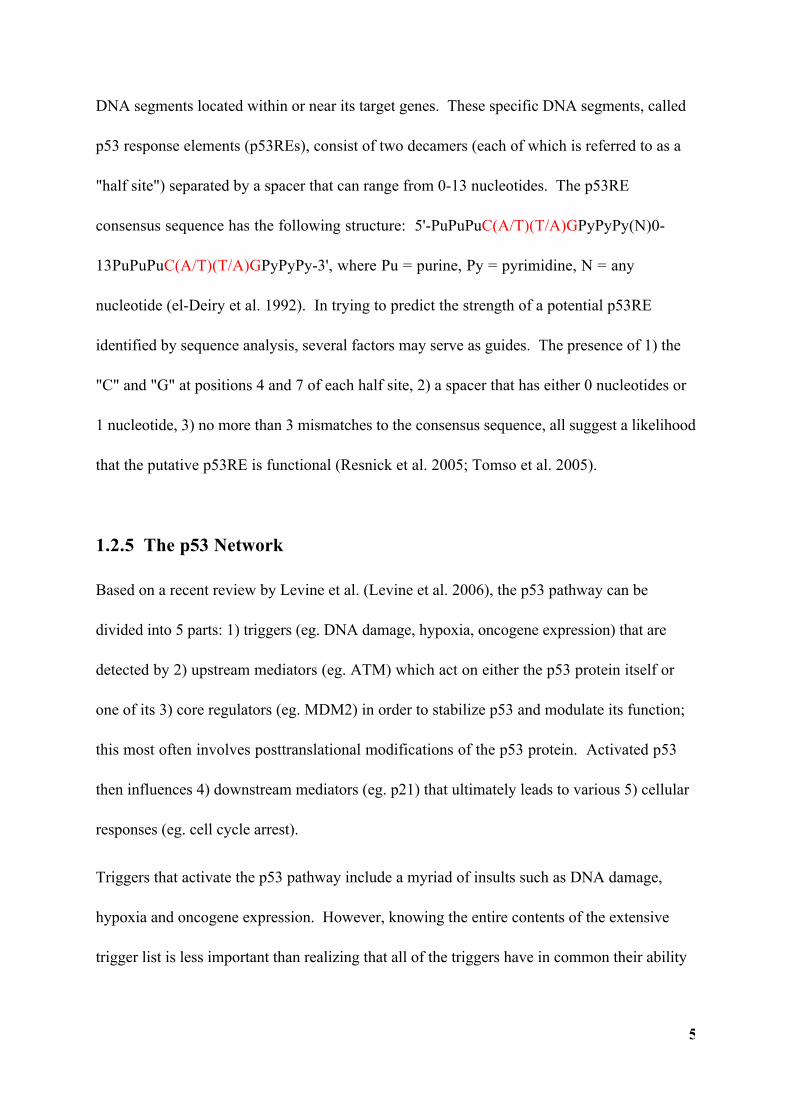
The human p53 gene (TP53) is located on chromosome 17p13.1. It contains 11 exons and
encodes a protein that is 393 amino acids in length and has a number of highly conserved
functional domains (Figure 1A) (Olsson et al. 2007). Located at the N-terminal region is the
transactivation domain, which is required for transcriptional regulation of p53-target genes.
This is followed by a proline-rich domain, which is involved in protein-protein interactions.
The core DNA binding domain is located at the centre of the protein and is required for the
recognition and binding of p53 to specific p53-response elements (p53REs). The significance
of this domain is evident given the fact that the vast majority of mutations in human cancers
are found within this region (Joerger and Fersht 2007). The oligomerization domain is
required for the oligomerization of p53; this is important since p53 performs its in vivo
functions as a tetramer. In addition, a nuclear export signal is located in this domain. Finally,
there is the C-terminal domain that regulates the binding of p53 to damaged DNA and also
houses nuclear localization signals.
After translation, p53 remains in the cytoplasm during the G1 phase of the cell cycle. It
translocates to the nucleus for S phase and then returns to the cytoplasm. In unstressed cells,
the half-life of p53 is very short (ie. 20 minutes) due to the fact that it undergoes rapid
degradation. Mdm2, an E3 ubiquitin ligase, is a major negative regulator of p53. It can control
cellular p53 levels in two ways: i) by binding to and partially obscuring the transactivation
domain of p53, thus impairing p53 transactivation functions, and more importantly, ii) by

3
targeting p53 for degradation via the ubiquitin-proteasome pathway (Momand et al. 1992;
Kubbutat et al. 1997; Daujat et al. 2001). Therefore, disrupting the interaction between
Mdm2 and p53 results in the stabilization and subsequent increase in cellular p53 levels. One
way that this occurs is by alteration of the p53 protein via various posttranslational
modifications (Figure 1A). For example, in response to gamma irradiation-induced DNA
damage, activation of ATM leads to phosphorylation of amino acid residue serine-15 (and
also of serine-20 via ATM activation of checkpoint kinase 2) in the N-terminus of human
p53. These and other modifications to p53 interfere with its binding to Mdm2, thus
increasing its stability and half-life. Another example illustrating the importance of Mdm2 in
maintaining low levels of p53 can be found after oncogene activation, which results in the
upregulation and activation of ARF. ARF has the ability to bind and inhibit the ubiquitin
ligase activity of Mdm2, thus resulting in stabilization of p53 (Levine et al. 2006).
1.2.2 p53 and Cancer
In humans, known aberrations of p53 manifest primarily as increased cancer susceptibility.
TP53 is the single most common target for genetic alteration in human cancers. Somatic
mutations of TP53 are present in half of all human malignancies. Of these mutations, 95%
occur in the DNA binding domain and 75% are single missense mutations (Hollstein et al.
1991; Hainaut et al. 1998; Hollstein et al. 1999; Hainaut and Hollstein 2000). Germline
mutations of TP53 results in the Li-Fraumeni syndrome characterized by a 25-fold increased
risk of developing one or more malignancies by age 50; the spectrum of tumours seen in these
patients are variable and include breast carcinoma, adreno-cortical carcinoma, brain neoplasms,
sarcomas, and leukemia (Evans and Lozano 1997; Kleihues et al. 1997). Many of the

4
remaining tumours that retain wild-type p53, have defects in their ability to activate p53. In
addition to its role in the development and progression of cancer, p53 status also influences
the tumour’s ability to evade treatment. The therapeutic effects of chemotherapy and
radiotherapy are mediated by their ability to cause DNA damage, which then in turn triggers
p53-dependent apoptosis. Therefore, tumours that exhibit loss of p53 functions will be more
resistant to such treatment (Igney and Krammer 2002).
1.2.3 p53-deficient mice
p53-deficient mice have been generated and exhibit high rates of spontaneous tumour
development (Donehower et al. 1992; Harvey et al. 1993; Jacks et al. 1994). Approximately
75% of p53-/- mice developed tumours by 6 months. By 9-10 months of age, all p53-null
mice either developed tumours or had perished. The most common tumour types were
lymphomas (lymphoid tissue origin) and sarcomas (mesenchymal tissue origin); occasional
carcinomas (epithelial tissue origin) also developed. Similar to p53-/- mice, p53+/- mice are
also prone to tumour formation but with increased latency (9-18 months of age) and a slightly
different frequency of tumour type (sarcomas were most common, followed by lymphoma).
Furthermore, p53-/- mouse embryonic fibroblasts exhibit many characteristics of cancer cells
such as anchorage independence, resistance to apoptotic stimuli, accelerated growth, and
abnormal cell cycle profiles (Harvey et al. 1993; Lowe et al. 1994).
1.2.4 p53 - The Transcription Factor
The major function of p53 lies in its ability to regulate the transcription of target genes. In
order to do this, p53 must recognize and bind, via its central DNA binding domain, specific
5
DNA segments located within or near its target genes. These specific DNA segments, called
p53 response elements (p53REs), consist of two decamers (each of which is referred to as a
"half site") separated by a spacer that can range from 0-13 nucleotides. The p53RE
consensus sequence has the following structure: 5'-PuPuPuC(A/T)(T/A)GPyPyPy(N)0-
13PuPuPuC(A/T)(T/A)GPyPyPy-3', where Pu = purine, Py = pyrimidine, N = any
nucleotide (el-Deiry et al. 1992). In trying to predict the strength of a potential p53RE
identified by sequence analysis, several factors may serve as guides. The presence of 1) the
"C" and "G" at positions 4 and 7 of each half site, 2) a spacer that has either 0 nucleotides or
1 nucleotide, 3) no more than 3 mismatches to the consensus sequence, all suggest a likelihood
that the putative p53RE is functional (Resnick et al. 2005; Tomso et al. 2005).
1.2.5 The p53 Network
Based on a recent review by Levine et al. (Levine et al. 2006), the p53 pathway can be
divided into 5 parts: 1) triggers (eg. DNA damage, hypoxia, oncogene expression) that are
detected by 2) upstream mediators (eg. ATM) which act on either the p53 protein itself or
one of its 3) core regulators (eg. MDM2) in order to stabilize p53 and modulate its function;
this most often involves posttranslational modifications of the p53 protein. Activated p53
then influences 4) downstream mediators (eg. p21) that ultimately leads to various 5) cellular
responses (eg. cell cycle arrest).
Triggers that activate the p53 pathway include a myriad of insults such as DNA damage,
hypoxia and oncogene expression. However, knowing the entire contents of the extensive
trigger list is less important than realizing that all of the triggers have in common their ability

6
to cause stress to an otherwise unstressed cell. Therefore, despite the already impressive
bestowed title of "guardian of the genome" (Lane 1992), it seems that p53 can also more
expansively be described as "guardian of genetic and metabolic homeostasis". To date, many
molecules in the p53 network have been identified. For example, MDM2, which functions as
an E3 ubiquitin ligase, is a major negative regulator of p53 levels in the cell (Momand et al.
1992; Kubbutat et al. 1997; Daujat et al. 2001). Other target genes that are transcriptionally
activated by p53 include p21 (cell cycle arrest), GADD45 (DNA repair), and Bax (apoptosis)
(Vogelstein et al. 2000; Vousden and Lu 2002). It has been shown that the promoter of
PTEN, another important tumour suppressor gene, contains a p53 binding element and that
p53 can activate transcription of PTEN (Stambolic et al. 2001). Cellular responses to p53
activation involve cell cycle arrest, apoptosis, senescence, DNA repair, angiogenesis, exosome
mediated secretion, and the IGF-1/mTOR pathway. However, despite these and other
advances, our understanding of the role of the p53 network in human disease development
and progression is far from complete. In fact, this multifunctional protein's involvement in
such a wide variety of cellular processes underscores the importance of understanding the true
nature and scope of its functions (Figure 1B).

7
Figure 1. Structure and Functions of p53. (A) Schematic representation of the p53
protein. TAD, transactivation domain. PRD, proline-rich domain. DBD, DNA-binding
domain. OD, oligomerization domain. CTD, C-terminal domain. Relative frequencies and
positions of mutational hotspots are indicated above the protein. Domains affected by
various posttranslational modifications are idicated below the protein. Based on Olsson et al.,
2007; Joerger and Fersht, 2007. (B) Examples of triggers (orange), upstream mediators
(yellow), core regulators and downstream mediators (gray), and cellular responses (green) of
the p53 network. Please refer to text for details. Based on Levine et al., 2006.
8

9
1.2.6 In search of novel p53 targets: In vivo genetic screen usingDrosophila melanogaster
Studies of homologous molecules in the p53 pathways have shown that apoptotic pathways
are well conserved from D. melanogaster to mammals. Drosophila p53 (dp53), the D.
melanogaster homolog of human p53 (hp53), has recently been cloned and characterized (Jin
et al. 2000; Ollmann et al. 2000). There is significant structural homology between the two
molecules in the important DNA binding domain, dp53 can bind hp53 consensus binding
sites, and overexpression of dp53 can induce apoptosis. In addition, ectopic expression of
hp53 in the D. melanogaster eye has previously been shown to inhibit entry into S-phase and
to induce apoptosis (Yamaguchi et al. 1999). These data indicate that p53 pathways are
conserved from flies to mammals and that D. melanogaster provides a simple and powerful
system in which to further study the molecules involved in the p53 network.
Therefore, in order to identify novel molecules within the p53 signaling pathway, we have
utilized an in vivo genetic screen using a binary vector system in D. melanogaster (Brand and
Perrimon 1993). The screen takes advantage of the fact that overexpression of dp53 in the D.
melanogaster eye imaginal disc results in a small rough eye phenotype. The first part of this
binary system involved the creation of a vector that contains the Gal4-dependent upstream
activating sequence (UAS) promoter driving the expression of a dp53 cDNA. This UAS-dp53
vector was then used to make a transgenic fly in which every cell has the potential to express
dp53, if a source of Gal4 is present. For the second part of the binary vector system, the eye-
specific glass multimer reporter (GMR) promoter was used to drive the expression of Gal4
only in the fly eye. Mating GMR-Gal4 transgenic flies with UAS-dp53 transgenic flies
resulted in progeny that express dp53 specifically in the fly eye. In effect then, these flies

10
contain a dp53 transgene driven by the GMR promoter. GMR-Gal4-dp53 flies have smaller,
rougher eyes when compared with wild-type flies. This eye phenotype is mainly due to
increased apoptosis (Ollmann et al. 2000). To identify genetic modifiers of the dp53
pathway, both the GMR-Gal4-dp53 and GMR-Gal4-hp53 flies (which also yields a small
rough eye phenotype) were crossed with mutant fly strains each containing one of 1150
distinct P-element insertions which disrupts one copy of a vital D. melanogaster gene. The
progeny of these crossings were collected and analyzed according to phenotypic changes in
eye size. Progeny flies with a larger eye phenotype than those of GMR-Gal4-dp53 flies were
scored as phenotypic suppressors of dp53. Progeny flies with smaller eyes than those of the
GMR-Gal4-dp53 flies were scored as phenotypic enhancers of dp53. Progeny flies exhibiting
no phenotypic change were scored as non-interacters. There are several advantages in
conducting in vivo genetic screens using D. melanogaster. Firstly, a functional screen allows
for the identification of genes important for the observed phenotype irrespective of their
location within any given signaling pathway. For example, a physical interaction is not
necessarily required. Secondly, the relatively short generation time of D. melanogaster
permits the analysis of a large number of mutants. Lastly, genomic information on D.
melanogaster is readily available through public databases and hence allows for timely
identification of P-element inactivated genes.

11
1.3 Brain Expressed RING finger Protein (BERP)
1.3.1 D. melanogaster Brain Tumour (brat) suppresses the eye phenotypeof dp53
Based on results of the D. melanogaster genetic screen, brain tumour (brat) was identified as a
suppressor of the p53 eye phenotype. Brat is a D. melanogaster tumour suppressor gene
first identified in 1976 during a screen for lethal mutations (Wright et al. 1976; Wright et al.
1981). The brat gene, first cloned by Arama et al., encodes a 1037 amino acid protein
consisting of two B-box domains, a coiled-coil domain, and a C-terminal beta-propeller
domain composed of NHL repeats; these domains have all been implicated in protein-protein
interactions. In the larval brain, brat is a negative regulator of cell growth. Recessive loss of
function mutations of brat result in greatly enlarged brain hemispheres (due to neoplastic
proliferation of optic neuroblasts) and lethality during the third instar larval and pupal stages
(Arama et al. 2000). More recently, it has been shown that brat inhibits self-renewal of larval
neuroblasts (Betschinger et al. 2006). In the early embryo, brat appears to be a translational
repressor of hunchback mRNA via its interactions with nanos and pumilio (Sonoda and
Wharton 2001). In addition, brat has been shown to be a negative regulator of cell growth and
ribosomal synthesis (Frank et al. 2002).
1.3.2 Mammalian homologs of D. melanogaster brat
Mammalian brat homologs contain a N-terminal RING finger, a B-box, a coiled coil, and a C-
terminal domain composed of NHL repeats (Figure 2); the relative order of the domains
remains the same as that for brat (Arama et al. 2000). Three mammalian molecules fit this

12
pattern: BERP/TRIM3, NARF/TRIM2, HT2A/TRIM32. They all belong to the TRIM
(TRIpartite Motif) family of proteins which consists of 37 members and are defined by the
presence of an N-terminal RING finger, followed by one or two B-boxes, and a coiled-coil
domain; the C-terminus is variable (Reymond et al. 2001). TRIM proteins have diverse
functions ranging from development and cell growth to oncogenesis. Reymond et al. (2001)
showed that 1) through their coiled coil regions, TRIM proteins are able to form homo and
hetero-oligomers, and 2) the RING finger and B-box(es) are important for proper subcellular
localization of the TRIM proteins. The three putative mammalian homologs of brat are
TRIM proteins that have a C-terminal beta-propeller domain composed of NHL repeats.

13
Figure 2. Mammalian homologs of brat. Schematic representation of the brat protein and
its mammalian homologs: BERP/TRIM3, NARF/TRIM2, HT2A/TRIM32. Hs, Homo
sapiens. Dm, Drosophila melanogaster. Red, RING finger domain. Dark blue, B-box 1
domain. Light blue, B-box 2 domain. Green, coiled-coil domain. Yellow, NHL repeats
domain. Based on Arama et al., 2000 and Reymond et at., 2001.

14

15
1.3.2.1 BERP/TRIM3
BERP (Brain Expressed Ring finger Protein), was first cloned and characterized in the rat by
El-Husseini et al. (El-Husseini and Vincent 1999; El-Husseini et al. 2000). It is most strongly
expressed in the brain, especially in the cerebellum. Other sites of expression include heart,
breast, lung, pancreas, kidney, and liver. Its expression in the murine brain is upregulated
following chemically induced seizures (Ohkawa et al. 2001). The BERP protein is 744 amino
acids in length and consists of an N-teminal RBCC domain (RING finger, b-box, coiled-coil), a
central ABP-like domain, and a C-terminal beta-propeller domain. In response to nerve
growth factor, PC12 cells overexpressing a BERP truncation mutant lacking the NHL beta-
propeller domain fail to stop proliferation and do not exhibit neurite outgrowth (El-Husseini
and Vincent 1999). Yeast-two-hybrid and immunoprecipitation experiments indicate that
BERP interacts with two proteins of the actin cytoskeleton, alpha-actinin-4 and myosin V,
via its N-terminal and C-terminal domains respectively (El-Husseini and Vincent 1999; El-
Husseini et al. 2000). Alpha-actinin-4, an isoform of the actin binding protein alpha-actinin,
has been implicated in cell motility and cancer (Honda et al. 1998; Nikolopoulos et al. 2000).
Class V myosins are implicated in organelle trafficking and cell motility (Provance and Mercer
1999; Yan et al. 2005; Wang et al. 2008). BERP has been identified as a member of the
cytoskeleton-associated recycling or transport (CART) complex along with the endosome
associated protein hrs, alpha-actinin-4, and myosin V. In this complex, which localizes to the
early endosome, the proteins are bound to each other in a linear fashion: hrs binds to alpha-
actinin-4, which binds to BERP, which binds to myosin V. The authors show that the CART
complex is involved in the constitutive recycling of the transferrin receptor and that this
process utilizes the actin cytoskeleton (Yan et al. 2005). Large-scale phosphoproteome

16
characterizations have identified BERP as a possible phosphorylated protein in epidermal
growth factor (EGF)-stimulated HeLa cells (Olsen et al. 2006) and in preparations isolated
from murine postsynaptic densities (Trinidad et al. 2006).
BERP is well conserved in rat, mouse and human. Rat BERP shares 99% identity with
murine BERP and 98% with human BERP (Arama et al. 2000; El-Husseini et al. 2001). As of
this time, no studies involving murine BERP have been published. In humans, BERP, also
known as RNF22 (El-Husseini et al. 2001) or TRIM3 (Reymond et al. 2001), maps to
chromosome 11p15.5, a region that has been named “multiple tumour-associated region-1”
because deletions of this region can be found in many human malignancies including those of
the brain, breast, bladder, pancreas, testes, liver, and striated muscle (El-Husseini et al., 2001).
Interestingly, the Beckwith-Wiedemann syndrome (BWS) also maps to 11p15.5. BWS is a
congenital overgrowth syndrome with an incidence of approximately 1:15000. Clinical
manifestations are variable and include pre and post-natal somatic overgrowth, organomegaly,
hemihypertrophy, abdominal wall defects, and a predisposition to childhood malignancies
(Steenman et al. 2000). In a recent shotgun proteomics analysis, BERP was one of the
proteins shown to be up-regulated in the dorsolateral prefrontal cortex of schizophrenic
patients (Martins-de-Souza et al. 2009). In addition, Boulay et al. recently identified BERP
(as TRIM3) as the candidate tumour suppressor gene at the 11p15.5 locus after examining 70
human gliomas for loss of heterozygosity (Boulay et al. 2009).
1.3.2.2 NARF/TRIM2
NARF (Neural Activity-related RING Finger protein; also known as TRIM2), a second
mouse homolog of rat BERP has been cloned and characterized (Ohkawa et al. 2001).

17
Ohkawa et al. chemically induced seizures in mice and then used a PCR-based cDNA
subtraction method in order to identify genes whose expressions were upregulated in the
hippocampus. NARF and BERP are closely related (67% identity) and contain the same
protein domains. NARF is reported to be predominantly expressed in the brain, especially
the hippocampus. Similar to BERP, NARF also binds to myosin V via its beta-propeller
domain. Balastik et al. recently reported that NARF (as TRIM2) is an ubiquitin ligase and
that TRIM2-deficient mice develop tremor and ataxia beginning at 4 months with subsequent
spontaneous seizures and that this is due to neurodegeneration secondary to axonal
accumulation of neurofilament light chain (Balastik et al. 2008).
1.3.2.3 HT2A/TRIM32
HT2A/TRIM32 was first identified as a novel human protein that interacts with the Tat
proteins of HIV-1 and HIV-2 (Fridell et al. 1995). It is an E3 ubiquitin ligase (Horn et al.
2004) that can ubiquitinate actin (Kudryashova et al. 2005) and is highly expressed in skeletal
muscle. Mutations of TRIM32 have been identified several human conditions: limb-girdle
muscular dystrophy type 2H (Frosk et al. 2002), sarcotubular myopathy (Schoser et al.
2005) and Bardet-Biedl syndrome (Chiang et al. 2006). It is also highly expressed in
squamous cell carcinomas and has proposed oncogenic functions via its ability to mediate the
ubiquitination and degradation of the tumour suppressor Abl-interacter 2 (Kano et al. 2008).
The phenotype of TRIM32-deficient mouse confirms its utility as a model for limb-girdle
muscular dystrophy type 2H and sarcotubular myopathy (Kudryashova et al. 2009).
Recently, it has been shown that TRIM32 is a positive regulator of microRNAs and that it is
a negative regulator of murine neural stem cell renewal (Schwamborn et al. 2009).

18
1.4 Overview of Neuronal Function in the Mammalian CNS
1.4.1 Anatomy of the Neuron
Neurons account for approximately 10% of the cells present in the mammalian CNS. The
main function of neurons is to transmit information. The neuron is composed of a cell body
from which radiates a number of neurites (Figure 3). The cell body contains the nucleus along
with other organelles typically found in non-neuronal cells such as mitochondria, endoplasmic
reticulum, and Golgi apparatus. Neurites, specialized structures that carry information in the
form of electrical impulses towards and away from the neuronal cell body, are divided into
dendrites and axons. The axon begins at the axon hillock next to the cell body and ends some
distance away at the axon terminal. The axon transmits nerve impulses in a unidirectional
fashion from the hillock towards the axon terminal. The nerve impulse is then transmitted
from the axon terminal of the originating neuron to a dendrite or cell body of the target neuron
via a specialized inter-neuronal communication structure called the synapse. (Bear et al. 2001;
Purves et al. 2004)

19
Figure 3. Anatomy of the neuron. Please refer to text for details. Adapted from www.web-
books.com/Free/Images/Synapse.jpg.

20

21
1.4.2 Neuronal membrane potentials
1.4.2.1 Resting potential
The resting membrane potential in mammalian neurons is always negative and depending on
the species, usually ranges from about -40mV to -90mV; in humans, it is -70mV. The resting
potential is maintained by membrane pumps, such as the Na+K+ATPase pump, which cause
an imbalance of ions across the plasma membrane. This imbalance results in a potential
difference (voltage) between the inner and outer surfaces of the cell membrane. (Bear et al.
2001; Purves et al. 2004)
1.4.2.2 Action potential
The action potential is a brief reversal of the membrane potential that results in the
propagation of a nerve impulse along the axon of a neuron. The two phases of an action
potential are depolarization and repolarization. Depolarization occurs when there is enough
of a change in the membrane potential such that it reaches the threshold value of 15-20mV
depolarized from membrane potential. If threshold is reached, then voltage-gated Na+
channels in that area of the membrane open, allowing Na+ to flood into the cell.
Depolarization ends when the Na+ channels close. During repolarization, K+ channels open
so that K+ can leave the cell; the membrane potential returns to -70mV. The resting
concentrations of Na+ and K+ ions are then restored by membrane pumps. (Bear et al. 2001;
Purves et al. 2004)

22
1.4.3 Overview of the synapse
The synapse is a specialized communication junction that allows neurons to pass information
to other cells. There are several different types of synapses including electrical synapses in
which cells are physically connected via gap junctions, chemical synapses in which electrical
impulses from one cell is transferred to another cell via chemicals messengers across a small
space separating the cells, and neuromuscular junctions which are chemical synapses found in
the PNS between motor neurons and muscle cells. For the purposes of this thesis, only the
classical chemical synapse occurring between two neurons within the CNS will be considered.
There are three basic components to the classical chemical synapse: the presynaptic element,
the synaptic cleft, and the postsynaptic density. The presynaptic axon terminal contains
mitochondria and vesicles, which contain neurotransmitters. In response to upstream
electrical signals, synaptic vesicles fuse with the pre-synaptic membrane and release
neurotransmitter molecules into the synaptic cleft. The neurotransmitter molecules then
diffuse across the synaptic cleft where they bind to and activate neurotransmitter receptors
located on the post-synaptic membrane. (Bear et al. 2001; Purves et al. 2004)
1.4.4 Overview of general neuroreceptor functions
There are two basic types of neuroreceptors: ionotropic neurotransmitter-gated ion channels
and metabotropic G-protein-coupled receptors (GPCRs). Neurotransmitter-gated ion
channels are composed of multiple polypeptide units that come together to form a
transmembrane pore. When the receptor is bound by its neurotransmitter, it undergoes a
conformational change that allows the passage of ions through its central pore. The functional
effects of activating neurotransmitter-gated ion channels are dependent on which ions are

23
involved. Generally, if a Na+ channel is involved, then the net effect will be excitatory due to
a local depolarization of the postsynaptic membrane. In other words, activation of a
neurotransmitter-gated Na+ channel results in the generation of an excitatory postsynaptic
potential (EPSP). If a Cl- channel is involved, then the net effect will be inhibitory, due to a
local hyperpolarization of the postsynaptic membrane. Similar to the above example,
activation of a neurotransmitter-gated Cl- channel results in the generation of an inhibitory
postsynaptic potential (IPSP). If the sum of all the EPSPs and IPSPs results in a net
excitatory effect, then an action potential is generated; if the net effect is inhibitory, then no
action potential is generated. While ion channels mediate fast synaptic transmission, GPCRs
mediate slower synaptic transmission with more diverse and longer lasting postsynaptic
effects. Upon binding of neurotransmitter molecules, the receptor activates G-proteins
within the membranes, which in turn activates effector proteins such as G-protein-gated ion
channels and second messengers. (Bear et al. 2001; Purves et al. 2004)
1.4.5 Overview of Neurotransmitter Systems
Neurotransmitters can be classified based on biochemical composition into three categories:
(1) amino acids, (2) amines, and (3) peptides. Amino acid and amine neurotransmitters are
small molecules that are released from synaptic vesicles; peptide neurotransmitters are larger
molecules that are released from secretory granules. Amino acid neurotransmitters include
gamma-amino butyric acid (GABA), glutamate, and glycine. Amine neurotransmitters include
acetylcholine, dopamine, epinephrine, histamine, norepinephrine, and serotonin. Peptide
neurotransmitters include cholecystokinin, dynorphin, enkephalins, N-
acetylaspartylglutamate, neuropeptide Y, somatostatin, substance P, thyrotropin-releasing

24
hormone, vasoactive intestinal polypeptide. Within the CNS, amino acid neurotransmitters
mediate the majority of fast synaptic transmissions. Generally speaking, glutamate and
GABA are considered to be the major excitatory and inhibitory neurotransmitters in the
mature mammalian CNS, respectively. (Bear et al. 2001; Purves et al. 2004)
1.5 GABAA Receptor signaling within the Mammalian CNS
1.5.1 GABA - The Neurotransmitter
GABA, present in approximately 15-20% of neurons, is the primary inhibitory
neurotransmitter in the mature mammalian CNS. It is synthesized in presynaptic neurons
from glutamate using the enzyme glutamic acid decarboxylase (GAD). There are two
different isoforms of GAD: GAD65 and GAD67 (Erlander et al. 1991). The gene for GAD65
is located on human chromosome 2 and encodes a 65 kDa isoform of the protein, most of
which is in the inactive apo-GAD65 form. Therefore, although GAD65 comprises the
majority of GAD present in the brain, it synthesizes only about 30% of the brain's GABA.
In GAD65-deficient mice, levels of apo-GAD65 were lower compared to wildtype controls;
however, levels of active holo-GAD65 and GABA were unchanged in the CNS. In addition,
they had increased susceptibility for developing spontaneous seizures (Asada et al. 1996).
The gene for GAD67 is located on human chromosome 10 and encodes a 67kDa isoform of
GAD. Unlike GAD65, most of the GAD67 in the brain is in the active holo-GAD67 form
and synthesizes approximately 70% of the brain's GABA. GAD67-deficient mice have
severe cleft palate and die shortly after birth (Asada et al. 1997). Mice deficient for both
GAD65 and GAD67 contain 0.02% of normal GABA levels. They have a similar phenotype
25
to the GAD67 knockout mice in that they die shortly after birth from severe cleft palate and
show no gross or microscopic abnormalities in brain development (Ji et al. 1999).
Once synthesized, GABA is loaded into synaptic vesicles by the vesicular neurotransmitter
transporter VGAT (Cherubini and Conti 2001). Release of GABA from synaptic vesicles
into the synaptic cleft is mediated by calcium-dependent exocytosis. Re-uptake of GABA
into the axon terminal and surrounding glial cells occurs via GABA transporters (GATs)
(Schousboe et al. 2004). GABA transaminase metabolizes GABA into succinic
semialdehyde, which is then metabolized into succinic acid by succinic semialdehyde
dehydrogenase or into gamma-hydroxybutyric acid by succinic semialdehyde reductase
(Wong et al. 2003).
1.5.2 GABA Receptor Family
There are 3 classes of GABA receptors: the ionotropic GABA A and GABA C receptors
(GABAARs and GABACRs, respectively), which are ligand-gated chloride channels, and the
metabotropic G-protein-coupled GABA B receptors (GABABRs). Although the focus will
be on GABAARs, the other two classes will also be reviewed briefly.
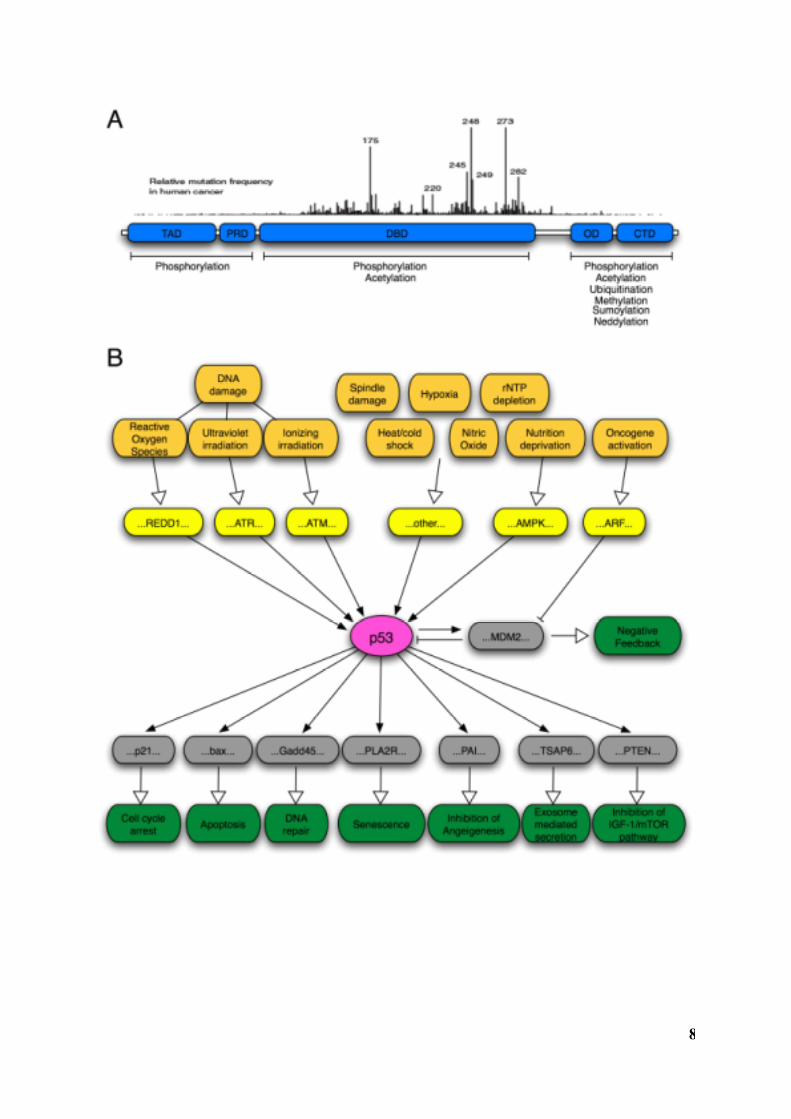
1.5.3 GABA A Receptors
GABA A receptors are heteropentameric ligand-gated chloride channels that mediate the
majority of fast synaptic inhibitory signals within the mature mammalian CNS. Structurally,
each receptor is composed of five polypeptide subunits drawn from a pool of 16 different
subunits (alpha 1-6, beta 1-3, gamma 1-3, delta, epsilon, theta, pi) that are encoded by seven

26
different gene families (Olsen and Sieghart 2008). The presence of certain polypeptide
subunits tends to confer particular functional characteristics to the assembled receptor. For
example, the presence of the gamma2 subunit is required for benzodiazpine sensitivity and
synaptic clustering (Pritchett et al. 1989; Essrich et al. 1998). Although there are
approximately 20 native GABA A receptors in the human CNS, the majority of them are
composed of 2 alpha subunits, 2 beta subunits and 1 gamma subunit (Figure 4) (Chang et al.
1996; Sieghart and Sperk 2002). Receptors containing the gamma2 subunit are the most
prevalent (Vicini and Ortinski 2004; Whiting 2006); specifically, the alpha1/beta2/gamma2
combination represents approximately 43% of GABAARs within the CNS (McKernan and
Whiting 1996). Each polypeptide subunit is composed of approximately 500 amino acids
and contains an N-terminal domain, a cys-loop domain, and a C-terminal domain (Schofield et
al. 1987; Macdonald and Olsen 1994). The N-terminal domain, composed of approximately
200 amino acids, is extracellular and sometimes forms the agonist binding sites for the
receptor. This is followed by a 15 amino acid, disulphide-linked, extracellular cysteine-loop.
The C-terminal domain contains 4 alpha-helical, hydrophobic, membrane-spanning segments
(M1, M2, M3, M4) with a large intracellular loop located between M3 and M4; this is
followed by a short, extracellular C-terminus. The M3/M4 intracellular loop, an important
site for phosphorylation and synaptic localization, is the most divergent region among the
various receptor subtypes.

27
Figure 4. The GABA A Receptor. Shown is a schematic representation of a receptor
composed of two alpha subunits, two beta subunits, and 1 gamma subunit. Select GABAAR
modulators and their binding sites are also depicted. Please refer to text for details. Adapted
from Purves et al., 2004.

28

29
Pharmacologically, compounds that enhance GABAAR function include muscimol,
benzodiazapines, barbiturates, neuroactive steroids, alcohol, and general anesthetics.
Compounds that inhibit GABAAR function include bicuculline, picrotoxin, and
pentylenetetrazol (Macdonald and Olsen 1994; Huang et al. 2001).
Gene-deficient mice have been generated for the following GABAAR subunits: alpha1-6,
beta2, beta3, gamma2, and delta. The most severe phenotypes are seen in mice lacking the
gamma2 or beta3 subunits. Gamma2 subunit knockout mice show perinatal lethality, have
decreased channel conductance of GABAARs, and show defects in postsynaptic clustering of
GABAARs (Gunther et al. 1995). Gamma2 subunit heterozygotes are viable and fertile but
show decreased synaptic clustering of GABAARs especially in the hippocampus.
Behaviourally, they show increased chronic anxiety with aversion towards stressful situations
and enhanced responses to fear conditioning (Crestani et al. 1999). In beta3 subunit knockout
mice, 57% develop cleft palate while 90% (including mice without cleft palate) die shortly
after birth (Homanics et al. 1997). In addition, they exhibit hyperactivity, spontaneous
seizures, abnormalities on electroencephalograms, impaired learning and memory, impaired
motor coordination, and repetitive stereotypical movements; these findings are similar to
Angelman syndrome in humans (DeLorey et al. 1998). Alpha1 subunit knockout mice have
decreased body weight, exhibit tremors when handled, have increased susceptibility to
bicuculine-induced seizures and show a >50% loss of GABAAR receptors; however, no
motor deficits or spontaneous seizures were apparent (Sur et al. 2001; Vicini et al. 2001).
Most of the remaining mutants display no overt phenotype but rather exhibit more subtle
behavioural or biochemical abnormalities. For example, alpha5 subunit knockout mice exhibit
enhanced hippocampus-dependent spatial learning (Collinson et al. 2002); alpha3 subunit

30
knockout mice exhibit decreased prepulse inhibition of the acoustic startle reflex, which is an
abnormality of sensorimotor gating often found in patients with schizophrenia (Yee et al.
2005).
Some of the GABAAR polypeptide subunits are encoded by gene clusters on human
chomosomes 4p12 (alpha2, alpha4, beta1, gamma1), 5q34 (alpha1, alpha6, beta2, gamma2),
15q13.2 (alpha5, beta3, gamma3) and Xq28 (alpha3, epsilon, theta); however, the genes
encoding the delta and pi subunits do not belong in a cluster and can be found on
chromosomes 1p36.3 and 5q35.1, respectively (Olsen and Sieghart 2008).
1.5.3.1 The GABAA Receptor in Human Disease
GABAAR dysfunction has been implicated in a number of human diseases including
epilepsy, anxiety disorders, schizophrenia, drug abuse, autism, and Angelman syndrome.
1.5.3.1.1 EpilepsySeizures result from uncontrolled electrophysiological discharge of neurons within the CNS
due to an increase in excitatory (glutaminergic) signals or a decrease in inhibitory
(GABAergic) signals. These imbalances of excitatory and inhibitory neurotransmission have
been correlated with altered expression of GABAAR subunits (Brooks-Kayal et al. 1998)
and/or altered GABAAR trafficking (Coulter 2001). For example, induction of status
epilepticus in animal models lead to increased GABAAR endocytosis (Wagstaff et al. 1991).
Gene-deletion mutants involving GABAAR subunits exhibit altered seizure thresholds (such
as the increased sensitivity to the GABAAR antagonist bicuclline seen in the alpha1-subunit
knockout mouse) and outright seizures (such is seen in the beta3-subunit knockout mouse).
Mutations have been identified in families with seizure syndromes (Jones-Davis and

31
Macdonald 2003) that all involve the gamma2 subunit of the GABAAR (R43Q, K289M,
Q351X). A mutation in the alpha1 subunit (A322D) has been found in patients with juvenile
myoclonic epilepsy (Jones-Davis and Macdonald 2003). In addition, the genomic locus of
the beta3 subunit has been implicated in Angelman Syndrome, which is characterized, by
mental retardation and epilepsy (Wagstaff et al. 1991).
1.5.3.1.2 SchizophreniaThree lines of evidence implicate the involvement of GABAARs in schizophrenia: 1)
Changes in expression of GABAAR subunits are present in post mortem brain tissue from
schizophrenic patients (Akbarian et al. 1995), 2) Drugs, such as benzodiazpines, that affect
GABAAR function improve symptoms of schizophrenia (Hosak and Libiger 2002), and 3)
The alpha3 subunit knockout mouse shows decreased prepulse inhibition, an abnormality in
sensorimotor gating that can be found in schizophrenic patients, which can be reversed by
treatment with the antipsychotic medication haloperidol (Yee et al. 2005).
1.5.3.1.3 Anxiety DisordersAnxiety disorders include generalized chronic anxiety, panic disorder and posttraumatic stress
disorder. GABAARs are implicated since the mainstay of treatment for these conditions are
benzodiazepines, which enhance GABAAR function. The gamma2 subunit heterozygous
mouse, which exhibits behavourial traits consistent with chronic anxiety, has decreased
binding of benzodiazepines in several regions of the brain (Crestani et al. 1999). This is
similar to patients with panic attacks that exhibit decreased GABAAR-benzodiazepine
binding in the brain (Tiihonen et al. 1997). In addition, while benzodiazepines (enhancers of
GABAAR function) inhibit anxiety, low doses of PTZ (antagonist of GABAAR function)
causes anxiety in human patients (Kalueff and Nutt 1996).

32
1.5.3.2 The GABA A Receptor Lifecycle
GABAARs are constantly in a dynamic state of flux. Therefore molecules and pathways that
regulate GABAAR trafficking have significant influence on the inhibition of synaptic activity
within the CNS. The GABAAR lifecycle can be divided into several stages: 1) assembly of
receptors from component subunits, 2) trafficking of receptors to the cell surface, 3)
clustering of receptors on the postsynaptic membrane, 4) endocytosis, 5) post-endocytic
sorting resulting in either receptor recycling or lysosomal degradation.
1.5.3.2.1 Assembly of GABAARsAssembly, via oligomerization, of GABAARs from component subunits occurs in the
endoplasmic reticulum (ER). This process is characterized by its dependence on N-terminal
sequences of the polypeptide subunits, its speed of occurence (within 30 minutes of
translation), and its inefficiency (less than 25% of translated polypeptide subunits are
assembled into receptors) (Gorrie et al. 1997). Receptors that are improperly assembled
undergo endoplasmic reticulum-associated degradation (ERAD) in which subunits are
ubiquitylated and then degraded via the ubiquitin-proteosome system. In addition,
GABAARs are subject to activity-dependent ubiquitylation in which the level of neuronal
activity can affect the ubiquitylation of the receptors and thus regulate cell surface levels
(Saliba et al. 2007). A decrease in neuronal activity leads to an increase in ERAD that
ultimately results in decreased insertion of GABAARs into the surface membrane. Likewise,
increased neuronal activity results in decreased ERAD of GABAAR and increased expression
of receptors at the cell surface. In this way, the level of neuronal activity can affect the cell
surface expression of GABAARs and thus regulate synaptic inhibition. PLIC1 (protein
linking IAP to the cytoskeleton), a ubiquitin-like protein that prevents the degradation of

33
ubiquitylated substrates, binds to the intracellular domains of alpha and beta subunits which
blocks ERAD and results in increased numbers of receptors expressed on the surface of the
cell (Bedford et al. 2001).
1.5.3.2.2 Trafficking of the GABAAR to the cell surfaceAssembled receptors that successfully exit the ER proceed to the Golgi apparatus where they
are packaged into vesicles and transported to the cell surface for insertion into the plasma
membrane. Several molecules are thought to be involved in this process.
GABAAR-associated protein (GABARAP) localizes to the Golgi apparatus and binds to
intracellular domain of the GABAAR gamma2 subunit (Wang et al. 1999). Overexpression of
GABARAP along with GABAARs result in increased surface expression of receptors (Chen
et al. 2000). These data, along with the fact that it is not present at synaptic sites, suggests
that GABARAP may be involved in trafficking of the GABAAR to the cell surface (Leil et al.
2004). Although GABARAP-deficient mice show no change in levels of gamma2-containing
GABAARs; this may indicate redundancy or other compensatory mechanisms (O'Sullivan et
al. 2005).
Phospholipase-C-related catalytically inactive proteins (PRIPs) have been show to bind
beta1-3 subunits, the gamma2 subunit, and GABARAP (Kanematsu et al. 2002). PRIP2 is
expressed ubiquitously while PRIP1 is expressed mainly in the brain (Uji et al. 2002).
Possible functions for PRIPs in the GABAAR lifecycle include trafficking of receptors to the
cells surface, modulation of receptor phosphorylation, and internalization of receptors.
PRIPs may be involved in trafficking by acting as a bridge between GABAARs and
GABARAP; this is supported by the decreased association between GABAARs and
34
GABARAP in PRIP1/PRIP2 double knockout mice (Kanematsu et al. 2002). PRIPs may
also be involved in the phosphorylation-dependent modulation of GABAARs through the
inactivation of protein phosphatase 1 alpha (PP1alpha) (Yoshimura et al. 2001). While PKC
and PKA can phosphorylate the beta subunits of GABAARs and modulate its functions
(Kittler and Moss 2003), PP1alpha can terminate this effect by dephosphorylating the
receptor (Terunuma et al. 2004); therefore, the inactivation of PP1alpha by PRIP1 can lead to
enhanced phosphorylation of GABAARs.
Golgi-specific DHHC zinc-finger-domain protein (GODZ) has been identified as the principal
enzyme responsible for the palmitylation of GABAARs, a process that is required for
postsynaptic clustering (Keller et al. 2004; Fang et al. 2006). Brefeldin-A-inhibited
GDP/GTP exchange factor 2 (BIG2) binds beta subunits and transports GABAARs to the
cell surface (Charych et al. 2004). GABAAR-interacting factor 1 (GRIF1) binds the beta2
subunit of GABAARs as well as to the motor protein kinesin; it is thought to be involved
regulating motor-dependent transport of GABAARs (Beck et al. 2002; Smith et al. 2006).
1.5.3.2.3 Synpatic Clustering of GABAARsReceptors that are successfully assembled and trafficked to the cell surface are typically
inserted into the cell membrane at extrasynaptic sites (Bogdanov et al. 2006). Then,
depending on their subunit composition, they reach their postsynaptic locations through
lateral diffusion and trapping (Thomas et al. 2005). For example, gamma2 subunit-containing
GABAARs tend to be present in synaptic clusters while receptors containing alpha5 and
delta subunits are primarily extrasynaptic. Currently, two mechanisms for clustering are
thought to be possible: gephyrin-dependent clustering and gephyrin-independent clustering.
As the name implies, gephyrin-dependent clustering of GABAARs involves the protein

35
gephyrin, which localizes to synaptic sites on GABAergic neurons and binds the alpha2
subunit of GABAARs (Tretter et al. 2008). Loss of gephryin results in loss of synaptic
clusters that contain GABAARs with alpha2 and/or gamma2 subunits (Kneussel et al. 1999;
Jacob et al. 2005). Neuronal cultures derived from the GABAAR gamma2 subunit knockout
mouse shows a lack of postsynaptic GABAARs and gephrin (Essrich et al. 1998). However,
due to the fact that synaptic GABAAR clusters are still present in gephyrin knockout mice, a
gephyrin-independent mechanism of GABAAR synaptic clustering has been proposed
(Kneussel et al. 2001; Levi et al. 2004). Radixin, an ERM (ezrin, radixin, moesin) family
protein, has been implicated in this process. Radixin localizes to the plasma membrane, and
binds the alpha5 subunit of GABAARs as well as F-actin. Loss of radixin results in
decreased synaptic clustering of alpha5-containing GABAARs while maintaniing overall cell
surface receptor levels (Loebrich et al. 2006).
1.5.3.2.4 Endocytosis of GABAARsNeuronal GABAARs at the cell surface undergo constitutive internalization via clathrin-
dependent endocytosis. When this process is blocked, an increase in mini inhibitory
postsynaptic current (mIPSC) amplitude is seen; this is consistent with increased numbers of
cell surface receptors due to decreased internalization. Adapter protein 2 (AP2) of the
clathrin-AP2 complex recruits GABAARs into clathrin-coated pits via its ability to bind
beta1-3 and gamma2 subunits (Kittler et al. 2000). Phosphorylation at AP2-binding sites of
GABAAR subunits decreases AP2 binding which leads to decreased receptor endocytosis
and increased mIPSC amplitudes (Kittler et al. 2005; Kittler et al. 2008). This suggests a
mechanism by which pathways that regulate protein kinases and phosphatases may be able
to influence synaptic inhibition.

36
1.5.3.2.5 Post-endocytic recycling and degradation of GABAARsOnce GABAARs are internalized via endocytosis they can either be recycled to the cell
surface or undergo lysosomal degradation. Currently, little is known about the molecules or
mechanisms that influence this process. However, overexpression of Huntingtin-associated
protein (HAP1), a protein shown to bind GABAAR beta subunits, results in decreased
degradation and increased recycling of GABAARs, increased surface expression of
GABAARs, and increased mIPSC amplitude (Kittler et al. 2004).
1.5.4 GABAB Receptors
In contrast to the ionotropic GABAA and GABAC receptors, GABABRs are metabotropic
G-protein-coupled receptors. Pharmacologically, they are characterized by their sensitivity
to the GABA analog baclofen and insensitivity to the GABAAR antagonist bicuculline (Hill
and Bowery 1981). Structurally, they are heterodimers composed of 2 seven-transmembrane
subunits: GABAB1 and GABAB2. Gene deletion mouse models for GABAB1 (Prosser et
al. 2001; Schuler et al. 2001) and GABAB2 (Gassmann et al. 2004; Thuault et al. 2004) have
been generated and show similar phenotypes: spontaneous seizures, hyperalgesia, increased
locomotor activity, impaired memory. The genes for the human GABAB1 and GABAB2
subunits are mapped to chromosomes 6p21.3 and 9q22.1-q22.3, respectively. Abnormalities
of GABABRs have been implicated in a number of human conditions including spasticity,
pain, cognitive impairments, anxiety and depression, schizophrenia, absence epilepsy, and
drug addiction (Bowery 2006).

37
1.5.5 GABAC Receptors
Like GABAARs, GABACR are also pentameric ligand-gate chloride channels.
Pharmacologically however, they are characterized by their insensitivity to the GABAAR
antagonist bicuculline and to GABAAR modulators such as benzodiazapines and barbiturates
(Bormann 2000). GABACRs are composed of 3 different rho subunits and are expressed
primarily in the retina (Enz and Cutting 1998). Mice that are deficient in the rho1 subunit
have altered visual and olfactory processing (McCall et al. 2002; Chen et al. 2007). The genes
encoding human rho1 and rho2 are located on chromosome 6q14-q21 (Cutting et al. 1992);
human rho3 is located on chromosome 3q11-q13.3 (Bailey et al. 1999).
1.6 Thesis Rationale and Objectives
The tumour suppressor p53 is a key player in the cell's response to a variety of stress
signals. In order to identify novel molecules in the p53 network, the Mak lab performed an in
vivo genetic screen using Drosophila melanogaster and identified the D. melanogaster tumour
suppressor Brain Tumour (brat) as a putative interacter of p53. . In mammals, there exists
three homologs to brat: TRIM3/BERP, TRIM2/NARF and TRIM32/HT2A. Using NCBI's
BLASTP program, BERP was identified as the best mammalian hit for brat and was thus
chosen as the molecule upon which the work of this thesis would be based.
The two main objectives for this thesis are:
1) To determine the role of BERP in the p53 network.
2) To characterize the role of BERP in the mammalian CNS through the generation and
analysis of a gene-deficient mutant mouse.

2 BERP is a Novel p53 Target Gene
2.1 Introduction
Normal p53 function is vital for maintaining the integrity of our genome in the face of DNA
damage and other abnormal stresses such as aberrant proliferative signals, telomere erosion,
hypoxia, loss of adhesion, and loss of survival signals. It is a multifunctional protein involved
in a variety of cellular processes including cell cycle arrest, senescence, apoptosis, DNA
repair, and angiogenesis. The ability of p53 to prevent the propagation of damaged or
potentially transformed cells is key to its function as a tumour suppressor (Vousden and Lu
2002; Levine et al. 2006). Although many molecules in the p53 pathway have been identified
including transcriptional targets p21 (cell cycle arrest), GADD45 (DNA repair), Bax
(apoptosis), and major negative regulator MDM2, our understanding of this complex network
is incomplete (Momand et al. 1992; Kubbutat et al. 1997; Vogelstein et al. 2000; Daujat et al.
2001; Vousden and Lu 2002). As more molecules within the p53 network are identified and
characterized, the apparent reach of this transcription factor increases accordingly. For
example, it has been shown that the promoter of PTEN, a major negative regulator of the PI3
kinase pathway, contains a p53 response element and that p53 can activate transcription of
PTEN (Stambolic et al. 2001). This discovery revealed a previously unknown connection
between these two important tumour suppressors and their respective signaling pathways. It
follows then that the identification of novel molecules in the p53 network would allow us not
only to better understand the role(s) of this tumour suppressor in already defined pathways
(eg. cell cycle arrest, apoptosis, senescence...etc...), but may also provide clues that point to
its involvement in novel functions that have not yet been described.

39
Therefore, in order to identify novel molecules within the p53 network, the laboratory
performed a genetic modifier screen in D. melanogaster using fly lines that overexpress dp53
in the developing eye (GMR-Gal4-dp53); these flies have a small, rough eye phenotype
compared to wild type flies. To identify genetic modifiers of the p53 pathway, GMR-Gal4-
dp53 flies were crossed with mutant fly strains each containing one of 1150 distinct P-
element insertions which disrupts one copy of a vital D. melanogaster gene. The progeny of
these crossings were scored according to phenotypic changes in the eye. Progeny with larger
eyes than those of GMR-Gal4-dp53 flies were phenotypic suppressors; those with smaller
eyes were phenotypic enhancers. Results of this screen identified D. melanogaster brain
tumour (brat) as a suppressor of the p53 eye phenotype and hence, putative interacter of
p53. Using NCBI's BLASTP program, we determined that of the three known mammalian
brat homologs, BERP was the best hit and therefore would be the focus of our studies.
Because the D. melanogaster screen is a genetic screen and not a biochemical screen, three key
possibilities should be considered: i) BERP functions upstream of p53, ii) BERP functions
downstream of p53, and iii) BERP functions in parallel to p53. However, due to the nature
of the screen performed (ie. in which p53 was overexpressed in the fly eye), a hit that
functions upstream of p53 is unlikely. Therefore it is most likely that BERP is either
downstream of p53 or functions in a parallel pathway. Since p53 exerts many of its cellular
effects by regulating the transcription of downstream genes, we wondered whether BERP
could be a transcriptional target of p53. This chapter describes several lines of evidence
supporting the interpretation that BERP is a novel p53-regulated gene.
40
2.2 Materials and Methods
2.2.1 DNA sequences and prediction of p53-binding sites
DNA sequences and potential p53-binding sites were obtained from NCBI
(http://www.ncbi.nlm.nih.gov/sites/entrez?db=gene) and TFBIND (http://tfbind.hgc.jp/)
(Tsunoda and Takagi 1999) respectively.
2.2.2 Cell culture
The isogenic human colon cancer cell lines HCT116 p53+/+ and HCT116 p53-/-, a kind gift
from Dr. B. Vogelstein (Sidney Kimmel Comprehensive Cancer Center, Baltimore, MD),
were cultured in McCoy's 5A media supplemented with 10% fetal calf serum and L-
glutamine.
2.2.3 ChIP assay
HCT116 p53+/+ and HCT116p53-/- cells were treated with 5FU for 24 hours, cross-linked
with formaldehyde and sonicated (4 x 20s pulses, duty cycle 30%, output control 3, Branson
Sonifier® S-450A) into fragments ranging in size from 200bp to 1000bp. Chromatin
immunoprecipitation was performed on cell extracts using EZ ChIP Kit (Millipore) and anti-
p53 antibody (DO-1, Santa Cruz). PCR amplification on the immunoprecipitated chromatin
was performed using primers specific for potential p53REs in the region upstream of the
BERP gene. Primer sequences were as follows. p21, 5'-GTGGCTCTGATTGGCTTTCTG-
3' and 5'-CTGAAAACAGGCAGCCCAAGG-3'; BERP B, 5'-
41
GGGTGTGGGAGATTGGACATGGTAC-3' and 5'-
CCAGGAAGATAGACAGGGCAGCAAC-3'; BERP EFG, 5'-
GGGACAGATGGTTGCAGGTTGGAG-3' and 5'-
CTGCTAGGGCCAGTCCTGAGTTTC-3'.
2.2.4 Luciferase assay
pGL3-p21, a kind gift from Dr. S. Benchimol (Lin et al. 2000), contains a p53-binding site
from the Cdkn1a promoter and the E1B core promoter sequence subcloned into the pGL3-
Basic vector (Promega) just upstream of the luc+ gene. pGL3-TATA is the pGL3-p21
vector in which the Cdkn1a p53-binding site is removed. The Cdkn1a p53-binding site of
pGL3-p21 was replaced by PCR-amplified fragments, from HCT116 cell genomic DNA, of
potential p53 response elements upstream of the BERP gene in order to generate pGL3-
BERPA, pGL3-BERPB, and pGL3-BERPE vectors. The constructs were cotransfected
using Fugene 6 (Roche) into HCT116 p53-/- cells with a beta-galactosidase vector and vectors
expressing either wildtype or a DNA binding-mutant form p53 (Baker et al. 1990; Kern et al.
1992). Cells were harvested and lysed 24 hours post transfection using the Luciferase Assay
System (Promega). Luciferase activity was normalized to beta-galactosidase activity and
expressed relative to pGL3-TATA.
2.2.5 Real time RT-PCR
Total RNA was extracted using RNeasy (Qiagen) and reverse transcribed using Superscript
first strand RT-PCR cDNA synthesis system (Invitrogen) both according the manufacturers'

42
protocols. Quantitative PCR was performed on cDNA using TaqMan Gene Expression
Assays (BERP: Hs00197678_m1, P21: Hs00355782_m1, NARF: Hs00209620_m1, HT2A:
Hs00705875_s1, PPIA: Hs99999904_m1, GAPDH: Hs99999905_m1, HPRT1:
Hs99999909_m1, TBP: Hs99999910_m1, Applied Biosystems) and the 7900HT Fast Real-
Time PCR System (Applied Biosystems).
2.2.6 Genotyping of p53-deficient mice
p53-deficient mice, originally created in the laboratory of Dr. Tyler Jacks (Jacks et al. 1994),
were generated from heterozygous intercrosses. Genotyping of the mice was performed as
per the protocol from the Jacks laboratory. Briefly, this consitsted of multiplex PCR
performed on genomic DNA extracted from mouse tails using the following primers: 5'-
CAGCGTGGTGGTACCTTAT-3', 5'-TATACTCAGAGCCGGCCT-3', 5'-
CTATCAGGACATAGCGTTGG-3'. The PCR conditions used were 95ºC x 15' followed
by 30 cycles of 94ºC x 1', 60ºC x 1', 72ºC x 1' with a final extension at 72ºC x 10' (GeneAmp
9600, Perkin Elmer). The presence of the wild-type and mutant alleles were denoted by PCR
products of ~ 450 and ~ 615 base pairs, respectively.
2.2.7 In-situ hybridization
The in situ hybridization procedure was performed similar to that previously described (Hui
and Joyner, 1993; Skinnider et al., 2001). Briefly, p53 +/+ and p53 -/- adult male mice (8-12
weeks old) were treated with PTZ (45 mg/kg, Sigma) or PBS via a single intra-peritoneal
injection. At 6 and 24 hours post-injection, the brains were harvested, fixed for 24 hours in

43
10% neutral buffered formalin, dehydrated, and embedded in paraffin. RNAse-free sections
(4 µm thick) were placed onto glass slides, de-paraffinized, acetylated, dehydrated, and
hybridized with sense or antisense -[33P]-UTP-labeled RNA probes that were synthesized
from linearized template with T3 or T7 RNA polymerase. The BERP DNA template was a
428bp fragment subcloned into pBluescript SK (Stratagene). C- (cardiac) actin, a DNA
template known to consistently work with a well-defined expression pattern, was run in
parallel as a positive control for the procedure. Once hybridization and washes were
completed, the slides were dehydrated and a sheet of x-ray film was exposed overnight (to
gain a rough sense of expression level). Slides were then coated with liquid Kodak NTB 2 or
NTB photographic emulsion (Eastman Kodak) and stored at 4°C. After exposure for 5 to
14 days (depending upon the strength of the signal determined from the x-ray film exposure),
the slides were developed in Kodak D19 developer (4min at 14ºC, Eastman Kodak), fixed
(Kodak Fixer) and counterstained with toluidine blue. The specificity of the hybridization
signal was verified by the corresponding lack of signal when sense RNA probes were used.
Cells/areas were scored as positive if the number of silver grains was at least 2-fold over
background.

44
2.3 Results
2.3.1 The BERP promoter region contains multiple potential p53 responseelements
The 14.8kb genomic fragment upstream of the BERP translational start site was examined for
the presence of potential p53 response elements. Using sequence analysis, multiple potential
sites similar to the p53RE consensus sequence as described by El-Deiry et al., 1992 were
identified. Of these, three sites (B, E, G) that had “C “and “G” nucleotides at positions 4 and
7 of each half site, and that had no more than 3 mismatches to the consensus sequence were
chosen for testing (Figure 5); site F, although it had >3 mismatches to the consensus sequence
was also included due to its proximity to both sites E and G. Site B
(GGACATGGTAcatcctttgTCACTTGCCC) is located between bases -11349 to -11321
relative to the BERP translational start site (the nucleotide immediately 5' to the ATG is -1).
It contains two half-sites with 17 of 20 nucleotide matches to the p53RE consensus sequence;
there is a 9 bp spacer between the two half-sites. Site E is located within intron 1 between
bases -7374 to -7354; it contains two half-sites separated by a 1 bp spacer, with 19 of 20
nucleotide matches to the p53RE consensus sequence. Site F is located within intron 1
between bases -7258 to -7235; it contains two half-sites separated by a 4 bp spacer, with 15
of 20 nucleotide matches to the p53RE consensus sequence. Site G is located within intron 1
between bases -7151 to -7128; it contains two half-sites separated by a 4 bp spacer, with 17
of 20 nucleotide matches to the p53RE consensus sequence.

45
Figure 5. Predicted p53REs within the BERP genomic locus. (A) Genomic localization of 4
potential human BERP p53REs. Gray ovals represent the location of four putative BERP
p53REs (B, E, F, G) as indicated. Residue positions are expressed relative to the translation
start site; the "A" of the ATG is +1. (B) Sequences of the putative p53REs within the
BERP genomic locus. The p53RE consensus sequence is shown for comparison; Pu = A/G,
Py = C/T, N = A/G/C/T. Capitalized letters, nucleotides from half-site sequences. Small
letters, nucleotides from the spacer sequence. Asterisks, mismatches to the p53RE consensus
sequence. The position of each potential site is given relative to the start of translation. For
each potential site, the number of residues matching the p53RE consensus sequence is
indicated.

46

47
2.3.2 p53 can bind BERP p53REs in vivo and regulate transcription
ChIP analysis was performed in order to determine whether p53 could bind to the potential
BERP p53REs in vivo. HCT116 p53+/+ and HCT116 p53-/- cells were treated with 5FU in
order to induce p53. Cells were harvested 24 hours later and chromatin immunoprecipitation
was performed using anti-p53 antibody. This was followed by PCR with primers specific for
the potential p53REs. Results indicate that p53 binds to BERP site B as well as to BERP
sites EFG in vivo (Figure 6A). Note that due to proximity of BERP sites E, F and G, it is
impossible to determine the exact location to which p53 binds. In order to determine whether
the potential BERP p53REs can regulate transcription, oligonucleotides containing the
sequences for BERP sites B, E, F and G were cloned into the pGL3-TATA construct
upstream of the luciferase reporter gene. The constructs were then co-transfected into
HCT116 p53-/- cells along with a vector expressing either wild-type p53 or a DNA-binding-
domain mutant form of p53. pGL3-p21 was used a positive control. Of the four potential
sites tested, only BERP E resulted in an increase in luciferase activity in the presence of wild-
type p53; no increase was seen in the presence of mutant p53 (Figure 6B). Additionally,
a C → A point mutation at position 4 of the BERP E site results in loss of luciferase activity
(Figure 6C). These findings suggest that the BERP E p53RE is bound by p53 and can
regulate transcription in a p53-dependent manner.

48
Figure 6. In vivo binding and transcriptional competence of predicted BERP p53REs.
(A) Chromatin immunoprecipitation assay in HCT116 cells showing the in vivo binding of
p53 with potential BERP p53REs (sites BERP B and BERP EFG). The p21 p53RE was
used as a positive control. Cells were treated with 5FU to induce p53; untreated controls
received DMSO only. Immunoprecipitations were performed using non-specific mouse
immunoglubulin ("IgG" lanes) and DO-1 anti-p53 antibody ("anti-p53" lanes). 1% of the
total sonicated chromatin was removed prior to immunoprecipitation and used for input
DNA ("Input" lanes). H2O, water control. PCR products were resolved on a 1% agarose gel
stained with ethidium bromide. (B) Luciferase assay showing the ability of wild-type (light
blue bars) and mutant p53 (orange bars) to activate transcription of luciferase reporter
constructs containing potential BERP p53REs (pGL3-BerpB, pGL3-BerpE, pGL3-BerpF,
pGL3-BerpG). pGL3-p21 was used as a positive control. pGL3-TATA, empty vector
control. Luciferase activity was normalized to beta-galactosidase activity and expressed
relative to pGL3-TATA levels. Results shown are the means of four independent
experiments performed in triplicate; error bars represent 1 SEM. (C) Luciferase assay
showing the ability of wild-type (light blue bars) and mutant p53 (orange bars) to activate
transcription of luciferase reporter constructs containing site BERP E (pGL3-BerpE) and a
mutant version of site BERP E containing a C → A point mutation at position 4 (pGL3-
BerpE*). pGL3-p21, positive control. pGL3-TATA, empty vector control. pGL3-BerpG,
a construct containing a putative BERP p53RE that is unable to support transcriptional
activation by p53. Luciferase activity was normalized to beta-galactosidase activity and
expressed relative to pGL3-TATA levels. Results shown are the means of 3 independent
experiments performed in quadruplicate; error bars represent 1 SEM.

49

50
2.3.3 BERP expression is p53-dependent in vitro
To determine whether BERP expression is p53 dependent in vitro, we treated the isogenic
HCT116 p53+/+ and HCT116 p53-/- cancer cell lines with increasing doses of 5FU (a
compound known to activate p53 in this system) and measured the levels of BERP mRNA
using real-time RT-PCR. Results show that BERP expression is upregulated 4 to 5-fold in a
p53-dependent manner at both 24 (Figure 7B) and 48 (Figure 7A) hours after treatment with
5FU. In addition, BERP homologs NARF and HT2A did not show p53-dependent
upregulation (Figure 7B), which suggests that this effect is specific to BERP under these
conditions. Similar results were obtained using additional endogenous controls (please refer to
materials and methods).

51
Figure 7. BERP expression in HCT116 p53-/- and HCT116 p53+/+ cells. (A) Real-time
RT-PCR analysis of BERP expression in HCT116 cells. RNA extracted from HCT116
p53+/+ and HCT116 p53-/- cells 48 hours after treatment with increasing doses of 5FU.
Real-time RT-PCR was performed in order to determine the relative expression levels of
target genes. Values were normalized to HPRT1 and expressed relative to untreated controls.
P21 was used as a positive control for p53 activation. HCT116-/BERP (light red bars),
BERP expression in HCT116 p53-/- cells. HCT116+/BERP (dark red bars), BERP
expression in HCT116 p53+/+ cells. HCT116-/P21 (light blue bars), P21 expression in
HCT116 p53-/- cells. HCT116+/P21 (dark blue bars), P21 expression in HCT116 p53+/+
cells. Results shown are the means of three independent experiments performed in triplicate;
error bars represent 1 SEM. (B) Real-time RT-PCR analysis of BERP, NARF and HT2A in
HCT116 cells. RNA was extracted from HCT116 p53+/+ and HCT116 p53-/- cells 24 hours
after treatment with increasing doses of 5FU. Real-time RT-PCR was performed to
determine the relative expression levels of the indicated target genes. HCT116mut/BERP
(light red bars), BERP expression in HCT116 p53-/- cells. HCT116wt/BERP (dark red bars),
BERP expression in HCT116 p53+/+ cells. HCT116 HCT116mut/HT2A (light green bars),
HT2A expression in HCT116 p53-/- cells. HCT116wt/HT2A (dark green bars), HT2A
expression in HCT116 p53+/+ cells. HCT116mut/NARF (light orange bars), NARF
expression in HCT116 p53-/- cells. HCT116+/NARF (dark orange bars), NARF expression
in HCT116 p53+/+ cells. HCT116mut/P21 (light blue bars), P21 expression in HCT116
p53-/- cells. HCT116wt/P21 (dark blue bars), P21 expression in HCT116 p53+/+ cells.
P21expression was used as a positive control for p53 activation. Values were normalized to
HPRT1 and expressed relative to untreated controls. Results shown are the means of three
independent experiments performed in triplicate; error bars represent 1 SEM.

52

53
2.3.4 BERP expression is p53-dependent in vivo
Results from section 2.3.2 suggest that site E within intron 1 of the human BERP genomic
locus is indeed a functional p53 response element. Sequence analysis of the murine BERP
genomic locus also reveals multiple putative p53 response elements (data not shown).
Although no site identical to Site E of the human genomic locus was identified within the
murine genomic locus, it is interesting that one of the putative murine sites (AGGCAGGCCC
t GTGCATGTTC) is located at a similar relative position within intron 1 (7121 bp upstream
of the translational start site compared to 7374 bp for human Site E), and has a high number
of residues matching the consensus sequence (18/20 matches compared to 19/20 matches for
human Site E). In addition, both are composed of half-sites that are separated by a spacer
region consisting of a single nucleotide. Therefore, in order to determine whether BERP
expression is p53-dependent in mouse tissue, p53 +/+ and p53 -/- adult male mice between 8
- 12 weeks old were injected with PTZ (3-5 mice per genotype (p53 +/+ and p53-/-) per
condition (PTZ and PBS) per time point (6 and 24 hours). The brains were harvested at 6
hours (Figure 8) and 24 hours (data not shown) post injection, then subjected to in situ
hybridization using a 33P-labeled BERP riboprobe. At 6 hours, endogenous levels of BERP
were present in the brains of p53 -/- mice (Figures 8A and 8C). In contrast, strong up-
regulation of BERP was seen in the brains of p53 +/+ mice (Figures 8B and 8D). The brains
of sham injected p53 -/- and p53 +/+ mice showed endogenous levels of BERP (Figures 8E
and 8F). Taken together, these data indicate that BERP is upregulated in a p53-dependent
manner in response to PTZ in vivo.

54
Figure 8. BERP expression in p53-/- and p53+/+ mice. In response to PTZ injection, BERP
expression is up-regulated in the cerebellum (B) and hippocampus (D) of p53 +/+ mice
compared to levels present in the cerebellum and hippocampus of p53 -/- mice (A and C,
respectively). BERP expression in the p53 -/- mice (A and C) is comparable to the
endogenous levels present in sham injected p53 -/- and p53 +/+ mice (E and F). Scale bar:
200µm.

55

56
3 The Role of BERP in the Mammalian CNS
3.1 Introduction
BERP (Brain Expressed Ring finger Protein), a molecule that initially drew our interest for its
homology to a D. melanogaster tumour suppressor, was first cloned and characterized in the
rat by El-Husseini et al. (El-Husseini and Vincent 1999; El-Husseini et al. 2000). It binds to
alpha-actinin-4 and myosin V, two members of the actin cytoskeleton that have been
implicated in cell motility, cancer and organelle trafficking (Honda et al. 1998; Provance and
Mercer 1999; Nikolopoulos et al. 2000; Yan et al. 2005; Wang et al. 2008). In PC12 cells,
overexpression of a BERP truncation mutant prevented NGF-induced differentiation and
neurite outgrowth (El-Husseini and Vincent 1999). It is strongly expressed in the brain and is
upregulated in the murine brain following chemically induced seizures (Ohkawa et al. 2001).
In humans, BERP (as TRIM3) was recently identified as the candidate tumour suppressor
gene at the 11p15.5 locus after examining 70 human gliomas for loss of heterozygosity
(Boulay et al. 2009). In addition, a recent shotgun proteomics analysis suggested that BERP
is up-regulated in the brains of schizophrenic patients (Martins-de-Souza et al. 2009). These
findings, along with the discovery that BERP is a novel p53-regulated gene (as described in
Chapter 2) suggest that BERP may an important role in the mammalian CNS. However, an in
vivo role for BERP is yet to be described. Therefore, we sought to determine the possible
physiologic function of BERP through the generation of a gene-deficient mutant mouse model.
This chapter describes the generation of a BERP-deficient mouse using targeted mutagenesis
and its characterization based on the clues provided from the published literature.

57
3.2 Materials and Methods
3.2.1 ES cell culture
E14K embryonic stem cells derived from 129/OLA mice were grown on a monolayer of
mitomycin C-treated primary mouse embryonic fibroblasts. The culture medium consisted of
DMEM with 15% FCS (HyClone, Logan, Utah), leukemia inhibitory factor, L-glutamine, and
beta-mercaptoethanol.
3.2.2 Generation of BERP-deficient mice
The full-length mouse BERP cDNA was PCR amplified from a mouse brain cDNA library
(Clontech) using specific primers flanking the BERP open reading frame. The BERP cDNA
was then used to probe a P1-derived artifical chromosome (PAC) clone library in order to
identify clones that carry a genomic fragment containing the mouse BERP locus. Two such
PAC clones were successfully obtained (3M16 and 143K22). A targeting construct designed
to replace coding exons 2-5 of BERP with a pGK promoter driven neomycin resistance gene
cassette in reverse orientation of BERP transcription was created. The final targeting
construct contained both a short arm and a long arm of sequences derived from the PAC clone
3M16, which flanked the neomycin cassette. The short arm introduced a stop codon
immediately after the 5’ splice site of coding exon 2. The targeting construct (20ug) was
linearized with NotI, electroporated into 5x10⁶ E14K mouse embryonic stem cells (Bio-Rad
Gene Pulser; 0.34 kV, 250 F) and treated with 300µg/mL of G418 (Sigma) for 10 days. ES
cells were screened for successful homologous recombination by PCR using primers specific
58
for the neomycin resistance gene and the flanking BERP locus (5'-
CATACCCGAATCCAGGTCTATCTC-3’ and 5'-
CCTCCCACTCATGATCTATAGATCGG-3’). PCR-positive clones were confirmed by
Southern hybridization of NcoI-digested genomic DNA with radio-labeled probes for both the
5’ region immediately flanking the targeted BERP locus (which detects a 13.5 kb wild-type
allele and a 4.5 kb mutant allele) and the neomycin resistance gene (to confirm single
integration). ES clones that contain the correctly targeted allele were micro-injected into
blastocysts harvested from day 3.5 pregnant C57BL/6 female mice and implanted into the
uteri of day 2.5 pseudopregnant CD1 foster mother mice in order to generate chimeras. All
resultant chimeras were mated with C57BL/6 mice and Agouti-coloured offspring were
assessed for successful germline transmission of the mutant allele (BERP+/-) by tail genomic
DNA extraction followed by PCR and Southern hybridization analysis. Heterozygous mice
(BERP +/-) were intercrossed to produce BERP-null mice (BERP -/-). Two lines from
independently targeted ES clones were successfully generated and backcrossed to C57BL/6.
3.2.3 Genotyping of BERP-deficient mice by PCR and Southern Blotting
PCR was performed on genomic DNA extracted from mouse tails using the following primer
sets: 5'-CCTGCTTCTCTCACTGTCACCACC-3' and 5'-
CACCCTTCTCCCTTCCACGACTAC-3' for the wild-type allele; 5'-
CAGTCATAGCCGAATAGCCTCTCC-3' and 5'-CACCCTTCTCCCTTCCACGACTAC-
3' for the mutant allele. The PCR conditions used were 94ºC - 15' followed by 40 cycles of
94ºC - 30", 58ºC - 30", 72ºC - 1', with a final extension at 72ºC - 7' (GeneAmp 9600, Perkin

59
Elmer). The presence of the wild-type and mutant alleles was denoted by PCR products of
632 and 1155 base pairs, respectively.
Southern blot analysis was performed on 10µg of tail-derived genomic DNA. After digestion
with NcoI, the DNA was fractionated on a 1% agarose gel and transferred to a positively
charged nylon membrane (Hybond N+, Amersham). Membranes were hybridized with a
radio-labeled probe from the 5' flanking region, which detects a 13.5 kb band representing the
wild type allele and a 4.5 kb band representing the mutant allele.
3.2.4 Generation and genotyping of BERP-/-;p53-/- mice
BERP+/- mice (section 3.2.2) were crossed with p53+/- mice (Jacks et al. 1994) in order to
generate BERP+/-;p53+/- mice. Mice with simultaneous deficiencies of BERP and p53 were
generated by intercrossing pairs of BERP+/-;p53+/- mice. Genotyping of the BERP locus
was performed by PCR as described in section 3.2.3. Genotyping of the p53 locus was
performed by PCR as described in section 2.2.6.
3.2.5 Histological analysis
Tissues were fixed in 10% neutral buffered formalin, dehydrated, and embedded in paraffin.
Sections were cut (approximately 4 µm thick), placed onto glass slides and stained with either
H&E/LFB (central nervous system tissues) or H&E (all other tissues). Sectioned material was
also used for in situ hybridization analysis of mRNA (see below).

60
3.2.6 Western blot analysis
Tissues were homogenized in lysis buffer containing 0.5% CHAPS w/v, 10mM Tris (pH7.5),
1mM MgCl2, 1mM EGTA, 10% glycerol v/v, 50µM NaF, 100µM Na3VO4, and protease
inhibitor cocktail tablets (Roche). Total protein concentration was determined using the
Bradford assay (Bio-Rad). Protein lysates were fractionated by sodium dodecyl sulfate
polyacrylamide gel electrophoresis on an 8% tris-glycine polyacrylamide gel (Invitrogen) and
blotted onto a polyvinylidene difluoride membrane (Millipore). Blots were incubated with
mouse anti-BERP antibody (BD Biosciences) at a dilution of 1:500 or rabbit anti-Actin
antibody (Sigma) at a dilution of 1:1000. Bound antibodies were visualized by incubation
with horseradish peroxidase-conjugated goat anti-mouse or goat anti-rabbit secondary
antibodies followed by enhanced chemiluminescence according to the manufacturer's protocol
(Amersham).
3.2.7 Behavioural characterization
All behavioural tests were performed at the Samuel Lunenfeld Research Institute's Centre for
Modeling Human Disease (CMHD) Mouse Physiology Facility, Toronto, Canada. Test
subjects consisted of BERP+/+ and BERP-/- male mice backcrossed at least 6 generations into
a C57BL/6 genetic background. All mice were housed in groups of 3-5 per cage and were
between 10-13 weeks old at the time of testing. Food and water were available ad
libitum.

61
SHIRPA Neurological Screen
A general neurological screen was performed on test subjects according to the modified
SHIRPA (Smithkline Beecham, MRC Harwell, Imperial College, the Royal London hospital
Phenotype Assessment) protocol (Rogers et al. 1997).
Locomotor Activity and Open-Field Test
Subjects were individually placed into the centre of a chamber (42cm wide x 42cm long x
33cm high) equipped with horizontal and vertical infrared sensors (Ugo Basile, Italy). For the
first 5 minutes, the following parameters were recorded using The Observer (Noldus
Information Technology): time spent in and number of entries into the border area, time spent
in and number of entries into the centre area, number of on wall- and off wall-rearings,
horizontal and vertical activity (beam breaks). After the first 5 minutes, measurement of
horizontal and vertical activity continued for an additional 25 minutes. The test chamber was
cleaned with a 70% ethanol solution between subjects.
Elevated plus maze test
The testing apparatus consisted of two opposed open arms (25cm x 5.5cm) and two opposed
closed arms (25cm x 5.5cm x 25cm) extending at right angles from a centre platform; the entire
apparatus was elevated 50 cm above the ground. Test subjects were individually placed in
the centre of the maze and the following parameters were recorded by The Observer (Noldus
Information Technology) during a 5 minute observation period: time spent on the open arms,
closed arms, and on the central platform. Total number of entries into open and closed arms
was used as a measure of overall motor activity. The test apparatus was cleaned with a 70%
ethanol solution between subjects.

62
Contextual and cued fear conditioning
The test apparatus consisted of a test chamber (25cm high x 30cm wide x 25cm deep) with a
grid floor connected to a current generator and a speaker. On day 1 (conditioning training),
test subjects were placed individually into the chamber and observed without stimulus for
120 seconds. This was followed by 30s of an audible tone (3600Hz, 85dB) and a 2s foot
shock (1mA) that co-terminated with the tone. The subject was removed from the chamber
30s later. Baseline freezing activity was recorded using automated fear conditioning software
(FreezeFrame, Actimetrics Software). On day 2, approximately 24 hours later, the test
subjects were individually returned to the test chamber; freezing activity was monitored for
300s during which time no stimulus was applied (contextual fear test). Test subjects were
then removed from the test chamber. Two hours later, test subjects were individually placed
into an altered version of the test chamber (grid floor was covered with a plastic sheet, two
pieces of fiberglass were used to create triangle-shaped chamber, door was covered with black
cardboard) and observed without stimulus for 180s. This was followed by an audible tone
(3600Hz, 85dB) for 180s (cued fear test). Freezing activity was recorded throughout the test.
The test apparatus was cleaned with a 70% ethanol solution between subjects.
Prepulse Inhibition of the Acoustic Startle Response
The testing apparatus consists of 4 sound-attenuating chambers (Startle Reflex System, MED
Associates Inc.) that could confine and detect the movement of the test subjects. Five
different trial types were used: (i) A "pulse-only" trial in which only an acoustic startle pulse
of 120dB was presented for 40 milliseconds. (ii-iv) "Prepulse-pulse" trials in which a
prepulse tone (69, 73, 81dB, 20 milliseconds) is followed by a pulse (120dB, 40 milliseconds)

63
at 100 millisecond intervals. (v) A "no stimulus" trial in which only background noise of 65dB
was presented to measure baseline movement of the test subject in the chamber. The trials
were performed in the following order: (1) A 15 minute "no stimulus" trial for acclimation, (2)
five "pulse-only" trials, (3) 10 combination blocks that contained all the five trial types in
pseudo-random order, (4) five "pulse-only" trials. Inter-trial intervals varied between 12 and
30 seconds. The maximum force intensity for each trial was recorded as startle level. The
PPI level is defined as the average percent reduction in startle intensity between prepulse-
pulse and pulse-only trials at all three prepulse levels (69, 73, 81dB). The test apparatus was
cleaned with a 70% ethanol solution between subjects.
Accelerating Rotarod
The testing apparatus consisted of a rod that was suspended 30cm above a plastic floor and
was divided into 4 sections by opaque plastic dividers, thus allowing 4 subjects to be tested
simultaneously (Economex Rotarod, Columbus Instruments). Test subjects were placed onto
the rod facing away from the observer. Initially, subjects were observed for 60 seconds while
the rod remained stationary. Next, the rod was rotated at a constant speed of 5 revolutions
per minute (rpm) for 90 seconds. The rotational speed was then gradually increased by
0.1rpm per second for 300 seconds; the maximum speed reached was 30rpm. The latency to
falling off the rod was recorded. Test subjects underwent 3 consecutive trials per day for 3
consecutive days. The mean latency was calculated by averaging the latency for three
consecutive trials.

64
Tail suspension test
Test subjects were suspended within the tail suspension chamber from a small metallic hook
by their tails using adhesive tape. The cumulative duration of immobility over a 6 minute
observation period was recorded using The Observer (Noldus Information Technology)
Grip strength test
Subjects were held by the tail and allowed to grip a metal grid. Slow and steady traction was
applied until the grip was released down the complete length of the grid. The maximum grip
strength was recorded in grams. Eight trials in total were performed per subject (4 forelimb
trials and 4 fore-hindlimb trials).
Tail flick test
The distal portion of the subject's tail was submerged in 50º degree Celsius water bath; the
latency to removal was measured.
3.2.8 Pentylenetetrazol seizure susceptibility testing
Mice were shipped to the Research Service at the Department of Veterans Affairs Medical
Center (DVAMC) in Coatesville, Pennsylvania in the USA in six batches. Each batch
contained both wild type (N ~ 10) and knock out mice (N ~ 10) and batches were shipped
approximately 6 weeks apart. Upon arrival to the DVAMC, mice were housed in a
quarantine room of the animal facility in the basement of Building #11 for at least 1 week
prior to testing. Mice were maintained on a 14 hr (light) 10 hr (dark) circadian light cycle and
had food and water available ad libitum. All mice were male and were between the ages of 8-
12 weeks at the time of seizure testing. Seizure tests were conducted between the hours of 9

65
a.m. and 12 noon. Mice were given a single injection of pentylenetetrazole (PTZ, Sigma)
dissolved in physiological saline at pH 7.0. Injections were given subcutaneously in a volume
equal to 1% of body weight. Drug solutions were prepared fresh on the day of each
experiment. A range of doses was studied (40, 60, 80, 90 and 100 mg/kg) and doses were
staggered such that several doses were utilized in testing each batch of mice. Individuals
performing seizure tests were blind with respect to the genotypes of the mice. Following
PTZ injection, mice were placed into a plexiglass chamber (20mm wide, 30 mm deep, 40 mm
high) with mesh floor and observed for 45 minutes during which time seizure responses were
scored. Three endpoints, as well as the latencies to each endpoint were recorded: partial
seizure (PS), generalized seizure (GS), maximal seizure (MS). Partial seizure is characterized
by a sudden whole body spasm or a sudden and rapid clonus involving the head, neck or one
forelimb. Generalized seizure is characterized by loss of upright posture and bilateral clonus
of fore and hind limbs. Maximal seizure is characterized by bilateral tonic extension of the
hind limbs; it is sometimes fatal in susceptible mice.
3.2.9 Hemi-brain slice preparation
Male mice 3-4 weeks old were anesthetized with halothane and decapitated. The brain was
rapidly extracted and placed into ice-cold, oxygenated (95%O2, 5%CO2) artificial cerebral
spinal fluid (ACSF) that contained 125 mM NaCl, 2.5 mM KCl, 25 mM NaHCO3, 1.25 mM
NaH2PO4, 1 mM MgCl2, 2 mM CaCl2, and 25 mM glucose and was titrated to pH 7.3–7.4
with osmolarity of 300–320 mOsm. Hemi-brain coronal slices (300 µm) were cut using a

66
vibratome (Vibratome Co.) and placed in oxygenated ACSF at room temperature for 1 hour
before recording.
3.2.10 Electrophysiology
Slices were transferred into a recording chamber on the stage of an infrared-DIC E600FN
microscope (Nikon). The chamber was continuously perfused with oxygenated ACSF at
room temperature at a rate of 2 mL/minute. The whole cell patch-clamp technique was used
to record from cortical pyramidal neurons. Recording electrode resistance was 3–5 M_ when
filled with solution containing 145 mM CsCl, 1mM CaCl2, 2 mM MgCl2, 5 mM EGTA, 10
mM HEPES, 4 mM K2ATP, titrated to pH 7.3 with CsOH and the osmolarity was 280–290
mOsm. An Axopatch 200B (MDC) was used to record mIPSCs. Data acquisition and
analysis were performed using DigiData 1322A (MDC) and the analysis software pClamp 10
(MDC). Signals were filtered at 2 kHz and sampled at 10 kHz. The resistance of the patch
pipette was monitored throughout the whole-cell recording and data were discarded if the
resistance of the electrode changed by more than 20%. For recording mIPSCs, neurons were
voltage-clamped at -70 mV in the presence of TTX (1.0 µM), CNQX (20 µM) and D-APV
(50 µM). All recordings were performed at room temperature.
3.2.11 Murine cortical neuron cultures
Cultures of primary neurons were derived from the cerebral cortex of embryonic day 17.5
mice (E17.5). Pregnant females from timed matings were sacrificed by cervical dislocation and
the uteri were dissected and the embryos were removed. The cortex from the embryo brains

67
were excised, placed in ice-cold HBSS, and gently triturated with fire-polished Pasteur
pipettes. The dissociated cell suspension was pelleted by centrifugation at 300g x 5' at 4ºC,
re-suspended in plating medium, and plated on poly-D-lysine coated Petri dishes (day 0). On
day 3, half of the plating medium was replaced with maintenance medium. Maintenance
medium was exchanged every 3 days thereafter. Plating medium consisted of Neurobasal
medium (Invitrogen), 2% B-27 supplement (Gibco), 10% FBS (Hyclone), 0.5 mM L-
glutamine, and 25 µM glutamic acid. Maintenance medium consisted of Neurobasal medium,
2% B-27 supplement, and 0.5 mM L-glutamine.
3.2.12 Biotinylation Assay
After 10 days in culture, cell surface proteins were isolated using the Pierce Cell Surface
Protein Isolation Kit (Thermo Scientific) according to the manufacturer's protocol. Biotin-
tagged protein was quantified using the Bradford assay (Bio-Rad). Protein lysates
(20µg/lane) were fractionated by sodium dodecyl sulfate polyacrylamide gel electrophoresis
on a 10% tris-glycine polyacrylamide gel (Invitrogen) and transferred onto a polyvinylidene
difluoride membrane (Millipore). Blots were probed with anti-GABA-A-receptor-gamma-2
antibody (ab16213, Abcam) at a dilution of 1:1000 and anti-ionotropic-Glutamate-receptor-2
antibody (ab40878, Abcam) at a dilution of 1:5000. Bound antibodies were visualized by
incubation with horseradish peroxidase-conjugated secondary antibodies followed by
enhanced chemiluminescence according to the manufacturer's protocol (Amersham). Blots
were subsequently stripped and incubated with anti-Actin antibody (Sigma) at a dilution of
1:5000 in order to confirm that the biotin-tagged surface proteins were not contaminated with
cytoplasmic proteins. Densitometry analysis was performed using NIH ImageJ software
68
(Rasband, W.S., ImageJ, U. S. National Institutes of Health, Bethesda, Maryland, USA,
http://rsb.info.nih.gov/ij/, 1997-2008).
3.2.13 Real time RT-PCR
Total RNA was extracted using RNeasy (Qiagen) and reverse transcribed using Superscript
first strand RT-PCR cDNA synthesis system (Invitrogen) both according the manufacturers'
protocols. Quantitative PCR was performed on cDNA using TaqMan Gene Expression
Assays (Gabrg2: Mm00433489_m1, Hprt1: Mm01324427_m1, TBP: Mm01277042_m1,
B2m: Mm00437762_m1, Applied Biosystems) and the 7900HT Fast Real-Time PCR
System (Applied Biosystems).
3.2.14 Neurite Outgrowth Assay
Neurons from d17.5 embryos were isolated as described above (see "Mouse cortical neuron
cultures"). Cells were then plated on poly-D-lysine coated coverslips in 12-well plates and
fixed 18, 48, or 72 hours later with 4% paraformaldehyde. The cells were stained with a
mouse monoclonal anti-MAP2 antibody (Sigma, M4403), which was visualized using a Cy3
conjugated affinity purified donkey anti-mouse antibody (Jackson Immuno Labs, 115-165-
146). Images were captured using an OrcaER (Hamamatsu), Micropublisher MP5
(QImaging), or Leica DC500 (Leica Microsystems) camera attached to a DM6000 or DMRE
Leica Research microscope and analyzed using Volocity (Improvision Inc) or LAS (Leica)
software. Measurements of neurites were made using differential interference contrast (DIC)
optics on the Leica DM6000 upright microscope with Volocity (Improvision Inc.) acquisition

69
and measurement software. The total neurite length for each neuron was the sum of all
neurites extending from the cell body. A minimum of 50 neurons were examined per genotype
per experiment.
3.2.15 Neurosphere formation and differentiation assays
Adult male mice, 8-12 weeks old, were killed by cervical dislocation. All subsequent steps
were performed using aseptic techniques. The brain was removed and placed into ice cold,
oxygenated artificial cerebral spinal fluid containing 124mM NaCl, 5mM KCl, 1.3 mM
MgCl2, 26mM NaHCO3, 10mM glucose, 2mM CaCl2. The cortex was removed in order to
expose the lateral ventricles. A small strip of tissue from the medial and lateral walls of the
lateral ventricles from both brain hemispheres was removed. The dissected tissue was
digested using the Papain Dissociation Kit (Worthington Biochemical Corporation) as per the
manufacturer's instructions for 60 minutes at 37ºC. The tissue was mechanically dissociated
into a single cell suspension by trituration using fire-polished Pasteur pipettes. Viable cells,
as determined by trypan blue exclusion, were counted and plated on 24-well plates at a
density of 20 cells/µL (10000 cells per well). Cells were cultured in chemically defined serum
free medium (SFM) in the presence of 20 ng/mL epidermal growth factor (Sigma), 10 ng/mL
fibroblast growth factor 2 (Sigma), 2 µg/mL heparin (Sigma). SFM consisted of DMEM/F12
(1:1) (Invitrogen), 5 mM HEPES buffer, 0.6% glucose, 3 mM NaHCO3, 2 mM L-glutamine,
25 mg/ml insulin, 100 mg/ml transferrin, 20 nM progesterone, 60 mM putrescine, and 30 nM
sodium selenite. After 7 days in culture, the number of neurospheres (“primary”
neurospheres) in each well was counted. To determine self-renewal capacity, primary
neurospheres in each well were collected, mechanically dissociated into a single cell

70
suspension and re-plated on new 24-well plates at a density of 10 viable cells/µL (5000 cells
per well; 8 wells per animal). After 7 days in culture, the number of secondary neurospheres
in each well was counted. For continued passaging, spheres were collected, dissociated and
re-plated as described above. Cell size and viability for single cell suspensions from
dissociated neurospheres were determined using a Beckman Coulter Vi-CELL XR Viability
Analyzer.
3.2.16 Neurosphere differentiation assay
To determine multipotentiality of the neurospheres, single spheres were transferred to poly-
D-lysine/laminin-coated 8 -well chamber slides (BD BioCoat, BD Biosciences) containing
SFM with 1% fetal bovine serum. After 7 days, the spheres were fixed in 4%
paraformaldehyde treated with 0.5% Triton X-100 for 30 minutes prior to
immunocytochemistry. Spheres were preblocked in histoblock containing 5% goat serum,
10% donkey serum, 10% FCS, and 0.5% Triton X-100. Neurospheres were incubated with
primary antibody overnight at 4ºC and with secondary antibodies at room temperature for 1.5
hours. Anti-beta-III-tubulin (R&D Systems, clone TuJ-1, mouse monoclonal) was used as a
neuron-specific marker at a dilution of 1:1000. Glial fibrillary acid protein (rabbit anti-cow
GFAP, DAKO,) was used as a specific marker for astrocytes at a dilution of 1:1000.
Secondary antibodies (Jackson Immuno Labs) were donkey anti-mouse Cy3 (1:200 dilution)
and goat anti-rabbit Cy2 (1:200 dilution). Chambers were washed with PBS (-Ca2+, -Mg2+)
before dehydrating and mounting in a xylene-based mounting medium (Entellan, EMD). Slides
were then examined using a Leica DM6000 microscope with epifluorescence and appropriate
filter sets. The proportion of neurons was determined by counting beta-III-tubulin positive

71
cells and expressing this number as a percentage of the total number of cells in 5 random fields
per neurosphere.
3.2.17 Thymidine incorporation assay
Proliferation assays of neural stem/progenitor cells were performed in flat-bottom 96-well
plates. 2500 viable cells per well were plated in triplicate and cultured in chemically defined
serum free medium in the presence of growth factors (as described in Neurosphere Formation
and Differentiation Assays). Plates were pulsed with 1 mCi [3H] thymidine per well and
harvested after 6 hours. [3H] Thymidine uptake was measured using a scintillation counter
(Topcount, Canberra Packard).

72
3.3 Results
3.3.1 Generation of BERP-deficient mice
BERP-deficient mice were generated using homologous recombination in ES cells to disrupt
the BERP gene (Figure 9A). The targeting construct was designed to replace coding exons 2-5
of BERP with a pGK promoter driven neomycin resistance cassette. After several cycles of
electroporation and G418 selection, independent ES cell clones that contained the mutant
BERP allele were injected into C57BL/6 blastocysts in order to generate chimeras. Agouti-
coloured pups (F1) resulting from matings between chimeras and C57BL/6 mice were
assessed for successful germline transmission of the mutant BERP allele by PCR and
Southern blotting of tail-extracted genomic DNA (Figure 9B). The absence of BERP protein
in BERP -/- mice was confirmed by Western blotting of whole brain lysates using an anti-
BERP antibody (Figure 9C). F1 heterozygotes were backcrossed six generations into the
C57BL/6 background. F1 heterozygous intercrosses yielded the expected sex and Mendelian
ratios. BERP -/- mice were viable, healthy, and fertile, and weight of pups at weaning age of
the same sex were not significantly different (Figure 10). No gross or histological
abnormalities were identified. Aged BERP+/- and BERP-/- mice (>1 year) showed no
differences in lifespan or tumour formation compared with wild-type controls (data not
shown).
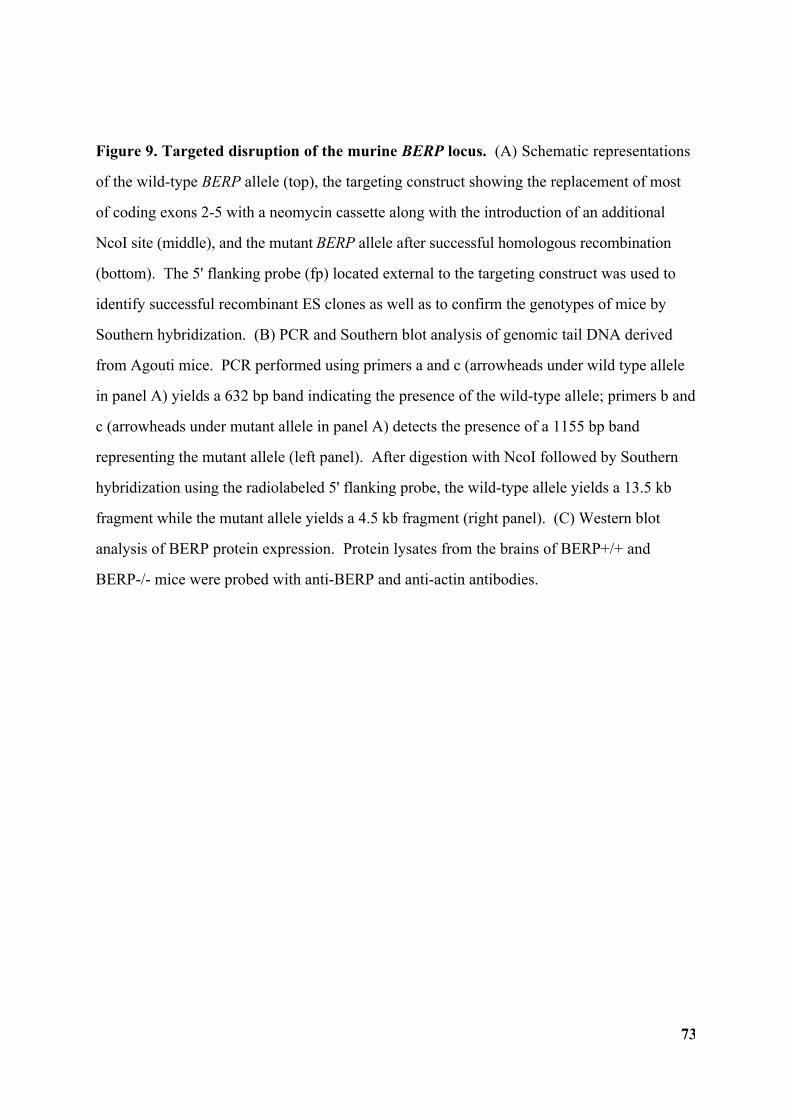
73
Figure 9. Targeted disruption of the murine BERP locus. (A) Schematic representations
of the wild-type BERP allele (top), the targeting construct showing the replacement of most
of coding exons 2-5 with a neomycin cassette along with the introduction of an additional
NcoI site (middle), and the mutant BERP allele after successful homologous recombination
(bottom). The 5' flanking probe (fp) located external to the targeting construct was used to
identify successful recombinant ES clones as well as to confirm the genotypes of mice by
Southern hybridization. (B) PCR and Southern blot analysis of genomic tail DNA derived
from Agouti mice. PCR performed using primers a and c (arrowheads under wild type allele
in panel A) yields a 632 bp band indicating the presence of the wild-type allele; primers b and
c (arrowheads under mutant allele in panel A) detects the presence of a 1155 bp band
representing the mutant allele (left panel). After digestion with NcoI followed by Southern
hybridization using the radiolabeled 5' flanking probe, the wild-type allele yields a 13.5 kb
fragment while the mutant allele yields a 4.5 kb fragment (right panel). (C) Western blot
analysis of BERP protein expression. Protein lysates from the brains of BERP+/+ and
BERP-/- mice were probed with anti-BERP and anti-actin antibodies.

74

75
Figure 10. General phenotypic assessment of BERP-deficient mice (129ola/C57BL/6
mixed background). (A) Genotype analysis of BERP mice. PCR of genomic tail DNA was
performed using primers specific for the BERP wild-type and mutant alleles. Results shown
are from one litter of a heterozygous intercross. (B) Chart showing the sex and genotype
breakdown of 296 offspring from heterozygous intercrosses. (C) Mean weights at weaning of
BERP+/+, BERP+/-, and BERP-/- mice (n=15-41) for each genotype of each sex; error bars
represent 1 SEM.

76
77
3.3.2 Behavioural characterization of BERP-/- mice
3.3.2.1 SHIRPA Neurological Screen in BERP-deficient mice
To assess gross neurological function, a modified SHIRPA neurological screen was performed
on the mice. This battery of tests is a semi-quanititative observational method of assessing
basic phenotypic, behavioural and sensorimotor characteristics (Rogers et al. 1997). Of note,
BERP-/- mice had decreased body weight (21.7g±0.7 vs. 24.3g±0.4; p<0.0001, Student's t-
test) and body length (93.4mm±0.5 vs. 95.6mm±0.6; p<0.05, Student's t-test) relative to
wild-type controls (Figure 11). No other significant differences between the genotypes were
seen in the rest of the SHIRPA screen.

78
Figure 11. SHIRPA neurological assessment for body weight in BERP-deficient mice.
(A) and body length (B) in BERP+/+ (yellow bars) and BERP-/- (blue bars) mice. Results
shown are the means of 9 BERP+/+ and 12 BERP-/- mice; error bars represent 1 SEM.
*p<0.05 and ***p<0.001, Student's t-test.

79

80
3.3.2.2 BERP-/- mice exhibit increased freezing in fear conditioning tests
Fear conditioning is used to determine a subject's fear-driven learning ability. In the
contextual test, the subject is placed into a chamber and observed for fear as measured by the
amount of freezing behaviour; freezing is defined as the absence of all observable movement
except respiration. The subject then undergoes a single conditioning session in which a 30-
second neutral tone (the auditory cue/conditioned stimulus, CS) is paired with a 2-second
foot-shock (the unconditioned stimulus, US) that co-terminates with the tone. After 24 hours
the subject is placed into the same conditioning chamber and its fear response is measured.
Contextual fear conditioning relies on hippocampus and amygdala-dependent memory
(Anagnostaras et al. 2001), and measures the ability of subjects to form a negative association
between the contextual cues of the conditioning chamber and the unconditioned stimulus. In
the cued test, 24 hours after undergoing the conditioning session, the subject is placed into an
altered version of the chamber (in which the visual, auditory, olfactory, and tactile contextual
cues have been changed) during which time the neutral tone (the auditory cue/conditioned
stimulus) from the previous day's conditioning session is played; fear response is measured
before and after the presentation of the tone. Cued fear conditioning is amygdala-dependent
(Anagnostaras et al. 2001), and measures the ability of subjects to form a negative association
between the auditory cue of the conditioned stimulus and the unconditioned stimulus.
Baseline measurements show a slight increase in freezing in BERP-/- mice compared to
BERP+/+ mice (Figure 12, baseline); however, this was not statistically significant. In the
context test, BERP-/- mice exhibited significantly increased freezing in response to the
conditioning context compared to wild-type controls (45.4%±3.8 for BERP-/- vs. 23.2%±4.0
for BERP+/+; p<0.01, Student's t-test; Figure 12, 24hour context). In the cued test, BERP-/-
81
exhibited increased freezing in response to the conditioned stimulus compared to wild-type
controls (56.6%±5.9 for BERP-/- vs. 31.9%±5.6 for BERP+/+; p<0.01, Student's t-test;
Figure 12, post-CS). Interestingly, BERP-/- mice also exhibited increased freezing prior to the
presentation of the conditioned stimulus during the cued fear test (11.4%±1.9 for BERP-/- vs.
1.6%±0.5 for BERP+/+; p<0.01; Student's t-test; Figure 12, pre-CS). These data suggest that
BERP-/- mice have enhanced contextual and cued fear conditioning compared to wild-type
controls. The enhanced freezing of the BERP-/- mice to the altered context (pre-CS) but not
at baseline, raises the possibility that after the conditioning session, BERP-/- mice retained a
higher level of fear and anxiety leading to increased freezing even during the pre-CS phase of
the cued test.

82
Figure 12. Fear conditioning in BERP-deficient mice. (A) Contextual fear conditioning
test showing the amount of freezing for BERP+/+ (yellow bars) and BERP-/- (blue bars) mice
with no stimulus (baseline), and with being placed in the same environment 24 hours after
receiving a tone/shock trial (24 hour context). (B) Cued fear conditioning test showing the
amount of freezing for BERP+/+ (yellow bars) and BERP-/- (blue bars) mice when placed in
an altered environment 24 hours after receiving a tone/shock trial (pre-CS), and when being
presented with a tone while in the altered environment (post-CS). Results shown are means
from 9 BERP+/+ and 12 BERP-/- mice; error bars represent 1 SEM. **p<0.01, Student's t-
test.

83
84
3.3.2.3 BERP-/- mice exhibit abnormalities in the open field test forexploration and general locomotion; however, no effect of BERP isseen in the elevated plus maze test
The open-field and elevated plus maze tests were used to assess anxiety in the mice. In the
open-field test, which is used to assess the response to being placed in a novel, open
environment, fewer entries into the centre zone, decreased time spent in the centre zone,
increased time spent in the border zone and fewer number of rearings are all parameters
indicative of increased anxiety. These parameters are all measured during the first five
minutes of the subject being placed in the open-field because it represents the period of
greatest anxiety (see Materials and Methods). In the elevated plus maze test, increased
anxiety is manifested by a decrease in the amount of time spent in the open arms and an
increase in the amount of time spent in the closed arms. Results show that during the open-
field test (Figure 13), BERP-/- mice had fewer numbers of rearing (22.3±2.2 for BERP-/- vs.
32.0±3.6 for BERP+/+; p<0.05, Student's t-test; Figure 13C), and chose to spend more time
in the border zone (1435s±26 for BERP-/- vs. 1306s±29 for BERP+/+; p<0.01, Student's t-
test; Figure 13B). However, there was no difference between the genotypes for the length of
time spent in the centre zone or the number of entries into the centre zone (Figures 13A and
13D). Although BERP-/- mice seemed to spend slightly less time in the open arms of the
elevated plus maze than wild-type controls (Figure 14), this difference was not statistically
significant (p=0.18). Overall horizontal (Figure 15A) and vertical (Figure 15B) activity did
not differ between BERP-/- and BERP+/+ mice suggesting that there is no effect of genotype
on general locomotor activity. However, in the first five minutes of the test, which represents
the time of greatest anxiety, there was a significant decrease in vertical activity for BERP-/-
mice compared to wild-type controls 40.3±6.0 for BERP-/- vs. 75.8±9.8 for BERP+/+;

85
p<0.01, Student's t-test; Figure 15B). This supports the decreased number of rearings seen in
the BERP-/- mice and is another parameter indicative of increased anxiety. Taken together,
these data suggest that the BERP-/- mice are slightly more anxious than wild-type controls.

86
Figure 13. Open field exploration in BERP-deficient mice. (A) Time spent in the centre
zone. (B) Time spent in the border zone. (C) Number of rearings. (D) Number of entries
into centre zone. Results shown are the means for 9 BERP+/+ (yellow bars) and 12 BERP-/-
mice (blue bars); error bars represent 1 SEM. *p<0.05 and **p<0.01, Student's t-test.
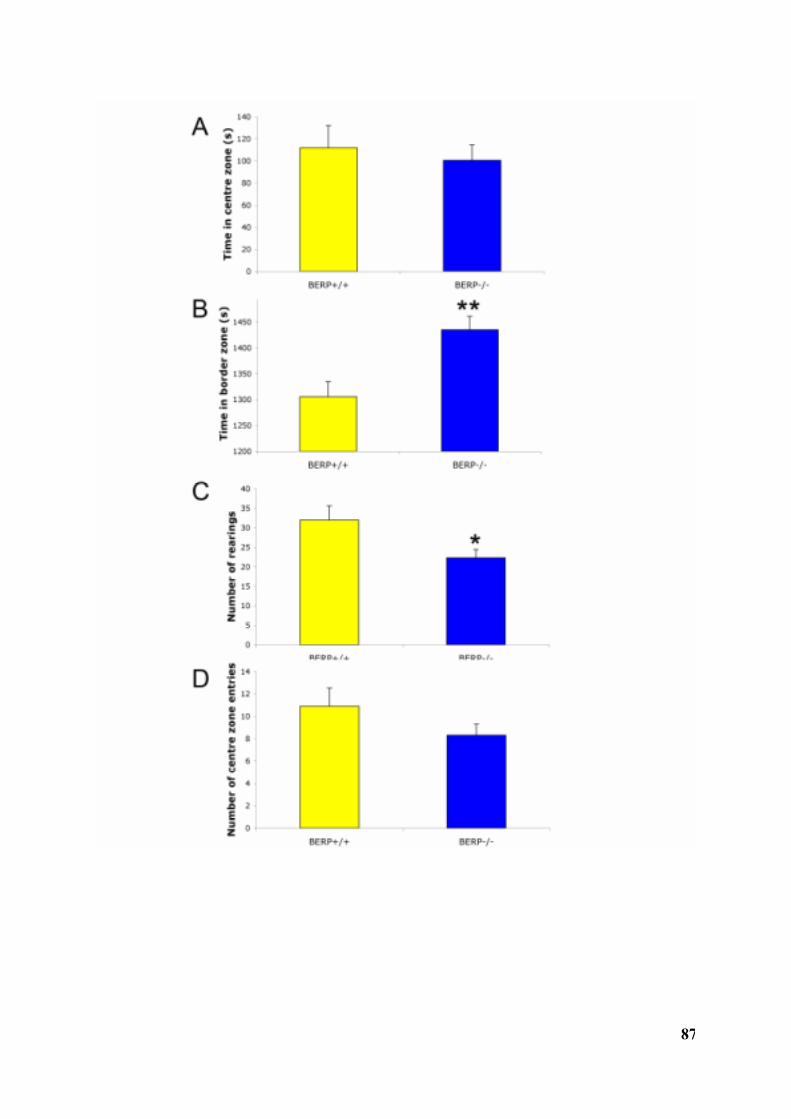
87

88
Figure 14. Elevated plus maze test in BERP-deficient mice. (A) Percentage of time spent
on open arms. (B) Percentage of time spent on closed arms. (C) Total number of entrances.
Results shown are the means for 9 BERP+/+ (yellow bars) and 12 BERP-/- mice (blue bars);
error bars represent 1 SEM.

89

90
Figure 15. General locomotor activity in BERP-deficient mice. (A) Horizontal activity
as measured by the number of beam breaks. (B) Vertical activity as measured by the number
of beam breaks. Results shown are the means for 9 BERP+/+ and 12 BERP-/- mice; error
bars represent 1 SEM. Yellow denotes BERP+/+ values; blue denotes BERP-/- values.
**p<0.01, Student's t-test.

91
92
3.3.2.4 BERP-/- mice exhibit abnormalities in the accelerating rotarod test
BERP-/- mice were deficient in rotarod test for motor coordination (Figure 16) compared to
wild-type controls (p<0.05 for days 1 and 3; p<0.01 for day 2, Student’s t-test). This effect
was present in all 3 days of the test. Of note is the fact that despite consistently falling off
the rotarod faster than wild-type controls, BERP-/- mice appear to improve each day, which
suggests that they may have the capacity for ongoing motor learning. This is in contrast to
the wild-type controls, which showed an improvement from day 1 to day 2, but no
improvement from day 2 to day 3.

93
Figure 16. Accelerating rotarod test in BERP-deficient mice. Results shown are the
mean latencies to fall of three trials for the indicated test days in 9 BERP+/+ (yellow graph)
and 12 BERP-/- mice (blue graph); error bars represent 1 SEM. *p<0.05 and **p<0.01,
Student's t-test.

94

95
3.3.2.5 No effect of BERP in tests for sensorimotor gating
Sensorimotor gating was assessed by measuring prepulse inhibition (PPI) of the acoustic
startle response (ASR). In this test, the ability of a prepulse to inhibit the acoustic startle
response is measured. Patients with schizophrenia often show deficits in PPI compared to
control subjects and so a deficit in PPI can be used as a test for psychosis in mice (Braff and
Geyer 1990). There was no significant difference in acoustic startle response between the
two genotypes (Figure 17A). Although not statistically significant, there was a trend that the
prepulse inhibition was decreased in BERP-/- mice for all three (69dB, 73dB, 81dB) prepulse
sound levels (Figure 17B).

96
Figure 17. Prepulse inhibition of the acoustic startle response in BERP-deficient mice.
Acoustic startle response (A) and prepulse inhibition of acoustic startle response (B) at the
indicated prepulse sound levels in BERP-/- (blue bars) and BERP+/+ (yellow bars) mice.
Results shown are means from 9 BERP+/+ and 12 BERP-/- mices; error bars represent 1
SEM.

97

98
3.3.2.6 No effect of BERP in tail suspension test (depression-relatedbehaviour).
The tail suspension test is a widely used model for assessing depression-like behaviour in
mice. As shown in (Figure 18), no difference was seen in the tail suspension test between
BERP+/+ and BERP-/- mice; this suggests that BERP does not play a role in depression-like
behaviour.

99
Figure 18. Tail suspension test in BERP-deficient mice. Tail suspension test illustrating
the total duration of immobility for BERP+/+ (yellow bar) and BERP-/- (blue bar). Results
shown are means of 9 BERP+/+ and 12 BERP-/- mice; error bars represent 1 SEM.

100
101
3.3.2.7 No effect of BERP in grip test (neuromuscular function)
There was no difference in the grip test between BERP-/- and BERP+/+ mice. This suggests
that neuromuscular function and muscle strength are normal in BERP-/- mice compared to
wild-type controls (data not shown).
3.3.2.8 No effect of BERP in tail flick test (nociception)
No difference was seen in the tail flick test between BERP-/- and BERP+/+ mice. This
suggests that sensitivity to pain is normal in BERP-/- mice compared to wild-type controls
(data not shown).
3.3.3 Increased resistance to PTZ-induced seizures in Berp-/- mice
Since BERP was shown to be upregulated in the brains of mice subjected to injections of the
chemoconvulsant PTZ, we decided to examine susceptibility to PTZ-induced seizures in
BERP-deficient mice. Injection of PTZ elicits a constellation of sequence-specific behavioural
seizure responses. Susceptibility to PTZ-induced seizures can be measured semi-
quantitatively by documenting the presence and progression of seizure responses during a
defined observation period. A more quantitative measure of susceptibility may be derived
from the latency to specific seizure response endpoints. Our initial tests were performed in
mice of mixed (129Ola x C57BL/6) genetic background in order to determine if further testing
was warranted. Male mice 8-12 weeks of age were treated with 45mg/kg of the
chemoconvulsant PTZ via intraperitoneal injection and observed over a period of 60 minutes
for the occurrence of a generalized seizure (which was defined in the methods section); the
observer was blinded to the genotypes of the test subjects. Results show that 67% of wild-

102
type mice (n=36) and 51% of BERP-/- mice (n=33) experienced generalized seizures (p=0.2,
chi square) (Figure 19A). Although not statistically significant, the data indicated the
presence of a biological trend suggesting that BERP-/- mice may be more resistant to PTZ-
induced seizures compared to wild-type controls. Several factors made these initial tests less
than ideal: the mixed genetic background of the mice, the inability to provide a consistently
uniform testing environment, and the use of intraperitoneal injections, which while easier to
administer, is more variable in its effects. Therefore, to test whether BERP-/- mice indeed
exhibit increased resistance to PTZ-induced seizures, we backcrossed the mice 6 generations
onto a C57BL/6 genetic background and repeated the experiments in a specialized testing
facility using multiple doses of PTZ delivered via subcutaneous injection (see Materials and
Methods for details). At 60mg/kg, there was a significant decrease in the proportion of
BERP-/- mice that exhibited generalized seizures compared to wild-type controls (9 of 13 for
BERP-/- vs. 15 of 15 for BERP+/+; p<0.05 Fisher's exact test and Chi square) (Figure 19F).
The difference in mean latencies to generalized seizure for BERP-/- vs. BERP+/+ mice was
also statistically significant (p<0.05, Student's t-test) at this dose (Figure 19C). Although
results for the other doses did not reach statistical significance, the data trends indicate that in
general, BERP-/- were more resistant to PTZ-induced seizures compared to wild-type
controls. For each dose, the proportion of knockout mice that experienced seizure activity
was consistently lower than wild-type controls; this was true for partial, generalized and
maximal seizures. Similarly, the latency to each seizure type was consistently longer in
BERP-/- mice than wild-type controls. Taken together, these results suggest that BERP-
deficient mice are more resistant to PTZ-induced seizures compared to wild-type controls.

103
Figure 19. PTZ seizure susceptibility testing in BERP-deficient mice. Unless otherwise
specified, all mice were 8-12 week old males backcrossed 6 generations onto a C57BL/6
genetic background; PTZ at the indicated doses was administered by subcutaneous injection
after which the mice were monitored for a period of 3600s. Blue bar/lines, BERP-/- mice.
Yellow bar/lines, BERP+/+ mice. (A) Proportion of mixed genetic background (129Ola x
C57BL/6) BERP+/+ (n=36) and BERP -/- (n=33) mice exhibiting generalized seizure in
response to 45mg/kg of PTZ by intraperitoneal injection. (B-D) Latencies to PTZ-induced
partial seizures (PS - panel B), generalized seizures (GS - panel C), and maximal seizures (MS
- panel D) in BERP+/+ and BERP -/- mice. PTZ was administered at doses of 40mg/kg (n=21
for BERP+/+, n=19 for BERP-/-), 60mg/kg (n=15 for BERP+/+, n=13 for BERP-/-), 80mg/kg
(n=11 for BERP+/+, n=9 for BERP-/-), 90mg/kg (n=10 for BERP+/+, n=10 for BERP-/-), and
100mg/kg (n=7 for BERP +/+, n=7 for BERP-/-). Each data point represents the mean from
the indicated number of BERP+/+ and BERP-/- mice; error bars are 1 SEM. PS, partial
seizure. GS, generalized seizure. MS, maximal seizure. *p<0.05, Student's t-test. (E-G)
Dose response curves for PTZ-induced partial seizures (panel E), generalized seizures (panel
F), and maximal seizures (panel G) in BERP+/+ and BERP -/- mice. PTZ was administered at
doses of 40mg/kg (n=21 for BERP+/+, n=19 for BERP-/-), 60mg/kg (n=15 for BERP+/+,
n=13 for BERP-/-), 80mg/kg (n=11 for BERP+/+, n=9 for BERP-/-), 90mg/kg (n=10 for
BERP+/+, n=10 for BERP-/-), and 100mg/kg (n=7 for BERP +/+, n=7 for BERP-/-). Each
data point represents the percentage of mice exhibiting partial, generalized, or maximal
seizures at the indicated dose of PTZ. *p<0.05, Fisher's exact test and Chi square.
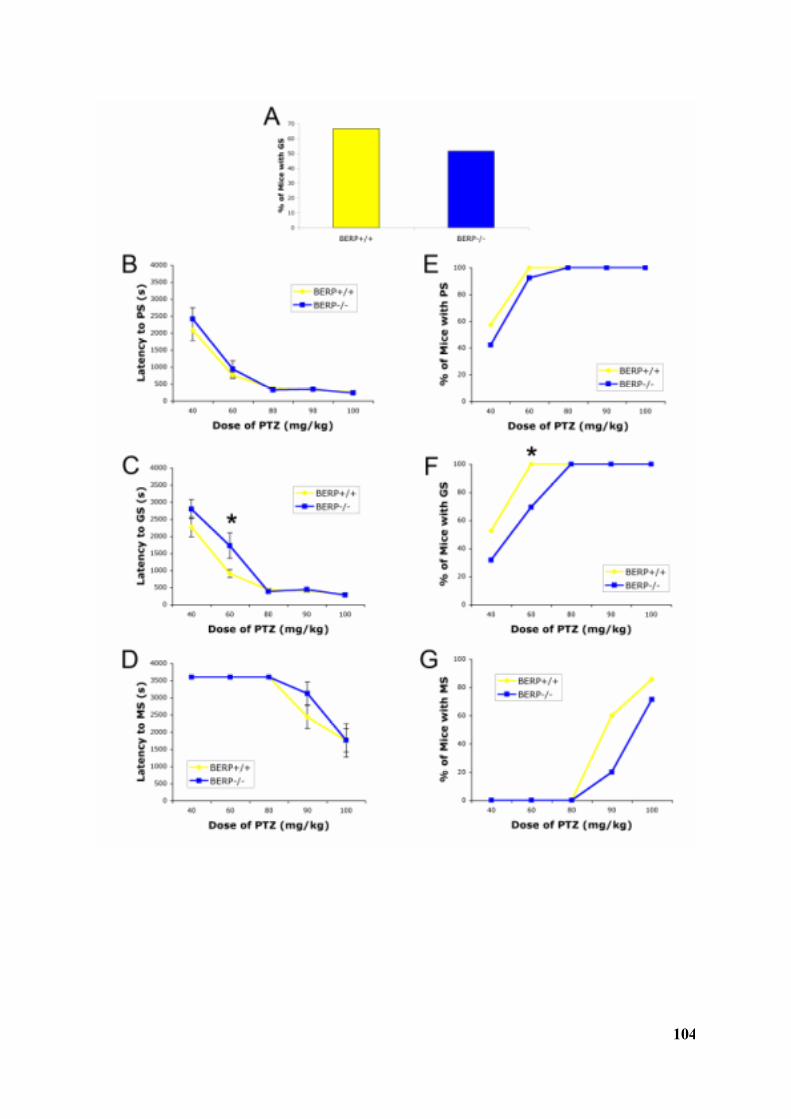
104

105
3.3.4 The amplitude of mIPSCs is decreased in BERP-/- mice
Recording mIPSCs allows us to assess abnormalities in the function of ionotropic GABA-
mediated synaptic transmission. In general, changes in the frequency and amplitude of mean
mIPSCs are correlated with presynpatic (neurotransmitter release) and postsynpatic
(neuroreceptor function) factors, respectively. Since PTZ is an antagonist of GABAAR
signaling and our data indicate that BERP-deficient mice show increased resistance to PTZ-
induced seizures, we decided to examine whether BERP may be related to GABAAR
function. In order to determine whether BERP plays a role in GABAergic synaptic
transmission, we examined GABAAR-mediated mIPSCs using whole cell, patch-clamp
electrophysiology. To record mIPSCs from neurons of brain slices prepared from BERP+/+
and BERP-/- mice, NBQX (an AMPA/kainate receptor antagonist), D-APV (an NMDA
receptor antagonist) and TTX (a Na+ channel blocker) were applied to the external solution.
Results show that the mean mIPSC amplitude is reduced in BERP-/- mice compared with
BERP+/+ mice (Figure 20D, right). No difference was seen in the mean mIPSC frequency
between the two genotypes (Figure 20D, left). Since it has been suggested that changes in the
amplitude of mIPSCs are mediated by the number of postsynaptic GABAARs (Nusser et al.
1997), our data suggest that BERP-/- mice have fewer GABAARs compared with wild-type
controls.

106
Figure 20. Electrophysiological measurements in BERP-deficient mice.
(A) Representative mIPSCs traces recorded from BERP+/+ (top) and BERP-/- mice (bottom).
(B) An example of averaged mIPSC from BERP+/+ (n=1899 events, left) and BERP-/- mice
(n=3122 event, right). (C) Cumulative probability plots of mIPSC peak amplitude (bin size
0.5 pA). The mIPSC amplitude distribution significantly shifted towards smaller values in
BERP-/- mice than BERP+/+ mice (p < 0.001, Kolmogorov-Smirnov test). (D) Mean
mIPSCs frequency (left) and amplitude (right) in BERP-/- mice compared to BERP+/+ mice.
Data shown are the means from 11 BERP+/+ and 13 BERP-/- mice; error bars represent 1
SEM. **p <0.01, Student’s t-test.

107

108
3.3.5 Decreased surface expression of GABAAR gamma2 subunit inBERP-/- mice
To determine whether BERP plays a role in the number of surface GABAARs present in the
brain, we performed biotinylation assays on cortical neuron cultures from BERP+/+,
BERP+/-, and BERP-/- embryos. This was followed by Western blot analyses for the
gamma2 subunit of the GABAAR. Results show that cell surface expression of GABAARs
is decreased in BERP-/- mice compared to BERP+/+ and BERP+/- mice (Figure 21). In
addition, probing with anti-GluR2 antibody showed no change in expression between BERP
wild-type, heterozygous and knockout mice, suggesting that BERP is not involved in
regulating the number of surface glutamate receptors.

109
Figure 21. GABA A receptor expression in BERP-deficient mice. (A) Western blot
analysis of biotinylated surface proteins extracted from pooled cortical neuron cultures of day
17.5 BERP +/+, BERP +/-, BERP -/- embryos. Results shown are a single trial representative
of 4 independent experiments, probed with anti-GABA-A-receptor-gamma-2 (Gamma2) and
anti-ionotropic-Glutamate-receptor-2 (GluR2) antibodies. (B) Densitometry analysis of
surface GABA A receptor gamma 2 subunit expression in cortical neuron cultures from BERP
+/+, BERP+/- and BERP -/- embryos (day 17.5). Results shown are the means of 4
independent experiments; error bars represent 1 SEM. **p<0.01, Student’s t-test. (C) Real-
time RT-PCR analysis of GABA A receptor expression in BERP+/+ and BERP-/- embryos.
Real-time RT-PCR was performed on RNA extracted from the brains of day 17.5 BERP+/+
and BERP-/- embryos in order to determine the relative expression levels of GABA A
receptor (gamma subunit) mRNA. Results shown are the means from 17 wild-type and 19
knockout embryos performed in triplicate; error bars represent 1 SEM. Values were
normalized to HPRT1 and expressed relative to wild-type controls.

110

111
3.3.6 GABA A receptor gamma2 subunit mRNA levels are unchanged inBERP-/- mice
To determine whether mRNA levels of GABA A receptor gamma2 subunit is decreased in
BERP-/- mice, we performed real time RT-PCR on RNA extracted from the brains of day
17.5 embryos (Figure 21C). Results show similar expression levels of GABAARg2 mRNA
in BERP+/+ and BERP-/- embryos, suggesting that the decrease in GABAAR surface protein
expression seen in BERP-/- neurons is a post-transcriptional phenomenon.
3.3.7 Cortical neurons from BERP-/- embryos show an increase in totalneurite length
In order to determine whether BERP plays a role in neuronal proliferation, a neurite
outgrowth assay was performed using cortical neurons isolated from day 17.5 embryos. Cells
were plated and allowed to proliferate for 18 hours (48 and 72 hours) before being fixed,
stained (MAP2) and analyzed for total neurite length. Measurements of neurites were made
using DIC. The MAP2 staining confirmed the neuronal identity of each neurite measured.
Measurements were made at later time points (48 and 72 hours) but by this time neurites
were too long and of rather convoluted morphology to be accurately assessed. Results
showed that BERP -/- neurons have a greater average total neurite length compared to
wildtype controls (15.28 µm ± 1.45 vs. 19.65 µm ± 0.65, p<0.05, Student’s t-test) (Figure
22). Although the difference is small, it is statistically significant at a 5% confidence limit. It
is also clear from these data that BERP deficiency was not a detriment or inhibitor of cortical
cell growth in culture.

112
Figure 22. Neurite outgrowth measurements in BERP-deficient mice.
(A) Representative images of BERP +/+ (left panel) and BERP -/- (right panel) cortical
neurons derived from day 17.5 embryos at 18h after plating. Cells were stained for MAP2
(not visible) and imaged/measured using DIC optics (see text). Neurites were colour-marked
and tagged once measured to avoid duplication. Scale bar: 40mm. (B) Graphical
representation of the neurite outgrowth assay showing the mean total neurite length for BERP
+/+ (yellow column) and BERP -/- (blue column) neurons. Results shown are the means of
three independent experiments with at least 5 animals of each genotype; error bars represent 1
SEM. *p<0.05 (Student's t-test).

113

114
3.3.8 BERP-deficiency has no impact on the self-renewal, differentiation,proliferation, viability and size of murine neural stem cells
In order to determine whether BERP plays a role in neural stem cell biology, we isolated
neural stem cells from the subventricular zone (SVZ) of the lateral ventricles of wild-type and
BERP-/- mice and examined their self-renewal capacity, proliferation, size, viability, and
differentiation potential. p53 has been shown to be a negative regulator of neural stem cell
self-renewal (Meletis et al. 2006) and since our laboratory has identified BERP as a possible
novel p53 interacter, we decided to also isolate neural stem cells from p53-/- and
BERP-/-;p53-/- double mutant mice for our studies. Results from neurosphere formation
assays (Figure 23A) indicate that neural stem cells derived from BERP-/- mice showed no
difference in self-renewal capacity compared to wild-type controls. Neural stem cells derived
from p53-/- mice showed an increase in self-renewal capacity compared to wild-type
controls, which supports the findings of Meletis et al. (2006). Neural stem cells from BERP-
/-;p53-/- double knockout mice also showed an increase in self-renewal capacity compared to
wild-type controls; however, no significant difference was seen when compared to p53-/-
mice. The proliferative capacity of dissociated stem cells was determined by thymidine
uptake (Figure 23B). Neural stem cells derived from BERP-/- mice showed no difference in
thymidine incorporation compared to wild-type controls. Neural stem cells derived from
both p53-/- and BERP-/-;p53-/- mice showed increased proliferative capacity compared to
wild-type controls; however, no significant difference was seen between cells derived from
p53-/- mice and those derived from BERP-/-;p53-/- mice. No difference in cell diameter
(Figure 23C) or viability (Figure 23D) was detected for any of the knockout mice compared
to wild-type controls. No significant difference in neuronal differentiation potential was seen

115
in neural stem cells derived from any of the genotypes compared to wild-type controls
(Figure 23E). Thus, BERP-deficiency has no impact on the self-renewal, differentiation,
proliferation, viability and size of murine neural stem cells derived from the SVZ.

116
Figure 23. Analysis of neural stem cells in BERP-deficient and p53-deficient mice. For
all panels, yellow bar = wild-type (WT); blue bar = BERP-/-; pink bar = p53-/-; green bar =
BERP-/-;p53-/-. (A) Neurosphere formation assay. Results shown are the average number of
secondary neurospheres per well relative to wild-type controls for each genotype (n=8 for
WT; n=7 for BERP-/-; n= 7 for p53-/-; n= 6 for BERP-/-;p53-/-); error bars represent 1 SEM.
*p<0.05 and **p<0.01, Student’s t-test. (B) Thymidine incorporation assay for dissociated
neural stem/progenitor cells from secondary neurospheres Results shown are the mean
thymidine uptake at 92h after plating for each genotype (n=7 for WT; n=7 for BERP-/-; n= 5
for p53-/-; n= 5 for BERP-/-;p53-.-) from 4 independent experiments each performed in
triplicate; error bars represent 1 SEM. *p<0.05 and **p<0.01, Student’s t-test. (C) Cell
viability assay. Secondary neurospheres were dissociated into single cells and viability was
determined using trypan blue exclusion. Results shown are the mean number of viable cells
expressed as a percent of total cell number for each genotype (n=5 for WT; n=4 for BERP-/-;
n= 6 for p53-/-; n= 6 for BERP-/-;p53-/-); error bars represent 1 SEM. (D) Cell size
determination. Results shown are the mean diameter (µm) of viable cells from dissociated
secondary neurospheres for each genotype (n=5 for WT; n=4 for BERP-/-; n= 6 for p53-/-;
n= 6 for BERP-/-;p53-.-); error bars represent 1 SEM. (E) Neurosphere differentiation assay.
Results shown are the proportion of _-III-tubulin positive cells (neurons) in secondary
neurospheres from each genotype (n=3 for WT; n=3 for BERP-/-; n=4 for p53-/-; n=3 for
BERP-/-;p53-/-); error bars represent 1 SEM. (F) Photomicrograph depicting an example of
beta-III-tubulin positive (arrowhead) and GFAP+ (arrow) cells from a differentiated
neurosphere.

117
118
4 Discussion
4.1 What is the neurological phenotype of BERP-deficient mice?
BERP-/- mice are viable indicating that BERP is dispensable for normal development (Figure
10). In post-natal mice, BERP is highly expressed in the brain, especially in the cerebellum
and hippocampus. BERP-/- mice survived to maturity, were able to breed, and their brains
appear morphologically normal compared to wild-type controls. However, the fact that no
obvious morphological abnormalities were identified by gross and histological examiniation
does not preclude the possibility of neurological dysfunction. Therefore, we performed a
battery of tests in a cohort of BERP-deficient and BERP wild-type mice in order to assess
possible abnormalities in neurological function.
BERP-deficient mice exhibit enhanced learning ability
This was seen in fear conditioning tests as well as the accelerating rotarod test. In both the 24
hour context (which is hippocampus and amygdala-dependent) and cued (which is only
amygdala-dependent) fear conditioning tests, BERP-deficient mice exhibited increased
freezing behaviour (Figure 12). The possibility that pain perception may impact these results
was eliminated with the tail flick test that showed no effect of genotype on nociception
(section 3.3.2.8). A difference in hearing ability was also eliminated as a possible confounding
factor since no effect of genotype was seen in the acoustic startle response (Figure 17A). In
the rotarod test, BERP-deficient mice showed improvement in performance (as determined by
latency to fall) from day 1 to day 2 as well as from day 2 to day 3. In contrast, BERP wild-
type mice showed improvement only between day 1 and day 2; no further improvement was

119
seen between day 2 and day 3 (Figure 16). It would be interesting to see whether with
continued testing, the BERP-deficient mice would be able to surpass the wild-type controls in
their ability to remain on the rotarod. These results suggest that BERP may be involved in
more than one type of learning: hippocampus and amygdala-dependent fear learning, as well
as motor learning. It also suggests that BERP is a negative regulator of these processes and
that removing BERP somehow enhances learning and memory.
BERP-deficient mice are more fearful and anxious
Factors that support increased anxiety in BERP-deficient mice include more time spent in the
border zone, fewer numbers of rearings, and decreased vertical activity during the first 5
minute period in the open field test (Figures 13B, 13C, 15B). An additional supporting factor
can be found in the cued fear conditioning test (Figure 12). No significant difference in
freezing between BERP-deficient and BERP wild-type mice was seen at baseline. However,
during the cued test, BERP-deficient mice showed increase freezing in the altered context
prior to the presentation of the conditioned stimulus. This would support a generally
heightened sense of fear in the BERP-deficient mice after receiving a foot shock due to a
general increase in anxiety. Factors that do not support an interpretation of increased anxiety
in BERP-deficient mice include no difference the time spent in the centre zone and in the
number of entries into the centre zone of the open field test (Figures 13A and 13D), and no
difference in the elevated plus maze test (Figure 14). Taken together, these results suggest
that BERP likely plays a role mediating anxiety-like behaviour.

120
BERP-deficient mice have decreased motor coordination
This was well demonstrated in the accelerating rotarod test where BERP-deficient mice had
shorter latencies to fall compared to wild-type controls (Figure 16). A difference in muscle
strength was eliminated as a possible cause of the rotarod deficit since no effect of genotype
was seen in the grip test for muscle strength (section 3.3.2.7). This suggests that the decrease
motor coordination exhibited by BERP-deficient mice is likely cerebellar in origin.
BERP-deficient mice have increased resistance to PTZ-induced seizures
This trend was seen for all seizures types both in the proportion of mice succumbing to
seizures and in the latency to seizure (Figure 19). In addition, both these readout parameters
reached statistical significance for generalized seizures at a dose of 60mg/kg. This suggests
that BERP likely plays a role in epileptogenesis.
BERP-deficient mice may have decreased prepulse inhibiition of the acoustic startle reflex
The tendency for BERP-deficient mice to have decreased prepulse inhibition was seen at all
three prepulse sound levels (Figure 17B). Since the responses to the acoustic startle were
very similar between the two genotypes (Figure 17A), it is unlikely that issues involving
hearing impairment would confound the results. Therefore, this raises the possibility that
although the differences did not reach statistical significance, the observed tendencies may
have physiological significance. In light of the PTZ data supporting the increased resistance
to seizures, it is not surprising to find that the level of arousal in BERP-deficient mice is
lower than that found in the wild-type mice.
121
In summary, we find that BERP-deficient mice exhibit enhanced learning ability, increased
fear and anxiety, impaired coordination, increased resistance to PTZ-induced seizures, and
possibly decreased prepulse inhibition of the acoustic startle reflex compared to wild-type
controls.
In light of these findings, future experiments using BERP-deficient mice may offer additional
illumination on the molecular basis of, for example, learning and memory. Results from both
the fear conditioning and accelerating rotarod tests suggest that BERP-deficient mice exhibit
enhanced abilities in emotional and motor forms of learning/memory. This implies that BERP
is a negative regulator of these processes and that removing BERP somehow enhances learning
and memory. Further exploration of BERP's role in this area can be pursued by examining
whether other components of memory (spatial, working, and reference) is also affected in
BERP-deficient mice. The biological basis for learning/memory formation in BERP-deficient
mice can be examined by studying synaptic plasticity, the ability to increase or decrease the
strength of synaptic connections, which can be demonstrated experimentally as long term
potentiation (LTP) and long term depression (LTD) in the classic hippocampal and cerebellar
paradigms, respectively. Therefore, a further dissection of BERP's role in memory formation
and retention can be pursued by examining whether LTP or LTD is enhanced in hippocampal
and cerebellar brain slice preparations derived from BERP-deficient and BERP wild-type
mice.
Interestingly, the regulation of emotions such as fear and anxiety has been shown to involve
the cerebral cortex, hippocampus, amygdala, and cerebellum (Schutter and van Honk 2005),
all areas that have high levels of BERP expression. As well, there is evidence indicating that

122
those suffering from posttraumatic stress disorder have decreased hippocampal volume due to
the loss of dentrites (Radley et al. 2004; Bonne et al. 2008). Therefore, it would be
interesting to more closely examine the neuronal architecture of these structures in BERP-
deficient mice using Golgi staining of 100µm-thick brain sections. This is especially true
since the “classic” dendritic arbour architecture of the cerebellum lends itself quite well to the
examination by Golgi staining and any differences will likely reveal itself most easily in this
area of the brain.
4.2 Invoking Occam's razor: The BERP-deficient mouse as amodel for non-ataxic cerebellar dysfunction?
In discussing the phenotypic findings of the BERP-deficient mice, we will first take a
structure-function approach in this section, followed by a molecular approach in the next
section.
The neurological phenotype of the BERP-/- mice suggests the possibility of functional
abnormalities involving the hippocampus, amygdala, and cerebellum (Figure 24). This would
certainly make sense given that within the brain, BERP is highly expressed in these areas. If
we adopt the traditional view that the cerebellum is involved in motor coordination while the
hippocampus and amygdala (which form part of the limbic system) are involved in memory
formation and emotional responses, then the neurological phenotype of BERP-deficient mice
can mostly be linked to dysfunction these areas of the brain (Bear et al. 2001). The enhanced
fear/fear-driven learning and anxiety can quite easily be attributed to the
hippocampus/amygdala areas of the brain. Although the problem of understanding the true
nature of epileptogenesis is far from resolved, sclerosis (scarring) of the hippocampus is often

123
associated with temporal lobe epilepsy (TLE), and patients with poorly controlled TLE often
benefit from surgical removal of temporal lobe structures including the hippocampus and
amygdala (Parrent and Lozano 2000; Blumcke et al. 2002). In addition, abnormalities of the
limbic system are also commonly thought to be involved in schizophrenia (Goldman and
Mitchell 2004). This leaves the cerebellum as the source of dysfunction for the impaired
performance of the BERP-deficient mice in the accelerating rotarod test. This interpretation
could leave us with the very reasonable assertion that BERP-deficient mice exhibit
phenotypic traits consistent with functional abnormalities of the hippocampus, amygdala,
and cerebellum.

124
Figure 24. Neuroanatomical structures. Select anatomical structures within the human
brain. Please refer to text for details. Adapted from the American Health Assistance
Foundation (source: http://www.ahaf.org/alzheimers/about/understanding/anatomy-of-the-
brain.html).

125

126
However, an alternative interpretation can also be made that ties all of these findings to the
cerebellum. According to long-standing tradition, the cerebellum is primarily thought to be
involved in movement, coordination and motor learning. However, in recent years, there is
mounting evidence that support an expanded role for the cerebellum. It is now implicated in
emotional/cognitive processes such as the formation of fear-memories, which were
traditionally thought to reside primarily within the limbic structures (Sacchetti et al. 2002).
Cerebellar abnormalities are present in neuropsychiatric disorders including anxiety,
schizophrenia and autism (Schutter and van Honk 2005; Andreasen and Pierson 2008).
Patients with epilepsy often have cerebellar atrophy; whether this is due to recurrent
seizures, longterm anticonvulsant therapy, or other factors is unclear. However, stimulation
of the cerebellum has the ability to stop seizure activity suggesting a role for the cerebellum in
modulating seizures (Velasco et al. 2005). So while many reported instances of cerebellar
dysfunction involve some degree of motor abnormality such as ataxia or tremor, the absence
of such findings does not exclude the possibility of cerebellum-based pathophysiology. For
example, there exists also the Cerebellar Cognitive Affective Syndrome (CCAS) that is
characterized by non-motor manifestations (Schmahmann and Sherman 1998) such as deficits
in executive function, cognition, language, and affect. This suggests that a cerebellar-centred
explanation for the observed phenotype in BERP-deficient mice is possible despite the lack
of an overt movement abnormality. In this way, BERP-deficient mice may represent a novel
model system for the study of non-ataxic cerebellar dysfunction.
To answer the question of whether the neurological phenotype seen in the BERP-deficient
mice can be attributed to cerebellar dysfunction (ie. whether the application of Occam's razor

127
is truly appropriate in this case), one could generate a mutant mouse in which loss of BERP
can be anatomically and temporally controlled. This can be accomplished using the Cre/loxP
system in which a BERP conditional knockout mouse would be crossed with one that
expresses a Cre transgene under the transcriptional control of a cerebellum-specific gene
(Sandberg et al. 2000; Suzuki et al. 2004). The addition of an inducible element would
provide further specificity and power to such a system (Tsujita et al. 1999) in that BERP
deficiency could then be introduced in a mature animal. Depending on the results, further
refinement can then be achieved by examining the loss of BERP in other anatomical regions
such as the hippocampus or cortex, either on their own, or in combination with loss of
function in the cerebellum (Tsien et al. 1996; Guo et al. 2000).
4.3 What is the possible role of BERP in the CNS?
In attempting to define a possible molecular role for BERP in the CNS, several pieces of
evidence should be examined. BERP associates with myosin V via its c-terminal domain (El-
Husseini and Vincent 1999). Myosin V has been shown to be involved in the intracellular
trafficking of organelle and receptors (Provance and Mercer 1999; Wang et al. 2008). Both
BERP and myosin V are members of the CART complex, which is involved in the
constitutive recycling of transferrin receptors in HeLa cells (Yan et al. 2005). This raises the
possibility that the CART complex, and therefore BERP, may be involved in the intracellular
trafficking of other cell surface receptors that undergo constitutive endocytosis. Our results
from patch-clamp recordings show decreased mIPSC amplitude in brain slices derived from
BERP-/- compared to wild-type controls (Figure 20). Western blot analyses show decreased
surface expression of gamma2 subunit-containing GABAARs in cultured neurons derived

128
from BERP-/- embryos compared to those from wild-type controls (Figures 21A and 21B).
Taken together, these data suggest BERP-/- mice have decreased GABAAR function in the
brain due to decreased numbers of GABAARs. In addtion, no statistically significant
difference was seen in GABAAR gamma2 subunit mRNA expression from the brains of
BERP-/- embryos compared with wild-type controls (Figure 21C), suggesting that the
decrease in GABAARs is likely a posttranscriptional phenomenon. Therefore, we
hypothesize that BERP is involved in the intracellular trafficking of GABAARs. If the
CART complex (or an analogous structure) exists in neurons and performs a similar function
to the one described for the transferrin receptor, then it would suggest that BERP is involved
in post-endocytic recycling of the GABAAR. BERP was identified as a possible
phosphoprotein in a large-scale analysis of proteins isolated from murine post-synaptic
densities (Trinidad et al. 2006). This suggests that in a phosphorylated state, BERP may
have a synaptic location. At this point however, without further studies examining the
effect(s) of BERP on GABAAR levels/distribution and possible physical interactions
between BERP and components of the GABAAR network, it is premature to try and
precisely place BERP into one of the five stages of the GABAAR lifecycle as described in
section 1.5.3.2.
4.4 Is BERP involved in neurite outgrowth?
Our results from cortical neuron cultures indicate that although the difference is small, neurite
outgrowth is enhanced in neurons derived from BERP-/- murine embryos (Figure 22). Van
Diepen et al. reported that deficiency (via knockdown by double stranded RNA) of L-TRIM,
the molluscan ortholog of mammalian TRIM2 and TRIM3, led to decreased neurite

129
outgrowth in neurons cultured from the snail Lymnaea stagnalis (van Diepen et al. 2005).
This apparent discrepancy may represent differences in neuronal development between snails
and mice. In addition, in vitro knockdown of L-TRIM expression would likely elicit different
compensatory responses than a genetic deletion of TRIM3 present from the earliest stages of
development. In our studies, although neurite outgrowth was enhanced in ex vivo BERP-
deficient neuronal cultures, ultimately, the brains of the fully developed knockout animals
were morphologically indistinguishable from wild-type controls. This suggests that despite a
statistically significant difference in an ex vivo environment, the effect of BERP deficiency on
neurite outgrowth is not biologically significant in vivo. This again supports the importance
of considering biological compensation in the analysis of gene-deletion mutant animals.
4.5 Is BERP a functional homolog of D. melanogaster brat?
Brat is a D. melanogaster tumour suppressor that functions as a translational repressor of
hunchback (Sonoda and Wharton 2001) and as a negative regulator of ribosomal RNA
synthesis (Frank et al. 2002); it is also a negative regulator of self-renewal in Drosophila
neuroblasts (Betschinger et al. 2006). In addition, through the utility of an in vivo genetic
modifier screen, our laboratory determined that brat is a possible novel interacter of
Drosophila p53. Therefore, the identification of a brat mammalian homolog with similar
functions could provide exciting new opportunities to study abnormalities of the nervous
system. Brat belongs to a family of proteins that contain N-terminal zinc-finger and coiled
coil domains with a C-terminal NHL domain (Arama et al. 2000). The mammalian homologs
of brat are the three TRIM-NHL proteins: BERP/TRIM3, NARF/TRIM2, and
HT2A/TRIM32 (Reymond et al. 2001). Homologs can be either orthologs or paralogs (Fitch
130
2000). Orthologs arise from speciation event(s) and likely have similar or analogous
functions. Paralogs arise from duplication event(s) and are less likely to have similar
functions to each other. Therefore, in the search of a mammalian homolog with similar
functions to brat, we employed the best reciprocal hit (BRH) strategy, which is commonly
used by biologists for identifying orthologs to study (Hulsen et al. 2006; Moreno-Hagelsieb
and Latimer 2008). In the BRH method, two cross-species proteins are considered orthologs
if they are each other's top hit using the National Center for Biotechnology Information's
(NCBI) basic local alignment search tool for proteins (BLASTP). In attempting to apply the
BLASTP BRH strategy to determine the mammalian brat ortholog, we encountered an
interesting situation. The top mammalian hit for brat was BERP/TRIM3 followed by
NARF/TRIM2. However, the top Drosophila hit for BERP/TRIM3 was a protein named
abba; brat was second. Therefore, brat does not have a BLASTP BRH partner in mammals.
In this scenario, we instead opted to use the best unidirectional BLASTP hit for brat and thus
chose BERP as the molecule upon which to focus our studies.
In our experiments on neural stem/progenitor cells isolated from BERP-deficient mice, no
effect of genotype on the self-renewal capacity, differentiation, and proliferation was seen
(Figure 23). Neural stem/progenitor cells from p53-deficient mice showed a dramatic
enhancement of self-renewal capacity which supports previously published reports (Meletis
et al. 2006). However, although neural stem/progenitors isolated from BERP-/-;p53-/- double
knockout mice showed a trend towards even greater increases in self-renewal and proliferative
capacity compared to those from p53-/- mice, the difference was not statistically significant
(Figure 23A and 23B). Published reports for NARF/TRIM2 indicate that it plays a role in

131
neurodegeneration, possibly due to the accumulation of neurofilament light chain (Balastik et
al. 2008). A recently published report shows that HT2A/TRIM32, in a mammalian setting,
has very similar functions to brat in that it is able to inhibit cell proliferation, to undergo
asymmetric localization during mitosis, and to negatively regulate the self-renewal capacity of
murine neural stem/progenitor cells (Schwamborn et al. 2009). Therefore, although
experimental methodologies differed, based on the most current information to date, it
appears that of the three mammalian TRIM-NHL proteins, HT2A/TRIM32 has the most
analogous function to D. melanogaster brat and it is likely that these two molecules have an
orthologous relationship. In this context, it would appear that NARF/TRIM2 and
BERP/TRIM3 are likely paralogs of brat.
4.6 Why do knockout mice from the TRIM-NHL family notdevelop brain tumours?
Due to their homology to D. melanogaster brat (brain tumour), the mammalian TRIM-NHL
proteins continue to carry with them the expectation of tumourigenesis. Interestingly though,
none of the TRIM-NHL gene-deficient mice develop malignancies. This raises the possibility
of in vivo compensation with redundant molecules providing the "missing" tumour
suppressor functions. If this compensation is provided for by the other TRIM-NHL
proteins, then it is possible that simultaneous deficiency of more than one family member
may be required reveal a tumourigenic phenotype.
In addition, generated mice lacking a particular gene can have different phenotypes than their
human counterparts. A good example of this phenomenon is the p53 knockout mouse, which

132
tends to develop lymphomas and sarcomas while in humans, p53-deficiencies tend to be
associated with carcinomas.
The timing of loss may also be important; an organism is more likely to be able to compensate
for early germline losses rather than later somatic losses that occur after "roles" and pathways
have already been determined. Such may be the case when comparing the lack of tumours in a
classical knockout mouse to LOH of a particular gene in human tumours. For example, BERP
(as TRIM3) was recently identified as the candidate tumour suppressor gene associated with
LOH of 11p15.5 found in 70 human malignant gliomas (Boulay et al. 2009); however, BERP-
deficient mice do not develop gliomas.
Lastly, in the generation of a classical knockout mouse, unless the size of the targeted locus is
small enough such that it can be entirely replaced/eliminated, then the possibility of residual
protein function should be considered. In keeping with standard and commonly employed
targeting strategies for creating null alleles, the BERP knockout mouse described in this thesis
was generated by replacing most of coding exons 2-5 (half the RING finger, all of the B-box,
coiled coil, and filamin/ABP280 domains) with a neomycin cassette (Figure 9A). In addition,
a stop codon was introduced at the start of exon 2 just after the splice acceptor site. Using a
mouse monoclonal antibody against the N-terminal aspect of BERP (BD Biosciences), the
82kDa band representing BERP was eliminated in the knockout mice (Figure 9C). As with
any gene-targeted mouse, there is always the possibility that any part of the gene not directly
replaced/eliminated by the targeting strategy could end up encoding partial proteins. In this
case, since the NHL domain was not replaced in the targeting strategy, the possibility of a

133
partial protein with residual function can only be eliminated with an antibody capable of
detecting the C-terminus of BERP.
4.7 The p53/BERP /GABAAR relationship - A novel role for p53in the brain?
Riley et al. recently published a comprehensive overview of 129 known p53-regulated genes.
In order to be included in their analysis, a gene had to fulfill at least three of the following four
criteria: 1) "...the presence of a p53RE in the DNA close to or in the gene", 2) "...a
demonstration that the gene is either upregulated or down regulated at the RNA and protein
levels by the activated wild-type p53 protein (but not by the mutant protein)", 3) "...to clone
the p53RE from that gene, place it near a test gene, such as luciferase, and demonstrate that
the p53 protein can regulate the test gene", and 4) "...to use chromatin immunoprecipitation
with a p53-specific antibody to demonstrate the presence of the p53 protein on the RE site in
the DNA" (Riley et al. 2008). Our study of the human BERP genomic locus revealed the
presence of four putative p53RE (Figure 5B). One (BERP site B) is located upstream of exon
1 while the other three (BERP sites E, G, F) are located within intron 1 (Figure 5A). We
show that BERP expression is upregulated after 5FU treatment in the HCT116 cells that
contain wild-type p53 but not in isogenic cells that contain mutant p53 (Figure 7). In
addtion, we show upregulation of BERP expression in the brains of p53+/+ mice but not p53-
/- after PTZ injection (Figure 8). In a luciferase assay, BERP site E was able to support
transcription in the presence of wild-type but not mutant p53 (Figure 6B); a C → A point
mutation at position 4 rendered the site unresponsive to transcription regardless of p53 status
(Figure 6C). A chromatin immunoprecipitation assay using a p53-specific antibody (DO-1)

134
shows that p53 can bind to BERP site E in HCT116 containing wild-type p53 but not in
HCT116 cells with mutant p53 (Figure 6A). These data fulfill the criteria set out by Riley et
al. and support the interpretation that BERP undergoes p53-dependent transcriptional
activation and is indeed a novel p53-regulated gene.
Since PTZ is a modulator of GABAAR function, its ability to upregulate BERP expression in
a p53-dependent manner suggests that: 1) PTZ is a novel activator of p53, 2) p53 is
downstream of GABAAR function, 3) BERP is downstream of p53. Also, based on the
evidence presented in Section 4.3 (“What is the possible role of BERP in the CNS?”), we
hypothesized that BERP is involved in receptor trafficking of the GABAAR. Taken
together, this suggests a feedback loop in which PTZ, acting as a stress to the neuroelectrical
homeostasis of the neuron, inhibits GABAAR function. This triggers the activation of p53
which in its capacity as a transcription factor, upregulates expression of its target gene BERP.
BERP then exerts its effects on the cell surface expression of GABAARs.
The existence of this new GABAAR - p53 - BERP pathway implies that p53 is involved in
the regulation of PTZ-induced effects on BERP. This suggests that p53, through BERP,
plays a novel role in the regulation of GABAAR signaling and seizure susceptibility in the
CNS. Further studies are required to more precisely elucidate the functions of p53 and BERP
in GABAAR signaling and their contributions to epileptogenesis.
4.8 PTZ – A novel therapy in the battle against cancer?
While approximately 50% of human cancers contain p53 mutations, this means that the other
50% does not. However, in the tumours that still retain wild-type p53, the function of p53 is

135
often abrogated due to signaling or regulation defects (Hainaut and Hollstein 2000).
Therefore, the recent demonstration that re-activation of p53 leads to tumour regression
(Ventura et al. 2007; Xue et al. 2007) underscores the importance of identifying compounds
capable of restoring p53 function in the roughly 50% of all human cancers that still retain
wild-type p53.
Triggers that activate the p53 pathway can be genotoxic (e.g. ionizing irradiation, ultraviolet
irradiation) or non-genotoxic (e.g. hypoxia, ribonucleotide depletion, microtubule disruption,
oncogene activation, replicative senescence). Genotoxic activators, including radiotherapy and
many chemotherapeutic drugs in current use, involve DNA damage, which can injure normal
tissues and may result in the development of secondary cancers. Therefore, non-genotoxic
compounds capable of activating p53 without the negative consequences associated DNA
damage would be therapeutically ideal.
PTZ, commonly used to generate seizures in animal models, is a compound that antagonizes
the functions of GABAARs (Huang et al. 2001) and does not cause neuronal apoptosis
(Planas et al. 1994; Valente et al. 2004; Koeller et al. 2008). Our results show that in
response to PTZ injection, BERP is upregulated in vivo in a p53-dependent manner (Figure
8). This suggests that PTZ is a novel activator of p53 transactivation functions. Since it does
not cause neuronal death, subconvulsive doses of this, or a pharmacologically similar
compound, may be effective in the treatment of human cancers and have the advantage of
being free from major side effects. Further studies are required to determine whether PTZ
should be classified as a genotoxic or non-genotoxic compound and whether it can activate a
136
form of p53 with the appropriate posttranslational modifications that will lead to tumour
regression in vivo.
4.9 Closing Remarks
p53 is a central player in an organism's ability to respond to a variety of cellular stresses. Its
success as a tumour suppressor is contingent on its ability to preserve proliferative and
genomic stability in the face of many such insults. The identification of novel molecules
within the p53 network allow us the opportunity to expand our understanding of both known
and as yet unknown functions of this important transcription factor.
Prior to this work, there was no previously reported association between p53, BERP and
GABA A receptors. The findings in Chapter 2 support the interpretation that BERP is a
novel transcriptional target of p53 and that PTZ may be a novel activator of p53. The
findings in Chapter 3, through the generation and characterization of a BERP-deficient mouse
model, suggest that while BERP is dispensable for normal development, fertility, longevity,
tumour suppression, and adult neural stem cell renewal and differentiation, it may play a role
in fear learning and memory, seizure susceptibility, and the trafficking of GABA A receptors
in the brain. Taken together, this suggests a role for BERP in the modulation of GABA A
receptor-mediated seizure susceptibility as well as in p53 signaling. The convergence of these
two fields, through BERP, suggests that BERP may represent an important link to the
identification of a novel role for p53 in the regulation of "neuroelectrical homeostasis" in the
brain.

137
5 References
Akbarian, S., M. M. Huntsman, J. J. Kim, A. Tafazzoli, S. G. Potkin, W. E. Bunney, Jr. andE. G. Jones (1995). "GABAA receptor subunit gene expression in human prefrontal cortex:comparison of schizophrenics and controls." Cereb Cortex 5(6): 550-60.
Anagnostaras, S. G., G. D. Gale and M. S. Fanselow (2001). "Hippocampus and contextualfear conditioning: recent controversies and advances." Hippocampus 11(1): 8-17.
Andreasen, N. C. and R. Pierson (2008). "The role of the cerebellum in schizophrenia." BiolPsychiatry 64(2): 81-8.
Arama, E., D. Dickman, Z. Kimchie, A. Shearn and Z. Lev (2000). "Mutations in the beta-propeller domain of the Drosophila brain tumor (brat) protein induce neoplasm in the larvalbrain." Oncogene 19(33): 3706-16.
Asada, H., Y. Kawamura, K. Maruyama, H. Kume, R. Ding, F. Y. Ji, N. Kanbara, H.Kuzume, M. Sanbo, T. Yagi and K. Obata (1996). "Mice lacking the 65 kDa isoform ofglutamic acid decarboxylase (GAD65) maintain normal levels of GAD67 and GABA in theirbrains but are susceptible to seizures." Biochem Biophys Res Commun 229(3): 891-5.
Asada, H., Y. Kawamura, K. Maruyama, H. Kume, R. G. Ding, N. Kanbara, H. Kuzume, M.Sanbo, T. Yagi and K. Obata (1997). "Cleft palate and decreased brain gamma-aminobutyricacid in mice lacking the 67-kDa isoform of glutamic acid decarboxylase." Proc Natl Acad Sci US A 94(12): 6496-9.
Bailey, M. E., B. E. Albrecht, K. J. Johnson and M. G. Darlison (1999). "Genetic linkage andradiation hybrid mapping of the three human GABA(C) receptor rho subunit genes:GABRR1, GABRR2 and GABRR3." Biochim Biophys Acta 1447(2-3): 307-12.
Baker, S. J., S. Markowitz, E. R. Fearon, J. K. Willson and B. Vogelstein (1990)."Suppression of human colorectal carcinoma cell growth by wild-type p53." Science249(4971): 912-5.
Balastik, M., F. Ferraguti, A. Pires-da Silva, T. H. Lee, G. Alvarez-Bolado, K. P. Lu and P.Gruss (2008). "Deficiency in ubiquitin ligase TRIM2 causes accumulation of neurofilamentlight chain and neurodegeneration." Proc Natl Acad Sci U S A 105(33): 12016-21.

138
Bear, M., B. Connors and M. Paradiso (2001). Neuroscience Exploring the Brain. Baltimore,MD, Lippincott Williams & Wilkins.
Beck, M., K. Brickley, H. L. Wilkinson, S. Sharma, M. Smith, P. L. Chazot, S. Pollard and F.A. Stephenson (2002). "Identification, molecular cloning, and characterization of a novelGABAA receptor-associated protein, GRIF-1." J Biol Chem 277(33): 30079-90.
Bedford, F. K., J. T. Kittler, E. Muller, P. Thomas, J. M. Uren, D. Merlo, W. Wisden, A.Triller, T. G. Smart and S. J. Moss (2001). "GABA(A) receptor cell surface number andsubunit stability are regulated by the ubiquitin-like protein Plic-1." Nat Neurosci 4(9): 908-16.
Betschinger, J., K. Mechtler and J. A. Knoblich (2006). "Asymmetric segregation of thetumor suppressor brat regulates self-renewal in Drosophila neural stem cells." Cell 124(6):1241-53.
Blumcke, I., M. Thom and O. D. Wiestler (2002). "Ammon's horn sclerosis: amaldevelopmental disorder associated with temporal lobe epilepsy." Brain Pathol 12(2): 199-211.
Bogdanov, Y., G. Michels, C. Armstrong-Gold, P. G. Haydon, J. Lindstrom, M. Pangalos andS. J. Moss (2006). "Synaptic GABAA receptors are directly recruited from theirextrasynaptic counterparts." Embo J 25(18): 4381-9.
Bonne, O., M. Vythilingam, M. Inagaki, S. Wood, A. Neumeister, A. C. Nugent, J. Snow, D.A. Luckenbaugh, E. E. Bain, W. C. Drevets and D. S. Charney (2008). "Reduced posteriorhippocampal volume in posttraumatic stress disorder." J Clin Psychiatry 69(7): 1087-91.
Bormann, J. (2000). "The 'ABC' of GABA receptors." Trends Pharmacol Sci 21(1): 16-9.
Boulay, J. L., U. Stiefel, E. Taylor, B. Dolder, A. Merlo and F. Hirth (2009). "Loss ofheterozygosity of TRIM3 in malignant gliomas." BMC Cancer 9: 71.
Bowery, N. G. (2006). "GABAB receptor: a site of therapeutic benefit." Curr OpinPharmacol 6(1): 37-43.
Braff, D. L. and M. A. Geyer (1990). "Sensorimotor gating and schizophrenia. Human andanimal model studies." Arch Gen Psychiatry 47(2): 181-8.
139
Brand, A. H. and N. Perrimon (1993). "Targeted gene expression as a means of altering cellfates and generating dominant phenotypes." Development 118(2): 401-15.
Brooks-Kayal, A. R., M. D. Shumate, H. Jin, T. Y. Rikhter and D. A. Coulter (1998)."Selective changes in single cell GABA(A) receptor subunit expression and function intemporal lobe epilepsy." Nat Med 4(10): 1166-72.
Chang, Y., R. Wang, S. Barot and D. S. Weiss (1996). "Stoichiometry of a recombinantGABAA receptor." J Neurosci 16(17): 5415-24.
Charych, E. I., W. Yu, C. P. Miralles, D. R. Serwanski, X. Li, M. Rubio and A. L. De Blas(2004). "The brefeldin A-inhibited GDP/GTP exchange factor 2, a protein involved invesicular trafficking, interacts with the beta subunits of the GABA receptors." J Neurochem90(1): 173-89.
Chen, L., H. Wang, S. Vicini and R. W. Olsen (2000). "The gamma-aminobutyric acid type A(GABAA) receptor-associated protein (GABARAP) promotes GABAA receptor clusteringand modulates the channel kinetics." Proc Natl Acad Sci U S A 97(21): 11557-62.
Chen, Y., D. Zhou, K. Zhou, Y. Ren, W. Dai, M. Xu, L. Lu and Z. Lu (2007). "Study onolfactory function in GABAC receptor/channel rho1 subunit knockout mice." Neurosci Lett427(1): 10-5.
Cherubini, E. and F. Conti (2001). "Generating diversity at GABAergic synapses." TrendsNeurosci 24(3): 155-62.
Chiang, A. P., J. S. Beck, H. J. Yen, M. K. Tayeh, T. E. Scheetz, R. E. Swiderski, D. Y.Nishimura, T. A. Braun, K. Y. Kim, J. Huang, K. Elbedour, R. Carmi, D. C. Slusarski, T. L.Casavant, E. M. Stone and V. C. Sheffield (2006). "Homozygosity mapping with SNP arraysidentifies TRIM32, an E3 ubiquitin ligase, as a Bardet-Biedl syndrome gene (BBS11)." ProcNatl Acad Sci U S A 103(16): 6287-92.
Collinson, N., F. M. Kuenzi, W. Jarolimek, K. A. Maubach, R. Cothliff, C. Sur, A. Smith, F.M. Otu, O. Howell, J. R. Atack, R. M. McKernan, G. R. Seabrook, G. R. Dawson, P. J.Whiting and T. W. Rosahl (2002). "Enhanced learning and memory and altered GABAergicsynaptic transmission in mice lacking the alpha 5 subunit of the GABAA receptor." JNeurosci 22(13): 5572-80.
140
Coulter, D. A. (2001). "Epilepsy-associated plasticity in gamma-aminobutyric acid receptorexpression, function, and inhibitory synaptic properties." Int Rev Neurobiol 45: 237-52.
Crestani, F., M. Lorez, K. Baer, C. Essrich, D. Benke, J. P. Laurent, C. Belzung, J. M.Fritschy, B. Luscher and H. Mohler (1999). "Decreased GABAA-receptor clustering resultsin enhanced anxiety and a bias for threat cues." Nat Neurosci 2(9): 833-9.
Cutting, G. R., S. Curristin, H. Zoghbi, B. O'Hara, M. F. Seldin and G. R. Uhl (1992)."Identification of a putative gamma-aminobutyric acid (GABA) receptor subunit rho2 cDNAand colocalization of the genes encoding rho2 (GABRR2) and rho1 (GABRR1) to humanchromosome 6q14-q21 and mouse chromosome 4." Genomics 12(4): 801-6.
Daujat, S., H. Neel and J. Piette (2001). "MDM2: life without p53." Trends Genet 17(8):459-64.
DeLorey, T. M., A. Handforth, S. G. Anagnostaras, G. E. Homanics, B. A. Minassian, A.Asatourian, M. S. Fanselow, A. Delgado-Escueta, G. D. Ellison and R. W. Olsen (1998)."Mice lacking the beta3 subunit of the GABAA receptor have the epilepsy phenotype andmany of the behavioral characteristics of Angelman syndrome." J Neurosci 18(20): 8505-14.
Donehower, L. A., M. Harvey, B. L. Slagle, M. J. McArthur, C. A. Montgomery, Jr., J. S.Butel and A. Bradley (1992). "Mice deficient for p53 are developmentally normal butsusceptible to spontaneous tumours." Nature 356(6366): 215-21.
el-Deiry, W. S., S. E. Kern, J. A. Pietenpol, K. W. Kinzler and B. Vogelstein (1992)."Definition of a consensus binding site for p53." Nat Genet 1(1): 45-9.
El-Husseini, A. E., P. Fretier and S. R. Vincent (2001). "Cloning and characterization of a gene(RNF22) encoding a novel brain expressed ring finger protein (BERP) that maps to humanchromosome 11p15.5." Genomics 71(3): 363-7.
El-Husseini, A. E., D. Kwasnicka, T. Yamada, S. Hirohashi and S. R. Vincent (2000). "BERP,a novel ring finger protein, binds to alpha-actinin-4." Biochem Biophys Res Commun 267(3):906-11.
El-Husseini, A. E. and S. R. Vincent (1999). "Cloning and characterization of a novel RINGfinger protein that interacts with class V myosins." J Biol Chem 274(28): 19771-7.
141
Enz, R. and G. R. Cutting (1998). "Molecular composition of GABAC receptors." VisionRes 38(10): 1431-41.
Erlander, M. G., N. J. Tillakaratne, S. Feldblum, N. Patel and A. J. Tobin (1991). "Two genesencode distinct glutamate decarboxylases." Neuron 7(1): 91-100.
Essrich, C., M. Lorez, J. A. Benson, J. M. Fritschy and B. Luscher (1998). "Postsynapticclustering of major GABAA receptor subtypes requires the gamma 2 subunit and gephyrin."Nat Neurosci 1(7): 563-71.
Evans, S. C. and G. Lozano (1997). "The Li-Fraumeni syndrome: an inherited susceptibilityto cancer." Mol Med Today 3(9): 390-5.
Fang, C., L. Deng, C. A. Keller, M. Fukata, Y. Fukata, G. Chen and B. Luscher (2006)."GODZ-mediated palmitoylation of GABA(A) receptors is required for normal assembly andfunction of GABAergic inhibitory synapses." J Neurosci 26(49): 12758-68.
Fitch, W. M. (2000). "Homology a personal view on some of the problems." Trends Genet16(5): 227-31.
Frank, D. J., B. A. Edgar and M. B. Roth (2002). "The Drosophila melanogaster gene braintumor negatively regulates cell growth and ribosomal RNA synthesis." Development 129(2):399-407.
Fridell, R. A., L. S. Harding, H. P. Bogerd and B. R. Cullen (1995). "Identification of a novelhuman zinc finger protein that specifically interacts with the activation domain of lentiviralTat proteins." Virology 209(2): 347-57.
Frosk, P., T. Weiler, E. Nylen, T. Sudha, C. R. Greenberg, K. Morgan, T. M. Fujiwara and K.Wrogemann (2002). "Limb-girdle muscular dystrophy type 2H associated with mutation inTRIM32, a putative E3-ubiquitin-ligase gene." Am J Hum Genet 70(3): 663-72.
Gassmann, M., H. Shaban, R. Vigot, G. Sansig, C. Haller, S. Barbieri, Y. Humeau, V. Schuler,M. Muller, B. Kinzel, K. Klebs, M. Schmutz, W. Froestl, J. Heid, P. H. Kelly, C. Gentry, A.L. Jaton, H. Van der Putten, C. Mombereau, L. Lecourtier, J. Mosbacher, J. F. Cryan, J. M.Fritschy, A. Luthi, K. Kaupmann and B. Bettler (2004). "Redistribution of GABAB(1)protein and atypical GABAB responses in GABAB(2)-deficient mice." J Neurosci 24(27):6086-97.
142
Goldman, M. B. and C. P. Mitchell (2004). "What is the functional significance ofhippocampal pathology in schizophrenia?" Schizophr Bull 30(2): 367-92.
Gorrie, G. H., Y. Vallis, A. Stephenson, J. Whitfield, B. Browning, T. G. Smart and S. J.Moss (1997). "Assembly of GABAA receptors composed of alpha1 and beta2 subunits inboth cultured neurons and fibroblasts." J Neurosci 17(17): 6587-96.
Gunther, U., J. Benson, D. Benke, J. M. Fritschy, G. Reyes, F. Knoflach, F. Crestani, A.Aguzzi, M. Arigoni, Y. Lang and et al. (1995). "Benzodiazepine-insensitive mice generated bytargeted disruption of the gamma 2 subunit gene of gamma-aminobutyric acid type Areceptors." Proc Natl Acad Sci U S A 92(17): 7749-53.
Guo, H., C. Mao, X. L. Jin, H. Wang, Y. T. Tu, P. P. Avasthi and Y. Li (2000). "Cre-mediated cerebellum- and hippocampus-restricted gene mutation in mouse brain." BiochemBiophys Res Commun 269(1): 149-54.
Hainaut, P., T. Hernandez, A. Robinson, P. Rodriguez-Tome, T. Flores, M. Hollstein, C. C.Harris and R. Montesano (1998). "IARC Database of p53 gene mutations in human tumorsand cell lines: updated compilation, revised formats and new visualisation tools." NucleicAcids Res 26(1): 205-13.
Hainaut, P. and M. Hollstein (2000). "p53 and human cancer: the first ten thousandmutations." Adv Cancer Res 77: 81-137.
Harvey, M., M. J. McArthur, C. A. Montgomery, Jr., J. S. Butel, A. Bradley and L. A.Donehower (1993). "Spontaneous and carcinogen-induced tumorigenesis in p53-deficientmice." Nat Genet 5(3): 225-9.
Harvey, M., A. T. Sands, R. S. Weiss, M. E. Hegi, R. W. Wiseman, P. Pantazis, B. C.Giovanella, M. A. Tainsky, A. Bradley and L. A. Donehower (1993). "In vitro growthcharacteristics of embryo fibroblasts isolated from p53-deficient mice." Oncogene 8(9): 2457-67.
Hill, D. R. and N. G. Bowery (1981). "3H-baclofen and 3H-GABA bind to bicuculline-insensitive GABA B sites in rat brain." Nature 290(5802): 149-52.
Hollstein, M., M. Hergenhahn, Q. Yang, H. Bartsch, Z. Q. Wang and P. Hainaut (1999)."New approaches to understanding p53 gene tumor mutation spectra." Mutat Res 431(2):199-209.
143
Hollstein, M., D. Sidransky, B. Vogelstein and C. C. Harris (1991). "p53 mutations in humancancers." Science 253(5015): 49-53.
Homanics, G. E., T. M. DeLorey, L. L. Firestone, J. J. Quinlan, A. Handforth, N. L.Harrison, M. D. Krasowski, C. E. Rick, E. R. Korpi, R. Makela, M. H. Brilliant, N.Hagiwara, C. Ferguson, K. Snyder and R. W. Olsen (1997). "Mice devoid of gamma-aminobutyrate type A receptor beta3 subunit have epilepsy, cleft palate, and hypersensitivebehavior." Proc Natl Acad Sci U S A 94(8): 4143-8.
Honda, K., T. Yamada, R. Endo, Y. Ino, M. Gotoh, H. Tsuda, Y. Yamada, H. Chiba and S.Hirohashi (1998). "Actinin-4, a novel actin-bundling protein associated with cell motility andcancer invasion." J Cell Biol 140(6): 1383-93.
Horn, E. J., A. Albor, Y. Liu, S. El-Hizawi, G. E. Vanderbeek, M. Babcock, G. T. Bowden,H. Hennings, G. Lozano, W. C. Weinberg and M. Kulesz-Martin (2004). "RING proteinTrim32 associated with skin carcinogenesis has anti-apoptotic and E3-ubiquitin ligaseproperties." Carcinogenesis 25(2): 157-67.
Hosak, L. and J. Libiger (2002). "Antiepileptic drugs in schizophrenia: a review." EurPsychiatry 17(7): 371-8.
Huang, R. Q., C. L. Bell-Horner, M. I. Dibas, D. F. Covey, J. A. Drewe and G. H. Dillon(2001). "Pentylenetetrazole-induced inhibition of recombinant gamma-aminobutyric acid typeA (GABA(A)) receptors: mechanism and site of action." J Pharmacol Exp Ther 298(3): 986-95.
Hulsen, T., M. A. Huynen, J. de Vlieg and P. M. Groenen (2006). "Benchmarking orthologidentification methods using functional genomics data." Genome Biol 7(4): R31.
Igney, F. H. and P. H. Krammer (2002). "Death and anti-death: tumour resistance toapoptosis." Nat Rev Cancer 2(4): 277-88.
Jacks, T., L. Remington, B. O. Williams, E. M. Schmitt, S. Halachmi, R. T. Bronson and R.A. Weinberg (1994). "Tumor spectrum analysis in p53-mutant mice." Curr Biol 4(1): 1-7.
Jacob, T. C., Y. D. Bogdanov, C. Magnus, R. S. Saliba, J. T. Kittler, P. G. Haydon and S. J.Moss (2005). "Gephyrin regulates the cell surface dynamics of synaptic GABAA receptors."J Neurosci 25(45): 10469-78.

144
Ji, F., N. Kanbara and K. Obata (1999). "GABA and histogenesis in fetal and neonatal mousebrain lacking both the isoforms of glutamic acid decarboxylase." Neurosci Res 33(3): 187-94.
Jin, S., S. Martinek, W. S. Joo, J. R. Wortman, N. Mirkovic, A. Sali, M. D. Yandell, N. P.Pavletich, M. W. Young and A. J. Levine (2000). "Identification and characterization of a p53homologue in Drosophila melanogaster." Proc Natl Acad Sci U S A 97(13): 7301-6.
Joerger, A. C. and A. R. Fersht (2007). "Structure-function-rescue: the diverse nature ofcommon p53 cancer mutants." Oncogene 26(15): 2226-42.
Jones-Davis, D. M. and R. L. Macdonald (2003). "GABA(A) receptor function andpharmacology in epilepsy and status epilepticus." Curr Opin Pharmacol 3(1): 12-8.
Kalueff, A. and D. J. Nutt (1996). "Role of GABA in memory and anxiety." Depress Anxiety4(3): 100-10.
Kanematsu, T., I. S. Jang, T. Yamaguchi, H. Nagahama, K. Yoshimura, K. Hidaka, M.Matsuda, H. Takeuchi, Y. Misumi, K. Nakayama, T. Yamamoto, N. Akaike and M. Hirata(2002). "Role of the PLC-related, catalytically inactive protein p130 in GABA(A) receptorfunction." Embo J 21(5): 1004-11.
Kano, S., N. Miyajima, S. Fukuda and S. Hatakeyama (2008). "Tripartite motif protein 32facilitates cell growth and migration via degradation of Abl-interactor 2." Cancer Res 68(14):5572-80.
Keller, C. A., X. Yuan, P. Panzanelli, M. L. Martin, M. Alldred, M. Sassoe-Pognetto and B.Luscher (2004). "The gamma2 subunit of GABA(A) receptors is a substrate forpalmitoylation by GODZ." J Neurosci 24(26): 5881-91.
Kern, S. E., J. A. Pietenpol, S. Thiagalingam, A. Seymour, K. W. Kinzler and B. Vogelstein(1992). "Oncogenic forms of p53 inhibit p53-regulated gene expression." Science 256(5058):827-30.
Kittler, J. T., G. Chen, S. Honing, Y. Bogdanov, K. McAinsh, I. L. Arancibia-Carcamo, J. N.Jovanovic, M. N. Pangalos, V. Haucke, Z. Yan and S. J. Moss (2005). "Phospho-dependentbinding of the clathrin AP2 adaptor complex to GABAA receptors regulates the efficacy ofinhibitory synaptic transmission." Proc Natl Acad Sci U S A 102(41): 14871-6.
Kittler, J. T., G. Chen, V. Kukhtina, A. Vahedi-Faridi, Z. Gu, V. Tretter, K. R. Smith, K.McAinsh, I. L. Arancibia-Carcamo, W. Saenger, V. Haucke, Z. Yan and S. J. Moss (2008).

145
"Regulation of synaptic inhibition by phospho-dependent binding of the AP2 complex to aYECL motif in the GABAA receptor gamma2 subunit." Proc Natl Acad Sci U S A 105(9):3616-21.
Kittler, J. T., P. Delmas, J. N. Jovanovic, D. A. Brown, T. G. Smart and S. J. Moss (2000)."Constitutive endocytosis of GABAA receptors by an association with the adaptin AP2complex modulates inhibitory synaptic currents in hippocampal neurons." J Neurosci 20(21):7972-7.
Kittler, J. T. and S. J. Moss (2003). "Modulation of GABAA receptor activity byphosphorylation and receptor trafficking: implications for the efficacy of synapticinhibition." Curr Opin Neurobiol 13(3): 341-7.
Kittler, J. T., P. Thomas, V. Tretter, Y. D. Bogdanov, V. Haucke, T. G. Smart and S. J. Moss(2004). "Huntingtin-associated protein 1 regulates inhibitory synaptic transmission bymodulating gamma-aminobutyric acid type A receptor membrane trafficking." Proc Natl AcadSci U S A 101(34): 12736-41.
Kleihues, P., B. Schauble, A. zur Hausen, J. Esteve and H. Ohgaki (1997). "Tumorsassociated with p53 germline mutations: a synopsis of 91 families." Am J Pathol 150(1): 1-13.
Kneussel, M., J. H. Brandstatter, B. Gasnier, G. Feng, J. R. Sanes and H. Betz (2001)."Gephyrin-independent clustering of postsynaptic GABA(A) receptor subtypes." Mol CellNeurosci 17(6): 973-82.
Kneussel, M., J. H. Brandstatter, B. Laube, S. Stahl, U. Muller and H. Betz (1999). "Loss ofpostsynaptic GABA(A) receptor clustering in gephyrin-deficient mice." J Neurosci 19(21):9289-97.
Koeller, H. B., M. E. Ross and S. B. Glickstein (2008). "Cyclin D1 in excitatory neurons ofthe adult brain enhances kainate-induced neurotoxicity." Neurobiol Dis 31(2): 230-41.
Kubbutat, M. H., S. N. Jones and K. H. Vousden (1997). "Regulation of p53 stability byMdm2." Nature 387(6630): 299-303.
Kudryashova, E., D. Kudryashov, I. Kramerova and M. J. Spencer (2005). "Trim32 is aubiquitin ligase mutated in limb girdle muscular dystrophy type 2H that binds to skeletalmuscle myosin and ubiquitinates actin." J Mol Biol 354(2): 413-24.

146
Kudryashova, E., J. Wu, L. A. Havton and M. J. Spencer (2009). "Deficiency of the E3ubiquitin ligase TRIM32 in mice leads to a myopathy with a neurogenic component." HumMol Genet 18(7): 1353-67.
Lane, D. P. (1992). "Cancer. p53, guardian of the genome." Nature 358(6381): 15-6.
Leil, T. A., Z. W. Chen, C. S. Chang and R. W. Olsen (2004). "GABAA receptor-associatedprotein traffics GABAA receptors to the plasma membrane in neurons." J Neurosci 24(50):11429-38.
Levi, S., S. M. Logan, K. R. Tovar and A. M. Craig (2004). "Gephyrin is critical for glycinereceptor clustering but not for the formation of functional GABAergic synapses inhippocampal neurons." J Neurosci 24(1): 207-17.
Levine, A. J., W. Hu and Z. Feng (2006). "The P53 pathway: what questions remain to beexplored?" Cell Death Differ 13(6): 1027-36.
Lin, Y., W. Ma and S. Benchimol (2000). "Pidd, a new death-domain-containing protein, isinduced by p53 and promotes apoptosis." Nat Genet 26(1): 122-7.
Loebrich, S., R. Bahring, T. Katsuno, S. Tsukita and M. Kneussel (2006). "Activated radixinis essential for GABAA receptor alpha5 subunit anchoring at the actin cytoskeleton." Embo J25(5): 987-99.
Lowe, S. W., T. Jacks, D. E. Housman and H. E. Ruley (1994). "Abrogation of oncogene-associated apoptosis allows transformation of p53-deficient cells." Proc Natl Acad Sci U S A91(6): 2026-30.
Macdonald, R. L. and R. W. Olsen (1994). "GABAA receptor channels." Annu Rev Neurosci17: 569-602.
Martins-de-Souza, D., W. F. Gattaz, A. Schmitt, C. Rewerts, G. Maccarrone, E. Dias-Netoand C. W. Turck (2009). "Prefrontal cortex shotgun proteome analysis reveals altered calciumhomeostasis and immune system imbalance in schizophrenia." Eur Arch Psychiatry ClinNeurosci.

147
McCall, M. A., P. D. Lukasiewicz, R. G. Gregg and N. S. Peachey (2002). "Elimination of therho1 subunit abolishes GABA(C) receptor expression and alters visual processing in themouse retina." J Neurosci 22(10): 4163-74.
McKernan, R. M. and P. J. Whiting (1996). "Which GABAA-receptor subtypes really occurin the brain?" Trends Neurosci 19(4): 139-43.
Meletis, K., V. Wirta, S. M. Hede, M. Nister, J. Lundeberg and J. Frisen (2006). "p53suppresses the self-renewal of adult neural stem cells." Development 133(2): 363-9.
Momand, J., G. P. Zambetti, D. C. Olson, D. George and A. J. Levine (1992). "The mdm-2oncogene product forms a complex with the p53 protein and inhibits p53-mediatedtransactivation." Cell 69(7): 1237-45.
Moreno-Hagelsieb, G. and K. Latimer (2008). "Choosing BLAST options for better detectionof orthologs as reciprocal best hits." Bioinformatics 24(3): 319-24.
Nikolopoulos, S. N., B. A. Spengler, K. Kisselbach, A. E. Evans, J. L. Biedler and R. A. Ross(2000). "The human non-muscle alpha-actinin protein encoded by the ACTN4 genesuppresses tumorigenicity of human neuroblastoma cells." Oncogene 19(3): 380-6.
Nusser, Z., S. Cull-Candy and M. Farrant (1997). "Differences in synaptic GABA(A)receptor number underlie variation in GABA mini amplitude." Neuron 19(3): 697-709.
O'Sullivan, G. A., M. Kneussel, Z. Elazar and H. Betz (2005). "GABARAP is not essentialfor GABA receptor targeting to the synapse." Eur J Neurosci 22(10): 2644-8.
Ohkawa, N., K. Kokura, T. Matsu-Ura, T. Obinata, Y. Konishi and T. A. Tamura (2001)."Molecular cloning and characterization of neural activity-related RING finger protein(NARF): a new member of the RBCC family is a candidate for the partner of myosin V." JNeurochem 78(1): 75-87.
Ollmann, M., L. M. Young, C. J. Di Como, F. Karim, M. Belvin, S. Robertson, K. Whittaker,M. Demsky, W. W. Fisher, A. Buchman, G. Duyk, L. Friedman, C. Prives and C.Kopczynski (2000). "Drosophila p53 is a structural and functional homolog of the tumorsuppressor p53." Cell 101(1): 91-101.

148
Olsen, J. V., B. Blagoev, F. Gnad, B. Macek, C. Kumar, P. Mortensen and M. Mann (2006)."Global, in vivo, and site-specific phosphorylation dynamics in signaling networks." Cell127(3): 635-48.
Olsen, R. W. and W. Sieghart (2008). "International Union of Pharmacology. LXX. Subtypesof gamma-aminobutyric acid(A) receptors: classification on the basis of subunit composition,pharmacology, and function. Update." Pharmacol Rev 60(3): 243-60.
Olsson, A., C. Manzl, A. Strasser and A. Villunger (2007). "How important are post-translational modifications in p53 for selectivity in target-gene transcription and tumoursuppression?" Cell Death Differ 14(9): 1561-75.
Parrent, A. G. and A. M. Lozano (2000). "Stereotactic surgery for temporal lobe epilepsy."Can J Neurol Sci 27 Suppl 1: S79-84; discussion S92-6.
Planas, A. M., M. A. Soriano, I. Ferrer and E. Rodriguez Farre (1994). "Regional expressionof inducible heat shock protein-70 mRNA in the rat brain following administration ofconvulsant drugs." Brain Res Mol Brain Res 27(1): 127-37.
Pritchett, D. B., H. Sontheimer, B. D. Shivers, S. Ymer, H. Kettenmann, P. R. Schofield andP. H. Seeburg (1989). "Importance of a novel GABAA receptor subunit for benzodiazepinepharmacology." Nature 338(6216): 582-5.
Prosser, H. M., C. H. Gill, W. D. Hirst, E. Grau, M. Robbins, A. Calver, E. M. Soffin, C. E.Farmer, C. Lanneau, J. Gray, E. Schenck, B. S. Warmerdam, C. Clapham, C. Reavill, D. C.Rogers, T. Stean, N. Upton, K. Humphreys, A. Randall, M. Geppert, C. H. Davies and M.N. Pangalos (2001). "Epileptogenesis and enhanced prepulse inhibition in GABA(B1)-deficient mice." Mol Cell Neurosci 17(6): 1059-70.
Provance, D. W. and J. A. Mercer (1999). "Myosin-V: head to tail." Cell Mol Life Sci 56(3-4): 233-42.
Purves, D., G. Augustine and D. Fitzpatrick, Eds. (2004). Neuroscience. Sunderland, MA,Sinauer Associates.
Radley, J. J., H. M. Sisti, J. Hao, A. B. Rocher, T. McCall, P. R. Hof, B. S. McEwen and J.H. Morrison (2004). "Chronic behavioral stress induces apical dendritic reorganization inpyramidal neurons of the medial prefrontal cortex." Neuroscience 125(1): 1-6.

149
Resnick, M. A., D. Tomso, A. Inga, D. Menendez and D. Bell (2005). "Functional diversityin the gene network controlled by the master regulator p53 in humans." Cell Cycle 4(8): 1026-9.
Reymond, A., G. Meroni, A. Fantozzi, G. Merla, S. Cairo, L. Luzi, D. Riganelli, E. Zanaria,S. Messali, S. Cainarca, A. Guffanti, S. Minucci, P. G. Pelicci and A. Ballabio (2001). "Thetripartite motif family identifies cell compartments." Embo J 20(9): 2140-51.
Riley, T., E. Sontag, P. Chen and A. Levine (2008). "Transcriptional control of human p53-regulated genes." Nat Rev Mol Cell Biol 9(5): 402-12.
Rogers, D. C., E. M. Fisher, S. D. Brown, J. Peters, A. J. Hunter and J. E. Martin (1997)."Behavioral and functional analysis of mouse phenotype: SHIRPA, a proposed protocol forcomprehensive phenotype assessment." Mamm Genome 8(10): 711-3.
Sacchetti, B., E. Baldi, C. A. Lorenzini and C. Bucherelli (2002). "Cerebellar role in fear-conditioning consolidation." Proc Natl Acad Sci U S A 99(12): 8406-11.
Saliba, R. S., G. Michels, T. C. Jacob, M. N. Pangalos and S. J. Moss (2007). "Activity-dependent ubiquitination of GABA(A) receptors regulates their accumulation at synapticsites." J Neurosci 27(48): 13341-51.
Sandberg, R., R. Yasuda, D. G. Pankratz, T. A. Carter, J. A. Del Rio, L. Wodicka, M.Mayford, D. J. Lockhart and C. Barlow (2000). "Regional and strain-specific gene expressionmapping in the adult mouse brain." Proc Natl Acad Sci U S A 97(20): 11038-43.
Schmahmann, J. D. and J. C. Sherman (1998). "The cerebellar cognitive affective syndrome."Brain 121 ( Pt 4): 561-79.
Schofield, P. R., M. G. Darlison, N. Fujita, D. R. Burt, F. A. Stephenson, H. Rodriguez, L.M. Rhee, J. Ramachandran, V. Reale, T. A. Glencorse and et al. (1987). "Sequence andfunctional expression of the GABA A receptor shows a ligand-gated receptor super-family."Nature 328(6127): 221-7.
Schoser, B. G., P. Frosk, A. G. Engel, U. Klutzny, H. Lochmuller and K. Wrogemann (2005)."Commonality of TRIM32 mutation in causing sarcotubular myopathy and LGMD2H." AnnNeurol 57(4): 591-5.

150
Schousboe, A., A. Sarup, O. M. Larsson and H. S. White (2004). "GABA transporters asdrug targets for modulation of GABAergic activity." Biochem Pharmacol 68(8): 1557-63.
Schuler, V., C. Luscher, C. Blanchet, N. Klix, G. Sansig, K. Klebs, M. Schmutz, J. Heid, C.Gentry, L. Urban, A. Fox, W. Spooren, A. L. Jaton, J. Vigouret, M. Pozza, P. H. Kelly, J.Mosbacher, W. Froestl, E. Kaslin, R. Korn, S. Bischoff, K. Kaupmann, H. van der Putten andB. Bettler (2001). "Epilepsy, hyperalgesia, impaired memory, and loss of pre- andpostsynaptic GABA(B) responses in mice lacking GABA(B(1))." Neuron 31(1): 47-58.
Schutter, D. J. and J. van Honk (2005). "The cerebellum on the rise in human emotion."Cerebellum 4(4): 290-4.
Schwamborn, J. C., E. Berezikov and J. A. Knoblich (2009). "The TRIM-NHL proteinTRIM32 activates microRNAs and prevents self-renewal in mouse neural progenitors." Cell136(5): 913-25.
Sieghart, W. and G. Sperk (2002). "Subunit composition, distribution and function ofGABA(A) receptor subtypes." Curr Top Med Chem 2(8): 795-816.
Smith, M. J., K. Pozo, K. Brickley and F. A. Stephenson (2006). "Mapping the GRIF-1binding domain of the kinesin, KIF5C, substantiates a role for GRIF-1 as an adaptor proteinin the anterograde trafficking of cargoes." J Biol Chem 281(37): 27216-28.
Sonoda, J. and R. P. Wharton (2001). "Drosophila Brain Tumor is a translational repressor."Genes Dev 15(6): 762-73.
Stambolic, V., D. MacPherson, D. Sas, Y. Lin, B. Snow, Y. Jang, S. Benchimol and T. W.Mak (2001). "Regulation of PTEN transcription by p53." Mol Cell 8(2): 317-25.
Steenman, M., A. Westerveld and M. Mannens (2000). "Genetics of Beckwith-Wiedemannsyndrome-associated tumors: common genetic pathways." Genes Chromosomes Cancer28(1): 1-13.
Sur, C., K. A. Wafford, D. S. Reynolds, K. L. Hadingham, F. Bromidge, A. Macaulay, N.Collinson, G. O'Meara, O. Howell, R. Newman, J. Myers, J. R. Atack, G. R. Dawson, R. M.McKernan, P. J. Whiting and T. W. Rosahl (2001). "Loss of the major GABA(A) receptorsubtype in the brain is not lethal in mice." J Neurosci 21(10): 3409-18.
Suzuki, H., R. Okunishi, W. Hashizume, S. Katayama, N. Ninomiya, N. Osato, K. Sato, M.Nakamura, J. Iida, M. Kanamori and Y. Hayashizaki (2004). "Identification of region-specific

151
transcription factor genes in the adult mouse brain by medium-scale real-time RT-PCR."FEBS Lett 573(1-3): 214-8.
Terunuma, M., I. S. Jang, S. H. Ha, J. T. Kittler, T. Kanematsu, J. N. Jovanovic, K. I.Nakayama, N. Akaike, S. H. Ryu, S. J. Moss and M. Hirata (2004). "GABAA receptorphospho-dependent modulation is regulated by phospholipase C-related inactive proteintype 1, a novel protein phosphatase 1 anchoring protein." J Neurosci 24(32): 7074-84.
Thomas, P., M. Mortensen, A. M. Hosie and T. G. Smart (2005). "Dynamic mobility offunctional GABAA receptors at inhibitory synapses." Nat Neurosci 8(7): 889-97.
Thuault, S. J., J. T. Brown, S. A. Sheardown, S. Jourdain, B. Fairfax, J. P. Spencer, S.Restituito, J. H. Nation, S. Topps, A. D. Medhurst, A. D. Randall, A. Couve, S. J. Moss, G.L. Collingridge, M. N. Pangalos, C. H. Davies and A. R. Calver (2004). "The GABA(B2)subunit is critical for the trafficking and function of native GABA(B) receptors." BiochemPharmacol 68(8): 1655-66.
Tiihonen, J., J. Kuikka, P. Rasanen, U. Lepola, H. Koponen, A. Liuska, A. Lehmusvaara, P.Vainio, M. Kononen, K. Bergstrom, M. Yu, I. Kinnunen, K. Akerman and J. Karhu (1997)."Cerebral benzodiazepine receptor binding and distribution in generalized anxiety disorder: afractal analysis." Mol Psychiatry 2(6): 463-71.
Tomso, D. J., A. Inga, D. Menendez, G. S. Pittman, M. R. Campbell, F. Storici, D. A. Belland M. A. Resnick (2005). "Functionally distinct polymorphic sequences in the humangenome that are targets for p53 transactivation." Proc Natl Acad Sci U S A 102(18): 6431-6.
Tretter, V., T. C. Jacob, J. Mukherjee, J. M. Fritschy, M. N. Pangalos and S. J. Moss (2008)."The clustering of GABA(A) receptor subtypes at inhibitory synapses is facilitated via thedirect binding of receptor alpha 2 subunits to gephyrin." J Neurosci 28(6): 1356-65.
Trinidad, J. C., C. G. Specht, A. Thalhammer, R. Schoepfer and A. L. Burlingame (2006)."Comprehensive identification of phosphorylation sites in postsynaptic densitypreparations." Mol Cell Proteomics 5(5): 914-22.
Tsien, J. Z., D. F. Chen, D. Gerber, C. Tom, E. H. Mercer, D. J. Anderson, M. Mayford, E.R. Kandel and S. Tonegawa (1996). "Subregion- and cell type-restricted gene knockout inmouse brain." Cell 87(7): 1317-26.

152
Tsujita, M., H. Mori, M. Watanabe, M. Suzuki, J. Miyazaki and M. Mishina (1999)."Cerebellar granule cell-specific and inducible expression of Cre recombinase in the mouse." JNeurosci 19(23): 10318-23.
Tsunoda, T. and T. Takagi (1999). "Estimating transcription factor bindability on DNA."Bioinformatics 15(7-8): 622-30.
Uji, A., M. Matsuda, T. Kukita, K. Maeda, T. Kanematsu and M. Hirata (2002). "Moleculesinteracting with PRIP-2, a novel Ins(1,4,5)P3 binding protein type 2: Comparison with PRIP-1." Life Sci 72(4-5): 443-53.
Valente, T., M. I. Dominguez, A. Bellmann, L. Journot, I. Ferrer and C. Auladell (2004)."Zac1 is up-regulated in neural cells of the limbic system of mouse brain following seizuresthat provoke strong cell activation." Neuroscience 128(2): 323-36.
van Diepen, M. T., G. E. Spencer, J. van Minnen, Y. Gouwenberg, J. Bouwman, A. B. Smitand R. E. van Kesteren (2005). "The molluscan RING-finger protein L-TRIM is essential forneuronal outgrowth." Mol Cell Neurosci 29(1): 74-81.
Velasco, F., J. D. Carrillo-Ruiz, F. Brito, M. Velasco, A. L. Velasco, I. Marquez and R. Davis(2005). "Double-blind, randomized controlled pilot study of bilateral cerebellar stimulationfor treatment of intractable motor seizures." Epilepsia 46(7): 1071-81.
Ventura, A., D. G. Kirsch, M. E. McLaughlin, D. A. Tuveson, J. Grimm, L. Lintault, J.Newman, E. E. Reczek, R. Weissleder and T. Jacks (2007). "Restoration of p53 functionleads to tumour regression in vivo." Nature 445(7128): 661-5.
Vicini, S., C. Ferguson, K. Prybylowski, J. Kralic, A. L. Morrow and G. E. Homanics (2001)."GABA(A) receptor alpha1 subunit deletion prevents developmental changes of inhibitorysynaptic currents in cerebellar neurons." J Neurosci 21(9): 3009-16.
Vicini, S. and P. Ortinski (2004). "Genetic manipulations of GABAA receptor in mice makeinhibition exciting." Pharmacol Ther 103(2): 109-20.
Vogelstein, B., D. Lane and A. J. Levine (2000). "Surfing the p53 network." Nature408(6810): 307-10.

153
Vousden, K. H. and X. Lu (2002). "Live or let die: the cell's response to p53." Nat RevCancer 2(8): 594-604.
Wagstaff, J., J. H. Knoll, J. Fleming, E. F. Kirkness, A. Martin-Gallardo, F. Greenberg, J. M.Graham, Jr., J. Menninger, D. Ward, J. C. Venter and et al. (1991). "Localization of the geneencoding the GABAA receptor beta 3 subunit to the Angelman/Prader-Willi region of humanchromosome 15." Am J Hum Genet 49(2): 330-7.
Wang, H., F. K. Bedford, N. J. Brandon, S. J. Moss and R. W. Olsen (1999). "GABA(A)-receptor-associated protein links GABA(A) receptors and the cytoskeleton." Nature397(6714): 69-72.
Wang, Z., J. G. Edwards, N. Riley, D. W. Provance, Jr., R. Karcher, X. D. Li, I. G. Davison,M. Ikebe, J. A. Mercer, J. A. Kauer and M. D. Ehlers (2008). "Myosin Vb mobilizesrecycling endosomes and AMPA receptors for postsynaptic plasticity." Cell 135(3): 535-48.
Whiting, P. J. (2006). "GABA-A receptors: a viable target for novel anxiolytics?" Curr OpinPharmacol 6(1): 24-9.
Wong, C. G., T. Bottiglieri and O. C. Snead, 3rd (2003). "GABA, gamma-hydroxybutyricacid, and neurological disease." Ann Neurol 54 Suppl 6: S3-12.
Wright, T. R., W. Beermann, J. L. Marsh, C. P. Bishop, R. Steward, B. C. Black, A. D.Tomsett and E. Y. Wright (1981). "The genetics of dopa decarboxylase in Drosophilamelanogaster. IV. The genetics and cytology of the 37B10-37D1 region." Chromosoma 83(1):45-58.
Wright, T. R., G. C. Bewley and A. F. Sherald (1976). "The genetics of dopa decarboxylase inDrosophila melanogaster. II. Isolation and characterization of dopa-decarboxylase-deficientmutants and their relationship to the alpha-methyl-dopa-hypersensitive mutants." Genetics84(2): 287-310.
Xue, W., L. Zender, C. Miething, R. A. Dickins, E. Hernando, V. Krizhanovsky, C. Cordon-Cardo and S. W. Lowe (2007). "Senescence and tumour clearance is triggered by p53restoration in murine liver carcinomas." Nature 445(7128): 656-60.
Yamaguchi, M., F. Hirose, Y. H. Inoue, M. Shiraki, Y. Hayashi, Y. Nishi and A. Matsukage(1999). "Ectopic expression of human p53 inhibits entry into S phase and induces apoptosisin the Drosophila eye imaginal disc." Oncogene 18(48): 6767-75.

154
Yan, Q., W. Sun, P. Kujala, Y. Lotfi, T. A. Vida and A. J. Bean (2005). "CART: AnHrs/Actinin-4/BERP/Myosin V Protein Complex Required for Efficient Receptor Recycling."Mol Biol Cell 16(5): 2470-82.
Yee, B. K., R. Keist, L. von Boehmer, R. Studer, D. Benke, N. Hagenbuch, Y. Dong, R. C.Malenka, J. M. Fritschy, H. Bluethmann, J. Feldon, H. Mohler and U. Rudolph (2005). "Aschizophrenia-related sensorimotor deficit links alpha 3-containing GABAA receptors to adopamine hyperfunction." Proc Natl Acad Sci U S A 102(47): 17154-9.
Yoshimura, K., H. Takeuchi, O. Sato, K. Hidaka, N. Doira, M. Terunuma, K. Harada, Y.Ogawa, Y. Ito, T. Kanematsu and M. Hirata (2001). "Interaction of p130 with, andconsequent inhibition of, the catalytic subunit of protein phosphatase 1alpha." J Biol Chem276(21): 17908-13.