the role of ccrl2 in the regulation of germinal centre b-cell
TRANSCRIPT

THE ROLE OF CCRL2 IN THE REGULATION OF GERMINAL CENTRE B-CELL
MIGRATION
AND
A NEW REGULATORY STEP IN T-CELL MIGRATION INTO TISSUE DURING
INFLAMMATION; SEPARATING THE WANTED FROM THE UNWANTED
BY
SARAH LOUISE COOK
A thesis submitted to the
University of Birmingham
For the degree of
MASTER OF RESEARCH
School of Immunity and Infection
College of Medical and Dental Sciences
University of Birmingham
August 2011

University of Birmingham Research Archive
e-theses repository This unpublished thesis/dissertation is copyright of the author and/or third parties. The intellectual property rights of the author or third parties in respect of this work are as defined by The Copyright Designs and Patents Act 1988 or as modified by any successor legislation. Any use made of information contained in this thesis/dissertation must be in accordance with that legislation and must be properly acknowledged. Further distribution or reproduction in any format is prohibited without the permission of the copyright holder.
1
CONTENTS
PROJECT 1
ABSTRACT ...................................................................................................................................................... 6
ABBREVIATIONS ............................................................................................................................................ 7
1. INTRODUCTION ......................................................................................................................................... 8
1.1 The White Pulp .................................................................................................................................... 8
1.2 T-cell dependent and T-cell independent responses .......................................................................... 8
1.2.1 The Germinal Centre .................................................................................................................. 10
1.3 An Overview of Chemokine Receptors ............................................................................................. 13
1.4 CCRL2 ............................................................................................................................................... 13
1.5 The Role of Chemokines in the Germinal Centre .............................................................................. 14
1.5.1 CCRL2 within the Germinal Centre ............................................................................................ 14
1.6 Aims of project .................................................................................................................................. 14
2. MATERIALS AND METHODS ................................................................................................................... 17
2.1 Mice for T-independent response .................................................................................................... 17
2.2 Mice for T-dependent immune response ......................................................................................... 17
2.3 cDNA Preparation ............................................................................................................................ 17
2.3.1 mRNA extraction. ....................................................................................................................... 17
2.3.2 cDNA preparation ...................................................................................................................... 17
2.4 Laser capture microdissection .......................................................................................................... 17
2.5 Taqman Semiquantitative Real Time PCR ......................................................................................... 18
2.6 SYBR Green Real Time PCR ............................................................................................................... 18
2.7 Western Blot ..................................................................................................................................... 18
2.7.1 Protein preparation from tissue ................................................................................................ 19

2
2.7.2 Protein concentration determination ........................................................................................ 19
2.7.3 Sodium Dodecyl Sulphate Polyacrylamide Gel Electrophoresis (SDS-PAGE) ............................. 19
2.7.4 Western Blot .............................................................................................................................. 19
2.8 Fluorescence staining of spleen sections .......................................................................................... 19
2.9 Production of plasmid vector containing CCRL2 DNA ...................................................................... 20
2.9.1 Transformation of E. coli ............................................................................................................ 20
2.9.2. Determination of positive plasmid clones ................................................................................ 21
3. RESULTS ................................................................................................................................................... 24
3.1 Presence of an alternative splice variant of CCRL2 in the thymus. .................................................. 24
3.1.1 SYBR Green Real Time PCR analysis of thymus, spleen and inguinal lymph node sections ...... 24
3.1.2 Taqman real-time PCR of thymus, spleen and lymph node sections ........................................ 24
3.1.3 Western Blot analysis using polyclonal rabbit anti-mouse CCRL2 antibody .............................. 31
3.2 The role of CCRL2 within cells of the Germinal Centre ..................................................................... 31
3.2.1 Expression of chemokine receptors in sorted B cells from a T-cell independent response. ..... 31
3.2.2 Attempt to stain for CCRL2 expression in whole spleen sections.............................................. 37
3.2.3 Expression of CCRL2 in microdissected spleen sections of a T-cell dependent response ......... 41
3.3 Cloning of the CCRL2 gene to produce a transfected cell line that can be used for monoclonal
antibody production ............................................................................................................................... 43
4. DISCUSSION ............................................................................................................................................. 46
4.1 Presence of an alternative splice variant of CCRL2 in the thymus ................................................... 46
4.2 The role of CCRL2 within the Germinal Centre ................................................................................ 48
4.3 Cloning of the CCRL2 gene to produce a transfected cell line that can be used for monoclonal
antibody production. .............................................................................................................................. 52
4.4 Future Work ...................................................................................................................................... 52
ABSTRACT .................................................................................................................................................... 55

3
ABBREVIATIONS .......................................................................................................................................... 56
5. INTRODUCTION ....................................................................................................................................... 57
5.1 A brief overview of leukocyte migration........................................................................................... 57
5.2 Lymphocyte capture to endothelium – the role of cytokines and adhesion molecules .................. 57
5.3 Stable lymphocyte adhesion to endothelium – the role of chemokines and integrins .................... 59
5.3.1 CCR5 ........................................................................................................................................... 60
5.3.2 CXCR3 ......................................................................................................................................... 60
5.4 Factors in lymphocyte transmigration through endothelium .......................................................... 61
5.5 Specific lymphocyte subtypes preferentially transmigrate through endothelium ........................... 62
5.6 Aims of project .................................................................................................................................. 63
6. MATERIALS AND METHODS .................................................................................................................... 64
6.1 Endothelial cell culture ..................................................................................................................... 64
6.2 Isolation of human peripheral blood lymphocytes ........................................................................... 66
6.3 Flow assay ......................................................................................................................................... 66
6.3.1. Analysis ..................................................................................................................................... 69
6.4 Flow cytometry ................................................................................................................................. 69
6.4.1. Flow cytometry analysis of perfused PBL cells ......................................................................... 69
6.4.2. Flow cytometry analysis of PBL treated with blocking antibodies against CXCR3 or CCR5 ..... 72
6.5 Statistical analysis ............................................................................................................................. 72
7. RESULTS ................................................................................................................................................... 73
7.1. Effect of different cytokine treatments on lymphocyte recruitment to HUVEC ............................. 73
7.1.1 Effect of cytokine treatment on adherence ............................................................................... 73
7.1.2. The effect of cytokine treatment on the behaviour of transmigrated PBL .............................. 76
7.1.3. The effect of cytokine treatment on recruitment of PBL subtypes. ......................................... 84

4
7.2. The effect of blocking the chemokine receptors CXCR3 and CCR5 on PBL adherence .................. 88
7.3. PBL adhesion to HMEC-1 using flow and static based assays .......................................................... 92
8. DISCUSSION ............................................................................................................................................. 96
8.1. The effect of cytokines on lymphocyte recruitment and behaviour. .............................................. 96
8.2 The effect of blocking two chemokine receptors on lymphocyte recruitment. ............................... 98
8.3 The use of HMEC-1 in flow. ............................................................................................................... 99
8.4 Future work. .................................................................................................................................... 100
REFERENCES .............................................................................................................................................. 101
APPENDIX A ............................................................................................................................................... 108
APPENDIX B ............................................................................................................................................... 114
APPENDIX C ............................................................................................................................................... 115

5
THE UNIVERSITY OF BIRMINGHAM
The Role of CCRL2 in the Regulation of Germinal Centre
B-Cell Migration This Project is Submitted in Partial Fulfilment of the
Requirements for the Award of the MRes
Sarah Cook (MRes Biomedical Research)
8/15/2011
6
ABSTRACT
CC-Chemokine receptor like 2 (CCRL2) is the newest member of the atypical chemokine receptor family,
a set of proteins which tend to act as “decoy receptors”, causing a chemoattractant gradient of their
ligands. Using SYBR-Green and Taqman RT-PCR analysis of murine tissue, this study aimed to
characterise the expression of CCRL2 in the spleen, thymus and lymph nodes. Using specifically
designed primers, the PCR techniques detected an alternative, “long”, spliced variant of CCRL2 within
the thymus. CCRL2 mRNA expression was also defined over 8 days, during the lifetime of the germinal
centre. CCRL2 mRNA expression was measured within B cells, the germinal centre or the T Zone. Due to
its high expression within plasma B cells at days 4 and 7, CCRL2 may be involved in plasma cell exit from
the GC. However, CCRL2 mRNA was also expressed within the germinal centre on days 7 and 8, which
may suggest the receptor also has a role in germinal centre breakdown. Finally, this study also started
the process of monoclonal antibody production to murine CCRL2. CCRL2 DNA was successfully cloned
into a plasmid vector and transformed into E. coli in preparation for transfection into a mammalian cell
line.
7
ABBREVIATIONS
ACR Atypical Chemokine Receptor
β2M β2-Microglobulin
BCR B-Cell Receptor
BLN Brachial Lymph Node
CCRL2 CC-Chemokine Receptor Like 2
CRAM Chemokine Receptor on Activated Macrophages
Ct Cycle Number of PCR threshold
DARC Duffy Antigen Receptor for Chemokines
DZ Dark Zone of the Germinal Centre
GC Germinal Centre
GPCR G-protein Coupled Receptor
H+ CCRL2 cDNA amplified with HindIII forward primer
H- PCR amplification with HindIII forward primer but without CCRL2 cDNA template
HA+ CCRL2 cDNA amplified with HindIII-ATG forward primer
HA- PCR amplification with HindIII-ATG forward primer but without CCRL2 cDNA template
HPRT Hypoxanthine-guanine phosphoribosyltransferase
ILN Inguinal Lymph Node
LN Lymph Node
LZ Light Zone of the Germinal Centre
MLN Mesenteric Lymph Node
QM Quasi-Monoclonal
RT-PCR Real Time Polymerase Chain Reaction
TD T-cell Dependent Response
TI T-cell Independent Response
TZ T-cell Zone
SDS-PAGE Sodium Dodecyl Sulphate Polyacrylamide Gel Electrophoresis
Tmelt Melting temperature of DNA
U/C Uncut plasmid vector

8
1. INTRODUCTION
The spleen is a secondary lymphoid organ located in the abdomen, connected to the stomach and
located directly below the diaphragm (1). It has a very distinct architecture, where different cells are
split into distinct areas within either red or white pulp (reviewed by Mebius and Kraal (1)). The red pulp
has the capacity to filter the blood and remove old erythrocytes and recycle iron (1). The white pulp,
however, is a zone of clonal expansion of activated B cells, with a structure similar to that of the lymph
node (1). This study focuses on the white pulp area.
1.1 The White Pulp
The lymphoid area of the spleen is the white pulp, where T and B cells are located in specific
compartments, which allows for B cell hypermutation and differentiation. A central arteriole is
surrounded by the T cell zone (TZ), also known as periarteriolar lymphoid sheath (PALS). Next to the TZ
are the follicles (which house the majority of naive B cells) and is surrounded by the marginal zone (MZ).
The marginal sinus is the site of entry for lymphocytes, macrophages and dendritic cells, and this is the
area which separates the red and white pulp (2). Although similar, the precise architecture of the white
pulp differs between human and mouse, particularly in the marginal zone (1, 3) (figure 1.1).
As stated, the white pulp is a compartment which allows for B cell hypermutation and differentiation.
Although B cells can be presented antigen by T cells, they can also respond directly to antigen as long as
it is able to cross-link the B cell receptor (BCR) (2).
1.2 T-cell dependent and T-cell independent responses
A T-cell dependent response (TD) is an antibody response by B cells which is induced by protein
antigens. Antigen is taken up by B cells which present it to T cells; recognition of the same antigen by
both B and T cells allows reciprocal activation of each other (2). Subsequent costimulation of the T cells
permits it to induce somatic hypermutation and class switching within the B cells (2), leading to the
formation of germinal centres.

9
Figure 1.1. Comparison of the splenic white pulp of a) mouse and b) human. Main differences include
the structure of the marginal zone, which in human is split into inner and outer sections. Picture adapted
from Mebius and Kraal (1)

10
Conversely, a T-cell independent response (TI) does not require the collaboration of T and B cells. This is
typical for non-peptide antigens such as DNA, polysaccharides and phospholipids which do not activate
T cells (4). TI responses can be split into two types; TI-I in which the antigen react with Toll-like
receptors on the B cells surface causing activation, and TI-II, where the antigen is able to cross link
multiple BCRs on the B cell surface (4). Both naive and experienced memory B cells participate in TI
responses (figure 1.2) however, the memory B cells have a much enhanced response to TI stimulation
(4). TI responses can also lead to class switching (2) and so the formation of a GC.
1.2.1 The Germinal Centre
The Germinal Centre (GC) is defined by MacLennan as a structure which “develops in the B-cell follicles
of secondary lymphoid tissues during TD responses, where B cells undergo massive clonal expansion and
activate a site-directed hypermutation mechanism on Ig-variable region genes” (5). These GCs are made
up of distinct areas and zones which aid this process (figure 1.3). The dark zone (DZ) contains large B
cells known as centroblasts, which rapidly proliferate (on every 6-8 hours), however only 2 or 3 B cells
per GC generate expanded clones (4). While proliferating, the B cells undergo somatic hypermutation of
the variable region of their antibody genes (4, 6). Somatic hypermutation is within the variable domains
of the immunoglobulin, occurring via single nucleotide changes or microdeletions (7) and causing either
enhanced or reduced affinity for the receptor to antigen.
Within the light zone (LZ) are smaller, nonproliferating centrocytes which are derived from the larger
centroblasts (6). These smaller cells compete for binding of antigen present by follicular dendritic cells
(6), with high affinity receptors out-competing low affinity ones and thus enabling cell survival. The
remaining B cells die via apoptosis due to lack of stimulation from the B cell receptor-antigen complex
(2). Two-photon laser-scanning microscopy has shown that B cells are able to move from the DZ to the
LZ and back again (8), however these results are regarded by many as controversial. Successfully
selected B cells can differentiate into plasma or memory cells in the LZ (2). To ensure an antibody
response occurs early after pathogen infection, B cells can leave the GC after a small number of
proliferation cycles, however others can remain in the GC for 2 weeks (4).

11
Figure 1.2 T-cell independent and T-cell dependent antibody responses. Adapted from Zubler (4)
Key: Bn - naive B cells; Bm – memory B cells; DC - dendritic cells; FDC - follicular dendritic cells; GC -
germinal centre; MZ - marginal zone; PL - plasma cells; TH - T helper cells.

12
Figure 1.3. Structure of the germinal centre; a) architecture of the GC within a B cell follicle.
Proliferating centroblasts are within the dark zone, nonproliferating centrocytes in the light zone; b)
immunostaining of a mouse spleen staining for IgD and CD35 (9)
13
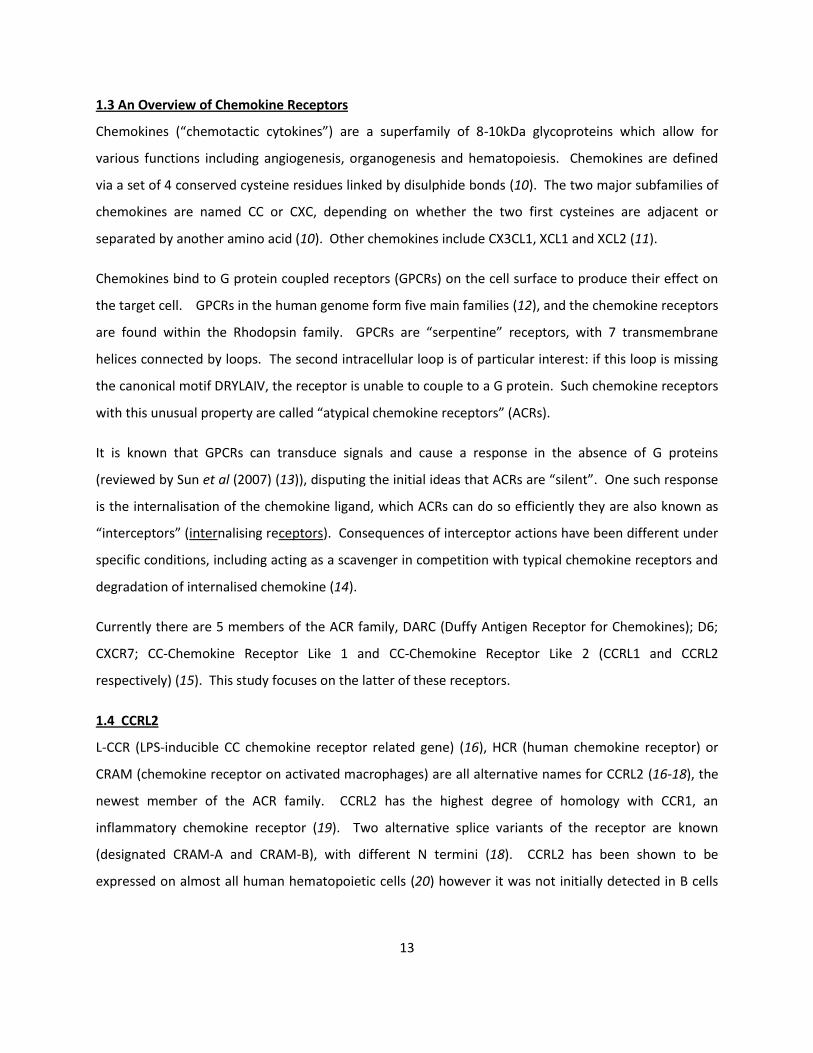
1.3 An Overview of Chemokine Receptors
Chemokines (“chemotactic cytokines”) are a superfamily of 8-10kDa glycoproteins which allow for
various functions including angiogenesis, organogenesis and hematopoiesis. Chemokines are defined
via a set of 4 conserved cysteine residues linked by disulphide bonds (10). The two major subfamilies of
chemokines are named CC or CXC, depending on whether the two first cysteines are adjacent or
separated by another amino acid (10). Other chemokines include CX3CL1, XCL1 and XCL2 (11).
Chemokines bind to G protein coupled receptors (GPCRs) on the cell surface to produce their effect on
the target cell. GPCRs in the human genome form five main families (12), and the chemokine receptors
are found within the Rhodopsin family. GPCRs are “serpentine” receptors, with 7 transmembrane
helices connected by loops. The second intracellular loop is of particular interest: if this loop is missing
the canonical motif DRYLAIV, the receptor is unable to couple to a G protein. Such chemokine receptors
with this unusual property are called “atypical chemokine receptors” (ACRs).
It is known that GPCRs can transduce signals and cause a response in the absence of G proteins
(reviewed by Sun et al (2007) (13)), disputing the initial ideas that ACRs are “silent”. One such response
is the internalisation of the chemokine ligand, which ACRs can do so efficiently they are also known as
“interceptors” (internalising receptors). Consequences of interceptor actions have been different under
specific conditions, including acting as a scavenger in competition with typical chemokine receptors and
degradation of internalised chemokine (14).
Currently there are 5 members of the ACR family, DARC (Duffy Antigen Receptor for Chemokines); D6;
CXCR7; CC-Chemokine Receptor Like 1 and CC-Chemokine Receptor Like 2 (CCRL1 and CCRL2
respectively) (15). This study focuses on the latter of these receptors.
1.4 CCRL2
L-CCR (LPS-inducible CC chemokine receptor related gene) (16), HCR (human chemokine receptor) or
CRAM (chemokine receptor on activated macrophages) are all alternative names for CCRL2 (16-18), the
newest member of the ACR family. CCRL2 has the highest degree of homology with CCR1, an
inflammatory chemokine receptor (19). Two alternative splice variants of the receptor are known
(designated CRAM-A and CRAM-B), with different N termini (18). CCRL2 has been shown to be
expressed on almost all human hematopoietic cells (20) however it was not initially detected in B cells

14
(21). A subsequent study reported that CRAM was expressed by B cells depending on the maturation
stage of that cell (22).
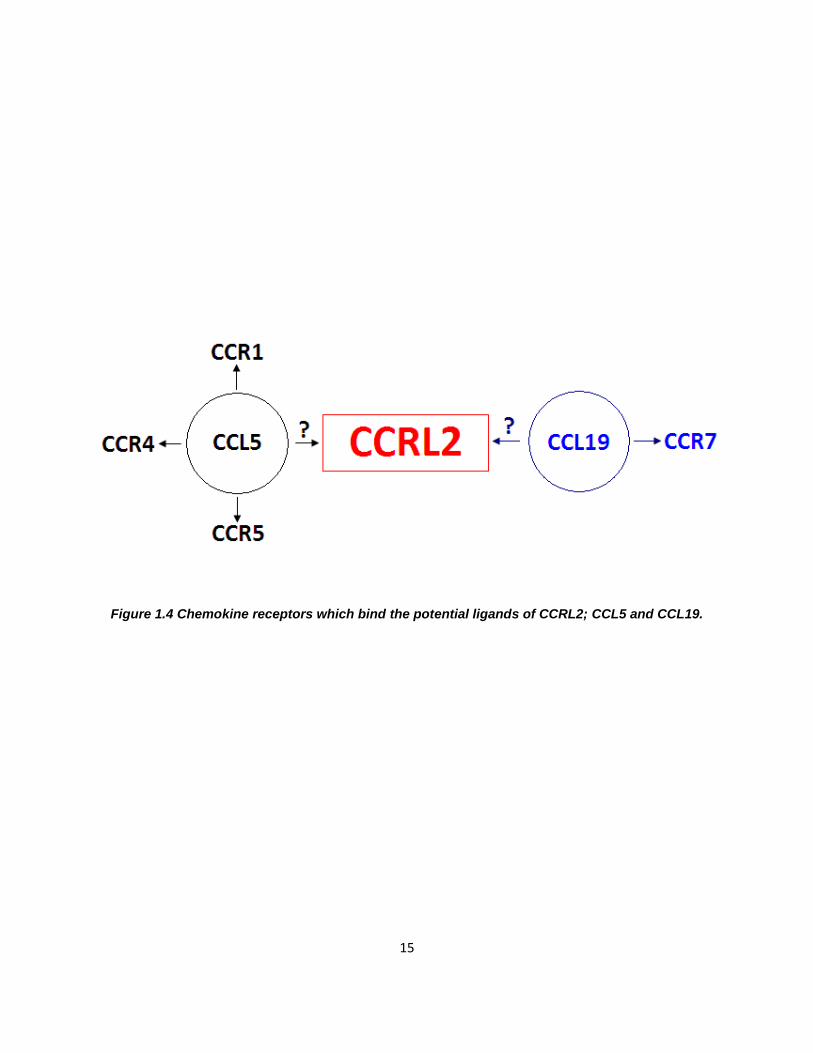
As of yet, a definitive ligand for mouse CCRL2 has been described in full (figure 1.4). In 2003 Biber and
colleagues investigated chemotaxis of CCRL2 expressing HEK 293 cells when stimulated with various
chemokines (23). This suggested that CCL2, CCL5, CCL7 and CCL8 induced chemotaxis, with CCL5 having
the greatest effect (23). However, the same result was not shown in CHO cell CCRL2 transfectants
within the same study (23) and also not shown in a second chemotaxis study by a different group who
used L1.2 cell transfectants (24). A more recent study by Leick et al. researched ligands for human
CRAM and determined that the chemokine CCL19 can bind with an affinity similar to that which it binds
another receptor, CCR7 (25).
1.5 The Role of Chemokines in the Germinal Centre
Chemokines play a crucial role in the formation and maintenance of the GC. For example, before the GC
has formed, CXCL13 expressed within the follicle is required for B cell migration to this area, the
receptor CXCR5 mediating this migration (26). Conversely, CCL19 and CCL21 expressed within the PALS
attract CCR7 expressing T cells and dendritic cells to the T-zone (27). The chemokine receptor CXCR5 is
required for direction of cells to the LZ, and without CXCR4, B cells are excluded from the DZ (28).
1.5.1 CCRL2 within the Germinal Centre
Although a role for CCRL2 has yet to be established within the GC, two sets of evidence point to
functional role of this chemokine receptor. First, Otero and colleagues showed that CCRL2 knockout
mice had normal recruitment of DCs to the lung, however this was defective in antigen loaded DCs to
mediastinal LNs (19). Second, CCRL2 has been shown to be present within the B cell follicle of the
human LN using fluorescent staining (figure 1.5).
1.6 Aims of project
To characterise the expression of CCRL2 within the spleen, lymph node and thymus of mouse
To determine the expression of CCRL2 in B cells over the days of a germinal centre reaction
To clone CCRL2 into a plasmid vector for the first stages of monoclonal antibody production
15
Figure 1.4 Chemokine receptors which bind the potential ligands of CCRL2; CCL5 and CCL19.

16
Figure 1.5 Human lymph node B cell follicle stained for CCRL2 (red) and DAPI (gray). Image provided by
Poonam Kelay and Antal Rot, University of Birmingham.

17
2. MATERIALS AND METHODS
2.1 Mice for T-independent response
Mouse work was carried out by others and is shortly summarised here. QM B18κeYFP mice were
sacrificed, spleens removed and B cells sorted. C57BL6 mice were injected with these B cells and one
day later immunised with NP-Ficoll. After immunisation mice were sacrificed after 0, 1, 3, 4 or 7 days.
Spleens were removed and B cells were sorted by FACS into eYFP+, eYFP- or further into eYFP+CD138-
(donor germinal centre B cells), eYFP+CD138+ (donor plasma B cells) and eYFP-CD138- (host B cells).
2.2 Mice for T-dependent immune response
C57BL6 mice were primed with chicken gamma globulin (CGG) and after 5 weeks injected with NP-CGG
and anti-NP IgM. Mouse was sacrificed on day 8 and spleen extracted.
2.3 cDNA Preparation
2.3.1 mRNA extraction.
Tissue sections or sorted cell samples were stored at -80°C until needed. Samples were disrupted using
the QIAshredder columns (Qiagen, Crawley, UK) or via mechanical homogenisation and extraction of
mRNA was conducted using the RNeasy Mini kit (tissue samples and sorted cells >20,000 in number) or
RNeasy Micro kit (sorted cells <20,000 in number) (Qiagen) as per the manufacturer’s instructions. RNA
was eluted in 30µl of RNAse free water and stored at -80°C until required.
2.3.2 cDNA preparation
cDNA was prepared by one of two methods. Either the 30µl RNA sample was mixed with 3µl random
primer (Promega Biosciences, CA, USA) and denatured at 70°C for 10mins. This was shock cooled on ice
and 27µl of reverse transcription mix was added (table 2.1). The sample was incubated for 1hr at 41°C
and subsequently at 90°C for 10mins. In the second method the sample was diluted to 833ng of RNA in
a 14µl solution and to this 6µl of Superscript VILO reverse transcription mix was added (Invitrogen,
Paisley, Scotland; table 2.1). Sample was heated to 25°C for 10 mins, 42°C for 60mins and subsequently
85°C for 5mins. Prepared cDNA was stored at -20°C until needed.
2.4 Laser capture microdissection

18
6µm spleen sections from mouse in 2.2 were cut using a cryostat (Bright Instruments, Huntington, UK)
and picked onto PALM Membrane Slides NF (PALM Microlaser Technologies, Bernried, Germany) and
adjacent sections were cut onto teflon framed glass slides. All were fixed in acetone at 4°C for 20mins.
PALM slides were stained in 1% cresyl violet for 2.5mins, were washed sequentially in 50%, 70% and
100% ethanol and subsequently air dried.
Stained glass slides were used as a reference for sections to be cut from the PALM Membrane Slides NF.
Laser capture microdissection was performed using a Microbeam HT microscope (PALM Microlaser
Technologies) and Palm@Robo software version 3.0. Microdissected areas were captured into 20µl RLT
buffer (Qiagen) and cDNA prepared as previously described (section 2.1)
2.5 Taqman Semiquantitative Real Time PCR
1µl of cDNA preparation added to a well of a 384 well plate along with relevant primers and probes
(appendix A) with 1x Taqman Universal PCR Master Mix (all Applied Biosystems, CA, USA). The plate is
covered with clear adhesive foil (Applied Biosystems), vortexed and centrifuged (short spin up to
2000rpm). Wells contained primers specific for both target gene and housekeeping gene (β2-
microglobulin, [β2M]) according to previous optimisation experiments. Plate was loaded into an ABI
7900 Real-time PCR machine (Applied Biosystems) with a temperature cycle as shown in table 2.2.
Fluorescence analysis was performed by SDS 2.2.2 software (Applied Biosystems) with a threshold set
manually during the logarithmic phase of the PCR. The cycle where signal above threshold was obtained
(Ct) was recorded for each sample, and relative quantity of target gene expressed deduced by taking ΔCt
(Ct-sample minus Ct-housekeeping) and calculating 2-ΔCt. A one-tailed Mann-Whitney U Test was
performed to test statistical significance.
2.6 SYBR Green Real Time PCR
13.5µl SYBR Green PCR reaction mix (table 2.1) was added to each well, made up of either forward and
reverse primers for CCRL2 or the housekeeping gene hypoxanthine-guanine phosphoribosyltransferase
(HPRT). RNA extracted from thymus, spleen and lymph node by others had cDNA prepared as
described. This was diluted 5x and 11.5µl added to the wells. Plate was loaded into Stratagene
Mx3000P machine (Agilent Technologies, Edinburgh, UK) with the cycle shown in table 2.2.
Fluorescence analysis was performed using MxPro Software.
2.7 Western Blot
19
2.7.1 Protein preparation from tissue
Thymus, spleen, mesenteric lymph node (MLN) and inguinal lymph node (ILN) extracted from 8 week
C57BL6 mouse and frozen in liquid nitrogen until needed. Tissues were dissected and appropriate
amounts of RIPA lysis buffer were added depending on the mass of the tissue (300µl lysis buffer for
every 5mg tissue). Tissues were homogenised and left on a shaker at 4°C for 2 hours. Samples were
centrifuged at 4°C for 20mins at 12000 rpm and kept at -80°C until needed.
2.7.2 Protein concentration determination
Protein concentration of each sample was determined using Pierce BCA Protein Assay Kit (Thermo
Scientific, MA, USA) as per the manufacturer’s instructions.
2.7.3 Sodium Dodecyl Sulphate Polyacrylamide Gel Electrophoresis (SDS-PAGE)
Separation gel was made up to a 15% acrylamide. Markers used were Pageruler Plus Protein Ladder
(Fermentas Life Sceinces, St. Leon-Rot, Germany). 11µg total protein was loaded.
2.7.4 Western Blot
Proteins transferred from gel to membrane and membrane blocked overnight with 5% milk PBS-
0.1%Tween (PBST). Incubated 1hr in mouse anti-β-actin antibody or polyclonal rabbit anti-mouse CCRL2
antibody (Sigma-Aldrich, Poole, UK) in 5% milk PBST and subsequently washed three times for 15mins in
PBST. Further incubation for 1hr in biotinylated-goat anti-mouse-IgG (Invitrogen) or anti-rabbit IgG-
biotin (Sigma-Aldrich) in 5% milk PBST and washed as before. Final incubation of 1hr with strepavidin
peroxidise (Sigma-Aldrich) in 5% milk PBST before five 5min PBST washes. Blots developed with
Chemiluminescent peroxidase substrate (Sigma-Aldrich).
2.8 Fluorescence staining of spleen sections
Spleen sections were cut by others onto glass slides using a cryostat to a thickness of 6µm. Sections
were blocked for 15min with 10% goat serum before being stained with polyclonal rabbit anti-mouse
CCRL2 antibody (Sigma-Aldrich) for 1 hour. Slides were washed in PBS before application of polyclonal
goat anti-rabbit-biotinylated (Dako, Ely, UK) secondary antibody for 30 mins. After another wash step
slides were incubated with streptavidin-555 (Invitrogen) in the dark for 20mins. A further wash step was
conducted before the slides were stained with DAPI and washed 3 times. 1 drop of Vectashield
Mounting Medium (Vector Laboratories, Peterborough, UK) was added to each spleen section before

20
coverslip added and sealed using clear nail varnish. Slides were viewed using a Leica Microscope
DM6000.
2.9 Production of plasmid vector containing CCRL2 DNA
2.9.1 Transformation of E. coli
2.9.1.1 Amplification of CCRL2 DNA
A commericially available vector carrying myc-dkk c-terminal tagged CCRL2 cDNA (Origene, MD, USA)
was used as a template for CCRL2 amplification. The reaction was designed to remove the tags and add
a stop codon as well as restriction enzyme sites to enable further cloning. Two sets of alternative
forward primers were used that amplified from the ATG start codon or included an upstream sequence
containing a ribosomal binding site with Kozac sequence (table 2.1 and PCR program in table 2.2).
2.9.1.2 Ligation of CCRL2 DNA with plasmid vector
Amplified DNA plus negative controls were separated on a 1% agarose gel with SYBR Safe, all
subsequent agarose gels used this method. The agarose with DNA of expected product size (1150bp)
were cut from the gel and purified using GeneJET Gel Extraction Set (Fermentas Life Sciences) as per the
manufacturer’s instructions. Further visualisation of the gel ensured that all DNA extracted. DNA
concentration was determined using a Nandrop 1000 Spectrophotometer (Thermo Scientific). The
vector pLNCX2 (ClonTech, USA, Appendix B) and amplified CCRL2 DNA were incubated with SalI and
HindIII restriction enzymes in 2x Tango buffer, as recommended by Double Digest application
(Fermentas Life Sciences) or incubated with HindIII and SalI enzymes separately. The DNA was purified
using a PCR purification kit (Fermentas Life Sciences) as per the manufacturer’s instructions. The
restriction digest was evaluated using agarose gel. The vector pLNCX2 was incubated with either the cut
HindIII or HindIII-ATG amplified CCRL2 DNA with the LigaFast Rapid DNA Ligation System (Promega
Biosciences), as per the manufacturer’s instructions.
2.9.1.3 Transformation of E. coli with vector containing CCRL2 DNA
50µl aliquots of α-select chemically competent cells (Bioline) were stored at -80°C until required, and
were thawed on wet ice. 5µl of ligated vector was added to the cells were and incubated on ice for
30mins. The bacteria were transformed by heat-shock at 42°C for 30-45s and subsequently incubated
on ice for 2mins. 945µl of SOC media was added and tubes incubated for 1hr at 200rpm at 37°C. The
transformed bacteria were plated on agar with carbenicillin (Bioline, London, UK) and incubated

21
overnight at 37°C. Individual colonies were thereafter grown in LB broth with carbencillin on shaker
overnight at 37°C.
2.9.2. Determination of positive plasmid clones
Overnight bacterial colonies were used for vector purification using GeneJET Plasmid MiniPrep
(Fermentas Life Sciences) as per the manufacturer’s instructions and incubated overnight with SalI and
XhoI restriction enzymes in Buffer O, as recommended by Double Digest application (Fermentas Life
Sciences). Samples analysed using agarose gel. Positive clones were sequenced at The University of
Birmingham Biosciences Department using forward and reverse primers for the vector (appendix B).

22
Table 2.1 Reaction Mixtures and buffers.
Reverse Transcription Mix
SuperScript VILO
Reverse
Transcription Mix
SYBR Green PCR Mix
CCRL2 Amplification
Reaction Mix
12µl 5x first strand buffer
(Invitrogen)
2µl 10X SuperScript
Enzyme Mix 12.5µl SensiMix 2 times 0.4µl 10mM dNTP
6µl DTT 0.1M (Invitrogen) 4µl 5X VILO
Reaction Mix 0.5µl SYBR Green
4µl 5X Phusion HF
Buffer (New England
Biolabs)
3µl dNTP (10mM)
(Invitrogen)
0.25µl 20µM CCRL2
Forward primer
0.5µl 20µM CCRL2
forward primer
3µl Moloney murine
leukemia virus reverse
transcriptase (Invitrogen)
0.25µl 20µM CCRL2
Reverse primer
0.5µl 20µM CCRL2
reverse primer
1.5µl RNasin RNase inhibitor
(Promega)
13.4µl water
1.5µl RNase free water
0.2µl Phusion DNA
polymerase (New
England Biolabs)

23
Table 2.2. PCR cycling programmes.
Semiquantitative Real-time
PCR SYBR Green PCR CCRL2 Amplification PCR
50°C for 2mins 95°C for 10min 98°C for 30s
95°C for 10mins 95°C for 20s
For 40 cycles
98°C for 10s For 37
cycles 95°C for 15s
For 40 cycles
65°C for 20s 72°C for 45s
60°C for 1min 72°C for 30s 72°C for 2mins
Tmelt curve addition 4°C until DNA needed

24
3. RESULTS
3.1 Presence of an alternative splice variant of CCRL2 in the thymus.
3.1.1 SYBR Green Real Time PCR analysis of thymus, spleen and inguinal lymph node sections
Previous work within the group had suggested that CCRL2 mRNA is spliced differently in the thymus –
indicating the possible existence of a longer form of the protein. These previous findings were
supported in this study using SYBR Green PCR and analysing the dissociation curve of CCRL2 cDNA
prepared from mouse thymus, spleen and ILN (figure 3.1). Both the spleen and ILN sections had a
melting temperature (Tmelt) of 82°C. However, even though the thymus had a minor peak in
fluorescence at 82°C, the major fluorescence was seen at 85°C.
3.1.2 Taqman real-time PCR of thymus, spleen and lymph node sections
3.1.2.1 Optimisation of Taqman real-time PCR CCRL2 long and short primers
To further determine differences in long and short forms of the CCRL2 transcript, primers and probes
were designed for use in Taqman real-time PCR applications (appendix A). Optimisation of reaction
conditions for these CCRL2 long and short primers and probes occurred in three stages. First, the
optimal primer concentration was deduced, using a checkerboard titration with forward and reverse
primers in 900nM, 300nM and 50nM concentrations. The probe concentration was kept constant. For
both the long and short CCRL2 primers, 900nM/900nM was found to be the optimal concentration for
both the forward and reverse primers (ie concentration at which the Ct was consistently at its lowest
value (figure 3.2).
Second, the optimal probe concentration was determined, where probe was diluted from 225 to 25nM
in solutions containing forward and reverse primers at 900nM (deduced optimal concentration). Both
the long and short primer probes gave the lowest Ct at 200nM (figure 3.3).

25
Figure 3.1. SYBR Green RT-PCR dissociation curve for thymus, spleen and inguinal lymph node. cDNA amplified
using CCRL2 primers. Primers for experiment are listed in Appendix A.
Key (duplicates):

26
Figure 3.2. First stage of Taqman real-time primer optimisation - determination of optimal primer
concentration. a) Ct against primer concentration for CCRL2 short form primer; b) Ct against primer
concentration for CCRL2 long form primer. Optimal concentration of primers is that which gives the
lower Ct at the lowest primer concentration

27
Figure 3.3. Optimisation of CCRL2 a) short and b) long FAM probe. Both show Ct against increasing
probe concentration. Probe was diluted but cDNA template and primer concentration stayed constant.
Optimal probe concentration is the lowest concentration which gives the gives lowest Ct value.

28
Finally, the primers were analysed for their ability to be used in a multiplex reaction with the
housekeeping gene β2M. Serial dilutions of the cDNA template were analysed with only CCRL2 primers,
only β2M primers or both together, and the relationship between dilution and Ct compared for each
(figure 3.4). The short form of the primer shows that upon dilution, the Ct value for both β2M and
CCRL2 remains similar (figure 3.4a), indicating that it is capable of being used in a multiplex reaction
with the housekeeping gene. Conversely, although at higher dilutions the long form gives similar Ct
values for both the target and housekeeping genes (figure 3.4b), at smaller dilutions it does not give any
signal when used in multiplex. Therefore, although it could be possible to use the two primers in
multiplex, to reduce risk within this study only singleplex reactions are used.
3.1.2.2 Detection of long and short forms of CCRL2 in thymus, spleen and lymph node sections using
Taqman RT-PCR
cDNA was prepared from the sections of thymus, spleen, ILN (n=3), Brachial Lymph Node (BLN) and MLN
(n=2) of 8 week wild type BL6 mice. 1µl of cDNA was loaded into a 384-well plate along with optimised
CCRL2 short (multiplexed with β2-M) or optimised CCRL2 long (singleplex) primers and RT-PCR was
performed. To ensure the results were not due to the nature of the housekeeping gene used, both
short and long isoforms were compared to the expression of β-actin mRNA. Figure 3.5 shows that with
both housekeeping genes, all tissues produced a signal with CCRL2 short primers. In this study, long
form CCRL2 was amplified not only from the thymus, but also from spleen and ILN samples. However,
the median levels of expression of the long form of CCRL2 mRNA in spleen and ILN are at least 10x lower
than expression within the thymus.

29
Figure 3.4. β2-Microglobulin and CCRL2 a) short and b) long primers amplification either in
singleplex or in multuiplex. The cDNA template is diluted and primers and probes are used in
singleplex and multiplex reactions at their optimal concentrations to determine if the presence of the
housekeeping primers changes the efficiency of amplification.
Key:

30
Figure 3.5. RT-PCR of spleen, thymus, ILN, BLN and MLN sections with CCRL2 long or short form
primers. Relative expression of both forms of the protein with housekeeping gene a) β2-M and b) β-
actin.
Key:
31
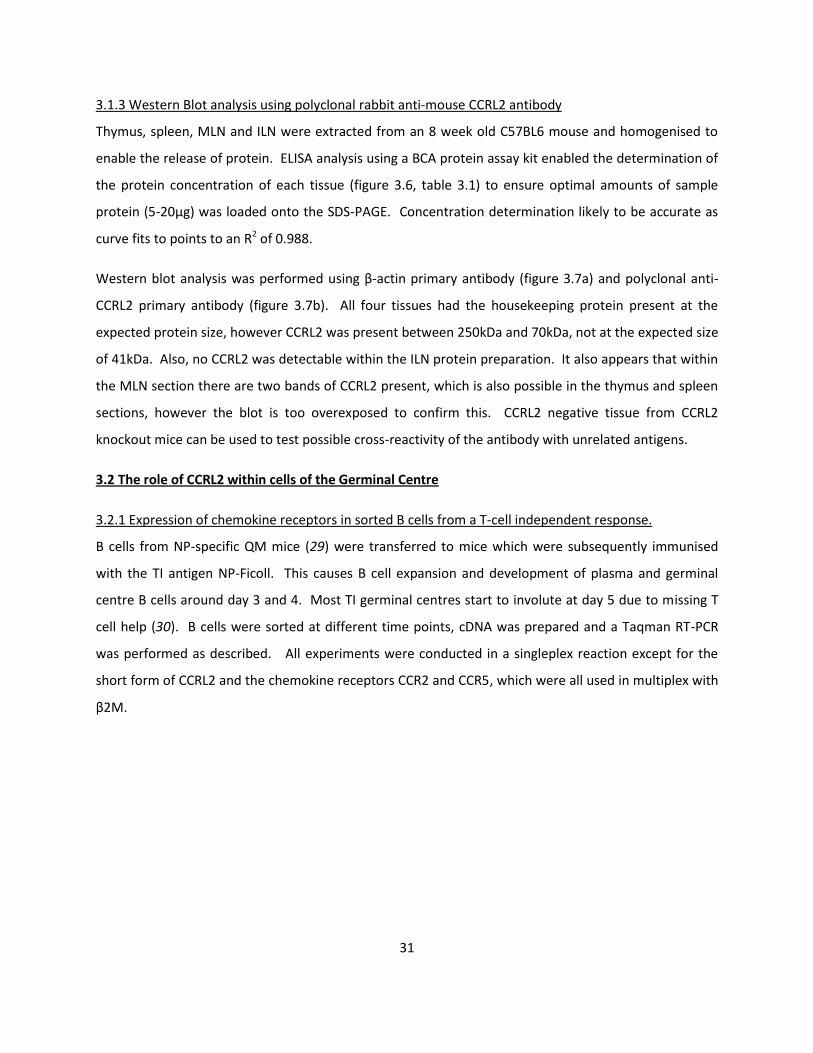
3.1.3 Western Blot analysis using polyclonal rabbit anti-mouse CCRL2 antibody
Thymus, spleen, MLN and ILN were extracted from an 8 week old C57BL6 mouse and homogenised to
enable the release of protein. ELISA analysis using a BCA protein assay kit enabled the determination of
the protein concentration of each tissue (figure 3.6, table 3.1) to ensure optimal amounts of sample
protein (5-20µg) was loaded onto the SDS-PAGE. Concentration determination likely to be accurate as
curve fits to points to an R2 of 0.988.
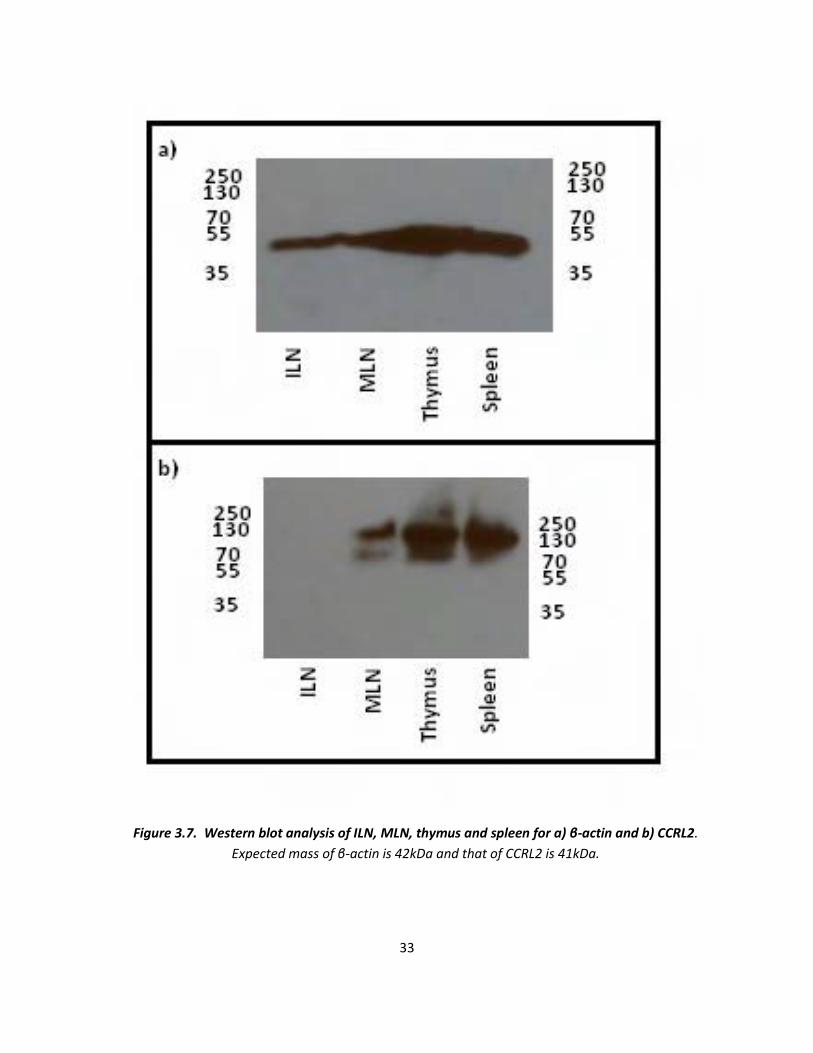
Western blot analysis was performed using β-actin primary antibody (figure 3.7a) and polyclonal anti-
CCRL2 primary antibody (figure 3.7b). All four tissues had the housekeeping protein present at the
expected protein size, however CCRL2 was present between 250kDa and 70kDa, not at the expected size
of 41kDa. Also, no CCRL2 was detectable within the ILN protein preparation. It also appears that within
the MLN section there are two bands of CCRL2 present, which is also possible in the thymus and spleen
sections, however the blot is too overexposed to confirm this. CCRL2 negative tissue from CCRL2
knockout mice can be used to test possible cross-reactivity of the antibody with unrelated antigens.
3.2 The role of CCRL2 within cells of the Germinal Centre
3.2.1 Expression of chemokine receptors in sorted B cells from a T-cell independent response.
B cells from NP-specific QM mice (29) were transferred to mice which were subsequently immunised
with the TI antigen NP-Ficoll. This causes B cell expansion and development of plasma and germinal
centre B cells around day 3 and 4. Most TI germinal centres start to involute at day 5 due to missing T
cell help (30). B cells were sorted at different time points, cDNA was prepared and a Taqman RT-PCR
was performed as described. All experiments were conducted in a singleplex reaction except for the
short form of CCRL2 and the chemokine receptors CCR2 and CCR5, which were all used in multiplex with
β2M.
32
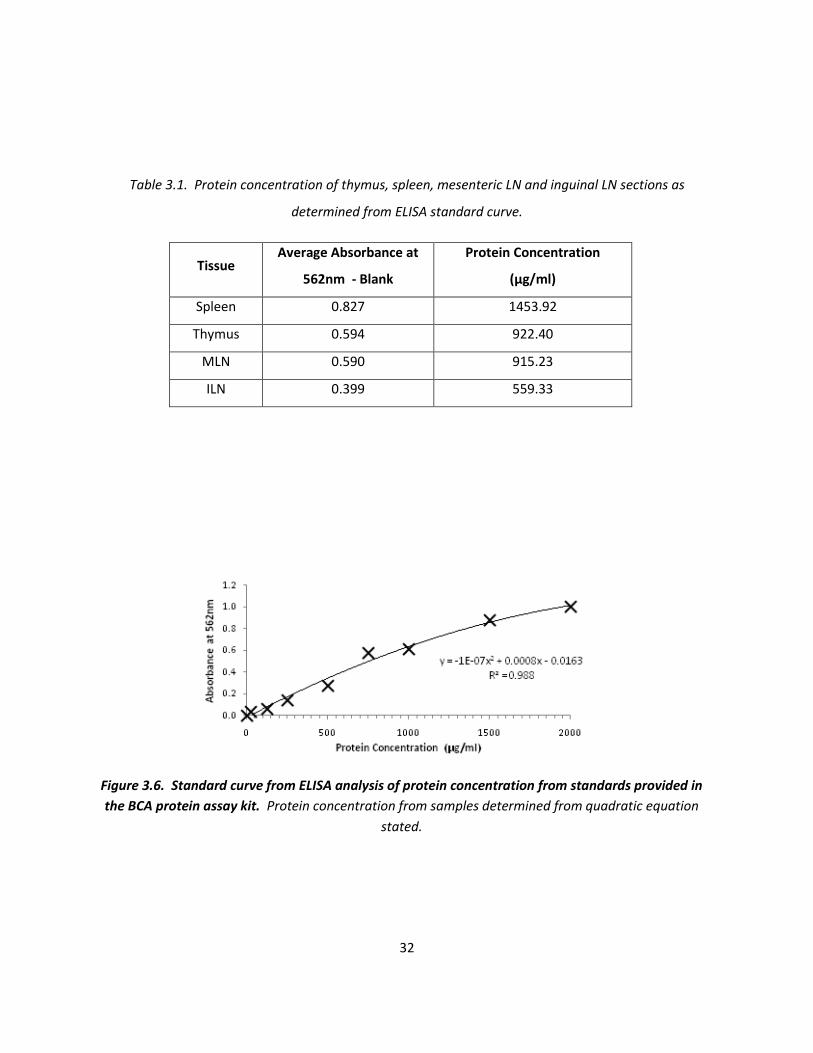
Table 3.1. Protein concentration of thymus, spleen, mesenteric LN and inguinal LN sections as
determined from ELISA standard curve.
Tissue Average Absorbance at
562nm - Blank
Protein Concentration
(µg/ml)
Spleen 0.827 1453.92
Thymus 0.594 922.40
MLN 0.590 915.23
ILN 0.399 559.33
Figure 3.6. Standard curve from ELISA analysis of protein concentration from standards provided in
the BCA protein assay kit. Protein concentration from samples determined from quadratic equation
stated.
33
Figure 3.7. Western blot analysis of ILN, MLN, thymus and spleen for a) β-actin and b) CCRL2.
Expected mass of β-actin is 42kDa and that of CCRL2 is 41kDa.

34
CXCR5 is a chemokine receptor that is important for follicular organisation, and it has also been
associated with germinal centre organisation (28). Figure 3.8 shows the expression of CXCR5 mRNA in
sorted cells. On days 3 and 4 post NP-Ficoll immunisation, the expression of this receptor on activated B
cells is significantly reduced compared to that on the non-activated host B cells (p=0.01). Upon reaching
day 7 CXCR5 levels in GC cells have become similar to unstimulated follicular host B cells, while it is
undetectable in plasma cells (p=0.03).
To determine whether CCRL2 has a role during B cell differentiation its expression was detected using
RT-PCR (figure 3.9). CCRL2 is present in baseline levels on unactivated cells on day 0 and day 3. Four
days after immunisation CCRL2 mRNA is present on plasma B cells, while on GC B cells it is expressed at
baseline levels (p=0.01), with plasma cells having approximately 10x more expression of CCRL2 mRNA.
By day 7, there is no difference in CCRL2 expression on plasma cells, however, GC B cells at this stage
now also express the mRNA at a level similar to that of plasma B cells. However, the difference between
days 4 and 7 GC B cells is insignificant (p=0.1), even though the figure would suggest otherwise. The
likely cause of would probably the single anomalous result where the mRNA expression of CCRL2 10x
lower than of the other GC B cell samples.
On day 7 non-activated host B cells seem to express lower levels of CCRL2 mRNA than the transferred B
cells. This difference, however, was insignificant. It is possible that this is due to a mix up in 2 samples
from one of the four mice used in this experiment (figure 3.9), indicating that the experiment should be
repeated.
CCRL2 long form primer was also tested on all these samples and was undetectable in each sample (data
not shown).

35
Figure 3.8. Expression of chemokine receptor CXCR5 in B cells sorted on different days after a T-cell independent
immune response. * p= 0.03; ** p= 0.01
Key:

36
Figure 3.9. Relative expression of CCRL2 short form in B cells sorted on different days after a T-cell independent
immune response. *p=0.01
Key:

37
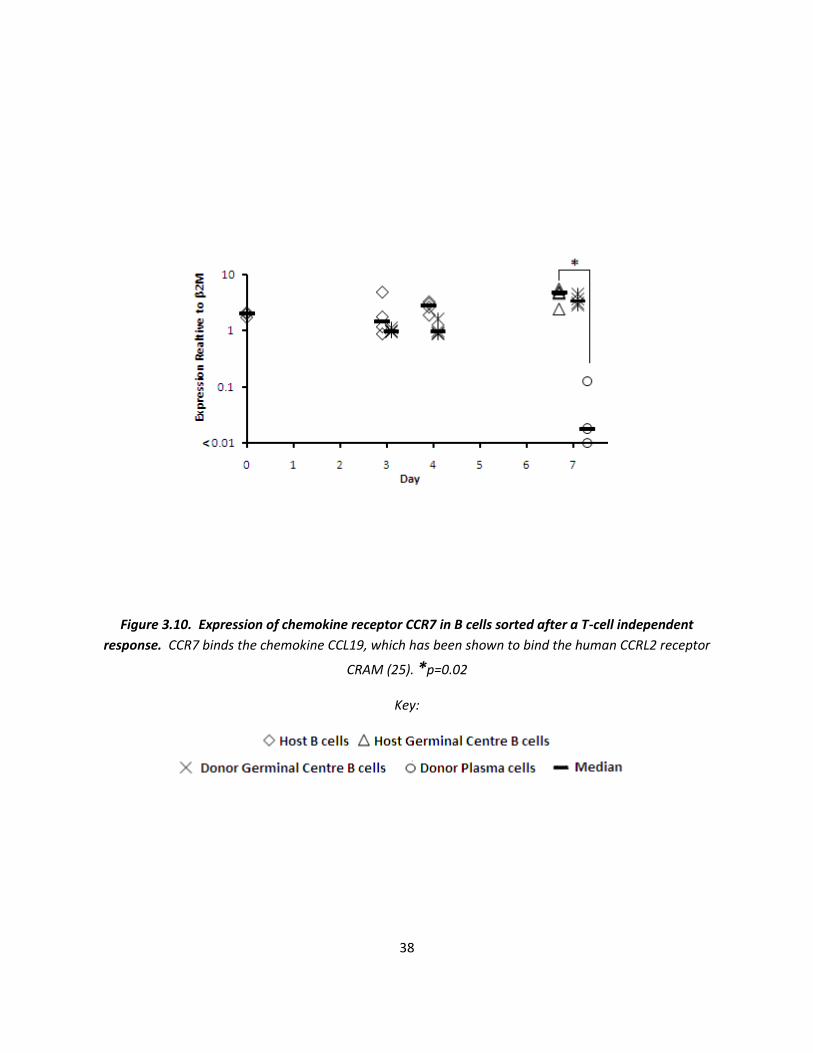
Figures 3.10 and 3.11 show the expression mRNA coding for other chemokine receptors on the sorted B
cell population, particularly those which potentially share ligands with CCRL2 (figure 1.4). CCR7 binds
the chemokine CCL19, and its mRNA expression is shown in figure 3.10. It shows that CCR7 is expressed
on non-activated B cells. mRNA expression on activated GC cells is also high. However, at day 7 a vast
difference (100x less) of CCR7 mRNA is shown within plasma cells (p=0.02). It should also be noted that
this is the only chemokine receptor studied where expression on the mRNA level appears to be higher
than that of the housekeeping gene.
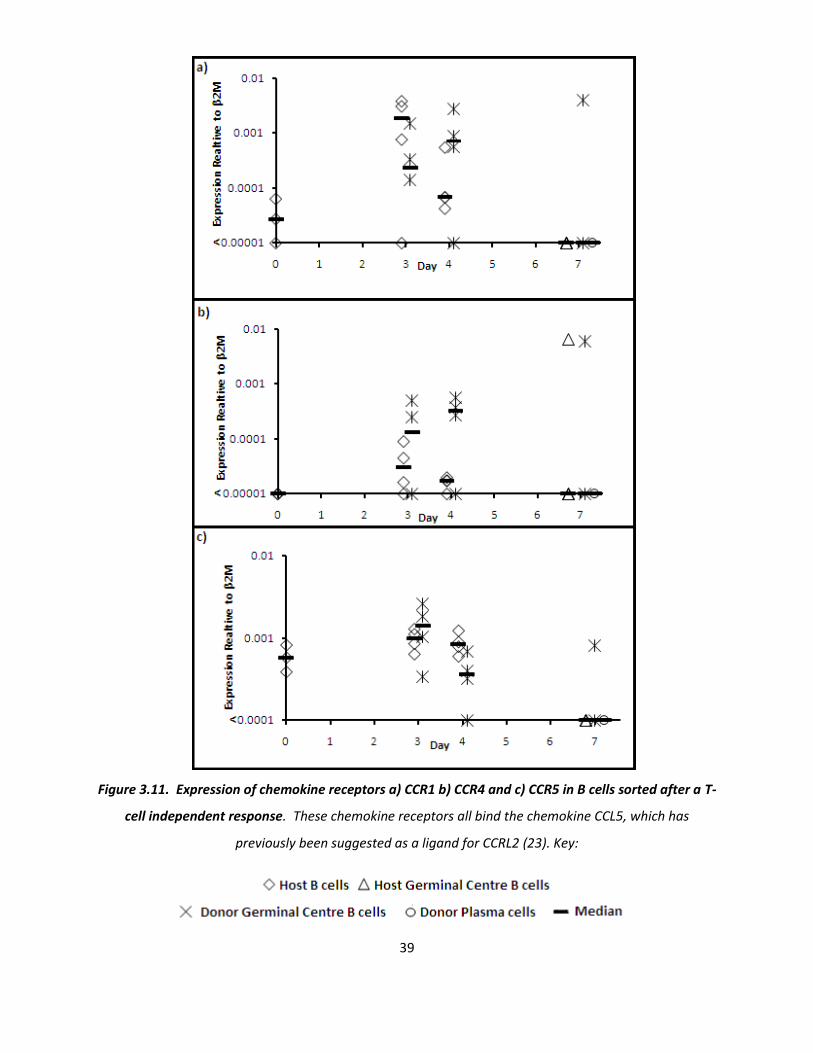
The final three chemokine receptors to be studied were CCR1, CCR4 and CCR5 (figure 3.11). These three
receptors all bind CCL5, another potential ligand for CCRL2 (figure 1.4). All of these chemokine
receptors show an increased expression in early GC B cells (day 3 and day 4). Interestingly, host cells
showed an increase in this chemokine receptor at the same time. On day 7, all sorted cell populations
had lost expression of all 3 chemokine receptors.
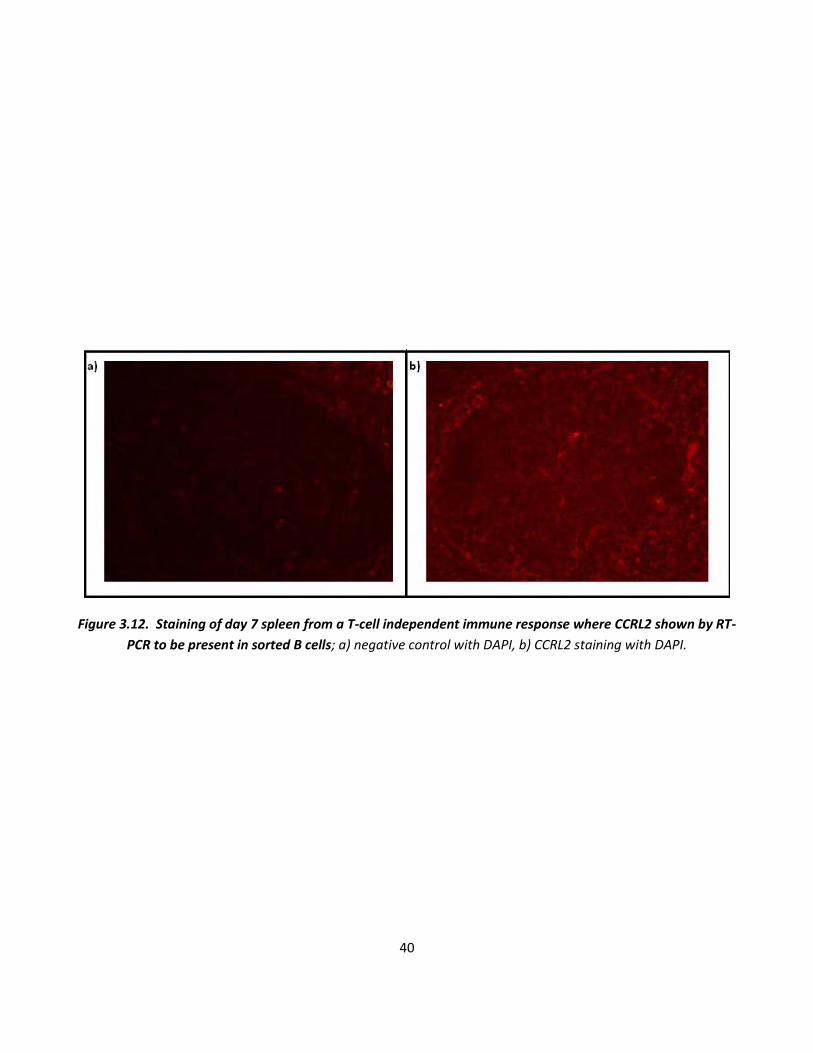
3.2.2 Attempt to stain for CCRL2 expression in whole spleen sections
Although the antibody ordered from Sigma-Aldrich was tested by the company on spleen sections in a
Western blot analysis, it had not been previously tested for tissue staining. For this purpose, the
antibody was used to stain 6µm spleen sections of day 7 TI response, where CCRL2 shown to be
expressed in plasma and germinal centre B cells from RT-PCR data. A negative control was also used,
where there was no primary antibody present (figure 3.12a). Fluorescence was greater in the section
with anti-CCRL2 antibody (figure 3.12b) showing that the staining is due to primary antibody. However,
the staining does not localised to B cells. Staining of CCRL2 negative tissue from CCRL2 knockout mice
will deduce if this staining is specific for CCRL2, or due to cross reactivity with other antigens. If this is
not the case, further optimisation of the antibody concentrations may be worthwhile. This experiment
confirms the need for better reagents to stain for CCRL2 tissue sections.
38
Figure 3.10. Expression of chemokine receptor CCR7 in B cells sorted after a T-cell independent
response. CCR7 binds the chemokine CCL19, which has been shown to bind the human CCRL2 receptor
CRAM (25). *p=0.02
Key:
39
Figure 3.11. Expression of chemokine receptors a) CCR1 b) CCR4 and c) CCR5 in B cells sorted after a T-
cell independent response. These chemokine receptors all bind the chemokine CCL5, which has
previously been suggested as a ligand for CCRL2 (23). Key:
40
Figure 3.12. Staining of day 7 spleen from a T-cell independent immune response where CCRL2 shown by RT-
PCR to be present in sorted B cells; a) negative control with DAPI, b) CCRL2 staining with DAPI.

41
3.2.3 Expression of CCRL2 in microdissected spleen sections of a T-cell dependent response
Mice primed with CGG had the spleen extracted 8 days post NP-CGG immunisation. Spleen sections
were cut onto a PALM membrane slide and subsequently dissected using laser assisted microdissection.
Due to time constraints, only GC (n=4), TZ (n=4) and membrane negative control (n=2) areas were cut.
Firstly, the sections were tested for the transcription factor IRF-4 and β2M, as a positive control for
cDNA preparation (figure 3.13a) and were then tested for CCRL2 both short and long form (figure 3.13b).
The membrane negative control had undetectable levels of IRF-4 and β2M cDNA (data not shown) but
both GC and TZ areas had detectable levels of both (figure 3.13a), indicating cDNA preparation had been
successful. Upon detection of CCRL2 short form, it was shown that it is present in significantly higher
levels within the GC than within the TZ (p=0.01). The long form was undetectable in both GC and TZ
samples (data not shown).

42
Figure 3.13 RT-PCR of microdissected GC and TZ areas of a spleen section 8 days after a TD
response; a) IRF-4 indicates microdissection and cDNA preparation successful; b) CCRL2 short
primers. *p=0.01

43
3.3 Cloning of the CCRL2 gene to produce a transfected cell line that can be used for monoclonal
antibody production
Previously prepared CCRL2 cDNA was amplified using forward primers that contained an additional
HindIII or HindIII-ATG restriction site, and a reverse primer containing a SalI restriction site. The PCR
product was separated on a 1% agarose gel to ensure amplification was successful and also that the
CCRL2 amplicon was not contaminated (figure 3.14a, expected product size 1150bp). Gel containing
amplified DNA was cut out and the DNA extracted (figure 3.14b). DNA was purified to a final
concentration of 8.2ng/µl and 8.8ng/µl for the HindIII and HindIII-ATG DNAs, respectively.
DNA inserts, plus the plasmid vector pLNCX2 were then incubated with HindIII and SalI restriction
enzymes within a 2x Tango buffer, as recommended by Fermentas. Comparison of digested and
undigested plasmid by 1% agarose gel (figure 3.15a) revealed that the digest had been successful for at
least one of the enzymes, but whether both enzymes had successfully “cut” the DNA could not be
confirmed until bacterial transformation. Therefore, a separate experiment where the plasmid and
insert were incubated with HindIII and SalI restriction enzymes separately was also conducted.
Ligation of the CCRL2 insert into the plasmid vector enabled subsequent transformation of bacteria.
Colonies were produced on both HindIII and HindIII-ATG plasmid ligated plates when the restriction
enzymes were used both separately or together. To determine if any bacterial colonies had successfully
taken up a plasmid containing the insert, a further restriction digest with XhoI and SalI enzymes was
conducted. Figure 3.15b shows that transformation had indeed been successful for 3 colonies of HindIII
primer origin when the enzymes were used in conjunction with one another, however, of the 5 tested
there were no positive colonies for HindIII-ATG. Analysing only HindIII-ATG colonies shows that when
the restriction enzymes were used separately, there was also successful ligation of plasmid and insert
(figure 3.15c).
The plasmid inserts were purified from the bacteria and subsequently sequenced (appendix C). Using
NCBIs BLAST2 analysis software it was determined that both one HindIII and one HindIII-ATG amplified
DNA construct had an insert with an identical sequence as the original CCRL2 DNA (Appendix A).
Subsequent Maxiprep of these plasmids was not conducted within this study due to time constraints.

44
Figure 3.14. 1% agarose gels to monitor amplification of CCRL2 from cDNA to be cloned into a plasmid
vector; a) amplified CCRL2 to be extracted from gel for further cloning studies, expected product size
1150bp; b) gel after CCRL2 DNA bands cut out
Key: “M” Marker; “H+” HindIII primer and CCRL2 template; “H-“ HindIII primer no template control; “HA+”
HindIII-ATG primer and CCRL2 template; “HA-“ HindIII-ATG primer no CCRL2 template control.

45
Figure 3.15. 1% agarose gels after restriction digests; a) comparison of vectors either uncut or cut with
HindIII and SalI enzymes; b) vectors purified from bacteria and cut with SalI and XhoI show three colonies
which have the insert extracted (arrows); c) All plasmids contain HindIII-ATG insert when cut with HindIII and
SalI separately.
Key: “M” Marker; “H+” HindIII primer and CCRL2 cDNA; “HA+” HindIII-ATG primer and CCRL2 cDNA; “U/C”
Uncut plasmid DNA.

46
4. DISCUSSION
CCRL2 is a member of the atypical chemokine receptor (ACR) family, which also includes DARC and
D6. As a family, these receptors tend to cause a chemoattractant gradient of their ligands (31),
however a ligand for CCRL2 has yet to be described in full. This study aimed to characterise the
expression of CCRL2 in various lymphoid organs, particularly identify its expression within the
germinal centre, and to start the process of monoclonal antibody production for the mouse form of
the protein.
4.1 Presence of an alternative splice variant of CCRL2 in the thymus
Previous studies from members of the group had suggested the presence of an alternative splice
variant of CCRL2 that are different between the thymus and spleen of mice. In order to confirm this
and study other lymphoid tissues, the spleen, inguinal, brachial, mesenteric lymph nodes and
thymus of wild type mice were compared using differing real-time PCR methods.
The first experimental approach was to use SYBR-Green RT-PCR, which can identify PCR products
that differ in size by use of Tmelt curves. Increasing the temperature causes the double stranded
DNA to turn into single strands, releasing the bound SYBR Green resulting in a quench in the SYBR-
Green fluorescence. A difference in the temperature at which the fluorescence of samples is
quenched could be due to various factors, including mis-priming or primer dimers, but more
commonly it will be due to differing lengths of the transcripts (a longer transcript requires more
energy to turn from double stranded into single stranded DNA). It was suspected that the
chemokine receptor was longer within the thymus. NCBI ORF Finder has shown that there are 2
possible alternative start codons within intron 3 upstream of the published start codon of CCRL2
consensus sequence. Therefore, forward and reverse primers were designed to bind exons 2 and 3,
respectively (appendix A). The Tmelt data showed a difference between thymus and the spleen and
inguinal lymph node (ILN) sections. The thymus section, although with a minor fluorescence change
at the same temperature as the spleen and ILN sections, gave its highest change in fluorescence at
3°C higher. The alternative products from LN and spleen versus thymus in the SYBR-Green PCR has
also been confirmed by cloning and sequencing by other members within the lab.
Second, Taqman RT-PCR was conducted, because SYBR-Green PCR has a limited sensitivity. RT-PCR
uses a combination of sequence specific primer pairs as well as a sequence specific probe which
binds between primers. Increased sensitivity allows for detection of samples with less of the RNA
present, which were particularly important for microdissected samples. Primers and probes were
designed to distinguish unequivocally between the original “short” splice variant of CCRL2 and the
alternative “long” splice variant. These primers were successfully optimised for primer and probe
47
concentration. It was also found that the short primers could be used in multiplex with the
housekeeping gene β2-Microglobulin. Within this study, the long primers were not used in
conjunction with β2-M, as at higher dilutions no signal was present, however it is possible that this
was due to lack of template within these samples at the higher template dilutions. Therefore it
would be wise to repeat the multiplex reaction for the long primers to confirm or deny whether a
multiplex reaction is possible.
Upon using the optimised primers to detect the differing splice variants in tissue sections of wild
type mice, all sections had similar relative expression of the short form. The long form was detected
in thymus as expected from the SYBR-Green PCR data, however it was also observed to a lesser
extent within the spleen and ILN tissues. This was also shown when the primers were used in
singleplex with β-actin. Due to the nature of the long form primer, it is able to bind any DNA
contaminating the sample, unlike the short form primer (appendix A). The relatively high expression
of this long form within thymus tissue would suggest it is unlikely that the signal is due to DNA
contamination. However, whether the smaller signal from the spleen and ILN are genuine signals or
signals from genomic DNA contamination was not determined. It would therefore be wise to
conduct further DNase treatment, as well as repeating the experiment.
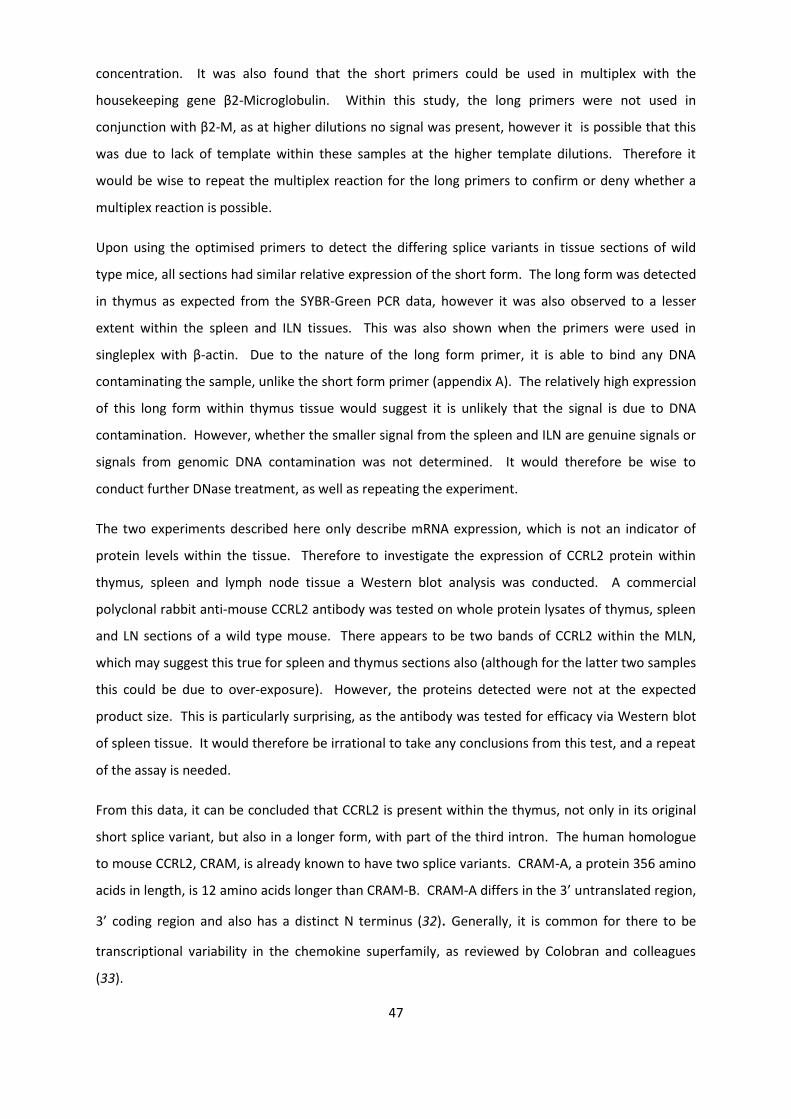
The two experiments described here only describe mRNA expression, which is not an indicator of
protein levels within the tissue. Therefore to investigate the expression of CCRL2 protein within
thymus, spleen and lymph node tissue a Western blot analysis was conducted. A commercial
polyclonal rabbit anti-mouse CCRL2 antibody was tested on whole protein lysates of thymus, spleen
and LN sections of a wild type mouse. There appears to be two bands of CCRL2 within the MLN,
which may suggest this true for spleen and thymus sections also (although for the latter two samples
this could be due to over-exposure). However, the proteins detected were not at the expected
product size. This is particularly surprising, as the antibody was tested for efficacy via Western blot
of spleen tissue. It would therefore be irrational to take any conclusions from this test, and a repeat
of the assay is needed.
From this data, it can be concluded that CCRL2 is present within the thymus, not only in its original
short splice variant, but also in a longer form, with part of the third intron. The human homologue
to mouse CCRL2, CRAM, is already known to have two splice variants. CRAM-A, a protein 356 amino
acids in length, is 12 amino acids longer than CRAM-B. CRAM-A differs in the 3’ untranslated region,
3’ coding region and also has a distinct N terminus (32). Generally, it is common for there to be
transcriptional variability in the chemokine superfamily, as reviewed by Colobran and colleagues
(33).

48
4.2 The role of CCRL2 within the Germinal Centre
Staining of CCRL2 by the group within B follicle of the human LN suggested a functional role for
CCRL2 during the lifetime of the GC (figure 1.5). Also, Otero and colleagues found antigen-loaded
dendritic cells were not efficiently trafficked to lymph nodes in CCRL2 knock-out mice (19). The aim
of this study was to characterise the expression of CCRL2 at different time-points of a GC-forming
immune response by using various splenic cell sorted or tissue samples. A summary of all the
receptor findings is shown in figure 4.1.
B cells sorted from a T-independent response were tested for various chemokine receptors using
Taqman RT-PCR, including CCRL2 short and long forms. eYFP+ splenic B cells from a QM mouse were
transferred to WT hosts and the hosts then injected with NP-Ficoll. Germinal centres in a TI
response are fully formed by days 3 and 4 and by day 5 it is classed as a mature, and may even start
to involute at this early stage (30).
In 2004 Allen et al. found that cells entered the GC light zone, and the orientation of this LZ, was via
the chemokine receptor CXCR5 (28). This chemokine receptor was found to be significantly lower on
GC B cells in comparison to non-activated follicular B cells , that surround the GC 3 and 4 days post
immunisation, which agrees with that found by Y. Zhang in 2010 (34). At day 7 CXCR5 increases in
expression on GC B cells, and it is not detected on plasma cells. CXCR5 is responsible for cells
entering the B follicle and particularly in the GC LZ (28) but downregulates on antibody secreting
cells (35).
It was found that the long form of CCRL2 was undetectable in any sorted B cell samples. The
possible reason is spleen sections having very small amounts of the CCRL2 transcript (section 4.1).
However, the original short form was expressed in the B cells in a very specific manner. On days 3 it
was in very low levels in activated GC B cells, as was true for day 4. In contrast, plasma cells
contained significantly higher levels of the mRNA on day 4. This difference in expression was lost on
day 7, where both plasma cells and GC B cells express CCRL2 mRNA in high levels. Therefore CCRL2
appears to have a role in early plasma cells and once the GC is mature, its function also spreads to
GC B cells.
As CCRL2 mRNA had shown to be present on all B cells at day 7, a section of this spleen was taken
and fluorescently stained with the CCRL2. The staining was not specifically localised to B cells and
was present relatively evenly across the section. The Western blot analysis (section 4.1) indicated
cross reactivity of the antibody with unknown proteins, which may be reflected in the
immunofluorescence staining.

49
Due to its high expression on plasma B cells on both days 4 and 7 it is possible that it is involved in
plasma cells exit from the GC to enable the production of antibodies in the periphery. Conversely it
is not present on GC B cells until day 7. At this point of a TI response, the GC is starting to
breakdown and involute. It is therefore possible that it has a role in GC breakdown, perhaps by also
allowing GC B cells to exit the GC like the plasma cell counterparts.
Various ligands for CCRL2 have been described, however independent confirmation of those shown
in mouse has yet to occur, and a single ligand (CCL19) has been shown in human CRAM (figure 1.4).
Although these ligands cannot be tested on sorted cells, other receptors known to bind them were
also tested using RT-PCR. CCR7, which binds the potential CCRL2 ligand CCL19, had the highest
mRNA expression of any chemokine receptor tested, with expression similar to that of β2M on all
active GC-B cell samples every day. This high expression is not surprising, as CCR7 has previously
been shown to be upregulated on active B cells (36).
Contrary to this, on day 7 CCR7 expression is significantly lower on plasma B cells. CCR7 is known to
have a vast role in immunity (reviewed by Forster and colleagues (37) ). In 2005 a study by Okada et
al. showed that, within LNs, a CCR7-ligand gradient causes movement of B cells towards the T-zone
boundary to meet T helper cells (38). Another study has shown that the expression of CCR7 retains T
cells in the T cell area, emphasising its role within T-zone boundaries (39). The downregulation of
CCR7 on plasma cells seen in this study is the same as that found in the review by Cyster (2003) (35)
because CXCR4 and CXCR3, not CCR7, have roles for the migration of antibody secreting cells.
Finally, chemokine receptors CCR1, CCR4 and CCR5, which all bind the potential CCRL2 ligand CCL5
(figure 1.4), were analysed. All receptors had a surprisingly similar mRNA expression, with a
significant increase in expression on GC B cells by day 3 and through to day 4, and then a complete
drop in expression on day 7. However this final drop was not conclusive due to single samples with a
very high expression of receptor mRNA compared to the others. To determine the significance of
the drop in expression on day 7, there must be a repeat of this experiment. However, the results as
described here appear contradict those within previously published data. Using flow cytometry to
isolate B cells from human tonsil, Corcione and colleagues deduced that CCR1 was absent and CCR4
poorly expressed on germinal centre B cells (40). It is likely this contradiction is due to the results
from this study being gained during a specific GC timeline for a specific TI antigen, whereas the
Corcione study isolates B cells from human tonsil without a specific immunisation regimen, resulting
in GC B cells persistence.
Interestingly, there is an apparent opposite expression of CCRL2 mRNA in comparison to the
receptors of CCL5. CCRL2, whose expression is low and increases at day 7, has opposite expression

50
to that of the other 3 receptors, whose expression are high and then mainly undetectable at day 7.
This could imply a role for CCL5 within the GCs at days 3 and 4, but less function at day 7, when the
GCs involute.
CCRL2 is a member of the atypical chemokine receptor family, which are also known as interceptors
(internalising receptors) due to their ability to take up the chemokine ligand into the cell (41). From
the data here, it is possible to suggest that CCRL2 is not present on GC B cells in the early stages of
the GC reaction because they require the ligand CCL5 (and so receptors CCR1, CCR4 and CCR5) to
elicit a function, perhaps retention within the GC. By day 7, when GC involution in nearing, the B
cells reduce expression of the receptors to CCL5 and increase the expression of CCRL2 to ensure any
binding of CCL5 does not elicit the response, but enable internalisation of the ligand, therefore
allowing for GC breakdown.
Finally, because the previous RT-PCR data had shown an increase in CCRL2 mRNA expression at day
7, a spleen sample at day 8 after a TD antigen immunisation was taken. A combination of
histological staining, microdissection and RT-PCR would be used to characterise specific areas of the
spleen CCRL2 mRNA is expressed. Unfortunately, due to time constraints, only 9 sections were
microdissected. The results show that CCRL2 short form mRNA is expressed within the GC, and
expression was also detectable in the TZ, with significantly lower levels.
It is difficult to imply any conclusion from the TZ results without knowledge of how CCRL2 is
expressed in the TZ over time. However, because of its TZ expression, it is possible that CCRL2 is not
just expressed on B cells, even though these are the cells mainly tested within this study.
The high expression of CCRL2 within the GC at day 8 within the TD response could support the
previous data of high expression of CCRL2 mRNA in day 7 GC B cells. It would be interesting to see if
this expression is decreased in days 3 and 4 of the response, as implied by cell sorted results.
Further, dissection of plasma cell areas would enable confirmation of plasma cells also having high
expression of the chemokine receptor at this, and earlier, stages.

51
Figure 4.1. Expression of chemokine receptors during a Germinal Centre response. Expression on B cells or
within the Germinal Centre and T-zone. Receptors CCRL2, CXCR5, CCR1, CCR4, CCR5 and CCR7 all tested unless
otherwise stated; a) Day 1 post-immunisation only tested for CCRL2 which is not present on any eYFP+ cells; b)
Day 3 post-immunisation, germinal centre B cells; c) Day 4 post-immunisation, only CCRL2 tested for plasma
cell mRNA expression, all tested for GC B cell expression; d) Day 7 post immunisation and difference of receptor
mRNA between germinal centre or plasma cells; e) Day 8 post immunisation and only CCRL2 tested on
microdissected germinal centre or T-zone areas; f) legend. Pictures adapted from The Thesis of Y. Zhang (34)

52
4.3 Cloning of the CCRL2 gene to produce a transfected cell line that can be used for monoclonal
antibody production.
As well as assessing CCRL2 directly, the final part to this study was to start the process of monoclonal
antibody production against mouse CCRL2. Although a human version of the antibody is available,
currently there is only a polyclonal antibody available for mouse CCRL2 (Sigma-Aldrich) which has
been used within this study for both Western blot and histology analyses. Within this study, both of
these analyses gave inconclusive data. The Western blot results, however, are probably due to
personal technique rather than the antibody itself. It is therefore paramount to acquire a specific
monoclonal antibody for use within these in vitro studies to ensure a signal is not from unspecific
protein binding.
Within this study the first stages of monoclonal antibody production has been successful. CCRL2
DNA, still as its original sequence, has been effectively cloned into a plasmid vector. There are two
bacterial strains expressing this vector available, the first contains the CCRL2 DNA only, and the
second contains CCRL2 DNA with an additional ATG start codon. Further study will suggest which of
these CCRL2 variants, once transfected into a mammalian cell line, enables the most efficient
expression of CCRL2.
4.4 Future Work
Further characterisation of the longer form of CCRL2 is required. Within this study it was shown that
the longer form of CCRL2 is expressed within the thymus, which confirms a previous study within the
group. Various questions have yet to be answered – where is the alternate splice site and so what is
its size? Does the longer form have different ligands or function to the shorter form? And finally,
what is the tissue expression of the long form, are the signals in the spleen and ILN genuine?
Further mRNA expression data is needed. It would be useful to know the expression of the various
chemokine ligands on plasma cells (for example plasma cell expression is only seen on days 4 and 7,
and only CCRL2 has been tested on day 4 plasma cells). Further, microdissection of different
timepoints in the immune response would allow further investigation into CCRL2 expression in
specific areas of the spleen instead of only cell subsets. Also, microdissection would allow detection
of possible related chemokines.
To utilise the currently available polyclonal CCRL2 antibody to its fullest potential, it should be
titrated to deduce optimal concentration for staining and Western blot techniques. This will ensure
any data gained from these experiments are genuine results and not background.

53
Finally, continuation of the methods to produce a monoclonal antibody against mouse CCRL2 must
be conducted. This antibody could allow further analysis of tissues for CCRL2, including histological
techniques, FACs analysis and ELISA techniques.

54
THE UNIVERSITY OF BIRMINGHAM
A New Regulatory Step in T-cell Migration into Tissue
During Inflammation; Separating the Wanted from
the Unwanted This Project is Submitted in Partial Fulfilment of
the Requirements for the Award of the MRes
1121067
15/08/2011

55
ABSTRACT
Many proteins function in recruitment of lymphocytes from circulation and subsequent
transmigration into tissues. Definition of these proteins has been through in vitro models which
mimic the in vivo processes. In order to study lymphocyte recruitment, this study utilised a flow
assay, in which the circulation is simulated by perfusion of lymphocytes over an endothelial
monolayer. The aim was to characterise how the cytokines TNF-α and IFN-γ affect endothelial
recruitment and behaviour of peripheral blood lymphocytes (PBL), and also define chemokine
receptors involved in this process. It was observed that TNF-α treated endothelium recruits less PBL,
and this reduction is due to an inefficient capture of CD4+ T cells. In contrast, NK cells were
efficiently recruited to cytokine stimulated endothelium. After 1 hour of wash, the endothelium did
not lose any bound PBL, suggesting PBL do not readily exit back to circulation once bound. As
different cytokine stimulated endothelium produces different chemokines, the chemokine receptors
CXCR3 and CCR5 were functionally blocked on PBL. Contrary to previous reports, blocking of CXCR3
had no effect on lymphocyte recruitment, which may be explained by the antibody used here
blocking different receptor-ligand interactions, or blocking different isoforms of the chemokine
receptor.
56
ABBREVIATIONS
CHO Chinese Hamster Ovary cell line
EDTA Ethylenediaminetetraacetic Acid
GAG Glycosaminoglycan
GPCR G protein coupled receptors
HMEC Human Microvascular Endothelial Cells
HUVEC Human Umbilical Vein Endothelial Cells
ICAM-1 Intercellular Adhesion Moleculae-1
IFN-γ Interferon-γ
LFA-1 Lymphocyte Function-Associated Antigen-1
MADCAM-1 Mucosal Vascular Addressin Cell-Adhesion Molecule-1
PBL Peripheral Blood Lymphocytes
PBSA Phosphate Buffered Saline with Bovine Serum Albumin at 1.5%
PBSA2% Phosphate Buffered Saline with Bovine Serum Albumin at 2%
RANTES Regulated upon Activation, Normal T cell Expressed, and Secreted; Chemokine CCL5
RT Room Temperature
TNF-α Tumour Necrosis Factor-α
TNF+IFN Endothelium treated with both TNF-α and IFN-γ
VCAM-1 Vascular Cell Adhesion Molecule-1
VLA-4 Very Late Antigen-4

57
5. INTRODUCTION
In order to protect the host, leukocytes must exit the blood and enter into tissues. To define the
molecules involved in this process, different in vitro models have been utilised to mimic leukocyte
capture and transmigration. Static assays, which involve the incubation of leukocytes with
endothelium, allow for lymphocyte adhesion and transmigration. Flow assays, however, force
leukocytes over endothelium under various shear rates causing the capture and rolling of the
leukocyte along the endothelial surface, before stable adhesion and transmigration. The following
summarises how these models have shown mechanisms by which lymphocytes adhere to, and
transmigrate into, endothelial tissue.
5.1 A brief overview of leukocyte migration
There are four very general steps which are involved in leukocyte capture and subsequent
transmigration into tissue; 1) tethering and rolling along to the endothelial surface; 2) activation of
integrins; 3) firm adhesion and migration over endothelium 4) transmigration into tissue (figure 5.1)
(42). The latter step is split into many stages, including transit across the endothelial monlayer,
through the underlying basement membrane and into the stroma (43). There are different signals
which govern this process between different leukocytes, with the focus of this study being
lymphocytes.
5.2 Lymphocyte capture to endothelium – the role of cytokines and adhesion molecules Cytokine release by endothelium and cells of the innate immune system signals to lymphocytes the
need to exit circulation. Different cytokines are released by different cells during differing infections,
with often a proinflammatory phenotype. For example, large amounts of tumour necrosis factor-α
(TNF-α) is produced in response to lipopolysaccharide and other bacterial products (44). This
cytokine is mainly produced by macrophage, but also by other cell types including endothelium (44).
On the other hand, interferon-γ (IFN-γ) and its receptor are widely expressed with potent antiviral
effects (45).

58
Figure 5.1 Leukocyte adhesion cascade. The close proximity of the leukocyte to the endothelial
membrane enables capture and rolling along the endothelial surface, with firm adhesion requiring
activation of the leukocyte first. Once the leukocyte is stably adhered, it may start spreading and
crawling, which can eventually lead to transmigration through the endothelial layer and into the
tissue below. Adapted from Ley et al. (2007)(42)

59
Stimulating endothelium with both TNF-α and INF-γ within flow models of the circulatory system
increases attraction of lymphocytes to endothelium in comparison to the control (46). TNF-α
treatment on endothelial cells causes the induction of surface expression of P-selectin, as shown by
indirect immunofluorescence with anti P-selectin antibody (47). P-selectin is a member of the
selectin family of molecules, named as to whether they were discovered on leukocytes (L-selectin),
platelets (P-selectin) or endothelium (E-selectin) (48-49). Luscinskas and colleagues, by blocking the
selectins with antibodies and detecting adherence to human umbilical vein endothelial cell (HUVEC)
monolayers under flow, established that P-selectin mediates the contact between lymphocytes and
the endothelium (47). This was confirmed in another study, where blocking the function of P-
selectin on TNF-α treated HUVEC inhibited rolling of T cells on endothelium (50). The latter study,
amongst others, also established a requirement of E-selectin in the capture and rolling of
lymphocytes, by utilising either L-cell or Chinese hamster ovary (CHO) cell transfectants of E-selectin
(50-51). The data from these studies highlights the importance of selectins in the initial capture and
rolling of lymphocytes.
The role of cytokines in activating endothelium for lymphocyte capture is emphasised in a study by
Oppenheimer-Marks et al., who utilised control endothelium and that stimulated with IL-1 to deduce
the molecules involved in lymphocyte adhesion (52). This study determined the parts played by of
vascular cell adhesion molecule-1 (VCAM-1) and intercellular adhesion molecule-1 (ICAM-1) in T-cell
adhesion, via way of a static assay (52). Blocking of VCAM-1 function inhibits T-cell adhesion on IL-1
stimulated endothelium, but blocking ICAM-1 had no effects (52). However, the opposite is true in
unstimulated endothelium (52). Comparison of flow and static assays using L-cells which are
transfected with VCAM-1 or ICAM-1 also emphasise their different roles within adhesion (51). Under
static conditions, T cells adhered to both transfected cell lines – a property which was blocked using
antibodies against the molecules (51). However, VCAM-1, but not ICAM-1 transfectants were able to
support adhesion under flow, thus suggesting VCAM-1 has a role in all stages of lymphocyte
adhesion, whereas ICAM-1 is only involved in stabilising the attachment (51). Confirmation that
ICAM-1 is not involved in stable adhesion of lymphocyte attachment under flow was shown when
treatment of HUVEC with blocking antibody to the molecule did not have an effect (50).
5.3 Stable lymphocyte adhesion to endothelium – the role of chemokines and integrins
VCAM-1 interacts with β1-integrins expressed on the lymphocyte, and blocking these caused the
lymphocyte to roll quicker along TNF-α activated HUVEC, which is not the case for β2-integrins (47).
This emphasised that the different integrin subsets have different roles in lymphocyte adhesion to
endothelium. In order to express integrins and allow for stable adhesion, the lymphocyte must be

60
activated. Activation is caused, in part, by chemotactic cytokines (“chemokines”). Chemokines are
defined via a set of 4 conserved cysteine residues linked by disulphide bonds (10). The two major
subfamilies of chemokines are named CC or CXC, depending on whether the two first cysteines are
adjacent or separated by another amino acid (10). Chemokines bind to G protein coupled receptors
(GPCRs) on the cell surface to produce their effect on the target cell. GPCRs are “serpentine”
receptors, with 7 transmembrane helices connected by loops.
The lymphocyte is in close contact with the endothelial glycocalyx due to initial tethering and rolling
(53). Within this polysaccharide matrix are bound chemokines, secreted by the activated endothelial
cells. The chemokines bind to, and are immobilised by, glycosaminoglycans (GAGs) via the motif
BBXB (where B is a basic amino acid), as shown by mutagenesis studies of CCL5 (54). Using
chemokine mutations, Proudfoot et al. demonstrated that GAG binding is required for the in vivo
activity of certain chemokines (55) (reviewed by A. Rot (2010) (56)). Upon binding to the serpentine
receptor, dissociation of the G-protein α- and βγ- subunits causes a signalling cascade which
cumulates in the release of talin (57). Activation of the integrin is subsequently caused by the
binding of talin to the β tails of integrin (43, 57-58).
There have been numerous studies deciphering the role of various chemokines in lymphocyte
recruitment to endothelium. The present study will observe the effect of blocking two chemokine
receptors, CCR5 and CXCR3, on lymphocyte recruitment. Below summarises the current literature
relating to these two particular chemokine receptors.
5.3.1 CCR5
The chemokine CCL5, (sometimes referred to as RANTES; Regulated upon Activation, Normal T cell
Expressed, and Secreted) is a ligand for CCR5. However, Baltus and colleagues observed that CCR5
does not mediate memory T cell arrest to human microvascular endothelial cells (HMEC) treated
with CCL5 under a shear flow rate of 0.15Pa (59). This was interesting as another receptor of CCL5,
CCR1, was capable of CCL5 mediate memory T cell arrest under the same conditions (59).
Nonetheless, CCR5 has been demonstrated to be required in TH1 cell arrest, as using monoclonal
antibodies against CCR5 Lim et al. showed a significant decrease in accumulation of TH1 cells on TNF-
α treated endothelium (60).
5.3.2 CXCR3
In 1998 Piali and colleagues examined the adhesion of IL-2 stimulated memory T cells on HUVEC
treated with TNF-α or IFN-γ under a shear flow rate of 0.1Pa (61). In this study the lymphocytes
rapidly adhered, but the effect was reduced with addition anti-CXCR3 antibody (61). This is

61
unsurprising, since the lymphocytes used all expressed CXCR3 strongly (61). These results have not
only been observed in HUVEC - Curbishley et al described CXCR3 activation promotes adhesion and
transmigration of in vivo activated liver T cells (T cells isolated from diseased livers) across human
liver endothelium under a shear flow rate of 0.05Pa (53). These results were both confirmed later,
when McGettrick et al. showed anti-CXCR3 treatment caused a 75% reduction in lymphocyte
adhesion to TNF-α with IFN-γ (TNF+IFN) treated endothelium at a shear flow rate of 0.1Pa (62). This
inflammatory-dependent CXCR3 stabilisation is likely due to CXCR3 ligands requiring the
inflammatory cytokine IFN-γ for their expression.
5.4 Factors in lymphocyte transmigration through endothelium
Chemokine signalling is not only important for integrin activation, but their signalling cascades also
incur other changes to the lymphocyte. Binding of the chemokine causes dephosphorylation of
cytoskeletal ERM proteins (ezrin/radixin/moesin), enabling microvillus resorption and polarisation
(63-64). In addition to microvilli resorption, the chemokines have a role in actin skeleton
organisation and thus transmigration. This was emphasised in a study by Ding and colleagues, who
noted that lymphocyte transmigration in both TNF-α and IFN-γ activated HUVEC was inhibited by
addition of pertussis toxin (65). Further evidence was found when the binding of a specific
chemokine, CXCL9, rapidly activated small GTPases RhoA and Rac1 (66), and Rho GTPases have long
been implicated as regulators of the actin cytoskeleton (67).
Transmigration of activated T cells (T cells preincubated with IL-2) is upregulated when the lower
chamber of a static assay is incubated with the chemokine CCL5 (68). In addition to CCL5; CCL2 and
CCL3 have been shown to induce transmigration of resting memory T cells specifically, whereas
CXCL12 is capable of inducing transmigration in both naive and memory T cell subsets (65).
The role of chemokines in lymphocyte transmigration has been shown to be affected by the cytokine
treatment of HUVEC. CXCL11 increases transmigration across TNF-α, but not IFN-γ, nor TNF+IFN
stimulated HUVEC (69). This is due to TNF-α stimulated HUVEC being the only condition which does
not produce CXCL11 (69).
Transmigration is not only dependent on chemokines and the subsequent signalling cascades which
they produce. For example, by incubating peripheral blood lymphocytes (PBL) with an antagonist
against the prostaglandin D2 receptor, DP2, Ahmed et al. observed inhibition of transmigration,
showing that prostanoid signals are also required for lymphocyte transmigration (70).
62
As with adhesion, transmigrating lymphocytes utilise different molecules depending on the
activation state of the endothelium and the lymphocytes themselves. Activated T cells have a 3 to 4
fold increase in transmigration through HUVEC than resting T cells (71). These T cells utilise the
expression of the ICAM-1 counter-receptor lymphocyte function-associated antigen-1 (LFA-1), yet
resting T cells do not (71). Conversely, another study stated that ICAM-1 is required for
transmigration of T cells, independent of stimulation of either HUVEC or the T cells themselves (52).
Interestingly, blocking the function of both LFA-1 and very late antigen-4 (VLA-4; the intergrin
counter-receptor of VCAM-1) abolishes T cell transmigration (69).
Once a cell has transmigrated through the endothelium, it is still able to reverse-transmigrate back
out again. Recent in vitro data has shown some lymphocytes undergo transitions in and out of
endothelial monolayers in both static and flow conditions (46). This “frustrated” phenotype, implies
a separate signal is required for lymphocyte migration into stroma once transmigration has occurred
(46). Whether this phenomenon is from a specific subset of lymphocytes remains to be seen,
however, it is currently unknown that if without the suggested signal required “frustrated”
lymphocytes will exit the endothelium and return to circulation.
5.5 Specific lymphocyte subtypes preferentially transmigrate through endothelium
The ability to collect, purify and subsequently stain for specific lymphocyte markers has enabled
determination of which lymphocyte subtypes have transmigrated through the endothelial
membranes. CD8+ T cells have a greater capacity to transmigrate than CD4+ T cells, and within the
latter, memory CD4+ T cells transmigrate more efficiently than naive (72). Further to this, TNF-α and
IFN-γ treatment of HUVEC increases the transmigration capacity of memory CD4+ T cells, whereas
activation of the T cells increases the ability for transmigration of naive CD4+ T cells (65, 73).
Chemokines have also been implicated in transmigrational ability; the chemokine CXCL11 increases
transmigration of both memory CD4+ and CD8+ T cells (69). Opposite to this, the molecule CD31 is
negatively correlated with transmigration, probably due to its expression being closely linked with
that of the naive T cell marker, CD45RA (74).
63
5.6 Aims of project
Determine the differences in lymphocyte adhesion to cytokine treated endothelium
Observe the effect of time on the number of lymphocytes adhered to the endothelial
surface
Characterise which lymphocyte subtypes preferentially bind to cytokine treated
endothelium
Block chemokine receptors on lymphocytes and deduce if there is an effect on recruitment
to endothelium

64
6. MATERIALS AND METHODS
6.1 Endothelial cell culture
The primary cell line human umbilical vein endothelial cells (HUVEC) were isolated by Phil Stone in
accordance with protocol described (75). HUVEC were grown in complete media (Medium 199 with
glutamine (Gibco Invitrogen Compounds, Paisley, Scotland) with gentamycin sulphate (35µg/ml),
human epidermal growth factor (10ng/ml), fetal calf serum (20% w/w heat-inactivated) and
hydrocortisone (1µg/ml; all from Sigma-Aldrich, Poole, UK) at 37˚C in a 5%CO2 incubator.
Immortalised cell line human microvascular endothelial cells (HMEC; gift of Francisco Candel, CDC,
Atlanta, GA) were recovered from liquid nitrogen, resuspended in complete media and cultured as
HUVEC.
6.1.1. Preparation of Ibidi slide for flow assay.
Confluent endothelial cells were rinsed with 2ml 0.02% EDTA and subsequently incubated for 1-2
minutes with a 2:1 ratio of trypsin:EDTA (both Sigma-Aldrich) to detach cells. To neutralise the
trypsin, 8ml of complete media was added and the solution, which was then centrifuged at 1500rpm
for 5min. Cells were resuspended in complete medium and 35µl of this added to µ-Slide VI0.4 slides
(Ibidi, Martinsried, Germany, figure 6.1) to fill the channel. Slides were incubated at 37˚C 5% CO2 for
40min to ensure adherence to the channel surface, after which the wells were topped up with
complete media. Slides were left within a humidity chamber for 24hr at 37˚C in a 5% CO2 incubator.

65
Figure 6.1 Ibidi µ-Slide VI0.4 slides in which HMEC or HUVEC were seeded for flow assay. Cells were
grown within the channels across the centre of the slide, and wells at the end contained fresh
complete media to provide nutrients for the cells. Wells at either end represent the inlet and outlet
of the channels.

66
6.2 Isolation of human peripheral blood lymphocytes
Blood from healthy volunteer donors was collected in tubes containing potassium EDTA (Sarstedt,
Leicester, UK) after informed consent. Leukocytes were separated in a density gradient, where
2.5ml of Histopaque 1077 was layered onto 2.5ml of Histopaque 1119 (both Sigma-Aldrich), onto
which 5ml of the blood was added. This was centrifuged for 40min at 2500rpm to separate blood
cells to different layers. Mononuclear cells were retrieved from the top of the gradient, between
plasma and Histopaque 1077 (figure 6.2). Mononuclear cells were washed twice in phosphate
buffered saline (containing calcium chloride and magnesium chloride) with 0.15% bovine fraction V
albumin (all Sigma-Aldrich) (“PBSA”) for 5min at 1500rpm. To deplete the mononuclear cells of
monocytes, cells were resuspended in 1ml of PBSA and incubated in a 25cm3 cell culture Falcon flask
for 30min at 37˚C 5% CO2 causing monocytes and activated PBL to adhere to the flask surface.
Enriched peripheral blood lymphocytes (PBL) were gently washed in PBSA and centrifuged for 5min
at 1500rpm. Cells were resuspended in 1ml of PBSA. Cells were counted using Cellometer Auto T4
(Nexcelom Bioscience, Lawrence, MA, USA) and diluted to either 1million/ml or 2million/ml using
PBSA. If the experiment required, PBL were incubated for 15min with a function blocking antibody
against CCR5 clone number 45531 (20µg/ml) or against CXCR3 clone number 49801 (10µg/ml, both
R&D Systems, Minneapolis, MN).
6.3 Flow assay
Slides containing HUVEC or HMEC-1 were treated with either tumour necrosis factor-α (TNF-α, R&D
Systems) (100U/ml), interferon-γ (IFN-γ) (10ng/ml, Peprotech Inc., London, UK) or both 24 hours
prior to start of flow assay.
The flow system was set up within a Perspex box at 37°C (figure 6.3), as previously described (76-77).
The slide was visualised using a 20x Leitz Labovert phase contrast microscope and images recorded
onto a video cassette tape. All tubing was primed with wash buffer to rid the system of bubbles
before any tubing was connected to the slide. The syringe pump (Harvard Apparatus PHD2000
Programmable, Instech Laboratories) was set to a flow rate of either 0.4ml/min or 0.8ml/min,
equivalent to a wall shear stress of 0.05Pa or 0.1Pa respectively (See the Ibidi website, www.ibidi.de,
for calculation). Wash buffer was pumped through the system for 1 minute, after which the
electronic valve (Lee Products, Gerards Cross, UK) was switched on for 4min to enable a bolus of
PBL. The slide was then washed for 2min, after which recordings of 10 fields of view down the
centre of the slide were made onto videotape. For calculation of migration velocities, a single field
of view was recorded for 10min. Finally, another 10 field recording was conducted down the centre
of the slide as before.

67
Figure 6.2 Representation of separation of blood components using a Histopaque gradient. PBL
were collected from the mononuclear cell layer, between the plasma and histopaque.

68
Figure 6.3 Schematic representation of the flow assay which mimics the circulatory system within
post-capillary venules. Either wash buffer or PBL was pulled through the slide via a pump,
depending on whether the electronic valve was off or on, respectively. A camera, located on the
microscope, was able to record the PBL and endothelium located on the slide. All parts of the
equipment, minus the pump, were kept within a box heated to 37°C.
69
6.3.1. Analysis
Videos were digitised and analysed offline using Image Pro Plus software (DataCell Ltd.,
Finchampstead, UK). Lymphocytes were counted and classed as either adherent-rolling (phase
bright, spherical cells moving over surface slower than free flowing cells); adherent-stationary
(phase bright, spherical cells that appear to “vibrate” on endothelium surface) or transmigrated
(phase dark and distorted in shape) as previously described (46) (figure 6.4). The velocity of cells
migrating underneath the endothelium was measured in a single field over 10min. In each digitised
image cells were outlined and the centre of the cell determined. Migration velocity was calculated
as the average distance the centre of the cell moved per minute. In order to analyse migration
directionality, the original (x,y) coordinates of the cell were taken as the origin (0,0) and all
subsequent co-ordinates re-calculated relative to this.
6.4 Flow cytometry
6.4.1. Flow cytometry analysis of perfused PBL cells
Supernatants from the slides were collected and remaining cells within the channel removed by
trypsinisation (section 6.1.1) and combined with the supernatants. Samples were incubated with
fluorescently-tagged antibodies (table 6.1) for 30mins at 4°C in the dark. Samples were washed and
fixed with 2% paraformaldehyde (Sigma-Aldrich) and stored at 4°C until analysis. Labelled cells were
analysed using CyAN FACS analyser (Beckman Coulter, UK) with analyser plus offline analysis
controlled with Summit v4.3 software.

70
Figure 6.4 Adherent cells on a monolayer of HUVEC. The phase bright round lymphocyte was stably
bound to the surface (eg. solid arrow). The phase dark distorted lymphocyte had transmigrated
through the endothelial layer and was migrating underneath (eg. dotted arrow).

71
Table 6.1. Primary antibodies used for flow cytometric analysis of PBL isolated from flow assay.
Epitope Fluorophore Isotype Expression Company
CD3 APC IgG1 T-cell Invitogen
CD4 PacBlue IgG2b Subset of T cells eBioscience, UK
CD8 FITC IgG2a Subset of T cells BD Biosciences,
Oxford, UK
CD45RO PE IgG1 Memory T cells BD Biosciences
CD20 PeCy7 IgG1 Mature B cells AbCam,
Cambridge, UK
72
6.4.2. Flow cytometry analysis of PBL treated with blocking antibodies against CXCR3 or CCR5
PBL were treated with function-blocking antibodies against CXCR3 and CCR5 as described (section
6.2). PBL were washed and treated with secondary antibody, polyclonal goat anti-mouse
immunoglobulin, FITC conjugated (Dako, Ely, UK) for 30mins at 4°C in the dark. As a comparison
fresh PBL were incubated with either FITC conjugated anti-CXCR3 (R&D Systems) of Alexa Fluor
conjugated anti-CCR5 (BioLegend, San Diego, CA, USA). Samples were then fixed and analysed as
described in 6.5.1.
6.5 Statistical analysis
Data was plotted into GraphPad Prism version 5 which analysed the effects of multiple treatment via
two-way ANOVA. If applicable, individual treatments were compared using a Bonferroni test.
Statistical significance was accepted for any p value less than 0.05.

73
7. RESULTS
7.1. Effect of different cytokine treatments on lymphocyte recruitment to HUVEC
7.1.1 Effect of cytokine treatment on adherence
Initial experiments examined recruitment of peripheral blood lymphocytes to HUVEC. The
endothelial cells were treated with either TNF-α, IFN-γ, or a combination of both and subsequently
was perfused with PBL. Adherence and behaviour of PBL was then determined. All cytokine treated
endothelium were capable of lymphocyte capture from flow, however, less than 1% of the perfused
lymphocytes bound to the endothelial layer; this was true for all three cytokine treated conditions.
The TNF+IFN condition consistently bound more PBL than the use of cytokines individually (figure
7.1), although this was not statistically significant. It is shown here there are no differences in
adhesion between 2 and 16 minutes of washing, supporting previous data (46), which indicates
stable lymphocyte adhesion to the endothelium.
Lymphocyte behaviour was determined by video recording of 10 random fields of view from the top
(inlet) to the bottom (outlet) of the channel. As these experiments were conducted in Ibidi slides,
different to the chamber slides previously used (46), it was important to ensure even binding of PBL
throughout the channel. PBL were randomly distributed along the channel, with no bias towards
either the inlet or outlet (figure 7.2). Of the four TNF+IFN experiments, one had considerably lower
binding in comparison to the other three (figure 7.2c). This variation could explain the lack of
significant difference in adherence in figure 7.1.

74
Figure 7.1 The effect of cytokine treatment on adherence of lymphocytes to HUVEC from flow.
HUVEC were stimulated with either TNF-α, IFN-γ or both, 24hours before a 4minute perfusion of PBL.
PBL adherence was determined after 2 or 16 minutes of washing. Data are the mean ± SEM for 4
independent experiments.
Key: 2 minutes post PBL perfusion; 16 minutes post PBL perfusion
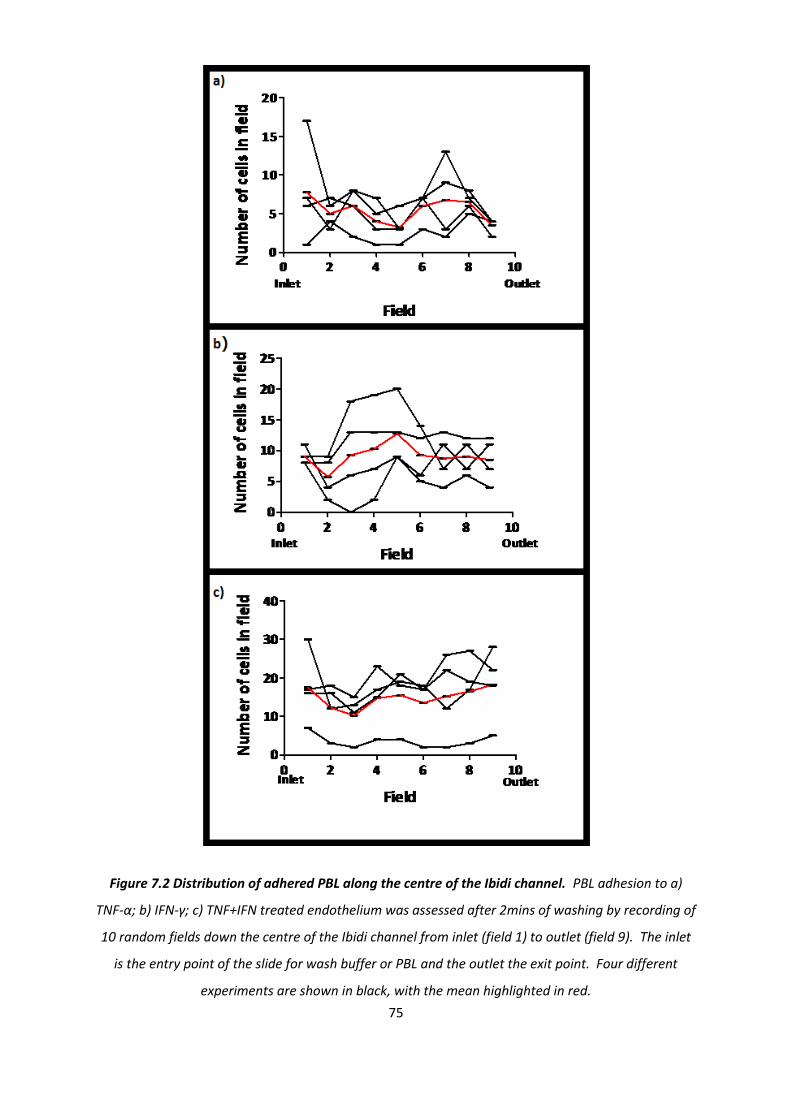
75
Figure 7.2 Distribution of adhered PBL along the centre of the Ibidi channel. PBL adhesion to a)
TNF-α; b) IFN-γ; c) TNF+IFN treated endothelium was assessed after 2mins of washing by recording of
10 random fields down the centre of the Ibidi channel from inlet (field 1) to outlet (field 9). The inlet
is the entry point of the slide for wash buffer or PBL and the outlet the exit point. Four different
experiments are shown in black, with the mean highlighted in red.
76
Upon adhering to the endothelial monolayer, lymphocyte behaviour can be defined as rolling,
stationary or transmigrated through the surface (figure 6.2). For all cytokine treatments only 5% of
lymphocytes were defined as rolling at 2min, and this value further decreased at 16min due to stable
adhesion of the lymphocytes (figure 7.3a-b). At 2 minutes of washing, the majority of PBL were
firmly adhered to the endothelial surface (approximately 60-80% depending on cytokine treatment),
with the remaining transmigrated through the endothelial cell surface (20-40%). There was a
significant increase in the percentage of transmigrated cells at 16min compared to 2min across all
cytokine treatments (figure 7.3b). However, this is different to previous studies, which suggested
that transmigration did not increase over time (46). Significantly less PBL transmigrated when TNF-
α was used to treat the endothelium compared to IFN-γ treatment (figure 7.3c), which is consistent
with previous reports (46).
7.1.2. The effect of cytokine treatment on the behaviour of transmigrated PBL
Once a lymphocyte has transmigrated underneath the endothelial layer it is able to move around
beneath the surface. The direction of this movement was random and not dictated by the flow
above the endothelial layer (figure 7.4). Lymphocytes migrated underneath the surface at
approximately 7.5-8µm/min (consistent with previous data (46)), and this was unaffected by
cytokine treatment (figure 7.5a). However, the variation in the velocities of individual cells was quite
considerable, ranging from 1-21µm/min (figure7.5b).
It has previously been demonstrated that lymphocytes appear to be “frustrated,” and undergo
numerous transitions above and below the endothelial monolayer (46) (figure 7.6). The frustrated
migration was observed here over a 10 minute period, with cells making between 1 and 6 transitions
(figure 7.7a) with similar trends observed for all cytokine treatments (figure 7.7b). To assess
whether these “frustrated” cells eventually left the endothelium and returned to flow, a single field
was recorded every 10 minutes for 1 hour and the number of remaining cells determined (table 7.1
and figure 7.8). The number of transmigrated cells gradually increased with time, peaking at 30min,
after which the number remained relatively constant. Only 2 phase bright cells stayed stationary
throughout the hour, suggesting some cells are pre-disposed to not transmigrate through the
endothelial monolayer (figure 7.8). As the total number of cells did not decrease over the hour, the
frustrated cells did not re-enter flow within this time frame (table 7.1).
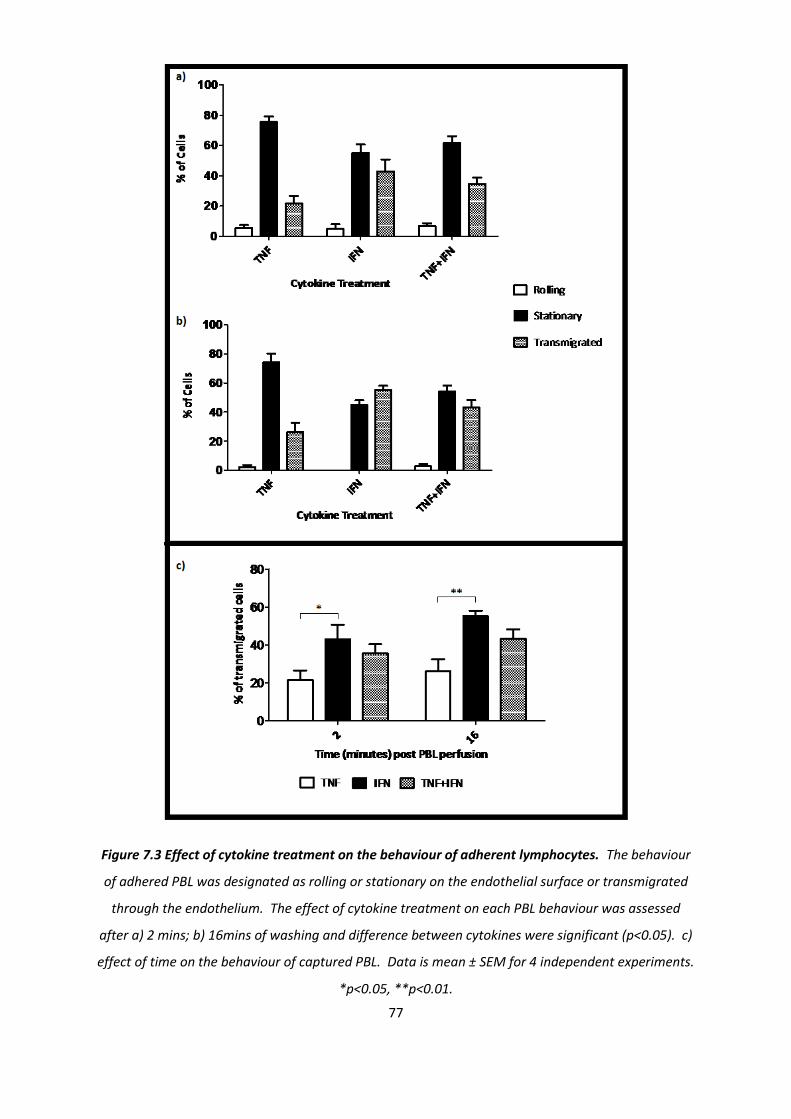
77
Figure 7.3 Effect of cytokine treatment on the behaviour of adherent lymphocytes. The behaviour
of adhered PBL was designated as rolling or stationary on the endothelial surface or transmigrated
through the endothelium. The effect of cytokine treatment on each PBL behaviour was assessed
after a) 2 mins; b) 16mins of washing and difference between cytokines were significant (p<0.05). c)
effect of time on the behaviour of captured PBL. Data is mean ± SEM for 4 independent experiments.
*p<0.05, **p<0.01.
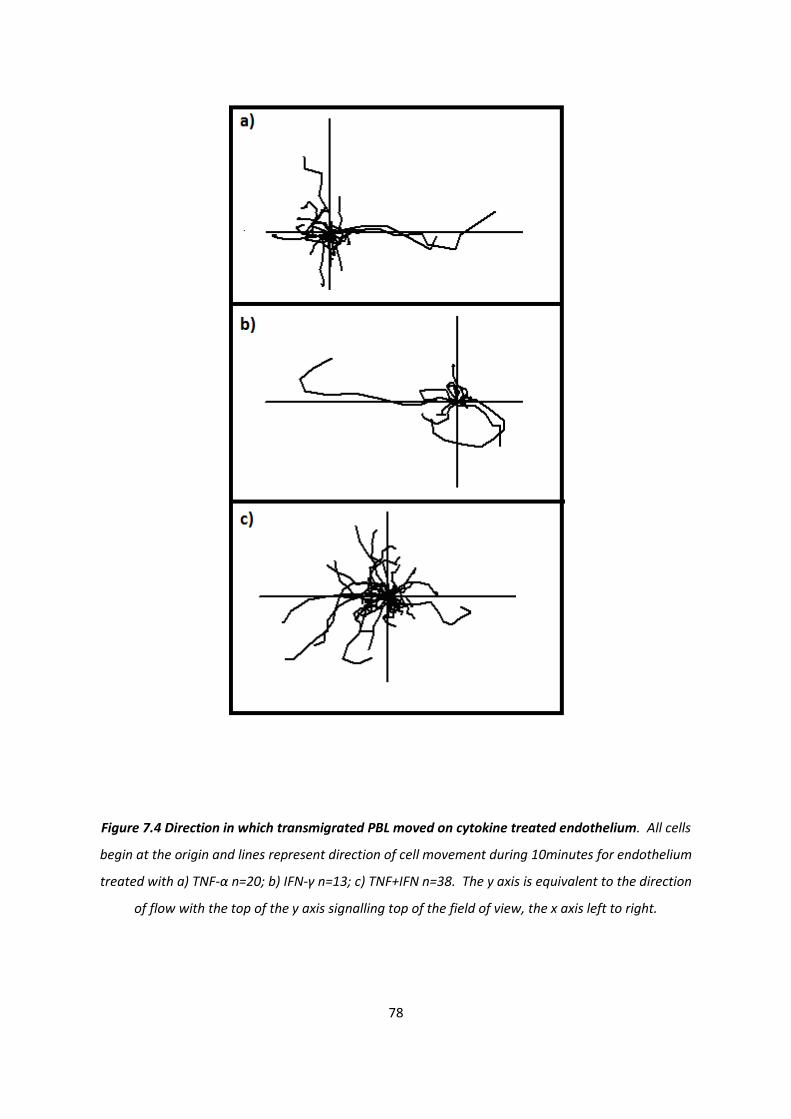
78
Figure 7.4 Direction in which transmigrated PBL moved on cytokine treated endothelium. All cells
begin at the origin and lines represent direction of cell movement during 10minutes for endothelium
treated with a) TNF-α n=20; b) IFN-γ n=13; c) TNF+IFN n=38. The y axis is equivalent to the direction
of flow with the top of the y axis signalling top of the field of view, the x axis left to right.
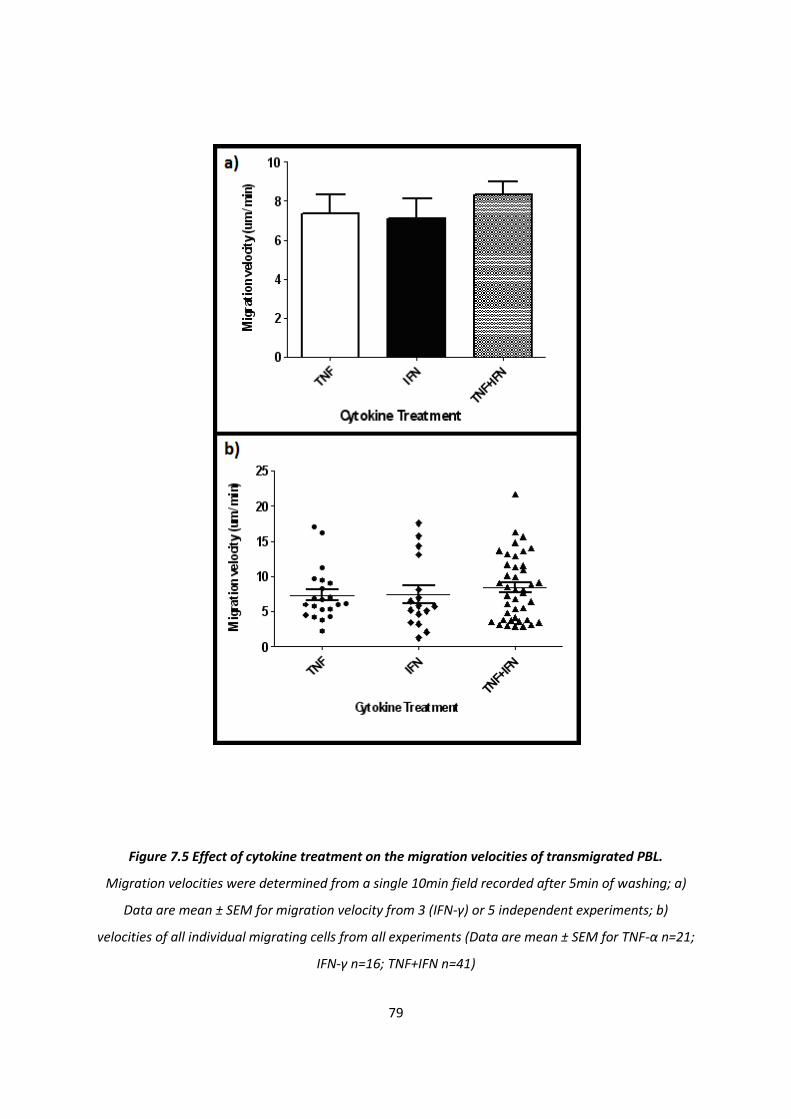
79
Figure 7.5 Effect of cytokine treatment on the migration velocities of transmigrated PBL.
Migration velocities were determined from a single 10min field recorded after 5min of washing; a)
Data are mean ± SEM for migration velocity from 3 (IFN-γ) or 5 independent experiments; b)
velocities of all individual migrating cells from all experiments (Data are mean ± SEM for TNF-α n=21;
IFN-γ n=16; TNF+IFN n=41)

80
Figure 7.6 Micrographs showing a "frustrated" cell migrating in and out of the endothelium. A
single cell, marked with an asterisk, was followed over 5min as it changed between phase dark and
phase bright throughout the pictures. The snapshots represent the cells movements over 5 minutes.
The cell undergoes 4 transitions.

81
Figure 7.7 Effect of cytokine treatment on the transitional ability of individual lymphocytes over 10
minutes. A single field was recorded for 10min after 5min of washing and the migratory behaviour
of individual cells assessed; a) effect of cytokine treatment on migratory transits of individual cells (a
transit is defined by whether a cell transmigrates (phase bright to phase dark; open points) or
reverse-transmigrates (phase dark to phase bright; blacked); b) percentage of total cells which
undergo a transition irrespective of their start position as mean ± SEM. Data are from 4 (IFN-γ) or 5
independent experiments.

82
Table 7.1 Ongoing behaviour of PBL adhered to TNF+IFN treated endothelium over 1hr. A single
field was recorded every 10min for 1hr and the PBL behaviour at each time point taken. This data is
from a single experiment.
Time
(minutes)
post PBL
perfusion
Rolling Lymphocytes Stationary
Lymphocytes
Transmigrated
Lymphocytes Total number
of
Lymphocytes Number % Number % Number %
10 1 3.03 14 42.42 18 54.54 33
20 1 3.13 10 31.25 21 65.63 32
30 2 5.13 8 20.51 29 74.36 39
40 2 5.26 9 23.68 27 71.05 38
50 0 0 9 25.00 27 75.00 36
60 0 0 10 27.03 27 72.97 37
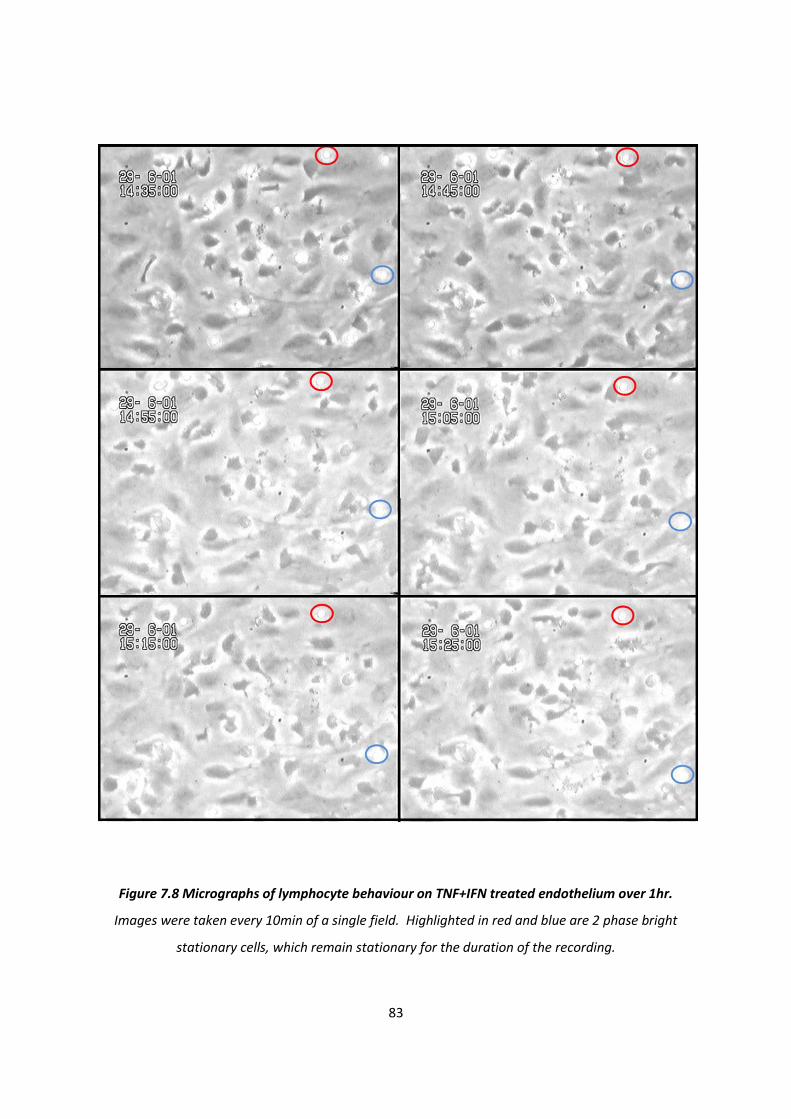
83
Figure 7.8 Micrographs of lymphocyte behaviour on TNF+IFN treated endothelium over 1hr.
Images were taken every 10min of a single field. Highlighted in red and blue are 2 phase bright
stationary cells, which remain stationary for the duration of the recording.

84
7.1.3. The effect of cytokine treatment on recruitment of PBL subtypes.
In order to determine which lymphocyte subpopulations were recruited to the endothelial cell
surface, the adherent cells were trypsinised and collected, stained for various lymphocyte markers
and analysed by flow cytometry. Fresh PBL were used as a control. Initially, it was important to
determine if trypsinisation cleaves the B cell marker, CD20. Other markers were not analysed as
previous experience had shown they were not trypsin sensitive. Fresh PBL were incubated with
trypsin for the same amount of time as in the channel and, post washing, were stained with the anti-
CD20 antibody (figure 7.9). There was little, if any, effect of trypsin on the expression and detection
of CD20+, indicating the marker is not sensitive to trypsin treatment and therefore anti-CD20
antibody was used for subsequent B cell determinations.
Due to time and reagent constraints, comparison of cells isolated from TNF-α and TNF+IFN treated
endothelium only were conducted. Cytokine treatment was shown to have an overall effect on
which subsets of PBL were detected. The fresh PBL were made up of approximately 65% T cells. The
PBL recruited during the flow assays were more varied in their number of T cells, with significantly
less T cells recruited to TNF-α treated endothelium (figure 7.10). This decrease is due to the less
efficient binding of CD4+ T cells in the TNF-α treated endothelium, with only 20% of the PBL being
CD4+, compared to 45% in the control. Although in comparison to the control, the TNF+IFN
condition also has less CD4+ cells present, this is not significant due to high experimental variation.
CD8+ T cells have similar numbers within each condition, as do B cells and memory CD4+ T cells.
However, the proportion of NK cells and memory CD8+ T cells within the populations isolated from
the flow assay show small, consistent, but insignificant increases in comparison to the control (figure
7.10).
Using the fresh PBL control data, it was possible to determine if subsets of cells more readily
adhered to the cell surface than others over the different cytokine treatments. As with the total PBL
fraction, less than 1% of the total number of cell type perfused adhered to the endothelial cell
surface (figure 7.11). Also similar was that the different cell subtypes adhered to TNF+IFN treated
endothelia significantly better than endothelium treated with TNF-α alone (figure 7.11). Although T
cells make up the majority of those bound, the binding was very inefficient, at only 0.1 or 0.25%
(TNF-α and TNF+IFN treated conditions, respectively). This pattern was also true for CD4+ T cells,
which has similar adhesion efficiencies to T cells. Conversely, NK cells have a particularly high
efficiency of adherence (0.35% for TNF-α and 0.6% for TNF+IFN), even though total numbers were
low. The memory subset of T cells also had very efficient binding in both cytokine treated
conditions, however TNF-α stimulated endothelial cells bound significantly less memory CD8+ T cells
than TNF+IFN (figure 7.11).

85
Figure 7.9 The effect on trypsin treatment on antibody binding of CD20, the B cell marker. a) fresh
PBL or b) fresh PBL incubated with trypsin were stained with anti-CD20 antibody with a PE-Cy7
marker and analysed by flow cytometry.

86
Figure 7.10 Effect of cytokine treatment on adherence of different PBL subtypes to endothelium. Fresh donor PBL or PBL isolated after perfusion onto TNF-
α or TNF+IFN treated endothelium were stained for various lymphocyte markers and analysed by flow cytometry. Plotted as % within lymphocyte sample ±
SEM, from 3 independent experiments. Overall, ANOVA showed that cytokine treatment has a significant effect on which subset of cells bind (p<0.05).
*p<0.05 **p<0.01.
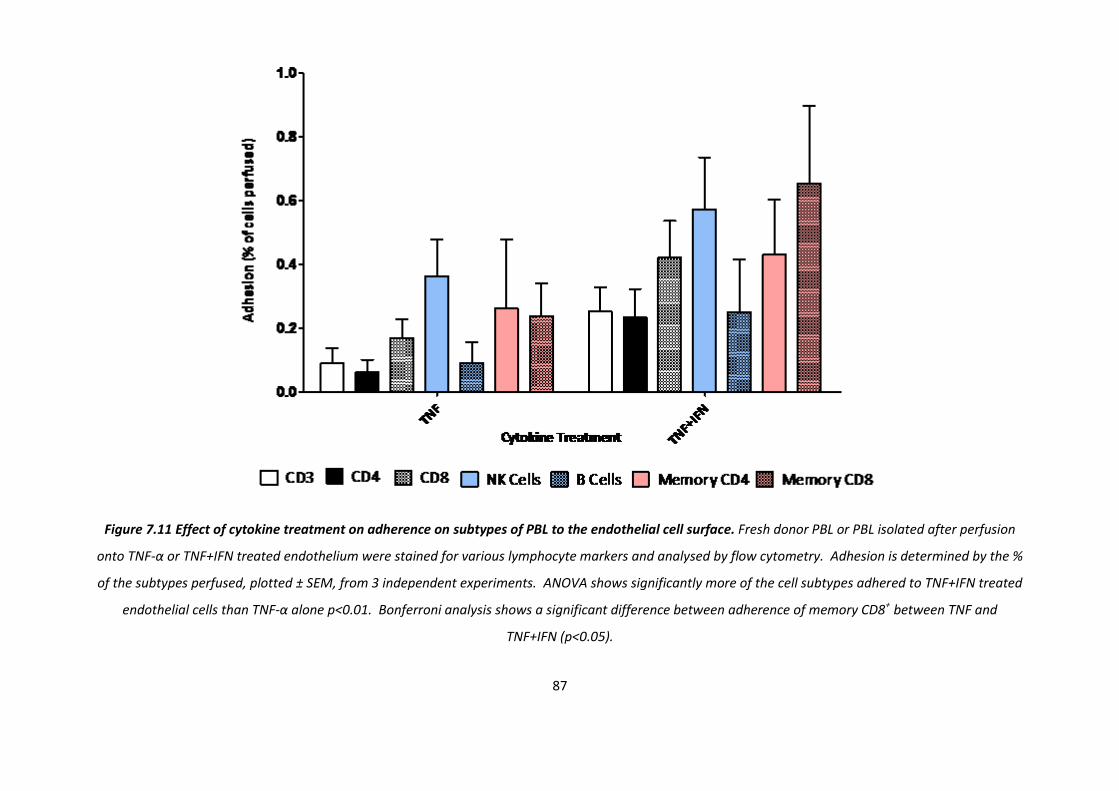
87
Figure 7.11 Effect of cytokine treatment on adherence on subtypes of PBL to the endothelial cell surface. Fresh donor PBL or PBL isolated after perfusion
onto TNF-α or TNF+IFN treated endothelium were stained for various lymphocyte markers and analysed by flow cytometry. Adhesion is determined by the %
of the subtypes perfused, plotted ± SEM, from 3 independent experiments. ANOVA shows significantly more of the cell subtypes adhered to TNF+IFN treated
endothelial cells than TNF-α alone p<0.01. Bonferroni analysis shows a significant difference between adherence of memory CD8+ between TNF and
TNF+IFN (p<0.05).

88
7.2. The effect of blocking the chemokine receptors CXCR3 and CCR5 on PBL adherence
PBL were incubated with neutralising antibody against CCR5 or CXCR3 before perfusion to determine
the effect on adherence. At both 2 and 16mins post PBL perfusion, there were no significant differences
between the adherence of control PBL and those blocked for either CXCR3 or CCR5 (figure 7.12). Within
the TNF-α condition, it appears that addition of blocking antibody slightly improves the ability of PBL to
adhere (figure 7.12a), however, stable adhesion of the PBL is ineffective as adherence is reduced in the
blocked conditions by 16mins. Conversely, in the TNF+IFN condition, adhesion is at 0.4% for all PBL
fractions, and by 16mins only anti-CCR5 has retained this, with control and anti-CXCR3 reducing to
0.35% adherence (figure 7.12b).
As well as adherence to the endothelial surface, chemokines also have a role in transmigration – causing
microvilli collapse and actin skeleton reorganisation. Therefore the effect of blocking the chemokine
receptors on PBL behaviour was also assessed (figure 7.13). Comparison of control, untreated, PBL to
those incubated with blocking antibody showed no significant difference for any of the PBL behaviours.
It had previously been demonstrated than anti-CXCR3 antibody reduced PBL binding in TNF+IFN treated
endothelium when cells were perfused at 0.1Pa(62). Therefore, the flow rate was increased to 0.1Pa
and the effect of blocking CXCR3 was examined (figure 7.14). As expected, there was approximately half
of adhereing cells at 0.1Pa than 0.05Pa (figure 7.14) however, there was still no effect on blocking
CXCR3.

89
Figure 7.12 Effect of blocking chemokine receptors CXCR3 and CCR5 on PBL adhesion to endothelium.
PBL were used fresh or incubated with either 10µg/ml of anti-CXCR3 antibody or 20µg/ml of anti-CCR5
antibody for 15min before perfusion onto endothelium treated with a)TNF-α; b)TNF+IFN. Adhesion was
determined after either 2 or 16 min of washing. Data are mean ± SEM from 2 independent experiments.

90
Figure 7.13 Effect of blocking the chemokine receptors CXCR3 and CCR5 on the behaviour of adhered
PBL. PBL were used fresh or incubated with either 10ng/ml of anti-CXCR3 antibody or 20ng/ml of anti-
CCR5 antibody for 15min before perfusion onto endothelium treated with either a)+b) TNF-α;
c)+d)TNF+IFN. PBL behaviour was assessed after a)+c) 2min; b)+d) 16min of washing. Data are mean
±SEM for 2 independent experiments.
Key:

91
0.05Pa
0.1Pa
0.0
0.1
0.2
0.3
0.4
0.5
Control Anti-CXCR3
Shear Rate
Ad
he
sio
n (
% o
f ce
lls
pe
rfu
sed
)
Figure 7.14 Effect of shear rate and CXCR3 blockade on PBL adhesion to the endothelial surface. PBL
were used fresh or incubated with either 10µg/ml of anti-CXCR3 antibody for 15min before perfusion at
either 0.05Pa or 0.1Pa onto endothelium treated with TNF+IFN. Data are mean ± SEM for 2 independent
experiments (0.05Pa) a single experiment (0.1Pa).

92
Finally, to ensure that the blocking antibodies were efficiently binding to their chemokine receptor
targets, fresh PBL were stained with either the unconjugated blocking antibody plus secondary, or a
different, directly conjugated, antibody to CXCR3 or CCR5. These were then subsequently analysed by
flow cytometry (table 7.2 and figure 7.15). Only 0.08% of cells were positive for CXCR3 when stained
with unconjugated blocking antibody (figure 7.15c). This was only 0.01% higher than the negative
control of secondary antibody alone. Using the directly conjugated CXCR3 antibody, 0.17% of cells were
deemed to be positive for the chemokine receptor. This value was low compared to data from a
separate ongoing study within the lab, which has shown found 9% of cells stained positive for CXCR3
when using a different conjugated antibody to the chemokine receptor. It was determined that 2.06%
of cells were positive for CCR5 when using the unconjugated blocking antibody, compared to 27.69% of
cells staining positive with the directly conjugated antibody. However, some of this data may be false
positive, as the staining was smeared within the negative as opposed to discrete positive and negative
populations (figure 7.15f). Nevertheless, this data is consistent with other studies using the same
antibody, suggesting that the separation between positive and negative are accurate.
7.3. PBL adhesion to HMEC-1 using flow and static based assays
Above results examined PBL adherence to primary isolated HUVEC, however the immortal cell line
HMEC-1 was also used if HUVEC were unavailable. It was observed that very few PBL were captured
from flow to TNF+IFN treated HMEC-1. Moreover, after a couple of minutes the endothelial cells
appeared to retract (figure 7.16). It was therefore difficult to conduct any experiments of significance
on this cell type under flow.

93
Table 7.2 Cell counts and percentage of PBL fraction which stained positive for chemokine receptors
CXCR3 or CCR5. PBL were incubated with either directly conjugated anti-CXCR3or anti-CCR5 antibodies,
or with unconjugated blocking antibodies to CXCR3 and CCR5 with a conjugated secondary antibody.
Positively stained cell numbers were then analysed by flow cytometry.
Antibody Staining Number of cells positively
stained % of PBL stained positive
Secondary antibody only 14 0.07
Unconjugated CXCR3 blocking
antibody 19 0.08
Directly conjugated CXCR3
antibody 37 0.17
Unconjugated CCR5 blocking
antibody 435 2.06
Directly conjugated CCR5
antibody 6293 27.69
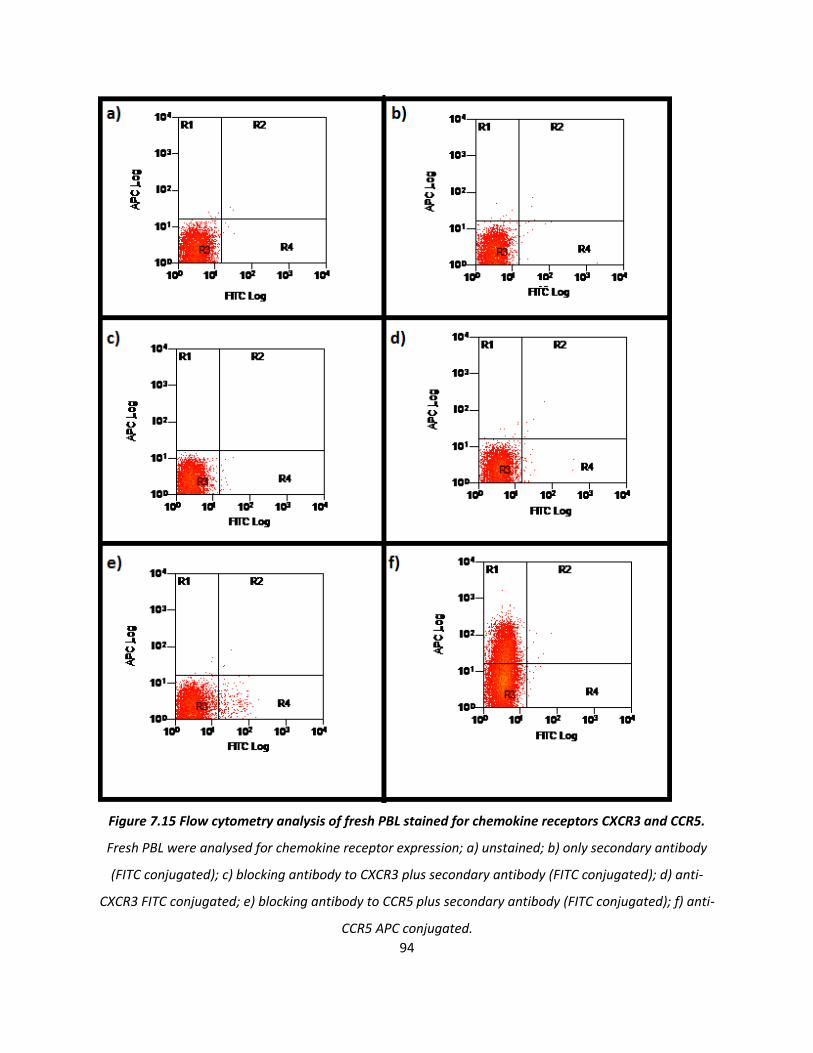
94
Figure 7.15 Flow cytometry analysis of fresh PBL stained for chemokine receptors CXCR3 and CCR5.
Fresh PBL were analysed for chemokine receptor expression; a) unstained; b) only secondary antibody
(FITC conjugated); c) blocking antibody to CXCR3 plus secondary antibody (FITC conjugated); d) anti-
CXCR3 FITC conjugated; e) blocking antibody to CCR5 plus secondary antibody (FITC conjugated); f) anti-
CCR5 APC conjugated.

95
Figure 7.16 Micrographs of HMEC-1 at 10 minute interval during a flow assay. Single field captured a)
8 minutes and b) 18 minutes after start of flow. Endothelial cells appeared to “vibrate” during the assay,
and circles emphasising areas where a change is apparent.
96
8. DISCUSSION
In order to protect the host, leukocytes must exit the blood and enter into tissues, and they utilise
various molecules to achieve this. Many studies have used in vitro models to determine which, and
how, various adhesion molecules, chemokines and cytokines affect lymphocyte recruitment to
endothelium. This study aimed to determine how the cytokines TNF-α and IFN-γ affect lymphocyte
recruitment to endothelium, including which subsets of lymphocytes they preferentially bind, plus
determine if the chemokine receptors CXCR3 and CCR5 are involved in this process.
8.1. The effect of cytokines on lymphocyte recruitment and behaviour.
HUVEC was treated with either TNF-α, IFN-γ or both and the effect on adhesion and transmigration of
lymphocytes was observed. Although insignificant, the use of both cytokines consistently caused the
adhesion of more lymphocytes than the use of each cytokine individually. Incubation of endothelium
with various cytokines has previously been shown to bring about the expression of various molecules
including P-selectin (47), VCAM-1 (52) and CXCL11 (69) (caused by TNF-α, IL-1 and IFN-γ respectively). It
is therefore plausible to suggest that the use of both cytokines together causes the expression of more
proteins by the endothelium, thus enabling the recruitment of more, and different, lymphocytes. This
is supported with the flow cytometry data – TNF-α treated endothelium had recruited significantly less
CD4+ T cells than the fresh PBL control, yet TNF+IFN treated endothelium did not. Therefore, the
addition of IFN-γ enables more efficient recruitment of CD4+ T cells. It would be wise to repeat this
experiment with IFN-γ treated endothelium to deduce if TNF+IFN treated endothelium binds more CD4+
T cells due to the cumulative effect of both cytokines, or IFN-γ itself allows for the more efficient
recruitment. As the relative numbers of memory CD4+ T cells remained constant, it could be proposed
that this decrease is due to less efficient recruitment of naive CD4+ T cells to TNF-α treated endothelium.
Previous studies have shown that transmigration of naive CD4+ T cells is reduced compared to CD8+ and
memory CD4+ T cells (72). It may therefore be possible that the lack of transmigration in those studies is
due to the lack of recruitment of naive CD4+ T cells in the first place.
The flow cytometry data shows proportions of each PBL subset within the fresh sample was, in the most
part, consistent with those defined (78), including a 2:1 CD4+:CD8+ T cell proportion. However, the
amount of B lymphocytes within the fresh sample was low: consistently only 5% in this study, compared
to what should be 10-15% (78). This low detection is likely caused by the use of anti-CD20 antibody to

97
define B cells, even though it is not present on plasma cells (79). It would therefore be appropriate to
repeat the assay with the use of, for example, anti-CD38 and anti-CD138 antibodies, which are highly
expressed on plasma cells (80).
Although in comparison to T cells there were low number of NK cells bound to the cytokine treated
endothelium, it actually had a very high efficiency of adhesion to both the TNF-α and TNF+IFN
stimulated endothelium. P-selectin has been shown to aid in the recruitment of lymphocytes to
endothelium and its expression is upregulated by pre-treatment of the endothelium with TNF-α (47). As
this molecule has also been shown to bind NK cells (81) it may be that this efficient binding of NK cells,
particularly in the TNF-α treated endothelium, is due to the upregulation of P-selectin by the endothelial
cells.
In this study, it was found that treatment of HUVEC stimulated with IFN-γ caused a significant increase in
the amount of transmigration in comparison to stimulation with TNF-α. The role of chemokines in
transmigration is well established, and their roles are summarised in two reviews (57, 82). A study by
Mohan and colleagues has previously shown that different chemokines are produced by endothelium
upon stimulation by different cytokine,s and that this had an effect on T cell transmigration (69). It is
therefore plausible that IFN-γ treated HUVEC produced chemokines more suited to PBL transmigration
than the TNF-α treated endothelium. Reduced recruitment, as well as transmigration, in the TNF-α
stimulated HUVEC may also be explained by this production of different chemokines, due to role of
chemokines in stable adhesion of lymphocytes (53, 60-62).
In a recent study by McGettrick and colleagues, cells took on what appeared to be a “frustrated”
phenotype, by transmigrating in and out of the endothelial cell monolayer multiple times (46). This
phenomenon was also observed here, in all three cytokine treated conditions. It was proposed that
these frustrated cells would eventual leave the circulation after a longer time frame, due to not
receiving additional signals for their retention and subsequent migration into compromised tissue.
Within this study, the frustrated cells do not appear to leave the endothelium after 1 hour, as similar
numbers of cells were seen at this time point in a single field. However it is unclear whether the single
field is representative of the entire channel, and thus whether over time the amount of PBL actually do
decrease. It is also of note that this single experiment only recorded PBL behaviour over 1 hour, so a
longer wash period should also be conducted to determine if “frustrated” cells eventually exit the
system altogether. Over the 1 hour of washing, only 2 of the 33 originally bound PBL remained
98
stationary and phase bright. This suggests that some PBL are predisposed not to transmigrate, but
remain on the endothelial cell surface. It would be interesting to observe if these cells are from a
particular subset of the PBL, and isolating the individual cell types (T cells, B cells, NK cells) and running
the flow assay individually would aid determination of this.
8.2 The effect of blocking two chemokine receptors on lymphocyte recruitment.
In this study, blocking of the chemokine receptors CXCR3 and CCR5 had no effect on lymphocyte
recruitment. This was of particular surprise for CXCR3, as previous results from McGettrick et al shows a
75% decrease in lymphocyte recruitment when TNF+IFN treated endothelium is perfused with PBL
treated with blocking antibody to CXCR3 (62). This is not the only published data which has shown
reduction when blocking CXCR3, with Piali et al and Curbishley et al also observing this (53, 61). One
possible explanation between the differences between this and the McGettrick study are the difference
in shear flow rate, 0.05Pa here compared to 0.1Pa in the other study (62). The 0.1Pa shear flow rate
was also used by Piali and colleagues to monitor lymphocyte recruitment to HUVEC (61). Although
Curbishley et al. conducted their experiments at 0.05Pa (53), their study involved specialised liver
activated T cells and liver endothelium, and so was not the same model as used in this study.
Nonetheless, the blocking of CXCR3 on PBL still had no effect on lymphocyte recruitment at 0.1Pa, and
therefore an alternative explanation was required.
Further research into the assays showed that the new antibody ordered for this study was a different
clone to that used in published data, so it was suggested that this could explain the inconsistent results.
Therefore flow cytometry analysis was used to ensure efficient binding of the new antibody to the PBL.
The blocking antibody stained fewer cells in comparison to the fluorescently conjugated antibody, which
could suggest that the blocking antibody had not bound. However, it is unlikely that the antibody
cannot bind, because not only have two papers shown that it is able to detect CXCR3 expression on mast
cells and melanomas (83-84), a 2010 paper by Oo and colleagues used the same antibody clone to
inhibit Treg binding in shear flow rates of 0.05Pa (85).
CXCR3 has two isoforms, A and B. Lasagni et al successfully utilised the blocking antibody clone to
detect the CXCR3-B isoform in transfectants (86), and so it is plausible that only this isoform is bound by
the antibody. A way to examine if this is the case would be to form both CXCR3-A and CXCR3-B

99
transfectant cell lines and using both the blocking antibody, and a secondary, to detect if the cell lines
stain positive via ELISA.
Another explanation of the differing results between this and previous studies is that the blocking
antibodies used prevent different interactions between CXCR3 and its ligands. The antibody clone used
in the three studies mentioned (53, 61-62) has been shown to block CXCL10, but not CXCL9 binding to
CXCR3 (87), whereas the antibody clone used within this study was shown to neutralise CXCL11
mediated chemotaxis. It is therefore possible that the two different antibodies used block slightly
different ligand-CXCR3 interactions, thus causing different results between this study and published
data. To assess if this is the case, a calcium flux assay could be conducted using all three chemokines,
aster blocking of PBL with the anti-CXCR3 antibody, and thus detecting if the cell is activated or not. If
this is found to be the case, it would imply that CXCL11 does not have a role in T-cell recruitment to
cytokine treated endothelium, and only a role in transmigration of PBL (69).
8.3 The use of HMEC-1 in flow.
The previously described assays all utilised primary HUVEC, however, when unavailable the
immortalised HMEC-1 cell line was used. Upon applying flow conditions, it was noted that few PBL
bound to the surface (0.15% adhesion compared with 0.55% when HUVEC used – data not shown (n=1)).
It is likely that this less efficient binding was due to the HMEC-1 not surviving the flow process – the
endothelium “vibrated”, and often pulled away from the slide surface. This would imply that HMEC-1
cannot be used in flow assay conditions – however Grubb et al utilised the cell line in a glass slide within
a parallel plate flow chamber at shear stress values 0.025-0.4Pa (88). As the shear stress used in these
experiments, 0.05Pa, is within this range, the HMEC-1 should have been able to withstand the flow.
It is therefore possible that the problems with the use of HMEC-1 under flow are the original seeding
density or the use of Ibidi slides. The latter are a channel with two wells containing media on either end
(figure 6.1), and so it is possible that the fresh media in the wells at either end does not reach the
HMEC-1 located in the centre of the channel. However, this is unlikely as the HUVEC were not affected
by growth within the Ibidi slide. To ensure that the Ibidi slide does not affect the use of HMEC-1 within
a flow assay, it would be wise to conduct an experiment in which fresh complete media is constantly
circulated through the slide to ensure the cells have access to the nutrients they require.

100
8.4 Future work.
First and foremost, tests must be conducted to ensure the blocking antibodies function correctly. This
could be conducted in various ways, for example chemotaxis assays or calcium flux assay. This is
paramount to ensure the differences between the data here and that found previously within the
laboratory are genuine.
Second, more accurate data on the effect of time on lymphocyte adhesion must be found. This study
conducted a single assay for 1 hour, and this was only in a one field, therefore its representation for the
whole slide can be questioned. Further analysis would include researching 10 fields down the slide at
different time points, and this would include conducting the experiment for longer than 1 hour.
Although the cell subtypes which bound to the endothelium here were found for TNF-α and TNF+IFN,
this was not conducted for the IFN-γ condition alone. As transmigration is highest in the IFN-γ treated
condition, it would be interesting to see if a difference is cellular recruitment may account for this.
Fourthly, although the different subtypes of PBL bound to the endothelium, it was not distinguished
whether different subtypes of cells preferentially transmigrated through the endothelium. The subsets
of transmigrated cells has been the focus of many studies (65, 69, 72-73), however these studies have
used isolated T cells, as opposed to PBL as a whole. To determine, phase bright cells and phase dark
cells should be retrieved from the slides separately, and their differences deduced. It may be possible to
do this by flowing EDTA through the channel to loosen the phase bright cells, before trypsin treatment
to retrieve the remaining, transmigrated, cells.
Finally, determination of the optimal seeding density of HMEC-1 is paramount before more assays are to
be conducted. It would then be possible to determine if the Ibidi slide has an effect on the use of HMEC-
1 within a flow system.

101
REFERENCES
1. Mebius, R. E., and Kraal, G. (2005) Structure and function of the spleen, Nat Rev Immunol 5, 606-616.
2. Vale, A. M., and Schroeder, H. W., Jr. (2010) Clinical consequences of defects in B-cell development, J Allergy Clin Immunol 125, 778-787.
3. Oracki, S. A., Walker, J. A., Hibbs, M. L., Corcoran, L. M., and Tarlinton, D. M. (2010) Plasma cell development and survival, Immunol Rev 237, 140-159.
4. Zubler, R. H. (2001) Naive and memory B cells in T-cell-dependent and T-independent responses, Springer Semin Immunopathol 23, 405-419.
5. MacLennan, I. C. (1994) Germinal centers, Annu Rev Immunol 12, 117-139. 6. Allen, C. D., Okada, T., and Cyster, J. G. (2007) Germinal-center organization and cellular
dynamics, Immunity 27, 190-202. 7. Berek, C., Berger, A., and Apel, M. (1991) Maturation of the immune response in
germinal centers, Cell 67, 1121-1129. 8. Schwickert, T. A., Lindquist, R. L., Shakhar, G., Livshits, G., Skokos, D., Kosco-Vilbois, M.
H., Dustin, M. L., and Nussenzweig, M. C. (2007) In vivo imaging of germinal centres reveals a dynamic open structure, Nature 446, 83-87.
9. Hauser, A. E., Kerfoot, S. M., and Haberman, A. M. (2010) Cellular choreography in the germinal center: new visions from in vivo imaging, Semin Immunopathol 32, 239-255.
10. Baggiolini, M., Dewald, B., and Moser, B. (1997) Human chemokines: an update, Annu Rev Immunol 15, 675-705.
11. Rot, A., and von Andrian, U. H. (2004) Chemokines in innate and adaptive host defense: basic chemokinese grammar for immune cells, Annu Rev Immunol 22, 891-928.
12. Fredriksson, R., Lagerstrom, M. C., Lundin, L. G., and Schioth, H. B. (2003) The G-protein-coupled receptors in the human genome form five main families. Phylogenetic analysis, paralogon groups, and fingerprints, Mol Pharmacol 63, 1256-1272.
13. Sun, Y., McGarrigle, D., and Huang, X. Y. (2007) When a G protein-coupled receptor does not couple to a G protein, Mol Biosyst 3, 849-854.
14. Segerer, S., Jedlicka, J., and Wuthrich, R. P. (2010) Atypical chemokine receptors in renal inflammation, Nephron Exp Nephrol 115, e89-95.
15. Ulvmar, M. H., Hub, E., and Rot, A. (2011) Atypical chemokine receptors, Exp Cell Res 317, 556-568.
16. Shimada, T., Matsumoto, M., Tatsumi, Y., Kanamaru, A., and Akira, S. (1998) A novel lipopolysaccharide inducible C-C chemokine receptor related gene in murine macrophages, FEBS Lett 425, 490-494.
17. Fan, P., Kyaw, H., Su, K., Zeng, Z., Augustus, M., Carter, K. C., and Li, Y. (1998) Cloning and characterization of a novel human chemokine receptor, Biochem Biophys Res Commun 243, 264-268.
18. Galligan, C. L., Matsuyama, W., Matsukawa, A., Mizuta, H., Hodge, D. R., Howard, O. M., and Yoshimura, T. (2004) Up-regulated expression and activation of the orphan chemokine receptor, CCRL2, in rheumatoid arthritis, Arthritis Rheum 50, 1806-1814.

102
19. Otero, K., Vecchi, A., Hirsch, E., Kearley, J., Vermi, W., Del Prete, A., Gonzalvo-Feo, S., Garlanda, C., Azzolino, O., Salogni, L., Lloyd, C. M., Facchetti, F., Mantovani, A., and Sozzani, S. (2010) Nonredundant role of CCRL2 in lung dendritic cell trafficking, Blood 116, 2942-2949.
20. Yoshimura, T., and Oppenheim, J. J. (2011) Chemokine-like receptor 1 (CMKLR1) and chemokine (C-C motif) receptor-like 2 (CCRL2); two multifunctional receptors with unusual properties, Exp Cell Res 317, 674-684.
21. Migeotte, I., Franssen, J. D., Goriely, S., Willems, F., and Parmentier, M. (2002) Distribution and regulation of expression of the putative human chemokine receptor HCR in leukocyte populations, Eur J Immunol 32, 494-501.
22. Hartmann, T. N., Leick, M., Ewers, S., Diefenbacher, A., Schraufstatter, I., Honczarenko, M., and Burger, M. (2008) Human B cells express the orphan chemokine receptor CRAM-A/B in a maturation-stage-dependent and CCL5-modulated manner, Immunology 125, 252-262.
23. Biber, K., Zuurman, M. W., Homan, H., and Boddeke, H. W. (2003) Expression of L-CCR in HEK 293 cells reveals functional responses to CCL2, CCL5, CCL7, and CCL8, J Leukoc Biol 74, 243-251.
24. Zabel, B. A., Nakae, S., Zuniga, L., Kim, J. Y., Ohyama, T., Alt, C., Pan, J., Suto, H., Soler, D., Allen, S. J., Handel, T. M., Song, C. H., Galli, S. J., and Butcher, E. C. (2008) Mast cell-expressed orphan receptor CCRL2 binds chemerin and is required for optimal induction of IgE-mediated passive cutaneous anaphylaxis, J Exp Med 205, 2207-2220.
25. Leick, M., Catusse, J., Follo, M., Nibbs, R. J., Hartmann, T. N., Veelken, H., and Burger, M. (2010) CCL19 is a specific ligand of the constitutively recycling atypical human chemokine receptor CRAM-B, Immunology 129, 536-546.
26. Ansel, K. M., Ngo, V. N., Hyman, P. L., Luther, S. A., Forster, R., Sedgwick, J. D., Browning, J. L., Lipp, M., and Cyster, J. G. (2000) A chemokine-driven positive feedback loop organizes lymphoid follicles, Nature 406, 309-314.
27. Forster, R., Schubel, A., Breitfeld, D., Kremmer, E., Renner-Muller, I., Wolf, E., and Lipp, M. (1999) CCR7 coordinates the primary immune response by establishing functional microenvironments in secondary lymphoid organs, Cell 99, 23-33.
28. Allen, C. D., Ansel, K. M., Low, C., Lesley, R., Tamamura, H., Fujii, N., and Cyster, J. G. (2004) Germinal center dark and light zone organization is mediated by CXCR4 and CXCR5, Nat Immunol 5, 943-952.
29. Cascalho, M., Ma, A., Lee, S., Masat, L., and Wabl, M. (1996) A quasi-monoclonal mouse, Science 272, 1649-1652.
30. de Vinuesa, C. G., Cook, M. C., Ball, J., Drew, M., Sunners, Y., Cascalho, M., Wabl, M., Klaus, G. G., and MacLennan, I. C. (2000) Germinal centers without T cells, J Exp Med 191, 485-494.
31. Borroni, E. M., and Bonecchi, R. (2009) Shaping the gradient by nonchemotactic chemokine receptors, Cell Adh Migr 3, 146-147.
32. (MD), B. (2002) The NCBI Handbook [Internet]; The Reference Sequence (RefSeq) Project. , National Library of Medicine (US), National Center for Biotechnology

103
Information Chapter 18, Available from http://www.ncbi.nlm.nih.gov/entrez/query.fcgi?db=Books.
33. Colobran, R., Pujol-Borrell, R., Armengol, M. P., and Juan, M. (2007) The chemokine network. II. On how polymorphisms and alternative splicing increase the number of molecular species and configure intricate patterns of disease susceptibility, Clin Exp Immunol 150, 1-12.
34. Zhang, Y. (2010) Thesis: Signals for B Cell Activation in Antibody Response, The University of Birmingham.
35. Cyster, J. G. (2003) Homing of antibody secreting cells, Immunol Rev 194, 48-60. 36. Reif, K., Ekland, E. H., Ohl, L., Nakano, H., Lipp, M., Forster, R., and Cyster, J. G. (2002)
Balanced responsiveness to chemoattractants from adjacent zones determines B-cell position, Nature 416, 94-99.
37. Forster, R., Davalos-Misslitz, A. C., and Rot, A. (2008) CCR7 and its ligands: balancing immunity and tolerance, Nat Rev Immunol 8, 362-371.
38. Okada, T., Miller, M. J., Parker, I., Krummel, M. F., Neighbors, M., Hartley, S. B., O'Garra, A., Cahalan, M. D., and Cyster, J. G. (2005) Antigen-engaged B cells undergo chemotaxis toward the T zone and form motile conjugates with helper T cells, PLoS Biol 3, e150.
39. Hardtke, S., Ohl, L., and Forster, R. (2005) Balanced expression of CXCR5 and CCR7 on follicular T helper cells determines their transient positioning to lymph node follicles and is essential for efficient B-cell help, Blood 106, 1924-1931.
40. Corcione, A., Tortolina, G., Bonecchi, R., Battilana, N., Taborelli, G., Malavasi, F., Sozzani, S., Ottonello, L., Dallegri, F., and Pistoia, V. (2002) Chemotaxis of human tonsil B lymphocytes to CC chemokine receptor (CCR) 1, CCR2 and CCR4 ligands is restricted to non-germinal center cells, Int Immunol 14, 883-892.
41. Nibbs, R., Graham, G., and Rot, A. (2003) Chemokines on the move: control by the chemokine "interceptors" Duffy blood group antigen and D6, Semin Immunol 15, 287-294.
42. Ley, K., Laudanna, C., Cybulsky, M. I., and Nourshargh, S. (2007) Getting to the site of inflammation: the leukocyte adhesion cascade updated, Nat Rev Immunol 7, 678-689.
43. Constantin, G. (2008) Chemokine signaling and integrin activation in lymphocyte migration into the inflamed brain, J Neuroimmunol 198, 20-26.
44. Wajant, H., Pfizenmaier, K., and Scheurich, P. (2003) Tumor necrosis factor signaling, Cell Death Differ 10, 45-65.
45. Platanias, L. C. (2005) Mechanisms of type-I- and type-II-interferon-mediated signalling, Nat Rev Immunol 5, 375-386.
46. McGettrick, H. M., Hunter, K., Moss, P. A., Buckley, C. D., Rainger, G. E., and Nash, G. B. (2009) Direct observations of the kinetics of migrating T cells suggest active retention by endothelial cells with continual bidirectional migration, J Leukoc Biol 85, 98-107.
47. Luscinskas, F. W., Ding, H., and Lichtman, A. H. (1995) P-selectin and vascular cell adhesion molecule 1 mediate rolling and arrest, respectively, of CD4+ T lymphocytes on tumor necrosis factor alpha-activated vascular endothelium under flow, J Exp Med 181, 1179-1186.

104
48. Tedder, T. F., Steeber, D. A., Chen, A., and Engel, P. (1995) The selectins: vascular adhesion molecules, FASEB J 9, 866-873.
49. Kansas, G. S. (1996) Selectins and their ligands: current concepts and controversies, Blood 88, 3259-3287.
50. Yago, T., Tsukuda, M., Yamazaki, H., Nishi, T., Amano, T., and Minami, M. (1995) Analysis of an initial step of T cell adhesion to endothelial monolayers under flow conditions, J Immunol 154, 1216-1222.
51. Jones, D. A., McIntire, L. V., Smith, C. W., and Picker, L. J. (1994) A two-step adhesion cascade for T cell/endothelial cell interactions under flow conditions, J Clin Invest 94, 2443-2450.
52. Oppenheimer-Marks, N., Davis, L. S., Bogue, D. T., Ramberg, J., and Lipsky, P. E. (1991) Differential utilization of ICAM-1 and VCAM-1 during the adhesion and transendothelial migration of human T lymphocytes, J Immunol 147, 2913-2921.
53. Curbishley, S. M., Eksteen, B., Gladue, R. P., Lalor, P., and Adams, D. H. (2005) CXCR 3 activation promotes lymphocyte transendothelial migration across human hepatic endothelium under fluid flow, Am J Pathol 167, 887-899.
54. Proudfoot, A. E., Fritchley, S., Borlat, F., Shaw, J. P., Vilbois, F., Zwahlen, C., Trkola, A., Marchant, D., Clapham, P. R., and Wells, T. N. (2001) The BBXB motif of RANTES is the principal site for heparin binding and controls receptor selectivity, J Biol Chem 276, 10620-10626.
55. Proudfoot, A. E., Handel, T. M., Johnson, Z., Lau, E. K., LiWang, P., Clark-Lewis, I., Borlat, F., Wells, T. N., and Kosco-Vilbois, M. H. (2003) Glycosaminoglycan binding and oligomerization are essential for the in vivo activity of certain chemokines, Proc Natl Acad Sci U S A 100, 1885-1890.
56. Rot, A. (2010) Chemokine patterning by glycosaminoglycans and interceptors, Front Biosci 15, 645-660.
57. Alon, R., and Shulman, Z. (2011) Chemokine triggered integrin activation and actin remodeling events guiding lymphocyte migration across vascular barriers, Exp Cell Res 317, 632-641.
58. Tadokoro, S., Shattil, S. J., Eto, K., Tai, V., Liddington, R. C., de Pereda, J. M., Ginsberg, M. H., and Calderwood, D. A. (2003) Talin binding to integrin beta tails: a final common step in integrin activation, Science 302, 103-106.
59. Baltus, T., Weber, K. S., Johnson, Z., Proudfoot, A. E., and Weber, C. (2003) Oligomerization of RANTES is required for CCR1-mediated arrest but not CCR5-mediated transmigration of leukocytes on inflamed endothelium, Blood 102, 1985-1988.
60. Lim, Y. C., Garcia-Cardena, G., Allport, J. R., Zervoglos, M., Connolly, A. J., Gimbrone, M. A., Jr., and Luscinskas, F. W. (2003) Heterogeneity of endothelial cells from different organ sites in T-cell subset recruitment, Am J Pathol 162, 1591-1601.
61. Piali, L., Weber, C., LaRosa, G., Mackay, C. R., Springer, T. A., Clark-Lewis, I., and Moser, B. (1998) The chemokine receptor CXCR3 mediates rapid and shear-resistant adhesion-induction of effector T lymphocytes by the chemokines IP10 and Mig, Eur J Immunol 28, 961-972.
105
62. McGettrick, H. M., Smith, E., Filer, A., Kissane, S., Salmon, M., Buckley, C. D., Rainger, G. E., and Nash, G. B. (2009) Fibroblasts from different sites may promote or inhibit recruitment of flowing lymphocytes by endothelial cells, Eur J Immunol 39, 113-125.
63. Nijhara, R., van Hennik, P. B., Gignac, M. L., Kruhlak, M. J., Hordijk, P. L., Delon, J., and Shaw, S. (2004) Rac1 mediates collapse of microvilli on chemokine-activated T lymphocytes, J Immunol 173, 4985-4993.
64. Brown, M. J., Nijhara, R., Hallam, J. A., Gignac, M., Yamada, K. M., Erlandsen, S. L., Delon, J., Kruhlak, M., and Shaw, S. (2003) Chemokine stimulation of human peripheral blood T lymphocytes induces rapid dephosphorylation of ERM proteins, which facilitates loss of microvilli and polarization, Blood 102, 3890-3899.
65. Ding, Z., Xiong, K., and Issekutz, T. B. (2000) Regulation of chemokine-induced transendothelial migration of T lymphocytes by endothelial activation: differential effects on naive and memory T cells, J Leukoc Biol 67, 825-833.
66. Robledo, M. M., Bartolome, R. A., Longo, N., Rodriguez-Frade, J. M., Mellado, M., Longo, I., van Muijen, G. N., Sanchez-Mateos, P., and Teixido, J. (2001) Expression of functional chemokine receptors CXCR3 and CXCR4 on human melanoma cells, J Biol Chem 276, 45098-45105.
67. Hall, A. (1998) Rho GTPases and the actin cytoskeleton, Science 279, 509-514. 68. Borthwick, N. J., Akbar, A. N., MacCormac, L. P., Lowdell, M., Craigen, J. L., Hassan, I.,
Grundy, J. E., Salmon, M., and Yong, K. L. (1997) Selective migration of highly differentiated primed T cells, defined by low expression of CD45RB, across human umbilical vein endothelial cells: effects of viral infection on transmigration, Immunology 90, 272-280.
69. Mohan, K., Ding, Z., Hanly, J., and Issekutz, T. B. (2002) IFN-gamma-inducible T cell alpha chemoattractant is a potent stimulator of normal human blood T lymphocyte transendothelial migration: differential regulation by IFN-gamma and TNF-alpha, J Immunol 168, 6420-6428.
70. Ahmed, S. R., McGettrick, H. M., Yates, C. M., Buckley, C. D., Ratcliffe, M. J., Nash, G. B., and Rainger, G. E. (2011) Prostaglandin D2 Regulates CD4+ Memory T Cell Trafficking across Blood Vascular Endothelium and Primes These Cells for Clearance across Lymphatic Endothelium, J Immunol 187, 1432-1439.
71. Oppenheimer-Marks, N., Davis, L. S., and Lipsky, P. E. (1990) Human T lymphocyte adhesion to endothelial cells and transendothelial migration. Alteration of receptor use relates to the activation status of both the T cell and the endothelial cell, J Immunol 145, 140-148.
72. Pietschmann, P., Cush, J. J., Lipsky, P. E., and Oppenheimer-Marks, N. (1992) Identification of subsets of human T cells capable of enhanced transendothelial migration, J Immunol 149, 1170-1178.
73. Brezinschek, R. I., Lipsky, P. E., Galea, P., Vita, R., and Oppenheimer-Marks, N. (1995) Phenotypic characterization of CD4+ T cells that exhibit a transendothelial migratory capacity, J Immunol 154, 3062-3077.

106
74. Bird, I. N., Spragg, J. H., Ager, A., and Matthews, N. (1993) Studies of lymphocyte transendothelial migration: analysis of migrated cell phenotypes with regard to CD31 (PECAM-1), CD45RA and CD45RO, Immunology 80, 553-560.
75. Cooke, B. M., Usami, S., Perry, I., and Nash, G. B. (1993) A simplified method for culture of endothelial cells and analysis of adhesion of blood cells under conditions of flow, Microvasc Res 45, 33-45.
76. Chakravorty, S. J., McGettrick, H. M., Butler, L. M., Buckley, C. D., Rainger, G. E., and Nash, G. B. (2006) An in vitro model for analysing neutrophil migration into and away from the sub-endothelial space: Roles of flow and CD31, Biorheology 43, 71-82.
77. Butler, L. M., Rainger, G. E., Rahman, M., and Nash, G. B. (2005) Prolonged culture of endothelial cells and deposition of basement membrane modify the recruitment of neutrophils, Exp Cell Res 310, 22-32.
78. Abbas AK., L. A., Pillai S. (2009) Cellular and Molecular Immunology, Saunders Elsevier Edition 6 (Updated).
79. Chu, P. G., Loera, S., Huang, Q., and Weiss, L. M. (2006) Lineage determination of CD20- B-Cell neoplasms: an immunohistochemical study, Am J Clin Pathol 126, 534-544.
80. Rawstron, A. C. (2006) Immunophenotyping of plasma cells, Curr Protoc Cytom Chapter 6, Unit6 23.
81. Moore, K. L., and Thompson, L. F. (1992) P-selectin (CD62) binds to subpopulations of human memory T lymphocytes and natural killer cells, Biochem Biophys Res Commun 186, 173-181.
82. Rose, D. M., Alon, R., and Ginsberg, M. H. (2007) Integrin modulation and signaling in leukocyte adhesion and migration, Immunol Rev 218, 126-134.
83. Fukiwake, N., Moroi, Y., Imafuku, S., Masuda, T., Kokuba, H., Furue, M., and Urabe, K. (2006) Anti-CXCR3 staining is useful for detecting human cutaneous and mucosal mast cells, J Dermatol 33, 326-330.
84. Monteagudo, C., Martin, J. M., Jorda, E., and Llombart-Bosch, A. (2007) CXCR3 chemokine receptor immunoreactivity in primary cutaneous malignant melanoma: correlation with clinicopathological prognostic factors, J Clin Pathol 60, 596-599.
85. Oo, Y. H., Weston, C. J., Lalor, P. F., Curbishley, S. M., Withers, D. R., Reynolds, G. M., Shetty, S., Harki, J., Shaw, J. C., Eksteen, B., Hubscher, S. G., Walker, L. S., and Adams, D. H. (2010) Distinct roles for CCR4 and CXCR3 in the recruitment and positioning of regulatory T cells in the inflamed human liver, J Immunol 184, 2886-2898.
86. Lasagni, L., Francalanci, M., Annunziato, F., Lazzeri, E., Giannini, S., Cosmi, L., Sagrinati, C., Mazzinghi, B., Orlando, C., Maggi, E., Marra, F., Romagnani, S., Serio, M., and Romagnani, P. (2003) An alternatively spliced variant of CXCR3 mediates the inhibition of endothelial cell growth induced by IP-10, Mig, and I-TAC, and acts as functional receptor for platelet factor 4, J Exp Med 197, 1537-1549.
87. Qin, S., Rottman, J. B., Myers, P., Kassam, N., Weinblatt, M., Loetscher, M., Koch, A. E., Moser, B., and Mackay, C. R. (1998) The chemokine receptors CXCR3 and CCR5 mark subsets of T cells associated with certain inflammatory reactions, J Clin Invest 101, 746-754.

107
88. Grubb, S. E., Murdoch, C., Sudbery, P. E., Saville, S. P., Lopez-Ribot, J. L., and Thornhill, M. H. (2009) Adhesion of Candida albicans to endothelial cells under physiological conditions of flow, Infect Immun 77, 3872-3878.

108
APPENDIX A: Information on CCRL2 gene and primer locations.
CCRL2 gene sequence Part 1: Current known Introns and exons. Exons marked with a grey background
CTACTGGGGGAGGAGAGACCTTATTAGGAAGTGCCTCCGTTCTGGGTTCTCCCTGCTCCAGGGTGAGTTTCATTTTCTGTCCTAGCTTCCAGGATGCTCGGGGCTTAATGTTCACTCATGTTTATCTGGGCTCTTTTCTTTCTGTTTTCTTATTGGTCTCTTCATTACCTATTTCTGTTTTTATAGTTACACTTTCCGTTTCACATGCTGATAATGCAAAGGATGTGCCTAAATCACAGACATCACCTAGTCCCCAGATTAGGTCAGCCATAGCTACACAGAGTCGTGGGCCTGAGGGCAGTTTACACATGCTTCCCGCCCCTCCCCCCCAACTCTTTGAAGTTCTTCTTCTTCTTCTTGAAATACCCATCTTTAACCAGCATCCTTCTCCTCCCGCCCACTCCCTTCCACTCCAAGACCAGGCAACTGTCCAATTCCTTTCTTCATCCCCATTCTCCATTGGAAACCAAGTCTCCCCTCCTCACAGTCCACCTGACCGTGTCCCACACGTCCTCACACAGGACTTTCCCCCGGGGCTTCCCCTGAGCGGGGTCAGCTACATCAAGTGTCCCAGCATCAACTGCTTCCTTCCAGCTGCTTGCAACACTCTTTGCTTTCTGACGTAGGAATGCTCACACCAGACTTGCATTTAGCAGCGCTCCTTTTCTGTCCAGCTCTGTCCCCAACCTCCTTCCCGACTGATACCACTTGCTTCCATGTTCTCTGGTGAGTATGGACACGTTTGTACTCTGGAAACTGTTATCTACTCAGGGAACTTATGTCAGAAGCCAGGGGGTGGGGTGGTGCGTCTCGGCTTCTGACATCACACTCTGATTATCACTGGAAGCAGGCGTGGGTTAGTGTCCTTATCCGAGGCAGCCTGGAGGACAGCTGGCTAAGAGGTACAGAGAAGTCAAACTTGGGATACCGGGAGAGGGAGAGATGAAAACAACTTCTCAATTTCTCTGCGGCTGACAGAAGCTCCTGAGAGAGGCTTTCAGAACTTGATTCCAGCTGGCCCGTGAAAGCTGTGTCTGGACGGGAGAGCCTCAGAGGAATAAACAGTGCCTTCTCTGGCTTCTCCGGGTCATGACCAGTCTGTTCAGAAGGAAGTGGTGTTTCTCTGACCCCACTGTTCCCACAGCCCCCTGGATGGTAGATCATGGGGCTGCACCCTTCCCCACCCTTGGGAACTCAGTCAAACGGTTATCTTTATCTCGCCAGCTTGTCCTCGTGCTTGACCAGCGCAGTTTCACTTTTGCAAACATCTGTTTATATCCCTTGAGAGAAAAAATATCAAGCAACCTGCCTCAAACGACGCTGTTTTGTCCGGTGAGCAAGGTAAGAAACTGTTTTAAACATCTGGGAAGTAGGCGGGCACCAACTTCTGAAGCTTAAGCCAGTCTCTGGTTGTTTTTAACTCTTTGTTTTCTTAGATCCTATCTCCCACGTAGAGTCTCGTTTCAACCAAAGAACTTAAGTGGCTTTAACGTCCCTGACTCTTTCTGTACCAGGCAGTTTCTGTCACATTAGCAGCGTGGTCCCTGGGTGCTTAATGAGGAGATTTGAGTACGGCCGCCCACGCTGGGGTGGGGGGTGGGGGCATAGTTACTTTCAGTCTTTGGCTGTCGGATGGAGGGGAATCATGACCTCTGGTTTCCCCACAGGACAGCCTCCGATGGATAACTACACAGTGGCCCCGGACGATGAATATGATGTCCTAATCTTAGACGACTACCTGGACAACAGTGGGCCGGACCAAGTTCCGGCCCCCGAGTTCCTCTCCCCCCAGCAGGTGCTGCAGTTCTGCTGCGCGGTGTTTGCGGTGGGTCTCTTGGACAACGTGCTGGCGGTGTTTATCTTGGTGAAATACAAAGGACTCAAGAATCTGGGGAACATCTACTTCCTAAACCTGGCACTTTCAAACCTGTGTTTCCTGCTTCCCCTGCCGTTCTGGGCCCATACTGCAGCACACGGGGAAAGCCCTGGCAATGGGACCTGTAAAGTTCTTGTCGGACTCCACTCCTCGGGCTTATACAGCGAGGTGTTTTCCAACATCCTCCTCCTTGTGCAAGGATACAGGGTGTTTTCCCAAGGGCGACTGGCCTCCATCTTCACGACAGTGTCTTGTGGTATTGTTGCGTGCATCCTGGCATGGGCCATGGCTACTGCGCTCTCTTTGCCCGAGTCTGTGTTTTATGAGCCTCGGATGGAAAGACAGAAACACAAGTGTGCCTTTGGCAAACCTCACTTCTTGCCAATCGAAGCGCCGCTCTGGAAGTACGTTCTGACGTCAAAAATGATCATCTTGGTACTTGCTTTTCCTCTGCTGGTTTTTATAATCTGCTGCAGGCAACTGAGGAGAAGGCAGAGCTTCAGGGAGAGACAGTACGACCTCCACAAGCCGGCTCTTGTCATAACGGGCGTGTTCCTTTTGATGTGGGCGCCTTACAACACTGTGCTTTTCCTGTCTGCTTTCCAGGAACACTTGTCCCTGCAGGATGAGAAGAGCAGCTACCACCTGGACGCAAGTGTTCAGGTCACACAGCTGGTAGCGACCACCCACTGCTGCGTCAACCCGCTGCTCTATTTGCTTCTTGACCGGAAGGCCTTTATGAGATACCTTCGCAGCCTGTTCCCACGGTGCAATGATATCCCCTATCAAAGTAGTGGAGGCTATCAGCAAGCGCCTCCAAGGGAAGGTCATGGCAGGCCCATTGAACTGTACAGCAATTTGCATCAAAGGCAGGATATAATATAATATAAACACTCAACCTTGTCTCTTCACATTGTTTTATGCCATTTTTATATGTTTGTATAAAAATAGAATATAAGAGGAAAGGGGGCTGGTTAATGAACATTTACTACTAAGCGTTGAATTTGTCTCTGGCACACGGTTAAGTTATTTATAAAGGTGAATTCCACTCTTCCTCTTTAGCGTTTGTCCGCAGTGTGGGCGTGGGCGGTGTGCATTCCATAAACTGAAGCTCGGTAGTTGTCCAAAGTTACATAACTATAAAGTGGCAAAACTGATGTGTAAACTCAGAGATCACTGGCCCCAGAGTCTGTGAGTTATCCAAGCGTGCCAGCCTTTCAGTAACTGTCAGCTAGCAGTGGTGGCATGTCTGTCATCCCAGCACTCTAGGAGGCGGAGGCAGGAGGCATCTCACAAATGCAAGTATAACCTGACTTCCCCCAACCTCAATTCTTTTTTTTTTGTTGTTGTTGTTGTTCATCAAAATACATGCAATAAATATATATATTTTTAAAGCACATCTTGAAGGTTGGGATTATAGTTTTGTTGGTAGAACATTAGCCCCCCAAGCCCAGCTTTGATCTATAGCATGGCATCTACCTAGTATGATCATGCCCATTTTGTTTTGTTTTGGGAGGCAGGGTTTCTCTGTGTAGCCCTGGCTGTCCAAGAACTCTCTTTGTAGTCGAGGCTAGCCTTGAACTCAGAGATGTGCCTGCCTCTGTTTCCTGAGTGCTAACACCTGGTGATGCCCATCTCAATATCAGCTCAACTCAAGAGGTGGACACAGAAAGATGAGAAGTTCAAGGTCATTCTTGGCTGTAGAGTTAGTTCAAGGTCACCTGGATCCATTAGACCCTGTCTTTAAAAAAAAAAAAAAAAACCCTAAGCCCAAATTGACCAAATTCTAAGTTAGAAGCAAGTGTTGGCTCATGTTCCTGCAGGCCCTGAGAGGTGCTGGCTGCGTGGTAGCGGTGCAAGCCAATGGCAAGGTCTGGTGGAACCTGCTGGGCTCTCTTGACTACTCACTATACTCAGGTTTGTCTGATTCTTCCAGCCCTTGAGTCCTCCGAGGTTTCAGAGTCTGTATTATGAAGGCTCTGTGTCTTAGGAAAGT
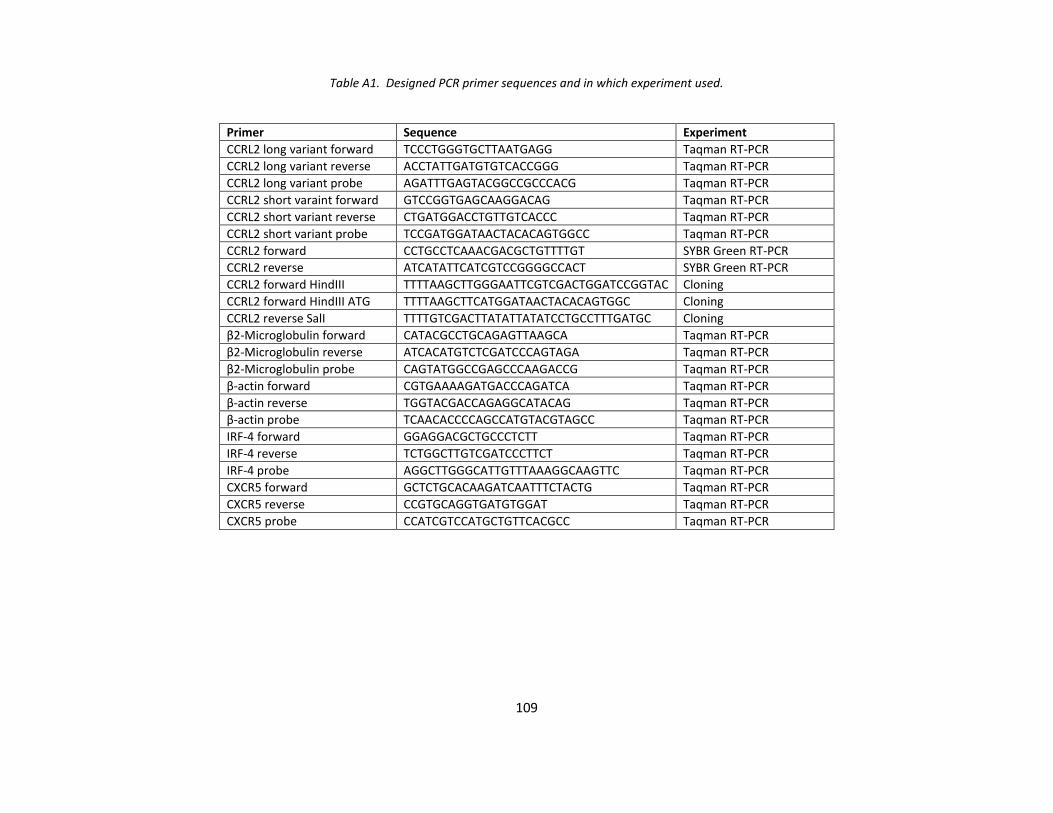
109
Table A1. Designed PCR primer sequences and in which experiment used.
Primer Sequence Experiment
CCRL2 long variant forward TCCCTGGGTGCTTAATGAGG Taqman RT-PCR
CCRL2 long variant reverse ACCTATTGATGTGTCACCGGG Taqman RT-PCR
CCRL2 long variant probe AGATTTGAGTACGGCCGCCCACG Taqman RT-PCR
CCRL2 short varaint forward GTCCGGTGAGCAAGGACAG Taqman RT-PCR
CCRL2 short variant reverse CTGATGGACCTGTTGTCACCC Taqman RT-PCR
CCRL2 short variant probe TCCGATGGATAACTACACAGTGGCC Taqman RT-PCR
CCRL2 forward CCTGCCTCAAACGACGCTGTTTTGT SYBR Green RT-PCR
CCRL2 reverse ATCATATTCATCGTCCGGGGCCACT SYBR Green RT-PCR
CCRL2 forward HindIII TTTTAAGCTTGGGAATTCGTCGACTGGATCCGGTAC Cloning
CCRL2 forward HindIII ATG TTTTAAGCTTCATGGATAACTACACAGTGGC Cloning
CCRL2 reverse SalI TTTTGTCGACTTATATTATATCCTGCCTTTGATGC Cloning
β2-Microglobulin forward CATACGCCTGCAGAGTTAAGCA Taqman RT-PCR
β2-Microglobulin reverse ATCACATGTCTCGATCCCAGTAGA Taqman RT-PCR
β2-Microglobulin probe CAGTATGGCCGAGCCCAAGACCG Taqman RT-PCR
β-actin forward CGTGAAAAGATGACCCAGATCA Taqman RT-PCR
β-actin reverse TGGTACGACCAGAGGCATACAG Taqman RT-PCR
β-actin probe TCAACACCCCAGCCATGTACGTAGCC Taqman RT-PCR
IRF-4 forward GGAGGACGCTGCCCTCTT Taqman RT-PCR
IRF-4 reverse TCTGGCTTGTCGATCCCTTCT Taqman RT-PCR
IRF-4 probe AGGCTTGGGCATTGTTTAAAGGCAAGTTC Taqman RT-PCR
CXCR5 forward GCTCTGCACAAGATCAATTTCTACTG Taqman RT-PCR
CXCR5 reverse CCGTGCAGGTGATGTGGAT Taqman RT-PCR
CXCR5 probe CCATCGTCCATGCTGTTCACGCC Taqman RT-PCR

110
Table A2. Primers ordered direct from Applied Biosystems: Taqman Gene Expression Assay.
Primer ID Number
CCR1 Mm00432606_s1
CCR2 Mm99999051_gH
CCR4 Mm00438271_m1
CCR5 Mm01216171_m1
CCR7 Mm00432608_m1
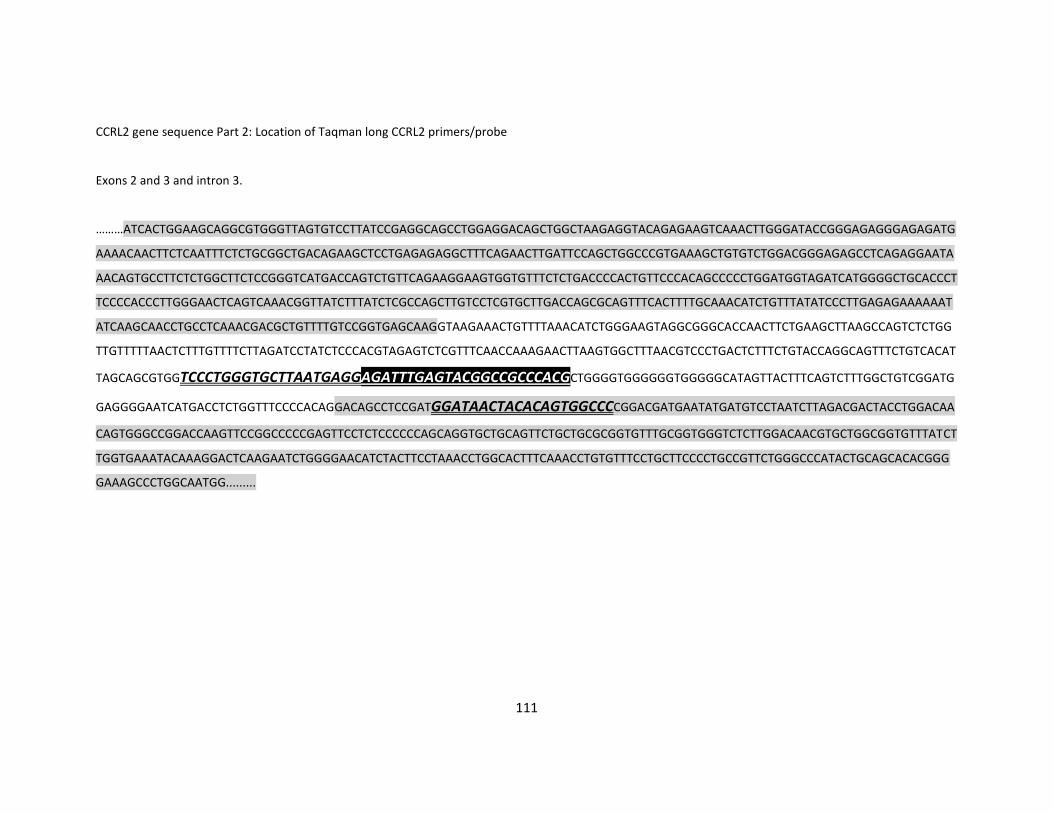
111
CCRL2 gene sequence Part 2: Location of Taqman long CCRL2 primers/probe
Exons 2 and 3 and intron 3.
………ATCACTGGAAGCAGGCGTGGGTTAGTGTCCTTATCCGAGGCAGCCTGGAGGACAGCTGGCTAAGAGGTACAGAGAAGTCAAACTTGGGATACCGGGAGAGGGAGAGATG
AAAACAACTTCTCAATTTCTCTGCGGCTGACAGAAGCTCCTGAGAGAGGCTTTCAGAACTTGATTCCAGCTGGCCCGTGAAAGCTGTGTCTGGACGGGAGAGCCTCAGAGGAATA
AACAGTGCCTTCTCTGGCTTCTCCGGGTCATGACCAGTCTGTTCAGAAGGAAGTGGTGTTTCTCTGACCCCACTGTTCCCACAGCCCCCTGGATGGTAGATCATGGGGCTGCACCCT
TCCCCACCCTTGGGAACTCAGTCAAACGGTTATCTTTATCTCGCCAGCTTGTCCTCGTGCTTGACCAGCGCAGTTTCACTTTTGCAAACATCTGTTTATATCCCTTGAGAGAAAAAAT
ATCAAGCAACCTGCCTCAAACGACGCTGTTTTGTCCGGTGAGCAAGGTAAGAAACTGTTTTAAACATCTGGGAAGTAGGCGGGCACCAACTTCTGAAGCTTAAGCCAGTCTCTGG
TTGTTTTTAACTCTTTGTTTTCTTAGATCCTATCTCCCACGTAGAGTCTCGTTTCAACCAAAGAACTTAAGTGGCTTTAACGTCCCTGACTCTTTCTGTACCAGGCAGTTTCTGTCACAT
TAGCAGCGTGGTCCCTGGGTGCTTAATGAGGAGATTTGAGTACGGCCGCCCACGCTGGGGTGGGGGGTGGGGGCATAGTTACTTTCAGTCTTTGGCTGTCGGATG
GAGGGGAATCATGACCTCTGGTTTCCCCACAGGACAGCCTCCGATGGATAACTACACAGTGGCCCCGGACGATGAATATGATGTCCTAATCTTAGACGACTACCTGGACAA
CAGTGGGCCGGACCAAGTTCCGGCCCCCGAGTTCCTCTCCCCCCAGCAGGTGCTGCAGTTCTGCTGCGCGGTGTTTGCGGTGGGTCTCTTGGACAACGTGCTGGCGGTGTTTATCT
TGGTGAAATACAAAGGACTCAAGAATCTGGGGAACATCTACTTCCTAAACCTGGCACTTTCAAACCTGTGTTTCCTGCTTCCCCTGCCGTTCTGGGCCCATACTGCAGCACACGGG
GAAAGCCCTGGCAATGG.........

112
CCRL2 gene sequence Part 3: Location of Taqman short CCRL2 primers/probe
Exons 2 and 3 and intron 3. The forward primer does not span the intron, but does span the exon2-exon3 joining region.
………..ATCACTGGAAGCAGGCGTGGGTTAGTGTCCTTATCCGAGGCAGCCTGGAGGACAGCTGGCTAAGAGGTACAGAGAAGTCAAACTTGGGATACCGGGAGAGGGAGAGAT
GAAAACAACTTCTCAATTTCTCTGCGGCTGACAGAAGCTCCTGAGAGAGGCTTTCAGAACTTGATTCCAGCTGGCCCGTGAAAGCTGTGTCTGGACGGGAGAGCCTCAGAGGAAT
AAACAGTGCCTTCTCTGGCTTCTCCGGGTCATGACCAGTCTGTTCAGAAGGAAGTGGTGTTTCTCTGACCCCACTGTTCCCACAGCCCCCTGGATGGTAGATCATGGGGCTGCACC
CTTCCCCACCCTTGGGAACTCAGTCAAACGGTTATCTTTATCTCGCCAGCTTGTCCTCGTGCTTGACCAGCGCAGTTTCACTTTTGCAAACATCTGTTTATATCCCTTGAGAGAAAAA
ATATCAAGCAACCTGCCTCAAACGACGCTGTTTTGTCCGGTGAGCAAG……..GACAGCCTCCGATGGATAACTACACAGTGGCCCCGGACGATGAATATGATGTCC
TAATCTTAGACGACTACCTGGACAACAGTGGGCCGGACCAAGTTCCGGCCCCCGAGTTCCTCTCCCCCCAGCAGGTGCTGCAGTTCTGCTGCGCGGTGTTTGCGGTGGGTC
TCTTGGACAACGTGCTGGCGGTGTTTATCTTGGTGAAATACAAAGGACTCAAGAATCTGGGGAACATCTACTTCCTAAACCTGGCACTTTCAAACCTGTGTTTCCTGCTTCCCCTGC
CGTTCTGGGCCCATACTGCAGCACACGGGGAAAGCCCTGGCAATGG.........
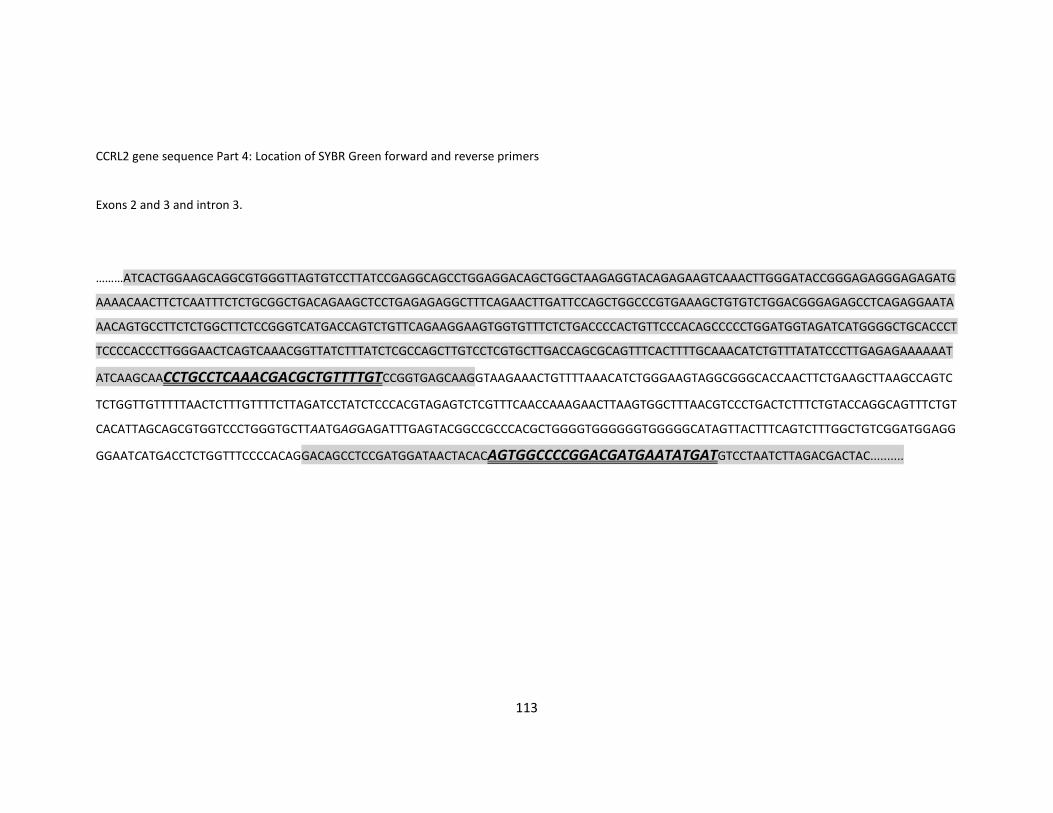
113
CCRL2 gene sequence Part 4: Location of SYBR Green forward and reverse primers
Exons 2 and 3 and intron 3.
………ATCACTGGAAGCAGGCGTGGGTTAGTGTCCTTATCCGAGGCAGCCTGGAGGACAGCTGGCTAAGAGGTACAGAGAAGTCAAACTTGGGATACCGGGAGAGGGAGAGATG
AAAACAACTTCTCAATTTCTCTGCGGCTGACAGAAGCTCCTGAGAGAGGCTTTCAGAACTTGATTCCAGCTGGCCCGTGAAAGCTGTGTCTGGACGGGAGAGCCTCAGAGGAATA
AACAGTGCCTTCTCTGGCTTCTCCGGGTCATGACCAGTCTGTTCAGAAGGAAGTGGTGTTTCTCTGACCCCACTGTTCCCACAGCCCCCTGGATGGTAGATCATGGGGCTGCACCCT
TCCCCACCCTTGGGAACTCAGTCAAACGGTTATCTTTATCTCGCCAGCTTGTCCTCGTGCTTGACCAGCGCAGTTTCACTTTTGCAAACATCTGTTTATATCCCTTGAGAGAAAAAAT
ATCAAGCAACCTGCCTCAAACGACGCTGTTTTGTCCGGTGAGCAAGGTAAGAAACTGTTTTAAACATCTGGGAAGTAGGCGGGCACCAACTTCTGAAGCTTAAGCCAGTC
TCTGGTTGTTTTTAACTCTTTGTTTTCTTAGATCCTATCTCCCACGTAGAGTCTCGTTTCAACCAAAGAACTTAAGTGGCTTTAACGTCCCTGACTCTTTCTGTACCAGGCAGTTTCTGT
CACATTAGCAGCGTGGTCCCTGGGTGCTTAATGAGGAGATTTGAGTACGGCCGCCCACGCTGGGGTGGGGGGTGGGGGCATAGTTACTTTCAGTCTTTGGCTGTCGGATGGAGG
GGAATCATGACCTCTGGTTTCCCCACAGGACAGCCTCCGATGGATAACTACACAGTGGCCCCGGACGATGAATATGATGTCCTAATCTTAGACGACTAC..........

APPENDIX B: Vector pLNCX2 information.
Figure B1. Vector pLNCX2. Vector cut with restriction enzymes HindIII and SalI (red lines) for insertion of
CCRL2 DNA, and subsequently at the SalI and XhoI (green line) sites for confirmation that the DNA had been
inserted. Sequencing used forward and reverse primers (black and clear arrows) to ensure CCRL2 DNA insert
had not any base pair changes during the transformation process. Ampicillin resistance enabled bacteria
which had taken up the plasmid to grow on agar plates containing carbenicillin.

115
APPENDIX C: NCBI Blast2 sequence analysis of clones positive for CCRL2 insert according to 1% agarose
gel analysis.
Insert sequence for HindIII amplified CCRL2. Forward primer for plasmid.
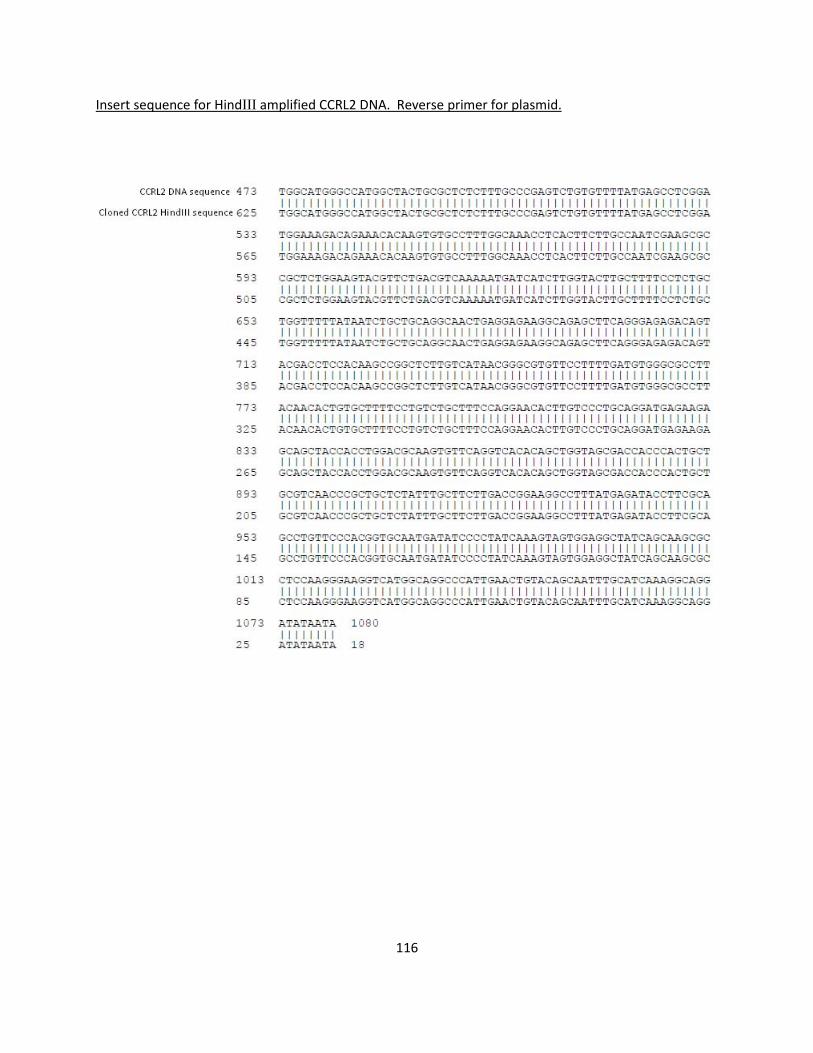
116
Insert sequence for HindIII amplified CCRL2 DNA. Reverse primer for plasmid.
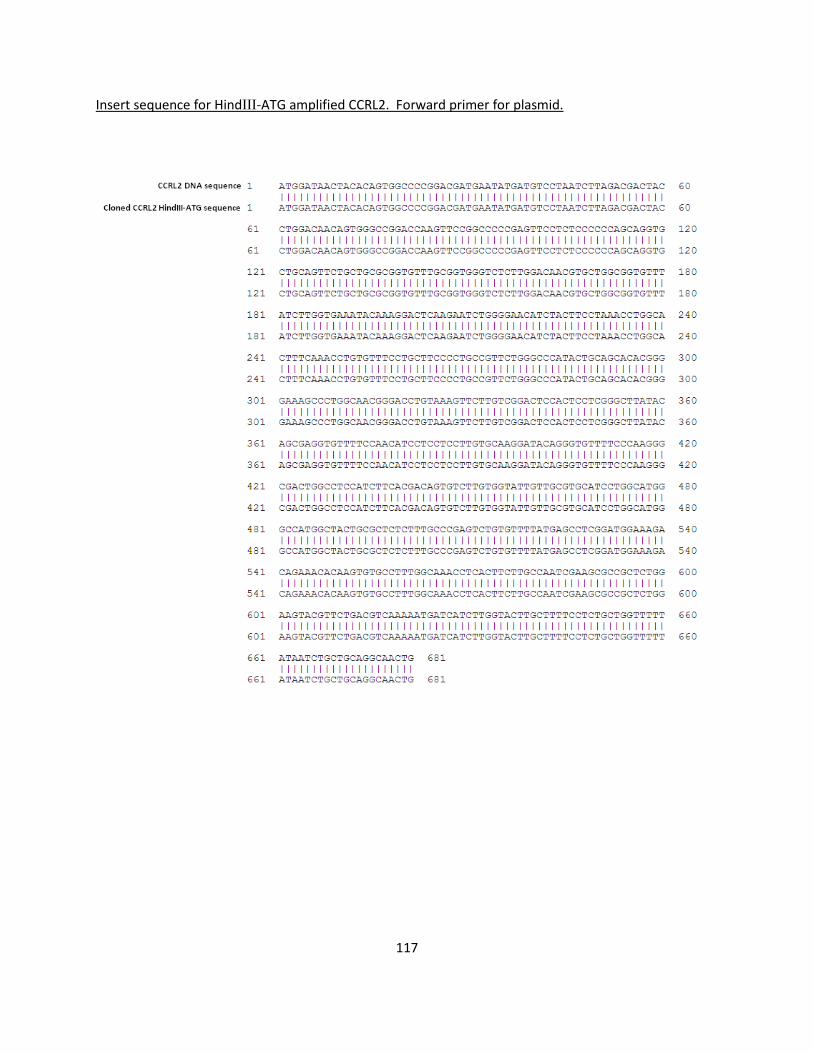
117
Insert sequence for HindIII-ATG amplified CCRL2. Forward primer for plasmid.
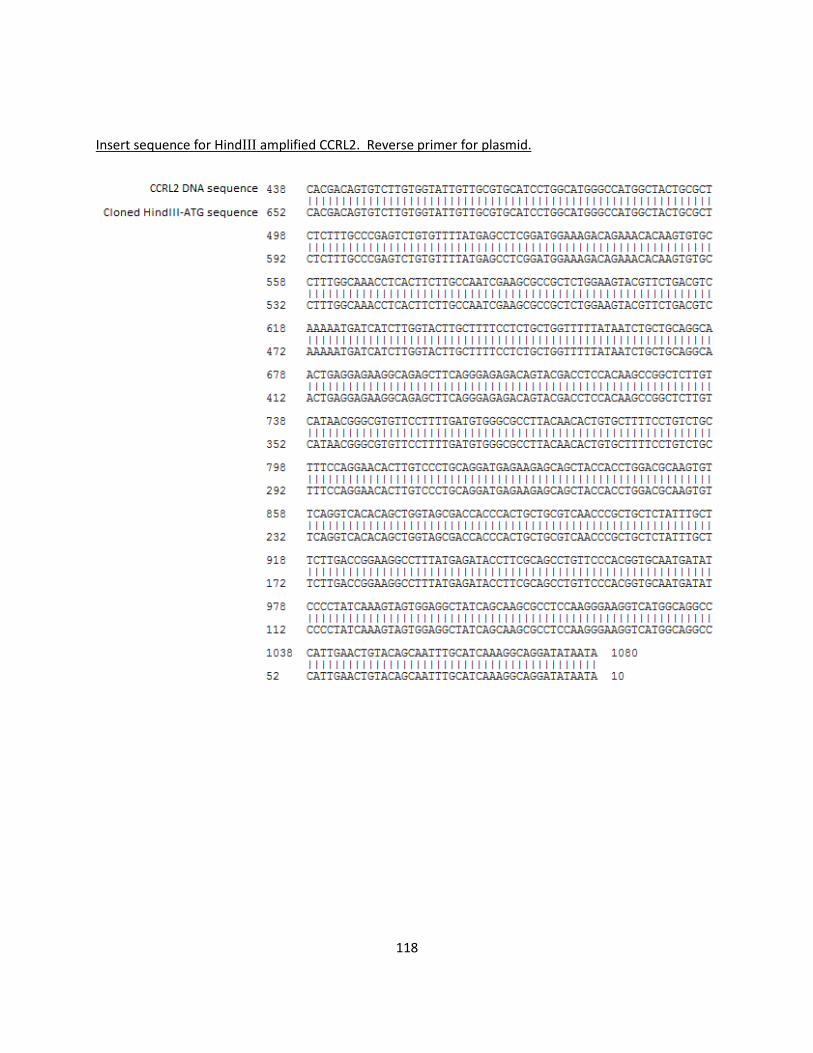
118
Insert sequence for HindIII amplified CCRL2. Reverse primer for plasmid.