the role of cerebrospinal fluid and brain imaging...
TRANSCRIPT
Inconvenzionecon
DOTTORATODIRICERCAINNEUROSCIENZE
CICLOXXIX
THEROLEOFCEREBROSPINALFLUID
ANDBRAINIMAGINGBIOMARKERS
INSTATUSEPILEPTICUS
COORDINATORE:PROF.VITTORIOGALLESE
TUTOR:PROF.STEFANOMELETTI
DOTTORANDO:Dr.ssaGIULIAMONTI

2
At first, there's just darkness and silence.
"Are my eyes open? Hello?"
I can't tell if I'm moving my mouth or if there's even anyone to ask. It's
too dark to see. I blink once, twice, three times. There is a dull
foreboding in the pit of my stomach. That, I recognize. My thoughts
translate only slowly into language, as if emerging from a pot of
molasses. Word by word the questions come: Where am I? Why does
my scalp itch? Where is everyone? Then the world around me comes
gradually into view, beginning as a pinhole, its diameter steadily
expanding. Objects emerge from the murk and sharpen into focus.
I know immediately that I need to get out of here.
FROM THE PREFACE OF “BRAIN ON FIRE” 1

3
ABSTRACT
My field of research concern epilepsy and in particular patients with status epilepticus
(SE), a neurological emergency and a possible life-threating condition due to recurrence
of seizures. In these three years of PhD route, I focus my studies on possible predictors
of neurological and epileptic outcomes in patients with SE, to improve knowledge and
management. We started with prospective collection of all cases of SE in our district
(follow literature criteria of definition and treatment). Then we select those patients
that undergone to simultaneous serum and CSF detection, and neuroradiological brain
investigation.
We divided our research in three categories:
1) Analysis of possible CSF biomarkers of neuronal damage in patients with SE and
possible correlation with timing from SE’s onset and SE evolution (refractory or
responsive SE).
2) Analysis of serum and CSF endogenous molecules (neurosteroids) with a direct
influence in neuronal activity. In animals, Allopregnanolone seems to have an
anticonvulsant effect, due to GABAergic activity close to benzodiazepines’ one; on
the contrary, Pregnanolone sulfate seems to have a proconvulsant activity.
Evaluation of these molecules in healthy subject and in patients with SE could
expand knowledge of neurosteroids panel and address new therapeutic
approaches for SE, especially for resistant/refractory cases.
3) Identification of possible neuro-radiological markers of refractoriness, through
serial brain MRI in cases of new onset refractory SE with early aggressive course
and potential immuno-mediated aetiology (NORSE). Bilateral claustrum
hyperintensity seems to represent a transient radiological markers in these cases
in which unfortunately autoantibodies are not yet discovered.
4
SOMMARIO
Il mio ambito di ricerca ha da sempre riguardato l'epilessia e in particolare i pazienti con
stato epilettico (SE), un'emergenza neurologica con possibili ripercussioni cliniche a
distanza, a causa del ripetersi di crisi epilettiche, potenzialmente dannose. Durante
questi tre anni di dottorato, la mia ricerca è stata incentrata sull’individuazione di
possibili biomarker, in grado di predire l’outcome neurologico ed epilettologico nei
pazienti con SE, al fine di migliorare la conoscenza e la gestione di questa patologia.
Abbiamo iniziato con uno studio prospettico di raccolta di tutti i casi di SE afferenti al
nostro distretto (seguendo i criteri di definizione e trattamento della letteratura). In
seguito, abbiamo selezionato i pazienti sottoposti a simultaneo prelievo di siero e liquor,
oltre alle indagini neuroradiologici cerebrali.
Abbiamo suddiviso la nostra ricerca in tre ambiti:
1) Analisi di possibili biomarcatori liquorali di danno neuronale in pazienti con SE e
possibile correlazione con il timing rispetto all’esordio dello SE e alla sua evoluzione (SE
refrattario o responsivo).
2) Analisi su siero e liquor di molecole endogene (neurosteroidi), con una documentata
influenza diretta sull’attività neuronale. Negli animali, infatti, l’allopregnanolone sembra
avere un effetto anticonvulsivante, mediante un’azione GABAergica, simile alle
benzodiazepine; al contrario, il pregnenolone solfato sembra avere un’attività
proconvulsivante. La valutazione di queste molecole in soggetti sani e in pazienti con SE
potrebbe espandere la conoscenza sui diversi neurosteroidi e rendere disponibili nuovi
approcci terapeutici per lo SE, soprattutto per i casi resistenti / refrattari.
3) Individuazione di possibili marcatori neuro-radiologici di refrattarietà, attraverso lo
studio di risonanza magnetica cerebrale nei casi di SE refrattario di nuova insorgenza
con decorso aggressivo a possibile eziologia immuno-mediata (NORSE). Il riscontro di
transitoria iperdensità bilaterale del claustrum sembra rappresentare un marcatore
radiologico in questi casi, in cui purtroppo un autoanticorpo non è ancora stato
scoperto.

5
ABBREVIATIONS
Aβ 1-42 Beta-amyloid 1-42 SRSE Super-refractory status epilepticus
AED Anti-epileptic drug STESS Status Epilepticus Severity Score
AP Allopregnanolone TMS Transcranial magnetic stimulation
CSF Cerebrospinal fluid t-TAU Total-TAU
CNS Central nervous system VNS Vagal nerve stimulation (VNS)
DBS Deep brain stimulation
ECT Electroconvulsive therapy
EEG Electroencephalography
EMSE Epidemiology-Based Mortality Score in Status Epilepticus
FIRES Febrile infection related epileptic syndrome
GOS Glasgow Outcome Sale
ICU Intensive unit care
IGIV Immuno-globuline
mRS modified Rankin scale
MRI Magnetic resonance imaging
NORSE New onset refractory status epilepticus
NSE neuron-specific enolase
PEX Plasma-exchange
PS Pregnenolone sulfate
p-TAU phosphorylated-TAU
RSE Refractory status epilepticus
SE Status epilepticus

6
TABLE OF CONTENTS
CHAPTER 1. INTRODUCTION ……………………………………………………… page 7
1. STATUS EPILEPTICUS………………………………………………………………………………… 7
1.1 Definition……………………………………………………………………………………………. 7 1.2 Pathophysiology………………………………………………………………………………….. 8 1.3 Classification………………………………………………………………………..................... 10 1.4 Epidemiology…………………………………………………………………………………….. 11 1.5 Treatment…………………………………………………………………………………………. 14 1.6 Prognosis & Outcomes……………………………………………………………………….. 18 1.7 References………………………………………………………………………………………….23
2. BIOMARKERS: definitions and applications………………………………………………….. 29
CHAPTER 2. EXPERIMENTAL……………………………………………………………… 31
2.1 CSF BIOMARKERS OF NEURONAL DAMAGE TO PREDICT OUTCOME IN STATUS
EPILEPTICUS
A. Motivation………………………………………………………………….……….………….……….31 B. Study 1: CSF TAU PROTEINS IN STATUS EPILEPTICUS………….……………….33 C. Discussion and perspectives…………………………………………………………………….56
2.2 SERUM AND CSF NEUROSTEROIDS IN STATUS EPILEPTICUS
A. Motivation………………………………………………………………….……….………….………..58 B. Study 2. DECREASED ALLOPREGNANOLONE LEVELS IN CSF DURING
STATUS EPILEPTICUS………….………….………….………….………….……………...........60 C. Discussion and perspectives……………………………………………………………….…….82
2.3 MRI FINDING AS POTENTIAL BIOMARKER IN STATUS EPILEPTICUS:
THE ROLE OF CLAUSTRUM
A. Motivation………………………………………………………………….……….………….……..…85 B. Study 3. CLAUSTRUM DAMAGE AND REFRACTORY STATUS EPILEPTICUS
FOLLOWING FEBRILE ILLNESS………….………….………….………….………….………88 C. Discussion and perspectives……………………………………………………………………105
CHAPTER 3. DISCUSSION…………………………………………………………………106 3.1 Relevance of potential biomarkers in management of status epilepticus
A. The role of CSF: outcome and implication for therapies………….………….………106 B. The role of MRI: timing and considerations………….………….………….…………….107
3.2 Conclusions………………………………………………………………………………………………….108
7
CHAPTER 1. INTRODUCTION
1. STATUS EPILEPTICUS
1.1 Definition
The Status Epilepticus (SE) is a neurological emergency and a possible life-threating
condition due to recurrence of seizures. Its definition changed many times through the
years. The first formal definition of SE was formulated by Gastaut in 1970 in the first
ILAE Classification of Seizures in which the SE was defined as “a seizure that persists for
a sufficient length of time or is repeated frequently enough to produce a fixed and
enduring epileptic condition”2. In the subsequent ILAE revision (1981), the SE was
defined as “a seizure that persists for a sufficient length of time or is repeated frequently
enough that recovery between attacks does not occur”3.
In the Glossary of Descriptive terms (2001) the SE was defined as “A seizure that shows
no clinical signs of arresting after a duration encompassing the great majority of
seizures of that type in most patients or recurrent seizures without interictal
resumption of baseline central nervous system function” 4.
Since the very first definition, two different conditions appeared as the core of the SE:
the first one is a unique prolonged seizure and the second one is the frequently
repetition of single seizures; both without spontaneous resolution that imply the need
for a pharmacological intervention. These first definitions do not precisely define the
length of time that has to pass since the beginning of this condition to classify it as SE.
Given the lack of a unique and precise definition of SE, different operational definitions
have been used in different textbooks, papers and clinical studies. In the majority of
them a SE is defined as a seizure that lasts for at least 30 minutes.5 This definition is
certainly useful for epidemiological studies but from a pragmatic point of view it seems
important to start a treatment as early as possible, in particular for generalized
convulsive SE (GCSE), to avoid serious consequences. For this reason, Lowenstein et al.6
in 1999 defined GCSE as “...≥5 minutes of continuous seizure or two or more discrete
seizures between which there is incomplete recovery of consciousness”.
Recently (2015), the ILAE Task Force on Classification of Status Epilepticus7 proposed a
new and unique definition of SE as “a condition resulting either from the failure of the

8
mechanisms responsible for seizure termination or from the initiation of mechanisms
which lead to abnormally prolonged seizures (after time point t1). It is a condition that
can have long-term consequences (after time point t2), including neuronal death,
neuronal injury, and alteration of neuronal networks, depending on the type and
duration of seizures”. This definition focuses, for the first time, on the “time dimension”
defining either the time after which a seizure become a SE (t1) and so when a treatment
must be started; or the time after which the prolonged seizure activity start to cause
neuronal damage (t2) defining how aggressively a treatment should be. These time
points are clearly defined for GCSE while for the other forms of SE there is lack of
evidences and they are only indicative.
1.2 Pathophysiology and basis for treatment refractoriness
In animal models of SE, seizures rapidly become self-sustaining and continue long after
the withdrawal of the epileptogenic stimulus, whether chemical or electrical. Ongoing
seizures produces many different changes in the brain thus there is not only a single
mechanism that is responsible for the evolution from a single seizure to a SE, but
different mechanisms that can cause an “excitation-inhibition imbalance”. In the very
first milliseconds to seconds, protein phosphorylation appears. This induces ionic
channels to open or close, neurotransmitters and modulators release, receptors
desensitization. Between seconds and minutes, receptors trafficking starts. The existing
receptors can move from the synaptic membrane into endosomes, or they can be
mobilized from storage sites to the synaptic membrane, and this process drastically
changes excitability by altering the number of inhibitory and excitatory receptors
available in the synaptic cleft. This is particularly important for the synaptic GABAA
receptors that are more and more internalized, while, at the same time, AMPA-R and
NMDA-R move to the synaptic membranes. This important change, on one hand
increases excitability and reduces inhibition, while on the other hand explain the
phenomenon of the increasing benzodiazepine resistance and of the contemporary
increasing anti-NMDA-R antagonist effectiveness in ongoing SE. Moreover, interestingly,
extra-synaptic GABAA receptors are not endocytosed, raising the possibility that
stimulation of those extra-synaptic receptors might be useful in the treatment of long
lasting status epilepticus8.
9
In the minutes to hours’ time range, plastic changes in neuropeptide modulators happen.
These changes are often maladaptive, with increased expression of pro-convulsive
neuropeptides (tachykinins substance P and neurokinin B) and depletion of inhibitory
neuropeptides (dynorphin, galanin, somatostatin and neuropeptide Y) contributing to a
state of raised excitability. Finally, in the hours, days, and weeks after the seizures
beginning, there are long-term changes in gene expression. Many changes in gene
expression are the result of seizure-induced neuronal death, and of the resulting
neuronal re-organization9. All these changes can produce long term brain damage
among which the most commonly recognize alteration acquired after SE is mesial
temporal sclerosis. This has been well seen in many different animal models of SE
(provoked by anti-GABA drugs, glutamatergic drugs, cholinergic drugs and electrical
stimulation) and there are clear human evidences10.
Besides these mechanisms that determine and sustain the SE, GCSE itself develop
systemic effects that need immediate recognition and treatment in the general
management of SE. The very beginning of GCSE is dominated by the body’s attempt to
maintain homeostasis. Blood pressure, central venous pressure, blood glucose increase,
and the patient become tachycardic. Given that, cerebral blood flow, brain glucose and
oxygen utilization increase in the initial phases of a seizure to maintain cerebral
homeostasis. Passing time, the homeostatic mechanisms start to fail. It is generally
theorized that after 30 minutes (but in some situations this could also begin before),
homeostatic failure begins and the patient may need systemic support. Cerebral blood
flow, brain glucose, and parenchymal oxygenation decrease and potentially play a part
in the cell damage associated with GCSE. Respiratory and metabolic acidosis, electrolyte
imbalance (for example, hyperkaliemia), hyperthermia, and rhabdomyolysis may all
occur. All these systemic alterations can potentially worsen the brain damage.
In this view, although the outcome of SE is mainly due to the aetiology of SE itself, the
rapid management of SE and the prevention of its systemic complications can
potentially avoid or at least reduce the morbidity connected to SE.

10
2.3 Classification
The classification of SE has changed many times too. In the first classifications2,3 the only
distinction was between partial and generalized SE.
In 2001 ILAE classification4 more details were added reproducing the seizures
classification. So Generalized Status Epilepticus (GSE) was divided in Generalized tonic-
clonic SE (GCSE), Clonic SE, Absence SE, Tonic SE, Myoclonic SE (MSE); while Focal
Status Epilepticus (FSE) recognized Epilepsia partialis continua, Aura continua, Limbic
SE and Hemiconvulsive SE with hemiparesis.
The 2006 ILAE classification11 outlined nine different possible types of SE: Epilepsia
partialis continua (EPC) of Kojevnikov, Supplementary motor area (SMA) status
epilepticus, Aura continua, Dyscognitive focal (psychomotor, complex partial) status
epilepticus, Tonic–clonic status epilepticus, Absence status epilepticus, Myoclonic status
epilepticus, Tonic status epilepticus, Subtle status epilepticus.
The last classification of SE7 introduces four axis of classification according to which
every episode of SE is defined: 1) Semiology; 2) Etiology; 3) EEG correlates; 4) Age.
1) Semeiology
SE is firstly divided according to the presence or absence of prominent motor
phenomena. If there are prominent motor phenomena these are subsequently classified
according to the type of motor activity seen. If there are subtle motor phenomena or no
motor phenomena at all, the SE is defined as Non Convulsive Status Epilepticus (NCSE)
and it is subdivided according to the level of consciousness (with or without coma).
2) Etiology
The cause of SE is defined “Known or symptomatic” when a certain cause of SE is found.
Relating to the temporal relationship between the beginning of SE and the beginning of
the cause, it is subdivided in “Acute”, “Remote” and “Progressive”. When the cause is not
certain the term “Unknown or Cryptogenic” should be used. In this classification
disappeared the term “Idiopathic” previously used to indicate a SE in the context of
Idiopathic Epilepsy Syndrome because it is theorized that in these syndrome when an
episodes of SE appeared it is always triggered by something, so that it could be classified
as Acute Symptomatic.

11
3) EEG correlates
Since there are no specific patterns for any types of SE and there are no evidence-based
EEG criteria for SE; for each episode of SE the EEG should be classified for:
• Location: generalized (including bilateral synchronous patterns), lateralized, bilateral
independent, multifocal;
• Name of the pattern: Periodic discharges, rhythmic delta activity or spike-and-
wave/sharp-and-wave plus subtypes;
• Morphology: sharpness, number of phases (e.g., triphasic morphology), absolute and
relative amplitude, polarity;
• Time-related features: prevalence, frequency, duration, daily pattern duration and
index, onset (sudden vs. gradual), and dynamics (evolving, fluctuating, or static);
• Modulation: stimulus-induced vs. spontaneous;
• Effect of intervention (medication) on EEG.
4) Age
Five different groups are identified:
• Neonatal (0 to 30 days);
• Infancy (1 month to 2 years);
• Childhood (> 2 to 12 years);
• Adolescence and adulthood (> 12 to 59 years);
• Elderly (≥ 60 years)
1.4 Epidemiology
Incidence of SE
The annual incidence of SE varies significantly across studies, e.g. from 9.9 to 41 per
100.000/year. It has been found higher in the United States studies, e.g. 21 per
100.000/year in the Rochester population12, 41 per 100.000/year (20 per 100.000/year
in whites) in Richmond population13, than in the central Europe studies e.g. 11.6 per
100.000/year in Lugo area14, 10.7 per 100,000/year in Bologna area15, 17.1 per
100.000/year in Marborg in the German study16, 15.5 per 100.000/year in Geneva
population17 and 9.9 per 100.000/year in the Swiss study of Coeyteaux et al.18. The only
exception was the Ferrara study in which an incidence of 27.2 per 100.000/year has

12
been reported19. In Modena population, if we excluded “area nord”, the incidence is
about 15-16 cases per 100.000/year (personal data).
This significant variability in SE incidence is related to both, differences in SE definitions
(in particular the duration criteria) among the studies and different distribution of risk
factors due to the variation of the population composition. Thus, making comparisons
about the incidences of SE among studies appears particularly difficult.
According to the age of onset, the incidence of SE shows a bi-modal, U-shaped age
distribution. The highest incidence of SE occurred in the first year of life. The second
highest incidence of SE occurred in the elderly population, representing the largest
group of patients at risk for developing SE13,14,17,18,19,20. The recurrence rate of SE
showed a similar behaviour. The incidence of SE was found to be grater (till two-times
higher) in males than in females at all ages14,17,18,19. This is probably in part related to a
different males/females distribution of the underlying aetiologies but in part it is
possibly related to a different gender seizures threshold under the influence of the
steroid hormones. An exception to these findings is represented by the higher incidence
in women compared to men previously found in the Bologna’s, Lugo’s and Modena’s
study14,15,22. The aetiologies of SE differs among adults and children too: among children
fever and low levels of AED are the most frequently found13 while among adults, acute
symptomatic aetiology is the most frequently encountered, among which
cerebrovascular diseases are the most frequently reported etiology13,14,15,19. Overall, a
positive history of epilepsy before SE development is found in nearly a half of
patients14,15.
Mortality
The mortality, measured in the majority of the studies as 30-days case fatality and in
some other at hospital discharge, is overall high after an episode of SE21.
It varies from 5% to 46%13,14,15,16,17,18,19,22,23 of SE episodes in the different studies. This
variance is partly related to different inclusion criteria (e.g. inclusion or exclusion of
post- anoxic SE condition related to a known high mortality, inclusion or exclusion of
paediatric population, age group with a lower mortality) and partly related to different
aetiologies composition of the studied population, since mortality is generally high in
acute symptomatic SE due to hypoxia/anoxia or cerebrovascular disease and low in SE
due to low levels/withdrawal of AEDs and withdrawal of alcohol13,15,19,21 and in patients
with remote symptomatic or idiopathic aetiologies.

13
Probably related to the different distribution of aetiologies, mortality appears also to be
related to age: it increases with increasing age, the lowest in children (3% in Richmond
study) and the highest in the elderly (38% in Richmond study)13, 23.
Moreover, mortality appears to be higher in white population when compared to non-
white population13, this finding could be explained by different aetiologies distribution
among different races. Mortality appears to increase increasing the length of SE too19.
In the study of Logroscino et al.12 incidence and mortality rates of SE have been found to
have increased in the period 1935-1984 with a stable case fatality. The increased
incidence and mortality are attributed by the authors to the increased survival over time
of patients after an episode of cardiac arrest and to the improved recognition of
myoclonic SE after cardiac arrest. Excluding that group, the authors found that the
overall case-fatality decreased over time12. In a recent study by Neligan et al.24 on the SE
of England and Wales from 2001 to 2013 a decrease in the SE mortality rate was found
besides a possible increase in the number of SE due to the introduction of the 5-minutes
length of time new definition of SE6 . The authors suggest, as a possible explanation, that
a policy of early and aggressive treatment could have improved the SE prognosis.
Refractoriness to treatment.
Among SE, the Refractory Status Epilepticus (RSE) is a particular critical conditions
characterized by seizures that continues despite the use of a first and a second line
therapies. In literature there are different definitions of this condition some of which are
based on the time elapsed since the beginning of SE some others are based on the
numbers of failed trial of antiepileptic drugs (2 or 3 drugs) and on the need of an
anesthetic therapy. Refractory SE develops in 23% to 43% of patients with SE, with a
mortality rate of 17% to 65%22,25,26,27,28,29,30 . The most frequent aetiologies in RSE are
brain tumours and post-anoxic encephalopathy30.

14
1.5 Treatment
SE could be classified upon the response to treatment. SE is generally divided in four
stages/phases even if it is well known that stages can merge one into the other.
The most used SE therapy approach is based on the four steps way of treatment:
1) Early SE or Stage I
Early SE or Stage I is the very first phase of SE. Benzodiazepines are worldwide
considered by all guidelines the first-line treatment for SE31,32,33. This class of drugs
increases neurons hyper-polarization by binding to GABAA receptor with subsequent
increased chloride flux into the neurons, so enhancing inhibitory neurotransmission.
The most common used benzodiazepines are: Lorazepam, Diazepam, Midazolam (iv
administration is considered off label for SE treatment in Italy) and Clonazepam (iv
route still not available in Italy). Each benzodiazepine could have different routes of
administration (Intravenous [IV], Intramuscular [IM], Rectal, Buccal and Intranasal
[IN]). Intravenous route is the most used and preferred in-hospital route of
administration while the others are quite often preferred in out-of-hospital settings (and
in particular intranasal, buccal Midazolam or rectal Diazepam in children treatment35)
whenever an IV line is not available. A recent Cochrane review34 on anticonvulsant
therapy for SE, found that in a pre-hospital setting, when an IV line is not possible to
find, IM Midazolam appears to be non-inferior to IV Lorazepam for seizures and SE
interruption and as safe as IV Lorazepam. On the other hand, when an IV line is
available, IV Lorazepam carries a lower risk than Diazepam of seizures and SE
continuation. From a pharmacokinetic point of view, Lorazepam is less lipid-soluble
than Diazepam so that, on one hand, its action starts later than Diazepam s action but, on
the other hand, it does not undergo to the rapid redistribution into peripheral tissues as
Diazepam goes and its action persist in time preventing seizures relapse. Thus, IV
Lorazepam has to be the preferred drug in early in-hospital SE treatment35.
2) Established SE or Stage II
If SE is not controlled by benzodiazepines administration, the SE enters the Stage II. In
this stage a therapy with an AED is established. The most important international
guidelines31,32,33 suggest the use, as a first line therapy for this stage, of IV
Phenytoin/Fosphenytoin. The efficacy of Phenytoin is worldwide accepted even if it

15
carries some important risk of systemic side effects (such as cardiac arrhythmias and
hypotension) as well as local side effects related to extravasation (local irritation,
thrombophlebitis, compartment syndrome, and ‘purple glove syndrome’ and tissue
necrosis)35.
Thus, whenever there is any contraindication to use Phenytoin, IV Valproic Acid or
Phenobarbital should be chosen. Valproic Acid enhances the GABA inhibitory action. It
has a broad spectrum of efficacy and it has a very rapid onset of action. It has few risks
of adverse events (mostly nausea, dizziness, thrombocytopenia) and it carries virtually
no cardiovascular and respiratory risks or sedating properties36. The major concern is
about the possibility of developing hyper-ammonaemia and the related hepatic
encephalopathy37,38. A recent review36 shows that Valproic Acid is as effective as
phenytoin in the treatment of established SE with a lower profile of adverse events than
phenytoin. Given the presence of few, small RCTs, international guidelines consider
Valproate as an alternative first line therapy to Phenytoin in the treatment of
established SE.
IV Phenobarbital is found to be at least as effective as a combination of Diazepam and
Phenytoin39 and it was showed not inferior to Lorazepam in the initial treatment of SE40.
Phenobarbital carries a high risk of CNS depression (sedation, hypotension and
respiratory failure) especially if administered after benzodiazepines used and for this
reason its used is nowadays mostly avoided.
There are emerging evidences in favour of the use of new antiepileptic drugs (e.g.
Levetiracetam, Lacosamide) in SE treatment even though randomized, controlled trials
are not still available in the literature and so they have not been introduced in the
international guidelines yet.
Levetiracetam acts with a not completely understood antiepileptic mechanism, based
mostly on SV2A proteins and, to a less extent, on Ca2+ calcium channels and
glutamatergic transmission. It is a broad spectrum drug with action against all types of
seizures with few drug to drug interactions, low adverse events risk profile and without
hepatic metabolism. For all these reasons it is now broadly used in everyday clinical
practice. At present, since the majority of studies on its use in stage II SE are small,
retrospective or prospective and not randomized, Levetiracetam has now a level of
evidence IIA and its use is recommended in GCSE after BDZs failures if there are
contraindications to Phenytoin or Valproic Acid or as the first choice, in FMSE or
NCSE3541,42.

16
At last, it is still ongoing a multicenter prospective randomized double blind study
(ESETT) comparing the administration of Levetiracetam, Phenytoin and Valproic Acid in
SE stage II43,44.
Lacosamide acts as enhancer of slow inactivation of Na+ channels and reduces the
activity of CRMP2. It has few drug to drug interactions, hepatic metabolism and it carries
few side effects (the most worrying of which is III degree AV conduction block, always
reported in patients with known cardiovascular risk factors45,46). To date, there are not
prospective randomized control trials on its used in SE, thus Lacosamide is still placed
as a second line agents for the treatment of established SE after the failure of phenytoin
or valproate or when these drugs are contraindicated35.
3) Refractory Status Epilepticus (RSE) or Stage III
If seizures continue despite the treatment with at least two trials of intravenous
antiepileptic drugs the SE is defined as refractory and the patient is admitted to the
Intensive Care Unit (ICU) and anesthetic therapy is needed. It has been suggested to
titrate the anesthetic therapy to a dose sufficient to maintain a burst-suppression (BS)
EEG pattern (level at which all electrographic seizures are usually controlled). The level
of anesthesia has to be monitored using either repetitive EEG, at least once every 24
hours, or, if there is the possibility, starting an EEG monitoring (c-EEG).
There are no randomized control trials for this stage and guidelines are based upon
retrospective case series. The anesthetics most used as the first line choice in this stage
are Midazolam, Propofol and Thiopental (or Pentobarbital). There are no evidences of
differences related to efficacy and mortality rate among them and the choice is usually
done on the basis of prior experience, usual practices and the profile of the adverse
events for each of them47,48. Moreover, there are Inhalation halogenated anesthetics (in
particular Isoflurane). Since they are still quite rarely used there is currently Oxford
level 4, grade D evidence to use Isoflurane in adults and children RSE35. Up to now they
could not be recommended as a first line therapy in RSE but their administration could
be reserved to the subsequent stages49 .
During this phase it is also recommended to continue AEDs therapy, administered the
support therapy, pay attention to and treat the possible general complications and try to
find and treat the underline cause (because the resolution of the underline cause could
be sometimes, per se, the SE treatment).
17
4) Super-Refractory Status Epilepticus (SRSE)
Super-refractory status epilepticus can be defined as SE that has continued or recurred
despite 24 hours of general anesthesia49. It generally develops in patients with severe
acute brain injuries or as a de novo condition in patients with no history of previous
epilepsy in the context of a suspicious autoimmune encephalopathy (NORSE/FIRES).
This stage represents a “terra incognita” in which any clinical evidence is completely
lacking and treatment is totally based on results from small case series in which patients
at this stage, are frequently treated with multiple drugs and it is extremely difficult to
find out evidence of efficacy for each of them.
The backbone of the therapy in this stage is still anesthetic therapy. It is common clinical
practice to continue it for an initial period of 24 hours and then reverse it in a very slow
way to avoid withdrawal seizures. If the condition persists anesthetic therapy has to be
reestablished and consequently institution/withdrawal patterns should be every 24-48
hours initially and then at 5-7 days-cycles49. Besides anesthesia, antiepileptic drugs
should always be administered throughout the course of anesthesia, so that when the
anesthetic agent is withdrawn there should be an adequate antiepileptic coverage.
Even if there are few evidences an incredible number of different therapies could be
tried at this stage: Ketamine, Lidocaine, Magnesium sulphate, Pyridoxine, Steroids and
Immunotherapy, Ketogenic diet, Hypothermia and in extreme cases respective
neurosurgery. Moreover, as a “last resort” therapy in long lasting super-RSE, there are
therapies for which there are no or scarce evidences. Among them we recognize:
Transcranial magnetic stimulation (TMS), Vagal nerve stimulation (VNS), Deep brain
stimulation (DBS), Electroconvulsive therapy (ECT), CSF drainage and even classical
music 35,48,49,50.

18
1.6 Prognosis
Assess the patient’s prognosis in SE episodes, as early as possible, appears to be of
paramount importance in SE management either to avoid over-treatment and its
harmful possible consequences in patients with probable good outcome (this is
especially true for NCSE without coma in which the further neurologic consequences of
risk related to SE is not completely assessed while they could be at high risk of
worsening due to therapeutic coma and its related complications51) or to avoid under-
detection and under-treatment in patients with a possible bad outcome.
Moreover, among predictors of bad outcomes, the identification of those modifiable
could lead to a possible outcome improvement.
Besides these considerations, predicting refractoriness of SE should be important for the
correct management of SE itself (e.g. using c-EEG monitoring, referral to an ICU).
1.6.1 Predictors of mortality
Different studies have analyzed the issue of mortality predictors in SE:
• Etiology. The majority of studies find that the etiology of SE is the most important
predictor of SE related mortality52. In particular, acute symptomatic etiologies23 and,
among them, the so called “potentially fatal etiologies” (that means the presence of
etiologies that are judge to be related to death independently from the presence of SE if
left untreated) 27,51,53,54 are particularly predictive of mortality after SE. Thus, anoxic
encephalopathy55 and acute CNS infections56 are conditions at high mortality risk.
Even if etiology has been found to determine the mortality risk, it is not the only factor
as it is suggested by the increased mortality risk in patients with cerebrovascular
disease with SE compared to patients with cerebrovascular disease without SE (32% vs
12%13) suggesting an interaction between injured brain and epileptic activity. Moreover,
Rossetti et al.57 found that the development of SE in post-anoxic patients increased the
mortality risk when compared to post-anoxic patients without SE.
• Duration of SE episode. In literature there are some contrasting evidences; some
authors found that, even if with different cut-off time, the longest is the duration of SE
the highest is the mortality56,58,59,60. Nevertheless, given that some patients with very
prolonged SE episodes survive, prolonged SE does not have to be considered hopeless
on the sole basis of the duration61. However, in some other studies, duration of SE was
not found to be a risk factor for 30-days mortality23,29,62,63.

19
• Type of SE. In the Rochester study23 the type of SE was not a risk factor for increased
short-term mortality. This result was confirmed later on by Hui et al.64.
• Gender. Logroscino et al.23 reported a lower risk of death in women than it was in men.
• Time to treatment. Literature data are somehow contrasting: in different studies56,64 a
delay in treatment administration (> 30 min or > 1 hour form SE onset) has been found
to be associated to a poor outcome; while in some other studies54,62 a treatment latency
of > 1 hour or 120 minutes was not found to be associated to a poorer outcome.
• Intra/extra-hospital onset. In some previous studies62,63 the intra-hospital onset was
found to be predictive of mortality and this finding is supposed to be an expression of a
preponderance of acute etiologies among intra-hospital onset SE episodes.
• Adherence to guidelines treatment. Contrasting data in literature: Vignatelli et al.62
reported that treatment non adherence to guidelines was independently related to a
worse outcome while in the study of Rossetti et al.54 this was not predictive for
increased mortality (either over-dosed, under-dosed or wrong drugs sequence).
• Age. Increased age (with different cut-off) is found to be related to increased
mortality23,51,53,54,56,58,65,66.
• Level of consciousness at first clinical evaluation. Coma on the first clinical
presentation reflects the severity of the SE and the underlying etiology. A deeply
reduced level of consciousness (stupor/coma) at first medical presentation before any
treatment, appears to be related to increased mortality61,66.
• Comorbidity. Contrasting data: Alvarez et al.67 and Rossetti et al.54 found that the
presence of comorbities was not independently related to outcome, while Marchi et al.51
found an increased mortality increasing the CCI (Charlson Comorbidity Index) score.
• Hospitalization complications. Hospitalization complications have been found to be
independently associated to mortality after SE68. Among hospital related complications,
the development of infections during SE (and in particular respiratory tracts infections)
is related to and increase the risk of mortality69,73; but the authors suggest that it is not
possible to drawn causality a cause of the presence of possible unmeasured
confounders.
• Response to treatment. It seems to be related to a decrease in the mortality
probability55.
• Need of ventilation and therapeutic coma. The need of intubation was significantly
related to poor outcome56. Marchi et al.51 found that therapeutic coma (without

20
differences among the anesthetics chosen) is independently related to increased risk for
mortality.
• EEG feature. In the study of Jaitly et al.70, the presence of burst suppression (BS), after
status epilepticus ictal discharges (ASIDs) or periodic epileptiform discharges on the
EEG (PEDs) were found to be independently predictive of bad outcome. On the other
side, Garzon et al.71 found that the outcome was not related to any specific patterns
independently from etiology and age. Overall the clinical significance of PLEDs (PEDs) or
persistent evidence of electrographic seizures post SE remains controversial. However,
their prognostic predictive value may be related more to the underlying etiology rather
than to any independent influence52.
1.6.2 Predictors of morbidity
The functional outcome after an episode of SE has been addressed many times. In
literature the level of disability after SE has been measured in different ways (e.g.
Glasgow Outcome Sale, GOS or mRs) comparing the score after SE (at discharge, at 30-
days, at 3 months etc.) to the score before SE.
The usual predictors are the following:
• Etiology. The most relevant independent predictor of a functional decline is the acute
symptomatic etiology53,64,65,67 and in particular the potentially fatal etiologies51,65,67,87.
Among etiologies, SE developed in the context of an epilepsy history was found to be
protective against clinical worsening after the SE episode29, while SE in the context of
lack of previous seizures was independently related to a worse prognosis51. SE without
an evident brain lesion is at low risk of functional deterioration72.
• Type of SE. Generalized form of SE (generalized discharges on EEG) appears to be
predictive of a bad outcome29. Other two subsequent studies64,65 do not find any
association of type of SE with morbidity.
• Age. Advanced age at presentation51 ,65 is a risk factor for increased morbidity.
• Comorbidity. Comorbidities do not seem to be related to increased morbidity in
a study conducted by Alvarez et al.67.
• Intra/extra-hospital SE development. SE present on admission (that means that
develops out of hospital) is found to be related to a better functional outcome when
compared with SE that develops during hospitalization72. The authors attribute that to
the in-hospital development of SE in the context of more pronounced systemic
complications and to a treatment delay.

21
• Level of consciousness at first clinical evaluation. Coma on presentation is considered
to be a risk factor for increased morbidity29,66. Overall, a low level of consciousness at
the SE onset has been clearly and consistently associated with a poor prognosis,
although this probably reflects the underlying etiology, in particular the anoxic
damage52.
• Hospitalization complications. In a study of Sutter et al.69, the development of
infections during SE relates to and increases the risk of worsening of the clinical
conditions after the SE. In a recent study, Semmlack et al.73 found a strong association
between infections development and bad outcome in SE but the authors suggest that,
even after multivariate analysis, it is not possible to drawn causality a cause of the
presence of possible unmeasured confounders. In RSE, the development of sepsis was
found to be independently related to decline of functional outcome74.
Moreover, an increased length of hospitalization53 is considered to be a risk factor for a
bad outcome.
• Duration of SE episode. A study conducted by Drislane et al.29 addresses the role of the
duration of SE in predicting bad outcome. The authors conclude that duration of SE
shorter than 10 hours was associated with a better outcome, but this was not significant
when combining duration, etiology, presentation in coma and type of SE in a
multivariate analysis.
In another study analyzing RSE only, longer duration of SE episode (more than 10 days)
was independently associated with poor functional outcome74.
• Adherence to guidelines treatment. In a study comparing two centers (one large
academic center where adherence to treatment guidelines was higher and a small
peripheral center with a lower adherence to treatment guidelines) with a non-different
SE severity between them, Rossetti et al.75 found a non-statistically different outcome. In
a subsequent study54 they confirmed the previous results (either overdosed, under-
dosed or wrong drugs sequence). However, these results are influenced by different
definitions of treatment appropriateness and different treatment protocols.
• Therapeutic coma. Marchi et al.51 found that therapeutic coma (without differences
among the anesthetics chosen) is independently related to increased risk for worsening
of clinical conditions after SE.

22
1.6.3 Predictors of refractoriness
• Gender. Some studies have reported a female predominance among RSE76,77. In
particular, in a Turkish population of patients with RSE76 the female gender was found
to be an independent predictor for refractoriness. Authors gave a possible explanation
of that, based on a probable hormonal differences in female/male seizures threshold
even if a hospital referral bias could not be completely ruled out in that study.
• Age. Sutter et al.78 found that younger age was associated with RSE development in the
univariate analysis but lost the association in the multivariate analysis. On the contrary,
Agan et al.76 found that patients with RSE were significantly older than patients with
responsive SE. Moreover, some others authors26,28 found that there is no clear
correlation between age and refractoriness development.
• Type of SE. Sutter et al.78 found that NCSE in coma was associated with RSE
development in the univariate analysis but lost the association in the multivariate
analysis. In the study of Mayer et al.25 the development of NCSE or FMSE was found to be
related to the development of refractoriness.
• Etiology. The presence of acute symptomatic etiologies is found to be an independent
predictor of refractoriness development76,78 and among them, the presence of acute
symptomatic encephalitis were found to be particularly predictive of refractoriness
development26,79. SE that develops as a de novo episode in patients without previous
history of epilepsy is at high risk of refractoriness28. Cryptogenic etiology is also found
to be predictive of refractoriness development in a recent study80 while a SE due to low
levels of AEDs in epileptic patients is frequently not-refractory26.
• Level of consciousness at first clinical evaluation. Coma/stupor at the beginning of SE
is found to be predictive of refractoriness28,66,78.
• Hospitalization complications. Sutter et al. 69 and Semmlack et al. 73, found that patients
that have infections during the SE episode have a higher risk of developing RSE
compared to patients without infections, and the probability increases with the numbers
of infections. Nevertheless, the authors suggest that it is not possible to drawn causality
a cause of the presence of possible unmeasured confounders.
• Laboratory findings. Sutter et al.78 found that decreased serum albumin levels (< 35
g/l) at the SE onset is an independent refractoriness predictors. Previous studies have
found association of increase of acute phase proteins (procalcitonin PCT) and
development of refractoriness and mortality and this is supposed to reflect the
interrelations of systemic inflammatory reactions and the epileptic activity81.

23
• Time to treatment. Different studies have found no relation before time to treatment
and the development of refractoriness 23,28,66.
Referring to RSE, predictors of mortality and increased morbidity are:
• Presence of periodic epileptiform discharges on the EEG (PEDs)77
• Development of fever as a complication of mechanical ventilation during
hospitalization79.
• High levels of CSF proteins and white cells (as an expression of increased
inflammation)82.
• Longer duration of mechanical ventilation82.
• Need of a suppression-burst pattern (SB) or isoelectric pattern to control seizures82 .
Among RSE, acute symptomatic etiology appears to be very frequent23, and in particular,
viral CNS encephalitis79. Dealing with treatment of RSE, there are no differences in terms
of mortality and return to baseline conditions between monotherapy and politherapy
with anesthetics agents and between reaching or not EEG burst suppression patterns27.
A presence of history of epilepsy and the SE types do not influence the outcome82. The
advanced age was found to be associated to unfavorable outcome in some studies23,77
whereas this association was not found in some others82.
1.7 References
1 Cahalan Susannah. “Brain on fire: my month of madness”. Hardcover. Nov 13, 2012.
2 Gastaut H. “Clinical and electroencephalographical classification of epileptic seizures”. Epilepsia 1970;11:102–113
3 “Proposal for revised clinical and electroencephalographic classification of epileptic seizures. From the Commission on Classification and Terminology of the International League Against Epilepsy”. Epilepsia 1981;22:489–501
4 Engel J Jr, International League Against Epilepsy (ILAE). “A proposed diagnostic scheme for people with epileptic seizures and with epilepsy: report of the ILAE Task Force on Classification and Terminology”. Epilepsia 2001;42:796–803
5 “Guidelines for epidemiologic studies on epilepsy. Commission on Epidemiology and Prognosis, International League Against Epilepsy”. Epilepsia 1993;34:592–596
6 Lowenstein DH, Bleck T, Macdonald RL. “It’s time to revise the definition of status epilepticus”. Epilepsia 1999;40(1):120–122
7 Trinka E, Cock H, Hesdorffer D, Rossetti A O, Scheffer I E, Shinnar S, Shorvon S, and Lowenstein D H: “A definition and classification of status epilepticus – Report of the ILAE Task Force on Classification of Status Epilepticus”. Epilepsia 2015;56(10):1515–1523

24
8 Goodkin H P, Joshi S, Kozhemyakin M, and Kapu J: “Impact of receptor changes on treatment of status epilepticus”. Epilepsia 2007;48(Suppl 8):14–15
9 Chen J Y, Wasterlain C G: “Status epilepticus: pathophysiology and management in adults”. Lancet Neurol 2006;5: 246–56
10 Scott R C, Surtees R A H, Neville B G R: Status epilepticus: pathophysiology, epidemiology, and outcomes”. Arch Dis Child 1998;79:73–77
11 Engel J Jr. Report of the ILAE classification core group. Epilepsia 2006;47:1558–1568
12 Logroscino G, Hesdorffer D C, Cascino G, Annegers J F, Hauser W A: “Time Trends in Incidence, Mortality, and Case-Fatality after First Episode of Status Epilepticus”. Epilepsia 2001;42(8):1031–1035
13 DeLorenzo R J, Hauser W A, Towne A R, Boggs J G, Pellock J M, Penberthy L, Garnett L, Fortner C A, Ko D: “A prospective, population-based epidemiologic study of status epilepticus in Richmond, Virginia”. Neurology 1996;46: 1029-1035
14 Vignatelli L, Rinaldi R, Galeotti M, de Carolis P, D’Alessandro R: “Epidemiology of status epilepticus in a rural area of northern Italy: a 2-year population-based study”. European Journal of Neurology 2005;12:897–902
15 Vignatelli L, Tonon C, D’Alessandro R, on behalf of the Bologna Group for the Study of Status Epilepticus: “Incidence and Short-term Prognosis of Status Epilepticus in Adults in Bologna, Italy” Epilepsia 2003;44(7):964–968
16 Knake S, Rosenow F, Vescovi M, Oertel W H, Mueller H-H, Wirbatz A, Katsarou N, Hamer H M, for the Status Epilepticus Study Group Hessen (SESGH): “Incidence of Status Epilepticus in Adults in Germany: A Prospective, Population-Based Study”. Epilepsia 2001;42(6):714–718
17 Jallon P, Coeytaux A, Galobardes B, Morabia A: “Incidence and case-fatality rate of status epilepticus in the Canton of Geneva”. The Lancet 1999;353:1496
18 Coeytaux A, Jallon P, Galobardes B, MD, Morabia A: “Incidence of status epilepticus in French-speaking Switzerland (EPISTAR)”. Neurology 2000;55:693–697
19 Govoni V, Fallica E, Monetti V C, Guerzoni F, Faggioli R, Casetta I, Granieri E: “Incidence of Status Epilepticus in Southern Europe: A Population Study in the Health District of Ferrara, Italy”. Eur Neurol 2008;59:120–126
20 Hesdorffer D C, Logroscino G, Cascino G, Annegers J F, Hauser W A: “Incidence of status epilepticus in Rochester, Minnesota, 1965-1984”. Neurology 1998;50:735-741
21 Logroscino G, Hesdorffer D C, Cascino G, Hauser W A, Coeytaux A, Galobardes B, Morabia A, Jallon P: “Mortality after a First Episode of Status Epilepticus in the United States and Europe”. Epilepsia 2005;46(Suppl. 11):46–48
22 Giovannini G, Monti G, Polisi M M, Mirandola L, Marudi A, Pinelli G, Valzania F, Girardis M, Nichelli P F, Meletti S: “A one-year prospective study of refractory status epilepticus in Modena, Italy”. Epilepsy Behav 2015;49:141-145
23 Logroscino G, Hesdorffer D C, Cascino G, Annegers J F, Hauser W A: “Short-Term Mortality After a First Episode of Status Epilepticus”. Epilepsia 1997;38(12):1344-1349

25
24 Neligan A, Walker M C: “Falling status epilepticus mortality rates in England and Wales: 2001-2013?”. Epilepsia 2016;[Epub ahead of print]
25 Mayer S A, Claassen J, Lokin J, Mendelsohn F, BA; Dennis L J, Fitzsimmons B-F: “Refractory Status Epilepticus: Frequency, Risk Factors, and Impact on Outcome”. Arch Neurol. 2002;59(2):205-210
26 Holtkamp M, Othman J, Buchheim K, Meierkord H: “Predictors and prognosis of refractory status epilepticus treated in a neurological intensive care unit”. J Neurol Neurosurg Psychiatry 2005;76:534–539
27 Rossetti A O, Logroscino G, Bromfield E B: “Refractory Status Epilepticus: Effect of Treatment Aggressiveness on Prognosis”. Arch Neurol. 2005;62:1698-1702
28 Novy J, Logroscino G, Rossetti A O: “Refractory status epilepticus: A prospective observational study”. Epilepsia 2010;51(2):251–256
29 Drislane F W, Blum A S, Lopez M R, Gautam S, Schomer D L: “Duration of refractory status epilepticus and outcome: Loss of prognostic utility after several hours”. Epilepsia 2009;50(6):1566–1571
30 Sutter R, Marsch S, Fuhr P, Ruegg S: “Mortality and recovery from refractory status epilepticus in the intensive care unit: A 7-year observational study” Epilepsia 2013;54(3):502–511
31 Meierkord H, Boon P, Engelsen B, Gocke K, Shorvon S, Tinuper P, Holtkamp M: “EFNS guideline on the management of status epilepticus in adults”. European Journal of Neurology 2010;17: 348–355
32 Minicucci F, Muscas G, Perucca E, Capovilla G, Vigevano F, Tinuper P: “Trattamento dello Stato Epilettico nell’adulto: Linee guida della Lega italiana contro l’epilessia”
33 Riviello J J, Ashwal S, Hirtz D, Glauser T, Ballaban-Gil K, Kelley K, Morton L D, Phillips S, Sloan E, Shinnar S: “Practice Parameter: Diagnostic assessment of the child with status epilepticus (an evidence-based review) Report of the Quality Standards Subcommittee of the American Academy of Neurology and the Practice Committee of the Child Neurology Society” Neurology 2006;67:1542–1550
34 Prasad M, Krishnan PR, Sequeira R, Al-Roomi K: “Anticonvulsant therapy for status epilepticus. Cochrane Database of Systematic Reviews 2014”, Issue 9. Art. No.: CD003723
35 Trinka E, Hofler J, Leitinger M, Rohracher A, Kalss G, Brigo F: “Pharmacologic treatment of status epilepticus”. Expert Opinion on Pharmacotherapy 2016;17(4):513-534
36 Trinka E, Hofler J, Zerbs A, Brigo F: “Efficacy and Safety of Intravenous Valproate for Status Epilepticus: A Systematic Review”. CNS Drugs2014;28:623–639
37 Embacher N, Karner E, Wanschitz J, Beer R, Trinka E: “Acute encephalopathy after intravenous administration of valproate in non-convulsive status epilepticus”. European Journal of Neurology 2006;13:e5–e6

26
38 Konig S A, Schenk M, Sick C, Holm E, Heubner C, Weiss A, Konig I, Hehlmann R: “Fatal Liver Failure Associated with Valproate Therapy in a Patient with Friedreich' s Disease: Review of Valproate Hepatotoxicity in Adults”. Epilepsia 1999;40(7):1036-1040
39 Shaner DM, McCurdy SA, Herring MO, Gabor AJ: “Treatment of status epilepticus: a prospective comparison of diazepam and phenytoin versus phenobarbital and optional phenytoin”. Neurology 1988;38:202–7
40 Treiman DM, Meyers PD, Walton NY, Collins JF, Colling C, Rowan AJ, Handforth A, Faught E, Calabrese VP, Uthman BM, Ramsay RE, Mamdani M B: “A comparison of four treatments for generalized convulsive status epilepticus. Veterans affairs status epilepticus cooperative study group”. N Engl J Med 1998;339(12):792–8
41 Berning S, Boesebeck F, van Baalen A, Kellinghaus C: “Intravenous levetiracetam as treatment for status epilepticus”. J Neurol 2009;256:1634–1642
42 Shin H W, Davis R: “Review of levetiracetam as a first line treatment in status epilepticus in the adult patients – what do we know so far?”. Frontiers in Neurology: Epilepsy 2013;4:1-4
43 Cock H R on behalf of the ESETT Group: “Established Status Epilepticus Treatment Trial (ESETT)”. Epilepsia 2011;52(Suppl. 8):50–52
44 Bleck T, Cock H, Chamberlain J, Cloyd J, Connor J, Elm J, Fountain N, Jones E, Lowenstein D, Shinnar S, Silbergleit R, Treiman D, Trinka E, Kapur J: “The Established Status Epilepticus Trial 2013”. Epilepsia 2013;54(Suppl. 6):89–92
45 Garces M, Villanueva V, Mauri J A, Suller A, Garcıa C, Gonzalez F J L, Osorio X R, Pajarın
G F, Piera A, Guillamon E, Santafe C, Castillo A, Giner P, Torres N, Escalza I, del Villar A, de
Casasola M C Gi, Bonet M, Noe E, Olmedilla N: “Factors influencing response to
intravenous lacosamide in emergency situations: LACO-IV study”. Epilepsy Behav
2014;36:144–152
46 Krause L U, Brodowski K O, Kellinghaus C: “Atrioventricular block following
lacosamide intoxication” Epilepsy Behav 2011;20:725–727
47 Claassen J, Hirsch LJ, Emerson RG, Mayer SA: “Treatment of refractory status
epilepticus with pentobarbital, propofol, or midazolam: a systematic review”. Epilepsia.
2002;43(2):146–53
48 Ferlisi M, Shorvon S: “The outcome of therapies in refractory and super-refractory
convulsive status epilepticus and recommendations for therapy”. Brain 2012;135(Pt
8):2314–28
49 Shorvon S, Ferlisi M: “The treatment of super-refractory status epilepticus: a critical
review of available therapies and a clinical treatment protocol”. Brain 2011;134:2802–
2818
50 Shorvon S: “Super-refractory status epilepticus: An approach to therapy in this
difficult clinical situation”. Epilepsia 2011;52(Suppl. 8):53–56
51 Marchi N A, Novy J, Faouzi M, Stähli C, Burnand B, Rossetti A O: “Status Epilepticus:
Impact of Therapeutic Coma on Outcome”. Crit Care Med 2015;43:1003–1009�

27
52 Neligan A, Shorvon S: “Prognostic factors, morbidity and mortality in tonic—clonic status epilepticus: A review”. Epilepsy Res 2011;93:1-10
53 Claassen J, Lokin J K, Fitzsimmons B-F M, Mendelsohn F A, Mayer S A: “Predictors of functional disability and mortality after status epilepticus”. Neurology 2002;58:139–142�
54 Rossetti A O, Alvarez V, Januel J-M, Burnand B: “Treatment deviating from guidelines does not influence status epilepticus prognosis”. J Neurol 2013;260:421–428�
55 Moghaddasi M, Joodat R, Ataei E: “Evaluation of Short-term Mortality of Status Epilepticus and Its Risk Factors”. Journal of Epilepsy Research 2015;5:13-16�
56 Sagduyu A, Tarlaci S, Sirin H: “Generalized tonic-clonic status epilepticus: causes, treatment, complications and predictors of case fatality”. J Neurol 1998;245: 640–646�
57 A.O. Rossetti A O, Logroscino G, Liaudet L, Ruffieux C, V. Ribordy V, Schaller M D, Despland P A, Oddo M: “Status epilepticus: An independent outcome predictor after cerebral anoxia”. Neurology 2007;69:255–260
58 Towne AR, Pellock JM, Ko D, DeLorenzo RJ: “Determinants of mortality in status epilepticus”. Epilepsia 1994 35(1):27-34�
59 Waterhouse E J, Garnett L K, Towne A R, Morton L D, Barnes T, Ko D, DeLorenzo R J: “Prospective Population-Based Study of Intermittent and Continuous Convulsive Status Epilepticus in Richmond, Virginia”. EpiIepsia 1999;40(6):752-758
60 Logroscino G, Hesdorffer DC, Cascino GD, Annegers JF, Bagiella E, Hauser WA: “Long- term mortality after a first episode of status epilepticus”. Neurology 2002;58(4):537-41�
61 Drislane F W, Lopez M R, Blum A S, Schomer D L: “Survivors and nonsurvivors of very prolonged status epilepticus”. Epilepsy Behav 2011;22:342–345
62 Vignatelli L, Rinaldi R, Baldin E, Tinuper P, Michelucci R, Galeotti M, de Carolis P, D’Alessandro R: “Impact of treatment on the short-term prognosis of status epilepticus in two population-based cohorts”. J Neurol 2008;255:197–204�
63 Delanty N, French J A, Labar D R, Pedley T A, Rowan A J: “Status epilepticus arising de novo in hospitalized patients: an analysis of 41 patients”. Seizure 2001;10:116–119
64 Hui A C F, Joynt G M, Li H, Wong K S: “Status epilepticus in Hong Kong Chinese: aetiology, outcome and predictors of death and morbidity”. Seizure 2003;12:478–482
65 Tsai M-H, Chuang Y C, Chang H W, Chang W N, Lai S-L, Huang C-R, Tsai N-W, Wang H-C, Lin Y-J, Lu C-H: “Factors predictive of outcome in patients with de novo status epilepticus”. Q J Med 2009;102:57–62
66 Rossetti A O, Hurwitz S, Logroscino G, Bromfield E B: “Prognosis of status epilepticus: role of aetiology, age, and consciousness impairment at presentation”. Neurol Neurosurg Psych 2006;77:611–615�
67 Alvarez V, Januel J-M, Burnand B, Rossetti A O: “Role of comorbidities in outcome prediction after status epilepticus”. Epilepsia 2012;53(5):e89–e92

28
68 Stelzer F G, Bustamante G de O, Sander H, Sakamoto A C, Fernandes R M F: “Short-term mortality and prognostic factors related to status epilepticus”. Arq Neuropsiquiatr 2015;73(8):670-675�
69 Sutter R, Tschudin-Sutter S, Grize L, Fuhr P, Marc J. M, Widmer A F, Marsch S, Ruegg S: “Associations between infections and clinical outcome parameters in status epilepticus: A retrospective 5-year cohort study”. Epilepsia 2012;53(9):1489–1497
70 Jaitly R, Sgro JA, Towne AR, DeLorenzo RJ: “Prognostic value of EEG monitoring after status epilepticus: a prospective adult study”. J Clin Neurophysiol 1997; 14(4): 326-34
71 Garzon E, Fernandes RM, Sakamoto AC: “Serial EEG during human status epilepticus: evidence for PLED as an ictal pattern”. Neurology 2001;57(7):1175-83
72 Belluzzo M, Furlanis G, Stragapede L: “Predictors of functional disability at hospital discharge after status epilepticus”. Epilepsy Research 2015;110:179—182�
73 Semmlack S, Tschudin-Sutter S, Widmer A F, Valenc M Ruegg S, Marsch S, Sutter R: “Independent impact of infections on the course and outcome of status epilepticus: a 10- year cohort study”. J Neurol 2016, May 3 (Epub ahead of print).
74 Madzar D, Geyer A, Knappe R U, Gollwitzer S, Kuramatsu J B, Gerner S T, Hamer H M, Huttner H B: “Association of seizure duration and outcome in refractory status epilepticus”. J Neurol 2016;263(3):485-491�
75 Rossetti AO, Novy J, Ruffieux C, Olivier P, Foletti GB, Hayoz D, Burnand B, Logroscino G: “Management and prognosis of status epilepticus according to hospital setting: a prospective study”. Swiss Med Wkly 2009;139(49-50):719-23
76 Agan K, Afsar N, Midi I, Us O, Aktan S, Aykut-Bingol C: “Predictors of refractoriness in a Turkish status epilepticus data bank”. Epilepsy Behav 2009;14:651–654�
77 Liberalesso P B N, Garzon E, Yacubian E M T, Sakamoto A C: “Higher mortality rate is associated with advanced age and periodic lateralized epileptiform discharges in patients with refractory status epilepticus”. Arq Neuropsiquiatr 2013;71(3):153-158
78 Sutter R, Kapland P W, Marscha S, Hammela E M, Ruegg S, Ziai W C: “Early predictors of refractory status epilepticus: an international two-center study”. Eur J of Neurol 2015;22:79–85�
79 Vooturi S, Jayalakshmia S, Sahub S, Mohandasa S: “Prognosis and predictors of outcome of refractory generalized convulsive status epilepticus in adults treated in neurointensive care unit”. Clinical Neurol and Neurosurg 2014;126:7–10
80 Jayalakshmi S, Vooturi S, Sahu S, Yada P K, Mohandas S: “Causes and outcomes of new onset status epilepticus and predictors of refractoriness to therapy”. Journal of Clin Neurosc 2016;26:89-94
81 Sutter R, Valença M, Tschudin-Sutter S, Rüegg S, Marsch S: “Procalcitonin and mortality in status epilepticus: an observational cohort study”. Critical Care 2015;19:361
82 Hocker S E, Britton J W, Mandrekar J N, Wijdicks E F M, Rabinstein A A: “Predictors of Outcome in Refractory Status Epilepticus”. JAMA Neurol. 2013;70(1):72-77�

29
2. Biomarkers: definitions and applications
The term “biomarker”, a portmanteau of “biological marker”, refers to a broad
subcategory of medical signs – that is, objective indications of medical state observed
from outside the patient – which can be measured accurately and reproducibly. Medical
signs stand in contrast to medical symptoms, which are limited to those indications of
health or illness perceived by patients themselves. There are several more precise
definitions of biomarkers in the literature, and they overlap considerably. In 1998, the
National Institutes of Health Biomarkers Definitions Working Group defined a
biomarker as “a characteristic that is objectively measured and evaluated as an indicator
of normal biological processes, pathogenic processes, or pharmacologic responses to
therapeutic intervention.” 83
World Health Organization (WHO) has defined a biomarker as “any substance, structure,
or process that can be measured in the body or its products and influence or predict the
incidence of outcome or disease” 84.
An even broader definition takes into account not just incidence and outcome of disease,
but also the effects of treatments, interventions, and even unintended environmental
exposure, such as to chemicals or nutrients. In their report on the validity of biomarkers
in environment risk assessment, the WHO has stated that a true definition of biomarkers
includes “almost any measurement reflecting an interaction between a biological system
and a potential hazard, which may be chemical, physical, or biological. The measured
response may be functional and physiological, biochemical at the cellular level, or a
molecular interaction” 85.
Biomarkers are merely the most objective, quantifiable medical signs modern
laboratory science allows us to measure reproducibly. The use of biomarkers, and in
particular laboratory-measured biomarkers, in clinical research is somewhat newer, and
the best approaches to this practice are still being developed and refined. The key issue
at hand is determining the relationship between any given measurable biomarker and
relevant clinical endpoints86.
FDA defines a biomarker as “Any measurable diagnostic indicator that is used to assess
the risk or presence of disease.” 87
The use of biomarkers in basic and clinical research as well as in clinical practice has
become so commonplace that their presence is considered the primary endpoints in
clinical trial. In the case of specific biomarkers that have been well characterized and

30
repeatedly shown to correctly predict relevant clinical outcomes across a variety of
treatments and populations, this use is entirely justified and appropriate. In many cases,
however, the “validity” of biomarkers is assumed where, in fact, it should continue to be
evaluated and re-evaluated.
References
83 Biomarkers Definition Working Group. Biomarkers and surrogate endpoints: preferred definitions and conceptual framework. Clin Pharmacol Therapeutics. 2001; 69:89–95.
84 WHO International Programme on Chemical Safety. Biomarkers in Risk Assessment: Validity and Validation. 2001.
85 WHO International Programme on Chemical Safety. Biomarkers and Risk Assessment: Concepts and Principles. 1993.
86 Strimbu K and Tavel JA. “What are biomarkers”. Curr Opin HIV AIDS. 2010 November ; 5(6): 463–466. 87 Gutman S, Kessler LG. “The US Food and Drug Administration perspective on cancer biomarker development” Nat Rev Cancer. 2006; 6:565-571.

CHAPTER 2.
2.1
PREDICT OUTCOME IN STATUS EPILEPTICUS
A. M
As illustrate in the paragraphs related to the pathophysiology of the status epilepticus
and in the previous studies about prognosis, refractoriness
worst outcome. Probably, it depends on the direct damage that repeated seizures
on the brain. Unfortunately, nowadays, we can’t predict the evolution of the status at the
early beginning,
clinical features and empirical scales
outcome,
Few studies
controversial results.
Tau protein is located in neurons of central nervous system (CNS) and is available and
measurable in CSF. In particular high values of tau protein in CSF are considered as
index of axonal and neuronal damage in several disease.
CHAPTER 2.
2.1 CSF BIOMARKERS OF NEURONAL DAMAGE TO
PREDICT OUTCOME IN STATUS EPILEPTICUS
A. Motivation
As illustrate in the paragraphs related to the pathophysiology of the status epilepticus
and in the previous studies about prognosis, refractoriness
worst outcome. Probably, it depends on the direct damage that repeated seizures
on the brain. Unfortunately, nowadays, we can’t predict the evolution of the status at the
early beginning,
clinical features and empirical scales
outcome,
Few studies
controversial results.
Tau protein is located in neurons of central nervous system (CNS) and is available and
measurable in CSF. In particular high values of tau protein in CSF are considered as
index of axonal and neuronal damage in several disease.
CHAPTER 2.
CSF BIOMARKERS OF NEURONAL DAMAGE TO
PREDICT OUTCOME IN STATUS EPILEPTICUS
otivation
As illustrate in the paragraphs related to the pathophysiology of the status epilepticus
and in the previous studies about prognosis, refractoriness
worst outcome. Probably, it depends on the direct damage that repeated seizures
on the brain. Unfortunately, nowadays, we can’t predict the evolution of the status at the
early beginning,
clinical features and empirical scales
outcome, but reliable biomarkers
Few studies
controversial results.
Tau protein is located in neurons of central nervous system (CNS) and is available and
measurable in CSF. In particular high values of tau protein in CSF are considered as
index of axonal and neuronal damage in several disease.
CHAPTER 2.
CSF BIOMARKERS OF NEURONAL DAMAGE TO
PREDICT OUTCOME IN STATUS EPILEPTICUS
otivation
As illustrate in the paragraphs related to the pathophysiology of the status epilepticus
and in the previous studies about prognosis, refractoriness
worst outcome. Probably, it depends on the direct damage that repeated seizures
on the brain. Unfortunately, nowadays, we can’t predict the evolution of the status at the
early beginning,
clinical features and empirical scales
but reliable biomarkers
Few studies evaluate
controversial results.
Tau protein is located in neurons of central nervous system (CNS) and is available and
measurable in CSF. In particular high values of tau protein in CSF are considered as
index of axonal and neuronal damage in several disease.
CHAPTER 2.
CSF BIOMARKERS OF NEURONAL DAMAGE TO
PREDICT OUTCOME IN STATUS EPILEPTICUS
otivation
As illustrate in the paragraphs related to the pathophysiology of the status epilepticus
and in the previous studies about prognosis, refractoriness
worst outcome. Probably, it depends on the direct damage that repeated seizures
on the brain. Unfortunately, nowadays, we can’t predict the evolution of the status at the
early beginning, neither we can predict a neurological impairment. We can use
clinical features and empirical scales
but reliable biomarkers
evaluate
controversial results.
Tau protein is located in neurons of central nervous system (CNS) and is available and
measurable in CSF. In particular high values of tau protein in CSF are considered as
index of axonal and neuronal damage in several disease.
CHAPTER 2.
CSF BIOMARKERS OF NEURONAL DAMAGE TO
PREDICT OUTCOME IN STATUS EPILEPTICUS
As illustrate in the paragraphs related to the pathophysiology of the status epilepticus
and in the previous studies about prognosis, refractoriness
worst outcome. Probably, it depends on the direct damage that repeated seizures
on the brain. Unfortunately, nowadays, we can’t predict the evolution of the status at the
neither we can predict a neurological impairment. We can use
clinical features and empirical scales
but reliable biomarkers
evaluate some mol
controversial results.
Tau protein is located in neurons of central nervous system (CNS) and is available and
measurable in CSF. In particular high values of tau protein in CSF are considered as
index of axonal and neuronal damage in several disease.
CHAPTER 2.
CSF BIOMARKERS OF NEURONAL DAMAGE TO
PREDICT OUTCOME IN STATUS EPILEPTICUS
As illustrate in the paragraphs related to the pathophysiology of the status epilepticus
and in the previous studies about prognosis, refractoriness
worst outcome. Probably, it depends on the direct damage that repeated seizures
on the brain. Unfortunately, nowadays, we can’t predict the evolution of the status at the
neither we can predict a neurological impairment. We can use
clinical features and empirical scales
but reliable biomarkers
some mol
Tau protein is located in neurons of central nervous system (CNS) and is available and
measurable in CSF. In particular high values of tau protein in CSF are considered as
index of axonal and neuronal damage in several disease.
EXPERIMENTAL
CSF BIOMARKERS OF NEURONAL DAMAGE TO
PREDICT OUTCOME IN STATUS EPILEPTICUS
As illustrate in the paragraphs related to the pathophysiology of the status epilepticus
and in the previous studies about prognosis, refractoriness
worst outcome. Probably, it depends on the direct damage that repeated seizures
on the brain. Unfortunately, nowadays, we can’t predict the evolution of the status at the
neither we can predict a neurological impairment. We can use
clinical features and empirical scales
but reliable biomarkers
some molecules of neuronal damage (NSE
Tau protein is located in neurons of central nervous system (CNS) and is available and
measurable in CSF. In particular high values of tau protein in CSF are considered as
index of axonal and neuronal damage in several disease.
EXPERIMENTAL
CSF BIOMARKERS OF NEURONAL DAMAGE TO
PREDICT OUTCOME IN STATUS EPILEPTICUS
As illustrate in the paragraphs related to the pathophysiology of the status epilepticus
and in the previous studies about prognosis, refractoriness
worst outcome. Probably, it depends on the direct damage that repeated seizures
on the brain. Unfortunately, nowadays, we can’t predict the evolution of the status at the
neither we can predict a neurological impairment. We can use
clinical features and empirical scales
but reliable biomarkers of brain damage induced directly by SE
ecules of neuronal damage (NSE
Tau protein is located in neurons of central nervous system (CNS) and is available and
measurable in CSF. In particular high values of tau protein in CSF are considered as
index of axonal and neuronal damage in several disease.
EXPERIMENTAL
CSF BIOMARKERS OF NEURONAL DAMAGE TO
PREDICT OUTCOME IN STATUS EPILEPTICUS
As illustrate in the paragraphs related to the pathophysiology of the status epilepticus
and in the previous studies about prognosis, refractoriness
worst outcome. Probably, it depends on the direct damage that repeated seizures
on the brain. Unfortunately, nowadays, we can’t predict the evolution of the status at the
neither we can predict a neurological impairment. We can use
clinical features and empirical scales
of brain damage induced directly by SE
ecules of neuronal damage (NSE
Tau protein is located in neurons of central nervous system (CNS) and is available and
measurable in CSF. In particular high values of tau protein in CSF are considered as
index of axonal and neuronal damage in several disease.
EXPERIMENTAL
CSF BIOMARKERS OF NEURONAL DAMAGE TO
PREDICT OUTCOME IN STATUS EPILEPTICUS
As illustrate in the paragraphs related to the pathophysiology of the status epilepticus
and in the previous studies about prognosis, refractoriness
worst outcome. Probably, it depends on the direct damage that repeated seizures
on the brain. Unfortunately, nowadays, we can’t predict the evolution of the status at the
neither we can predict a neurological impairment. We can use
clinical features and empirical scales, in ex. STESS
of brain damage induced directly by SE
ecules of neuronal damage (NSE
Tau protein is located in neurons of central nervous system (CNS) and is available and
measurable in CSF. In particular high values of tau protein in CSF are considered as
index of axonal and neuronal damage in several disease.
31
EXPERIMENTAL
CSF BIOMARKERS OF NEURONAL DAMAGE TO
PREDICT OUTCOME IN STATUS EPILEPTICUS
As illustrate in the paragraphs related to the pathophysiology of the status epilepticus
and in the previous studies about prognosis, refractoriness
worst outcome. Probably, it depends on the direct damage that repeated seizures
on the brain. Unfortunately, nowadays, we can’t predict the evolution of the status at the
neither we can predict a neurological impairment. We can use
, in ex. STESS
of brain damage induced directly by SE
ecules of neuronal damage (NSE
Tau protein is located in neurons of central nervous system (CNS) and is available and
measurable in CSF. In particular high values of tau protein in CSF are considered as
index of axonal and neuronal damage in several disease.
EXPERIMENTAL
CSF BIOMARKERS OF NEURONAL DAMAGE TO
PREDICT OUTCOME IN STATUS EPILEPTICUS
As illustrate in the paragraphs related to the pathophysiology of the status epilepticus
and in the previous studies about prognosis, refractoriness
worst outcome. Probably, it depends on the direct damage that repeated seizures
on the brain. Unfortunately, nowadays, we can’t predict the evolution of the status at the
neither we can predict a neurological impairment. We can use
, in ex. STESS 88
of brain damage induced directly by SE
ecules of neuronal damage (NSE
Tau protein is located in neurons of central nervous system (CNS) and is available and
measurable in CSF. In particular high values of tau protein in CSF are considered as
index of axonal and neuronal damage in several disease.
EXPERIMENTAL
CSF BIOMARKERS OF NEURONAL DAMAGE TO
PREDICT OUTCOME IN STATUS EPILEPTICUS
As illustrate in the paragraphs related to the pathophysiology of the status epilepticus
and in the previous studies about prognosis, refractoriness
worst outcome. Probably, it depends on the direct damage that repeated seizures
on the brain. Unfortunately, nowadays, we can’t predict the evolution of the status at the
neither we can predict a neurological impairment. We can use
88 and EMSE
of brain damage induced directly by SE
ecules of neuronal damage (NSE
Tau protein is located in neurons of central nervous system (CNS) and is available and
measurable in CSF. In particular high values of tau protein in CSF are considered as
index of axonal and neuronal damage in several disease.
EXPERIMENTAL
CSF BIOMARKERS OF NEURONAL DAMAGE TO
PREDICT OUTCOME IN STATUS EPILEPTICUS
As illustrate in the paragraphs related to the pathophysiology of the status epilepticus
and in the previous studies about prognosis, refractoriness
worst outcome. Probably, it depends on the direct damage that repeated seizures
on the brain. Unfortunately, nowadays, we can’t predict the evolution of the status at the
neither we can predict a neurological impairment. We can use
and EMSE
of brain damage induced directly by SE
ecules of neuronal damage (NSE
Tau protein is located in neurons of central nervous system (CNS) and is available and
measurable in CSF. In particular high values of tau protein in CSF are considered as
EXPERIMENTAL
CSF BIOMARKERS OF NEURONAL DAMAGE TO
PREDICT OUTCOME IN STATUS EPILEPTICUS
As illustrate in the paragraphs related to the pathophysiology of the status epilepticus
and in the previous studies about prognosis, refractoriness of SE
worst outcome. Probably, it depends on the direct damage that repeated seizures
on the brain. Unfortunately, nowadays, we can’t predict the evolution of the status at the
neither we can predict a neurological impairment. We can use
and EMSE
of brain damage induced directly by SE
ecules of neuronal damage (NSE
Tau protein is located in neurons of central nervous system (CNS) and is available and
measurable in CSF. In particular high values of tau protein in CSF are considered as
EXPERIMENTAL
CSF BIOMARKERS OF NEURONAL DAMAGE TO
PREDICT OUTCOME IN STATUS EPILEPTICUS
As illustrate in the paragraphs related to the pathophysiology of the status epilepticus
of SE
worst outcome. Probably, it depends on the direct damage that repeated seizures
on the brain. Unfortunately, nowadays, we can’t predict the evolution of the status at the
neither we can predict a neurological impairment. We can use
and EMSE
of brain damage induced directly by SE
ecules of neuronal damage (NSE
Tau protein is located in neurons of central nervous system (CNS) and is available and
measurable in CSF. In particular high values of tau protein in CSF are considered as
CSF BIOMARKERS OF NEURONAL DAMAGE TO
PREDICT OUTCOME IN STATUS EPILEPTICUS
As illustrate in the paragraphs related to the pathophysiology of the status epilepticus
of SE seems to determine a
worst outcome. Probably, it depends on the direct damage that repeated seizures
on the brain. Unfortunately, nowadays, we can’t predict the evolution of the status at the
neither we can predict a neurological impairment. We can use
and EMSE
of brain damage induced directly by SE
ecules of neuronal damage (NSE an
Tau protein is located in neurons of central nervous system (CNS) and is available and
measurable in CSF. In particular high values of tau protein in CSF are considered as
CSF BIOMARKERS OF NEURONAL DAMAGE TO
PREDICT OUTCOME IN STATUS EPILEPTICUS
As illustrate in the paragraphs related to the pathophysiology of the status epilepticus
seems to determine a
worst outcome. Probably, it depends on the direct damage that repeated seizures
on the brain. Unfortunately, nowadays, we can’t predict the evolution of the status at the
neither we can predict a neurological impairment. We can use
and EMSE 89
of brain damage induced directly by SE
and S100 protein)
Tau protein is located in neurons of central nervous system (CNS) and is available and
measurable in CSF. In particular high values of tau protein in CSF are considered as
CSF BIOMARKERS OF NEURONAL DAMAGE TO
PREDICT OUTCOME IN STATUS EPILEPTICUS
As illustrate in the paragraphs related to the pathophysiology of the status epilepticus
seems to determine a
worst outcome. Probably, it depends on the direct damage that repeated seizures
on the brain. Unfortunately, nowadays, we can’t predict the evolution of the status at the
neither we can predict a neurological impairment. We can use
89, as a m
of brain damage induced directly by SE
d S100 protein)
Tau protein is located in neurons of central nervous system (CNS) and is available and
measurable in CSF. In particular high values of tau protein in CSF are considered as
CSF BIOMARKERS OF NEURONAL DAMAGE TO
PREDICT OUTCOME IN STATUS EPILEPTICUS
As illustrate in the paragraphs related to the pathophysiology of the status epilepticus
seems to determine a
worst outcome. Probably, it depends on the direct damage that repeated seizures
on the brain. Unfortunately, nowadays, we can’t predict the evolution of the status at the
neither we can predict a neurological impairment. We can use
as a m
of brain damage induced directly by SE are lacking
d S100 protein)
Tau protein is located in neurons of central nervous system (CNS) and is available and
measurable in CSF. In particular high values of tau protein in CSF are considered as
CSF BIOMARKERS OF NEURONAL DAMAGE TO
PREDICT OUTCOME IN STATUS EPILEPTICUS
As illustrate in the paragraphs related to the pathophysiology of the status epilepticus
seems to determine a
worst outcome. Probably, it depends on the direct damage that repeated seizures
on the brain. Unfortunately, nowadays, we can’t predict the evolution of the status at the
neither we can predict a neurological impairment. We can use
as a measure of
are lacking
d S100 protein)
Tau protein is located in neurons of central nervous system (CNS) and is available and
measurable in CSF. In particular high values of tau protein in CSF are considered as
CSF BIOMARKERS OF NEURONAL DAMAGE TO
As illustrate in the paragraphs related to the pathophysiology of the status epilepticus
seems to determine a
worst outcome. Probably, it depends on the direct damage that repeated seizures caused
on the brain. Unfortunately, nowadays, we can’t predict the evolution of the status at the
neither we can predict a neurological impairment. We can use
easure of
are lacking
d S100 protein)
Tau protein is located in neurons of central nervous system (CNS) and is available and
measurable in CSF. In particular high values of tau protein in CSF are considered as
CSF BIOMARKERS OF NEURONAL DAMAGE TO
As illustrate in the paragraphs related to the pathophysiology of the status epilepticus
seems to determine a
caused
on the brain. Unfortunately, nowadays, we can’t predict the evolution of the status at the
neither we can predict a neurological impairment. We can use only
easure of
are lacking
d S100 protein) with
Tau protein is located in neurons of central nervous system (CNS) and is available and
measurable in CSF. In particular high values of tau protein in CSF are considered as
CSF BIOMARKERS OF NEURONAL DAMAGE TO
As illustrate in the paragraphs related to the pathophysiology of the status epilepticus
seems to determine a
caused
on the brain. Unfortunately, nowadays, we can’t predict the evolution of the status at the
only
easure of
are lacking.
with
Tau protein is located in neurons of central nervous system (CNS) and is available and
measurable in CSF. In particular high values of tau protein in CSF are considered as
CSF BIOMARKERS OF NEURONAL DAMAGE TO
As illustrate in the paragraphs related to the pathophysiology of the status epilepticus
seems to determine a
caused
on the brain. Unfortunately, nowadays, we can’t predict the evolution of the status at the
only
easure of
.
with
Tau protein is located in neurons of central nervous system (CNS) and is available and
measurable in CSF. In particular high values of tau protein in CSF are considered as

32
Our laboratory uses t-tau protein, p-tau protein and Aβ 1-42 CSF dosage to differentiate
the subtypes of degenerative cognitive impairment. In literature, no study has
specifically evaluated the CSF levels of tau proteins in patients with SE, to predict
neurological and epileptic outcomes. We consider very useful to have biomarker of SE
prognosis, available with less invasive procedure and relatively low costs for kit test,
since the first stage of the disease. We supposed that RSE and SRSE cases had the
highest risk of neuronal damage and that is probably time related. Obviously we
excluded all cases with acute brain damage such as acute head trauma, viral
encephalitis, and acute stroke in which tau protein could increase regardless of status.
Interesting, we tried also to evaluate the role of anaesthetic drugs on the brain; several
evidence support the role of neuro-protection due to burst suppression, on the other
side some studies consider a possible role in brain damage, especially for propofol.
References
88 Rossetti A O, Logroscino G, Milligan T A, Michaelides C, Ruffieux C, Bromfield E B: “Status Epilepticus Severity Score (STESS): A tool to orient early treatment strategy”. J Neurol 2008;255:1561–1566.
89 Leitinger M, Holler Y, Kalss G, Rohracher A, Novak H F, Hofler J, Dobesberger J, Kuchukhidze G, Trinka E: “Epidemiology-Based Mortality Score in Status Epilepticus (EMSE)”. Neurocrit Care 2015;22:273–282.

33
B: Study 1. CSF TAU PROTEINS IN STATUS EPILEPTICUS
Published on Epilepsy & Behaviour 49 (2015) 150-154
Giulia Monti1,2*, Manuela Tondelli1,2*, Giada Giovannini1,2, Roberta Bedin2, Paolo F
Nichelli1,2, Tommaso Trenti3, Stefano Meletti1,2, Annalisa Chiari2
1 Department of Biomedical, Metabolic, and Neural Science, University of Modena and Reggio Emilia, Modena, Italy. 2 Neurology Unit, NOCSAE Hospital, ASL Modena, Italy.� 3 Clinical Pathology-Toxicology, NOCSAE Hospital, ASL Modena, Italy
*Equal contribution
Abstract
Tau protein is a phosphorilated microtubule-associated protein, principally localized at
neuronal and axonal level in central nervous system (CNS). Tau levels in the
cerebrospinal fluid (CSF) are considered to index both axonal and neuronal damage. To
date, however, no study has specifically evaluated the CSF levels of tau proteins in
patients with status epilepticus (SE). We evaluated the levels of these established
biomarkers of neuronal damage in patients with SE who received a lumbar puncture
during SE between 2007 and 2014. SE cases due to acute structural brain damage,
including CNS infection, as aetiology were excluded. Clinical, biological, therapeutic, and
follow- up data were collected. Group comparison between patients stratified according
to SE response to antiepileptic drugs (AED), disability, and epilepsy outcomes were
performed. Twenty-eight patients were considered for the analyses (mean age 56
years): 14 patients had abnormally high CSF t-tau level, six patients had abnormally high
CSF p-tau level, and only three patients had abnormally low Aβ 1-42 level. CSF t-tau
value was higher in patients who developed a refractory SE compared to patients with
seizures controlled by AED. CSF t-tau values were positively correlated with SE duration
and were higher in patients treated with propofol anaesthesia compared to patients that
did not received this treatment. Patients with higher CSF t-tau had higher risk of
developing disability (OR=32.5, p=0.004) and chronic epilepsy (OR=12; p=0.016) in
comparison with patients with lower CSF t-tau level. Our results suggest that CSF t-tau

34
level might be proposed as biomarker of SE severity and prognosis. Prospective studies
are needed to evaluate the effects of propofol on tau pathology in this setting.
Keywords: status epilepticus; tau; refractory status epilepticus; epilepsy; seizures;
biomarkers.
1. Introduction
According to the WHO Dictionary of Epilepsy status epilepticus (SE) occurs “when a
seizure persists for a sufficient length of time or is repeated frequently enough to
produce a fixed or enduring epileptic condition” [1]. Clinical and experimental studies
have shown that SE may induce neuronal damage [2, 3] and is associated with high
mortality and poor neurological outcome [4, 5]. The prediction of outcome can be
difficult, and is mainly based on clinical features and aetiology [6-8]. To date no reliable
biomarker exists to predict SE outcomes. Markers of brain injury, such as neuron-
specific enolase (NSE) or S-100b protein (S-100), have been measured in patients with
seizures or SE with controversial findings [9-12]. Increased serum and CSF levels of NSE
have been reported in a subset of epileptic patients with SE [13].
Tau protein is a phosphorilated microtubule-associated protein, principally localized at
neuronal and axonal level in central nervous system (CNS). High total-tau (t-tau) and
phosphorilated-tau (p-tau) CSF levels are considered to index both axonal and neuronal
damage and are currently used in clinical research for early Alzheimer’s disease
diagnosis together with the determination of amyloid precursor protein cleavage
peptides such as A-beta 1-42 (Aβ 1-42) [14, 15]. Increased levels of CSF tau proteins are
also found in patients with various neurological diseases, such as traumatic brain injury,
acute ischemic stroke, viral encephalitis, Creutzfeldt-Jacob disease, suggesting that tau
CSF levels reflect the extent of axonal damage and neuronal degeneration [16-20].
In relation to seizures and epilepsy, only few studies have evaluated tau proteins as
potential biomarkers of seizures-related neuronal damage [21, 22]. A recent study
evaluated t-tau, p-tau and Aβ 1-42 proteins in groups of patients with different seizures
type and aetiologies founding no evidence of increased t-tau and p-tau levels compared
with control groups [23].
35
To date, however, no study has specifically evaluated the CSF levels of tau proteins in
patients with SE, and the potential prognostic utility of these biomarkers in this clinical
context.
2. Material And Methods
A retrospective observational study was performed between 2007 and 2014 at the
NOCSAE Hospital, Modena – Italy, including all patients admitted with SE who received a
lumbar puncture during SE in the suspect of a CNS infection.�SE was defined as ongoing
seizures, or repetitive seizures without intercurrent normalization of consciousness or
return to baseline for at least 30 min [24].
In order to avoid interpretation bias in biomarkers analyses due to causes of neuronal
injury other than seizures the following exclusion criteria were considered: (i) evidence
(by head CT or MRI) of an acute brain insult as aetiology of SE; (ii) evidence of viral or
bacterial CNS infection; (iii) evidence of cognitive decline in the context of a possible
neurodegenerative disorder; (iv) evidence of a progressive CNS disorder (i.e. brain
tumour). According to the ILAE criteria for the clinical classification of SE we excluded
cases due to an “acute symptomatic” as well as “progressive” CNS disease [25].
The final study was conducted on a patients’ cohort of 28 subjects fulfilling our
inclusion/exclusion criteria for whom information about demographic data, clinical
features, diagnostic findings, therapeutic interventions, and clinical outcomes were
acquired (Supplementary Table 1). All these patients were examined for bacterial and
viral infections including: HSV 1 and 2, varicella-zoster virus, HHV 6, cytomegalovirus,
Epstein–Barr virus, rubella, parvovirus B19, enterovirus, HIV, and mumps. All virological
studies were performed using DNA polymerase chain reaction (PCR). Each patient also
had a head CT and/or brain MRI at hospital admission or < 24 hour to exclude an acute
brain damage as causative event of SE. All included subjects had a EEG monitoring of
variable duration confirming SE diagnosis. EEG was defined as positive if showing an
ictal or periodic pattern or, if performed postictally, showing focal slowing (with or
without interictal discharges) unexplained by other causes, or generalized slowing with
interictal epileptiform activity [8].
36
CSF samples were acquired from a few hours after admission to a maximum of 20 days
(median of 72 hours)(Supplementary Table 2). Standard CSF chemical analysis was
performed to determine blood cell count and total protein concentration values.
Isoelectro-focusing (IEF) on agarose gel support was performed to check the presence of
oligoclonal IgG bands (OB). For CSF Aβ 1-42, t-tau, and p-tau181 dosage, analysis was
performed on CSF samples stored at -80°C in polypropylene storage tubes. CSF Aβ 1-42,
t-tau, and p-tau181 were measured with the ELISA method following manufacturer
instructions (Innogenetics, Gent, Belgium). All tests were performed in the same
laboratory by the same biologist in accordance with recent guidelines [26]. Cut-off
values were established according to literature and to our laboratory data [27, 28]: 350
pg/ml for t-tau; 60 pg/ml for p-tau; and 500 pg/ml for Aβ 1-42.
Statistical analysis was performed using STATA software and parametric or not
parametric tests were used as appropriate. Patients were classified in groups according
to the following variables: (i) response to AED; responsive SE versus refractory/super-
refractory SE [29]; (ii) disability outcome; worsening in disability was measured as a
change ≥ 1 point in modified Ranking score (mRS) score at 6 months follow-up; (iii)
epilepsy outcome; we considered patients who developed (or not) spontaneous seizures
after six months of follow-up. Post-SE epilepsy was defined as the occurrence of at least
one unprovoked epileptic seizure not earlier than four weeks after termination of SE.
The treatment protocol for SE was similar in all the patients and followed the guidelines
of the Italian League Against Epilepsy [30] and of the European Federation of
Neurological Societies [31]. Benzodiazepines were used as first line therapy (i.v.
lorazepam) followed by treatment with phenytoin or valproate i.v. at appropriate dose
as second line AEDs, in mono or polytherapy: phenytoin was used in 21 patients,
valproate in 13. Levetiracetam (i.v.) was used in 10 patients (in three as monotherapy);
i.v. lacosamide was use in one subjects in polytherapy. If seizures persisted after AEDs
treatment the SE was considered refractory and the patient was treated with general
anesthesia in intensive care unit (ICU)(12 patients): propofol was used in 10 patients,
midazolam in five, and thiopental in one. If seizures persisted or recurred after more
than 24 hours of general anesthesia the SE was considered super-refractory.
Independent t-tests or Mann-Whitney-U test were used to compare the groups on
different variables as appropriate. Correlation analyses were performed to study the
relationship between SE duration, time interval between the SE onset/admission and

37
lumbar puncture, and CSF values. Univariate logistic regression analyses were
performed to find the predictive value of each independent variable in discriminating
disability and epilepsy outcome at six months; by using these results, we constructed
multiple regression models adding only those variable with a p value<0.25 in order to
find the best model of prediction. For these analyses, we treated CSF biomarkers values
as dichotomous and the classification was based on the median value of the group. The
accuracy of these models was assessed by area under the curve (AUC) of the receiver
operating characteristic (ROC) curve. Patients with previous history of epilepsy or
seizure were not considered in logistic regression with epilepsy outcome as dependent
variable.
The scientific advisory board of our institution approved the research protocol
according to local regulations and informed written consent was obtained from patients.
3. Results
Table 1 reports the main demographic, electroclinical and CSF data of the patients (mean
age 56 years; range 11-79 years; 18 females). According to outcomes, 11 patients (39%)
worsened in functional outcome assessed by mRS score, 5 of which died; 11 patients
(39%) had refractory/super-refractory SE. For those patients with available follow-up
at six months (n=22), 10 (45.4%) developed chronic epilepsy. Considering cut-off
values, 14 patients had abnormally high CSF t-tau level, six patients had abnormally high
CSF p-tau level, and only three patients had abnormally low Aβ 1-42 level.
Statistical analyses demonstrated (Supplementary Table 3) that patients with
refractory/super-refractory SE had higher CSF t-tau level (p=0.0005) compared to
responsive SE (Figure 1a). Patients with mRS worsening showed higher CSF t-tau level
(p=0.005), greater frequency of refractory SE (p=0.03), greater frequency of remote
symptomatic SE (p=0.01), and greater use of anesthetic drugs (p=0.01). A sub-analysis
in dead patients compared to all other subjects did not show any difference in
demographic, electroclinical and CSF variables. Patients who developed chronic epilepsy
at six months were characterized by greater frequency of remote symptomatic SE
(p=0.03).
38
Correlation analyses performed between SE duration and CSF values showed that only t-
tau level was positively correlated with SE duration (rs=0.47, p=0.01)(Figure 1b). The
time interval between the SE onset/admission and CSF sample did not correlate with
CSF biomarkers concentrations.
Considering SE treatment, higher t-tau values were found in patients who underwent
lumbar puncture during general anesthesia with propofol compared to patients who
were treated with other drugs or who underwent lumbar puncture before anesthesia
(p=0.0019). The relative risk of having t-tau value higher than the median value in
patients treated with propofol was 3.3 (p=0.0008).
Univariate logistic regressions (Table 2) performed with disability outcome (mRS) as
dependent variable showed that refractory SE (OR=5.6, p=0.04), use of anesthetic drugs
(OR=8.6, p=0.01), and higher level of CSF t-tau (OR=32.5, p=0.004) were significant
predictors of disability development and/or worsening. Using several stepwise logistic
regression analyses inclusive of all variables with p<0.25 in univariate logistic
regression, we found that the best model for predicting disability outcome included CSF
t-tau level, need of ICU, and AED refractoriness with 82.14% of cases correctly classified.
Sensitivity and specificity of this model were 90.91% and 76.47%, respectively
(AUC=0.89). In this model, only CSF t-tau reliably and independently predicted disability
outcome (OR=21.2, p=0.013). Univariate logistic regressions performed with epilepsy
outcome as dependent variable showed that remote symptomatic cause (OR=25.6,
p=0.010) and higher level of CSF t-tau (OR=12, p=0.016) were significant predictors of
development of epilepsy at six months.

39
Table 1. Demographics and clinical features of patients with SE (n=28).
Age, mean (sd) 56,10 (19)
Gender: M (%) – F (%) 10 (35) – 18 (65)
Previous history of epilepsy/seizure, yes –no (%) 3 (10,7) – 25 (89,3)
Prevalent type of seizure Motor (%) Not motor (%)
14 (50) 14 (50)
SE presumed aetiology, Symptomatic remote (%) Drug withdrawal, toxic-metabolic, autoimmune or unknown (%)
10 (35,7) 18 (64,3)
SE duration (days), median (range) 4 (1-30)
Days from SE onset and lumbar puncture, median (range) 3 (0-20)
SE outcome, Responsive (%) Refractory and Super-refractory (%)
17 (61) 11 (39)
Anaesthetic drugs use, yes –no (%) 12 (43) – 16 (57)
CSF hyperproteinorrachia, yes –no (%) 5 (18) – 23 (82)
CSF Oligoclonal bands, yes –no (%)* 7 (25,9) – 20 (74,1)
CSF t-tau (pg/ml), median (range) 401 (68 – 195618)
CSF p-tau181(pg/ml), median (range) 39,5 (6 – 132)
CSF Aβ 1-42(pg/ml), median (range) 934,5 (309 – 1504)
Development of chronic epilepsy, yes –no (%)** 10 (45,4) – 12 (54,6)
mRS worsening, yes –no (%) 11 (39,3) – 17 (60,7)
Table legend. SE: status epilepticus; F: female; M: male; CSF: cerebrospinal fluid; mRS: modified Rankin scale; sd: standard deviation *CSF oligoclonal bands were not evaluated in 1 patient **Evaluated in 22 patients; 6 patients were lost at follow-up or died before the final follow-up

40
Table 2. Univariate logistic regression results for disability and epilepsy outcome.
mRS WORSENING
DEVELOPMENT OF
EPILEPSY AT 6 MONTHS
OR p 95% CI OR p 95% CI
Age
(≥ or ≤ 56years) 1,01 0,358 0,97-1,06 1 1,000 0,18-5,35
Gender 2 0,390 0,4-9,7 0,5 0,578 0,10-3,53
Previous history of epilepsy/seizure
3,5 0,327 0,28-44,8 - - -
Prevalent type of seizure
1,35 0,699 0,29-6,18 0,7 0,696 0,13-3,86
SE response to AED
5,68 0,040 1,07-29,99 1,33 0,746 0,23-7,62
SE aetiology 8,16 0,019 1,41-47,01 25,66 0,010 2,2-298,4
SE duration
(≥ or ≤ 4 days) 3,8 0,11 0,73-19,66 2,3 0,34 0,40-13,60
Days from SE onset and lumbar puncture
(≥ or ≤ 3 days)
3,8 0,11 0,73-19,66 2,3 0,34 0,40-13,60
Anaesthetic drugs use
8,66 0,015 1,52-49,22 2 0,43 0,35-11,2
CSF hyperproteinorrachia,
2,81 0,307 0,30-20,45 0,5 0,654 0,04-7,21
CSF OB 1,12 0,895 0,19-6,43 4,5 0,135 0,63-32,29
CSF t-tau, median 32,5 0,004 3,12-337,81 12 0,016 1,58-91,08
CSF p-tau181,
median 1,35 0,699 0,29-6,18 0.6 0,640 1,12-3,63
CSF Aβ 1-42, median 0,74 0,699 0,16-3,39 0,47 0,39 0,08-2,62
Table legend. SE: status epilepticus; CSF: cerebrospinal fluid; mRS: modified Rankin scale; OD: odds ratio; CI: confidence interval; OB: oligoclonal bands; AED: antiepileptic drugs. In bold significant values.

41
Figure 1. a). Distribution plot of t-tau in patients with status epilepticus (SE); red dots indicate patients with refractory or super-refractory SE, green dots represent cases with SE responsive to AED; horizontal line represents t-tau cut-off value (350 pg/ml); b). Positive correlation between status epilepticus duration (days) and CSF values, meaning that subjects with higher t-tau values had longer status epilepticus duration. t-tau value are represented as logarithmic value for display purpose.

42
Supplementary Table 1. Clinical data of the examined patients. Pts are numbered from the one with the highest t-Tau CSF level to the lowest.
Pt Age/
gender
Previous
history of
seizures/
epilepsy
Prevalent
type of
seizures
SE outcome
SE
duration
(days)
Need of
ICU
AED*
used Other drugs
Presumed
aetiology of
SE
Trigger
condition
Cognitive/
neurological
outcome
Development
of chronic
epilepsy
1 38/F No Tonic clonic Super-
Refractory 20 Yes lev, pht Propofol
Remote symptomatic
Infection/ Fever
Severe encephalopathy
Yes
2 30/F No Myoclonic Super-
Refractory 20 Yes
lev, pht, lcm
Propofol, Midazolam, Thiopental
Unknown Infection
/Fever Normal No
3 47/F No Complex
partial Refractory 4 Yes lev, pht Propofol Metabolic HypoNa+
Severe encephalopathy
No
4 72/F No Focal motor Super-
Refractory 7 Yes
lev, pht, vpa
Propofol Remote
symptomatic Infection/
Fever Severe
encephalopathy Yes
5 77/M No Complex
partial Super-
Refractory 8 Yes
lev, pht, vpa
Propofol, Midazolam
Remote symptomatic
- Death n.a.
6 69/M No Focal motor Refractory 15 Yes pht, ltg, oxc, pb
Propofol Remote
symptomatic -
Severe encephalopathy
Yes
7 72/F No Complex
partial Responsive 4 No pht -
Remote symptomatic
Infection/ Fever
Normal Yes
8 79/F No Focal motor Responsive 6 No pht, vpa - Unknown - Normal Yes

43
9 39/M No Complex
partial Responsive 1 No vpa -
Remote symptomatic
- Language deficit Yes
10 76/M No Focal motor Responsive 20 No vpa, pht - Remote
symptomatic Infection/
Fever Language deficit No
11 77/F No Focal motor Responsive 6 No pht - Unknown - Death n.a.
12 65/M No Myoclonic Refractory 3 Yes pht Propofol Unknown - Death n.a.
13 16/F Yes Focal
sensory Responsive 2 Yes lev Propofol
Remote symptomatic
- Mild cognitive
deficit Yes
14 68/M Yes Complex
partial Super-
Refractory 30 Yes
pht, lev, vpa, pb
Propofol Remote
symptomatic - Death Yes
15 43/M No Focal motor Responsive 2 No vpa, pht -
BDZ withdrawal in
substance abuse disorder
- Normal No
16 70/F No Complex
partial Responsive 7 No vpa - Unknown - Normal No
17 78/M No Tonic clonic Responsive 2 No lev - Unknown Infection/
Fever Normal No
18 58/F No Tonic clonic Refractory 5 Yes vpa Midazolam Lithium
overdosage - Normal No

44
19 51/F No Complex
parital Responsive 4 No pht, vpa - Unknown - Normal Yes
20 52/M No Focal motor Responsive 3 No lev - BDZ
withdrawal - Normal No
21 27/F No Focal motor Responsive 2 No pht - NMDAr
encephalitis - Normal Yes
22 79/F No Dyscognitive Responsive 2 No pht, vpa - Unknown Infection/
Fever Normal No
23 50/M No Dyscognitive Responsive 3 No pht - Unknown Infection/
Fever Normal No
24 59/F No Dyscognitive Responsive 1 No vpa -
Multidrug withdrawal for
neurpathic pain
- Death n.a.
25 11/F No Focal
sensory Refractory 7 Yes pht, lev Midazolam
NMDAr encephalitis
- Normal No
26 64/F No Focal motor Responsive 3 No pht - Unknown Infection/
Fever Normal No
27 37/F Yes Focal
sensory Refractory 3 Yes pht
Midazolam, Propofol
Remote symptomatic
- Normal n.a.
28 67/F No Dyscognitive Responsive 3 No pht, vpa -
BDZ withdrawal in
Bipolar disorder
- Normal n.a.

45
Table legend: F: female; M: male;CBZ: carbamazepine; CLB: clobazam; PHT: phenytoin; LCM: Lacosamide; LEV: levetiracetam; LTG: lamotrigine; MDZ: midazolam; PRO: propofol;OXC: oxcarbazepine; THIO: thiopentale; TPM: topiramate; VPA: valproate. n.a.: not available.
* The first line treatment was i.v. lorazepam or diazepam in every patient.
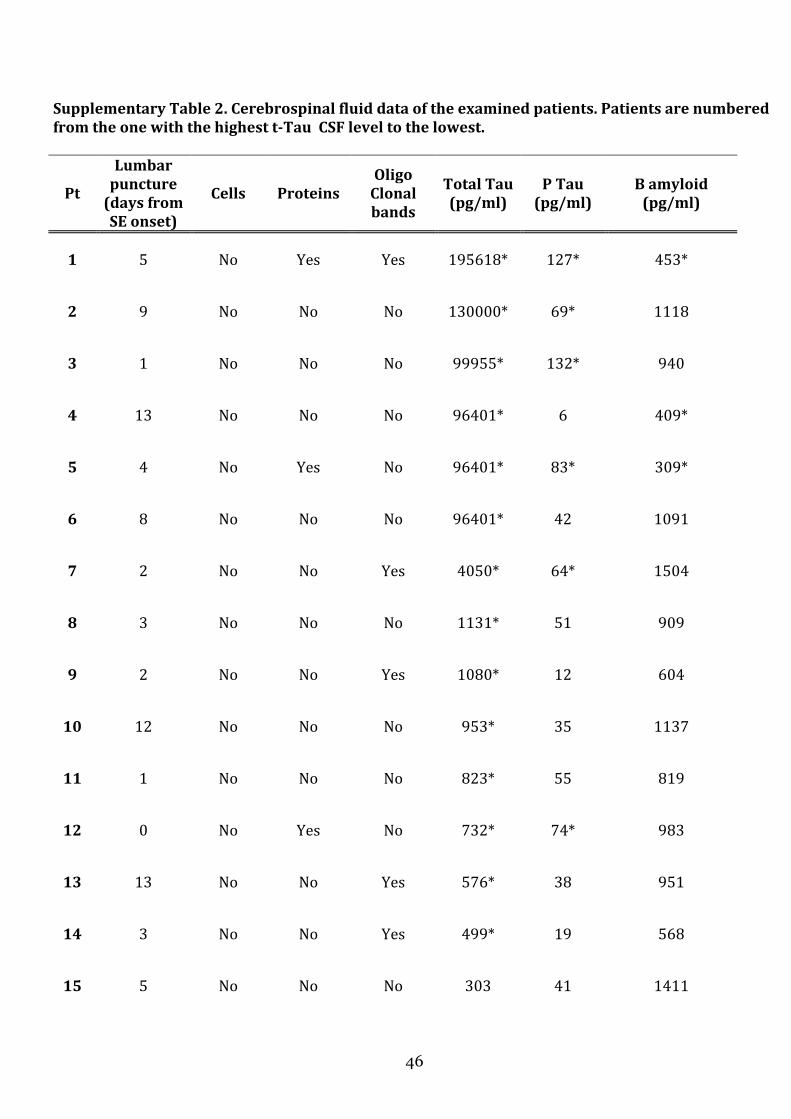
46
Supplementary Table 2. Cerebrospinal fluid data of the examined patients. Patients are numbered
from the one with the highest t-Tau CSF level to the lowest.
Pt
Lumbar
puncture
(days from
SE onset)
Cells Proteins
Oligo
Clonal
bands
Total Tau
(pg/ml)
P Tau
(pg/ml)
B amyloid
(pg/ml)
1 5 No Yes Yes 195618* 127* 453*
2 9 No No No 130000* 69* 1118
3 1 No No No 99955* 132* 940
4 13 No No No 96401* 6 409*
5 4 No Yes No 96401* 83* 309*
6 8 No No No 96401* 42 1091
7 2 No No Yes 4050* 64* 1504
8 3 No No No 1131* 51 909
9 2 No No Yes 1080* 12 604
10 12 No No No 953* 35 1137
11 1 No No No 823* 55 819
12 0 No Yes No 732* 74* 983
13 13 No No Yes 576* 38 951
14 3 No No Yes 499* 19 568
15 5 No No No 303 41 1411

47
16 8 No No No 243 47 1189
17 0 No No No 241 49 1050
18 1 No Yes No 225 38 776
19 4 No No No 210 30 929
20 2 No No No 158 14 863
21 2 No No No 136 27 958
22 1 No No Yes 134 25 909
23 5 No Yes No 68 9 762
24 20 No No No 186 36 896
25 3 No No Yes 232 46 1090
26 1 No No n.a. 130 34 698
27 1 No No No 130 34 950
28 1 No No No 213 46 1123

48
RESPONSE TO AED mRS WORSENING DEVELOPMENT OF
EPILEPSY at 6 months **
AED
Responsive
(n=17)
AED not
responsive
(n=11)
Group
compariso
n
Not
disability
worsening
(n=17)
Disability
worsening
(n=11)
Group
comparison No
(n=12)
Yes
(n=10)
Group
comparison
Age, mean (years) 58,76 52 ns 53,3 60,3 ns 54,8 59,5 ns Gender: M – F (n) 6-11 4-7 ns 5-6 5-12 ns 5-7 3-7 ns Previous history of epilepsy/seizure, yes –no (n)
1-16 2-9 ns 1-16 2-9 ns - - ns
Prevalent seizure type (n) motor not motor
8 9
6 5
ns
8 9
5 6
ns
7 5
5 5
ns
SE aetiology (n) Symptomatic remote Other/unknown (n)
4
13
6 5
ns
3 14
7 4
p=0,01
1 11
7 3
p=0,03
SE mean duration (days), median
3 7 p=0,003 3 7 ns 3,5 5 ns
Days from SE onset and lumbar puncture, median
2 3 ns 2 5 ns 2,5 3,5 ns
SE evolution Responsive Refractory/super-
refractory
- - - 13 4
7 4
p=0,03
8 4
6 4
ns
Anaesthetic drugs, yes –no (n) 1-16 11-0 p=0,000 4-13 8-3 p=0,01 4-8 5-5 ns CSF hyperproteinorrachia, yes –no (n)
1-16 4-7 p=0,04 2-15 3-8 ns 2-10 1-9 ns
CSF Oligoclonal bands*, yes –no (n)
4-12 3-8 ns 4-12 3-8 ns 2 -9 5-5 ns
CSF t-tau, median 241 96401 p=0,0005 225 953 p=0,005 236 1105,5 ns CSF p-tau181, median 36 46 ns 38 42 ns 39 51 ns CSF Aβ 1-42, median 929 940 ns 950 896 ns 995 919 ns
49
Supplementary Table 3. Group comparison results according to response to AED, disability, and epilepsy outcome
Table legend. n: numbers of subjects; SE: status epilepticus; F: female; M: male; CSF: cerebrospinal fluid; mRS: modified Rankin scale; sd: standard deviation *CSF oligoclonal bands were not evaluated in 1 patient **Evaluated in 22 patients; 6 patients were lost at follow-up or died before the final follow-up

50
4. Discussion
In this study we evaluated if established biomarkers of brain damage were increased
during status epilepticus. The hypothesis tested was to find out if repeated seizures
induce a neuronal damage that can be indexed by cerebrospinal fluid tau proteins;
therefore, we have excluded from the study all SE cases with a symptomatic aetiology
due to an acute or progressive CNS insult.
A first finding concerns the different patterns of CSF values for t-tau, p-tau, and Aβ 1-42
proteins. Indeed, only a few patients showed pathological levels of p-tau (21%) and Aβ
1-42 (11%), whereas 50% of the patients had pathologically high t-tau values. In
particular, t-tau values showed great variability, from normal values (< 350 pg/ml) to
dramatically high levels (> 90.000 pg/ml in six patients). Therefore t-tau protein was the
more sensible marker of neuronal damage in our sample of SE. Moreover, we found that
only t-tau correlated with the duration of SE. These findings are consistent with results
of tau pathology in other brain disorders. P-tau is considered to reflect the
phosphorylation state of tau, being a more direct signature of Alzheimer Disease.
Consistent with this, in patients with ischemic stroke, CSF t-tau but not p-tau levels were
increased and showed correlation with the size of the infarct, indicating that CSF t-tau
reflects the degree of neuronal damage [32]. Also in Creutzfeldt–Jacob disease marked
elevation of t-tau but not p-tau levels has been reported [19].
We found that t-tau was higher (i) in patients with refractory and super-refractory SE
compared to patients with SE responsive to AED and (ii) in patients who developed a
clinical and functional worsening in disability. These two results support the hypothesis
that t-tau might index the severity of status epilepticus and the concept that repeated
seizures in this clinical context might induce neuronal damage. Notably, our multiple
stepwise logistic regression analysis found that the best model for predicting disability
outcome included CSF t-tau level, need of ICU, and AED refractoriness with 82.14% of
cases correctly classified.
Only two previous studies have addressed CSF tau proteins as markers of seizures-
related neuronal damage [22, 23]. Both studies investigated mixed cohorts of patients
after single or repetitive seizures finding no increase in CSF biomarkers. High t-tau high
level was observed only in cases with acute symptomatic seizures due to CNS damage
[22]. The authors concluded that abnormal CSF tau levels can be found in patients with

51
seizures. However, isolated or repetitive seizure per se does not seem to lead to the
elevation of CSF tau. Moreover, in both studies a small subset of patients was
categorized as status epilepticus: t-tau levels were not reported to be high in these cases
and did not correlate with the number of seizures. It should be noted however, that the
SE cases included in these studies were responsive to first line therapy (i.v.
benzodiazepine) or second line AED (i.v. valproate). In our study, we observed that the
majority of patients with SE classified to responsive to AED showed normal t-tau levels
(11 out of 17 patients). Taken together, these evidences are concordant in showing that
isolated o repeated seizures which respond promptly to first or second line AED
treatment does not induce t-tau pathology and neuronal damage. Conversely, our study
demonstrates that severe, refractory/super-refractory SE cases, are associated to a
marked increase in t-tau levels possibly reflecting neuronal damage.
Another interesting finding was that t-tau levels were significantly higher in patients for
whom CSF samples were collected during general anaesthesia with propofol in ICU.
These patients who presented refractory SE received propofol treatment for at least one
cycle of 24-72 hour (or more in super-refractory SE cases). The use of general
anaesthetics and ICU staying were also associated to worse functional outcome and
disability. These findings raise the question of a role of general anaesthesia and propofol
in inducing tau pathology and subsequent cognitive worsening. Of course, the need of
ICU and anaesthetics drugs are related to the intrinsic severity of the status epilepticus
and therefore it is difficult to disentangle the effects of different variables on outcomes.
Previous studies in both adults and children have reported that the need and the
duration of anaesthetic treatment were related to worse functional outcome and namely
worse cognitive outcome [6] [6, 33]. The evidence that patients with SE treated with
propofol had high or dramatically high level of total tau CSF proteins deserve attention
and need to be verified in future prospective studies. Indeed, recent researches focused
on the effects of general anaesthesia on tau CSF levels showed that several anaesthetics
drugs can affect tau pathology in different and complex ways [34, 35]. Anaesthetics have
been previously shown to induce tau hyperphosphorylation through a mechanism
involving hypothermia-induced inhibition of protein phosphatase 2A activity [36, 37].
However, also the effect of propofol on tau phosphorylation under normothermic
conditions has been recently demonstrated in the mouse [38] and brief exposure to
different anaesthetics in human surgery procedures has resulted in t-tau increase [39].

52
These evidences support the urgent need of studies to assess the role on anaesthetics in
a severe brain disorder as status epilepticus.
Of course our study has several limitations, which are related to the retrospective
design. An important one concerns the lack of precise information about the exact time
of onset of seizures respect to CSF sampling. For SE cases that started during
hospitalization this information was available, for cases in whom seizures begun out of
hospital the timing was approximate in the majority and we assumed the hospital
admission as reference point. Another limitation concerns the exact number of seizures
that occurred before and after CSF sampling. Finally, in the present cohort no case of SE
in idiopathic or genetic epilepsy syndromes was present, therefore no data on these
disorders were acquired. However we believe that despite some limits this study
provided interesting results that can have clinical relevance.
In conclusion, we provide for the first time evidence of tau pathology during status
epilepticus. Total tau proteins showed a marked increase in refractory and super-
refractory SE cases and t-tau was a strong predictor of status severity, development of
disability, and subsequent epilepsy. The use of propofol anaesthesia was also associated
to high t-tau levels. These results deserve future verifications with prospective studies.
References
[1] Gastaut H. Dictionary of Epilepsy. Part 1. Definitions. World Health Organization, Geneva 1973
[2] Engel J, Jr. So what can we conclude--do seizures damage the brain? Prog Brain Res 2002; 135: p. 509-12.
[3] Pitkanen A, Nissinen J, Nairismagi J, Lukasiuk K, Grohn OH, Miettinen R, et al. Progression of neuronal damage after status epilepticus and during spontaneous seizures in a rat model of temporal lobe epilepsy. Prog Brain Res 2002; 135: p. 67-83.
[4] Logroscino G, Hesdorffer DC, Cascino G, Annegers JF, Hauser WA. Short-term mortality after a first episode of status epilepticus. Epilepsia 1997; 38(12): p. 1344-9.
[5] Rosenow F, Knake S, Hamer HM. [Non-convulsive status epilepticus: temporary fad or reality in need of treatment?]. Nervenarzt 2012; 83(12): p. 1551-8.
[6] Hocker SE, Britton JW, Mandrekar JN, Wijdicks EF, Rabinstein AA. Predictors of outcome in refractory status epilepticus. JAMA Neurol 2013; 70(1): p. 72-7.
53
[7] Neligan A, Shorvon SD. Prognostic factors, morbidity and mortality in tonic-clonic status epilepticus: a review. Epilepsy Res 2011; 93(1): p. 1-10.
[8] Rossetti AO, Hurwitz S, Logroscino G, Bromfield EB. Prognosis of status epilepticus: role of aaetiology, age, and consciousness impairment at presentation. J Neurol Neurosurg Psychiatry 2006; 77(5): p. 611-5.
[9] Buttner T, Lack B, Jager M, Wunsche W, Kuhn W, Muller T, et al. Serum levels of neuron- specific enolase and s-100 protein after single tonic-clonic seizures. J Neurol 1999; 246(6): p. 459-61.
[10] DeGiorgio CM, Correale JD, Gott PS, Ginsburg DL, Bracht KA, Smith T, et al. Serum neuron- specific enolase in human status epilepticus. Neurology 1995; 45(6): p.1134-7.
[11] Palmio J, Peltola J, Vuorinen P, Laine S, Suhonen J, Keranen T. Normal CSF neuron-specific enolase and S-100 protein levels in patients with recent non-complicated tonic-clonic seizures. J Neurol Sci 2001; 183(1): p. 27-31.
[12] Steinhoff BJ, Tumani H, Otto M, Mursch K, Wiltfang J, Herrendorf G, et al. Cisternal S100 protein and neuron-specific enolase are elevated and site-specific markers in intractable temporal lobe epilepsy. Epilepsy Res 1999; 36(1): p. 75-82.
[13] Correale J, Rabinowicz AL, Heck CN, Smith TD, Loskota WJ, DeGiorgio CM. Status epilepticus increases CSF levels of neuron-specific enolase and alters the blood-brain barrier. Neurology 1998; 50(5): p. 1388-91.
[14] Rosen C, Zetterberg H. Cerebrospinal fluid biomarkers for pathological processes in Alzheimer's disease. Curr Opin Psychiatry 2013; 26(3): p. 276-82.
[15] Frisoni GB, Blennow K. Biomarkers for Alzheimer's: the sequel of an original model. Lancet Neurol 2013; 12(2): p. 126-8.
[16] Hesse C, Rosengren L, Vanmechelen E, Vanderstichele H, Jensen C, Davidsson P, et al. Cerebrospinal fluid markers for Alzheimer's disease evaluated after acute ischemic stroke. J Alzheimers Dis 2000; 2(3-4): p. 199-206.
[17] Krut JJ, Zetterberg H, Blennow K, Cinque P, Hagberg L, Price RW, et al. Cerebrospinal fluid Alzheimer's biomarker profiles in CNS infections. J Neurol 2013; 260(2): p. 620-6.
[18] Ost M, Nylen K, Csajbok L, Ohrfelt AO, Tullberg M, Wikkelso C, et al. Initial CSF total tau correlates with 1-year outcome in patients with traumatic brain injury. Neurology 2006; 67(9): p. 1600-4.
[19] Riemenschneider M, Wagenpfeil S, Vanderstichele H, Otto M, Wiltfang J, Kretzschmar H, et al. Phospho-tau/total tau ratio in cerebrospinal fluid discriminates Creutzfeldt-Jakob disease from other dementias. Mol Psychiatry 2003; 8(3): p. 343-7.
[20] Zemlan FP, Rosenberg WS, Luebbe PA, Campbell TA, Dean GE, Weiner NE, et al. Quantification of axonal damage in traumatic brain injury: affinity purification and characterization of cerebrospinal fluid tau proteins. J Neurochem 1999;72(2):p.741-50.
[21] Matsui T, Maruyama M, Matsushita S, Arai H, Higuchi S, Maruyama K. A transient increase in cerebrospinal fluid tau level after epileptic seizure in an elderly patient. J Am Geriatr Soc 2007; 55(12): p. 2096-7.
54
[22] Palmio J, Suhonen J, Keranen T, Hulkkonen J, Peltola J, Pirttila T. Cerebrospinal fluid tau as a marker of neuronal damage after epileptic seizure. Seizure 2009; 18(7): p.474-7.
[23] Shahim P, Rejdak R, Ksiazek P, Blennow K, Zetterberg H, Mattsson N, et al. Cerebrospinal fluid biomarkers of beta-amyloid metabolism and neuronal damage in epileptic seizures. Eur J Neurol 2014; 21(3): p. 486-91.
[24] Proposal for revised classification of epilepsies and epileptic syndromes. Commission on Classification and Terminology of the International League Against Epilepsy. Epilepsia 1989; 30(4): p. 389-99.
[25] Guidelines for epidemiologic studies on epilepsy. Commission on Epidemiology and Prognosis, International League Against Epilepsy. Epilepsia 1993; 34(4): p. 592-6.
[26] Vanderstichele H, Bibl M, Engelborghs S, Le Bastard N, Lewczuk P, Molinuevo JL, et al. Standardization of preanalytical aspects of cerebrospinal fluid biomarker testing for Alzheimer's disease diagnosis: a consensus paper from the Alzheimer's Biomarkers Standardization Initiative. Alzheimers Dement 2012; 8(1): p. 65-73.
[27] Sjogren M, Vanderstichele H, Agren H, Zachrisson O, Edsbagge M, Wikkelso C, et al. Tau and Abeta42 in cerebrospinal fluid from healthy adults 21-93 years of age: establishment of reference values. Clin Chem 2001; 47(10): p. 1776-81.
[28] Tondelli M, Bedin R, Chiari A, Molinari MA, Bonifacio G, Lelli N, et al. Role of cerebrospinal fluid biomarkers to predict conversion to dementia in patients with mild cognitive impairment: a clinical cohort study. Clin Chem Lab Med 2015;53(3):p.453-60.
[29] Shorvon S, Ferlisi M. The treatment of super-refractory status epilepticus: a critical review of available therapies and a clinical treatment protocol. Brain 2011; 134(Pt 10): p. 2802-18.
[30] Minicucci F, Muscas G, Perucca E, Capovilla G, Vigevano F, Tinuper P. Treatment of status epilepticus in adults: guidelines of the Italian League against Epilepsy. Epilepsia 2006; 47 Suppl 5: p. 9-15.
[31] Meierkord H, Boon P, Engelsen B, Gocke K, Shorvon S, Tinuper P, et al. EFNS guideline on the management of status epilepticus in adults. Eur J Neurol 2010; 17(3): p. 348-55.
[32] Hesse C, Rosengren L, Andreasen N, Davidsson P, Vanderstichele H, Vanmechelen E, et al. Transient increase in total tau but not phospho-tau in human cerebrospinal fluid after acute stroke. Neurosci Lett 2001; 297(3): p. 187-90.
[33] Kramer U, Chi CS, Lin KL, Specchio N, Sahin M, Olson H, et al. Febrile infection-related epilepsy syndrome (FIRES): does duration of anesthesia affect outcome? Epilepsia 2011; 52 Suppl 8: p. 28-30.
[34] Run X, Liang Z, Gong CX. Anesthetics and tau protein: animal model studies. J Alzheimers Dis 2010; 22 Suppl 3: p. 49-55.
[35] Whittington RA, Virag L, Marcouiller F, Papon MA, El Khoury NB, Julien C, et al. Propofol directly increases tau phosphorylation. PLoS One 2011; 6(1): p. e16648.

55
[36] Planel E, Krishnamurthy P, Miyasaka T, Liu L, Herman M, Kumar A, et al. Anesthesia- induced hyperphosphorylation detaches 3-repeat tau from microtubules without affecting their stability in vivo. J Neurosci 2008; 28(48): p. 12798-807.
[37] Planel E, Richter KE, Nolan CE, Finley JE, Liu L, Wen Y, et al. Anesthesia leads to tau hyperphosphorylation through inhibition of phosphatase activity by hypothermia. J Neurosci 2007; 27(12): p. 3090-7.
[38] Whittington RA, Bretteville A, Virag L, Emala CW, Maurin TO, Marcouiller F, et al. Anesthesia-induced hypothermia mediates decreased ARC gene and protein expression through ERK/MAPK inactivation. Sci Rep 2013; 3: p. 1388.
[39] Tang JX, Baranov D, Hammond M, Shaw LM, Eckenhoff MF, Eckenhoff RG. Human Alzheimer and inflammation biomarkers after anesthesia and surgery. Anesthesiology 2011; 115(4): p. 727-32.
56
C. Discussion & perspective
Our findings support new prospective in the comprehension of status epilepticus effects
on CNS in humans. Possible biomarkers of neuronal damage since the early stages could
improve and guide better treatments and approaches.
Refractory SE cases are related to higher percentage of mortality and morbidity and an
early intervention is mandatory.
A recent paper published by our group (Giovannini et al. 2015)22 reported 83 SE cases in
one year of prospective analysis in Modena district; cases with RSE/super-RSE
represent 31% of all SE cases (SRSE accounted for 17% of all SE episodes). We observed
a similar incidence of cases with refractory SE that in previous studies, taking into
account the possible differences in classification and population included (we included
also post-anoxic aetiology). The overall short-term mortality was 37%. Comparing
mortality in cases with RSE with cases with responsive SE, a striking difference was
evident with a mortality of 54% in RSE compared with a mortality of 20% in responsive
SE. Moreover, we confirm that RSE is related to high short-term disability. This is not the
consequence of less aggressive treatment; rather it reflects the severity of the
underlying conditions.
Moreover, stupor/coma at onset is the most relevant clinical factor associated with SE
refractoriness. Probably is due to a delay in correct diagnosis of SE (often after 24
hours) and consequently in the treatment delay.
SE needs to be considered a neurological emergency supported by several different
aetiologies with very different evolutions. We need to improve our knowledge in this
field, especially in humans. We collected a lot of evidence that refractory cases often
evolves in neurological disabilities and chronic epilepsy, sometimes independently by
the underline conditions but primary as a consequence of repeated seizures.
This hypothesis is supported by our demonstration of high t-tau protein levels in CSF
only in refractory cases.
These preliminary data were published in May 2015 in the special issue of Epilepsy &
Behaviour on “Status epilepticus”, following the poster presentation during the London-
Innsbruck Colloquium on Status epilepticus and acute seizures, held in London on April
9-11 2015.
57
Starting from these evidences, in the last 2 years we collected other 25 patients with SE
that undergone to CSF analyses, for a total of 53 cases; we decide to reach at least 60
patients to repeat statistical analysis. We hope to reach the purpose in the next few
months.
Our intention is to propose CSF collection in patients with SE, not only to exclude CNS
infection, but also to analyze prognostic factors of possible brain damage.
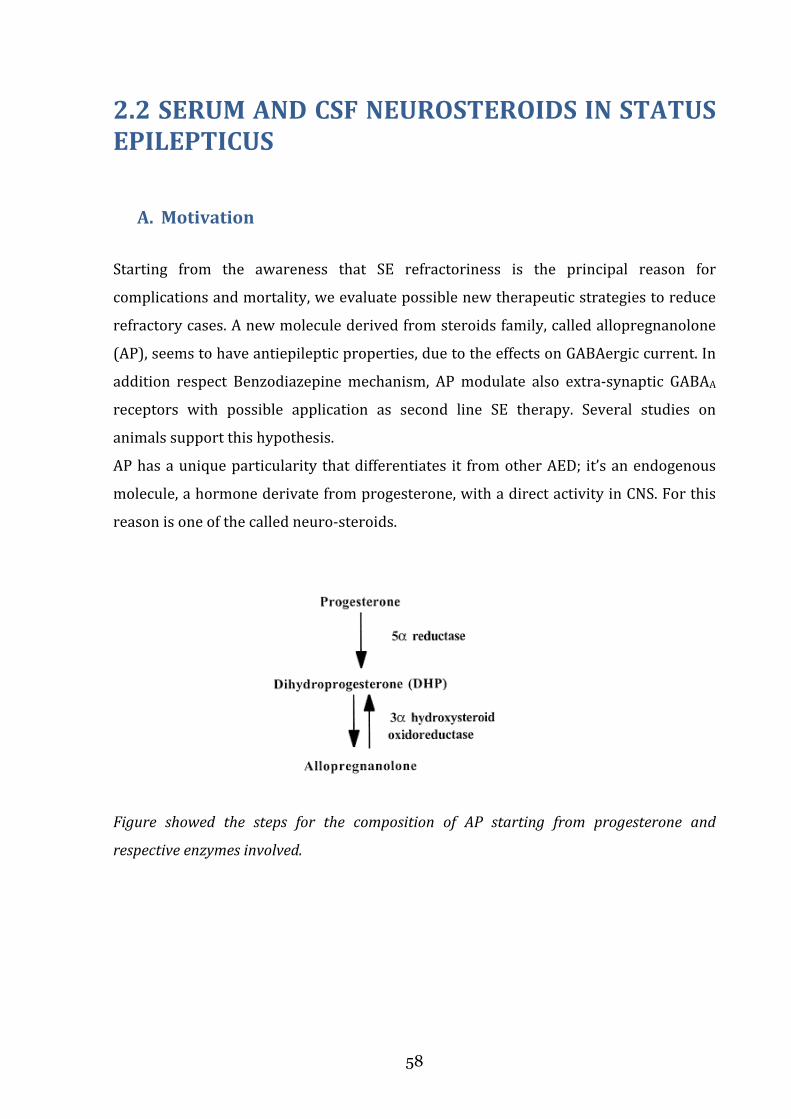
58
2.2 SERUM AND CSF NEUROSTEROIDS IN STATUS
EPILEPTICUS
A. Motivation
Starting from the awareness that SE refractoriness is the principal reason for
complications and mortality, we evaluate possible new therapeutic strategies to reduce
refractory cases. A new molecule derived from steroids family, called allopregnanolone
(AP), seems to have antiepileptic properties, due to the effects on GABAergic current. In
addition respect Benzodiazepine mechanism, AP modulate also extra-synaptic GABAA
receptors with possible application as second line SE therapy. Several studies on
animals support this hypothesis.
AP has a unique particularity that differentiates it from other AED; it’s an endogenous
molecule, a hormone derivate from progesterone, with a direct activity in CNS. For this
reason is one of the called neuro-steroids.
Figure showed the steps for the composition of AP starting from progesterone and
respective enzymes involved.

59
Figure showed GABAA receptors with sub-unite site for ligands. In post-synaptic
membranes are located the two sub-types of GABA receptors: synaptic and extra-synaptic.
Other neuro-steroids are considered to influence neuronal activity; in particular
pregnenolone sulphate seems to have a proconvulsant mechanism.
In literature, no study analysed physiological values of such neurosteroids in humans,
considering gender and age, nor in epileptic patients.
We started from our laboratory CSF storage to select normal CSF in normal patients, in
which lumbar puncture was done to exclude neurological disease.
Then we considered our cohort of patients with SE and we selected those that
undergone to simultaneously CNS and serum detection to evaluate the dosage of the
principal neurosteroids (PS and AP).
References:
- Belelli D, Lambert JJ. Neurosteroids: endogenous regulators of the GABAA receptor. Nat Rev Neurosci 2005;6:565-575.
- Kokate TG, et al. Convulsant actions of the neurosteroid pregnenolone sulfate in mice. Brain Res 1999;831:119-124.
- Biagini G, et al. Neurosteroids and epilepsy. Curr Opin Neurol 2010;23:170-176.

60
B. Study 2. DECREASED ALLOPREGNANOLONE LEVELS IN CSF DURING
STATUS EPILEPTICUS
Published as brief comunication on Epilepsia, 1–5, nov 2016 doi: 10.1111/epi.13625
*†Stefano Meletti, *†Chiara Lucchi, *†Giulia Monti, *†Giada Giovannini, *†Roberta Bedin,
‡Tommaso Trenti, §Cecilia Rustichelli, *†Giuseppe Biagini
*Department of Biomedical, Metabolic and Neural Sciences, University of Modena and Reggio Emilia, Modena, Italy; †Department of Neurosciences, NOCSAE Hospital, AUSL Modena, Italy; ‡Department of Laboratory Medicine and Pathological Anatomy, NOCSAE Hospital, AUSL Modena, Italy; §Department of Life Sciences, University of Modena and Reggio Emilia, Modena, Italy.
Short title: Neurosteroids in status epilepticus
KEY WORDS: Allopregnanolone; Cerebrospinal fluid; LC-MS/MS; Pregnenolone sulfate;
Status epilepticus.
Summary
Neuroactive steroids are increasingly considered as relevant modulators of neuronal
activity. Especially allopregnanolone (AP) and pregnenolone sulfate (PS) have been shown
to possess, respectively, anticonvulsant or proconvulsant properties. In view of the
potential role of these steroids, we aimed at evaluating AP and PS levels in cerebrospinal
fluid (CSF) and blood samples obtained from patients with status epilepticus (SE). To this
purpose, we enrolled 41 patients affected by SE and 41 subjects investigated for non-
epileptic neurological disorders. Liquid chromatographic procedures coupled with
electrospray tandem mass spectrometry and routine laboratory investigations were
performed. Significantly lower AP levels were found in CSF of patients affected by SE (-
30%; p < 0.05, Mann-Whitney test). Notably, AP was not detectable in 28 out of 41 patients
affected by SE (p < 0.01 vs controls, Fisher’s exact test). In serum, AP levels did not differ in
the two considered groups. Conversely, PS was present at similar levels in the investigated
groups. Finally, differences in AP levels could not be explained by a variation in CSF
albumin content. These findings indicate that AP is defective in the CSF of patients affected
by SE. This phenomenon was not dependent on carriers for steroids, such as albumin.

61
INTRODUCTION
In the central nervous system (CNS), allopregnanolone (AP) behaves as a positive
modulator of γ-aminobutyric acid type A (GABAA) receptor and it definitely enhances both
tonic and phasic GABAA-dependent inhibitory currents.1-3 This biological property has been
investigated in different models of epilepsy, in which it was consistently demonstrated that
AP is neuroprotective and anticonvulsant.4 In contrast, sulfated neurosteroids such as
pregnenolone sulfate (PS) negatively modulate the GABAA-dependent inhibition.2
Specifically, PS was shown to induce seizures when injected into the brain.5
In spite of this evidence, very few data are currently available on the possible role of AP
and PS in human epileptic disorders.6 One of the reasons for this still incomplete
knowledge is the difficulty to quantify with high specificity the neuroactive steroids by
currently available methods.7 To address this question, Rustichelli et al.8 have recently set a
method based on the removal of interfering phospholipids from samples. By this way, PS
was clearly detected and measured. On the contrary, AP was probably incompletely
separated from other steroids, such as the cognate molecule pregnanolone (PREG), which
was not previously considered as a possible co-eluting isomer. Although PREG is also a
positive modulator of GABAA currents, with slightly lower potency in comparison to AP, a
correct identification of PREG and AP is required to clarify which step in their processing
could be definitely altered.1
For these reasons, we aimed at further improving our protocol by setting a procedure to
clearly separate PREG from AP. Then, we applied the new procedure to evaluate the role of
AP and PS in a serious neurological disorder such as status epilepticus (SE). The role of
neurosteroids appears to be particularly relevant since, recently, administration of AP has
been proposed as possible therapeutic innovation to overcome the early refractoriness to
benzodiazepines observed during SE.9,10
MATERIALS AND METHODS
Chemicals and reagents
AmplifexTM-Keto Reagent Kit, human albumin (≥ 96%), AP (3α-hydroxy-5α-pregnan-20-
one), PREG (3α-hydroxy-5β-pregnan-20-one), and PS (5-pregnen-3β-ol-20-one sulfate)
were by Sigma-Fluka (St. Louis, MO). The internal standards (ISs) sodium pregnenolone-
17α,21,21,21-D4 sulfate (PS-D4) and 5α-pregnan-3α-ol-20-one-17α,21,21,21-D4 (AP-D4)

62
were from CDN Isotopes (Quebec, Canada). The 3β isomers of AP and PREG, respectively,
epiallopregnanolone (epiAP) and epipregnanolone (epiPREG) (Steraloids Inc., Newport,
RI), were used in order to monitor their retention times. Liquid chromatography-mass
spectrometry (LC-MS) purity grade acetonitrile, methanol, formic acid and ammonium
formate were from Sigma-Fluka; ultra-pure water was purified by a Milli-Q Plus185
system from Millipore (Milford, MA, USA). Phree Phospholipid Removal Tubes (1.0 mL)
were supplied by Phenomenex (Torrance, CA).
High-performance liquid chromatography coupled with tandem mass spectrometry
(LC-MS/MS)
Preparation of standard solutions
A standard stock solution containing PS, AP and PREG was prepared and serially diluted
with methanol to obtain working solutions at 10 different concentration levels, in the
range between 0.6-600 ng/mL for PS and 0.04-40 ng/mL for AP and PREG. The internal
standard calibration solution (IS) was prepared by diluting a stock solution of PS-D4 and
AP-D4 with methanol up to the concentration of 20 and 10 ng/mL for PS-D4 and AP-D4,
respectively. All solutions were stored at -20 °C until use.
LC-MS/MS conditions
The HPLC system consisted of an Agilent 1200 Series Binary Pump equipped with a
vacuum degasser, an autosampler and a thermostatted column compartment (Agilent,
Waldbronn, Germany). The chromatographic separation was performed on a Kinetex XB-
C18 column (75x2.1 mm; 2.6 µm particle size; Phenomenex) preceded by a UHPLC C18
SecurityGuard cartridge (2.1 mm; Phenomenex). The column temperature was set at 40
°C and the autosampler was maintained at 4 °C. Gradient elution was performed at a flow-
rate of 0.4 mL/min with a mobile phase of water/acetonitrile 90/10 added with 3 mM
ammonium formate and 0.1% formic acid (mobile phase A) and acetonitrile/water 90/10
added with 3 mM ammonium formate and 0.1% formic acid (mobile phase B) using the
following program: 0 to 1 min, isocratic at 30% (B); 1 to 10 min, linear gradient from 30
to 40% (B); 10 to 13 min, linear gradient from 40 to 100% (B); 13 to 18 min, isocratic at
100% (B), 18 to 20 min, linear gradient from 100 to 30% (B). A pre-equilibration period
of 10 min was used between each run. The injection volume was 10 µL and the injector
needle was washed with methanol. Mass spectrometric detection was performed using an
Agilent QQQ-MS/MS (6410B) triple quadrupole mass analyzer equipped with an ESI ion

63
source (Agilent, Waldbronn, Germany) operating in the positive mode. The ESI source
parameters were set as follows: the capillary voltage was 3500 V, the nebulizer (N2)
pressure was 35 psi, the drying gas (N2) temperature was 350 °C, the drying gas flow was
10 L/min and the electron multiplier voltage was 700. The mass spectrometer operated
in multiple reaction monitoring (MRM) mode with a dwell time of 100 msec. For collision-
induced dissociation (CID), high purity nitrogen was used as collision gas (15 psi). The
Agilent MassHunter Workstation Acquisition software version B.05.00 (B2043) was used
for instrument control, data acquisition, qualitative and quantitative data analysis. MS/MS
parameters were optimized by direct infusion of each derivatized analyte, including the
ISs, at 50 ng/mL in the initial LC mobile phase at a flow of 10 µL/min. For each analyte,
one precursor ion and three MRM transitions were set up; the validity of the chosen MRM
transitions was verified by LC-MS/MS analyses of human albumin solutions spiked with
the derivatized analytes and ISs (50 ng/mL) and processed as described below. The mass
spectrometer was calibrated to <2 mDa mass error prior to each batch analysis.
Calibration and quality control samples
Since the target analytes are endogenous compounds, 5% human albumin in phosphate
buffered saline was used as blank matrix for calibration and quality control samples.
Calibration samples were prepared by spiking 200 µL of human albumin solution with 50
µL of the IS solution and 50 µL of the working solutions; the samples were then subjected
to the sample processing described above. The concentration range in the obtained
calibration samples (n = 10) was 0.15 to 150 ng/mL for PS and 0.01 to 10 ng/mL for AP
and PREG; calibrator concentrations were chosen to give optimal coverage in the range of
clinical interest. The concentration of the deuterated internal standards in the calibration
samples was 5 and 2.5 ng/mL for PS-D4 and AP-D4, respectively. Low, medium and high
concentration quality control (QC) samples were prepared by spiking human albumin
solution (200 µL) with 50 µL of the IS solution and 50 µL of the working solutions at three
concentration levels (low, medium, high). These QC samples were processed as described
above; final concentrations in the obtained samples were: 0.15, 45, 150 ng/mL for PS and
0.01, 3, 10 ng/mL for AP and PREG, respectively; n=5 for each level.

64
Calibration model
Each calibration sample was assayed in triplicate on three separate days. The regression
lines were calculated using a weighed (1/x) linear regression model. Calibration curves
were generated from the peak-area ratio of each analyte quantifier transition to the
corresponding deuterated IS; the ratio was then plotted on the y-axis against the nominal
analyte concentration to generate the standard curves by the method of least squares
using a weighed (1/x) linear regression model.
LOD and LOQ
The sensitivity of the developed procedure was evaluated by determining the limit of
detection (LOD) and lower limit of quantification (LOQ). The LOQ is the lowest
concentration of the analyte in a sample which can be quantified with an acceptable
accuracy (±20%) and precision (RSD% < 20%). The LOD and LOQ values for each analyte
were calculated from their corresponding calibration plots as 3 σ/S and 10 σ/S,
respectively, where σ and S are the standard deviation and the slope of the regression line
(International conference on harmonisation of technical requirements for registration of
pharmaceuticals for human use. Harmonized tripartite guideline: validation of analytical
procedure: text and methodology Q2(R1),
http://www.ich.org/LOB/media/MEDIA417.pdf (Accessed November 2005).
The LOD and LOQ values for each analyte were then validated by analyzing blank albumin
samples fortified with analytes at the calculated LOD and LOQ levels.
Selectivity
Aliquots (200 µL) of human albumin solution were processed as described and analyzed
for the presence of any interference across the retention window of each analyte and IS.
Absence of interfering components is accepted if the response is less than 20% of the LOQ
values for the analytes and 5% for the internal standards.
Imprecision and accuracy
Method imprecision and accuracy were determined by replicate analyses of the QC
samples spiked at low, medium and high levels (n=5, each). The within-run and the
between-run precision values were evaluated as percent relative standard deviation
(RSD%) of the “found” values. RSD % = (SD/mean) x 100. The obtained values should not
exceed 15% for the QC samples, except for the LOQ (low level QC samples) which should

65
not exceed 20% (Center for Drug Evaluation and Research (CDER) Guidance for Industry:
Bioanalytical Method Evaluation, 2001). Accuracy of the method was evaluated by
analyzing post-spiked QC samples, i.e. blank albumin samples (200 µL) spiked with the
analytes and ISs after the SPE procedure, dried under nitrogen and derivatized; the found
levels were compared with the nominal analyte concentration to calculate accuracy,
expressed as percent of the estimated concentration. The mean concentration should be
within 15% of the nominal values for the QC samples, except for the LOQ which should be
within 20% of the nominal value (Center for Drug Evaluation and Research (CDER)
Guidance for Industry: Bioanalytical Method Evaluation, 2001).
Carry-over
Carry-over effect was evaluated by injecting processed blank albumin samples after
analyses of calibration samples spiked at the upper limit of quantitation (150 ng/mL for
PS and 10 ng/mL for AP and PREG). For acceptance, carry-over in the blank samples
following the high concentration should not exceed 20% of the lower limit of quantitation
(Center for Drug Evaluation and Research (CDER) Guidance for Industry: Bioanalytical
Method Evaluation, 2001).
Matrix effect and recovery
Matrix effect (ME) and recovery values were calculated for each analyte at low, medium
and high concentrations. Matrix effect was determined by dividing the analyte peak area
in the post-spiked QC samples to the peak area in absence of matrix (peak area of the neat
standard at the same nominal concentration): 50 µL of the IS solution and 50 µL of the
working solutions, dried under nitrogen and derivatized with Amplifex Keto Reagent as
described. According to Matuszewski et al.,21 the matrix effect should be between 75%
and 125%. Recovery was determined by comparing the levels found in the QC samples
spiked before the sample processing with the levels found in the post-spiked QC samples,
i.e. with no nominal loss of the target analytes.
Method validation
The following parameters were evaluated according to the Center for Drug Evaluation
and Research (CDER) Guidance for Industry (Bioanalytical Method Evaluation, 2001):
calibration model, limit of detection (LOD), limit of quantification (LOQ), selectivity,
imprecision, accuracy, carry-over, matrix effects, and recovery.

66
Sample processing
Serum and CSF samples (200 µL) were spiked with 50 µL of the IS solution, vortexed (90
sec) and added with 1000 µL of acetonitrile/methanol (70/30; +1.0% formic acid). The
samples were then sonicated (10 min, 4 °C), centrifuged (15.000 rpm, 10 min, 10 °C), and
the supernatants were purified on Phree-SPE cartridges to remove endogenous
phospholipids. Eluates were evaporated (Concentrator Plus #5305, Eppendorf AG,
Hamburg, Germany) at 35 °C and derivatized with 50 µL of Amplifex Keto Reagent for one
hour at room temperature. Subsequently, samples were added with 150 µL
methanol/water (70/30), centrifuged (15.000 rpm, 10 min, 10 °C) and transferred in
autosampler vials for LC-MS/MS analysis. Injection volume: 10 µL.
Patients
We retrospectively considered records of patients admitted with SE between January
2007 and August 2015, who received lumbar puncture at SE onset or during SE (Table
S1). Serum and CSF samples were extracted from our CSF bank by considering patients
for which the clinical information and electroencephalography (EEG) were diagnostic for
SE. SE was defined as ongoing seizures, or repetitive seizures without intercurrent
normalization of consciousness or return to baseline for at least 30 min.
The treatment protocol for SE was similar in all the patients and followed the guidelines
of the Italian League Against Epilepsy.11 If seizures persisted after antiepileptic drug
treatment, the SE was considered refractory or super-refractory and patients were
treated with one or multiple third-line agents.12 Serum and CSF samples were
simultaneously acquired from a few hours after admission to a maximum of 20 days
(median of four days).
The SE group was compared with patients that underwent a lumbar puncture for
suspected idiopathic intracranial hypertension, CNS infection, or inflammatory disease
between 2007 and 2015. Fifty subjects that had negative results at the end of the
diagnostic work-up were considered as non-epileptic control population. Nine patients
were excluded from this initial group due to pathological findings in CSF parameters (high
intracranial pressure, high cell counts, and positivity for oligo-clonal bands). The final
control group consisted of 41 subjects, all proved to be healthy people (Table S2). The
mean age was 45.6 years (range 16-80), 28 were female (68%).

67
The health service (AUSL-Modena) Institutional Review Board approved the research
protocol according to local regulations in accordance with the current revision of the
Helsinki Declaration, and informed written consent was obtained from patients or their
relatives.
68
Table S1. Demographic and clinical features of the patients with status epilepticus (SE). Each patient had a head CT and/or brain MRI at hospital admission or within 24 hours. All included subjects had EEG monitoring of variable duration confirming SE diagnosis.
All (41)
n (%)
Female gender 26 63%
Mean age, years (range) 55.8 (11-79)
Previous history of epilepsy° 1 2%
Electroclinical classification
NCSE 10 24%
GCSE 4 10%
MSE 3 7%
PCSE 24 59%
Etiology Classification*
Acute Symptomatic 20 49%
Progressive Symptomatic 5 12%
Remote Symptomatic 8 20%
Idiopathic 1 2%
Cryptogenic/de novo 7 17%
AED Treatment
First line: Benzodiazepines 41 100%
Second line: Phenytoin 19 47%
Second line: Valproate 22 53%
Second line: Levetiracetam** 14 34%
Second line: Lacosamide** 4 10%
Third line agents/ICU 18 44%
Resolution 23 56%
Refractory SE (RSE) 18 44%
Return To Baseline Conditions 23 56%
30 days mRS ≥ 3 15 36%
30 days mortality 6 15%
Development of epilepsy*** 27 66%

69
Table legend. NCSE: non convulsive status epilepticus; GCSE: generalized convulsive status epilepticus; MSE: myoclonic status epilepticus; PCSE: partial complex status epilepticus. ICU: intensive care unit; SE: status epilepticus; RSE: refractory status epilepticus. °None of the patients was on AED chronic therapy. *No case with anoxic etiology was included. **As polytherapy with valproate or phenytoin. ***Defined as the occurrence of at least one unprovoked epileptic seizure not earlier than four weeks after termination of SE.
Table S2. Demographic and clinical features of the control group. Each patient had a head CT and/or brain MRI.
All (41)
n (%)
Female gender 28 68%
Male gender
Mean age, years (range)
13
45.6
32%
(16-80)
Previous history of epilepsy° 0 0%
Reason for CSF tap
Headache 13 32%
Acute confusion 9 22%
Suspected idiopathic intracranial
hypertension 10 24%
Suspected normal pressure
hydrocephalus 1 2.5%
Suspected optic neuritis
Loss of consciousness
1
3
2.5%
7.3%
Suspected CSF hypotension 4 9.7%
All these patients had normal CSF parameters (glucose; proteins; cell counts; no oligo-clonal bands). The final diagnostic work up excluded a neurological disorder in each subject.
Statistics
Data were compared using the Fisher’s exact test or the Mann-Whitney test (Sigmaplot
11, Systat Software, San Jose, CA). Results are presented as median and interquartile
range (IQR), and they were regarded significantly different at p < 0.05.

70
RESULTS
Steroids were derivatized as indicated in Fig. S1,13 and calibration curves were obtained
for each analyte (Fig. S2). Elution ensured the complete separation of PREG and AP and
prevented any interference with other analytes (Fig. S3). Multiple reaction monitoring
(MRM) ratios (Table S3) confirmed that interference from the biological matrix was
prevented (Fig. S4). Our method was validated (Tables S4 and S5) and allowed an
accurate and precise detection of AP, PREG, and PS. Each analyte level was determined via
regression curve of the area ratios of the analyte to the corresponding IS.
FIGURE S1
Chemical structures of the selected neurosteroids as quaternary aminooxy (QAO)
derivatives. O-(3-trimethylammonium-propyl) hydroxylamine) bromide, commercially available as AmplifexTM Keto reagent, was used for derivatization. The QAO-derivatization at C-20 position leads to the formation of both cis- and trans-isomers, with the trans-isomer accounting for approximately 95% of the total derivatization products, since the formation of the cis-isomer would be unfavorable because of steric hindrance.13 PS: pregnenolone sulfate; AP: allopregnanolone; PREG: pregnanolone.

71
FIGURE S2
Calibration curves for quantification of pregnenolone sulfate, pregnanolone and
allopregnanolone. Ratios were obtained by normalizing peak-area of the analyte quantifier transition with that of the corresponding internal standard (PS-D4 for pregnenolone sulfate, and AP-D4 for allopregnanolone and pregnanolone).
FIGURE S3
Representative MRM chromatogram of a calibration sample showing the monitored
transitions for the selected neurosteroids as QAO-derivatives. The quantifier transitions are marked with an asterisk. The quantifier MRM transition of QAO-PS showed a 13-fold sensitivity enhancement compared to that of underivatized PS at the same concentration; in this case the derivative was analyzed in the positive mode and the underivatized analyte in the negative mode, due to its poor ESI ionization. The QAO-derivatization led to a marked sensitivity enhancement (≥ 40-fold) also for the quantifier transition of AP and PREG. For the deuterated internal standards (ISs) we monitored the same transitions of the target analytes with m/z values shifted to the corresponding mass values. The LC-MS/MS conditions were optimized by analyzing standard solutions and also spiked blank albumin extracts. This sample was also spiked with epiAP and epiPREG.

72
As the four reduced progesterone metabolites (AP, PREG, epiAP and epiPREG) have common precursor ion and MRM transitions, therefore a satisfactory chromatographic resolution is required for their accurate quantification. PS: pregnenolone sulfate (1.5 ng/mL); AP: allopregnanolone (0.1 ng/mL); PREG: pregnanolone (0.1 ng/mL). The sample was also spiked with epiallopregnanolone (epiAP) and epipregnanolone (epiPREG), both at 0.05 ng/mL.
FIGURE S4
Representative MRM chromatogram showing the QAO-neurosteroids in serum of a control subject. The quantifier transitions are marked with an asterisk. To test the best solvent system for protein precipitation, human albumin aliquots (200 µL) were spiked with known amount of the target analytes, vortexed, and added with 1.0 mL of: pure ACN, pure MeOH and ACN/MeOH in different ratios (70/30, 50/50 and 30/70). All the mentioned solvents (and mixtures) were added with 1.0% formic acid, in order to comply with the requirements of the chosen SPE stationary phase. The obtained samples were processed and derivatized as described above. Best results in terms of recovery were achieved using ACN/MeOH (70/30; +1.0% formic acid); the procedure led to satisfactory results in terms of signal response and retention time reproducibility, confirming the adequate phospholipid removal. PS: pregnenolone sulfate, AP: allopregnanolone, PREG: pregnanolone.
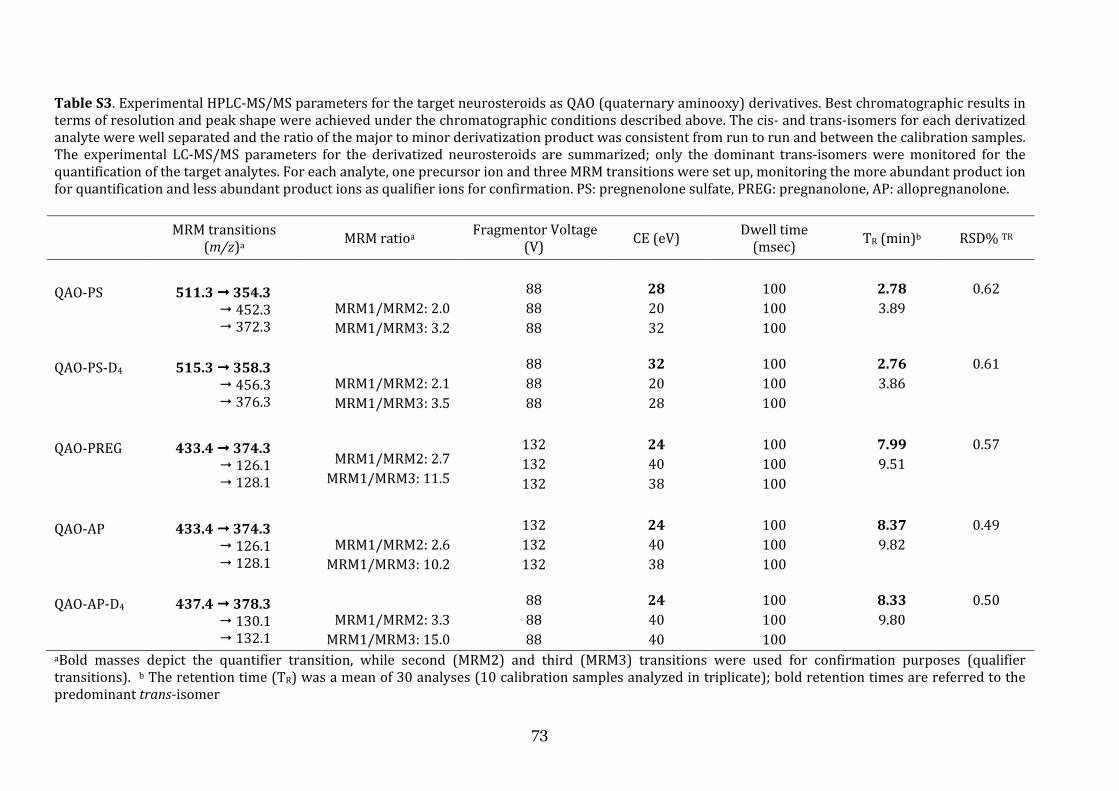
73
Table S3. Experimental HPLC-MS/MS parameters for the target neurosteroids as QAO (quaternary aminooxy) derivatives. Best chromatographic results in terms of resolution and peak shape were achieved under the chromatographic conditions described above. The cis- and trans-isomers for each derivatized analyte were well separated and the ratio of the major to minor derivatization product was consistent from run to run and between the calibration samples. The experimental LC-MS/MS parameters for the derivatized neurosteroids are summarized; only the dominant trans-isomers were monitored for the quantification of the target analytes. For each analyte, one precursor ion and three MRM transitions were set up, monitoring the more abundant product ion for quantification and less abundant product ions as qualifier ions for confirmation. PS: pregnenolone sulfate, PREG: pregnanolone, AP: allopregnanolone.
MRM transitions
(m/z)a MRM ratioa Fragmentor Voltage (V) CE (eV) Dwell time
(msec) TR (min)b RSD% TR
QAO-PS
511.3 !!!! 354.3
! 452.3 ! 372.3
MRM1/MRM2: 2.0 MRM1/MRM3: 3.2
88 88 88
28
20 32
100 100 100
2.78
3.89
0.62
QAO-PS-D4
515.3 !!!! 358.3
! 456.3 ! 376.3
MRM1/MRM2: 2.1 MRM1/MRM3: 3.5
88 88 88
32
20 28
100 100 100
2.76
3.86
0.61
QAO-PREG
433.4 !!!! 374.3
! 126.1 ! 128.1
MRM1/MRM2: 2.7
MRM1/MRM3: 11.5
132 132 132
24
40 38
100 100 100
7.99
9.51
0.57
QAO-AP
433.4 !!!! 374.3
! 126.1 ! 128.1
MRM1/MRM2: 2.6
MRM1/MRM3: 10.2
132 132 132
24
40 38
100 100 100
8.37
9.82
0.49
QAO-AP-D4
437.4 !!!! 378.3
! 130.1 ! 132.1
MRM1/MRM2: 3.3
MRM1/MRM3: 15.0
88 88 88
24
40 40
100 100 100
8.33
9.80
0.50
aBold masses depict the quantifier transition, while second (MRM2) and third (MRM3) transitions were used for confirmation purposes (qualifier transitions). b The retention time (TR) was a mean of 30 analyses (10 calibration samples analyzed in triplicate); bold retention times are referred to the predominant trans-isomer

74
Table S4. Calibration curve parameters for the derivatized neurosteroids (as QAO derivatives). Calibration range: 0.15 − 150 ng/mL for PS; 0.01 − 10 ng/mL for AP and PREG. Linearity was adequate in the range 0.15-150 ng/ml for PS and 0.01-10 ng/mL for AP and PREG, with correlation coefficient values (r2) of at least 0.994. The LOQ values were 10 pg/mL for PS and 5 pg/mL for AP and PREG, confirming the satisfactory sensitivity of the developed procedure. The LOQ values fulfilled the usually acceptance criteria, being the corresponding deviation from the expected concentration (% accuracy) less than 20%. Monitoring the MRM transitions shown in Table S2, no co-eluting peaks >20% of the analyte peak area at the LOQ level, and no co-eluting peaks >5% of the internal standard peak area were observed in albumin samples; therefore the developed procedure was found to be selective for the target analytes. PS: pregnenolone sulfate, PREG: pregnanolone, AP: allopregnanolone.
Slope (± SD) Intercept (± SD) r2 LOD
(pg/mL) LOQ
(pg/mL)
QAO-PS 0.228 (± 0.006) + 0.041 (± 0.012) 0.994 3 10
QAO-PREG 0.381 (± 0.004) + 0.008 (± 0.001) 0.998 1.5 5
QAO-AP 0.379 (± 0.013) + 0.014 (± 0.001) 0.996 1.5 5
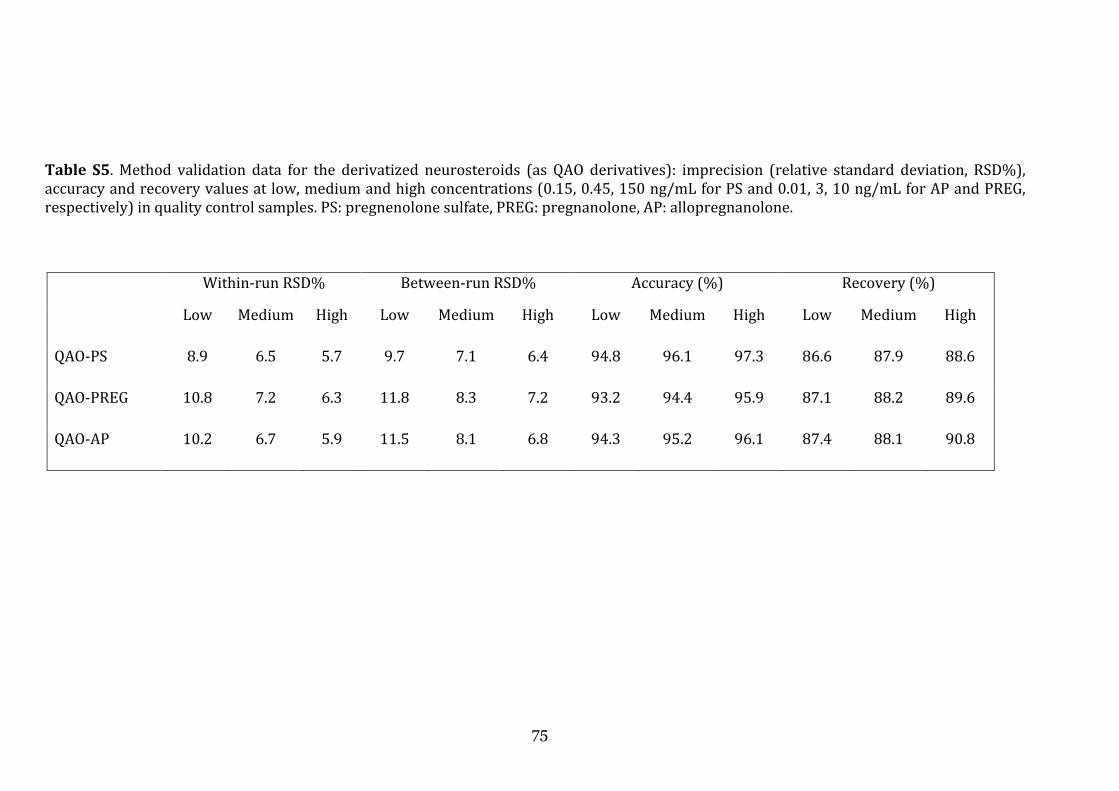
75
Table S5. Method validation data for the derivatized neurosteroids (as QAO derivatives): imprecision (relative standard deviation, RSD%), accuracy and recovery values at low, medium and high concentrations (0.15, 0.45, 150 ng/mL for PS and 0.01, 3, 10 ng/mL for AP and PREG, respectively) in quality control samples. PS: pregnenolone sulfate, PREG: pregnanolone, AP: allopregnanolone.
Within-run RSD% Between-run RSD% Accuracy (%) Recovery (%)
Low Medium High Low Medium High Low Medium High Low Medium High
QAO-PS 8.9 6.5 5.7 9.7 7.1 6.4 94.8 96.1 97.3 86.6 87.9 88.6
QAO-PREG 10.8 7.2 6.3 11.8 8.3 7.2 93.2 94.4 95.9 87.1 88.2 89.6
QAO-AP 10.2 6.7 5.9 11.5 8.1 6.8 94.3 95.2 96.1 87.4 88.1 90.8

In CSF obtained from both patients affected by SE and controls, AP was clearly
detectable in most but not all samples (Fig. 1). Specifically, AP was below the limit of
quantification in 15 out of 40 controls (one sample was missing), and in 28 out of 41
pa
excluding subjects in which the analyte was undetectable, and found significantly lower
levels (
difference was unaffected by excluding outliers from controls. At variance, AP was
detectable in all serum samples, but no difference was found by comparing patients
affected by SE with controls (Fig. 1B).
FIGURE 1
In CSF obtained from both patients affected by SE and controls, AP was clearly
detectable in most but not all samples (Fig. 1). Specifically, AP was below the limit of
quantification in 15 out of 40 controls (one sample was missing), and in 28 out of 41
patients affected by SE (p < 0.01, Fisher’s exact test). Then, we compared AP values by
excluding subjects in which the analyte was undetectable, and found significantly lower
levels (
difference was unaffected by excluding outliers from controls. At variance, AP was
detectable in all serum samples, but no difference was found by comparing patients
affected by SE with controls (Fig. 1B).
FIGURE 1
In CSF obtained from both patients affected by SE and controls, AP was clearly
detectable in most but not all samples (Fig. 1). Specifically, AP was below the limit of
quantification in 15 out of 40 controls (one sample was missing), and in 28 out of 41
tients affected by SE (p < 0.01, Fisher’s exact test). Then, we compared AP values by
excluding subjects in which the analyte was undetectable, and found significantly lower
levels (-30%; p < 0.05, Mann
difference was unaffected by excluding outliers from controls. At variance, AP was
detectable in all serum samples, but no difference was found by comparing patients
affected by SE with controls (Fig. 1B).
FIGURE 1
In CSF obtained from both patients affected by SE and controls, AP was clearly
detectable in most but not all samples (Fig. 1). Specifically, AP was below the limit of
quantification in 15 out of 40 controls (one sample was missing), and in 28 out of 41
tients affected by SE (p < 0.01, Fisher’s exact test). Then, we compared AP values by
excluding subjects in which the analyte was undetectable, and found significantly lower
30%; p < 0.05, Mann
difference was unaffected by excluding outliers from controls. At variance, AP was
detectable in all serum samples, but no difference was found by comparing patients
affected by SE with controls (Fig. 1B).
In CSF obtained from both patients affected by SE and controls, AP was clearly
detectable in most but not all samples (Fig. 1). Specifically, AP was below the limit of
quantification in 15 out of 40 controls (one sample was missing), and in 28 out of 41
tients affected by SE (p < 0.01, Fisher’s exact test). Then, we compared AP values by
excluding subjects in which the analyte was undetectable, and found significantly lower
30%; p < 0.05, Mann-
difference was unaffected by excluding outliers from controls. At variance, AP was
detectable in all serum samples, but no difference was found by comparing patients
affected by SE with controls (Fig. 1B).
In CSF obtained from both patients affected by SE and controls, AP was clearly
detectable in most but not all samples (Fig. 1). Specifically, AP was below the limit of
quantification in 15 out of 40 controls (one sample was missing), and in 28 out of 41
tients affected by SE (p < 0.01, Fisher’s exact test). Then, we compared AP values by
excluding subjects in which the analyte was undetectable, and found significantly lower
-Whitney test) in patients affected by SE (Fig. 1A). T
difference was unaffected by excluding outliers from controls. At variance, AP was
detectable in all serum samples, but no difference was found by comparing patients
affected by SE with controls (Fig. 1B).
In CSF obtained from both patients affected by SE and controls, AP was clearly
detectable in most but not all samples (Fig. 1). Specifically, AP was below the limit of
quantification in 15 out of 40 controls (one sample was missing), and in 28 out of 41
tients affected by SE (p < 0.01, Fisher’s exact test). Then, we compared AP values by
excluding subjects in which the analyte was undetectable, and found significantly lower
Whitney test) in patients affected by SE (Fig. 1A). T
difference was unaffected by excluding outliers from controls. At variance, AP was
detectable in all serum samples, but no difference was found by comparing patients
76
In CSF obtained from both patients affected by SE and controls, AP was clearly
detectable in most but not all samples (Fig. 1). Specifically, AP was below the limit of
quantification in 15 out of 40 controls (one sample was missing), and in 28 out of 41
tients affected by SE (p < 0.01, Fisher’s exact test). Then, we compared AP values by
excluding subjects in which the analyte was undetectable, and found significantly lower
Whitney test) in patients affected by SE (Fig. 1A). T
difference was unaffected by excluding outliers from controls. At variance, AP was
detectable in all serum samples, but no difference was found by comparing patients
In CSF obtained from both patients affected by SE and controls, AP was clearly
detectable in most but not all samples (Fig. 1). Specifically, AP was below the limit of
quantification in 15 out of 40 controls (one sample was missing), and in 28 out of 41
tients affected by SE (p < 0.01, Fisher’s exact test). Then, we compared AP values by
excluding subjects in which the analyte was undetectable, and found significantly lower
Whitney test) in patients affected by SE (Fig. 1A). This
difference was unaffected by excluding outliers from controls. At variance, AP was
detectable in all serum samples, but no difference was found by comparing patients
In CSF obtained from both patients affected by SE and controls, AP was clearly
detectable in most but not all samples (Fig. 1). Specifically, AP was below the limit of
quantification in 15 out of 40 controls (one sample was missing), and in 28 out of 41
tients affected by SE (p < 0.01, Fisher’s exact test). Then, we compared AP values by
excluding subjects in which the analyte was undetectable, and found significantly lower
his
difference was unaffected by excluding outliers from controls. At variance, AP was
detectable in all serum samples, but no difference was found by comparing patients
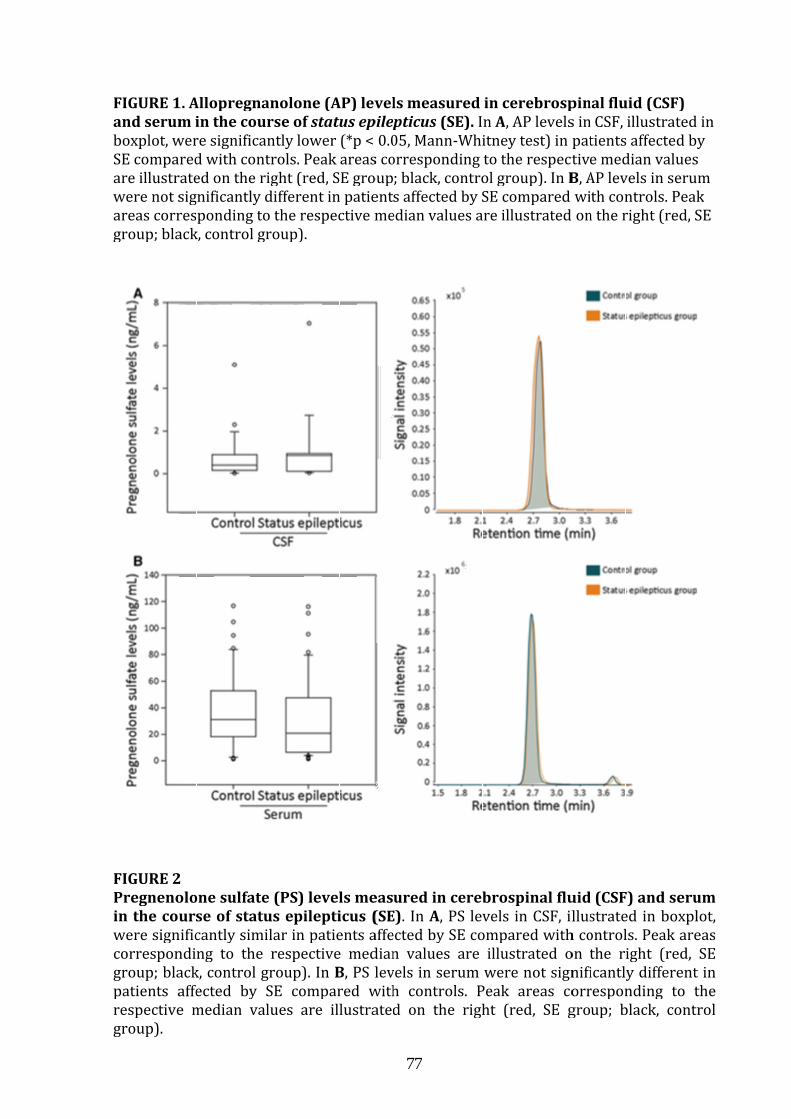
FIGURE 1.
and serum in the course of
boxplot, were significantly lower (*p < 0.05, MannSE comparare illustrated on the right (red, SE group; black, control group). In were not significantly different in patients affected by SE compared with controls. Peakareas corresponding to the respective median values are illustrated on the right (red, SE group; black, control group).
FIGURE 2
Pregnenolone sulfate (PS) levels measured in cerebrospinal fluid (CSF) and serum
in the course of status epilepticus (SE)
were significantly similar in patients affected by SE compared with controls. Peak areas corresponding to the respective median values are illustrated on the right (red, SE group; black, control group). In patients affected by SE compared with controls. Peak areas corresponding to the respective median values are illustrated on the right (red, group).
FIGURE 1. Allopregnanolone (AP) levels measured in cerebrospinal fluid (CSF)
and serum in the course of
boxplot, were significantly lower (*p < 0.05, MannSE compared with controls. Peak areas corresponding to the respective median values are illustrated on the right (red, SE group; black, control group). In were not significantly different in patients affected by SE compared with controls. Peakareas corresponding to the respective median values are illustrated on the right (red, SE group; black, control group).
FIGURE 2
Pregnenolone sulfate (PS) levels measured in cerebrospinal fluid (CSF) and serum
in the course of status epilepticus (SE)
were significantly similar in patients affected by SE compared with controls. Peak areas corresponding to the respective median values are illustrated on the right (red, SE group; black, control group). In patients affected by SE compared with controls. Peak areas corresponding to the respective median values are illustrated on the right (red,
Allopregnanolone (AP) levels measured in cerebrospinal fluid (CSF)
and serum in the course of
boxplot, were significantly lower (*p < 0.05, Manned with controls. Peak areas corresponding to the respective median values
are illustrated on the right (red, SE group; black, control group). In were not significantly different in patients affected by SE compared with controls. Peakareas corresponding to the respective median values are illustrated on the right (red, SE group; black, control group).
Pregnenolone sulfate (PS) levels measured in cerebrospinal fluid (CSF) and serum
in the course of status epilepticus (SE)
were significantly similar in patients affected by SE compared with controls. Peak areas corresponding to the respective median values are illustrated on the right (red, SE group; black, control group). In patients affected by SE compared with controls. Peak areas corresponding to the respective median values are illustrated on the right (red,
Allopregnanolone (AP) levels measured in cerebrospinal fluid (CSF)
and serum in the course of status epilepticusboxplot, were significantly lower (*p < 0.05, Mann
ed with controls. Peak areas corresponding to the respective median values are illustrated on the right (red, SE group; black, control group). In were not significantly different in patients affected by SE compared with controls. Peakareas corresponding to the respective median values are illustrated on the right (red, SE group; black, control group).
Pregnenolone sulfate (PS) levels measured in cerebrospinal fluid (CSF) and serum
in the course of status epilepticus (SE)
were significantly similar in patients affected by SE compared with controls. Peak areas corresponding to the respective median values are illustrated on the right (red, SE group; black, control group). In patients affected by SE compared with controls. Peak areas corresponding to the respective median values are illustrated on the right (red,
Allopregnanolone (AP) levels measured in cerebrospinal fluid (CSF)
status epilepticusboxplot, were significantly lower (*p < 0.05, Mann
ed with controls. Peak areas corresponding to the respective median values are illustrated on the right (red, SE group; black, control group). In were not significantly different in patients affected by SE compared with controls. Peakareas corresponding to the respective median values are illustrated on the right (red, SE
Pregnenolone sulfate (PS) levels measured in cerebrospinal fluid (CSF) and serum
in the course of status epilepticus (SE)
were significantly similar in patients affected by SE compared with controls. Peak areas corresponding to the respective median values are illustrated on the right (red, SE group; black, control group). In Bpatients affected by SE compared with controls. Peak areas corresponding to the respective median values are illustrated on the right (red,
Allopregnanolone (AP) levels measured in cerebrospinal fluid (CSF)
status epilepticusboxplot, were significantly lower (*p < 0.05, Mann
ed with controls. Peak areas corresponding to the respective median values are illustrated on the right (red, SE group; black, control group). In were not significantly different in patients affected by SE compared with controls. Peakareas corresponding to the respective median values are illustrated on the right (red, SE
Pregnenolone sulfate (PS) levels measured in cerebrospinal fluid (CSF) and serum
in the course of status epilepticus (SE)
were significantly similar in patients affected by SE compared with controls. Peak areas corresponding to the respective median values are illustrated on the right (red, SE
B, PS levels in serum were not significantly different in patients affected by SE compared with controls. Peak areas corresponding to the respective median values are illustrated on the right (red,
Allopregnanolone (AP) levels measured in cerebrospinal fluid (CSF)
status epilepticusboxplot, were significantly lower (*p < 0.05, Mann
ed with controls. Peak areas corresponding to the respective median values are illustrated on the right (red, SE group; black, control group). In were not significantly different in patients affected by SE compared with controls. Peakareas corresponding to the respective median values are illustrated on the right (red, SE
Pregnenolone sulfate (PS) levels measured in cerebrospinal fluid (CSF) and serum
in the course of status epilepticus (SE)
were significantly similar in patients affected by SE compared with controls. Peak areas corresponding to the respective median values are illustrated on the right (red, SE
, PS levels in serum were not significantly different in patients affected by SE compared with controls. Peak areas corresponding to the respective median values are illustrated on the right (red,
77
Allopregnanolone (AP) levels measured in cerebrospinal fluid (CSF)
status epilepticusboxplot, were significantly lower (*p < 0.05, Mann
ed with controls. Peak areas corresponding to the respective median values are illustrated on the right (red, SE group; black, control group). In were not significantly different in patients affected by SE compared with controls. Peakareas corresponding to the respective median values are illustrated on the right (red, SE
Pregnenolone sulfate (PS) levels measured in cerebrospinal fluid (CSF) and serum
in the course of status epilepticus (SE). In were significantly similar in patients affected by SE compared with controls. Peak areas corresponding to the respective median values are illustrated on the right (red, SE
, PS levels in serum were not significantly different in patients affected by SE compared with controls. Peak areas corresponding to the respective median values are illustrated on the right (red,
77
Allopregnanolone (AP) levels measured in cerebrospinal fluid (CSF)
status epilepticusboxplot, were significantly lower (*p < 0.05, Mann
ed with controls. Peak areas corresponding to the respective median values are illustrated on the right (red, SE group; black, control group). In were not significantly different in patients affected by SE compared with controls. Peakareas corresponding to the respective median values are illustrated on the right (red, SE
Pregnenolone sulfate (PS) levels measured in cerebrospinal fluid (CSF) and serum
In were significantly similar in patients affected by SE compared with controls. Peak areas corresponding to the respective median values are illustrated on the right (red, SE
, PS levels in serum were not significantly different in patients affected by SE compared with controls. Peak areas corresponding to the respective median values are illustrated on the right (red,
Allopregnanolone (AP) levels measured in cerebrospinal fluid (CSF)
status epilepticus (SE).
boxplot, were significantly lower (*p < 0.05, Manned with controls. Peak areas corresponding to the respective median values
are illustrated on the right (red, SE group; black, control group). In were not significantly different in patients affected by SE compared with controls. Peakareas corresponding to the respective median values are illustrated on the right (red, SE
Pregnenolone sulfate (PS) levels measured in cerebrospinal fluid (CSF) and serum
In A, PS levels in CSF, illustrated in boxplot, were significantly similar in patients affected by SE compared with controls. Peak areas corresponding to the respective median values are illustrated on the right (red, SE
, PS levels in serum were not significantly different in patients affected by SE compared with controls. Peak areas corresponding to the respective median values are illustrated on the right (red,
Allopregnanolone (AP) levels measured in cerebrospinal fluid (CSF)
(SE).
boxplot, were significantly lower (*p < 0.05, Mann-Whitney test) in patients affected by ed with controls. Peak areas corresponding to the respective median values
are illustrated on the right (red, SE group; black, control group). In were not significantly different in patients affected by SE compared with controls. Peakareas corresponding to the respective median values are illustrated on the right (red, SE
Pregnenolone sulfate (PS) levels measured in cerebrospinal fluid (CSF) and serum
, PS levels in CSF, illustrated in boxplot, were significantly similar in patients affected by SE compared with controls. Peak areas corresponding to the respective median values are illustrated on the right (red, SE
, PS levels in serum were not significantly different in patients affected by SE compared with controls. Peak areas corresponding to the respective median values are illustrated on the right (red,
Allopregnanolone (AP) levels measured in cerebrospinal fluid (CSF)
(SE). In Whitney test) in patients affected by
ed with controls. Peak areas corresponding to the respective median values are illustrated on the right (red, SE group; black, control group). In were not significantly different in patients affected by SE compared with controls. Peakareas corresponding to the respective median values are illustrated on the right (red, SE
Pregnenolone sulfate (PS) levels measured in cerebrospinal fluid (CSF) and serum
, PS levels in CSF, illustrated in boxplot, were significantly similar in patients affected by SE compared with controls. Peak areas corresponding to the respective median values are illustrated on the right (red, SE
, PS levels in serum were not significantly different in patients affected by SE compared with controls. Peak areas corresponding to the respective median values are illustrated on the right (red,
Allopregnanolone (AP) levels measured in cerebrospinal fluid (CSF)
In AWhitney test) in patients affected by
ed with controls. Peak areas corresponding to the respective median values are illustrated on the right (red, SE group; black, control group). In were not significantly different in patients affected by SE compared with controls. Peakareas corresponding to the respective median values are illustrated on the right (red, SE
Pregnenolone sulfate (PS) levels measured in cerebrospinal fluid (CSF) and serum
, PS levels in CSF, illustrated in boxplot, were significantly similar in patients affected by SE compared with controls. Peak areas corresponding to the respective median values are illustrated on the right (red, SE
, PS levels in serum were not significantly different in patients affected by SE compared with controls. Peak areas corresponding to the respective median values are illustrated on the right (red,
Allopregnanolone (AP) levels measured in cerebrospinal fluid (CSF)
A, AP levels in CSF, illustrated in Whitney test) in patients affected by
ed with controls. Peak areas corresponding to the respective median values are illustrated on the right (red, SE group; black, control group). In were not significantly different in patients affected by SE compared with controls. Peakareas corresponding to the respective median values are illustrated on the right (red, SE
Pregnenolone sulfate (PS) levels measured in cerebrospinal fluid (CSF) and serum
, PS levels in CSF, illustrated in boxplot, were significantly similar in patients affected by SE compared with controls. Peak areas corresponding to the respective median values are illustrated on the right (red, SE
, PS levels in serum were not significantly different in patients affected by SE compared with controls. Peak areas corresponding to the respective median values are illustrated on the right (red,
Allopregnanolone (AP) levels measured in cerebrospinal fluid (CSF)
, AP levels in CSF, illustrated in Whitney test) in patients affected by
ed with controls. Peak areas corresponding to the respective median values are illustrated on the right (red, SE group; black, control group). In were not significantly different in patients affected by SE compared with controls. Peakareas corresponding to the respective median values are illustrated on the right (red, SE
Pregnenolone sulfate (PS) levels measured in cerebrospinal fluid (CSF) and serum
, PS levels in CSF, illustrated in boxplot, were significantly similar in patients affected by SE compared with controls. Peak areas corresponding to the respective median values are illustrated on the right (red, SE
, PS levels in serum were not significantly different in patients affected by SE compared with controls. Peak areas corresponding to the respective median values are illustrated on the right (red, SE group; black, control
Allopregnanolone (AP) levels measured in cerebrospinal fluid (CSF)
, AP levels in CSF, illustrated in Whitney test) in patients affected by
ed with controls. Peak areas corresponding to the respective median values are illustrated on the right (red, SE group; black, control group). In Bwere not significantly different in patients affected by SE compared with controls. Peakareas corresponding to the respective median values are illustrated on the right (red, SE
Pregnenolone sulfate (PS) levels measured in cerebrospinal fluid (CSF) and serum
, PS levels in CSF, illustrated in boxplot, were significantly similar in patients affected by SE compared with controls. Peak areas corresponding to the respective median values are illustrated on the right (red, SE
, PS levels in serum were not significantly different in patients affected by SE compared with controls. Peak areas corresponding to the
SE group; black, control
Allopregnanolone (AP) levels measured in cerebrospinal fluid (CSF)
, AP levels in CSF, illustrated in Whitney test) in patients affected by
ed with controls. Peak areas corresponding to the respective median values B, AP levels in serum
were not significantly different in patients affected by SE compared with controls. Peakareas corresponding to the respective median values are illustrated on the right (red, SE
Pregnenolone sulfate (PS) levels measured in cerebrospinal fluid (CSF) and serum
, PS levels in CSF, illustrated in boxplot, were significantly similar in patients affected by SE compared with controls. Peak areas corresponding to the respective median values are illustrated on the right (red, SE
, PS levels in serum were not significantly different in patients affected by SE compared with controls. Peak areas corresponding to the
SE group; black, control
Allopregnanolone (AP) levels measured in cerebrospinal fluid (CSF)
, AP levels in CSF, illustrated in Whitney test) in patients affected by
ed with controls. Peak areas corresponding to the respective median values , AP levels in serum
were not significantly different in patients affected by SE compared with controls. Peakareas corresponding to the respective median values are illustrated on the right (red, SE
Pregnenolone sulfate (PS) levels measured in cerebrospinal fluid (CSF) and serum
, PS levels in CSF, illustrated in boxplot, were significantly similar in patients affected by SE compared with controls. Peak areas corresponding to the respective median values are illustrated on the right (red, SE
, PS levels in serum were not significantly different in patients affected by SE compared with controls. Peak areas corresponding to the
SE group; black, control
, AP levels in CSF, illustrated in Whitney test) in patients affected by
ed with controls. Peak areas corresponding to the respective median values , AP levels in serum
were not significantly different in patients affected by SE compared with controls. Peak areas corresponding to the respective median values are illustrated on the right (red, SE
Pregnenolone sulfate (PS) levels measured in cerebrospinal fluid (CSF) and serum
, PS levels in CSF, illustrated in boxplot, were significantly similar in patients affected by SE compared with controls. Peak areas corresponding to the respective median values are illustrated on the right (red, SE
, PS levels in serum were not significantly different in patients affected by SE compared with controls. Peak areas corresponding to the
SE group; black, control
, AP levels in CSF, illustrated in
Pregnenolone sulfate (PS) levels measured in cerebrospinal fluid (CSF) and serum
, PS levels in CSF, illustrated in boxplot, were significantly similar in patients affected by SE compared with controls. Peak areas corresponding to the respective median values are illustrated on the right (red, SE
, PS levels in serum were not significantly different in patients affected by SE compared with controls. Peak areas corresponding to the
SE group; black, control

78
Changes similar to those found for AP were demonstrated also for PREG (not shown).
Specifically, PREG was measured in CSF of 32 controls (0.022 ng/mL, IQR 0.016 to
0.025) and 34 patients (0.018 ng/mL, IQR 0.014 to 0.020; p < 0.05). No differences were
instead found for serum levels (controls: 0.030 ng/mL, IQR 0.018 to 0.064; patients:
0.028 ng/mL, IQR 0.018 to 0.063).
Peaks corresponding to PS were detected in all sera, whereas 34 out of 41 patients
affected by SE and 36 out of 40 controls presented detectable PS in CSF. As shown in Fig.
2A, PS levels were not significantly different in CSF. Similarly, quantification of PS in
serum of both groups did not reveal significant differences (Fig. 2B).
Finally, we considered the possibility that the alterations found in AP and PREG levels
could be explained by CSF albumin content or, additionally, could be influenced by sex
differences. However, albumin was present at similar concentration in CFS of both
groups (SE patients: 19.1 mg/dL, interquartile range 12.8 to 25.1; controls: 17.9 mg/dL,
interquartile range, 11.2 to 22.7), and similar levels were observed for all analytes in
both males and females of controls (Table S6) and patients (Table S7).
Table S6. Allopregnanolone (AP), pregnanolone (PREG), and pregnenolone sulfate (PS) levels measured in cerebrospinal fluid (CSF) and serum of male and female control subjects. Data are reported as median and interquartile range. No significant differences were found.
CSF SERUM
Male Female Male Female
AP
0.029 (0.018-0.049)
0.029 (0.017-0.041)
0.062 (0.033-0.105)
0.082 (0.036-0.185)
PREG 0.023
(0.017-0.026) 0.021
(0.015-0.024) 0.031
(0.017-0.064) 0.029
(0.021-0.065)
PS 1.379
(0.465-1.965) 0.626
(0.329-1.205) 62.220
(27.480-102.655) 40.930
(24.050-68.805)

79
Table S7. Allopregnanolone (AP), pregnanolone (PREG), and pregnenolone sulfate (PS) levels measured in cerebrospinal fluid (CSF) and serum of male and female patients affected by SE. Data are reported as median and interquartile range. No significant differences were found.
CSF SERUM
Male Female Male Female
AP 0.020
(0.131-0.031) 0.020
(0.015-0.026) 0.039
(0.022-0.056) 0.037
(0.025-0.079)
PREG 0.018
(0.015-0.020) 0.017
(0.014-0.020) 0.018
(0.015-0.06) 0.036
(0.021-0.062)
PS 0.626
(0.297-1.228) 0.481
(0.270-1.260) 43.015
(16.23-108.59) 24.160
(6.855-55.350)
DISCUSSION
We evaluated AP, PREG and PS in CSF of patients affected by SE using a modified LC-MS/MS
approach. Major achievements of this investigation were (i) the possibility to separate and
quantify AP and PREG, and (ii) the observed significant reduction in CSF but not in serum
of these steroids, in presence of (iii) stable levels of PS. These results suggest that synthesis
of endogenous anticonvulsants such AP and PREG is defective or that, alternatively, their
catabolism is enhanced in patients in which seizures evolved into SE. Moreover, reduction
in their levels may result in enhanced modulation by proconvulsant steroids such as PS.
The possibility to characterize the role of neuroactive steroids in humans and animal
models has been hampered by technical limitations, of which the “matrix effect” is the most
important for LC-MS/MS.14 Here we show that it is possible to overcome this specific
problem by increasing the efficiency of phospholipid removal.7 By this strategy we
obtained a specific identification and quantification of AP, PREG and PS in human CSF and
serum samples, leading to the observation of the selective reduction in CSF AP and PREG
levels. As no other data are available on these steroids in SE, we cannot exclude that the
observed changes might have preceded the SE. The few available studies on peripheral AP
in epileptic patients suggest the presence of reduced interictal levels15 and biphasic
changes following a seizure.6 However, almost all of our patients were seizure-free before
to develop the SE.
Indeed, the role of AP has been investigated both in animal models and humans and
inhibition of 5α-reductase by finasteride consistently resulted in increased epileptic

80
activity.2,4,6,15 No information is instead available for 5β-reductase, which synthesizes
PREG. Thus, it is possible that a reduced activity of 5α-reductase in SE could be responsible
for lower AP availability in CSF. However, we found that also PREG was affected in a similar
manner, suggesting that 5β-reductase and maybe other enzymes could be dysregulated in
SE. Alternatively, a reduced availability of a common substrate of these enzymes, such as
progesterone, may be the reason for the reduced availability of AP and PREG in SE. In such
a case, restorative therapies could be taken into account.
Because of their lipophilic nature, steroids require a carrier to be solubilized in CSF. For
this reason, we hypothesized that changes in CSF albumin could explain the differences
observed in AP and PREG levels. However, albumin levels were similar in both groups of
patients, suggesting that AP was less available under SE. Additionally, no differences were
found for the proconvulsant neurosteroid PS, for which the number of available samples
was similar to that of PREG, so that we exclude that differences in albumin or other carriers
could have affected our results.
In conclusion, an important consequence of our study is that AP and PREG reduction may
contribute to the epileptic activity observed in SE. In such a case, to reestablish levels of
these steroids may be an important therapeutic target in patients affected by SE. Indeed,
the limited, but encouraging evidence obtained in pediatric patients treated with AP to stop
super-refractory SE is in agreement with this hypothesis.10
References
1 . Mellon SH, Griffin LD. Neurosteroids: biochemistry and clinical significance. Trends Endocrinol Metab 2002; 13: 35-43.
2 . Biagini G, Panuccio G, Avoli M. Neurosteroids and epilepsy. Curr Opin Neurol 2010; 23: 170-176.
3 . Belelli D, Lambert JJ. Neurosteroids: endogenous regulators of the GABAA receptor. Nat Rev Neurosci 2005; 6: 565-575.
4 . Kaminski RM, Livingood MR, Rogawski MA. Allopregnanolone analogs that positively modulate GABA receptors protect against partial seizures induced by 6-Hz electrical stimulation in mice. Epilepsia 2004; 45: 864-867.
5 . Kokate TG, Juhng KN, Kirkby RD, et al. Convulsant actions of the neurosteroid pregnenolone sulfate in mice. Brain Res 1999; 831: 119-124.
6 . Galli R, Luisi M, Pizzanelli C, et al. Circulating levels of allopregnanolone, an anticonvulsant metabolite of progesterone, in women with partial epilepsy in the postcritical phase. Epilepsia 2001; 42: 216-219.
81
7 . Smith CC, Gibbs TT, Farb DH. Pregnenolone sulfate as a modulator of synaptic plasticity. Psychopharmacology 2014; 231: 3537-3556.
8 . Rustichelli C, Pinetti D, Lucchi C, et al. Simultaneous determination of pregnenolone sulphate, dehydroepiandrosterone and allopregnanolone in rat brain areas by liquid chromatography-electrospray tandem mass spectrometry. J Chromatogr B Analyt Technol Biomed Life Sci 2013; 930: 62-69.
9 . Rogawski MA, Loya CM, Reddy K, et al. Neuroactive steroids for the treatment of status epilepticus. Epilepsia 2013; 54(suppl. 6): 93-98.
10. Broomall E, Natale JE, Grimason M, et al. Pediatric super-refractory status epilepticus treated with allopregnanolone. Ann Neurol 2014; 76: 911-915.
11. Minicucci F, Muscas G, Perucca E, et al. Treatment of status epilepticus in adults: guidelines of the Italian League against Epilepsy. Epilepsia 2006; 47(suppl. 5): 9-15.
12. Ferlisi M, Shorvon S. The outcome of therapies in refractory and super-refractory convulsive status epilepticus and recommendations for therapy. Brain 2012; 135: 2314–2328.
13. Jin W, Jarvis M, Star-Weinstock M, et al. A sensitive and selective LC-differential mobility-mass spectrometric analysis of allopregnanolone in human plasma. Anal Bioanal Chem 2013; 405: 9497-9508.
14. Taylor PJ. Matrix effect: the Achilles heel of quantitative high-performance liquid chromatography-electrospray-tandem mass spectrometry. Clin Biochem 2005; 38: 328-334.
15. Stoffel-Wagner B, Watzka M, Steckelbroeck S, et al. Allopregnanolone serum levels and expression of 5a-reductase and 3a-hydroxysteroid dehydrogenase isoforms in hippocampal and temporal cortex of patients with epilepsy. Epilepsy Res 2003; 54: 11–19.

82
C. Discussion & perspective
In addition to these published data, we evaluate also the possible influence of age on
neurosteroids. We found that:
- Patients group has a median age slightly higher than controls.
- We found that age didn’t influence serum and CSF values of AP and PS. Analysis in the
control group confirm the data in the entire sample.
0
50
100
150
200
0 50 100
ng
/ml
età
pregnenolone-s siero
0,0
0,2
0,4
0,6
0,8
1,0
1,2
0 50 100
ng
/ml
età
pregnenolone-s CSF
0,00
0,10
0,20
0,30
0,40
0,50
0 50 100
ng
/ml
età
allopregnenolone siero
0,00
0,02
0,04
0,06
0,08
0,10
0,12
0,14
0 50 100
ng
/ml
età
allopregnenolone CSF

83
- Timing of lumbar puncture didn’t influence the neurosteroids values, nor in serum nor
in CSF. Limits are due to the small sample, in particular for CSF in which AP and PS are
detected often with under threshold values.
0
20
40
60
80
100
120
140
160
180
0 5 10 15 20 25
ng
/m
l
delta SE-PL (giorni)
Pregnenolone-s siero
0,00
0,20
0,40
0,60
0,80
1,00
1,20
0 5 10 15 20 25
ng
/m
l
delta SE-PL (giorni)
Pregnenolone-s CSF

84
In conclusion, we need to increase the number of patients and controls that undergo to
simultaneous detection of serum and CSF to confirm our hypothesis on AP role in status
epilepticus.
0,00
0,05
0,10
0,15
0,20
0,25
0,30
0,35
0,40
0,45
0,50
0 5 10 15 20 25
ng
/m
l
delta SE-PL (giorni)
Allopregnenolone siero
0,00
0,02
0,04
0,06
0,08
0,10
0,12
0 5 10 15 20 25
ng
/m
l
delta SE-PL (giorni)
Allopregnenolone CSF

85
2.3 MRI FINDING AS POTENTIAL BIOMARKER IN STATUS EPILEPTICUS:
THE ROLE OF CLAUSTRUM
A. Motivation
SE causes energy failure of the Na/K ATPase pump, which in turn causes sodium and
water influx leading to cellular swelling (cytotoxic edema). Excessive release of
excitatory amino acids such as glutamate and increased membrane ion permeability are
postulated as other mechanisms that cause cytotoxic edema. The resultant cytotoxic
edema is evident on imaging in various parts of the brain and is usually associated with
mild mass effect.
Transient focal hyperintensity on diffusion-weighted MR images (DWI) with
corresponding reduction of the apparent diffusion coefficient (ADC) is an increasingly
recognized phenomenon in the peri-ictal phase of epileptic seizures. It has been
described in experimental models of epilepsy as well as in patients, especially in
association with prolonged seizures or status epilepticus (SE)1,2,3. These DWI alterations
are thought to be associated with increased energy metabolism and hyper-perfusion, so
DWI can be useful to locate the epileptogenic focus4,5. DWI seems to visualize
pathophysiological aspects early after onset of seizure activity such as source of ictal
activity, of seizure propagation and mechanisms of chronic tissue damage.
Principal MRI abnormalities were found in the focal cortex, hippocampus, thalamus, and
splenium in focal SE patients3,4,6,7,8,9,10,11,12; in the generalized convulsive SE (GCSE)
patients, these MRI abnormalities were usually widespread across the cortical areas and
thalamus, accompanied with crossed cerebellar diaschisis sometimes13,14,15. These MRI
changes were often reversible but in severe or prolonged seizures can become
irreversible and lead to permanent brain damage such as brain atrophy, laminar
necrosis, or medial temporal sclerosis.
In some cases of refractory SE, abnormal lesions were observed in the putamen, globus
pallidus, and caudate nucleus. Although some speculate that the basal ganglia are a part
of the modulatory control system in epileptic seizure16, the exact mechanism behind the
MRI changes in the basal ganglia is still not clear17. Moreover, Cianfoni et al. described
that the presence of brain abnormalities on the MRI study obtained after a single seizure
or epileptic status, is generally considered as the origin, the cause of epilepsy;
nevertheless, MRI changes may be sometimes its consequence18.
86
In literature, several papers described post-ictal MRI changes in patients with status
epilepticus and some brain regions seem to be “typical” findings related to the seizures
activity. Most of the authors try to explain the wide spectrum of seizure induced MRI
abnormalities as a pure consequence of the repeated seizures. They did not consider
that all those patterns were probably associated to an equally wide spectrum of
undiagnosed, obscure underlying conditions19.
Recently, the same author published a bibliographic search to address the quality of
evidence in clinical reports supporting the assertion that brain MRI signal abnormalities
are a direct consequence of seizures20. The search resulted in 91 publications
corresponding to 413 cases. There was a wide range of clinical features and EEG and
MRI abnormalities. Premorbid or comorbid conditions were present in many cases, and
some of them are potential causes of MRI changes. Claimed evidence for MRI signal
abnormalities as a direct consequence of ictal activity was mostly based on the similarity
with previous reports, animal models, reversibility, congruent EEG, MRI changes not
respecting vascular territories, and ruling out other etiologies. So, the author concluded
that evidence supporting the notion of seizure-induced excitotoxicity is questionable in
the studied reports of postictal MRI abnormalities.
This point of view stimulates the search for new etiologies in the context of de novo
refractory SE. Especially, some MRI pattern could become the radiological marker of
specific pathological entities. In this direction goes our research on patients with an
acute de novo refractory status epilepticus, started after a febrile illness, that develop
reversible, isolated, bilateral claustrum hyperintesity after few days from seizures onset.
References
1. Gyngell ML, Back T, Hoehn-Berlage M, Kohno K, Hossmann KA. Transient cell depolarization after permanent middle cerebral artery occlusion: an observation by diffusion-weighted MRI and localized 1H-MRS. Magn Reson Med 1994; 31: 337–41. 2. Zhong J, Petroff OA, Prichard JW, Gore JC. Barbiturate-reversible reduction of water diffusion coefficient in flurothyl-induced status epilepticus in rats. Magn Reson Med 1995; 33: 253–6.
3. Szabo, K., Poepel, A., Pohlmann-Eden, B., Hirsch, J., Back, T., Sed- laczek, O., Hennerici, M., Gass, A., 2005. Diffusion-weighted and perfusion MRI demonstrates parenchymal changes in complex partial status epilepticus. Brain 128, 1369—1376.
4. Chu, K., Kang, D.W., Kim, J.Y., Chang, K.H., Lee, S.K., 2001. Diffusion-weighted magnetic resonance imaging in nonconvul- sive status epilepticus. Arch. Neurol. 58, 993—998.
87
5. Engelhorn, T., Hufnagel, A., Weise, J., Baehr, M., Doerfler, A., 2007. Monitoring of acute generalized status epilepticus using multi- local diffusion MR imaging: early prediction of regional neuronal damage. AJNR Am. J. Neuroradiol. 28, 321—327.
6. Bauer, G., Gotwald, T., Dobesberger, J., Embacher, N., Felber, S., Seppi, K., Walser, G., Trinka, E., Poewe, W., 2006. Transient and permanent magnetic resonance imaging abnormal- ities after complex partial status epilepticus. Epilepsy Behav. 8, 666—671.
7. Buracchio, T., Lewis, S.L., Jhaveri, M., Bergen, D., 2008. Restricted diffusion on magnetic resonance imaging in partial status epilep- ticus. Arch. Neurol. 65, 278—279.
8. Doherty MJ, Jayadev S, Watson NF, Konchada RS, Hallam DK. Clinical implica- tions of splenium magnetic resonance imaging signal changes. Arch Neurol 2005;62:433–7.
9. Hormigo A, Liberato B, Lis E, DeAngelis LM. Nonconvulsive status epilepticus in �patients with cancer: imaging abnormalities. Arch Neurol 2004;61:362–5. �
10. Lansberg, M.G., O’Brien, M.W., Norbash, A.M., Morrell, M., Albers, G.W., 1999. MRI abnormalities associated with partial status epilepticus. Neurology 52, 1021—1027.
11. Oster J, Doherty C, Grant P. Diffusion-weighted imaging abnormalities in the splenium after seizures. Epilepsia 2003;44:852–4.
12. Toledo, M., Munuera, J., Sueiras, M., Rovira, R., Alvarez-Sabin, J., Rovira, A., 2008. MRI findings in aphasic status epilepticus. Epilepsia 49, 1465—1469.
13. Men S, Lee DH, Barron JR, Munoz DG. Selective neuronal necrosis associated with status epilepticus: MR findings. AJNR Am J Neuroradiol 2000;21:1837–40. �
14. Nixon, J., Bateman, D., Moss, T., 2001. An MRI and neuropatho- logical study of a case of fatal status epilepticus. Seizure 10, 588—591.
15. Teixeira, R.A., Li, L.M., Santos, S.L., Zanardi, V.A., Guerreiro, C.A., Cendes, F., 2002. Crossed cerebellar atrophy in patients with precocious destructive brain insults. Arch. Neurol. 59, 843—847.
16. Dematteis, M., Kahane, P., Vercueil, L., Depaulis, A., 2003. MRI evi- dence for the involvement of basal ganglia in epileptic seizures: an hypothesis. Epileptic Disord. 5, 161—164.
17. Huang YC, Weng HH, Tsai YT, Huang YC, Hsiao MC, Wu CY, Hsu HL, Lee JD. Periictal magnetic resonance imaging in status epilepticus. Epilepsy Research (2009) 86, 72—81
18. Cianfoni A., Caulo M., Cerase A., Della Marca, Falcone C., Di Lella G.M., Gaudino S., Edwards J., Colosimo C. Seizure-induced brain lesions: A wide spectrum of variably reversible MRI abnormalities European Journal of Radiology 82 (2013) 1964–1972
19. Grillo E. Seizure-induced excitotoxicity: Just considering it could be a fallacy. European Journal of Radiology 82 (2013) e903–e904
20. Grillo Eugenio. Postictal MRI abnormalities and seizure-induced brain injury: Notions to be challenged. Epilepsy & Behavior 44 (2015) 195–199.
88
B. Study 3. CLAUSTRUM DAMAGE AND REFRACTORY STATUS
EPILEPTICUS FOLLOWING FEBRILE ILLNESS
Published on Neurology Sept 4 2015,
Stefano Meletti MD, PhD1,2, Jana Slonkova MD3, Iva Mareckova MD5, Giulia Monti MD1,2,
Nicola Specchio MD6, Petr Hon MD3, Giada Giovannini MD1,2, Vaclav Marcian MD3,
Annalisa Chiari MD2, Petr Krupa PhD, Doc4, Nicola Pietrafusa MD6, Dagmar Berankova
MD3, Michal Bar PhD, Doc3.
1 Department of Biomedical, Metabolic, and Neural Science, University of Modena and Reggio Emilia, Modena, Italy. 2 NOCSAE Hospital, ASL Modena, Italy. 3 Clinic of Neurology, University Hospital Ostrava, Czech Republic 4 Radiodiagnostic Institute University Hospital Ostrava, Czech Republic 5 Neurological Department of Na Homolce Hospital, Prague, Czech Republic 6 Division of Neurology, Bambino Gesù Children’s Hospital, IRCCS, Rome Italy
Key words: status epilepticus; myoclonus; MRI; fever; NORSE; FIRES; claustrum.
ABSTRACT
Objective: to characterize the clinical, EEG, and brain imaging findings in an adult case-
series of patients with de novo refractory status epilepticus (SE) occurring after a febrile
illness. Methods: a retrospective study (2010-2013) was undertaken with the following
inclusion criteria: (a) previously healthy adults with refractory SE; (b) seizures onset 0–
21 days after a febrile illness, and (c) lacking evidence of infectious agents in CSF; (d) no
previous history of seizures (febrile or afebrile), as well as previous or concomitant
neurological disorder. Results: among 155 refractory SE cases observed in the study
period, six (17 – 35 years-old) fulfilled the inclusion criteria. Confusion and stupor were
the most common symptoms at disease onset, followed after a few days by acute
repeated seizures that were uncountable in all but one. Seizures consisted of focal
motor/myoclonic phenomena with subsequent generalization. Anti-epileptic drugs
failed in every patient to control seizures, all subjects requiring intensive care unit
admission. Barbiturate-coma with burst-suppression pattern was applied in four out of
six patients for 5 – 14 days. One subject died in the acute phase. In each patient we
89
observed a reversible bilateral Claustrum MRI hyperintensity on T2 weighted
sequences, without restricted diffusion, time-related with SE. All patients had negative
multiple neural antibodies testing. Four out of five surviving patients developed chronic
epilepsy.
Conclusions: this is a hypothesis-generating study of a preliminary nature supporting
the role of the Claustrum in post-febrile de novo SE; future prospective studies are
needed to delineate the specificity of this condition, its pathogenesis, and the aetiology.
INTRODUCTION
In the last two decades several authors described a series of syndromes characterized
by the development of a difficult to treat status epilepticus (SE) in previously healthy
children after a febrile illness.1-7 The condition is characterized by a refractory status
epilepticus and followed by drug resistant epilepsy, with often severe neuropsychiatric
sequelae or death. These entities have been named with different acronyms but
probably FIRES (“febrile infection related epilepsy syndrome”) is the one that best
underscores the main features of the disorder.8 Cases with a similar clinical picture have
been described also in adults and in these case-series the most frequently used
definition is “new onset refractory status epilepticus” (NORSE).9-13 Recently, it has been
pointed out that probably different terms has been used to describe the same
condition.14-15 However, there is no consensus among investigators. Adult cases are
more heterogeneous, some with clear similarities with FIRES cases (with only the age at
onset as the main difference), while other representing probably different conditions.
We describe here a case-series and a literature review of young adults fulfilling the
definition of FIRES, all showing in the early acute phase of the disease a striking
alteration of the Claustrum on MRI, mainly bilaterally.
The Claustrum function has remained obscure for decades. In 1996 its involvement in a
case of de novo refractory status was reported for the first time.21 Only in recent years
the scientific community has gained a strong interest in the function of the Claustrum,
mainly with respect to its role in sensory integration and consciousness.16-20

90
METHODS
Patients and investigations
In a retrospective multicentric study (Gen 2010 – Dec 2013) information including
demographic data, clinical features, diagnostic findings, therapeutic interventions, and
clinical outcomes of patients fulfilling the following inclusion criteria were acquired: (a)
previously healthy adults (> 16 years of age) with refractory SE [failed intravenous
treatment with anti-epileptic drugs, requiring general anesthesia];22 (b) onset of
seizures 0–21 days after a febrile illness, and (c) lacking evidence of infectious agents in
CSF. Exclusion criteria were a previous history of seizures (febrile or afebrile), as well as
previous or concomitant neurological disorder. Data were extracted from the
participating centers reviewing clinical charts, EEG (video-EEG) recordings and MRI
imaging (when available). During the study period 155 cases of refractory SE were
observed. Among these, six fulfilled our inclusion criteria.
No family history for febrile seizures or epilepsy was reported. No one had personal and
familial history of immunological disorder.
All patients were examined for viral and bacterial infections. The following blood and
cerebrospinal fluid (CSF) analyses were performed: viral tests including HSV 1 and 2,
varicella-zoster virus, HHV 6, cytomegalovirus, Epstein–Barr virus, rubella, parvovirus
B19, enterovirus, and mumps. All virological studies were performed using DNA
polymerase chain reaction (PCR). The presence of oligoclonal IgG bands (OB) was
checked with isoelectro-focusing (IEF), performed with agarose gel support. Antinuclear
antibodies (ANA), anti-phospholipid antibodies, anti-DNA antibodies, anti-cardiolipin
antibodies, anti-extractable nuclear antigen antibodies (anti-ENA), anti-thyroid
antibodies were analyzed with immuno-enzymatic tests and indirect immuno-
fluorescent staining.
Thorax-abdomen computed tomography was performed in all patients showing no
occult neoplasm. An extensive blood analysis and testing of classical onco-neural
antibodies (anti-GAD, anti-Yo, Ri, Hu, anti-Ma2) was negative in all subjects.
Standard Protocol Approvals, Registrations, and Patient Consents
The scientific advisory boards of participating institutions approved the research
protocol according to local regulations and consent was obtained from patients or their
relatives. This research is reported following the STROBE guidelines.

91
Literature Review
Searches for identification of studies were run in from 1990 to 2014 in MEDLINE and
PubMed. Searches were limited from 1990 to the present day since studies carried out
previously would necessarily have included participants without MRI. The search
keywords were: “AERRPS”; “FIRES”; “NORSE”; “status epilepticus” AND “Claustrum”;
“epilepsy” AND “Claustrum”; “status epilepticus” AND “neuroimaging”. For each citation
considered, the abstract was read (when available). The bibliography of each of the
retrieved papers was examined to identify relevant references that could have been
missed by electronic search. Only peer-reviewed original articles providing images of
the Claustrum involvement were accepted for inclusion in the review.
RESULTS
Clinical data, interventions, and outcomes of the six patients are summarized in Table 1.
Age at onset was between 17 – 35 years; different ethnicities were represented. Fever,
in the context of a flu-like condition, preceded the onset of neurologic symptoms in all
patients. Confusion, stupor, sleepiness, and signs of consciousness alteration were the
most common symptoms at disease onset, followed after a few days by acute repeated
seizures that were uncountable in all but one patient. Seizures consisted in all subjects
in focal motor/myoclonic events with alternating side involvement and subsequent
generalization. In patients # 1 a dramatic generalized myoclonus was present through
the entire acute phase of the disease. Anti-epileptic drugs (AED) failed in every patient
to control seizures, all subjects requiring intensive care unit admission and treatment
with midazolam and propofol. Barbiturate-coma with burst-suppression pattern was
applied in four out of six patients for 5 – 14 days. Corticosteroid i.v. treatment was used
as adjunctive therapy in all patients during the acute early phase, while intravenous
immuno-globulins (IVIG) or plasma exchange (PEX) were used in four patients. One
patient did not survive the acute phase (pt #3: sepsis during ICU staying three weeks
after onset). One of the surviving patients was lost to follow-up since he returned to his
home country (pt. #5). Four are on AED therapy: three have active chronic focal
epilepsy despite adequate drug regimens, one presented seizure clusters for months
despite AED poly-therapy before epilepsy control.
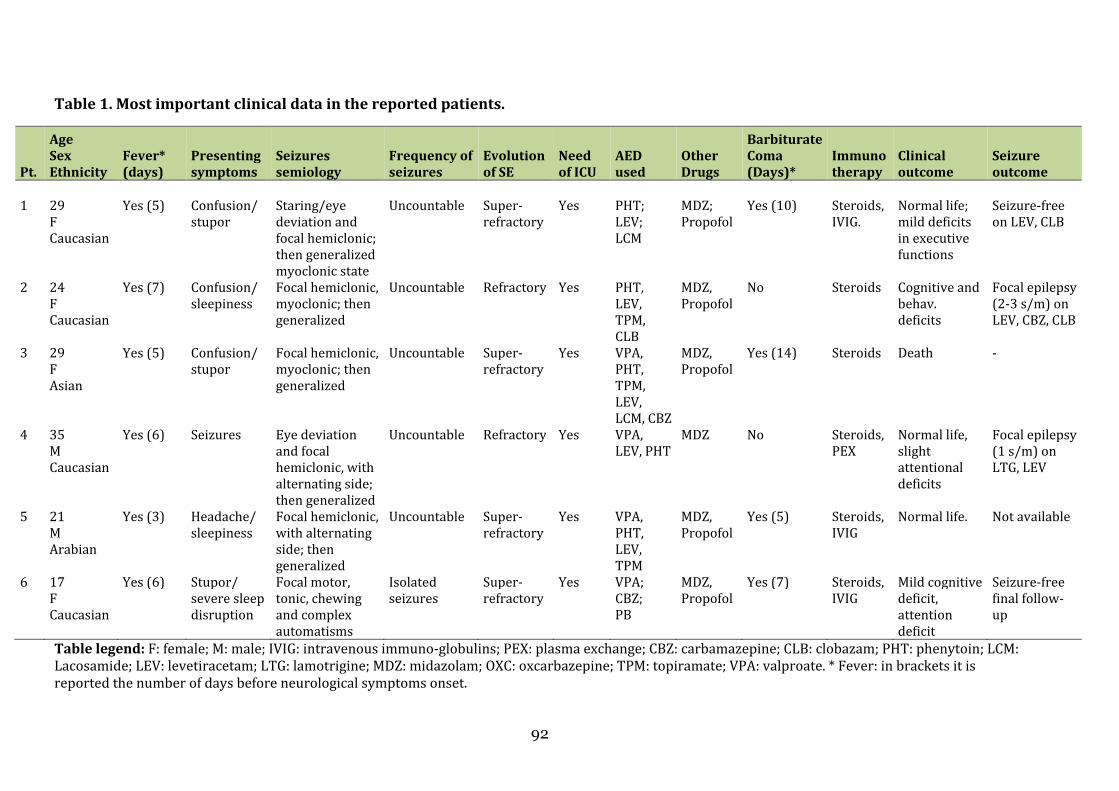
92
Table 1. Most important clinical data in the reported patients.
Pt.
Age
Sex
Ethnicity
Fever*
(days)
Presenting
symptoms
Seizures
semiology
Frequency of
seizures
Evolution
of SE
Need
of ICU
AED
used
Other
Drugs
Barbiturate
Coma
(Days)*
Immuno
therapy
Clinical
outcome
Seizure
outcome
1 29
F Caucasian
Yes (5) Confusion/ stupor
Staring/eye deviation and focal hemiclonic; then generalized myoclonic state
Uncountable Super-refractory
Yes PHT; LEV; LCM
MDZ; Propofol
Yes (10) Steroids, IVIG.
Normal life; mild deficits in executive functions
Seizure-free on LEV, CLB
2 24 F Caucasian
Yes (7) Confusion/ sleepiness
Focal hemiclonic, myoclonic; then generalized
Uncountable Refractory Yes PHT, LEV, TPM, CLB
MDZ, Propofol
No Steroids Cognitive and behav. deficits
Focal epilepsy (2-3 s/m) on LEV, CBZ, CLB
3
29 F Asian
Yes (5) Confusion/ stupor
Focal hemiclonic, myoclonic; then generalized
Uncountable Super-refractory
Yes VPA, PHT, TPM, LEV, LCM, CBZ
MDZ, Propofol
Yes (14) Steroids Death -
4
35 M Caucasian
Yes (6) Seizures Eye deviation and focal hemiclonic, with alternating side; then generalized
Uncountable Refractory Yes VPA, LEV, PHT
MDZ No Steroids, PEX
Normal life, slight attentional deficits
Focal epilepsy (1 s/m) on LTG, LEV
5
21 M Arabian
Yes (3) Headache/ sleepiness
Focal hemiclonic, with alternating side; then generalized
Uncountable Super-refractory
Yes VPA, PHT, LEV, TPM
MDZ, Propofol
Yes (5) Steroids, IVIG
Normal life. Not available
6 17 F Caucasian
Yes (6) Stupor/ severe sleep disruption
Focal motor, tonic, chewing and complex automatisms
Isolated seizures
Super-refractory
Yes VPA; CBZ; PB
MDZ, Propofol
Yes (7) Steroids, IVIG
Mild cognitive deficit, attention deficit
Seizure-free final follow-up
Table legend: F: female; M: male; IVIG: intravenous immuno-globulins; PEX: plasma exchange; CBZ: carbamazepine; CLB: clobazam; PHT: phenytoin; LCM: Lacosamide; LEV: levetiracetam; LTG: lamotrigine; MDZ: midazolam; OXC: oxcarbazepine; TPM: topiramate; VPA: valproate. * Fever: in brackets it is reported the number of days before neurological symptoms onset.

93
BrainImaging
During the acute phase of the disorder brain MRI showed bilateral Claustrum
involvement in all patients (Figure 1): these positive imaging studieswere acquired
withatimelagof3–10daysfromSEonset(Table2).Notably,inallpatientsthefirst
MRIstudy,undertakeninthefewdaysprecedingthedevelopmentofseizuresorinthe
firstdays(0–2days)aftertheonsetofrefractorySE,wasnegative.Beyondhighsignal
on FLAIR/T2 and diffusion weighted images [but with normal apparent diffusion
coefficient (ADC)] (Figure 2), no other sequences revealedClaustrumabnormalities;
nocontrastenhancementwasobserved inanycase.MRIstudiesundertakenafterSE
resolutionnolongershowedClaustrumalterations(Figure2).
Wedidnotobservesignalalterationsinvolvingthemedialtemporallobe,thesplenium
of corpus callosum, or other brain regions in anypatient.MRI studies in the chronic
phasewereavailableforthreepatientsandshowedmilddiffuseatrophyinone.
Notably, Claustrum alterations were not observed in any other case of status
epilepticus,forwhichanMRIstudywasavailableduringtheacutephase(104cases),
consideringanyaetiology.
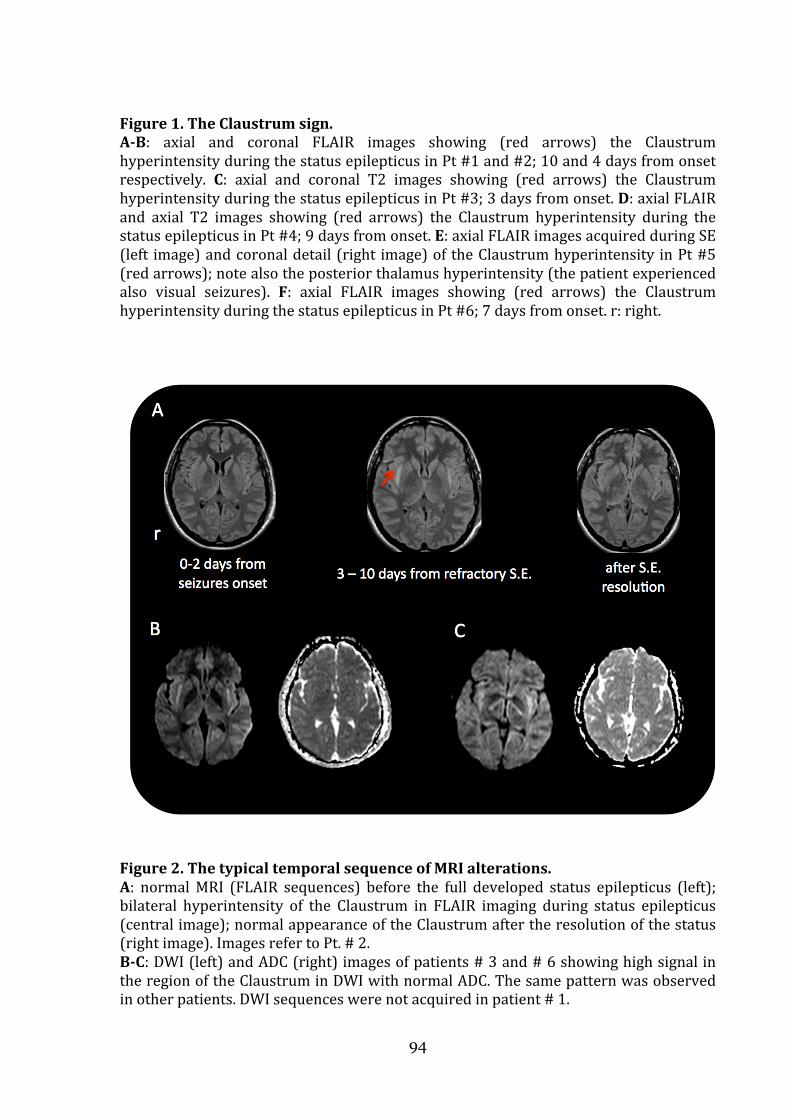
94
Figure1.TheClaustrumsign.A-B: axial and coronal FLAIR images showing (red arrows) the ClaustrumhyperintensityduringthestatusepilepticusinPt#1and#2;10and4daysfromonsetrespectively. C: axial and coronal T2 images showing (red arrows) the ClaustrumhyperintensityduringthestatusepilepticusinPt#3;3daysfromonset.D:axialFLAIRand axial T2 images showing (red arrows) the Claustrum hyperintensity during thestatusepilepticusinPt#4;9daysfromonset.E:axialFLAIRimagesacquiredduringSE(left image)andcoronaldetail(right image)oftheClaustrumhyperintensity inPt#5(redarrows);notealsotheposteriorthalamushyperintensity(thepatientexperiencedalso visual seizures). F: axial FLAIR images showing (red arrows) the ClaustrumhyperintensityduringthestatusepilepticusinPt#6;7daysfromonset.r:right.
Figure2.ThetypicaltemporalsequenceofMRIalterations.A: normalMRI (FLAIR sequences) before the full developed status epilepticus (left);bilateral hyperintensity of the Claustrum in FLAIR imaging during status epilepticus(centralimage);normalappearanceoftheClaustrumaftertheresolutionofthestatus(rightimage).ImagesrefertoPt.#2.B-C:DWI(left)andADC(right)imagesofpatients#3and#6showinghighsignalintheregionoftheClaustruminDWIwithnormalADC.Thesamepatternwasobservedinotherpatients.DWIsequenceswerenotacquiredinpatient#1.

95
Table 2. Most important investigational data during the acute phase in the reported
patients.
CSF Brain MRI in acute phase
Pt. Cells
(ul) Oligo.
bands EEG Claustrum
Other
brain
regions
Timing
from fever
(days)
Timing
from SE
onset
(days) Vigilance
Other
negative
findings 1 3 Absent G. SW; PD;
centro-temporal SW
Bilateral Insular cortex
17 10 Coma (on anaesthetic treatment)
LGI1, Caspr2 NMDAr, AMPAr, GABA(B), GABA(A),
mGlu-R1-R3-R5, POLG1 mutations
2 0 Absent G. SW; PD; centro- parietal SW
Bilateral None 11 4 Coma (on anaesthetic treatment)
LGI1, Caspr2 NMDAr, AMPAr, GABA(B), mGlu-R3,
3 20 Absent PD, SW with alternating side predominance (left> right)
Bilateral None 9 3 Coma (on anaesthetic treatment)
LGI1, Caspr2 NMDAr,
4 19 Absent PD, SW with alternating side predominance (left> right)
Bilateral None 13 9 Stupor LGI1, Caspr2 NMDAr, VGCC, mGlu-R3,
5 23-3 Absent Multifocal with fronto-temporal, occipital SW
Bilateral Right posterior thalamus
10 2 Coma (on anaesthetic treatment)
LGI1, Caspr2 NMDAr, AMPAr, GABA(B), mGlu-R3
6 10 Present Fronto-temporal bilat theta, L or R fronto-temporal SW
Bilateral None 10 4 Coma (on anaesthetic treatment)
LGI1, Caspr2 VGCC-Ab, NMDAr
Table Legend: G: generalized; SW: spikes and waves; PD: periodic discharges; Oligo: oligoclonal. FLAIR: fluid attenuated inversion recovery; DWI: diffusion weighted imaging; ADC: apparent diffusion coefficient. NMDAr: antibodies to N-methyl-D-aspartate receptor; LGI1: antibodies against leucine-rich glioma inactivated protein 1; Caspr2: contactin-associated protein-like 2; GABA(A), GABA(B): antibodies against the gamma-aminobutyric acid -A and -B receptor. AMPAr: antibodies against amino-3-hydroxy-5-methyl-4-isoxazolepropionic acid receptor; VGCC: antibodies against voltage-gated calcium channel; mGLU-R3: antibodies against metabotropic glutamate receptor 3.

Other investigational data
EEG during the acute phase showed multifocal spikes and sharp waves over fronto
central
Seizures arose independently from the two hemispheres with secondary generalization
in every patient. All patient had negative multiple neural antibodies testing, including
antibo
protein 1 (LGI1), and contactin
to voltage
negati
receptor (GABA
encephalopathy with refractory seizures/status epilepticus.
screened for mitochondria
p.A467T, p.W748S, and p.G848S were tested and were negative;
show specific alterations, and no respiratory chain defects were observed on muscle
tissue specimens.
Other investigational data
EEG during the acute phase showed multifocal spikes and sharp waves over fronto
central
Seizures arose independently from the two hemispheres with secondary generalization
in every patient. All patient had negative multiple neural antibodies testing, including
antibodies to N
protein 1 (LGI1), and contactin
to voltage
negative testing for CSF and serum antibodies against gamma
receptor (GABA
encephalopathy with refractory seizures/status epilepticus.
screened for mitochondria
p.A467T, p.W748S, and p.G848S were tested and were negative;
show specific alterations, and no respiratory chain defects were observed on muscle
tissue specimens.
Other investigational data
EEG during the acute phase showed multifocal spikes and sharp waves over fronto
central regions in the majority, with periodic lateralized discharges (
Seizures arose independently from the two hemispheres with secondary generalization
in every patient. All patient had negative multiple neural antibodies testing, including
dies to N
protein 1 (LGI1), and contactin
to voltage
ve testing for CSF and serum antibodies against gamma
receptor (GABA
encephalopathy with refractory seizures/status epilepticus.
screened for mitochondria
p.A467T, p.W748S, and p.G848S were tested and were negative;
show specific alterations, and no respiratory chain defects were observed on muscle
tissue specimens.
Other investigational data
EEG during the acute phase showed multifocal spikes and sharp waves over fronto
regions in the majority, with periodic lateralized discharges (
Seizures arose independently from the two hemispheres with secondary generalization
in every patient. All patient had negative multiple neural antibodies testing, including
dies to N
protein 1 (LGI1), and contactin
to voltage-gated K channels) (see
ve testing for CSF and serum antibodies against gamma
receptor (GABA
encephalopathy with refractory seizures/status epilepticus.
screened for mitochondria
p.A467T, p.W748S, and p.G848S were tested and were negative;
show specific alterations, and no respiratory chain defects were observed on muscle
tissue specimens.
Other investigational data
EEG during the acute phase showed multifocal spikes and sharp waves over fronto
regions in the majority, with periodic lateralized discharges (
Seizures arose independently from the two hemispheres with secondary generalization
in every patient. All patient had negative multiple neural antibodies testing, including
dies to N
protein 1 (LGI1), and contactin
gated K channels) (see
ve testing for CSF and serum antibodies against gamma
receptor (GABA
encephalopathy with refractory seizures/status epilepticus.
screened for mitochondria
p.A467T, p.W748S, and p.G848S were tested and were negative;
show specific alterations, and no respiratory chain defects were observed on muscle
tissue specimens.
Other investigational data
EEG during the acute phase showed multifocal spikes and sharp waves over fronto
regions in the majority, with periodic lateralized discharges (
Seizures arose independently from the two hemispheres with secondary generalization
in every patient. All patient had negative multiple neural antibodies testing, including
dies to N-methyl
protein 1 (LGI1), and contactin
gated K channels) (see
ve testing for CSF and serum antibodies against gamma
receptor (GABAA
encephalopathy with refractory seizures/status epilepticus.
screened for mitochondria
p.A467T, p.W748S, and p.G848S were tested and were negative;
show specific alterations, and no respiratory chain defects were observed on muscle
tissue specimens.
Other investigational data
EEG during the acute phase showed multifocal spikes and sharp waves over fronto
regions in the majority, with periodic lateralized discharges (
Seizures arose independently from the two hemispheres with secondary generalization
in every patient. All patient had negative multiple neural antibodies testing, including
methyl
protein 1 (LGI1), and contactin
gated K channels) (see
ve testing for CSF and serum antibodies against gamma
A) responsible for the recently described acute autoimmune
encephalopathy with refractory seizures/status epilepticus.
screened for mitochondria
p.A467T, p.W748S, and p.G848S were tested and were negative;
show specific alterations, and no respiratory chain defects were observed on muscle
tissue specimens.
Other investigational data
EEG during the acute phase showed multifocal spikes and sharp waves over fronto
regions in the majority, with periodic lateralized discharges (
Seizures arose independently from the two hemispheres with secondary generalization
in every patient. All patient had negative multiple neural antibodies testing, including
methyl
protein 1 (LGI1), and contactin
gated K channels) (see
ve testing for CSF and serum antibodies against gamma
) responsible for the recently described acute autoimmune
encephalopathy with refractory seizures/status epilepticus.
screened for mitochondria
p.A467T, p.W748S, and p.G848S were tested and were negative;
show specific alterations, and no respiratory chain defects were observed on muscle
Other investigational data
EEG during the acute phase showed multifocal spikes and sharp waves over fronto
regions in the majority, with periodic lateralized discharges (
Seizures arose independently from the two hemispheres with secondary generalization
in every patient. All patient had negative multiple neural antibodies testing, including
methyl-D
protein 1 (LGI1), and contactin
gated K channels) (see
ve testing for CSF and serum antibodies against gamma
) responsible for the recently described acute autoimmune
encephalopathy with refractory seizures/status epilepticus.
screened for mitochondria
p.A467T, p.W748S, and p.G848S were tested and were negative;
show specific alterations, and no respiratory chain defects were observed on muscle
Other investigational data
EEG during the acute phase showed multifocal spikes and sharp waves over fronto
regions in the majority, with periodic lateralized discharges (
Seizures arose independently from the two hemispheres with secondary generalization
in every patient. All patient had negative multiple neural antibodies testing, including
D-aspartate receptor (NMDAR), leucine
protein 1 (LGI1), and contactin
gated K channels) (see
ve testing for CSF and serum antibodies against gamma
) responsible for the recently described acute autoimmune
encephalopathy with refractory seizures/status epilepticus.
screened for mitochondrial disorders. The most common mutations in the POLG gene
p.A467T, p.W748S, and p.G848S were tested and were negative;
show specific alterations, and no respiratory chain defects were observed on muscle
Other investigational data
EEG during the acute phase showed multifocal spikes and sharp waves over fronto
regions in the majority, with periodic lateralized discharges (
Seizures arose independently from the two hemispheres with secondary generalization
in every patient. All patient had negative multiple neural antibodies testing, including
aspartate receptor (NMDAR), leucine
protein 1 (LGI1), and contactin
gated K channels) (see
ve testing for CSF and serum antibodies against gamma
) responsible for the recently described acute autoimmune
encephalopathy with refractory seizures/status epilepticus.
l disorders. The most common mutations in the POLG gene
p.A467T, p.W748S, and p.G848S were tested and were negative;
show specific alterations, and no respiratory chain defects were observed on muscle
EEG during the acute phase showed multifocal spikes and sharp waves over fronto
regions in the majority, with periodic lateralized discharges (
Seizures arose independently from the two hemispheres with secondary generalization
in every patient. All patient had negative multiple neural antibodies testing, including
aspartate receptor (NMDAR), leucine
protein 1 (LGI1), and contactin-associated protein
gated K channels) (see
ve testing for CSF and serum antibodies against gamma
) responsible for the recently described acute autoimmune
encephalopathy with refractory seizures/status epilepticus.
l disorders. The most common mutations in the POLG gene
p.A467T, p.W748S, and p.G848S were tested and were negative;
show specific alterations, and no respiratory chain defects were observed on muscle
EEG during the acute phase showed multifocal spikes and sharp waves over fronto
regions in the majority, with periodic lateralized discharges (
Seizures arose independently from the two hemispheres with secondary generalization
in every patient. All patient had negative multiple neural antibodies testing, including
aspartate receptor (NMDAR), leucine
associated protein
gated K channels) (see Table 2)
ve testing for CSF and serum antibodies against gamma
) responsible for the recently described acute autoimmune
encephalopathy with refractory seizures/status epilepticus.
l disorders. The most common mutations in the POLG gene
p.A467T, p.W748S, and p.G848S were tested and were negative;
show specific alterations, and no respiratory chain defects were observed on muscle
EEG during the acute phase showed multifocal spikes and sharp waves over fronto
regions in the majority, with periodic lateralized discharges (
Seizures arose independently from the two hemispheres with secondary generalization
in every patient. All patient had negative multiple neural antibodies testing, including
aspartate receptor (NMDAR), leucine
associated protein
Table 2)
ve testing for CSF and serum antibodies against gamma
) responsible for the recently described acute autoimmune
encephalopathy with refractory seizures/status epilepticus.
l disorders. The most common mutations in the POLG gene
p.A467T, p.W748S, and p.G848S were tested and were negative;
show specific alterations, and no respiratory chain defects were observed on muscle
96
EEG during the acute phase showed multifocal spikes and sharp waves over fronto
regions in the majority, with periodic lateralized discharges (
Seizures arose independently from the two hemispheres with secondary generalization
in every patient. All patient had negative multiple neural antibodies testing, including
aspartate receptor (NMDAR), leucine
associated protein
Table 2)
ve testing for CSF and serum antibodies against gamma
) responsible for the recently described acute autoimmune
encephalopathy with refractory seizures/status epilepticus.
l disorders. The most common mutations in the POLG gene
p.A467T, p.W748S, and p.G848S were tested and were negative;
show specific alterations, and no respiratory chain defects were observed on muscle
EEG during the acute phase showed multifocal spikes and sharp waves over fronto
regions in the majority, with periodic lateralized discharges (
Seizures arose independently from the two hemispheres with secondary generalization
in every patient. All patient had negative multiple neural antibodies testing, including
aspartate receptor (NMDAR), leucine
associated protein
Table 2).23
ve testing for CSF and serum antibodies against gamma
) responsible for the recently described acute autoimmune
encephalopathy with refractory seizures/status epilepticus.
l disorders. The most common mutations in the POLG gene
p.A467T, p.W748S, and p.G848S were tested and were negative;
show specific alterations, and no respiratory chain defects were observed on muscle
EEG during the acute phase showed multifocal spikes and sharp waves over fronto
regions in the majority, with periodic lateralized discharges (
Seizures arose independently from the two hemispheres with secondary generalization
in every patient. All patient had negative multiple neural antibodies testing, including
aspartate receptor (NMDAR), leucine
associated protein-like 2(Caspr2) (previously attributed
23 One subject (pt. #1) had additional
ve testing for CSF and serum antibodies against gamma
) responsible for the recently described acute autoimmune
encephalopathy with refractory seizures/status epilepticus.
l disorders. The most common mutations in the POLG gene
p.A467T, p.W748S, and p.G848S were tested and were negative;
show specific alterations, and no respiratory chain defects were observed on muscle
EEG during the acute phase showed multifocal spikes and sharp waves over fronto
regions in the majority, with periodic lateralized discharges (
Seizures arose independently from the two hemispheres with secondary generalization
in every patient. All patient had negative multiple neural antibodies testing, including
aspartate receptor (NMDAR), leucine
like 2(Caspr2) (previously attributed
One subject (pt. #1) had additional
ve testing for CSF and serum antibodies against gamma
) responsible for the recently described acute autoimmune
encephalopathy with refractory seizures/status epilepticus.
l disorders. The most common mutations in the POLG gene
p.A467T, p.W748S, and p.G848S were tested and were negative;
show specific alterations, and no respiratory chain defects were observed on muscle
EEG during the acute phase showed multifocal spikes and sharp waves over fronto
regions in the majority, with periodic lateralized discharges (
Seizures arose independently from the two hemispheres with secondary generalization
in every patient. All patient had negative multiple neural antibodies testing, including
aspartate receptor (NMDAR), leucine-
like 2(Caspr2) (previously attributed
One subject (pt. #1) had additional
ve testing for CSF and serum antibodies against gamma
) responsible for the recently described acute autoimmune
encephalopathy with refractory seizures/status epilepticus.24
l disorders. The most common mutations in the POLG gene
p.A467T, p.W748S, and p.G848S were tested and were negative;
show specific alterations, and no respiratory chain defects were observed on muscle
EEG during the acute phase showed multifocal spikes and sharp waves over fronto
regions in the majority, with periodic lateralized discharges (
Seizures arose independently from the two hemispheres with secondary generalization
in every patient. All patient had negative multiple neural antibodies testing, including
-rich glioma inactivated
like 2(Caspr2) (previously attributed
One subject (pt. #1) had additional
ve testing for CSF and serum antibodies against gamma-
) responsible for the recently described acute autoimmune
This patient was also
l disorders. The most common mutations in the POLG gene
p.A467T, p.W748S, and p.G848S were tested and were negative;25
show specific alterations, and no respiratory chain defects were observed on muscle
EEG during the acute phase showed multifocal spikes and sharp waves over fronto
regions in the majority, with periodic lateralized discharges (
Seizures arose independently from the two hemispheres with secondary generalization
in every patient. All patient had negative multiple neural antibodies testing, including
rich glioma inactivated
like 2(Caspr2) (previously attributed
One subject (pt. #1) had additional
-aminobutyric acid
) responsible for the recently described acute autoimmune
This patient was also
l disorders. The most common mutations in the POLG gene
muscle biopsy didn’t
show specific alterations, and no respiratory chain defects were observed on muscle
EEG during the acute phase showed multifocal spikes and sharp waves over fronto
regions in the majority, with periodic lateralized discharges (
Seizures arose independently from the two hemispheres with secondary generalization
in every patient. All patient had negative multiple neural antibodies testing, including
rich glioma inactivated
like 2(Caspr2) (previously attributed
One subject (pt. #1) had additional
aminobutyric acid
) responsible for the recently described acute autoimmune
This patient was also
l disorders. The most common mutations in the POLG gene
muscle biopsy didn’t
show specific alterations, and no respiratory chain defects were observed on muscle
EEG during the acute phase showed multifocal spikes and sharp waves over fronto
regions in the majority, with periodic lateralized discharges (Figure e
Seizures arose independently from the two hemispheres with secondary generalization
in every patient. All patient had negative multiple neural antibodies testing, including
rich glioma inactivated
like 2(Caspr2) (previously attributed
One subject (pt. #1) had additional
aminobutyric acid
) responsible for the recently described acute autoimmune
This patient was also
l disorders. The most common mutations in the POLG gene
muscle biopsy didn’t
show specific alterations, and no respiratory chain defects were observed on muscle
EEG during the acute phase showed multifocal spikes and sharp waves over fronto
Figure e
Seizures arose independently from the two hemispheres with secondary generalization
in every patient. All patient had negative multiple neural antibodies testing, including
rich glioma inactivated
like 2(Caspr2) (previously attributed
One subject (pt. #1) had additional
aminobutyric acid
) responsible for the recently described acute autoimmune
This patient was also
l disorders. The most common mutations in the POLG gene
muscle biopsy didn’t
show specific alterations, and no respiratory chain defects were observed on muscle
EEG during the acute phase showed multifocal spikes and sharp waves over fronto
Figure e-
Seizures arose independently from the two hemispheres with secondary generalization
in every patient. All patient had negative multiple neural antibodies testing, including
rich glioma inactivated
like 2(Caspr2) (previously attributed
One subject (pt. #1) had additional
aminobutyric acid
) responsible for the recently described acute autoimmune
This patient was also
l disorders. The most common mutations in the POLG gene
muscle biopsy didn’t
show specific alterations, and no respiratory chain defects were observed on muscle
EEG during the acute phase showed multifocal spikes and sharp waves over fronto-
-1).
Seizures arose independently from the two hemispheres with secondary generalization
in every patient. All patient had negative multiple neural antibodies testing, including
rich glioma inactivated
like 2(Caspr2) (previously attributed
One subject (pt. #1) had additional
aminobutyric acid-A
) responsible for the recently described acute autoimmune
This patient was also
l disorders. The most common mutations in the POLG gene
muscle biopsy didn’t
show specific alterations, and no respiratory chain defects were observed on muscle
-
).
Seizures arose independently from the two hemispheres with secondary generalization
in every patient. All patient had negative multiple neural antibodies testing, including
rich glioma inactivated
like 2(Caspr2) (previously attributed
One subject (pt. #1) had additional
A
) responsible for the recently described acute autoimmune
This patient was also
l disorders. The most common mutations in the POLG gene
muscle biopsy didn’t
show specific alterations, and no respiratory chain defects were observed on muscle

97
Literature review
Overall 16 cases were included in the review (14 studies, reported in Table 3). The
online supplementary reference (Ref e-1) reports 53 studies on neuroimaging changes
during SE that did not show any case with claustrum involvement. The patients’ age
range was 6 – 65 years (eight females). Fever, in the context of a flu-like condition,
preceded the onset of neurologic symptoms in 15 out of 16. Drowsiness, confusion, and
seizures were the presenting symptoms after a fever episode. In the acute phase
seizures configured a SE in all cases, with a predominance of focal motor and
secondarily generalized fits. In seven cases benzodiazepines and AED were successful in
controlling SE, while in eight patients the SE was considered refractory or super-
refractory with the need of drug-induced coma.22 One patient died in SE.27 MRI studies
showing bilateral Claustrum alterations were acquired during the SE acute phase in
stuporous/unconscious patients, with a time-lag of 3 to 20 days from SE onset. MRI
alterations in the acute phase consisted in every patient in hyperintense appearance of
the Claustrum on T2-weighted images. No case showed contrast enhancement. In two
cases apparent diffusion coefficient (ADC) maps were reported with no evidence of
decreased diffusion, as in our cases.31, 37 In five cases medial temporal lobe
hyperintensities were also present.27-29, 31, 34
Follow-up MRIs were reported for 11 out of 16 patients showing normal findings or
mild atrophy. In the MRI studies undertaken after SE resolution, the Claustrum
alterations were always reversed. Clinical follow-up data were available for 10 patients.
Eight out of 10 developed chronic focal epilepsy despite AED treatment.
The neuropathological examination in the patient died during SE reported marked
astrocytic reaction in the Sommer sector and end folium of both hippocampi and in the
Claustrum bilaterally. No sign of encephalitis or global hypoxic-ischemic changes were
observed.27
A presumed aetiology was lacking in 13 out of 16 cases. HSV1 encephalitis, mumps
encephalitis, and VGKC antibodies-related encephalitis were the presumed causes for
three patients. In seven patients (children-adolescents’ cases) the authors considered
the condition as belonging to the AERRPS/FIRES spectrum.

98
Table 3. Most relevant findings in reports describing Claustrum damage in patients with new
onset status epilepticus.
Author,
year
[ref]
Name
given to
the
conditio
n
N of
Pts Age
Sex
Presentin
g
symptom
s
Fever
(days
before
onset)
Presumed
aetiology
Seizure
semiolo
gy
Evolution
of SE
MRI
from
SE
onset
(days)
Immun
o-
therapy
Outcome/
Epilepsy
Kimura et al., 1994 [28]
None 1 7 M
Lethargy Yes (7) HSV1 (herpes stomatitis the week before)
Focal motor
Refractory 11 None Behavioral impairment Chronic epilepsy
Sperner et al., 1996 [20]
None 1 12 F
Dizziness, fatigue
Yes (14)
None Focal motor
Responsive
7 Steroids Normal life No epilepsy
Shiihara et al., 2006 [29]
Acute enc. with refractory SE
1 12 F
Fluctuation of vigilance
Yes (7) None Focal motor
Super-refractory
20 None Severe cognitive- deficit Chronic Epilepsy
Ishida et al., 2006 [30]
Non-herpetic acute limbic enc.
1 8 M
Seizures Yes (und.)
None Und. Responsive
Und. Und. Und.
Saito et al., 2007 [31]
AERRPS 1* 10 M
Fluctuation of vigilance
Yrs (6) None Focal motor
Super-refractory
11 Steroids, IVIG
Mild cognitive deficit No epilepsy
Specchio et al., 2011 [7]
FIRES 3 * 6-14 3 M, 1 F
Confusion, stupor, agitation
Yes (4-8)
None Focal motor
Responsive in 3/ Refractory in 1
Und. Steroids, IVIG in 3 out of 4
Mild to severe cognitive deficit/ Chronic Epilepsy
Gujjar et al., 2011 [32]
None 1 39 F
Lethargy Yes (4) None Focal motor
Super-refractory
14 None Normal life Chronic Epilepsy
Ishii et al., 2011 [33]
None 1 21 M
Seizures Yes (7) Mumps (PCR serum)
Focal motor
Refractory 7 None Und.
Serrano-Castro et al., 2013 [34]
FIRES 1 19 F
Seizures Yes (7) None Focal motor
Responsive
3 Steroids Normal life No epilepsy
Hiraga et al., 2014 [35]
None 1 65 F
Fluctuation of vigilance
Und. Ab anti-VGKC
Focal motor
Responsive
3 Steroids Memory loss Epilepsy outcome not reported
Mumoli et al., 2014 [36]
None, but possible FIRES
1 14 M
Drowsiness, confusion
Yes (10)
None Focal occipital
Responsive
10 Steroids, IVIG
Normal life Chronic Epilepsy

99
Cartagena et. al 2014 [37]
None 1* 22 F
Und. Und. None Focal motor
Refractory 7 Und. Und.
Table legend: N: number; Pts: patients; SE: status epilepticus; M: male; F: female; AERRPS: acute encephalitis with refractory, repetitive partial seizures; FIRES: febrile infection-related epilepsy syndrome; IVIG: intravenous immuno-globulins; Und: undetermined. *cases extracted from group studies.

100
DISCUSSION
We reported clinical, EEG, and brain imaging findings of a homogeneous group of six
adult patients that developed a new-onset refractory or super-refractory SE starting a
few days after a febrile illness and showing a striking Claustrum alteration, mainly
bilaterally. We ascertained through an extensive literature review that at least 16 other
cases have been described from 1996 to nowadays. Some of these cases were observed
in children and were attributed to FIRES.7,30 Probably, Claustrum involvement in febrile-
related new onset SE is more frequent than has been reported. Indeed, even for the
cases included in the review several of the imaging findings were not identified as
Claustrum alterations, but rather as peri-insular or external capsule lesions.26,31,35 For
these reasons, multicentric studies are needed to evaluate the actual Claustrum
involvement in both children and adults with febrile-related new onset SE.
Our observations are important for several reasons. First, this imaging sign seems to be
associated to a very aggressive form of SE, with focal motor seizures and myoclonus,
often requiring ICU admission and anesthetic drugs. Indeed, considering our patients’
group and the previously observed cases, refractory or super-refractory SE cases were
observed in 14 out of 22 patients (64%), and chronic epilepsy was reported in 12 out of
14 cases for which a follow-up was available/possible (85%). Second, no definite
aetiology was ascertained with the exception of three patients.26,32,34 Considering the
striking homogeneity of the observed cases, it seems highly probable that an unknown
but specific aetiology accounts for febrile-related SE with Claustrum hyperintensity.
From this point of view, the literature review, and the reported cases allow us to affirm
that Claustrum involvement was not observed in the context of refractory SE secondary
to acute structural brain damage or to other specific SE aetiologies. Importantly, no
other case with Claustrum involvement was observed in our cohort of SE cases observed
during the 4-year study period across the different participating Centers (104 cases with
MRI peri-, post-SE). Moreover, we screened 56 publications on peri-ictal imaging
changes in SE and only three cases were identified, notably all fulfilling our inclusion
criteria. It seems therefore quite unlikely that claustrum lesions represent a
consequence of refractory SE per se.
This retrospective uncontrolled study prevents us to make inferences about analysis of
outcomes in relation to treatments. However, immune-modulatory treatment could have
been relevant to outcomes.12,13 Notably, in the reported six patients the four that
received early IVIG/PEX (beyond i.v. steroids) had a good outcome also concerning

101
cognitive aspects, while the two patients that did not receive such treatment died or had
severe cognitive deficits. This observation together with the reversibility of the
Claustrum lesions, the preceding febrile illness, and the absence of any detectable
infectious agent, supports a role of inflammation-mediated mechanisms as relevant in
the determination of status epilepticus and encephalopathy in the presented cases.15 The
neuropathological findings in one previously reported patient who died during SE
showing evidence of only reactive gliosis without signs of encephalitis support this
hypothesis27
Our findings underscore the key-role of the Claustrum dysfunction in the
pathophysiology of this form of refractory or super-refractory SE. Indeed, the time-
course of the MRI alterations suggests that the SE was strictly time-related to Claustrum
dysfunction/damage. Of course, it is not possible to affirm if Claustrum damage is the
initial event leading to ictogenesis and SE, or if conversely it is the consequence of this
peculiar form of febrile-related SE. Indeed fever, seizures, or both, could be relevant to
induce Claustrum alterations. However, we suggest that Claustrum could have a relevant
role in the maintenance of this very aggressive form of refractory SE.
Experimental evidences in animal models indicate that some subcortical structures and
circuits act as critical modulators of seizure propagation and maintenance.38 In recent
years, the concept that during focal seizures activity, specific cortical-subcortical circuits
can be critical in sustaining epileptic activity and ictogenesis has been supported by
functional brain imaging studies.39 Notably however, few observations pointed attention
to the Claustrum within this framework, even in animal models.40 This can be explained
by the paucity of clinical data about the Claustrum involvement in epilepsy and by the
unknown functions of this thin layer of gray matter. Recent advances in neuro-anatomy
and physiology indicate this subcortical region as a highly relevant hub-centre in neural
synchronization of several (and distant) cortical areas, and, as a consequence, a
structure involved in integration of conscious perception.16-20 Considering these
physiological properties of the Claustrum, this structure could also be a key region in
promoting the propagation and synchronization of abnormal epileptic activity from
several cortical regions. To this point two properties of claustral neurons are relevant.
First, claustro-cortical fibers connect the Claustrum with several cortical areas including
the prefrontal, pre-postcentral, posterior parietal, orbitofrontal, and medial temporal
cortex.19, 20 Second, the Claustrum is constituted by densely packed and tightly
interconnected GABAergic interneurons.16, 17 Therefore, the Claustrum can potentially
102
bind together and modulate neural activities (epileptic activity in our case) from and to
widespread cortical areas.
Interestingly, a recent EEG/fMRI study in patients with focal drug-resistant epilepsies
found a common brain region with increased hemodynamic responses in relation to
interictal epileptiform discharges, regardless of the localization of interictal and ictal
activity.39 This region was close to the frontal Piriform cortex, and its Talairach
coordinates suggest that it corresponds to the Claustrum. Notably, GABAA receptor
binding (measured by flumazenil PET) was reduced in patients with more frequent
seizures.
Even if this report is a hypothesis-generating study of preliminary nature, our findings
suggest that the Claustrum could be an attractive new target for epilepsy and status
epilepticus therapy that deserves to be explored in future studies. Future prospective
studies are needed to delineate the specificity of this imaging biomarker, its
pathogenetic role in refractory status epilepticus, and the aetiology of the condition.
References
1. Baxter P, Clarke A, Cross H et al. Idiopathic catastrophic epileptic encephalopathy presenting with acute onset intractable status. Seizure 2003;12:379-87.
2. Kramer U, Shorer Z, Ben-Zeev B, Lerman-Sagie T, Goldberg-Stern H, Lahat E. Severe refractory status epilepticus owing to presumed encephalitis. J Child Neurol 2005;20:184-7.
3. Mikaeloff Y, Jambaqué I, Hertz-Pannier L et al. Devastating epileptic encephalopathy in school-aged children (DESC): a pseudo encephalitis. Epilepsy Res 2006;69:67-79.
4. Awaya Y, Fukuyama Y, Hayashi K, Osawa M. Acute non-herpetic encephalitis with severe refractory status epilepticus - its overwhelming ictogenicity, epileptogenicity, long-term prognosis and review of the literature. No To Hattatsu 2007;39:138-44
5. Sakuma H, Awaya Y, Shiomi M et al. Acute encephalitis with refractory, repetitive partial seizures (AERRPS): a peculiar form of childhood encephalitis. Acta Neurol Scand 2010;12:251-6.
6. Van Baalen A, Häusler M, Boor R et al. Febrile infection-related epilepsy syndrome (FIRES): a nonencephalitic encephalopathy in childhood. Epilepsia 2010;51:1323-8.
7. Specchio N, Fusco L, Claps D et al. Childhood refractory focal epilepsy following acute febrile encephalopathy. Eur J Neurol 2011;18:952-61.
8. Kramer U, Chi CS, Lin KL et al. Febrile infection-related epilepsy syndrome (FIRES): pathogenesis, treatment, and outcome: a multicenter study on 77 children. Epilepsia 2011;52:1956-65.

103
9. Van Lierde I, Van Paesschen W, Dupont P, Maes A, Sciot R. De novo cryptogenic refractory multifocal febrile status epilepticus in the young adult: a review of six cases. Acta Neurol Belg. 2003;103:88-94.
10. Wilder-Smith EP, Lim EC, Teoh HL et al. The NORSE (new-onset refractory status epilepticus) syndrome: defining a disease entity. Ann Acad Med Singapore 2005;34:417-20.
11. Costello DJ, Kilbride RD, Cole AJ. Cryptogenic New Onset Refractory Status Epilepticus (NORSE) in adults-Infectious or not? J Neurol Sci 2009;277:26-31.
12. Li J, Saldivar C, Maganti RK. Plasma exchange in cryptogenic new onset refractory status epilepticus. Seizure 2013;22:70-3.
13. Gall CR, Jumma O, Mohanraj R. Five cases of new onset refractory status epilepticus (NORSE) syndrome: outcomes with early immunotherapy. Seizure 2013;22:217-20.
14. Ismail FY, Kossoff EH. AERRPS, DESC, NORSE, FIRES: multi-labeling or distinct epileptic entities? Epilepsia 2011;52:e185-9.
15. Nabbout R, Vezzani A, Dulac O, Chiron C. Acute encephalopathy with inflammation-mediated status epilepticus. Lancet Neurol 2011;10:99-108.
16. Crick FC, Koch C. What is the function of the claustrum? Philos Trans R Soc Lond B Biol Sci 2005;360:1271-9.
17. Smythies J, Edelstein L, Ramachandran V. Hypotheses relating to the function of the claustrum. Front Integr Neurosci 2012;6:53. doi: 10.3389/fnint.2012.00053.
18. Koubeissi MZ, Bartolomei F, Beltagy A, Picard F. Electrical stimulation of a small brain area reversibly disrupt consciousness. Epilepsy & Behavior 2014; 37: 32-35.
19. Milardi D, Bramanti P, Milazzo C et al. Cortical and Subcortical Connections of the Human Claustrum Revealed In Vivo by Constrained Spherical Deconvolution Tractography. Cereb Cortex 2015;25:406-14.
20. Torgerson CM, Irimia A, Goh SY, Van Horn JD. The DTI connectivity of the human claustrum. Hum Brain Mapp 2014; Oct 23. doi: 10.1002/hbm.22667.
21. Sperner J1, Sander B, Lau S, Krude H, Scheffner D. Severe transitory encephalopathy with reversible lesions of the claustrum. Pediatr Radiol 1996;26:769-71.
22. Shorvon S, Ferlisi M. The treatment of super-refractory status epilepticus: a critical review of available therapies and a clinical treatment protocol. Brain 2011; 134:2802-18.
23. Dalmau J, Tuzun E, Wu HY et al. Paraneoplastic anti-N-methyl-Daspartate receptor encephalitis associated with ovarian teratoma. Ann Neurol 2007; 61: 25–36.
24. Petit-Pedrol M, Armangue T, Peng X et al. Encephalitis with refractory seizures, status epilepticus, and antibodies to the GABAA receptor: a case series, characterisation of the antigen, and analysis of the effects of antibodies. Lancet Neurol 2014;13:276-86.
25. Uusimaa J, Gowda V, McShane A et al. Prospective study of POLG mutations presenting in children with intractable epilepsy: prevalence and clinical features. Epilepsia 2013;54:1002-11.

104
26. Kimura S, Nezu A, Osaka H, Saito K. Symmetrical external capsule lesions in a patient with herpes simplex encephalitis. Neuropediatrics 1994;25:162-4.
27. Nixon J, Bateman D, Moss T. An MRI and neuropathological study of a case of fatal status epilepticus. Seizure 2001; 10: 588-591.
28. Shiihara T, Kato M, Ichiyama T et al. Acute encephalopathy with refractory status epilepticus: bilateral mesial temporal and claustral lesions, associated with a peripheral marker of oxidative DNA damage. J Neurol Sci 2006;250:159-61.
29. Ishida H, Hattori H, Takaura N et al. [A child with non-herpetic acute limbic encephalitis affecting the claustrum and hippocampus]. No To Hattatsu 2006;38:443-7.
30. Saito Y, Maegaki Y Okamoto R, et al. Acute encephalitis with refractory, repetitive partial seizures: case reports of this unusual post-encephalitic epilepsy. Brain Dev 2007;29:147-56.
31. Gujjar A, Jacob PC, Al-Asmi A, Ramachandran N, Obaidi A, Jain R. Reversible MRI changes in prolonged status epilepticus: a case report. Int J Neurosci 2011;121:341-5.
32. Ishii K, Tsuji H, Tamaoka A. Mumps virus encephalitis with symmetric claustrum lesions. AJNR Am J Neuroradiol 2011;32:E139. doi: 10.3174/ajnr.A2603.
33. Serrano-Castro PJ, Quiroga-Subirana P, Payán-Ortiz M, Fernandez-Perez J. The expanding spectrum of febrile infection-related epilepsy syndrome (FIRES). Seizure 2013;22:153-5.
34. Hiraga A, Watanabe O, Kamitsukasa I, Kuwabara S. Voltage-gated potassium channel antibody-associated encephalitis with claustrum lesions. Intern Med 2014;53:2263-4.
35. Mumoli L, Labate A, Palamara G, Sturniolo M, Gambardella A. Reversible symmetrical external capsule hyperintensity as an early finding of autoimmune encephalitis. Neurol Sci 2014;35:1147-9.
36. Cartagena AM, Young GB, Lee DH, Mirsattari SM. Reversible and irreversible cranial MRI findings associated with status epilepticus. Epilepsy Behav 2014;33:24-30.
37. Hwang KJ, Park KC, Yoon SS, Ahn TB. Unusual lesion in the bilateral external capsule following status epilepticus: a case report. J Epilepsy Res. 2014 31;4: 88-90. eCollection 2014.
38. Gale K. Subcortical structures and pathways involved in convulsive seizure generation. J Clin Neurophysiol 1992;9:264-77.
39. Laufs H, Richardson MP, Salek-Haddadi A, Vollmar C, Duncan JS, Gale K et al. Converging PET and fMRI evidence for a common area involved in human focal epilepsies. Neurology 2011;77:904-10.
40. Wada JA, Tsuchimochi H. Role of the claustrum in convulsive evolution of visual afferent and partial nonconvulsive seizure in primates. Epilepsia 1997;38:897-906.

105
C. Discussion and perspective
Our findings point the attention on the possible role of specific radiological brain pattern
as a biomarker to identify specific clinical conditions.
We made a collection of several cases of de novo refractory SE that share most of the
features:
- all started after a febrile illness
- all started with impairment of consciousness, confusion, stupor
- all rapidly develop in RSE/SRSE
- most present myoclonic seizures or motor emiclonic seizures
- all develop a bilateral, often isolated, hyperintensity in claustrum region
- all patients were treated for possible immune-mediated aetiology without specific
autoantibodies positivity.
Claustrum hyperintensity is specifically time related; all patients had normal MRI at
status onset, and develop this transient signal alteration between day 3 and 10 after
seizures onset. We think that this neuroradiological pattern is specific of a subtype of
immune-mediated encephalopathy in which the specific autoantibodies is not yet
discovered. Prompt correct diagnosis, treatment and management, especially in ICU,
could change the outcomes of this severe SE.
After this publication we collect several identical cases, one in our centre, other in
several part of Italy, Europe and United States. We are working in this direction, to
expand this casuistry to reinforce our hypothesis. We would evaluate similar cases in
paediatric population because probably some cases of FIRES and NORSE had the same
underline aetiology in different ages.
We collect also patient’s follow up:
The principal evidence is that all survival patients develop chronic and often drug
resistant epilepsy. None of the patients presented relapse or late brain MRI
modifications.
106
CHAPTER 3. DISCUSSION
3.1 RELEVANCE OF POTENTIAL BIOMARKERS IN MANAGEMENT OF
STATUS EPILEPTICUS
A. The role of CSF: outcome and implication for therapies
We demonstrated that several endogenous molecules could change in CSF of patients
with status epilepticus, if we compare the levels with healthy subjects. Some of that
changes could be a direct consequence of repeated seizures, and in particular of those
conditions in with seizures became refractory to antiepileptic drugs (RSE) or even to
anaesthetic therapies (SRSE). In the case of tau proteins, is well known that its increase
in CSF is related to axonal and neuronal damage, especially in acute brain damage.
We demonstrated an increase in CSF t-tau protein only in patients with RSE compared
with responsive ones, independently from aetiology (acute brain injury were a priori
excluded). We found also a positive correlation with SE duration, suggesting a direct
neuronal damage induced by persistence of seizures activities.
We need to expand the cohort of patients and try to relate these findings with the brain
alterations documented by MRI, distinguish reversible cases from chronic/atrophy
evolution ones. Early tau proteins dosage in CSF of patients with SE could predict
neurological and epileptic outcome. It’s necessary to take into account patients
comorbidities and the underline aetiology of the SE that could per se evolve in a worse
outcome. However these findings could direct and influence more appropriate
therapies: prevent unnecessary treatment in good cases and making timely treatments
for the most aggressive forms of SE.
Another point of view is the possibility to use new therapeutic molecules. Few evidences
support that allopregnanolone, an endogenous neurosteroids, have an antiepileptic
function, with a mechanism close to benzodiazepines. No standard values of this
hormone are available in humans. Few reports tried to use this drug in treatment of
patients with SRSE with great expectations, especially in children, without severe
adverse events.
We demonstrated that patents with SE had decrease levels of allopregnanolone
compared with healthy subjects. We can hypothesize that in patients with SE, a

107
consumption of this antiepileptic molecule occurs. Therefore, administration of
intravenous allopregnanolone could be a new therapeutic strategy in refractory to
benzodiazepine cases.
We recently participated to the SAGE trial, addressed to SRSE, with a good feeling.
Expanding experience in more cases should be necessary to evaluate real efficacy of this
drug.
B. The role of MRI: timing and considerations
Brain MRI in patients with status epilepticus is relevant for several reasons:
- to evaluate at onset possible SE’ s aetiology (stroke, encephalitis, post-traumatic injury
tumours, etc.)
- to follow SE’s evolution with brain alteration that compare few days after repeated
seizures and probably due to SE (ex. Hippocampal sclerosis after RSE). This radiological
marker could predict the development of chronic epilepsy after SE, often drug-resistant.
- to diagnose rare and under recognize aetiologies starting from clinical data and
identify common features. This is the case of new advance in definition of immuno-
mediated encephalopathies with epilepsy and status epilepticus.
We identify a subcategory of NORSE that started after a febrile illness with
stupor/confusion and prevalent myoclonic severe SE, with an isolated, bilateral
hyperintensity of claustrum regions on MRI. This alteration is strictly time-related with
SE because is found only between 3-10 days after SE’s onset. This could represent a
neuroradiological marker of a particular autoimmune encephalopathy that begins with
RSE and often evolve in catastrophic neurological impairments. This finding could guide
correct and timely treatment in immuno-mediate direction, despite the lack of specific
antibodies.

108
3.2 CONCLUSIONS
In clinical practise, biomarkers are the principal instruments that lead to the correct
diagnosis and treatment. This is valid for all the medical disciplines and for several, but
not all the disease. Unfortunately, biological markers are not available for all the
diseases, with an impact in outcome and prognosis.
Status epilepticus is a neurological and potentially dangerous condition that underlines
a great number of causes. Identify the aetiology is the mandatory condition that guide
the correct treatment. In fact SE treatment foresee antiepileptic and anaesthetic drugs,
based on the different stages of SE, but often only the treatment of the specific underline
aetiology should develop to complete resolution of the SE. This is true for metabolic
causes (hyponatremia, hyperammoniemia, renal dysfunction, infections ecc…) but also
for immune-mediate cases in which antibodies identification could support
immunological therapies (in ex. steroids, IGIV, PEX ecc…). Some cases escape to our
knowledge and improve the panel of potential biomarkers to identify aetiologies
underline SE was the objective of our works.
We follow several ways:
a) Principally we use CSF, direct font of information in CNS changes. We discovered:
a potential relationship between persistence of intractable seizures and direct
neuronal damage; a potential new therapeutic approach with endogenous
neurosteroid (AP) that seems to be consumed in CSF of status epilepticus
patients.
b) Then we identify an MRI pattern that should be specific of acute encephalopathy
associated with refractory SE started after a febrile illness; claustrum damage
should represent a radiological marker of this condition and could justify the
refractoriness of the status supported by the widespread interconnection of this
deep thin line of grey matter with the cortex.
Obviously, our hypothesis needs to be confirmed with a large cohort of patients and
probably with a multicentre collaboration.
What has driven and will guide us in the search is the challenge to improve treatments
of patients with epilepsy and status epileticus. I hope to be able to continue research
with the colleagues that help me in these years.

109
Ringraziamenti
Con grande gioia e stupore, mi accorgo che per la mia terza tesi, le persone da ringraziare sono sempre le stesse, sia tra i colleghi sia tra i famigliari.
Questo rafforza ancora di più la voglia che ho di condividere questo traguardo con le persone che mi hanno aiutato a raggiungerlo.
Primo fra tutti, ringrazio il dottor Stefano Meletti, il mio maestro da sempre, che mi ha insegnato il fascino della ricerca, senza allontanarmi troppo dalla mia prima e vera passione, la clinica. Dopo oltre 10 anni di lavoro insieme, spero di poter continuare a realizzare progetti e studi, ancora insieme.
Ringrazio il Professor Nichelli e tutta la clinica neurologica per l’aiuto e la disponibilità dimostrati nei miei confronti e per aver condiviso con me questi anni di crescita da neurologa.
Ringrazio le “mezze”, Giada e Laura, perché tre è meglio di uno e lavorare con voi, come gruppo, è uno stimolo continuo a migliorare, confrontarsi e crescere, sia professionalmente che umanamente.
Voglio ringraziare tutti i pazienti che hanno reso possibili le mie ricerche, e che sono lo stimolo continuo e incalzante per migliorare il nostro lavoro, che ci danno pensieri per farci trovare le soluzioni.
Voglio ringraziare tutta la mia famiglia, punto fermo della mia vita, la certezza di un aiuto sempre presente e di un supporto costante.
Ringrazio per questo i miei genitori, Maurizio e Mariella, e mia nonna Rina, per esserci sempre e per qualunque motivo, dal più futile al più serio.
Ringrazio più di tutto Andrea e i miei bimbi, Riccardo e Lorenzo, perché con loro ritrovo me stessa al di fuori della medicina, perché con loro sono cresciuta e continuo a crescere, come donna e come mamma, perché mi supportano in tutto e accettano i miei sacrifici, e perché uniti siamo più forti di tutto e di tutti, sempre e per sempre.