the role of continuous improvement in health care · the role of continuous improvement in health...
TRANSCRIPT

© 2010 Minitab, Inc.
The Role of Continuous
Improvement in Health Care
Eduardo Santiago, Ph.D.
Minitab, Inc.
State College, PA

© 2010 Minitab, Inc.
Agenda
The Role of Continuous Improvement
• The NAE/IOM report (2005)
• The Role of Statistics and Lean techniques
Success Stories
• Systems engineering at MD Medical Cancer Center
• Lean applications at Virginia Mason
• Six Sigma at Charleston Area Medical Center
Examples
• QFD, VSM, SPC, Predictive modeling, FMEA,
Optimization, Scheduling, Forecasting,
Autocorrelated data (ARIMA)

© 2010 Minitab, Inc.
The NAE/IOM Report
Healthcare expenditures will reach $3.30 trillion by 2013
[National Health Expenditure Data Projections].
Building a Better Delivery System: A New Engineering/
Health Care Partnership [Reid et al.]
The report concluded the need to include new
techniques that could lead to meaningful and sustained
improvements in healthcare.
Some of these techniques include: QFD, Tools for failure
analysis, Modeling and simulation, Optimization tools,
Predictive modeling, SPC, scheduling, etc.

© 2010 Minitab, Inc.
Design a better layout
Reduce patient wait times
Eliminate non-value added steps to improve efficiency,
reduce cost
Design processes to be mistake-proof
Balancing work, Leveling
Quick changeover (SMED)
Kanban, 5 S (visual workplace)
From push to pull
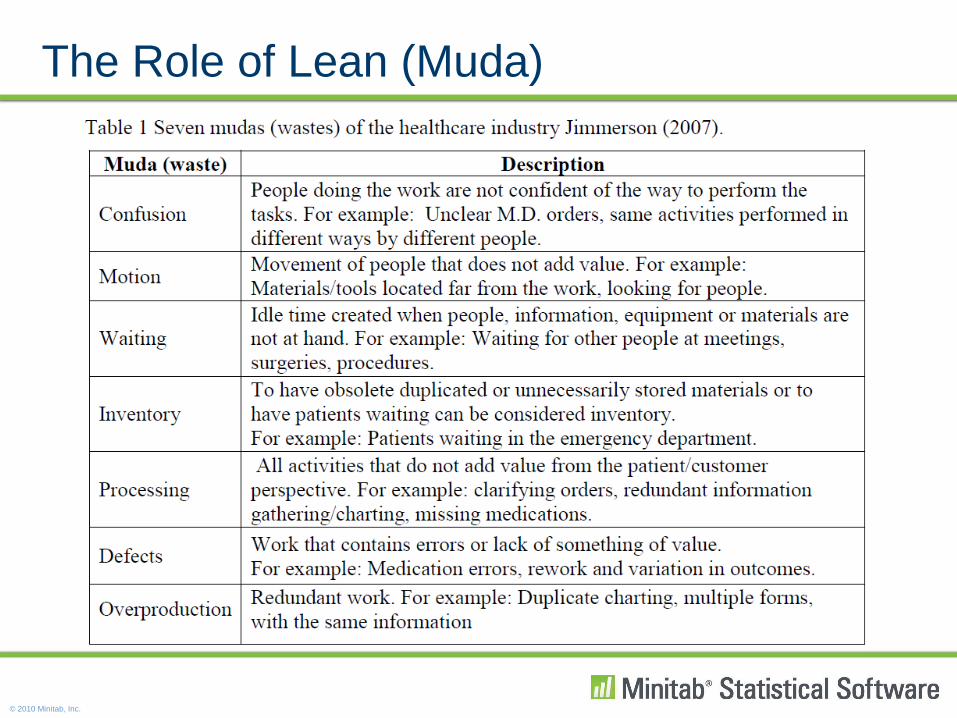
The Role of Lean in Healthcare

© 2010 Minitab, Inc.
What are the benefits of a Lean
program?
1. It’s easier to implement
2. May not necessarily require capital
investment
3. Can lead to standardization of
activities originally performed
differently by each surgeon
(Stanford hospital)
4. Help streamline a process that is
traditionally linear (patient visit)
The Role of Lean in Healthcare
© 2010 Minitab, Inc.
The Role of Lean (Muda)

© 2010 Minitab, Inc.
Process improvement with Design of Experiments.
Challenge: Most systems cannot be interrupted and need
to continue to run. (Discrete Event Simulation)
Predict the volume of work (i.e. the number of patients)
Reduce the variation in a process
Monitor the stability of an important single or set of
quality characteristics
Usually, requires a more quantitative approach, problems
could be more challenging than those in Lean projects
The DMAIC methodology naturally relies on the good
use of Statistics to solve problems
The Role of Statistics in Healthcare

© 2010 Minitab, Inc.
What are the benefits of a Six Sigma
program?
1. Its benefits have been shown in
both manufacturing and service
industries
2. Tools are available for most
practitioners
3. Several successful case studies
published and available in the
literature
The Role of Statistics in Healthcare

© 2010 Minitab, Inc.
Success Stories
These is just a small sample of the vast number of
improvement efforts in Healthcare.
1. MD Anderson Cancer Center – Systems Engineering
2. Virginia Mason – Lean
3. Charleston Area Medical Center – Six Sigma

© 2010 Minitab, Inc.
Success Stories (MD Anderson)
For eight of the past 10 years, including 2011, MD Anderson
has ranked No. 1 in cancer care in the "America's Best
Hospitals" survey published in U.S. News & World Report.
Components of Systems Engineering:
1. Frontline improvement initiatives (6s, Lean, Standardize)
2. QE Methods (SPC, Reliability, Engineering Economics)
3. Process Optimization (Scheduling, simulation, staffing)
4. Human Factors (Ergonomics, Safety)
5. Logistics (Facility layout, Supply chain, Inventory)
6. Data Mining and Analytics (Clinical informatics, DM)

© 2010 Minitab, Inc.
Success Stories (MD Anderson)
Systemic thinking
Human Factor Analysis
Facility Design Layout
Optimization
Mathematical Programming
Data Mining
Heuristics
Forecasting Queuing
Constraint Base Scheduling Decision Analysis
Discrete Event Simulation
Classification System
Scheduling
Network Analysis
Statistical Analysis Inventory Modeling
Fault Tree Analysis
QFD
Root Cause Analysis
Usability Process Mapping
Project Management
Evidence Based Medicine
Six Sigma
Lean
QI Leadership PDCA
Clinical Variation
Patient Safety
Basic Quality Tools
SPC
FMEA
Time/Motion Study
Qualitative Quantitative
Com
ple
xity
Adapted from Systems Engineering in Healthcare and How Statistics Plays a Role by Dr. Victoria Jordan
© 2010 Minitab, Inc.
Success Stories (MD Anderson)
Several Six Sigma projects have been completed at UT MD
Anderson Cancer Center.
1. Decrease expired drugs in outpatient pharmacies.
2. Reduce the number of On Demand Inventory Picks for
the central pharmacy.
3. Increase material scanning compliance in ICU supply
rooms.
4. New process in Leukemia Center reduced patient
walking distance by 89%, and patient wait time by 36%.

© 2010 Minitab, Inc.
Success Stories (Virginia Mason)

© 2010 Minitab, Inc.
Success Stories (Virginia Mason)
In 2002, Virginia Mason started a Lean initiative and since
then they have achieved various improvements. Some of
them are listed below:
1. Savings between $12-15 million dollars
2. Reduction of inventory by over 50%
3. Reduction of lead time by 65%
4. Distance traveled by people (44% down)

© 2010 Minitab, Inc.
Success Stories (Charleston Area MC)
1. Overall goal to identify and address inefficiencies in
workflow processes related to patient flow and staffing.
2. Reduced waiting times for appointments.
3. Reduced length of clinic visits and increased patient
satisfaction, clinic volume, and revenues.
4. Specifically waiting times for an obstetric appointment
decreased from 38 to 8 days, the wait for a new
gynecologic appointment declined from 60 to 25 days.

© 2010 Minitab, Inc.
Some Classic
Lean Tools

© 2010 Minitab, Inc.
Value Stream Mapping
Five Basic Principles:
1. Precisely specify value for each process
2. Identify the value stream for each process
3. Make value flow without interruption
4. Let customer pull value
5. Pursue perfection

© 2010 Minitab, Inc.
Value Stream Mapping
Current State of an Emergency Room

© 2010 Minitab, Inc.
Value Stream Mapping
Future State of an Emergency Room:

© 2010 Minitab, Inc.
Spaguetti Diagram
Helps track visually a path taken by a patient or employee in
a given timeframe while performing their assigned duties.

© 2010 Minitab, Inc.
Spaguetti Diagram
An A3 Report is a mechanical tool that embodies the PDCA
thought process that underlies all LEAN implementations.

© 2010 Minitab, Inc.
Some Classic
Statistical Tools

© 2010 Minitab, Inc.
Healthcare Challenges
Samples correspond to finite populations
Data is not always collected automatically
Some data (related to patients) is difficult to obtain
The environment is so dynamic, and constantly changing
that it is difficult to study data at common cause level.
© 2010 Minitab, Inc.
Control Charts
SPC is one of the most common applications used to monitor
the stability of a process over time. However, several
challenges can be presented.
1. Individual value control charts are frequently used
because rational subgrouping is impossible
2. Assumptions in control charts about the true parameter
being constant over the time frame are not always valid.
3. Often, no distribution model fits the data nor can the
data be transformed.

© 2010 Minitab, Inc.
G and T charts
Rare event control charts
Used to monitor time or opportunities
between rare events
Typically used in healthcare for:
• Infections (e.g. nosocomial)
• Medication errors
• Patient falls
• Ventilator-associated pneumonias
• And other rare adverse events

© 2010 Minitab, Inc.
Difference between G and T charts
G chart
• Days between rare events
• Opportunities (e.g. surgeries or doses) between rare events
• Inputs:
– Dates of events
– Number of opportunities
T chart
• Time between rare events
• Inputs:
– Dates/times of events
– Elapsed time between events

© 2010 Minitab, Inc.
G chart example
Each year, nosocomial infections
cause millions of hospital days and
thousands of deaths nationally.
Suppose we work for a hospital and
want to monitor these infections so we
can detect changes and react
appropriately if our process goes out
of control.
© 2010 Minitab, Inc.
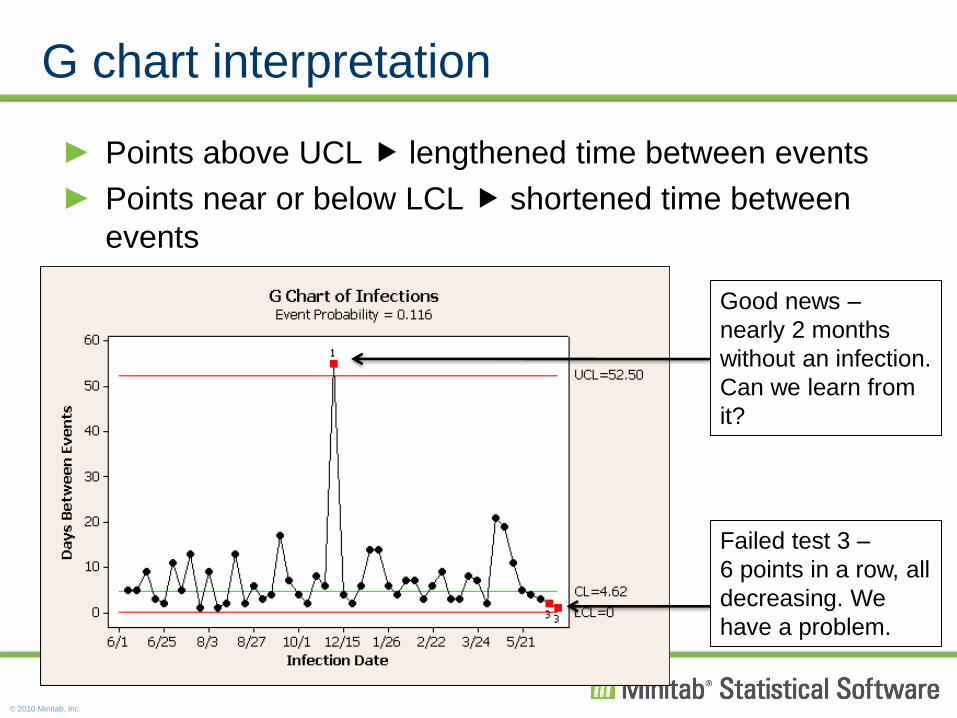
G chart interpretation
Points above UCL lengthened time between events
Points near or below LCL shortened time between
events
Failed test 3 –
6 points in a row, all
decreasing. We
have a problem.
Good news –
nearly 2 months
without an infection.
Can we learn from
it?

© 2010 Minitab, Inc.
T chart example
The Agency for Healthcare Research & Quality estimates
the incident rate for an adverse drug event (ADE) at less
than seven per 100 hospital admissions nationwide, with a
mean cost of $4,685 per event
(www.ahrq.gov/qual/errorsix.htm). Consider the time
between errors made in medication.

© 2010 Minitab, Inc.
T chart example

© 2010 Minitab, Inc.
P’ and U’ charts (Laney charts)
Similar to P and U charts:
• P’ charts for defectives
• U’ charts for defects
For large subgroup sizes where data exhibit
“overdispersion” – excessive variation
For case where true proportion of defectives/defects
varies slightly over time, creating “overdispersion”

© 2010 Minitab, Inc.
P’ and U’ charts – the problem
Overdispersion occurs when binomial (P) or Poisson (U)
distribution assumption is not valid
Result is P and U charts with tight control limits and
many out-of-control points

© 2010 Minitab, Inc.
P’ and U’ charts – the solution
Laney charts correct high false alarm rate by
the control limits so only important deviations are
detected.

© 2010 Minitab, Inc.
P’ chart example
Suppose we record the number of
patients in a day that wait for too
long, according to some internal
maximum waiting time allowed.
Hospital personnel need to
evaluate the stability of the process
to ensure it is in control and detect
any special cause variation.

© 2010 Minitab, Inc.
P’ chart example – diagnostic
Ratio of observed (within and between subgroup) to
expected (within subgroup only) variation > 147.8%
Recommendation use a P’ chart

© 2010 Minitab, Inc.
P’ chart interpretation
Process is stable and in control

© 2010 Minitab, Inc.
P’ chart example – summary
Large subgroup sizes tight limits on the P chart
Diagnostic test more variation in data than expected
P’ chart uses both within and between subgroup variation
to construct proper control limits
Conclusion: process is stable

© 2010 Minitab, Inc.
Clinical Trials
How Do I Know If a Recommended Treatment Works: An
Introduction to a Clinical Trial, by Nancy Geller

© 2010 Minitab, Inc.
Mixed Models (ANOVA)
A healthcare facility treats patients prior to knee surgery.
They want to know the effect of giving patients a massage
prior to surgery on the flexibility of the knee. So, half of the
patients received massages, half did not and they recorded
the flexibility of the two groups.

© 2010 Minitab, Inc.
General Linear Model: Flexibility versus Treatment, Time, Massage
Factor Type Levels Values
Time(Treatment) random 3 0, 5, 15
Massage(Treatment) fixed 3 None, AM, PM
Treatment fixed 2 Control, Massage
Analysis of Variance for Flexibility, using Adjusted SS for Tests
Source DF Seq SS Adj SS Adj MS F P
Time(Treatment) 1 63.42 63.42 63.42 4.57 0.041
Massage(Treatment) 1 59.69 59.69 59.69 4.30 0.047
Treatment 1 518.73 518.73 518.73 5.88 0.280 x
Error 28 388.49 388.49 13.87
Total 31 1030.33
x Not an exact F-test.
S = 3.72485 R-Sq = 62.30% R-Sq(adj) = 58.26%
Mixed Models (ANOVA)
© 2010 Minitab, Inc.
References
1. Fowler, J., Benneyan, J., Carayon, P., Denton, B., Keskinocak, P., and
Runger, G. An introduction to a new journal for Healthcare Systems
Engineering. IIE Transactions on Healthcare Systems Engineering. Vol. 1,
2011.
2. Olguin, E. Using Lean to improve room supply management in a hospital
emergency department. The Pennsylvania State University, 2010.
3. Reid, P., Compton, W., Grossman, J., and Fanjiang, G. Building a Better
Delivery System: A New Engineering/Health Care Partnership. The National
Academies Press. Washington, D.C. 2005.