the role of economic and social instruments in drought ... · the role of economic and social...
TRANSCRIPT
The role of economic and social instruments in drought
management: pricing, trading and awareness campaigns
Josefina MaestuProgram coordinator
Department of Economic and Social AffairsUnited Nations
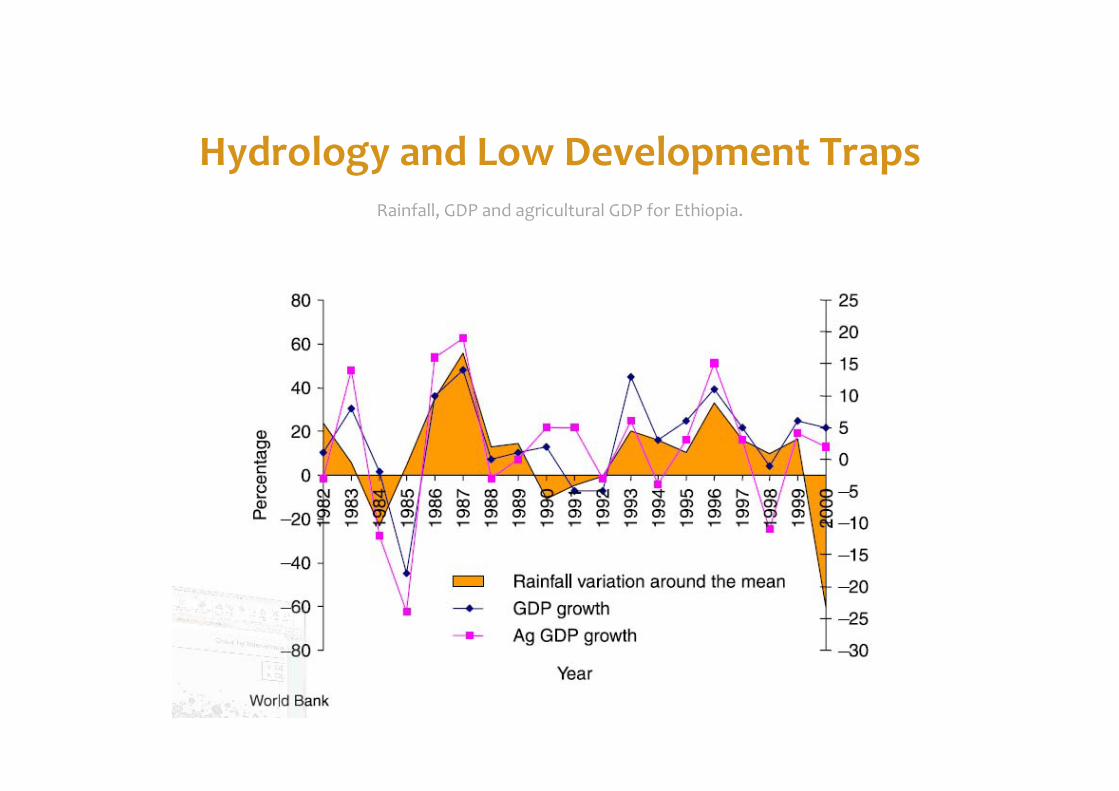
Hydrology and Low Development TrapsRainfall, GDP and agricultural GDP for Ethiopia.
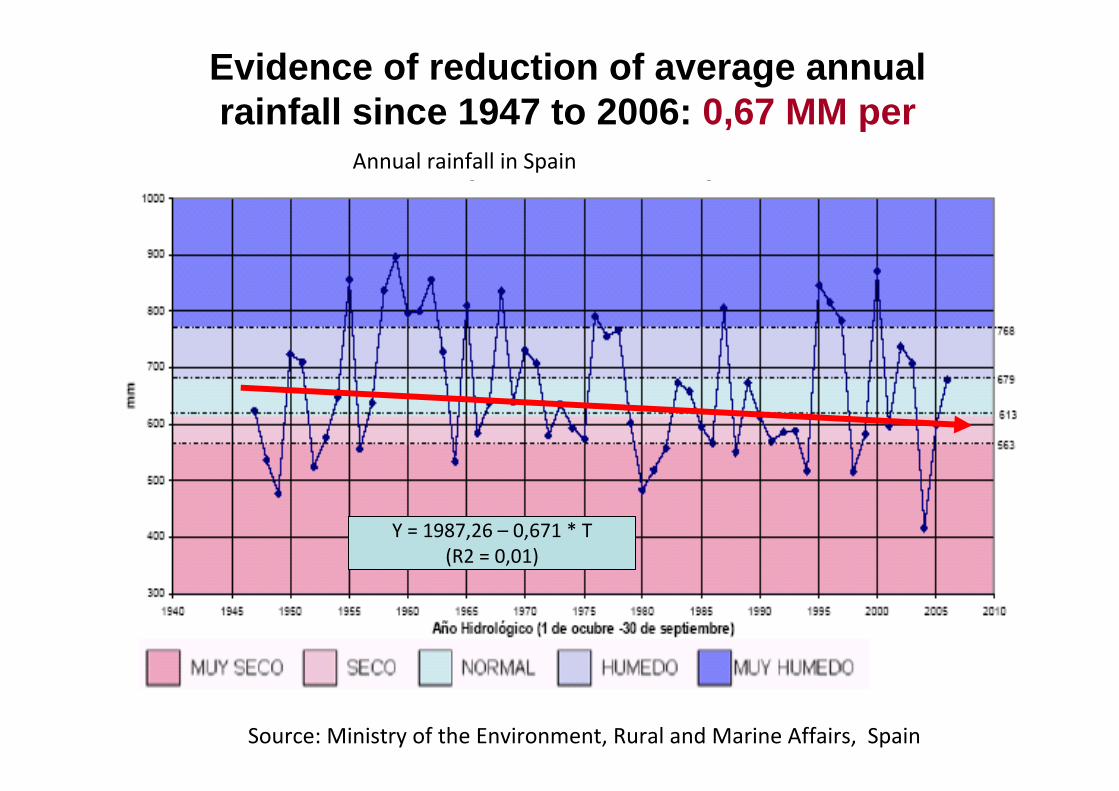
Evidence of reduction of average annual rainfall since 1947 to 2006: 0,67 MM per
year
Y = 1987,26 – 0,671 * T(R2 = 0,01)
Annual rainfall in Spain
Source: Ministry of the Environment, Rural and Marine Affairs, Spain

But droughts: not a meteorological problem anymore

Economic Instruments
Key economic instruments
1. Prices and Taxes2. Licensing and reallocation instruments
(trading/voluntary agreements)3. Subsidies and conditionality.4. Insurances

European framework (Commission communication 2007) The hiarchy
• Water pricing• Land use planning• Financing improved technical
efficiency• Water supply infrastructures• Water efficient technologies and
practices• Water saving culture• Knowldege and data collection
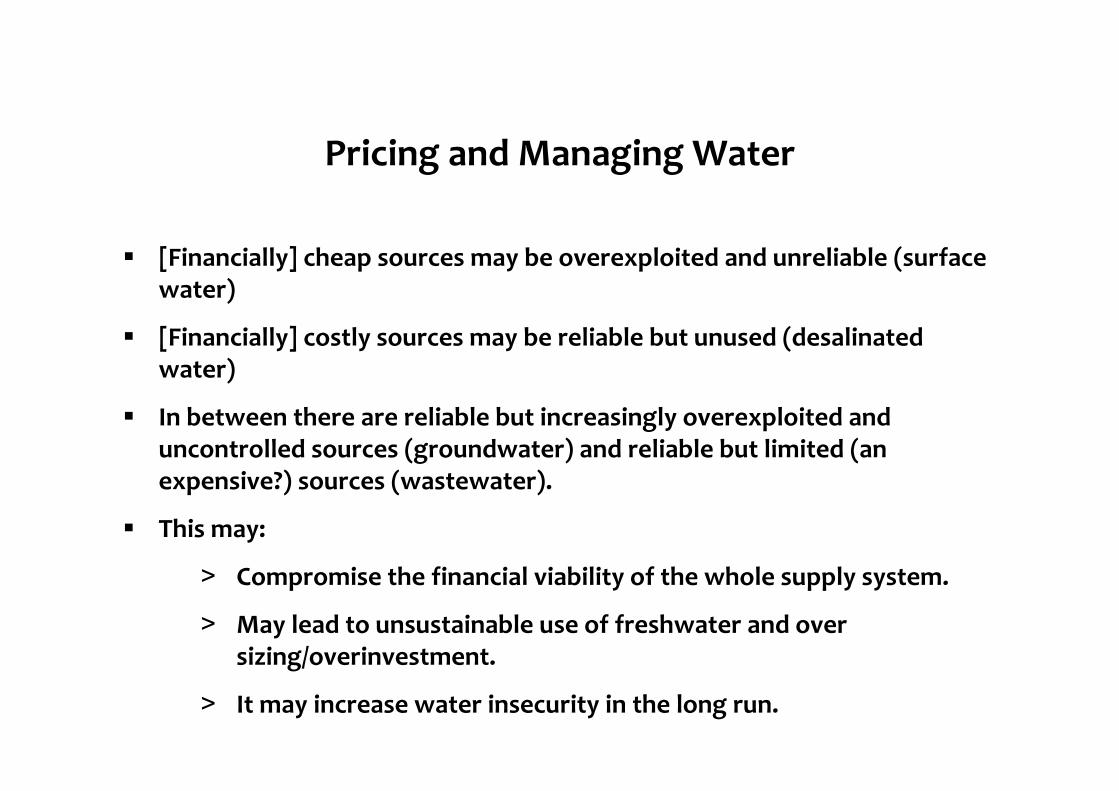
Pricing and Managing Water
[Financially] cheap sources may be overexploited and unreliable (surface water)
[Financially] costly sources may be reliable but unused (desalinated water)
In between there are reliable but increasingly overexploited anduncontrolled sources (groundwater) and reliable but limited (an expensive?) sources (wastewater).
This may:
> Compromise the financial viability of the whole supply system.
> May lead to unsustainable use of freshwater and over sizing/overinvestment.
> It may increase water insecurity in the long run.

PRICING IN URBAN AREAS-The charges-The structure-The effects

COSTS
a)Fixed costs
b)Variable costs
c)Costs of expanding the services
Price structure
a)Fix Charge/Service
b)Consumption charge
c) Connection charge

Structure of charges

Increasing costs of bulk water is reflected in volumetric and increasing block pricing
AlicanteCuotas Fijas Abastecimiento Doméstico. Alicante 2008
0
2
4
6
8
10
12
Contador Abastecimiento Saneamiento Canon Saneamiento Total
€/mes
Cuota de consumo de abastecimiento. Alicante 2008
0,0
0,3
0,6
0,9
1,2
1,5
1,8
0-3,3 3,3-10,3 10,3-20,3 >20,3
T1 T2 T3 T4
Tramos de consumo (m3/mes)
€/m
3
•Average HH water use per capita 139 l/per day
• Average price paid by HH 1,64 €/m3 (19,127 € per HH per month). Before Tax.
• On average the water bill is 0,7% of per capita income.•HH with higher water consumption will pay more than double.
Cuota de consumo de Alcantarillado. Alicante 2008
0,0
0,1
0,2
0,3
0-3,3 3,3-10,3 >10,3
T1 T2 T3
Tramos de consumo (m3/mes)
€/m
3

In Murcia
Cuotas Fijas Abastecimiento Doméstico.Murcia 2008
0
2
4
6
8
10
Contador Abastecimiento Saneamiento Canon Saneamiento Total
€/mes
•The average per capita consumption in Murcia is 158 l/per day
• The average price is 1,99 €/m3 (30,682 € per HH per month). Excluding Taxes
• The water bill is about 1,04% of per capita income
Aba ste cim ie nto: cuota de consum o Murcia 2008
0,0
0,2
0,4
0,6
0,8
1,0
1,2
1,4
0-10 10-20 20-30 30-45 >45
T1 T2 T3 T4 T5
Tram os de consum o (m 3/m es)
€/m
3

Abastecimiento: cuota de servicio Barcelona 2008
0,0
0,4
0,8
1,2
1,6
0-7 7-12 >12
T1 T2 T3
Tramos de consumo (m3/mes)
€/m
3
Tasa de alcantarilladoBarcelona 2008
0,0
0,1
0,2
0,3
0-12 >12
T1 T2
Tramos de consumo (m3/mes)€/
m3
Canon del Agua Barcelona 2008
0,0
0,4
0,8
1,2
1,6
2,0
0-10 10-18 >18
T1 T2 T3
Tramos de consumo (m3/mes)
€/m
3
Abastecimiento: Sist. 3 tramos: cuota de servicio€/mes
13 mm 7,18 (vivienda D y E)15 mm 4,52 (vivienda B y C)
In Barcelona

Water use varies..

Prices vary too …

Trend of reduction of per capita consumption by Households in the Mediterranean Basins
Consumo medio de agua. 1996 - 2005 (INE)
60
80
100
120
140
160
180
200
220
1996 1997 1998 1999 2000 2001 2002 2003 2004 2005
Con
sum
o m
edio
de
agua
(l/h
ab/d
ía)
Andalucía Cataluña Comunitat Valenciana Murcia (Región de)
• Increasing in Andalucia with improvement of per capita income, except in Malaga and Almeria
In Malaga and Almeria there has been a dramatic reduction of per capita consumption last year

Precio medio por los Servicios del Agua. 1996 - 2005 (INE)
0,00
0,20
0,40
0,60
0,80
1,00
1,20
1,40
1,60
1996 1997 1998 1999 2000 2001 2002 2003 2004 2005
Ingr
eso
med
io (
€/m
3 )
Andalucía Cataluña Comunitat Valenciana Murcia (Región de)
In paralel to sustained increases in prices over the last decade

In the regions with higher real increases in prices there has been an important reduction of per capita
consumption
Relación precios/consumos
Andalucía
Cataluña Comunitat Valenciana
M urcia (Región de)
-10,00%
-5,00%
0,00%
5,00%
10,00%
15,00%
-8,00% -6,00% -4,00% -2,00% 0,00% 2,00% 4,00%
C onsumo
Andalucía Cataluña Comunitat Valenciana M urcia (Región de)
•Catalonia and Valencia with the highest prices increases have reduced per capita consumption above 9%

País Precio $/m3 Coste ($) 200 m3
PIB ($) per cápita (PPA) 2006 % Agua s/PIB
Dinamarca 5,354 1.070,74 36.920 1,16%
Suiza 4,917 983,37 38.706 1,02%
Holanda 3,557 711,33 36.987 0,77%
Austria 3,443 688,65 36.368 0,76%
Francia 3,404 680,87 31.825 0,86%
Finlandia 3,258 651,51 35.559 0,73%
Suecia 3,011 602,12 34.735 0,69%
Bélgica 2,875 574,92 34.749 0,66%
Alemania 2,740 547,99 31.390 0,70%
Chipre 2,672 534,43 29.870 0,72%
Australia 2,305 460,94 33.037 0,56%
Noruega 2,180 435,97 44.648 0,39%
Grecia 2,126 425,26 33.004 0,52%
Hungría 1,877 375,32 30.047 0,50%
Japón 1,866 373,17 32.530 0,46%
Portugal 1,623 324,69 22.937 0,57%
España 1,507 301,40 27.914 0,43%
Italia 1,358 271,52 31.051 0,35%
Canadá 0,789 157,80 35.514 0,18%
Lituania 0,766 153,19 16.373 0,37%
Rumania 0,728 145,53 10.125 0,57%
Estados Unidos 0,658 131,60 43.223 0,12%
Argentina 0,203 40,65 16.080 0,10%
Differences in water prices(and per capita GDP)
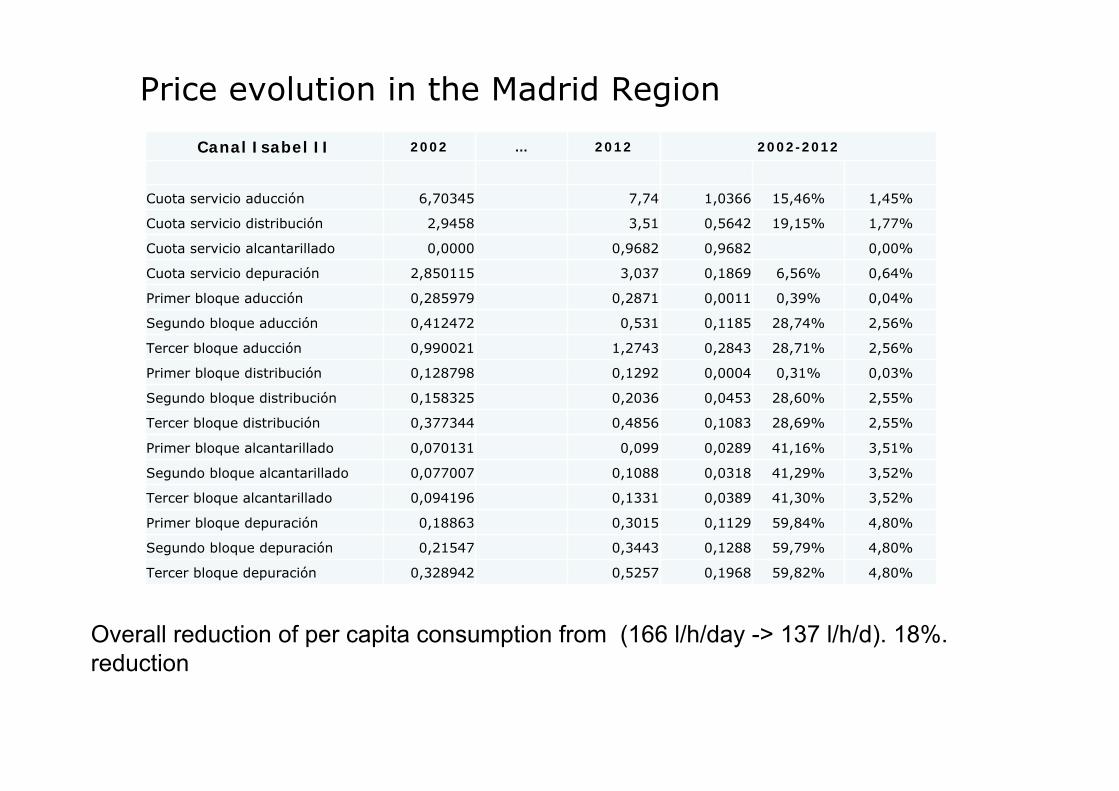
Price evolution in the Madrid Region
Canal Isabel II 2002 … 2012 2002-2012
Cuota servicio aducción 6,70345 7,74 1,0366 15,46% 1,45%
Cuota servicio distribución 2,9458 3,51 0,5642 19,15% 1,77%
Cuota servicio alcantarillado 0,0000 0,9682 0,9682 0,00%
Cuota servicio depuración 2,850115 3,037 0,1869 6,56% 0,64%
Primer bloque aducción 0,285979 0,2871 0,0011 0,39% 0,04%
Segundo bloque aducción 0,412472 0,531 0,1185 28,74% 2,56%
Tercer bloque aducción 0,990021 1,2743 0,2843 28,71% 2,56%
Primer bloque distribución 0,128798 0,1292 0,0004 0,31% 0,03%
Segundo bloque distribución 0,158325 0,2036 0,0453 28,60% 2,55%
Tercer bloque distribución 0,377344 0,4856 0,1083 28,69% 2,55%
Primer bloque alcantarillado 0,070131 0,099 0,0289 41,16% 3,51%
Segundo bloque alcantarillado 0,077007 0,1088 0,0318 41,29% 3,52%
Tercer bloque alcantarillado 0,094196 0,1331 0,0389 41,30% 3,52%
Primer bloque depuración 0,18863 0,3015 0,1129 59,84% 4,80%
Segundo bloque depuración 0,21547 0,3443 0,1288 59,79% 4,80%
Tercer bloque depuración 0,328942 0,5257 0,1968 59,82% 4,80%
Overall reduction of per capita consumption from (166 l/h/day -> 137 l/h/d). 18%. reduction

EXAMPLE OF THE MADRID REGION- Impact of the structure of the tariff
• In 2002 the fixed part of the tariff was 29% of the total bill, in 2013 it has become 48% • Advantages; financial reliability, less incentive (10% of savings in 2002 mean a 7% of
reduction in the bill; in 2013 it would reduce the bill by 5%)
Evolution of fixed and variable charges
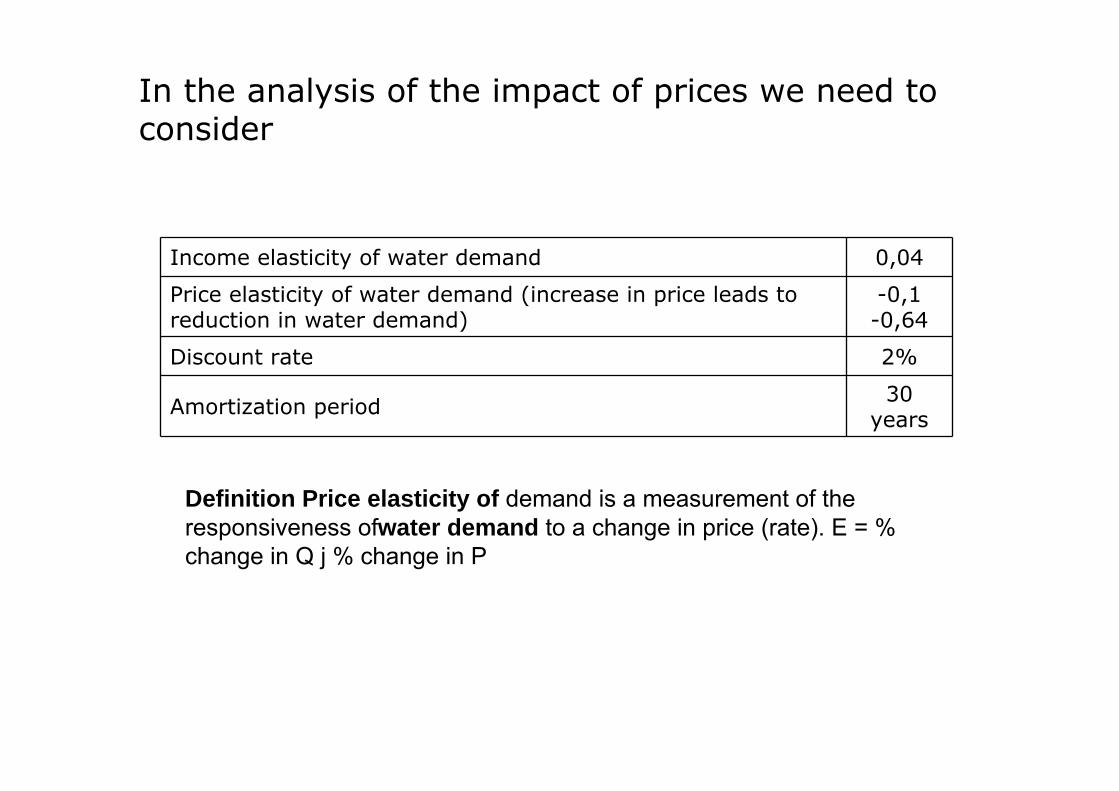
In the analysis of the impact of prices we need to consider
Income elasticity of water demand 0,04
Price elasticity of water demand (increase in price leads to reduction in water demand)
-0,1 -0,64
Discount rate 2%
Amortization period 30 years
Definition Price elasticity of demand is a measurement of the responsiveness ofwater demand to a change in price (rate). E = % change in Q j % change in P

Impact of price increase on demand
• ε = -0,64
• High increase in prices• Leads to decrease in
water use (between 4%-68%).
• ε = -0,1
• With a moderated increase in prices
• The water demand in maintained or there is a small reduction on water use per capita (0%-5%).

Importance of volumetric pricing reflecting increasing costs
€/ha €/hora €/m3
08 SINDICATO GENERAL DE AGUAS DE DOLORES 26,85 VARIABLE08 LA ESTAFETA 0,3 VARIABLE08 ASCOY, BENÍS Y CARRASQUILLA 15,4 0,1705 MIXTA FIJA-VARIABLE08 LA CORREDERA 6 0,0841 MIXTA FIJA-VARIABLE08 FUENTE DEL PERAL 30 0,15 MIXTA FIJA-VARIABLE08 JESÚS DEL GRAN PODER 9 0,1 MIXTA FIJA-VARIABLE08 MIRAFLORES 0,14 VARIABLE08 MAZARRÓN 132,22 0,34 VARIABLE08 RÍO ALHÁRABE 2500 0,2 VARIABLE08 SAN VÍCTOR 143,11 VARIABLE08 PUERTO LUMBRERAS 0,28 VARIABLE08 POZO DE LA DECARADA 0,12 13 MIXTA VARIABLE-OTROS08 SERRANA - LOS ALBARES 0,13 VARIABLE08 CAÑADAS DE SAN PEDRO 0,4 VARIABLE08 HEREDAMIENTO REGANTE DE MOLINA DE SEGURA 126 0,12 VARIABLE08 POZO DEL HORNO 6 0,06 MIXTA FIJA-VARIABLE08 ONTUR-ALBATANA 13 0,036 148,5 MIXTA VARIABLE-OTROS08 HEREDAMIENTO DE AGUAS HUERTA DE COLOMÍ Y TIRIEZA 0,3 VARIABLE08 C.R. Sindicato de Riegos de Cuevas de Almanzora 10,97 0,38 VARIABLE08 POZO DE PERDIGUERA 10 0,06 MIXTA FIJA-VARIABLE08 JUZGADO PRIVATIVO DE AGUAS DE CALLOSA 25 VARIABLE08 COMUNIDAD DE REGANTES DE CATRAL 42538 VARIABLE08 ACEQUIA DE DAYA VIEJA 2,22 VARIABLE08 JUZGADO DE AGUAS DE GUARDAMAR 85 VARIABLE08 EL MOJÓN DE LA MATANZA 0,13 VARIABLE08 JUZGADO PRIVATIVO DE AGUAS DE ROJALES 70,63 VARIABLE09 CR DE MONFORTE DEL CID 180,3 0,27 VARIABLE09 CR DE LA DEPURADORA DE LA SÉNIA 10 VARIABLE09 CR DE ALCALÁ DEL JÚCAR 85,4 VARIABLE09 CR SAN ISIDRO (Villavieja) 0,145 VARIABLE09 CR DE LA PRESA DEL PUENTE DE ALCARAZ 6 VARIABLE09 C.R. DE PEDREGUER 2124 0,16 VARIABLE09 C.R. ALICANTE 59,5 VARIABLE09 C.R. MINEOLA 0,45 VARIABLE09 C.R. POZO LA ,MONTAÑETA 0,18 VARIABLE09 C.R. ALMIZRRA DE CAMPO DE MIRRA 43,32 0,15 VARIABLE09 C.R. SINDICATO DE RIEGOS DE LA HUERTA DE ALICANTE 84,73 VARIABLE09 SAT EL TESORO CADILLEJO 0,07 VARIABLE09 C.R. DE CASTELLON 528 0,18 VARIABLE09 C.R. CARBONARIA Y CABALLERA 0,13 VARIABLE09 C.R. RIUS SANT JORDI 6139,1001 0,09 MIXTA FIJA-VARIABLE09 CR DE LA CIUDAD DE TERUEL 69,3 VARIABLE09 C.R. AYELO DE MALFERIT 168 VARIABLE09 C.R. FUENTES , LAS 108 VARIABLE09 SAT LAGUNA Nº 5370 0,07 VARIABLE09 C.R. AZUD DE LORCA 12 VARIABLE09 CANAL DE RIEGO DEL RIO TURIA (ACEQUIA DEL ORO) 182,4 VARIABLE09 C.R. POZO FURELL 360 0,33 0,11 VARIABLE09 CDAD. REGT. POZO LA PLACETA 0,21 VARIABLE09 C.R. POZO PLA FILANER 0,12 VARIABLE09 C.R. DE MATET 0,9 VARIABLE
CUENCA CUOTA FIJA €/ha
CUOTA OTROS TIPO TARIFA APLICADADENOMINACIÓN SOCIEDAD
CUOTA VARIABLE
Source: 2007-2009 WFD reports

High value (GVA) of Mediterranean Agriculture – There is ability to pay for desalinated water (about 4500 €/ha)

CMA y Segura 2005 Herbáceos200 hm3
10%(0,8 mill €)
Hortalizas e Invernadero
768 hm3
39%(2.689 mill €)
Leñosos1.018 hm3
51%(179 mill €)
Júcar 2005
Leñosos967 hm3
64%(63 mill. €)
Hortalizas e Invernadero
139 hm3
9%(1.619 mill €)
Herbáceos416 hm3
27%(9,4 mill €)
This is due to the importance of Horticulture and permanent crops . Importance of guarantee supply; and demand of
quality water for internal and external markets
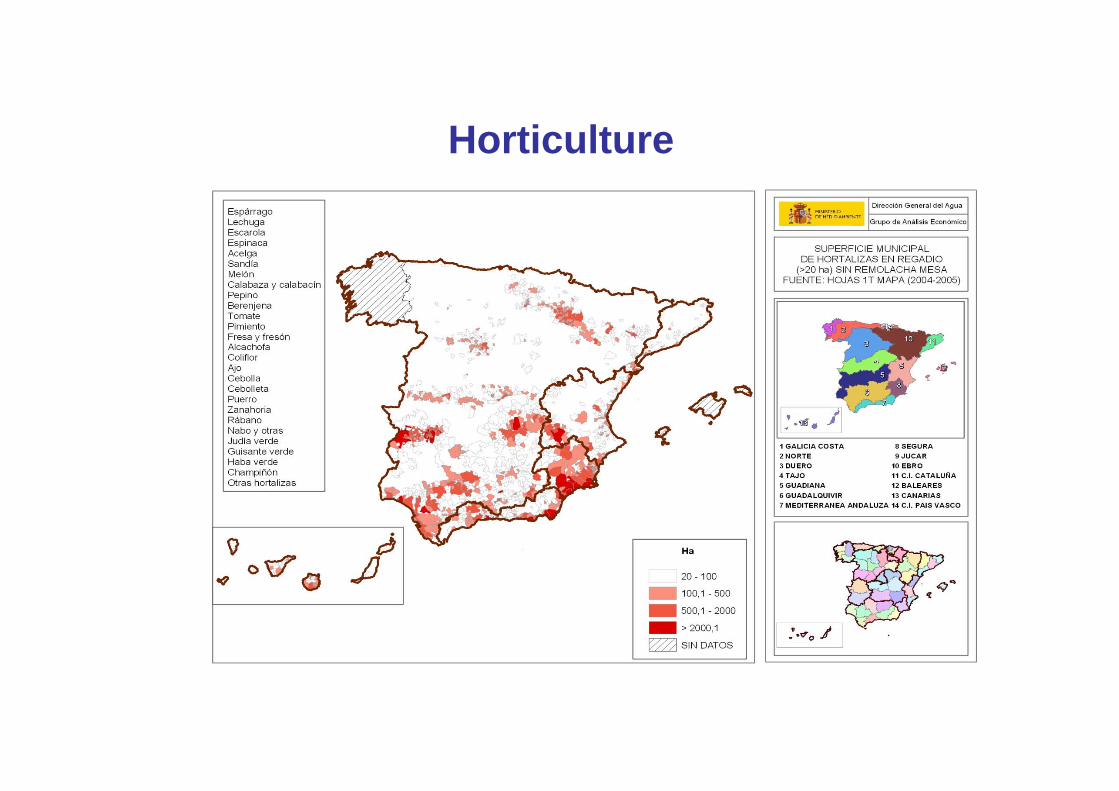
Horticulture

Permanent crops

Examples• Between farmers with cereal
crops –wheat- and farmers in horticulture and with permanent crops. “Canal de Estremera and Sindicato de Regantes ATS” (3 years)
• 31 hm3 (GL)
• 0.18 €/m3.
• Between farmers irrigating maize and water supply company for tourist destination and industrial area “C.R. del Canal de las Aves and Mancomunidad de los Canales del Taibilla”,:
• 36 hm3 (GL)
• 0,27 €/m3 .
• Strategic reserve

EXAMPLES
• C.R. del Bembézar a Aguas de Almanzora S.A.
• 3.6 hm3 (GL)
• 0,18 €/m3
• C.R. de Pago de la Vega del Serón a Aguas del Almanzora.
• 0. 9 hm3 (GL)
• 0,15 €/m3 .
• Company bought Rice farmers properties to transfer water license to their horticulture farm in the Almanzora
• 700 Has 9.3 (Hm3/GL)
• 0.04 €/m3

SEGURA Basin
0,01 €/m3
0,21 €/m3
0,49 –0,52 €/m3
SURFACE
Groundwater
DESALINATED
0,11 €/m3 Average
Tajo-Segura transfer
0,10 €/m3
558 Hm3 450 Hm3 451 Hm3 31 Hm3

SEGURA Basin
0,49 – 0,52 €/m3
SURFACEL
GROUNDWATER
Coste Medio
TAJO –SEGURA WATER TRANSFER
558 Hm3 450 Hm3 451 Hm3 118 Hm3
0,01 €/m3
0,10 €/m3
0,11 €/m3
0,21 €/m3
0,14 €/m3
∆ 0,03 €/m3
DESALINATED
∆ 87 Hm3
Previsiones desalación (CEDEX, 2006)

Water pricing and water security

Two cases• Main irrigation area in Murcia (SCRATS)
– Increases in prices of water tranfers (∆ 32%) and desalination will mean an increase in average price of bulk water from 0,115 €/m3 to 0,16 €/m3 (∆ 39%).
– Margins vary between 0,25-10,90 €/m3, Average of 1,8 €/m3.– Gross Value of increase production of 52,32 Million €
• Main Water supply to Alicante and Murcia (Mancomunidad de los Canales del Taibilla)– Supply to 2.4 million people; 50% of water of Tajus Transfer; – Present costs of bulk water between 0,14 €/m3 y 0,52 €/m3.
Charges of the Mancommunity to distribution water suppliers are of 0,43 €/m3.
– Expected increases of 19% (0,081 €/m3) with changes in the balance of the mix of water sources.
– The increases in costs of bulk water means an increase of 5% in Alicante, 4% in Murcia, in the HH water bill
– This means on average 0,10% of family income in Alicante and 0,14% in Murcia. Increase in resilience of water supplies in a tourist destination

Existing Communication
Campaigns

Campaigns on…
• Droughts, water scarcity. • Water Quality• Health concerns. • Service disruptions.

• Who communicates: WOPs responsibilities.
• What key messages we want to communicate about scarcity/water value, extreme events, health and sanitation, water quality,
• To whom: client groups, women, men, youth, rural, urban, illiterate, poor.
• Means for communicating: media, web, electronic and print material, workshops, ads with celebrities..
• Effects: IN WATER SAVED, IMPROVED HEALTH..
The important questions in communication

Communication campaigns: droughtsAguas de Barcelona (AGBAR)
Date: Spring-Summer 2008Objectives:
Encourage wise water useIncreased awareness about the importance of the drought
ActionsInform about the drought situation that affected Barcelona in 2008Inform the population about measures taken to guarantee water supply
Means:Special section on the webInformation and messages on the bill invoiceCustomer workshops, seminars, conferences
Effects: Decrease of 4% in household water consumption from Dec. 2007 to Dec. 2008

Communication campaigns: droughtsEMASESA: Seville Municipal Public Operator
• Date: 2005• Objectives: Reduction in water consumption,
Improvements in reservoir levels • Actions: Inform and increase awareness about the
drought situation that affected Seville in 2005• Means: Exhibitions on the occasion of World Water
Day and World Environment Day, Distribution and promotion of good practices among professionals, Radio messages, Information and Interviews on TV , Press releases, Special section on the web, Street campaigns, Messages on the invoice
• Effects: water consumption decreased, improved dialog with citizens, behavior changes

Educational activities

Objective• Educate in specific values: Which
values?• Increase knowledge: Of which specific
issues?• Promote behavior changes: To achieve
what?
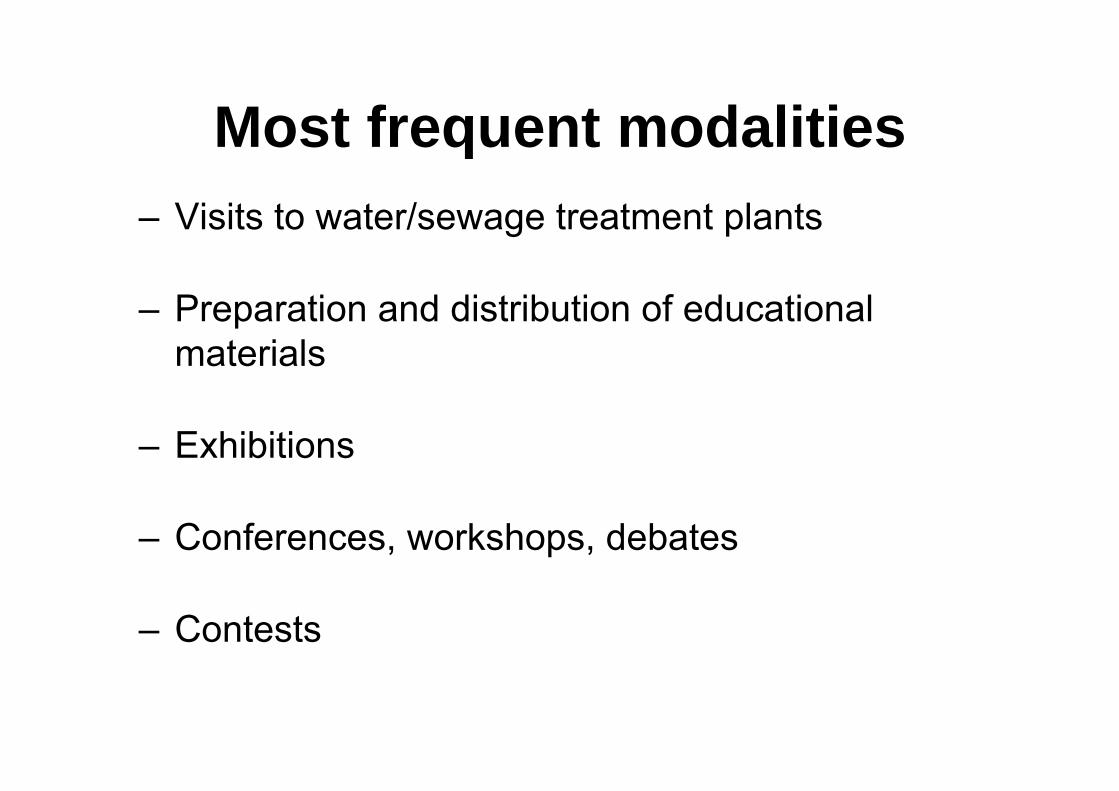
Most frequent modalities– Visits to water/sewage treatment plants
– Preparation and distribution of educational materials
– Exhibitions
– Conferences, workshops, debates
– Contests

Morocco: Office National de l’Eau Potable (ONEP)
• Initiative: Kids corner• Educational levels: primary and
secondary education• Themes: water cycle, water
treatment, water consumption, water pollution
• Means: mainly materials to be downloaded from the web, painting contests
• Main strengths: materials available in French and in Arabic

Nicaragua: Enacal• Initiative: Hablemos del Agua• Educational levels: secondary
education, university, communities• Themes: wise use of water, pollution,
wastewater management• Means: conferences, distribution of
books and notebooks containing key messages, competitions
• Main strengths: activities beyond the educational centre, implication of families
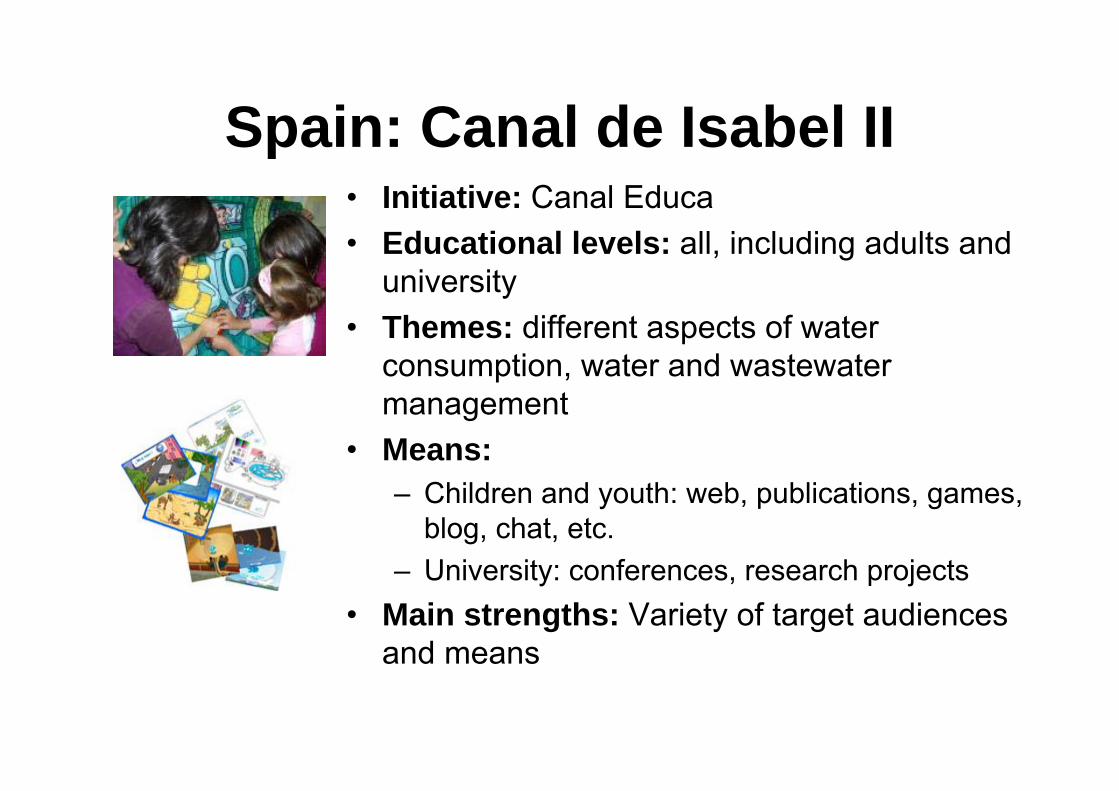
Spain: Canal de Isabel II• Initiative: Canal Educa• Educational levels: all, including adults and
university• Themes: different aspects of water
consumption, water and wastewater management
• Means:– Children and youth: web, publications, games,
blog, chat, etc.– University: conferences, research projects
• Main strengths: Variety of target audiences and means
Irrigation water use and prices of water services to
farmers

The cost of provision of bulk water supply in the
Mediterranean Basins and the effects of desalination

JÚCAR Basin
0,02 €/m3
0,07 €/m3
0,49-0,52€/m3
SURFACE
GROUNDWATER
DESALINATED
0,06 €/m3 Average
707 Hm3 2.361 Hm3 30 Hm3

JÚCAR Basin
0,02 €/m3
0,08 €/m3
0,49-0,52€/m3
SURFACE
GROUNDWATER
DESALINATED
0,06 €/m3
∆ 170 Hm3
Coste medio
∆ 0,02 €/m3
707 Hm3 2.361 Hm3 200Hm3
Previsiones desalación (CEDEX, 2006)

ANDALUCIA MEDITERRANEAN BASIN
0,019 €/m3
0,13 €/m3
SURFACE
GROUNDWATER
DESALINATED
0,09 €/m3 Coste Medio
782 Hm3 534 Hm3 96 Hm3
0,49 – 0,52 €/m3

0,019 €/m3
SURFACE
GROUNDWATER
0,09 €/m3 ∆ 0,02 €/m3
∆ 94 Hm3
Coste medio
782 Hm3 534 Hm3 180 Hm3
0,13 €/m3
0,11 €/m3
DESALINATED
0,49 – 0,52 €/m3
Previsiones desalación (CEDEX, 2006)
ANDALUCIA MEDITERRANEAN BASIN

COST STRUCTURE OF NEW DESALINATED WATER SUPPLY
Fuente: Informes de proyectos MMA
27%
3%
22%
38%
1% 6% 3%
Inversión Personal M&R Energía Gestión Financieros Otros

Conclusions• Relatively low costs of bulk water supply because of economies of
scale of conventional sources. Situation changing rapidly with less reliability of traditional sources of supply.
• Increases in average costs of bulk water with non conventional sources (desalination and WW reuse) (between 25% and 40%).
• Infrastructure costs of about 27% of total costs of desalinated water supply before distribution. Expected subsidies represent 7% of total supply costs (including O&M).
• Ability to pay of main users in the area. Linked to improved resilience to climate change and improved productivity.

ANNEX

The Hydrologic environment: a key to explain long term economic performance
H Development•Harnessed hydrology•Hampered by hydrology.•Hostage to hydrology.

Precipitation, actual evapotranspiration and runoff in Spain in mm (period 1940‐2005)
0
100
200
300
400
500
600
700
800
900
1000
1940 1945 1950 1955 1960 1965 1970 1975 1980 1985 1990 1995 2000 2005
mm
/año
Precipitación (mm)
Evapotranspiración real (mm)
Escorrentía (mm)
Irregular hydrological regimes in Spain
Mean annual precipitation (mm)
Mean annual runoff (mm)Source: Ministry of the Environment, Rural and Marine Affairs, Spain

Water pressure index: water use‐return flows / potential water availability
<0,5 Low 0,5‐1 Circumstantial water stress>1 Structural water stress
Water stress
Source: Ministry of Environment, Rural and Marine Affairs

Vulnerability: water scarcity risk in water resource systems. The most critical Spanish areas are arid and semiarid ones where water scarcity and drought problems are greater.
Impact on water resources and vulnerability in Spain
Impact on runoff reduction for a decrease of 5% in mean annual precipitation and an increase of 1ºC in mean annual temperature (year 2030) a decrease between 9 and 25% in runoff is expected depending on the river basin districts. Source: White Paper on Water in Spain, MMA (2000)

Precipitaciones
0
50
100
150
200
250
300
350
400
450
500
550
600
650
700
750
800
1961
1966
1971
1976
1981
1986
1991
1996
2001
2006
2011
2016
2021
2026
2031
2036
2041
2046
2051
2056
2061
2066
2071
2076
2081
2086
2091
2096
Pre
cipitaci
ón t
ota
l anual (m
m
ECHAM4 Model. Escenario A2
Precipitations
1961‐1990
2011‐2040
2041‐2070
2071‐2100
Source: Ministry of the Environment, Rural and Marine Affairs, Spain

ETP. ECHAM4. A2
1000
1050
1100
1150
1200
1250
1300
1350
1400
1450
1500
1961
1966
1971
1976
1981
1986
1991
1996
2001
2006
2011
2016
2021
2026
2031
2036
2041
2046
2051
2056
2061
2066
2071
2076
2081
2086
2091
2096
Evapotr
ansp
iraci
ón p
ote
nci
al to
tal anual (m
ECHAM4 Model. Escenario A2
Potential evapotranspiration
1961‐1990
2011‐2040
2041‐2070
2071‐2100

Escorrentía Budyko. ECHAM4. A2
0
25
50
75
100
125
150
175
1961
1966
1971
1976
1981
1986
1991
1996
2001
2006
2011
2016
2021
2026
2031
2036
2041
2046
2051
2056
2061
2066
2071
2076
2081
2086
2091
2096
Esc
orr
entía t
ota
l anual (m
m
Runoff
ECHAM4 Model. Escenario A2
1961‐1990
2011‐2040
2041‐2070
2071‐2100
Source: Ministry of the Environment, Rural and Marine Affairs, Spain

0,00%
1,00%
2,00%
3,00%
4,00%
5,00%
6,00%
7,00%
8,00%
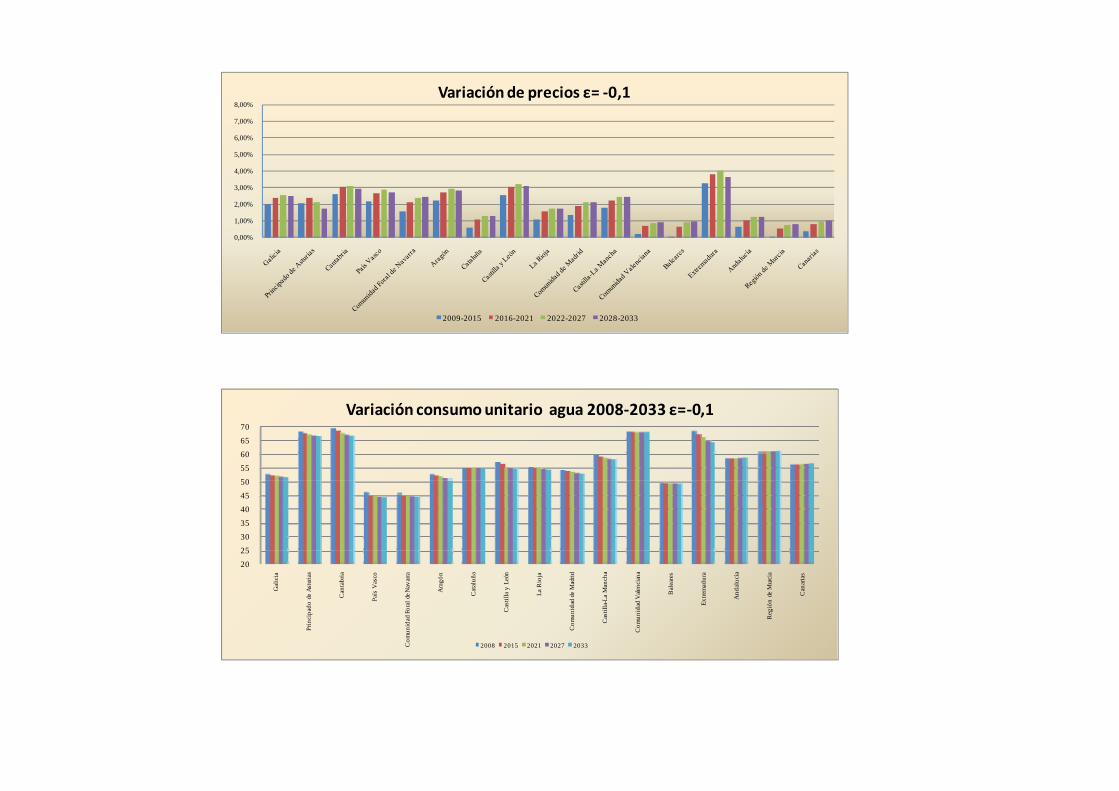
Variación de precios ε= ‐0,64
2009-2015 2016-2021 2022-2027 2028-2033
20
25
30
35
40
45
50
55
60
65
70
Gal
icia
Prin
cipa
do d
e As
turia
s
Can
tabr
ia
País
Vas
co
Com
unid
ad F
oral
de N
avar
ra
Ara
gón
Cat
aluñ
a
Cas
tilla
y L
eón
La R
ioja
Com
unid
ad d
e M
adrid
Cas
tilla
-La
Man
cha
Com
unid
ad V
alenc
iana
Bal
eare
s
Extre
mad
ura
And
aluc
ía
Reg
ión
de M
urci
a
Can
aria
s
Variación consumo agua 2008‐2033 ε=‐0,64
2008 2015 2021 2027 2033
0,00%
1,00%
2,00%
3,00%
4,00%
5,00%
6,00%
7,00%
8,00%Variación de precios ε= ‐0,1
2009-2015 2016-2021 2022-2027 2028-2033
20
25
30
35
40
45
50
55
60
65
70
Gal
icia
Prin
cipa
do d
e As
turia
s
Can
tabr
ia
País
Vas
co
Com
unid
ad F
oral
de N
avar
ra
Ara
gón
Cat
aluñ
a
Cas
tilla
y L
eón
La R
ioja
Com
unid
ad d
e M
adrid
Cas
tilla
-La
Man
cha
Com
unid
ad V
alenc
iana
Bal
eare
s
Extre
mad
ura
And
aluc
ía
Reg
ión
de M
urci
a
Can
aria
s
Variación consumo unitario agua 2008‐2033 ε=‐0,1
2008 2015 2021 2027 2033