the role of empiricism in improving the reliability of … slide “the role of empiricism in...
TRANSCRIPT

Title Slide
“The role of empiricism in improving the reliability offuture software"
Les Hatton
CISM, Kingston [email protected], [email protected]
Version 1.1: 25/Aug/2008
TAIC 2008, 29-08-2008. . . . . . . . . . . . . . . . . . . . . . . . . . . . . . . . . . . . . . . . . . . . . . . . . . . . . . . . . . . . . . . . . . . . . . . . . . . . . . . . . . .

Copyright Les Hatton, 2008- Slide 2
Overview
“Good tests kill flawed theories; we remain alive to guess again”
“Science must begin with myths, and with the criticism of myths”
Karl Popper 1902-1994

Copyright Les Hatton, 2008- Slide 3
Overview
Some historySoftware metrics, the bad, the worse and the uglyScale-free behaviour and statistical mechanicsSome more useful empirical results

Copyright Les Hatton, 2008- Slide 4
Fashion …languages, bloody languages
In my career, I have been forced to write programs in:-FocalAtlas AutocodeAlgolVarious assemblers, FPS microcode, MVS JCL, SEL firmwareFortran 66, 77, 90CPascal, OccamAda (briefly)C++, Java 1 and 2Various scripting languages, PHP, Perl, Tcl/Tk, Bash, Javascript, MySQL, …and back to C again, (this time from choice)
Copyright Les Hatton, 2008- Slide 5
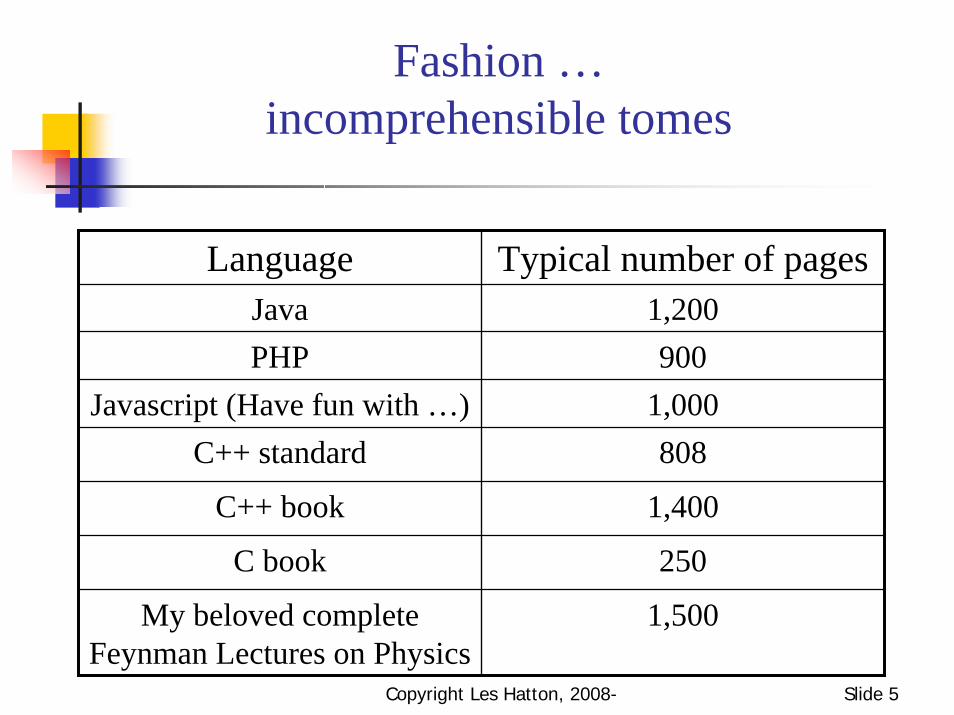
Fashion …incomprehensible tomes
Language Typical number of pagesJava 1,200PHP 900
Javascript (Have fun with …) 1,000C++ standard 808
C++ book 1,400
C book 250
My beloved complete Feynman Lectures on Physics
1,500

Copyright Les Hatton, 2008- Slide 6
Fashion …paradigms, bloody paradigms
In the final year at Kingston 2008, third year projects used
C, C#, C++, Java, Perl, PHP, MySQL, XML, HTML, XHTML, VB.Net on XP, Mac OS X, Linux, Vista with Eclipse, Netbeans, Ant, JWSDP, Glassfish, Linden script, DreamWeaver, Flash, Developer Studio.Net and a few others I can’t recall.
This is to satisfy the needs of industry as if they had any idea what they wanted.

Copyright Les Hatton, 2008- Slide 7
Fashion …inadequate statistical reasoning
Very few papers attempt to establish significance for their results using standard methodsA typical result might read A > B therefore A is (better / worse – substitute as appropriate) than B.

Copyright Les Hatton, 2008- Slide 8
And the result …
In the USA …• 01/08/2008 US Office of Management and Budget
have identified approximately 413 Government projects totalling at least $25 billion which are poorly planned, poorly performing or both.
• http://blogs.spectrum.ieee.org/riskfactor/2008/08/
Copyright Les Hatton, 2008- Slide 9
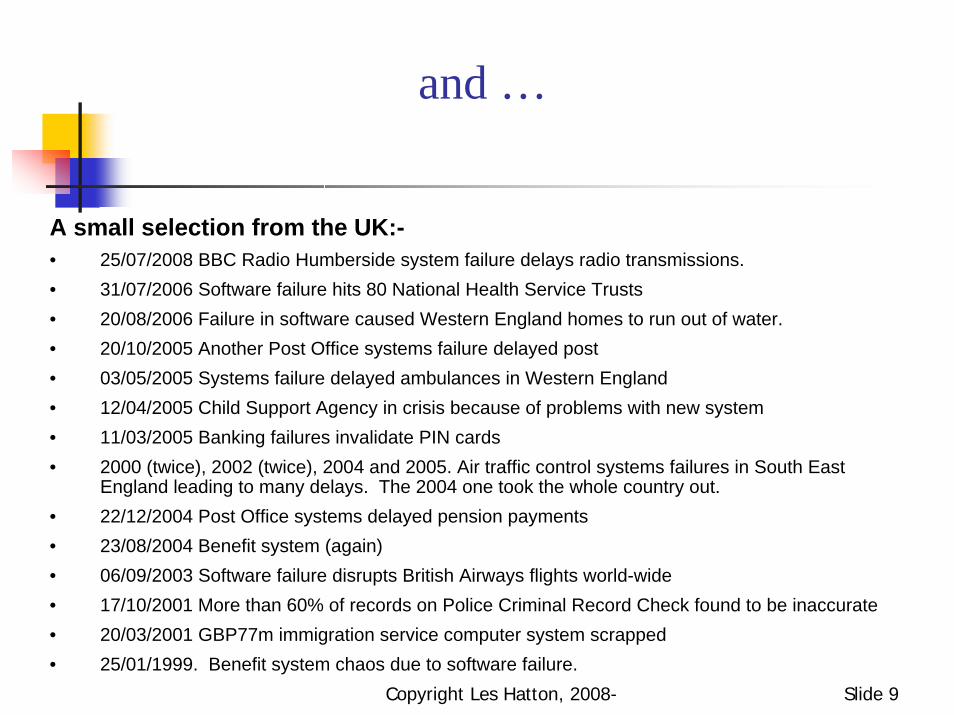
and …
A small selection from the UK:-• 25/07/2008 BBC Radio Humberside system failure delays radio transmissions.• 31/07/2006 Software failure hits 80 National Health Service Trusts• 20/08/2006 Failure in software caused Western England homes to run out of water.• 20/10/2005 Another Post Office systems failure delayed post• 03/05/2005 Systems failure delayed ambulances in Western England• 12/04/2005 Child Support Agency in crisis because of problems with new system• 11/03/2005 Banking failures invalidate PIN cards• 2000 (twice), 2002 (twice), 2004 and 2005. Air traffic control systems failures in South East
England leading to many delays. The 2004 one took the whole country out.• 22/12/2004 Post Office systems delayed pension payments• 23/08/2004 Benefit system (again)• 06/09/2003 Software failure disrupts British Airways flights world-wide• 17/10/2001 More than 60% of records on Police Criminal Record Check found to be inaccurate• 20/03/2001 GBP77m immigration service computer system scrapped• 25/01/1999. Benefit system chaos due to software failure.

Copyright Les Hatton, 2008- Slide 10
And a day in the life of a mail server (26-Aug-2008) …
Event # occurrencesReceived messages 47,267
Rejected as non-compliant - 32,501Silently discarded as junk - 13,722
Content filtered spam / scam - 924
Trojans - 22
Delivered (to 6 domains) 98 (0.2%)
Root dictionary attacks 160
Copyright Les Hatton, 2008- Slide 11
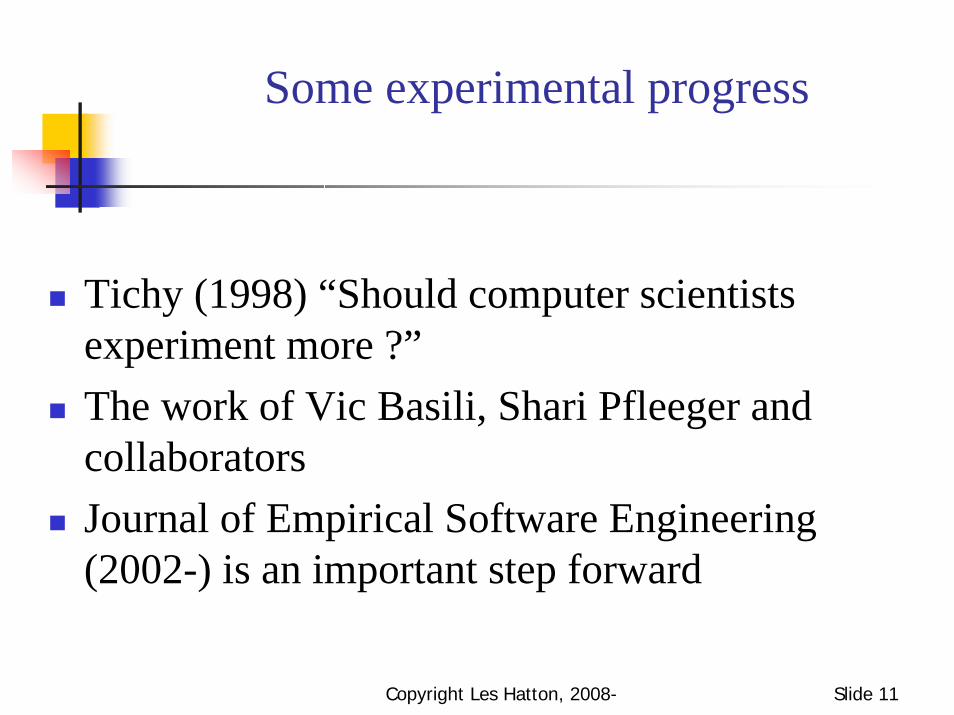
Some experimental progress
Tichy (1998) “Should computer scientists experiment more ?”The work of Vic Basili, Shari Pfleeger and collaboratorsJournal of Empirical Software Engineering (2002-) is an important step forward

Copyright Les Hatton, 2008- Slide 12
Overview
Some historySoftware metrics, the bad, the worse and the uglyScale-free behaviour and statistical mechanicsSome more useful empirical results

Copyright Les Hatton, 2008- Slide 13
Some examples of ‘metrics’
The goto statementNaur (1963), Dijkstra (1968) and hundreds of othersProhibited in Simula, OccamBanned by MISRA C (1998,2004), ESA Ada (1998), JSF C++ (2005),
if … else if … with no else, (MISRA, JSF)Maximum depth of control nesting, (ESA)Maximum cyclomatic number, (most use this)Perhaps 40 or so in general use.
Copyright Les Hatton, 2008- Slide 14
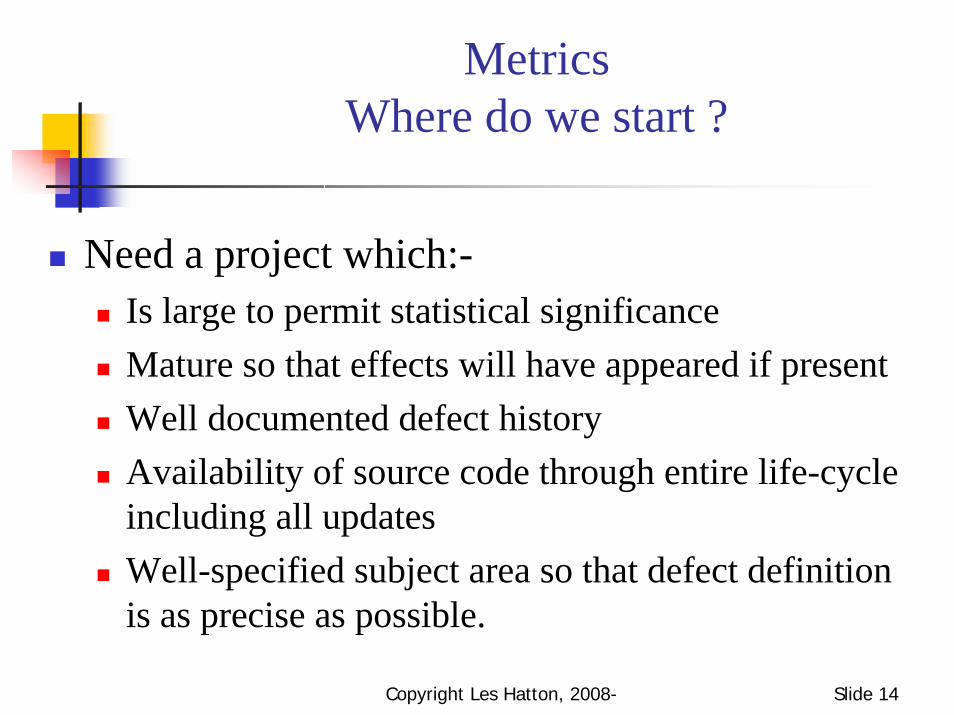
MetricsWhere do we start ?
Need a project which:-Is large to permit statistical significanceMature so that effects will have appeared if presentWell documented defect historyAvailability of source code through entire life-cycle including all updatesWell-specified subject area so that defect definition is as precise as possible.

Copyright Les Hatton, 2008- Slide 15
MetricsWhere do we start ?
Candidate 1: NAG Fortran Library 1970-2000266,123 XLOC in 3,659 subroutinesDevelopment history 1970-1999All defect data embedded in codeAnalysed source from 13 out of 19 MarksScientific subroutine library with excellent specs.
Candidate 2: NAG C library, 1990-1999Developed from Fortran and with similar specs

Copyright Les Hatton, 2008- Slide 16
MetricsWhere do we start ?
Candidate 1: NAG Fortran Library 1970-2000Full parse of Fortran, extracted 19 metrics
Candidate 2: NAG C library, 1990-1999Full parse of C, extracted 7 metrics
Linear regression, then Principle Component Analysis then smoothing to find any patterns

Copyright Les Hatton, 2008- Slide 17
Lesson 1:Cyclomatic complexity effectively useless
See also:-Woodward et al(1979) (and van der Meulen (2008) on a very large sample).

Copyright Les Hatton, 2008- Slide 18
Lesson 2:No metric strongly correlated
This is typical …

Copyright Les Hatton, 2008- Slide 19
Lesson 3:PCA – a very confused picture
Principle eigenvector

Copyright Les Hatton, 2008- Slide 20
Lesson 4:Some metrics weakly anti-correlated
Both are significant at the 5% level and behave opposite to the accepted doctrine
Copyright Les Hatton, 2008- Slide 21
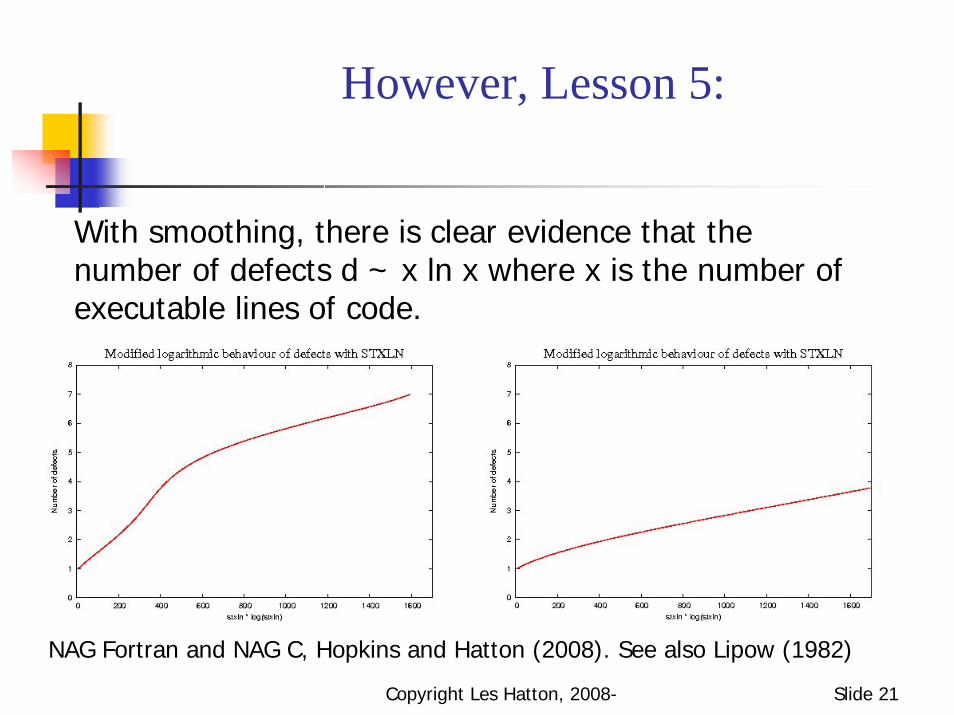
However, Lesson 5:
With smoothing, there is clear evidence that the number of defects d ~ x ln x where x is the number of executable lines of code.
NAG Fortran and NAG C, Hopkins and Hatton (2008). See also Lipow (1982)
Copyright Les Hatton, 2008- Slide 22
Overview
Some historySoftware metrics, the bad, the worse and the uglyScale-free behaviour and statistical mechanicsSome more useful empirical results

Copyright Les Hatton, 2008- Slide 23
What is scale-free behaviour ?
In this context, scale-free behaviour refers to a phenomenon whose frequency of occurrence is given by a power-law.Consider word-counting in a document. If n is the total number of words in a document and ni is the number of occurrences of word i, then it is observed(originally by Zipf (1949)), that for many texts,
pi icf = where c, p are constants and
nn
f ii ≡

Copyright Les Hatton, 2008- Slide 24
What is scale-free behaviour ?
pi incn =Re-writing as
This is usually shown as
ipncni ln)ln(ln −=
which looks likeln ni
ln i
and sometimes

Copyright Les Hatton, 2008- Slide 25
What is scale-free behaviour ?
pi incn =
Gives
Summing and re-arranging
))1(ln5772.0( 2tOttn ++=
where n is the total number of words and t is thetotal number of distinct words
For systems with this behaviour we can predict the total length from their ‘vocabulary’.
for p = 1

Copyright Les Hatton, 2008- Slide 26
What is scale-free behaviour ?
Written texts …
Actual length / Zipf length
012345678
Kin
g Ja
mes
Bib
le
The
Kor
an
Sw
edis
h B
ible
(in S
wed
ish)
Tam
ing
of th
esh
rew
Hen
ry V
Mac
beth
Thre
e M
en in
a B
oat
Adv
entu
res
ofS
herlo
ck
US
AC
onst
itutio
n
Eur
opea
nC
onst
itutio
n
Com
mon
Vul
nera
bilit
ies

Copyright Les Hatton, 2008- Slide 27
What is scale-free behaviour ?
NAG Fortran library, (Hopkins and Hatton 2008) …
Actual length
Predicted length

Copyright Les Hatton, 2008- Slide 28
More examples
Physics:- specific heat of spin glasses at low temperature, Caudron et al (1981)Biology: Protein family and fold occurrence in genomes, Qian et al. (2001)Biology: Evolutionary models, Fenser et al (2005)Economics: Income distributions, Rawlings et al (2004)Software systems: incoming and outgoing references and class sizes in OO systems, Potanin et al (2002)Fractals also exhibit scale-free behaviour (Novak):-
http://cism.kingston.ac.uk/people/details.php?AuthorID=577
Studies of C systems also reveal scale-free behaviour (Jones)http://www.knosof.co.uk/cbook/cbook.html

Copyright Les Hatton, 2008- Slide 29
General mathematical treatment
Consider a general system of N atomic objects dividedinto M pieces each with ni objects, each piece having aproperty ei associated with it.
1 2 3 ….
nr,er
… M
∑=
=M
iinN
1

Copyright Les Hatton, 2008- Slide 30
General mathematical treatment
!!...!!
21 MnnnNW =The number of ways of organising this is:-
Stirling’s approximation + logs as usual gives:-
i
M
ii nnNNW ∑
=
−=1
lnlnln
In physical systems, we seek to find the most likelyarrangement by maximising this subject to two constraints
i
M
iienU ∑
=
=1
∑=
=M
iinN
1
and

Copyright Les Hatton, 2008- Slide 31
General mathematical treatment
0)(ln =WδUsing Lagrange multipliers and setting
leads eventually to the most likely (i.e. equilibrium) distribution being given by
∑=
−
−
=≡ M
i
e
ei
ii
i
e
eNn
p
1
β
β
where pi is the probability of piece i getting a share eiof U and β is a constant.

Copyright Les Hatton, 2008- Slide 32
General mathematical treatment
To summarise
The equilibrium distribution of the ei subject to theconstraints
i
M
iienU ∑
=
=1
∑=
=M
iinN
1and
∑=
−
−
=≡ M
i
e
ei
ii
i
e
eNn
p
1
β
β
is
Copyright Les Hatton, 2008- Slide 33
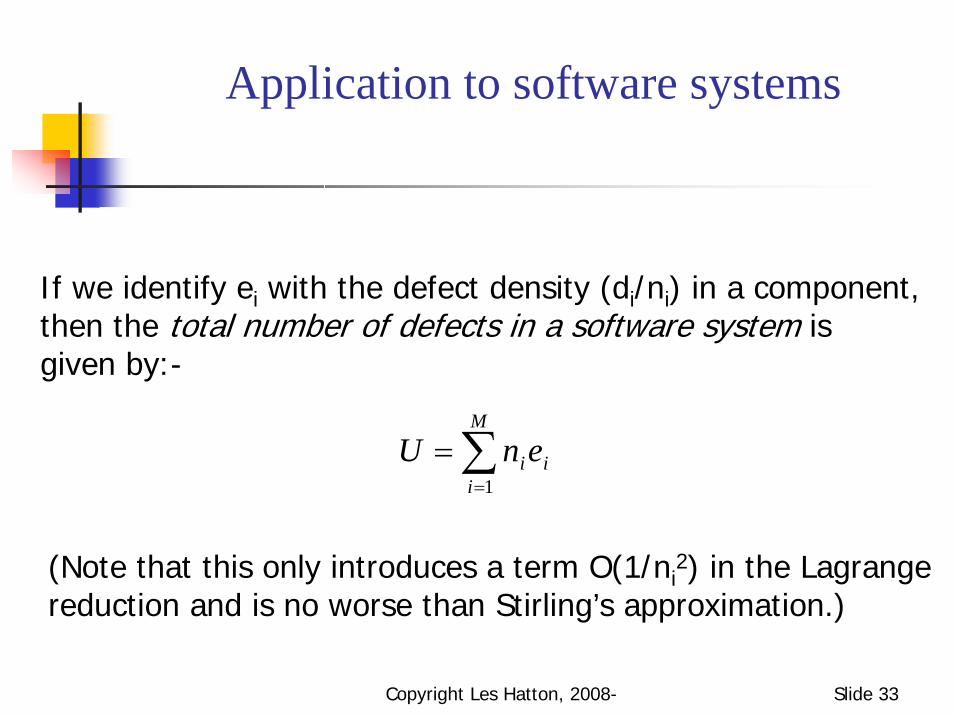
Application to software systems
If we identify ei with the defect density (di/ni) in a component,then the total number of defects in a software system isgiven by:-
i
M
iienU ∑
=
=1
(Note that this only introduces a term O(1/ni2) in the Lagrange
reduction and is no worse than Stirling’s approximation.)

Copyright Les Hatton, 2008- Slide 34
General mathematical treatment
ln ni
ln i
However, how are pi distributed in real software systems ?
Distribution in two large systems as they mature, i.e. become quasi-equilibrated.

Copyright Les Hatton, 2008- Slide 35
Application to software systems
Averaged over 21 very different quasi-equilibrated systems in Fortran, C and Tcl-Tk
βi
i nCp ≈
These distributions are classic power-lawbehaviour and it appears to be present a priori

Copyright Les Hatton, 2008- Slide 36
Application to software systems
This is linear with statistical significance at least 1%

Copyright Les Hatton, 2008- Slide 37
General mathematical treatment
Bringing it all together, the number of defects in a system is effectively frozen at release. So, as a system approaches quasi-equilibrium subject to the constraints,
∑=
−
−
=≡ M
i
e
ei
ii
i
e
eNn
p
1
β
β
∑=
=M
iinN
1
and i
M
iienU ∑
=
=1
Then a priori power-law behaviour
βi
i nCp ≈ +
=> ei ~ ln ni or di ~ ni ln ni

Copyright Les Hatton, 2008- Slide 38
Application to software systems
and this is what we appear to observe …
NAG Fortran and C libraries, Hatton and Hopkins (2008). See also Lipow (1982)

Copyright Les Hatton, 2008- Slide 39
Application to software systems
So this appears inevitable
Constraints on size and defects
Power-law size distribution
x ln x behaviour of defect density
These appear to be fixed a priori
Copyright Les Hatton, 2008- Slide 40
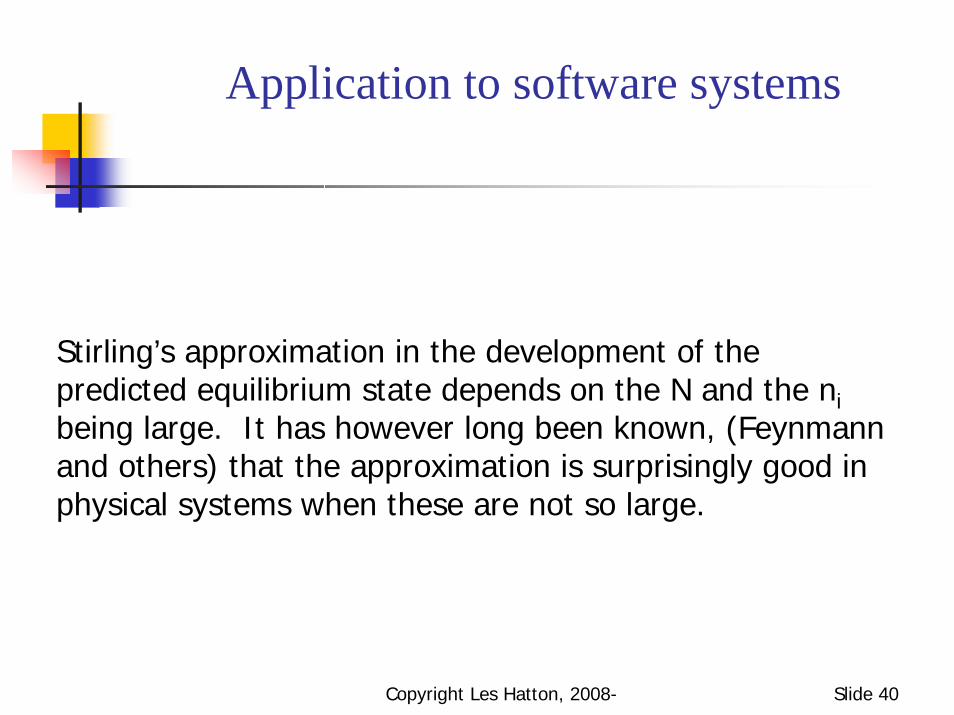
Application to software systems
Stirling’s approximation in the development of the predicted equilibrium state depends on the N and the nibeing large. It has however long been known, (Feynmann and others) that the approximation is surprisingly good in physical systems when these are not so large.

Copyright Les Hatton, 2008- Slide 41
Overview
Some historySoftware metrics, the bad, the worse and the uglyPower-law behaviour and statistical mechanicsSome more useful empirical results
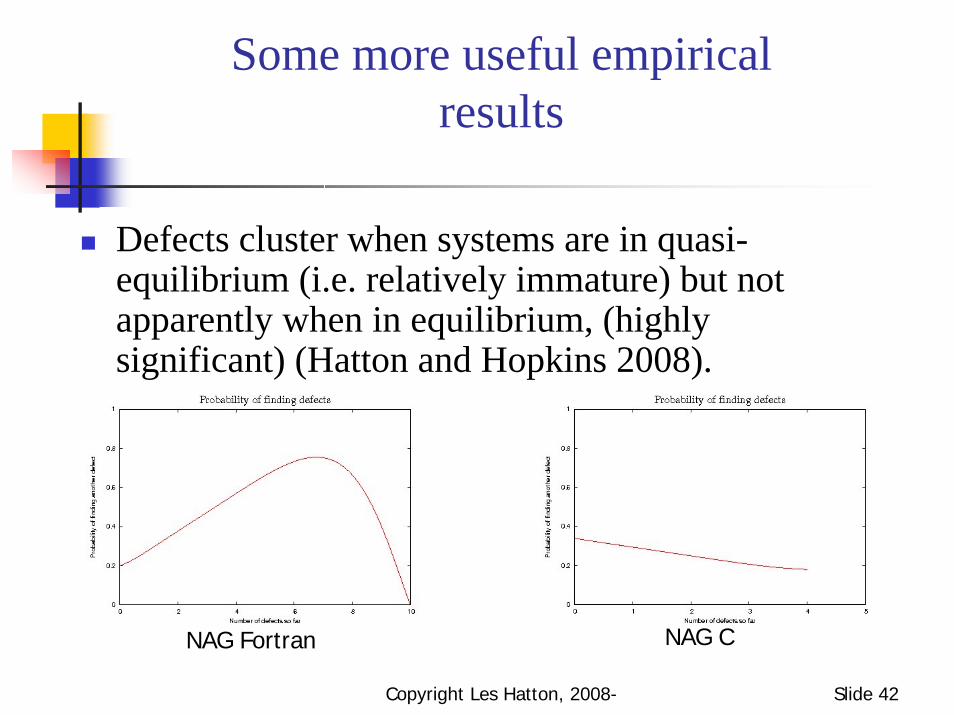
Copyright Les Hatton, 2008- Slide 42
Some more useful empirical results
Defects cluster when systems are in quasi-equilibrium (i.e. relatively immature) but not apparently when in equilibrium, (highly significant) (Hatton and Hopkins 2008).
NAG Fortran NAG C

Copyright Les Hatton, 2008- Slide 43
Some more useful empirical results
Note that this clustering is extreme with 78% (2865/3659) of the NAG Fortran components exhibiting no defectsEven in the C library, 66% (1506/2267) of the components have exhibited no defects
Nothing in either analysis has so far been able to find any reason for this, so the current best guess is that its purely statistical, like asking why a particular person has won the lottery, (the answer being of course that everybody else didn’t).
Copyright Les Hatton, 2008- Slide 44
Some more useful empirical results
The following are all statistically significantChecklists do not appear to improve inspection capability, (highly significant), (Hatton (2008)).The Pascal construct for i:= m to n is far more reliable than the C/C++ equivalent for (i=1; i<=m,…) (van der Meulen (2008))Run-time checks are just as effective on reliable code as unreliable code so don’t remove them, (van der Meulen (2008)).

Copyright Les Hatton, 2008- Slide 45
Conclusions
Empirical results strongly suggest implementation independent behaviour is present in software systemsComponent sizes in software systems of very different size and language obey power-law distributions a prioriArguments based on statistical mechanics predict defect distribution behaviour which is observedExecutable lines of code is as good as any other metricIndividual metrics long-believed to be correlated to defect are weak at best and some appear even weakly anti-correlated.

Copyright Les Hatton, 2008- Slide 46
Conclusions
Most importantly, we are beginning to get a feeling for how defective systems behave without being too cluttered with implementation details.
I for one, find this very exciting.
Copyright Les Hatton, 2008- Slide 47
References
My writing site:-http://www.leshatton.org/