the role of entrepreneurial management on …
TRANSCRIPT
THE ROLE OF ENTREPRENEURIAL MANAGEMENT ON
PROMOTION OF INTRAPRENEURSHIP IN THE SMALL
AND MEDIUM MANUFACTURING ENTERPRISES IN
KENYA
JOSEPHINE MUMBUA MUTISO
DOCTOR OF PHILOSOPHY
(Entrepreneurship)
JOMO KENYATTA UNIVERSITY OF
AGRICULTURE AND TECHNOLOGY
2017
The Role of Entrepreneurial Management on Promotion of
Intrapreneurship in the Small and Medium Manufacturing Enterprises
in Kenya
Josephine Mumbua Mutiso
A Thesis Submitted in Partial Fulfilment for the Degree of Doctor of
Philosophy in Entrepreneurship in the Jomo Kenyatta University of
Agriculture and Technology
2017
ii
DECLARATION
This Thesis is my original work and has not been submitted for a degree in any other
University
Signature………………………...................... Date………………………….
Josephine Mumbua Mutiso
This Thesis has been submitted for examination with our approval as the University
supervisors.
Signature………………………...................... Date………………………….
Dr. Patrick K. Ngugi, PhD
JKUAT, Kenya.
Signature………………………...................... Date………………………….
Dr. Thomas A. Senaji, PhD
KEMU, Kenya

iii
DEDICATION
This Thesis is dedicated to my husband Peter, children Victor, Philip, Terry and to
my parents.
iv
ACKNOWLEDGEMENT
It is through God’s grace that I have come this far, therefore my foremost gratitude
goes to Him. I am highly indebted to my supervisors, Dr. Patrick K. Ngugi for his
immense support, guidance and encouragement in the entire process, and Dr.
Thomas A. Senaji for his guidance, input and patience in putting together a
meaningful thesis. My husband and children have been patient, understanding and
supportive throughout the study period and I sincerely thank them. My father was
crucial in this journey for prodding me from time to time to join the PhD
programme.
My gratitude also goes to the management at JKUAT NCBD and the entire JKUAT
fraternity for providing a conducive environment for completion of this thesis. I also
sincerely thank all my colleagues and friends who encouraged me in one way or
another.
v
TABLE OF CONTENTS
DECLARATION ............................................................................................................. II
DEDICATION ............................................................................................................... III
ACKNOWLEDGEMENT ............................................................................................ IV
TABLE OF CONTENTS ................................................................................................ V
LIST OF TABLES ........................................................................................................ IX
LIST OF FIGURES ..................................................................................................... XII
LIST OF APPENDICES ........................................................................................... XIV
ACRONYMS AND ABBREVIATIONS .................................................................... XV
OPERATIONAL DEFINITION OF TERMS ........................................................ XVII
ABSTRACT ................................................................................................................ XIX
CHAPTER ONE .............................................................................................................. 1
INTRODUCTION ............................................................................................................ 1
1.1 Background to the Study .......................................................................................... 1
1.2 Statement of the Problem ....................................................................................... 11
1.3 Research Objectives ............................................................................................... 12
1.4 Research Hypotheses ............................................................................................. 13
vi
1.5 Justification of the Study ........................................................................................ 13
1.6 Scope of the Study ................................................................................................. 14
1.7 Limitations of the Study ......................................................................................... 14
CHAPTER TWO ........................................................................................................... 15
LITERATURE REVIEW .............................................................................................. 15
2.1 Introduction ............................................................................................................ 15
2.2 Theoretical Review ................................................................................................ 15
2.3 Conceptual Framework .......................................................................................... 25
2.4 Empirical Review ................................................................................................... 37
2.5 Critique of Existing Literature ............................................................................... 42
2.6 Summary of Literature ........................................................................................... 45
2.7 Research Gaps ........................................................................................................ 47
CHAPTER THREE ....................................................................................................... 49
RESEARCH METHODOLOGY ................................................................................. 49
3.1 Introduction ............................................................................................................ 49
3.2 Research Design ..................................................................................................... 49
3.3Target Population .................................................................................................... 51
vii
3.4 Sample Size and Sampling Technique ................................................................... 52
3.5 Data Collection and Instruments ............................................................................ 57
3.6 Pilot Study .............................................................................................................. 57
3.7 Data Analysis and Presentation .............................................................................. 60
3.8 Measurement of variables ...................................................................................... 61
CHAPTER FOUR .......................................................................................................... 66
RESEARCH FINDINGS AND DISCUSSION ............................................................ 66
4.1 Introduction ............................................................................................................ 66
4.2 Response Rate ........................................................................................................ 66
4.3 Results of the Pilot Study ....................................................................................... 67
4.4 Demographic Description of Respondents............................................................. 71
4.5 Descriptive Statistics on Study Variable ................................................................ 77
4.6Statistical Modelling ............................................................................................. 100
4.7Optimal Model ...................................................................................................... 125
CHAPTER FIVE .......................................................................................................... 126
SUMMARY, CONCLUSIONS AND RECOMMENDATIONS ............................. 126
5.1 Introduction .......................................................................................................... 126
viii
5.2 Summary of Study Findings ................................................................................ 126
5.3 Conclusion ........................................................................................................... 134
5.4 Recommendation.................................................................................................. 136
5.5 Areas for Further Research .................................................................................. 137
REFERENCES ............................................................................................................. 139
APPENDICES .............................................................................................................. 168
ix
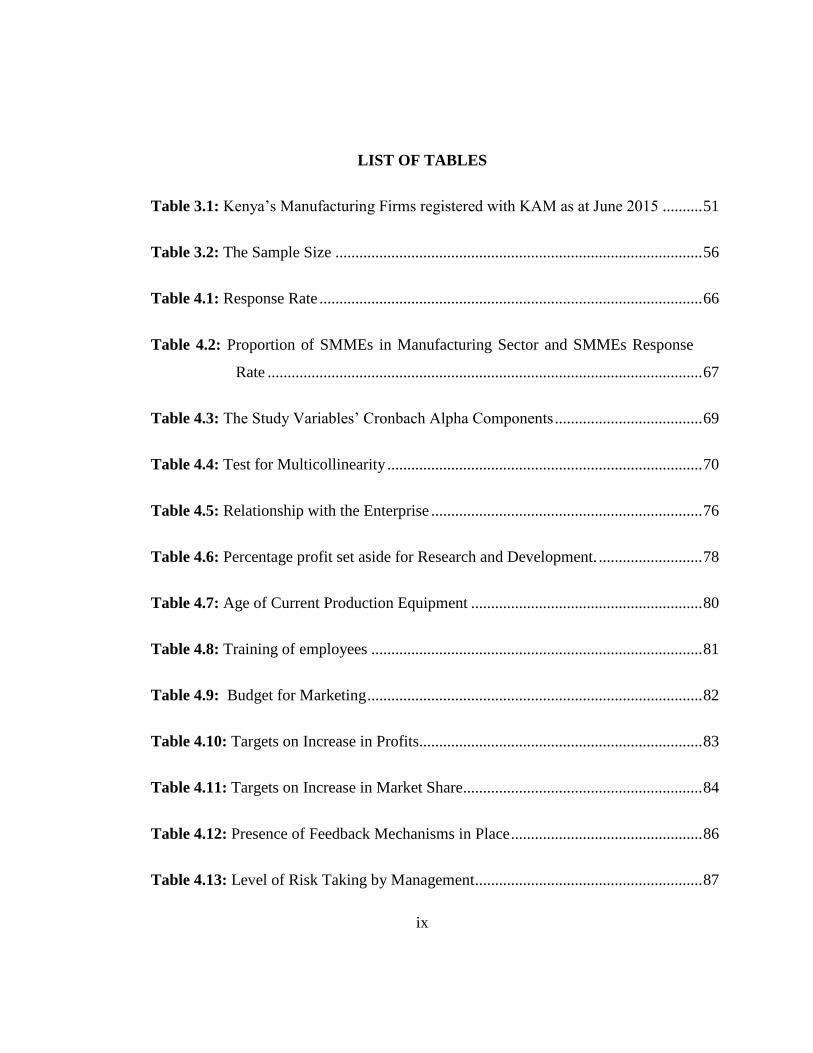
LIST OF TABLES
Table 3.1: Kenya’s Manufacturing Firms registered with KAM as at June 2015 .......... 51
Table 3.2: The Sample Size ............................................................................................ 56
Table 4.1: Response Rate ................................................................................................ 66
Table 4.2: Proportion of SMMEs in Manufacturing Sector and SMMEs Response
Rate ............................................................................................................. 67
Table 4.3: The Study Variables’ Cronbach Alpha Components ..................................... 69
Table 4.4: Test for Multicollinearity ............................................................................... 70
Table 4.5: Relationship with the Enterprise .................................................................... 76
Table 4.6: Percentage profit set aside for Research and Development. .......................... 78
Table 4.7: Age of Current Production Equipment .......................................................... 80
Table 4.8: Training of employees ................................................................................... 81
Table 4.9: Budget for Marketing .................................................................................... 82
Table 4.10: Targets on Increase in Profits....................................................................... 83
Table 4.11: Targets on Increase in Market Share............................................................ 84
Table 4.12: Presence of Feedback Mechanisms in Place ................................................ 86
Table 4.13: Level of Risk Taking by Management ......................................................... 87

x
Table 4.14: Promotions as a Result of New Ideas within the Years 2011 to 2015 ......... 88
Table 4.15: Monetary Reward for New Idea Contribution ............................................. 89
Table 4.16: Shareholding given to Employees for New Idea Generation ....................... 90
Table 4.17:.Grants given for Employees Individual Projects ......................................... 91
Table 4.18: Levels of Management. ................................................................................ 92
Table 4.19: How often Management gets Direct Information from Lower Levels ........ 93
Of Management ................................................................................................................ 93
Table 4.20:.Expectation of Employees to await Management Direction Before
Acting .......................................................................................................... 94
Table 4.21: Expectation of Employees to Always Abide by Laid Down Procedures .... 95
Table 4.22: Inclusion of Employees to Key Production and Marketing Decisions ........ 96
Table 4.23: What Gives Rise to New Opportunities ....................................................... 97
Table 4.24: Number of Times the Firms Upgraded Production Equipment/Process
since Inception ............................................................................................ 98
Table 4.25: Products not given to the Market that Firms can Rely on ............................ 99
Table 4.26: Percentage Increase in Market Share. ........................................................ 100
Table 4.27: Linear Regression analysis model results for commitment of Resources
on promotion of intrapreneurship ............................................................. 106
xi
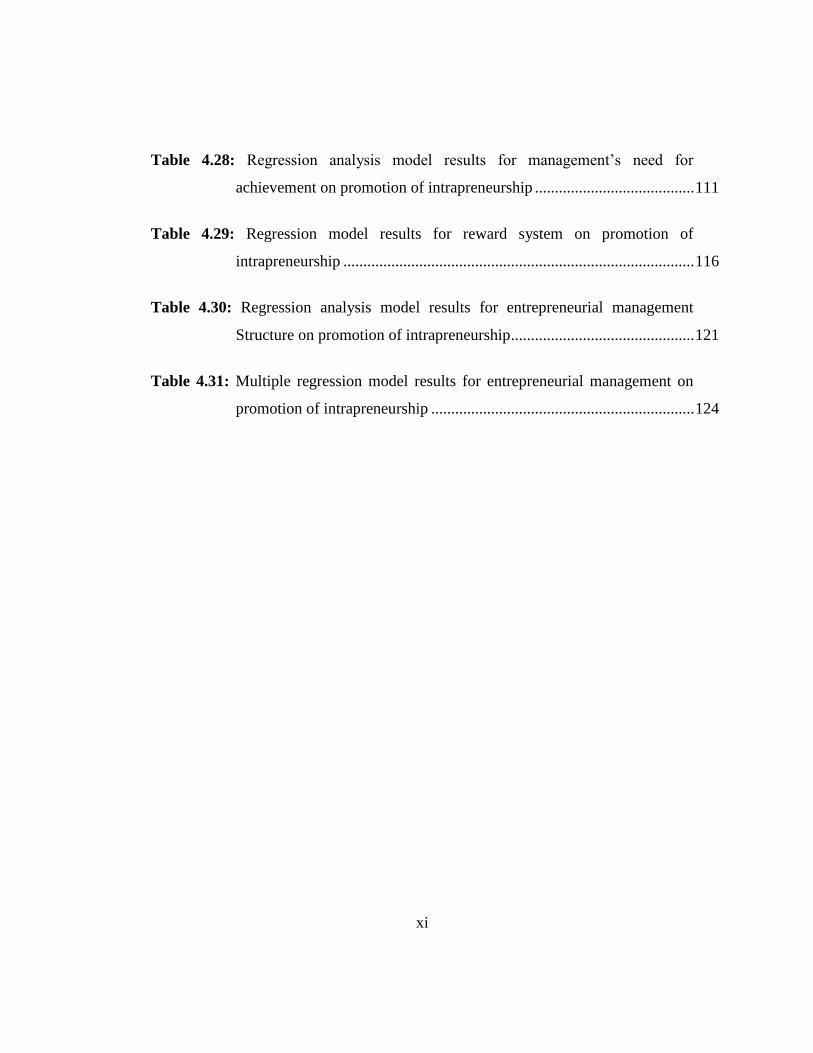
Table 4.28: Regression analysis model results for management’s need for
achievement on promotion of intrapreneurship ........................................ 111
Table 4.29: Regression model results for reward system on promotion of
intrapreneurship ........................................................................................ 116
Table 4.30: Regression analysis model results for entrepreneurial management
Structure on promotion of intrapreneurship .............................................. 121
Table 4.31: Multiple regression model results for entrepreneurial management on
promotion of intrapreneurship .................................................................. 124
xii
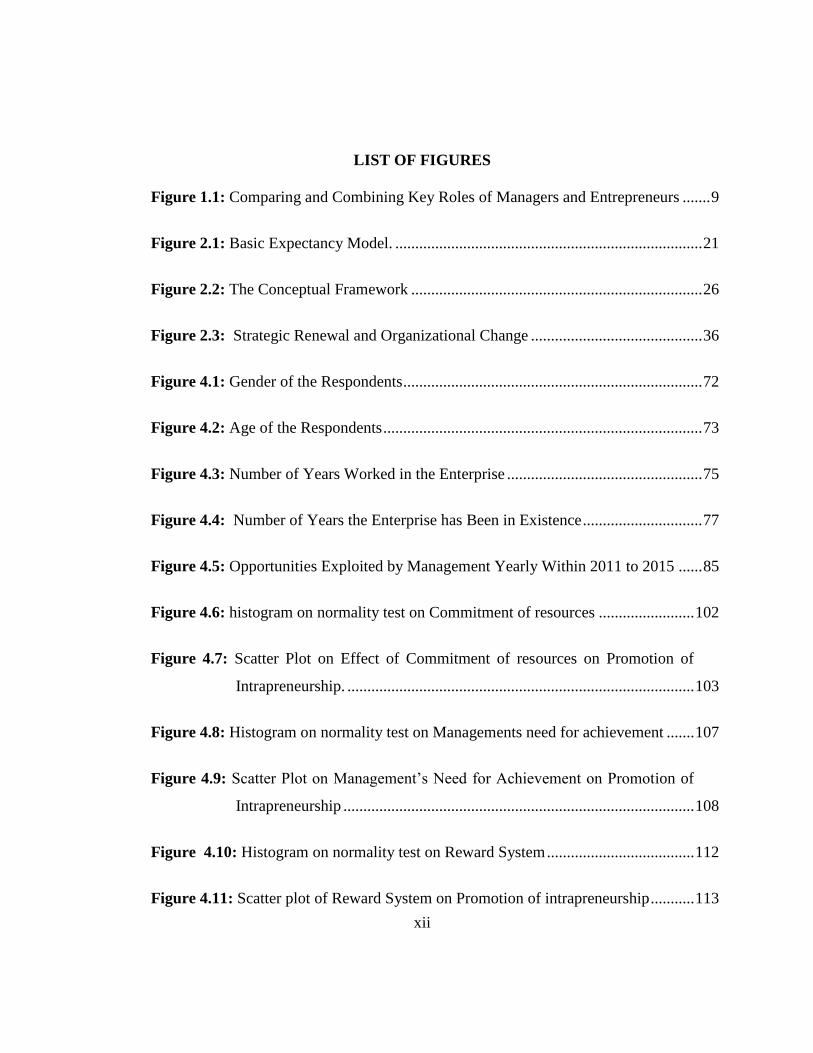
LIST OF FIGURES
Figure 1.1: Comparing and Combining Key Roles of Managers and Entrepreneurs ....... 9
Figure 2.1: Basic Expectancy Model. ............................................................................. 21
Figure 2.2: The Conceptual Framework ......................................................................... 26
Figure 2.3: Strategic Renewal and Organizational Change ........................................... 36
Figure 4.1: Gender of the Respondents ........................................................................... 72
Figure 4.2: Age of the Respondents ................................................................................ 73
Figure 4.3: Number of Years Worked in the Enterprise ................................................. 75
Figure 4.4: Number of Years the Enterprise has Been in Existence .............................. 77
Figure 4.5: Opportunities Exploited by Management Yearly Within 2011 to 2015 ...... 85
Figure 4.6: histogram on normality test on Commitment of resources ........................ 102
Figure 4.7: Scatter Plot on Effect of Commitment of resources on Promotion of
Intrapreneurship. ....................................................................................... 103
Figure 4.8: Histogram on normality test on Managements need for achievement ....... 107
Figure 4.9: Scatter Plot on Management’s Need for Achievement on Promotion of
Intrapreneurship ........................................................................................ 108
Figure 4.10: Histogram on normality test on Reward System ..................................... 112
Figure 4.11: Scatter plot of Reward System on Promotion of intrapreneurship ........... 113
xiii
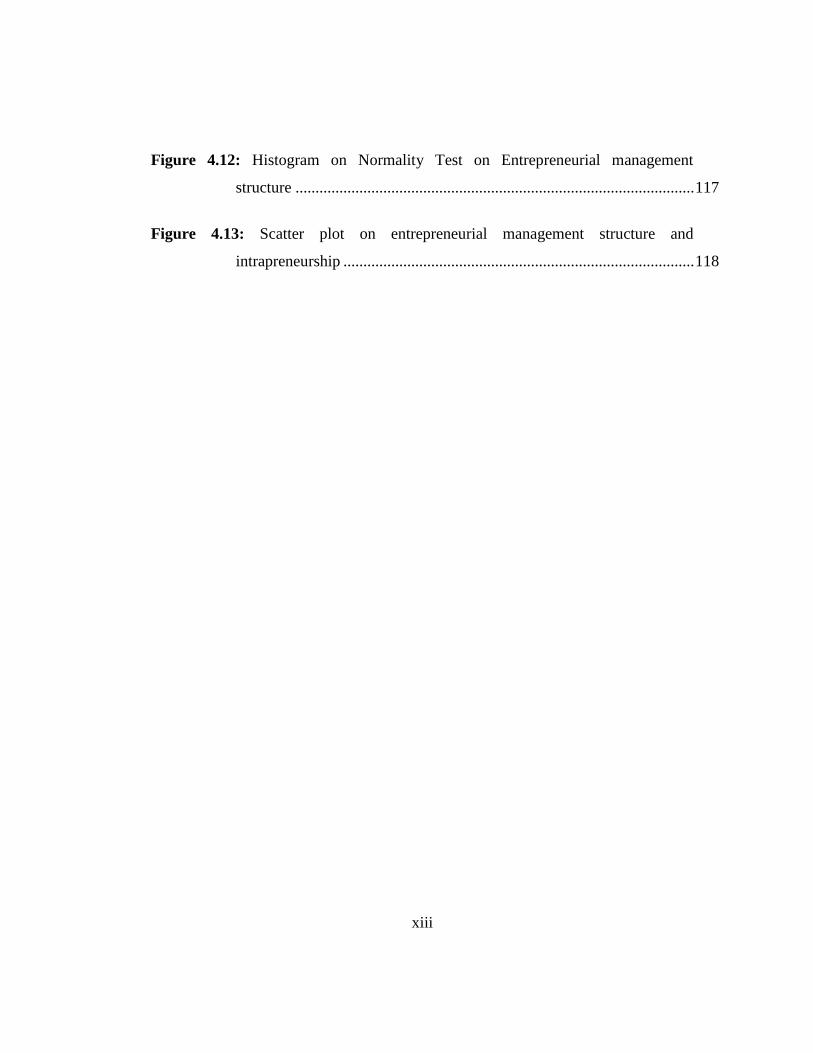
Figure 4.12: Histogram on Normality Test on Entrepreneurial management
structure .................................................................................................... 117
Figure 4.13: Scatter plot on entrepreneurial management structure and
intrapreneurship ........................................................................................ 118

xiv
LIST OF APPENDICES
Appendix 1: Questionnaire/Interview Guide ................................................................ 168
Appendix II: Sample Size Calculation Table ............................................................... 175
Appendix III: Results of Factor Analysis ..................................................................... 176
xv
ACRONYMS AND ABBREVIATIONS
AECT - Association for Educational Communications and Technology
ANOVA - Analysis of Variance
CR - Commitment of Resources
EC - European Commission
EMS - Entrepreneurial Management Structure
GDP - Gross Domestic Product
IFAC - International Federation of Accountants
ILO - International Labour Organization
INT - Intrapreneurship
KAM - Kenya Association of Manufactures
KPMG - Klynveld Peat Marwick Goerdeler
KIPPRA - Kenya Institute for Public Policy and Research and Analysis
KSHS - Kenyan Shillings
MNA - Management’s Need for Achievement
MSE - Micro and Small Enterprise
NAM - National Association of Manufacturers
xvi
OECD - Organization for Economic Co-operation and Development
ROK - Republic of Kenya
ROSA - Republic of South Africa
ROU - Republic of Uganda
RS - Reward System
SME - Small and Medium Enterprises
SMMES - Small and Medium Manufacturing Enterprises
SPSS - Statistical Package for Social Sciences
UN - United Nations
UNIDO - United Nations Industrial Development Organization
USA - United States of America
USBLS - United States Bureau of Labour Statistics
xvii
OPERATIONAL DEFINITION OF TERMS
Intrapreneurship Also referred to as corporate entrepreneurship, is the
entrepreneurial behaviour within incumbent
organizations (Jong, Parker, Wennekers, & Wu,
2011; Antonic & Antonic, 2011).
Entrepreneurial Management This is the type of management that helps firms
outperform the more administrative ones by being
strategic oriented, opportunity driven, committing
resources, growth oriented, having an entrepreneurial
culture, putting in place entrepreneurial management
structures and having a reward philosophy that
compensates employees (Kuhn, Sassmannshausen, &
Zollin, 2010).It is also achievement oriented
(Niuwenhuizen, 2008).
Entrepreneurial Management Structure A flat and organic structure with multiple
informal networks. The informal networks are
flexible and intended to encourage and create
enabling condition for employees to seek and create
opportunity, thus focused on rapidly detecting and
acting rapidly on environmental changes (Kuhn,
Sassmannshausen & Zollin, 2010).
Manufacturing The mechanical, physical, or chemical
transformation of materials, substances, or
components into new products (USBLS, 2014).
xviii
Need for Achievement A tendency to choose and persist at activities that
hold a moderate chance of success or a maximum
opportunity of personal achievement satisfaction
without the undue risk of failure (Okhomina, 2010).
Reward System This is a structured method of evaluating and
compensating employees based on their performance
(Holmes, Carvalho & Powers, 2010).
Resources All assets, organizational processes, capabilities,
organizational skills, management skills,
information and knowledge, categorized into
tangible, intangible and financial
(Laosirihongthong, Prajogo & Adebanjo, 2014).
xix
ABSTRACT
The manufacturing sector in Kenya has over the years experienced a lag in its
growth as statistics show thus necessitating a need to improve its performance. The
small and medium manufacturing enterprises are the majority in the sector and form
part of the SME sector, which in general is an important part of the country’s
economy as it generates over 60% of employment in the economy, but faces a
myriad of challenges. Practicing intrapreneurship has been known to improve
growth and profitability in firms, but SMEs have not fully embraced it.
Entrepreneurial management as opposed to administrative management is necessary
for any firm because it is pro-active, risk- taking and opportunity driven. This type
of management supports intrapreneurship which is of great value to a firm. This
study was therefore aimed at examining the role of entrepreneurial management on
promotion of intrapreneurship in Small and Medium Manufacturing Enterprises
(SMMEs) in Kenya. The objectives of the study were to determine how commitment
of resources, management’s need for achievement, reward system and
entrepreneurial management structure, promote intrapreneurship in the SMMEs. A
preliminary study was carried on a representative sample of 254 managers or
entrepreneur owner managers from the manufacturing firms registered under Kenya
Association of Manufacturers using stratified random sampling, from which 145
firms participated. Out of the 145 firms, 133 firms were found to be SMMEs. Data
was collected from 114 either managers or entrepreneur owner managers who
successfully participated in the study. Pilot testing was undertaken on 10% of the
sample to establish the validity and reliability of the quessionnaire as the instrument
of data collection using Cronbach Alpha. Descriptive and correlational research
designs were used for the study. Factor analysis was also used to determine the
suitability of the variables to the research. The use of linear regression was
determined by tests of multicollinearity, scatter plots and normality tests. Linear
regression analysis was used to establish the relationship between the independent
variables and dependent variable. The study hypotheses were tested using the
significance of the p values which led to the rejection of the null hypotheses and to
the acceptance of the alternative hypotheses. The findings of the study showed
entrepreneurial management significantly promoted intrapreneurship in SMMEs in
Kenya. Given their importance, SMMEs should embrace this type of management
so as to improve their performance through intrapreneurship. This would make their
contribution to the growth of the economy of Kenya to be more significant. Based
on the findings, further areas of research were recommended for example in the
areas of policy whereby the Government of Kenya can include entrepreneurial
management in its curricular of training entrepreneurs.
1
CHAPTER ONE
INTRODUCTION
1.1 Background to the Study
The aim of this study was to find out the role of entrepreneurial management on
promotion of intrapreneurship in the small and medium manufacturing enterprises
(SMMEs) in Kenya. The study was in particular focused on commitment of resources,
management’s need for achievement, reward system and entrepreneurial management
structure as the independent variables which play a role in the promotion of
intrapreneurship in these enterprises. Manufacturing is a key sector in not only the local
but also the global economy. Its importance is not limited to adding value but also
creates jobs and drives innovation for long-term sustainable economic growth. This is
both for emerging and developing economies in the world (Kennedy, 2013).
According to UNIDO (2015), the world manufacturing sector has continued to struggle
in its growth as a result of the global financial crisis of the year 2009, and this has
resulted in the developing countries being the main engine in the growth of the global
manufacturing. The pace of the growth is entirely not encouraging as it has over the past
few years decelerated. The sector is also in transition in many countries and faces
several challenges that are significant to its continued performance as pointed out by the
Chartered Institute of Management Accountants (2010). It is for these reasons that
measures should be undertaken to reduce the challenges defacing the sector. Most of the
worlds manufacturing is undertaken by the SME sector as affirmed by the Edinburg
Group (2012) that SMEs constitute about 95% of all the enterprise across the world, but
according to Katua (2014), have unique challenges which hinder their growth and
innovativeness.
Management plays an important role in overcoming challenges facing an organization
and therefore becoming a strong link in its performance. Management’s role is critical in
2
the direction and purpose of an organization for example through goal setting,
motivation, effective plans and support for innovation among others (Sullivan, 2011).
An organization’s management should constitute an entrepreneurial approach to issues.
It should therefore combine entrepreneurial behaviour like being innovative, risk taking
and creative, with administrative functions, among others, for the growth of the
organization (Smith, Hampson, Chaston & Badger 2003).
One way to enhance an organization’s performance is through intrapreneurship, which
has been linked to a firm’s performance of increased profits, with those firm’s that
practice it turning in better results (Kolokavic, Sisek, & Milovanovic, n.d).
Entrepreneurial management approach and commitment especially by top management
within an organization is required for intrapreneurship (Hisrich, Peters and Shepherd,
2010).
1.1.1 Small and Medium Scale Enterprises (SMEs)
There is no uniformity in defining SMEs (Beyene, 2002). According to IFAC (2010),
the European Union defines SMEs as those made up of enterprises employing fewer
than 250 persons. The Micro and Small Enterprises Act (2012) of Kenya defines micro
enterprises as those with one to nine people and an annual turnover that does not exceed
five hundred thousand shillings. Small enterprises under this Act are those with ten to
fifty employees with an annual turnover of between five hundred and five million
shillings (ROK, 2012).
This Act is however silent on the medium enterprises. The Act goes further to define a
micro enterprise in the manufacturing sector as that where the investment in plant and
machinery or the registered capital of the enterprise does not exceed ten million
shillings. A small enterprise in the manufacturing sector is that with an investment in
plant and machinery as well as the registered capital of the enterprise that is between ten
million and fifty million shillings.
3
Though SMEs are variously defined in the world, they are recognized as the key drivers
of economic growth. They are considered to constitute over 90% of the enterprises in
most economies especially developing ones, as well as being the main generators of
60% of employment in most developing economies(Joshi, n.d; ILO, 2007; Fjose,
Grünfeld, & Green, 2010). In Kenya as per Economic Survey 2015, the sector created
693 jobs (ROK, 2015). SMEs also stimulate entrepreneurial activity and skills, in
addition to providing flexibility and quick adaptation to the changes experienced in
market demand and supply conditions. Still, SMEs help in the diversification of
economic activities, contribute significantly to trade, both local and international, and
help in creating social cohesion (Elasrag, 2013).
SMEs are also viewed to be a crucial component of an economy’s industrial vibrancy
(Elasrag, 2013). This is further emphasized by Mitchell 2011 by noting that the countries
and regions that are highly reliant on existing and mature industries would ultimately
experience economic decline, bringing about chronic net job loss. To counter this, small
enterprise start-ups help to keep the economy afloat. As a result economies that highly
thrive, and are fast growing have more than high small enterprise start up rates, as well
as large SME sectors (Beck, Demirguc-Kunt, & Levine, 2005)
According to Kuratko 2003, the United States had achieved its highest economic
performance in the last ten years as a result of the fostering and promotion of
entrepreneurial activity which as pointed out by Elasrag (2013) is stimulated by SMEs.
Further, the newly industrialized countries like South Korea, Malaysia and Taiwan have
experienced development and economic growth because they accorded entrepreneurship
the right conditions to flourish (Nafukho, Machuma & Muyia, 2009).
In addition, the SME sector is important in provision of goods and services, as well as a
driver in competition promotion and innovation. This is further supported by a great
utilization of raw materials locally available in an economy (Taiwo, Ayodeji & Yusuf,
2012). SMEs also provide linkages for the large enterprises, corporations and
4
multinationals, either by being the ultimate customers or the distributors. This is
especially in developing countries where customers may be difficult to access especially
in the rural areas. Local distribution is therefore provided by SMEs which are in a better
position to cost effectively reach the customers.
In recognition of the important role played by the SME sector, the Government of Kenya
has over the years come up with policies and programmes to help strengthen this sector.
For example MSE Act (2012) came to formulate a framework for the MSE sector, by
proposing a creation of bodies to support the growth of the sector, while Kenya’s Vision
2030 proposes development of at least five SME industrial parks in major cities (ROK,
2007).
1.1.2 Global Perspective of Manufacturing in SMMEs
The United States of America’s 12% GDP is accounted for by its manufacturing sector,
while it employs about 9% of the countries workforce (NAM, 2015).However, as
posited by Levinson (2015), it is important to note that even though the USA’s
manufacturing output growth has over the last decade outperformed that of most
European countries and Japan, it has continued to lag behind that of China, Korea and
other Asian counties. Also, the USA’s share of global manufacturing activity declined
from 30% in 2002 to 17.4% in 2012, while it was displaced by China as the largest
manufacturing economy in the year 2010.
According to Klynveld Peat Marwick Goerdeler (KPMG) International (2015), China’s
growth in its GDP slowed down as from the year 2013to 2014 to stand at 74% partly due
to challenging environment within the manufacturing sector. The contribution to GDP is
13.9% lower than that of the service sector which stands at 73% (Taborda, 2015).
China’s manufacturing sector is dominated by SMMEs as pointed out by Ni (2015). The
SMMEs make goods of low technology leading to low profit margins, thus needing
innovativeness and improvement.
5
The bulk of manufacturing in USA is dominated by SMMEs which need to be
productive, continue to be innovative and engage in product improvement (Kifle,
2016).A report by Stone and Associates (2013) indicates that the small and medium
sized manufacturers in USA should play a critical role in exports, but this has been
largely played by the large enterprises. There is also under performance in exports in the
sector as a whole as compared to other developed nations because of reliance on the
large domestic market but which currently offers limited growth due to intense
competition and increased imports.
The firms in USA that rely on international sales are less vulnerable to the volatility in
the domestic demand. SMMEs can therefore benefit from exports but they are
constrained in terms of resources and lack management of capacity in manufacturing
especially in expertise for international trade (Kifle, 2016). In Africa, Fjose, Grunfeld
and Green (2010), SMEs constitute about 95% of all firms in the Sub-Saharan Africa.
The manufacturing sectors in these countries face challenges for example the
manufacturing sector in South Africa contributes significantly to its economy but its
importance declined from 19% in 1993 to 17% in 2012 (ROSA, 2015).
Tanzania’s manufacturing sector continues to lag behind those of the countries in the
region in terms of both quantity and quality of the industrial goods that are produced and
exported. The economy relies more on the agricultural sector, the extraction sector and
low value added manufacturing. Value added manufacturing is especially confined in a
few low technology sectors thus opening the country’s industry to international
competition vulnerability including making the county to be one of the least
industrialized in the world (UNIDO, 2012).
In Uganda the manufacturing sector has over the years been struggling and has
experienced a slow growth below the sub-Saharan average (ROU, 2010). The sector’s
contribution to Uganda’s GDP lags behind that of other regional countries like Kenya,
Tanzania and Burundi, even though ahead of Rwanda (KIPPRA, 2014).In Kenya, the

6
manufacturing sector constitutes 70% of the industrial sector‘s contribution to Gross
Domestic Product (GDP), and is recognized by the Kenya Vision 2030 as a key driver
for realizing a sustained annual GDP growth of 10%. In spite of these, the sector has
over the years continued to perform poorly and continues to lag behind the overall
economic growth by 1.9% (KAM, 2015). Small and medium manufacturing enterprises
form the bulk of this sector in Kenya (KIPPRA, 2014).
1.1.3 Small and Medium Manufacturing Enterprises in Kenya
Small and medium scale manufacturing is an important segment in the SME sector.
Small scale production is characterized by high labour involvement thus helping to
reduce the high levels of unemployment. Most of these enterprises do not require
intensive capital investment, thus easier to set up and operate than the large
manufacturing enterprises (Tarus & Nganga, 2013). According to the Kenya Association
of Manufacturers (KAM) (2012) Kenya’s industrial sector is comprised of
manufacturing, mining and quarrying and construction activities. This sector contributes
14% to the Gross Domestic Product (GDP). The greatest share of industrial production
is accounted for by manufacturing activities at 9.4%, that is approximately 70% of the
total industrial sector contribution to the GDP (KIPPRA, 2013). The manufacturing
sectors overall goal is to increase its GDP contribution to at least 10% per annum. The
contribution of the manufacturing sector to the total formal employment in Kenya is
13%, while the informal manufacturing accounts for 20% of the informal employment
(KAM, 2012).
The sector has a high untapped potential to contribute more to both the GDP and
employment (KIPPRA, 2013), but in spite of the sector’s importance to Kenya’s
economy, it has over the years continued to experience a lag. As well, even though the
formal employment in this sector increased by 2.9% in the year 2014, the real output in
the same year was 3.4% as compared to 5.6% in 2013, thus a decrease (ROK, 2015). As
a result of the recognition of the role played by this sector and to counter the lag,

7
Kenya’s Vision 2030 proposes several strategies to raise the sector’s contribution of
manufactured goods to the Central and East African regional market, targeted at 15%.
1.1.4 Entrepreneurial Management
There is a significant difference between entrepreneurial management and non
entrepreneurial management as pointed out by Smith, Hampson, Chaston and Badger
(2003). Entrepreneurial managerial behaviour promotes a culture of creativity and risk-
taking, creates flat informal structures, and promotes strategy so as to take advantage of
the opportunities that are identified. Non entrepreneurial managerial behaviour on the
other hand emphasizes planning, control, monitoring, evaluation, and formalized
organizational structures. According to Gürbüz and Aykol (2009), through
entrepreneurial management, firms are driven and motivated by opportunity which they
seize irrespective of the resources in their possession. Mechanisms which include
structure, culture and people are developed to support this. Further, entrepreneurial
management is an opportunity driven, proactive and action-oriented mode of
management balancing an organization’s innovation abilities with efficient and effective
use of resources, for creation and sustenance of successful organizations (Hortoványi,
2012).
Teece (2012) posits that the entrepreneurial management necessary for a business to
have dynamic capabilities is related to other managerial activity although different.
These dynamic capabilities are, opportunity identification and assessment, resource
mobilization to take advantage of the opportunity thus getting value, and continued
renewal. This is from the fact that entrepreneurship is about sensing and understanding
opportunities, getting things started, and finding new and better ways of putting things
together. Entrepreneurial management is therefore not about refining and maintaining
the existing procedures.
8
According to Casson, Yeung, Basu and Wadeson (2006), entrepreneurial firms are
innovative, proactive and risk taking. Entrepreneurial management should therefore be
proactive which is important for a firm’s performance. Procativeness has a positive
impact on a firm’s ability to perceive opportunities (Martínez & Moreno, 2011). It
however requires planning. These plans and actions require to be initiated before either a
threat or an opportunity occurs. A proactive manager is able to think ahead and take the
lead in problem prevention. This is opposed to reactive management that focuses on
current situations as a result of changes that have occurred already (Rasmussen, 2012).
Management must also have the ability to handle various personalities, tasks and
situations. One of these is the ability to empower the employees under them so that they
feel motivated for improved performance (Sunday & Somoye, 2011).
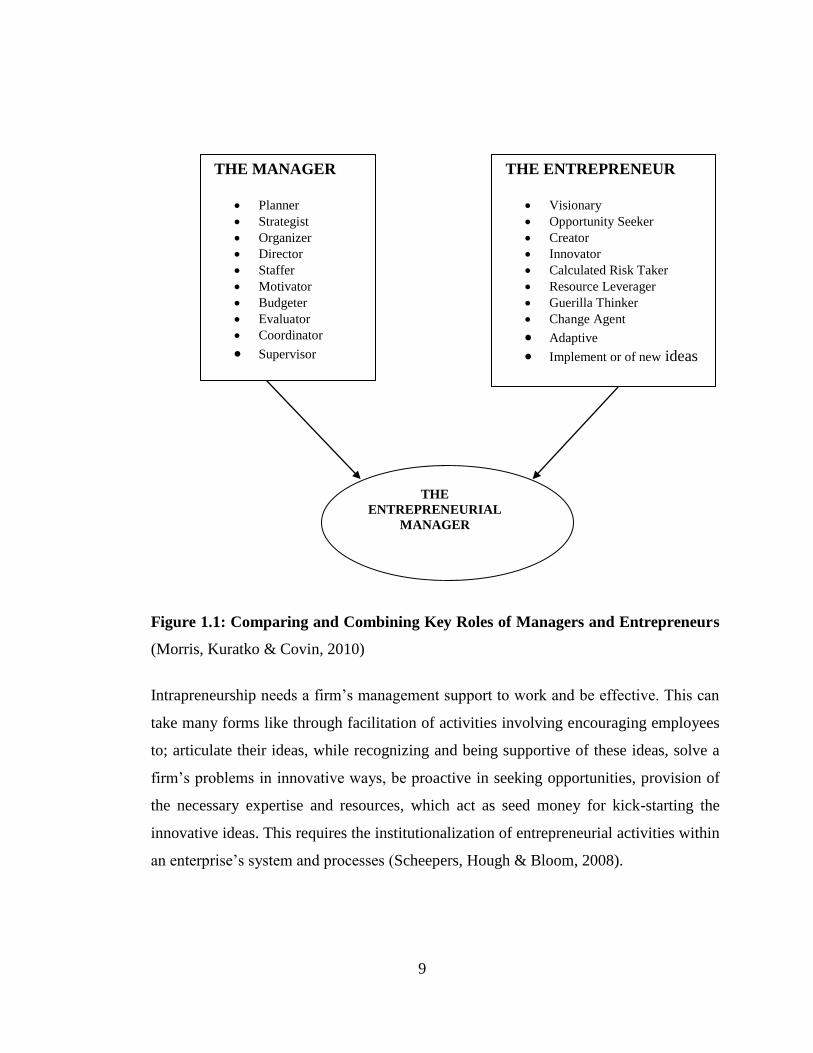
It is the position of Morris, Kuratko and Covin (2010) that management and
entrepreneurship are different. A manager ensures that there is an efficient and an
effective use of the resources that they control. An entrepreneur on the other hand is
concerned with what can be and not with what is. Managers should therefore become
entrepreneurs. The entrepreneur manager should be able to combine the key roles of a
manager and an entrepreneur as shown in figure 1.1.
9
Figure 1.1: Comparing and Combining Key Roles of Managers and Entrepreneurs
(Morris, Kuratko & Covin, 2010)
Intrapreneurship needs a firm’s management support to work and be effective. This can
take many forms like through facilitation of activities involving encouraging employees
to; articulate their ideas, while recognizing and being supportive of these ideas, solve a
firm’s problems in innovative ways, be proactive in seeking opportunities, provision of
the necessary expertise and resources, which act as seed money for kick-starting the
innovative ideas. This requires the institutionalization of entrepreneurial activities within
an enterprise’s system and processes (Scheepers, Hough & Bloom, 2008).
THE MANAGER
Planner
Strategist
Organizer
Director
Staffer
Motivator
Budgeter
Evaluator
Coordinator
Supervisor
THE ENTREPRENEUR
Visionary
Opportunity Seeker
Creator
Innovator
Calculated Risk Taker
Resource Leverager
Guerilla Thinker
Change Agent
Adaptive
Implement or of new ideas
THE
ENTREPRENEURIAL
MANAGER
10
1.1.5Intrapreneurship
Intrapreneurship has been variously defined by various scholars and researchers. Labels
used include corporate entrepreneurship, entrepreneurial orientation, corporate venturing
(Jackal, 2010; Nath, 2005; Maes, 2003). Literature shows that the most commonly used
label is corporate entrepreneurship. Intrapreneurship has also been defined as the
entrepreneurial behaviour exhibited by the already established organizations through
innovative ways like new venturing, organizational transformation or revitalization as a
result of strategic renewal (Kahkha, Kahrazeh & Armesh, 2014). Merwe and Lotz (2013)
define intrapreneurship as visionary directing an organization wide reliance on
entrepreneurial behavior to continually and purposefully create new businesses, activate
innovation or renewal within existing business so as to remain competitive.
Despite the inconsistency in defining and explaining intrapreneurship, its importance to a
firm has been emphasized over time. To mention but a few, there is an immense and
intense competition among firms that complicates the competitive landscape. The firms
operate in a macro environment that is characteristic of rapidity in technological progress
in many fields that render obsolescence to customer problems and current solutions. This
is further compounded by explosive industrial growth experienced in some sectors, while
others experience recession like conditions that lead to restructuring. These challenges
lead to firms getting out of business if they do not continually adapt to the changing
business environment. One way to achieve this is through intrapreneurship
(Ramachandran, Devarajan & Ray, n.d). Intrapreneurship can therefore be said to be an
important tool for revitalizing, transforming and improve the performance of an
organization ((Kahkha, Kahrazeh, Armesh, 2014)
11
1.2 Statement of the Problem
SMEs in the manufacturing sector in Kenya are faced with a number of challenges
which, as pointed out by Gathogo (2013) include lack of innovative capacity, slow to
embrace new technology, constraints in accessing capital and inadequate management
capacity. Gathogo (2013) still posits that despite SMMEs’ importance to the economy,
they have since Kenya’s independence performed poorly with some having to close
down due to inability to remain competitive and operate profitably. SMMEs form over
70% of the manufacturing sector in Kenya (KIPPRA, 2013), and in general, the sector
grew by 3.4% in 2014 as compared to 5.6% in 2013 (ROK, 2015), while its growth of
3.1% lags behind the overall economic growth of 5% (KAM, 2015). Further, the sector’s
share of exports to the global market at 0.02% compares unfavourably with that of South
Africa at 0.03%, Malaysia at 1.3% and Singapore at 2.4% (KIPPRA, 2013).
Promotion of intrapreneurship which is for all firms of all sizes and increases a firm’s
performance, can partly address these challenges Mokaya (2013).Further, Ragui and
Wainaina (2013) argue that intapreneurship is the way forward for SMEs, and should be
adopted to ensure their growth. It also rejuvenates and redefines organizations to create
and sustain competitive superiority, and improves their growth and profitability,
therefore it is important for SMEs to embrace intrapreneurship for them to remain
competitive (Schmelter, Mauer, Borsch & Brettel, 2010). Promotion of intrapreneurship
if encouraged in SMEs is a strategy to overcome challenges facing the sector (Kahkha,
Kahrazeh & Armesh, 2014).In spite of these recommendations, Shariatmadari,
Hajimohammadian, Mahdi and Jarad (2012) point out that most SMEs face challenges
in promoting intrapreneurship.
Few or no studies have directly linked entrepreneurial management to promotion of
intrapreneurship. Sejde, Veenker and During (2013) recommended that studies be
undertaken on the role of management or the entrepreneur owner on intrapreneurship
enhancement in SMEs. However, attention by management and scholars on a firm’s
12
ability to undertake intrapreneurship have. large firms do not face as many challenges as
the SMEs (Fini, Grinmaldi, Marzocchi, Sobrero, 2012; Naldi, Achtenhagen &
Davidsson 2015).This study therefore sought to address these gaps by undertaking an
empirical study on the role played by entrepreneurial management on promotion of
intrapreneurship in SMMEs in Kenya.
1.3 Research Objectives
1.3.1 General objective
The aim of the study was to examine the role of entrepreneurial management on
promotion of intrapreneurship in the small and medium manufacturing enterprises in
Kenya.
1.3.2 Specific Objectives
The specific objectives of the study were;
1. To determine the role of commitment of resources on promotion of
intrapreneurship in SMMEs in Kenya.
2. To examine the role of management’s need for achievement on promotion of
intrapreneurship in SMMEs in Kenya.
3. To assess the role of reward system on promotion of intrapreneurship in SMMEs
in Kenya.
4. To establish the role of entrepreneurial management structure on promotion of
intrapreneurship in SMMEs in Kenya.
13
1.4 Research Hypotheses
1. Ha: Commitment of resources has a positive significant role on promotion of
intrapreneurship in SMMEs in Kenya.
2. Ha: Management’s need for achievement has a positive significant role on
promotion of intrapreneurship in SMMEs in Kenya.
3. Ha: Reward system has a positive significant role on promotion of
intrapreneurship in SMMEs in Kenya.
4. Ha: Entrepreneurial management structure has a positive significant role on
promotion of intrapreneurship in SMMEs in Kenya.
1.5 Justification of the Study
The study will be of great importance to entrepreneurs and managers in the SME sector,
especially those in the manufacturing sector. The results of the study will give them
knowledge on how to entrepreneurially manage their enterprises to attain
intrapreneurship for their survival, profitability and growth.
Given the important role played by the SMMEs in the economical growth of country, the
findings of the study will help the policy makers and other support services to come up
the relevant training of the entrepreneurs in the sector. This would greatly enhance the
performance of the SMMEs for growth.
The study would also be of great benefit to other researchers and scholars as it would
form a basis for further research in the sector. It would also serve as a reference material
thus providing an empirical contribution to the study of intrapreneurship in small and
medium manufacturing enterprises and the SME sector in general.
14
1.6 Scope of the Study
The study focussed on the Small and Medium Manufacturing Enterprises registered with
the Kenya Association of Manufactures. The enterprises are placed in sectors therefore
enabling a representation of each sector. Since KAM is an organization registered in
Kenya, representing Kenyan manufacturing organizations, results were able to be
generalized to the SMMEs in Kenya and the rest of the world, especially the developing
countries.
The study was in particular confined to the role of entrepreneurial management on
promotion of intrapreneurship in SMMEs in Kenya, under four independent variables
namely commitment of resources, management’s need for achievement, reward system
and entrepreneurial management structure.
1.7 Limitations of the Study
There was a level of resistance by some respondents in giving the information required.
This was mitigated by assuring them that the study was purely for academic purposes
and would be treated with utmost confidentiality, and that the results would be availed to
them in case they required to know the outcome. Another limitation was that of failure
by the respondents to fully comprehend some of the questions, which was mitigated
through taking them through the questionnaire and explaining the questions in detail.
The classification of the SME sector in Kenya can be by either the number of
employees, or the financial turnover in Kenyan Shillings, or the value of the capital or a
combination of two or the three factors. Most of the respondents considered the financial
information to be confidential information thus declined to give it. Thus the study relied
mostly on the number of employees to determine whether a firm is within the SME
sector and not a large enterprise.
15
CHAPTER TWO
LITERATURE REVIEW
2.1 Introduction
This chapter reviewed the relevant literature by various scholars and researchers in the
area of Entrepreneurial management and intrapreneurship in enterprises, with a specific
focus on SMMEs. It is anchored on theoretical review, conceptual framework and the
empirical review which informed this study. The chapter specifically reviews
entrepreneurial management as operationalized in the conceptual framework as
commitment of resources, management’s need for achievement, reward system and
entrepreneurial management structure as independent variables, and the dependent
variable as promotion of intrapreneurship. The chapter also points out the research gaps
and areas as well as providing a detailed critique of the past empirical studies and
literature.
2.2 Theoretical Review
A theory is defined by Cherry (2015) as a “well-established principle that has been
developed to explain some aspect of the natural world”. A theory is further explained to
be as a result of repeated observation and testing. Facts, laws, predictions, and tested
assumptions that are widely accepted are incorporated in the theory. A theoretical
framework helps a researcher to limit the scope of data relevant to the study by focusing
on specific variables and viewpoint, facilitates concepts and variables’ understanding. It
must therefore demonstrate an understanding of theories and concepts that are relevant
to the research topic (Labaree, 2013). The theoretical review for this study is based on
the relevant theories which underpin commitment of resources, management’s need for
achievement, reward system and entrepreneurial management structure as variables
playing a role on promotion of intrapreneurship in SMMEs in Kenya.
16
These theories as discussed are resource based theory, McClelland’s need for
achievement theory, Herzberg’s motivation theory, the expectancy theory of motivation,
structural contingency theory and Schumpeter’s innovation theory.
2.2.1 Commitment of Resources
Commitment of resources by management to promote intrapreneurship is underpinned
by resource based theory. Resource based theory as discussed below explains the need
for development and commitment of resources that are heterogeneous, not easy to
imitate, and supportive of a firm’s competitive advantage.
Resource-Based Theory
Jay Barney in 1991 came up with the resource based view of the firm, and is considered
by many scholars as the father of the modern resource based theory of the firm
(Wüstenhagen,2008). The basic condition of resource-based theory is heterogeneity.
Even if firms are competitors in the same industry, they may possess different types of
resources and capabilities, thus a firm’s ability to sustain superior resources is the key to
competitive advantage. These resources include all assets, organizational processes,
organizational skills, management skills, information and knowledge. The resources
enable a firm to engage in the appropriate strategies for improvement of effectiveness
and efficiency (Wüstenhagen, 2008).
However, the attributes that make resources sustain competitive advantage for a firm are
rareness, worthiness (valuable), imperfectly mobile and non-substitutable. When a
firm’s resources and capabilities are immobile and not imitable, it becomes difficult and
costly for its competitors to develop and acquire them, thus the firm’s competitive
advantage is sustained (Perrigot & Pénard, 2013).When entrepreneurs possess a rare
insight into a resource’s value and others do not, those with the insight act upon the un-
exploited opportunities. This gives them a competitive advantage (Reddy & Rao, 2014).
17
Difference in the performance of the firms even when they compete in the same
industry, can be both as a result of the differences in their resources, as well as the
decision of the managers on the acquisition and deployment of these resources (Sirmon,
Hitt, Ireland & Gilbert, 2011). The resource based theory expects the management of a
firm to make a strategic choice to identify, develop and deploy key resources in order to
capitalize on the returns.
A firm can formulate strategies that take advantage of external opportunities by
exploiting or utilizing internal capabilities or available resources. One way a firm can
allocate and utilize its resources is by spending money on research and development,
marketing, hiring of managers with backgrounds and profiles that match the firm’s
business strategy among others (Perrigot & Penard, 2013). From the insights of this
theory it is important that management within SMMEs not only provide but also utilize
and allocate the available resources for stimulating intrapreneurship within the firm.
Striving to develop a unique and rare resources would position a SMME at an
advantageous competitive position within the market it operates in. The resource based
theory leads to the first research hypothesis which is, commitment of resources has a
significant role on promotion of intrapreneurship in SMMEs in Kenya.
2.2.2Management’s Need for Achievement
Management’s need for achievement is explained by McClelland’s high need for
achievement theory. This theory explains that achievement oriented individuals are
motivated by desire to accomplish that which they have set to achieve. The
achievement is made possible by formulating goals that are challenging but realistic
and achievable.
18
McClelland’s High Need for Achievement Theory
McClelland in 1961 came up with the high need for achievement theory, which states
that individuals who portray this tendency are motivated by the achievement, set
realistic, attainable but challenging goals, seek feedback for improvement, and push
themselves to do well for attainment of a feeling of accomplishment (Stewart & Roth,
2007; Okhomina, 2010).Entrepreneurs are perceived to be more achievement oriented
than the population in general. A manager needs to be entrepreneurial to portray a high
need for achievement. According to Kuratko, Ireland, Covin and Hornsby (2005),
managers are forced to be entrepreneurial by a combination of circumstances.
An entrepreneur is one who can envision the future and be able to recognize the
emerging patterns that represent untapped opportunities. Innovations are then formulated
to exploit these opportunities which are pursued regardless of the controlled resources.
There should therefore be a balance between management and entrepreneurship. Thus
managers must become entrepreneurs (Morris, Kuratko & Covin, 2010)
Marvel, Griffin, Hebda and Vojak (2007) go further to opine that, one way management
can support intrapreneurship is by being a champion for innovative ideas. High need for
achievement individuals are more oriented to innovative and energetic activities
requiring planning for the future. SMMEs due to the challenges that they face would
highly benefit from managers who possess and champion innovative ideas. Managers
who feel responsible for task outcomes would be successful, and would prefer tasks that
involve skill and effort as well as provided clear performance feedback, in addition to
the tasks being of moderate challenge and risk (Collins, Hanges & Locke, 2004). This
theory instigated the second research hypothesis that management’s need for
achievement has a significant role on promotion of intrapreneurship in SMMEs in
Kenya.
19
2.2.3 Reward System
The reward system independent variable is reinforced by two theories namely
Herzberg’s motivation theory and the expectancy theory of motivation. Herzberg’s
motivation theory explains two types of motivators namely intrinsic and extrinsic
motivators. The expectancy theory of motivation explains that employee’s performance
matches the rewards expected.
Herzberg’s Motivation theory
Herzberg came up with two-factor theory of motivation also known as motivation-
hygiene theory in 1959 (Hong & Waheed, 2011). Intrinsic motivators which according
to Herzberg are the motivation factors cause motivation when available while extrinsic
motivators which are the hygiene factors cause dissatisfaction or lower motivation when
absent (Hong & Waheed, 2011).
Intrinsic motivators which are within the job context are less tangible and more
emotional, while extrinsic motivators are more tangible basic needs. According to
Achakul and Yolles (2013), extrinsic motivation inspires an individual to work in
response to a factor separate from the work itself, which leads to a separate income. This
can be in terms of either/or reward, benefit, recognition, commission and salary. This is
opposed to intrinsic motivation which inspires an individual to engage in work for its
own sake, either because it is of interest, enjoyable or satisfying. Dermer (2007), points
out that over the years there have been suggestions that focusing on extrinsic motivation
only reduces the intrinsic motivation. Marvel, Griffin, Hebda, & Vojak (2007), in their
study found out that a reward and recognition system was the most outstanding in the
motivation category.
Amar (2004) defines motivation as a term that is associated with the forces acting on a
person causing him to act in a certain way. It can be described as a pattern of thinking
that helps stimulate an individual’s behaviour (Achakul &Yolles, 2013). It is important

20
to understand the dynamics of motivation so as to understand and identify the drivers of
peoples’ acts in certain ways. Behavioural changes which are as a result of either
internal or external stimuli portray motivation (Amar, 2004).
An individual’s motivation to assume the risks that are associated with entrepreneurial
activity can be driven by an appropriate reward system as pointed out by Marvel,
Griffin, Hebda and Vojak(2007). Also, organizations have to provide an environment for
intrapreneurship by stimulating, supporting and protecting intrapreneurs (Morris,
Kuratko & Covin, 2010). Intrapreneurship in SMMEs can be encouraged by an effective
reward system that considers goals and results.
The Expectancy Theory of Motivation
The expectancy theory was developed by Victor Vroom in 1964 as a cognitive process
theory of motivation pegged on people’s believe that the effort put at work matches the
performance achieved, which in turn should match the rewards received(Lunenburg
(2011). People are motivated by the belief that much effort brings about good
performance which in turn attracts good rewards. Vroom identified four assumptions
that encourage people as they join organizations which are; (i) employees join
organizations with expectations such as motivations, their needs and past experiences,
thereby influencing how they react to the organization, (ii) employees consciously
choose how to behave based on their expectancy calculations, (iii) employees have
different expectations from the organization, from which, (iv) they choose among
alternatives for optimal personal outcomes.
These assumptions result to three key elements of expectancy motivation theory, namely
expectancy, instrumentality and valence (Parijat & Bagga, 2014). Expectancy estimates
the probability of a job related effort resulting in a particular level of outcome or
performance. It ranges between 0 and 1, that is if employees believe that their effort will
not bring the desired outcome, the expectancy is 0, while if they believe that their effort
21
will result in a significant or best performance, then the expectancy is 1. Instrumentality
means that performance will be rewarded for example with promotion, increased salary,
bonuses and other positive motivation, and is between 0 and 1 as well.
Better performance or results in this case become instrumental in gaining the rewards.
Therefore, if the employee believes that better performance results in a reward, the
instrumentality has a value of 1, and if not, then it is 0. Valence on the other hand is
between -1 and +1 and measures the value or the attractiveness of the rewards. It can
vary from employee to employee thereby resulting in to preferences. If an employee
strongly prefers a certain reward, then valence is positive and if not, it is negative.
Fatigue and stress can be outcomes of increased work efforts and these tend to produce a
negative valence, unlike other positive motivation which include like salary increase,
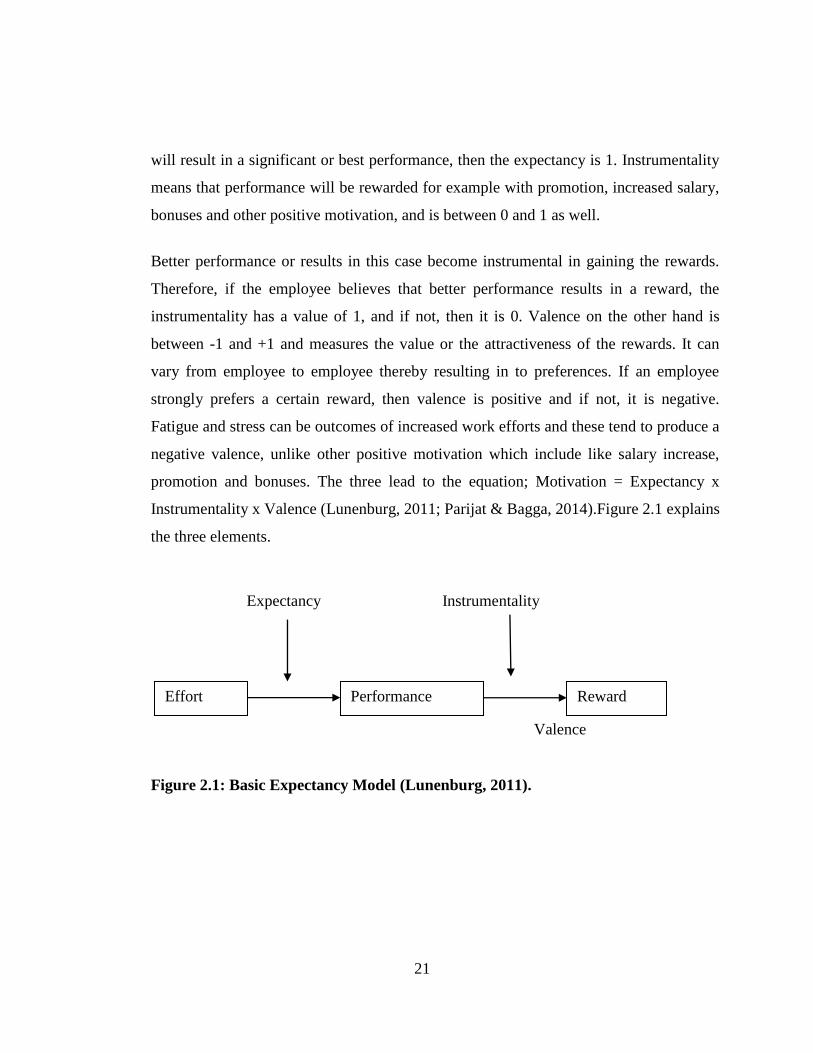
promotion and bonuses. The three lead to the equation; Motivation = Expectancy x
Instrumentality x Valence (Lunenburg, 2011; Parijat & Bagga, 2014).Figure 2.1 explains
the three elements.
Expectancy Instrumentality
Valence
Figure 2.1: Basic Expectancy Model (Lunenburg, 2011).
Effort Performance Reward
s
22
Employees in SMMEs would be motivated if their efforts lead to improved performance,
thus proving their expectation of more effort brings the desired result. Moreover, if this
improved performance is rewarded by either promotion, increased salary, bonuses or
other forms of reward, these employees would do a lot more for the firms. The reward in
this case should be that which attracts general acceptance by the employees. The two
theories give rise to the third research hypothesis that reward system has a significant
role on promotion of intrapreneurship in SMMEs in Kenya.
2.2.4 Entrepreneurial Management Structure
The entrepreneurial management structure as an independent variable is explained by the
structural contingency theory. This theory argues that organizations should adapt to their
environments as there is no single structure that fits all organizations. The structure
should therefore be flexible to fit the changing environment.
Structural Contingency Theory
Lawrence and Lorsch in the 1960’s came up with the structural contingency theory
which states that there is no best way or single structure to organize an organization.
Instead the structure is dependent on the situation or circumstances at hand (Donaldison,
2013). It is an organizational behaviour study approach which claims that individual
organizations adapt to their environments (Soylu, 2008).According to this theory, no
single type of management structure can be applied to all organizations. Organization’s
effectiveness will therefore be dependent on matching these contingent factors like the
technology type, the volatility of the environment, the organization size, organizational
structure features as well as its information system (Islam & Hu, 2012).
Organizational contingency assumes that the interaction between structural dimensions
of work design and contingency factors influences how an organization adapts and
performs within its environment. The organization’s internal functioning should
23
therefore be linked and correlated to the demands and changes of the external
environment (Soylu, 2008; Leweling, 2007). SMMEs exist in an environment that is fast
changing in terms of competition and technology, and need a management structure that
is flexible enough to make decisions that are contingent to the changes of the moment.
Long (2016) posits that contingency plans should be a part and parcel of small
businesses to enable efficient continuation of operations when faced with difficulties and
challenges. It is important then that SMMEs’ managers be guided by their perception of
the environment to select contingency factors like culture, strategy, task uncertainty, size
and technology, which in turn influence the organization structure that leads to superior
performance.
The contingency variables and structure should fit to avoid lower performance. Any
change in the contingency variables means that the structure is out of fit, necessitating
the organization to undergo structural change so that the fit between the contingency
variables and structure can be regained. Managers have to consistently select the
appropriate contingency factors to fit the organization’s current environment (Soylu,
2008).
It is the assumption of the structural contingency theory according to Donaldson (2005),
that low uncertainty tasks are performed better by a centralized hierarchy as it is simple,
quick and cheaply allows close coordination. When innovation and other factors
increase task uncertainty, then there is need to loosen control and introduce participatory
and communicative structures. The result of this is reduction in structural simplicity and
raised costs but the benefits of innovation are enjoyed as a reward (Donaldson, 2005).
This theory informs the fourth research hypothesis that entrepreneurial management
structure has a significant role on promotion of intrapreneurship in SMMEs in Kenya
24
2.2.5 Intrapreneurship
Schumpeter’s innovation theory supports promotion of intrapreneurship in SMMEs.
The theory states that innovation is doing things differently and brings new
combinations, thus destroys the old economy while creating a new one. This
scenario results in a new economic value which is necessary for the survival of the
firm.
Schumpeter’s Innovation Theory
Schumpeter (1885-1950) introduced the concept of innovation and its role in
entrepreneurship and economic growth by stating that innovation was the only function
which was fundamental in history. It was the view of Schumpeter that entrepreneurs are
those who carry out new combinations (innovation), and that change should be
discontinuous and revolutionary (Sledzik, 2013).
Innovation and entrepreneurship occupy and play an important role in the development
of the economy in the world. Innovation according to Schumpeter as pointed out by
Sledzik (2013) is doing things differently in the economic realm, and further positions
that more money and making profits would be as a result of innovations to the financial
systems. It is therefore imperative that anyone who seeks to make profits must be
innovative. Innovation causes creative destruction (Hawkins & Davis, 2012).
Sledzik 2013 further points out that Schumpeter viewed innovation as a process of
industrial mutation that continually revolutionarizes the structure of the economy from
within. The innovation continuously destroys the old economy as well as continuously
creating a new one. SMMEs would for this reason greatly benefit from innovation as this
would introduce new products, processes or even new markets in turn increasing their
profitability. New combinations would force entrepreneurial SMMEs to go against the
trends, thus creating a new economic value. This value is a culmination of combining
factors of production in new ways thus doing things differently, which could either be
25
new ways of supplying, producing, distributing, or organizing which defy resistance and
induce cycles of adjustment that are value creating (Hawkins & Davis, 2012).
2.3 Conceptual Framework
Kothari (2004), defines conceptual framework as a guiding tool to researchers in their
inquiry. It consists of concepts placed within a sequential and logical design. Based on
literature and personal experience, conceptual framework provides structure and content
for the whole study (Vaughan, 2008). It helps in identifying the research variables as
well as aiding in clarification of relationships among the variables.
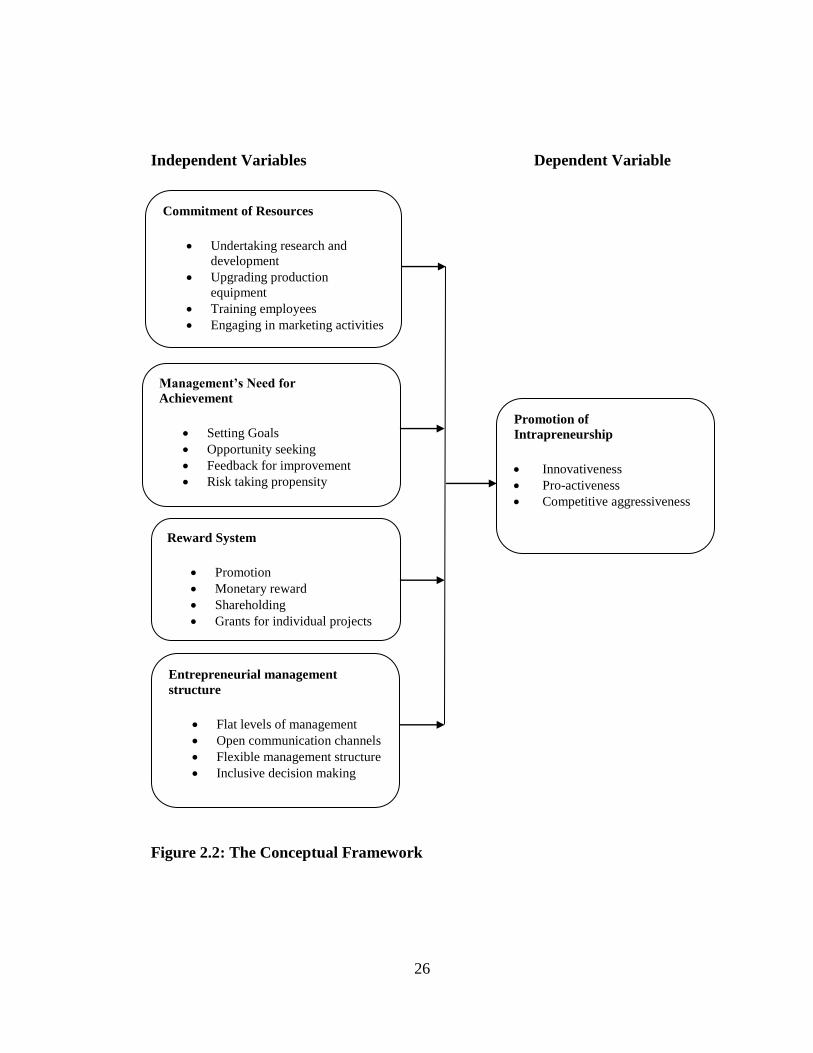
Figure 2.2 on conceptual framework gives the independent variables as commitment of
resources, management’s need for achievement, reward system and entrepreneurial
management structure and the dependent variable as promotion of intrapreneurship.
These will guide the study in establishing the relationship between them.
26
Independent Variables Dependent Variable
Figure 2.2: The Conceptual Framework
Commitment of Resources
Undertaking research and
development
Upgrading production
equipment
Training employees
Engaging in marketing activities
Management’s Need for
Achievement
Setting Goals
Opportunity seeking
Feedback for improvement
Risk taking propensity
Promotion of
Intrapreneurship
Innovativeness
Pro-activeness
Competitive aggressiveness
Reward System
Promotion
Monetary reward
Shareholding
Grants for individual projects
Entrepreneurial management
structure
Flat levels of management
Open communication channels
Flexible management structure
Inclusive decision making

27
2.3.1 Commitment of Resources
One way to enhance organizational intrapreneurship is by providing resources to
intrapreneurs. These resources should be appropriate to support the development of
intrapreneurship ideas (Morris, Kuratko & Covin, 2010). A firm’s ability to sustain and
utilize key superior resources is the key to competitive advantage. These resources
enable a firm to engage in the appropriate strategies for improvement of effectiveness
and efficiency (Elango, 2003). The resources include all assets, organizational processes,
capabilities, organizational skills, management skills, information and knowledge. They
can be categorized into tangible, intangible and financial resources. The tangible and
intangible resources are those that the firm owns or controls. A firm is said to be capable
if it has the ability to combine and exploit the available resources through the developed
organizational routines to achieve the set objectives (Laosirihongthong, Prajogo &
Adebanjo, 2014).
Bridoux (n.d) conceptualizes that a firm’s strategy is conditioned by its resources and
competitive environment. The strategy of the firm as well as its performance, in turn
have an effect on the resources and the competitive environment. In the due course,
these interactions create new resources for the organization. Resources that are able to
sustain a firm’s competitive advantage are strategic resources. For a firm to engage in
intrapreneurship, it is important for it to continuously acquire and develop new
resources, reconfigure resources in new ways. This way, the firm is in a better position
to exploit new opportunities (Hayton & Kelly, 2006).Areas to allocate resources include
acquiring or improving the production equipment which helps lower the production cost
as pointed out by Singh and Mahmood (2015). Production equipment is considered as a
major asset by manufacturing firms therefore a tendency to continually improve them in
order to remain competitive through lowering of production cost (Yang, 2014).
28
An employee of a firm can be made entrepreneurial through provision of adequate
resources and support. This is especially for the employees who detect an opportunity
that is exploitable (Fayolle, 2007). However employees with entrepreneurial tendencies
exhibit a higher level of human capital. This human capital could be in the form of skills
which can be gained through training (Dizgah, Gilninia, Alipour & Asgari, 2011).
Knowledge, capabilities and risk taking by entrepreneurial employees within a firm
support intrapreneurship (Liu & Wang, 2012). Training develops employees’ knowledge
and skills which makes them to b emore innovative and productive (Aguinis & Kraiger,
2009).
Kuhn, Sassmannshausen, and Zollin (2010)are of the opinion that, one way to
differentiate between entrepreneurial management and administrative management
within an enterprise is how each utilizes the resources controlled. The argument is that
entrepreneurial management is opportunity driven and is geared towards the pursuant
and exploitation of opportunities irrespective of resources controlled. Administrative
management on the other hand tends to use resources in the best or most efficient way
possible on given purposes or achievement of organizational goals, by objective setting
and coordinating people (Morris, Kuratko & Covin, 2010; Boone & Kurtz, 2015).
Entrepreneurial management is innovative and can be propagated by allocating resource
to research and development which produces innovative products that can compete
favourably in the global market as established by Kinkel, Wengel and Lay (2005). Also,
according to Bowen (2012), firms that fund research and development continue to be
innovative.
29
An entrepreneurially oriented firm is also that which practices entrepreneurial marketing
(Schindehutte & Kuratko, 2014).Entrepreneurial marketing involves innovativeness,
proactiveness and risk taking, therefore an important function of enhancing
entrepreneurial orientation of a firm (Kraus, Harms & Fink, 2009). Thus allocating huge
resources to marketing activities enables the firm to stay competitive through acquisition
of customer equity and increased market share Tirreni (2005).
2.3.2 Management’s Need for Achievement
Okhomina (2010) defines the need for achievement as a “tendency to choose and persist
at activities that hold a moderate chance of success or a maximum opportunity of
personal achievement satisfaction without the undue risk of failure”. According to
Stewart, Carland, Carland, Watson, and Sweo (2003) as quoted by Carraher, Buchanan
and Puia (2010), it is high need for achievement that influences an individual to take an
entrepreneurial position that produces more achievement satisfaction. It predisposes one
towards entrepreneurial activity. Need for achievement oriented individuals have a belief
that the outcome of their behavour is controllable.
Individuals who portray a high need for achievement also seek reliable feedback on their
progress which motivates them on their entrepreneurial efforts (Wu, Matthews &
Dagher, 2007; Okhomina, 2010). Need for achievement is associated with entrepreneurs
who need to perform well at challenging tasks, setting goals to perform them as well as
seeking feedback on performance (Chell & Ozkan, 2014).
Achievement motivation is therefore imperative for high performance. This motivation
can present itself in form of challenging goals and tasks to achieve the set goals, and
whose feedback helps in skills improvement (Chell & Ozkan, 2014). Opportunity
seeking which is a core aspect of intrapreneurship (Botha & Nyanjom, 2011), is also an
aspect favourable with high need for achievement individuals.
30
Need for achievement portrays a strong sense of responsibility to finding solutions to
problems (Ratzburg, n.d), and perseverance through the setbacks inevitable in the
entrepreneurial process (Shane, 2003). Problem solving is one of the key functions of a
manager whereby the situation is analyzed and the problem identified, alternative ways
of dealing with the problem developed and the course of action decided upon (Omukoro,
2009). It is for this reason that management above all else should be entrepreneurial by
being multi-skilled for example in technical skills, people skills and conceptual skills
among others (Sunday & Somoye, 2011). This way management becomes effective for
performance of an organization which needs to be managed through activities like high
levels of staff involvement as well as motivation (UN, 2009).
According to Nieuwenhuizen (2008), an achievement oriented manager is innovative
and if this is combined with decision making responsibility, the manager is as much an
entrepreneur as the owner of the enterprise. Innovativeness is one of the key roles of
entrepreneurs in SMEs (Marcati, Guido, & Peluso, 2008). Innovation is also an
important aspect both for the survival of any business and enabling achievement of high
levels of competitiveness in the market (Lwamba, Bwisa & Sakwa, 2013).
Innovativeness is one of the important dimensions of intrapreneurship as pointed out by
Karacaoglu, Bayrakdarog and San (2013).
2.3.3 Reward System
Reward or compensation can be divided into non-monetary, direct and in-direct
compensation (Fogleman & McCorkle, 2009). Non-monetary includes any benefit
that is received by an employee from the employer or the job but has no tangible
value, for example security in the job, praise and recognition, growth opportunity.
Promotion of employees for example gives them an opportunity for career growth
and can be used by management to promote employees’ satisfaction thus improved
performance (Sarwar & Abugre, 2013).
31
Direct compensation includes the basic wage, performance based pay for example
bonuses, and as pointed out by Marvel, Griffin, Hebda and Vojak (2007), has in
some instances known to motivate employees more. Indirect compensation are the
programs that an employer is legally required to provide to the employees, for
example retirement programs, healthcare insurance, paid leave. Howard and
Dougherty (2004) point out that an organization can have a competitive advantage
as a result of reward systems. The employees are motivated to improve performance,
thus enhancing an organization’s performance and productivity. For these reward
systems to work, they should be strategically designed to link activities and work
outcomes that are supportive of the organization’s strategic direction. This way the
organization’s strategic goals are fostered.
Among others, the aim of a reward and compensation system is to reward employees as
per the value created, serve as motivation to employee’s engagement and commitment as
well as developing a culture of high performance (Armstrong, 2007). It must therefore
be strategic so as to address for the longer-term the value of people in what they do and
achieve.
Giving employees shareholding is a long-term incentive which gives employees an
incentive to be more innovative and raise their productivity (Kauffman, 2006; Rix &
Flint, 2013). Further, Motivation is a process for giving people’s behaviour purpose and
direction. Motivators are therefore an integral part of the work employees perform
(Rahim & Daud, 2012).
For firms to remain entrepreneurial, employees with outstanding contributions should be
rewarded. This fosters the spirit of innovation among them as well as encouraging them
to have a responsibility for significant achievement (Gautan & Verma, 1997). It is
therefore important that for a firm’s management to play the entrepreneur role well, it
should be capable of analysing the firm’s development possibilities and implement the
necessary supportive changes which may include employee encouragement to contribute
32
individual ideas (Cieslinska, 2007). Employees can be encouraged through directly
financing their innovative ideas which is a supportive infrastructure for intrapreneurship
(Zhao, 2013).
2.3.4 Entrepreneurial Management Structure
Kuhn, Sassmannshausen and Zollin (2010) have the opinion that management structure
is one of the dimensions of entrepreneurial management, and go ahead to differentiate
between administrative management structure and entrepreneurial management
structure. This difference is brought about mostly by how the two types of management
use and control their resources. The administrative management structure leans towards
formal and complex hierarchy with highly routinized work under clear roles and
responsibilities.
On the other hand, entrepreneurial management structure tends to be organic with
multiple informal networks. These informal networks are flexible and intended to
encourage and create enabling conditions for employees to seek and create opportunity,
thus focused on rapidly detecting and acting rapidly on environmental changes (Kuhn,
Sassmannshausen & Zollin, 2010).
Burns (2011) further posits that the need for tight management control decreases as
firms that are entrepreneurial move away from centralized hierarchical forms to flatter
structures that facilitate horizontal communication channels. There is introduction of
autonomy and for better entrepreneurial performance, but where a firm has decreased
entrepreneurial activity, the need for controls increases. According to Finch, Hansen and
Alexander (2010), one way to encourage employees to be more effective and perform
better, is to appreciate them through more regular consultation, listening to them more
and taking action based on their suggestions.
33
Including employees to decision making indirectly motivates them to be more
productive as they feel recognized and appreciated (Irawanto, 2015; Ezennaya,
2011).Further, for firms to be successfull in intrapreneurship there should be an
establishment of favourable organizational system with a supportive organizational
structure, job design, supportive job rotation and freedom and flexibility given to
employees to manage their own work and solve problems (Srivastava & Agrawal, 2010).
It is therefore necessary for management style to fit the structure of the organization and
vice versa (Burns, 2011). It is for this reason that for entrepreneurship to continue within
a firm, flatter organic structures are necessary for effective entrepreneurial management
style. The organizational structure of an organization is one of the most effective factors
on the establishment of different dimensions of entrepreneurial orientation (Shoghi &
Safieepoor, 2013).
2.3.5 Promotion of Intrapreneurship
Scheepers, Hough and Bloom (2008) point out that many authors refer to firm level
entrepreneurial orientation as indicative of intrapreneurship. This orientation has
three dimensions, which can be referred to as the dimensions of intrapreneurship.
These three dimensions are innovativeness, pro-activeness and risk-taking.
However, other authors go on to add two more, which are autonomy and
competitive aggressiveness thus becoming five dimensions of intrapreneurship
(Morris, Schindehutte& Allen 2005; Kreiser, Marino & Weaver 2002).
Most firm’s find it hard to maintain and keep up the initial entrepreneurial spirit that was
of help in the start-up stage (Ramachandran, Devarajan & Ray, n.d.). For these firms to
survive and remain relevant, continual innovation and being entrepreneurial is required.
One way to do this is by embracing intrapreneurship.
34
Senaji and Kamau (2013) point out that firms need to intensify intrapreneusrhipin order
to realize improved performance outcomes. An organization’s high performance level
can be linked to a high level of intrapreneurial intensity (Mokaya, 2013).
The SME sector as pointed out by Ragui and Wainaina (2013) needs to practice and
promote intrapreneurship. This is because even though the SMEs contribute to the
growth of a country’s economy, they are faced by a myriad of challenges. The Sessional
Paper No.2 of 2005 identifies a number of challenges which need to be addressed for
these enterprises to operate profitably (ROK, 2005). This situation is not made any better
by globalization and liberalized trade that have not only brought new opportunities but
also increased the challenges for these enterprises to compete at a global level (OECD,
2004). Only a small section of SMEs has the ability to identify and exploit the global
opportunities as well as the challenges and especially those in developing countries.
Intrapreneurship activities in this case have been known to improve growth and
profitability in an organization. The impact of these activities may increase over time
depending on the firm’s competitive environment (Nath, 2005). Some of the
intrapreneurship activities include willingness to take risks, pro-activeness, radical
product, service and process innovations, new businesses that create revenue streams.
These activities can be utilized to examine the propensity of a firm towards
entrepreneurial behaviour (Lawson, 2014).
Intrapreneurship according to Aktan and Bulut (2008), impacts positively on financial
performance of a firm, and firms with high intrapreneurship levels exhibit a high
performance. It is not only financial performance improvement, but also improved
internal efficiencies and higher employee morale (Kolokavic, Sisek & Milovanovic,
n.d). It is also a tool for business development, revenue growth and profitability
enhancement, the more reason that businesses should be encouraged to embrace
intrapreneurship in their operations (Nkosi, 2011).
35
Firms that practice and promote intrapreneurship may engage in strategic renewal which
may above all else involve innovation (Ramachandran, Devarajan& Ray, n.d ; Gibson
2013), and also firms with an established intrapreneurial orientation pursue innovation
(Botha & Nyanjom, 2011). Urbancová (2013) points out that innovativeness needs
managements support for it to thrive. This should be sustained innovation which may
not be as a result of a single discrete event (Morris, Kuratko & Covin, 2010). Gibson
(2013) defines strategic renewal as “the act of dynamically adjusting business models
and strategies to the deep changes in the external environment”.
Strategic renewal is defined by Kuratko (2014) as that which is concerned with
organizational renewal that involves major strategies as well as structural changes. A
firm going through a strategic decline will be at a weakened position to compete
effectively thus requires a renewal process. Strategic renewal may not be just the
transformation of organizations by renewing the key ideas on which they are built, but
that which represents a repositioning that is fundamental to the organization’s
competitive space (Morris, Kuratko & Covin, 2010).
“Strategic renewal includes the process, content, and out-come of refreshment or
replacement of attributes of an organization that have the potential to substantially affect
its long-term prospects” (Argawal & Helfat, 2009). Entrepreneurial efforts within an
organization that bring about substantial changes to its strategy, business model and
organizational structure, constitute strategic renewal. Strategic renewal is an important
factor in intrapreneurship process. Spector (2007), strategic renewal is the alteration of
an organization’s strategy, which can either be incremental (expansion into new
products, service lines or dramatic improvements in the current lines), or
transformational (redefining customer expectations, industry dynamics, and the basis for
competition).This is done with an aim of regaining competitive advantage that is
sustainable. Renewed strategy implementation will require the leaders of an organization
be engaged in a process of change as depicted by figure 2.3.
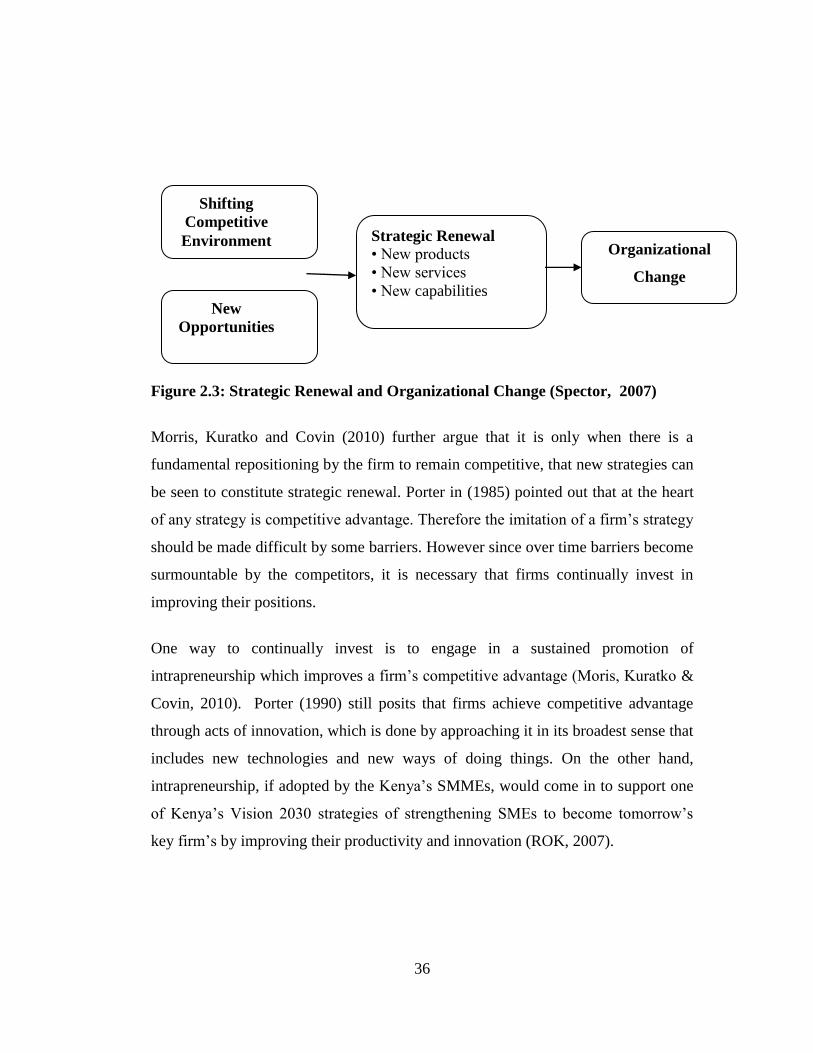
36
Figure 2.3: Strategic Renewal and Organizational Change (Spector, 2007)
Morris, Kuratko and Covin (2010) further argue that it is only when there is a
fundamental repositioning by the firm to remain competitive, that new strategies can
be seen to constitute strategic renewal. Porter in (1985) pointed out that at the heart
of any strategy is competitive advantage. Therefore the imitation of a firm’s strategy
should be made difficult by some barriers. However since over time barriers become
surmountable by the competitors, it is necessary that firms continually invest in
improving their positions.
One way to continually invest is to engage in a sustained promotion of
intrapreneurship which improves a firm’s competitive advantage (Moris, Kuratko &
Covin, 2010). Porter (1990) still posits that firms achieve competitive advantage
through acts of innovation, which is done by approaching it in its broadest sense that
includes new technologies and new ways of doing things. On the other hand,
intrapreneurship, if adopted by the Kenya’s SMMEs, would come in to support one
of Kenya’s Vision 2030 strategies of strengthening SMEs to become tomorrow’s
key firm’s by improving their productivity and innovation (ROK, 2007).
Shifting
Competitive
Environment
New
Opportunities
Strategic Renewal
• New products
• New services
• New capabilities
Organizational
Change
37
According to Williams (2009), pro-activeness enables a firm to be entrepreneurial
by predicting future changes, needs and demands thus developing new products or
services that may not be related to the current operations. This enables introduction
to the market of new products and services ahead of the competitor (Diefenbach,
2011). Still a firm should strive to portray intrapreneurship through competitive
aggressiveness by its ambition to challenge and dominate its competitors. This can
be attained through improving the firm’s position and performance in the market
place which ensures more market share (Kosta & Nicolaidis, 2011; Azami, 2013).
2.4 Empirical Review
2.4.1 Commitment of Resources
Mensah (2013) did a study in Ghana on strategic resources and performance of rural
SMES. The study was made on 150 retail SMEs in the Western Region of Ghana. The
focus of the study was on how both external and internal resources affect the
performance of the SMES. The study divided the internal resources into tangible and
intangible while the external resources were viewed as suppliers, customers and
competitors. The two types of resources were the independent variables.
Performance which was the dependent variable in this study was viewed as profits, stock
turn over and customer satisfaction. Tangible resources studied were cash, stock and
employees, while the intangible resources were experience, education, open hours and
processes. The study found out that cash, experience and opening hours, were the
resources that affected performance the most. This study strengthened the resources
based theory that the resources of a firm act as its source of competitive advantage.
Another study was undertaken by McGlone (2014) investigating into factors which
contribute to entrepreneurial activities within the financial services industry. The study
focused on six factors namely management support, work discretion, organizational
boundaries, rewards reinforcement, time availability and climate variables, as
38
prerequisites of corporate entrepreneurship within the financial services industry in
Ireland, by focusing on one of the well known international services company in Dublin.
Management support in this study was looked at that which provided encouragement,
support and resources especially finances, to employees to enable them scout for, pursue
and develop creative as well as entrepreneurial initiatives within the organization. The
study concluded that management support, which includes allocating resources to
employees, was an important and key driver for intrapreneurship activities in the
industry.
2.4.2 Management’s Need for Achievement
Okhomina (2010) did a study on how supportive environment moderates the relationship
between entrepreneurial orientation and psychological traits on 315 dealers and owners
of used car lots in the United States of America. The psychological traits studied were
need for achievement, internal locus of control, tolerance for ambiguity.
The high need for achievement scored a higher mean score (5.88) than either the internal
locus of control (5.70) or the tolerance for ambiguity (5.24). The study also found that
supportive environment positively moderated the relationship between psychological
traits and entrepreneurial orientation. The study also gave credence to the view that high
need for achievement as well as other psychological traits enhance the entrepreneurial
orientation of a firm.
Rishipal and Jain (2012) undertook a study titled “Need for achievement an antecedent
for risk adaptiveness among entrepreneurs” by looking at a sample of 100 entrepreneurs,
50 from large scale enterprises and 50 from small scale enterprises. The results of the
study showed that need for achievement among entrepreneurs greatly influenced the
degree of their risk adaptiveness. However, the degree for need for need for achievement
among small scale entrepreneurs was less than that of large scale entrepreneurs. The
explanation given for this scenario was that mostly small scale entrepreneurs are
39
beginners and may lack the potential, capability, exposure and experience for resource
management and how to conduct business, therefore showing a high degree of need for
achievement but not adaptive to risk taking. The entrepreneur thus in the small scale
enterprise is fearful of the challenging, unknown and uncertain future business
environment.
2.4.3 Reward System
Bau and Dowling (2007) in Germany did a study on the impact of reward and incentive
systems on entrepreneurial firms. A survey of 1,500 entrepreneurial firms was contacted
but only 59 of these either responded or filled a usable questionnaire. The focus was on
firms that were not more than seven years old with at least 20 employees, but not
specific to SMES.
The response of 59 represented only 3.9% of the targeted population of 1,500, which
was inadequate. The study used independent variables as the company age in years at the
time of survey, age of employees, firm size measured by sales and number of
employees, employees’ age, education level, and gender. The dependent variables of the
study were incentives arising from the work itself, social incentives, incentives by
internal organizational environment, direct and indirect financial rewards.
The results of Bau and Dowling (2007) study were that the social incentives were rated
higher than all the others as the most important. Incentives provided by the work itself
were rated second, incentives as a result of internal organizational environment were
third. The weakest were the financial incentives with the direct financial incentive rated
higher than the indirect financial incentive. The study concluded that because
entrepreneurial firms are characterized by limited resources and a higher degree of
uncertainty and risk, the emphasis was on non financial reward and incentive system
than on financial. Another important finding was the matching of education level with
financial reward and incentive. Those companies with high university graduate

40
employees had a more sophisticated reward and incentive system. Therefore those
wanting to run their operations competitively in competing with the large integrated
companies, it was important to focus on the financial rewards preferred by the university
graduate.
Scheepers (2011), did a study on the relevance of rewards on motivation of
intrapreneurs, investigating the rewards used by organizations in motivation of
intrapreneurs in both service and information and communication technology firms in
South Africa. The study explored several rewards in order to determine the ones that
intrapreneurs valued. The conclusion of the study was that intrapreneurs mostly valued
formal acknowledgement, social incentives and the organizational freedom of
employees.
Schhepers (2011) study concluded that money was not the most important factor in
encouraging entrepreneurs. Entrepreneurial firms, therefore, based on this study should
offer more social incentives, support and offer formal acknowledgement to their
employees. Organizational freedom should as well be availed to enable employees make
decisions on how to achieve goals that are job related.
2.4.4 Entrepreneurial Management Structure
Shoghi and Safieepoor (2013) undertook a study on the effects of organizational
structure on entrepreneurial orientation of employees in the metal industries of Kaveh
Industrial City of Iran. The study pointed out that organizational structure is one of the
most important and effective factors that help in facilitation of entrepreneurship in
organizations. The study looked at the constructs of organizational structure as
complexity, formalization and centralization. In particular the study found that
organizational structures that are not complex and consistence with the criteria for the
organization lead to improved organizational entrepreneurship. Where there are strict
and rigorous rules, the entrepreneurial orientation decreases. It is therefore important,
41
that organizations implement a flexible entrepreneurial structure if entrepreneurial
activities are intended. In Turkey Alpkan, Bulut, Gunday, Ulusoy, and Kilic (2010)
undertook a study to investigate innovative performance of companies as a result of both
the direct and interactive effects of organizational support and human capital. It looked
at the organizational support variables as management support for generation and
development of new ideas, allocation of free time, work discretion, performance based
reward systems and tolerance for risk taking.
Human capital was looked at as both a moderating variable to organizational structure,
and a direct influence on the innovative performance of firms. The study was carried out
on 184 manufacturing firms in Turkey. The results of the study were that organizational
support has a positive impact on innovative performance of the firms. This was
especially so for the management support and tolerance for risk taking, which were
found to be the drivers that strongly influenced innovativeness.
The study byAlpkan, Bulut, Gunday, Ulusoy, and Kilic (2010) found that when human
capital was interacted with organizational support not to produce high levels of
innovative performance especially when they are both high. However, when
organizational support was high and human capital was low, the innovative performance
was high. The explanation for this finding was that there appeared to be in existent either
other resources or antecedents beyond human capital and organizational support
interaction, necessary to reach higher innovativeness levels. Human capital on its own
was found to have a positive impact on innovative performance.
42
2.4.5 Promotion of Intrapreneurship
Lwamba, Bwisa and Sakwa, (2013) did a study on exploring the innovativeness
dimension of corporate entrepreneurship on financial performance of manufacturing
firms in Kenya. Innovativeness was the independent variable which was operationalized
by product innovativeness, process innovativeness and organizational innovativeness.
Financial performance was the dependent variable operationalized as profits and sales.
The study was focused on 200 manufacturing firms within Nairobi County, with 186
firms of these responding. The study concluded that innovativeness is fundamental to the
financial performance of a firm. The conclusion was that managers of firms should
therefore embrace innovativeness for firms to experience financial performance. This
study reinforced the importance of intrapreneurship to improved firm performance.
Duarte (2011) undertook a study to analyse management strategies so as to evaluate the
degree of entrepreneurship portrayed by the management of a firm through the use of
innovation, risk and proactive strategies. The study was undertaken on a group of 251
industrial and construction firms in Portugal. Proactivity was found to be the only one in
the firm’s, leading to the conclusion that intrapreneurship was very low in the firms. The
firms were found to portray risk averse and lack of innovativeness. The management
style was found to be weak thus the rates of intrapreneurship.
2.5 Critique of Existing Literature
The study by Mensah (2013) linked availability and utilization of resources to high
performance of SMEs. It gave credence to the view that commitment and utilization of
the available resources enables a business to enhance its competitive advantage.
However the study focused on 150 SMEs owned by rural traders mainly in the retail
sector. Sehgal (2008) posited that retail sector is differentiated from the manufacturing
sector in that retail is a distribution channel of the manufactured products.
43
Manufacturing is the process through which raw materials are turned into finished
products. The investment focus is different for both. The retail sector invests on the
merchandise flowing through it while manufacturing sector invests on the raw materials
and equipment for manufacture. It is important to note that the study did not link
resource utilization to promotion of intraprenurship but to the SME’s performance.
McGlone (2014) study investigated factors which contribute to entrepreneurial activities
and was based on the financial services industry in Ireland. The study used the corporate
entrepreneurship climate instrument to collect data from the respondents. It was also
based on a single financial services company in Dublin, Ireland, while it used purposive
sampling to identify the respondents. The variables which it investigated are different
from those that the researcher investigated except for the reward system. McGlone study
was neither in the manufacturing sector nor was it in the SME sector so the results
cannot be generalized in these sectors.
The study undertaken by Rishipal and Jain (2012) on the need for achievement as an
antecedent for risk adaptiveness among entrepreneurs was a comparative study between
the large and the small scale sector. The study does not also specify which specific
sectors or industries it focused on. The focus was on two variables, being need for
achievement and risk adaptiveness of entrepreneurs, thus it did not relate need for
achievement to intrapreneurship in firms. The results of this study cannot be generalized
to small and medium scale enterprises in Kenya as the researcher did not compare them
to large manufacturing enterprises. Rishipal and Jain (2012) study used the risk
adaptiveness test and achievement motive test, which this study did not use.
The study by Scheepers (2011) on the relevance of rewards on motivation of
intrapreneurs in encouraging intrapreneurship, although an empirical study was
conducted on South African firms in the service and information sector, and
communication sector. The study apart from being undertaken on 119 service firms and
101 communication firms, did not classify the firms in terms of size, which is either
44
SMEs or large enterprises. Data was obtained through telephone interviews and was
mainly on a likert scale from 1 (strongly disagree) to 9 (strongly agree). Intrapreneurship
was studied from three dimensions of innovativeness, pro-activeness and risk-taking,
while rewards system was the only independent variable with fifteen constructs. The
study clearly deviates from the one the researcher undertook and therefore cannot be
generalized to Kenyan SMMEs.
The study by Alpkan, Bulut, Gunday, Ulusoy and Kilic (2010) concluded that there is a
positive relationship between management support and innovative performance.
Innovativeness as a result of entrepreneurial management is a dimension of
intrapreneurship that the researcher sought to establish. The study by Bau and Dowling
(2007) brings out support to the importance of reward system in enhancing the
entrepreneurial spirit of a firm. The results of the study cannot however be generalized
to include firms in developing countries especially on the financial rewards. The study
also points out that since it is based on German firms, the national cultural bias is a
possible limitation especially in human resource management and organizational
behaviour. The response rate of the study was very low at 59 firms of 1500 firms
targeted for the study thus representing 3.9%. It did not indicate whether small and
medium scale manufacturing firms were part of the study.
The study by Lwamba, Bwisa, and Sakwa (2013) supports the view that the
innovativeness of corporate entrepreneurship positively affects performance of a firm. It
was however focused on manufacturing firms in general without differentiating whether
they were Large or Small and Medium Scale. It focused on Nairobi County only which
may not form a good basis of generalization since they are not in a rural setting. The
sampling technique was simple random sampling with every manufacturing firm having
an equal chance of participating in the study. The manufacturing sectors in Kenya were
therefore not adequately represented in the study. It also did not specifically focus on
SMMEs and was not on entrepreneurial management and promotion of intrapreneurship.
45
Mokaya (2013) did a study on theoretical perspectives, approaches and outcomes of
corporate entrepreneurship. The study concluded that firm performance and corporate
entrepreneurship are closely related. Firms nurturing organizational structures and
values that favour and encourage entrepreneurial orientations are more likely to post
better performance results than those which do not. Those firms that have high
intrapreneurial intensities in particular experience high performance levels. This study
was however a secondary research and did not focus on any particular entrepreneurial
segment.
2.6 Summary of Literature
This chapter reviewed the theories which explain the variables to the study. Resource
based theory explains the importance of resources to an organization, and how decision
by managers on the acquisition and utilization of these resources is important to the
exploitation of the external opportunities (Simon, Hitt, Ireland & Gilbert, 2011). The
resource based theory brings forth the first hypothesis. The second hypothesis was
instigated by McClelland’s high need for achievement which states that individuals with
a high need for achievement are pushed to do well so that they can attain a feeling of
accomplishment, with entrepreneurs portraying this aspect more than the population in
general (Stewart & Roth, 2007). The third hypothesis was anchored on two theories the
first one being Herzberg’s two-factor motivation theory also known as motivation-
hygiene theory.
Intrinsic motivators are within the job why extrinsic motivators or the hygiene factors
are outside the job. The second theory is the expectancy theory of motivation which
states that individuals are motivated by the belief that the effort put at work matches
performance which in turn attracts the appropriate rewards (Lunenburg, 2011). The
fourth hypothesis was informed by structural contingency theory that states that no
single management structure is applicable to all organizations, therefore should be
tailored on the contingency factors affecting the organization (Soylu, 2008).
46
The empirical review strengthened the view of the resource based theory that a firm’s
resources act as its source of competitive advantage. There is also a positive relationship
between a high need for achievement as a psychological trait and entrepreneurial
orientation of a firm (Okhomina, 2010). Moreover, a manager who is achievement
oriented is innovative which is one aspect of survival of any business. A reward system
is also positively related to the performance of entrepreneurial firms with the direct
financial reward rating higher than the indirect financial reward. The social incentives
rank higher as per the study undertaken by Bau and Dowling (2007).
The study undertaken by Shoghi and Safiepoor (2013) has the view that management
structure is one of the most important and effective factors that help in facilitating
intrapreneurship in organizations and especially structures that are neither complex nor
rigid. The study by Lwamba, Bwisa and Sakwa (2013) innovativeness dimension of
intrapreneurship with improved financial performance, thus reinforcing the view that
intrapreneurship is necessary for any firm. There is also need by the SMEs to practice
intrapreneurship for them to overcome the various challenges facing them and become
competitive (Ragui & Wainaina, 2013).
The critique brought out the shortcomings of the studies for example the study by
Mensah (2013) was based on SMEs owned by rural traders in the retail sector and this
sector is different from the manufacturing sector. The study by Bau and Dowling (2007)
was undertaken on German firms a developed country which is different from a
developing country, while the study done by Lwamba, Bwisa and Sakwa (2013) focused
of one dimension of intrapreneurship and based on manufacturing firms in general
without specifically focusing on SMMEs. The study by Alpkan, Bulut, Gunday, Ulusoy
and Kilic (2010) linked management support to innovativeness which is a dimension of
intrapreneurship.
47
The research gaps that were identified include the fact that most of the studies
undertaken have tended to greatly focus on the large enterprises ignoring the SME
sector. There is also scarcity of studies linking entrepreneurial management to
intrapreneurship within a firm and specifically to intrapreneurship within SMMEs. It is
therefore necessary to undertake a comprehensive study to establish the role of
entrepreneurial management on SMMEs.
2.7 Research Gaps
Manufacturing is one of the key important sectors in Kenya as it contributes to 14% of
the Gross Domestic Product (KAM, 2015). The formal employment in the year 2014
increased by 2.9% in this sector (ROK, 2015). However, the contribution of this sector
to GDP has continued to stagnate at 10% despite its high yet untapped potential to
contribute more to both the GDP and employment (KIPPRA, 2013). The sector is
comprised of more than 70% SMMEs (KIPPRA, 2013), which according to Gathogo
(2013) have continued to perform poorly since Kenya’s independence and some have
had to close down due to inability to remain competitive and operate profitably.
Intrapreneurship increases firms performance and can be practiced by firms of all sizes.
The studies that have been undertaken on intrapreneneuship have tended to focus on the
large firms. According to Naldi, Achtenhagen and Davidsson (2015), there has been
increased attention on international intrapreneurship and not much is known about firm-
level entrepreneurship undertaken by established small and medium-sized enterprises.
Internationally, even though Sakhdari, Burgers and Davidsson (2014) did an attention-
based view study of the moderating role of entrepreneurial management in the
relationship between absorptive capacity and corporate entrepreneurship in Iran and
Australia, it was neither specifically focused on SMEs nor on SMMEs. Entrepreneurial
management in this case was constituted as strategic orientation, resource orientation,
management structure, reward philosophy, growth orientation and culture.
48
Though three of these constructs are part of what this study sought to establish their role
on promotion of intrapreneurship, the study used a moderating variable of absorptive
capacity.
In Kenya, several studies have been undertaken on intrapreneurship but focused on the
large enterprises. Mokua and Ngugi (2013) looked at the determinants of corporate
entrepreneurship in the banking industry in Kenya. The determinants in this study were
entrepreneurial culture, strategy, rewards and organization culture. Even though the
study concluded that the availability of these determinants was crucial for there to be
intrapreneurship, it was neither on small firms nor on SMMEs.
The study by Lwamba, Bwisa and Sakwa (2013) focused on the innovativeness
dimension of corporate entrepreneurship on financial performance of manufacturing
firms in Kenya. The study did not specifically focus on SMMEs, which face challenges
unique to the SME sector in general, for example they may lack capacity and could be
financially constrained, therefore lumping them together in a study could produce biased
data. The study even though focused on the manufacturing sector did not look at what
brings out intrapreneurship within a firm. This study therefore sought to fill the
identified gaps and those pointed out in the criticism of the existing literature, by
establishing the role of entrepreneurial management on intrapreneurship in SMMEs in
Kenya.
Duarte (2011) study was based on 251 firms in manufacturing and construction in
Portugal. The environment of the firms in Portugal is not the same as the environment in
Kenya thus results cannot be generalized to the Kenyan situation. Also competitive
aggressiveness to indicate promotion of intrpreneurship which part of the current study
was not part of the areas studied by Duarte (2011).

49
CHAPTER THREE
RESEARCH METHODOLOGY
3.1 Introduction
This chapter discusses how the research was undertaken by focusing on the process, the
tools and procedures which were used. In particular, it shows the population and
explains how the sample was selected as well as discussing the data collection
instrument, processing and the procedures that were used to analyze the data so as to
achieve the objectives of the study. Pilot study which is an important aspect for testing
the validity and reliability of the research instrument is discussed under this chapter.
3.2 Research Design
The study was conducted using both descriptive and correlational research designs.
According to Elahi and Dehdashti (2011), descriptive research is appropriate when the
objective is to determine the degree of the relatedness of the variables. It is proper to use
this type of research design if the research objectives; portray social or physical
phenomena characteristics, determine the degree of the association of variables, and
make predictions in regard to the occurrence of social or physical phenomena.
Descriptive research design can either be quantitative or qualitative, and can often utilize
elements within the same study, and explains the way things are in the phenomenon or
the population being studied (Knupfer & McLellan, 2001; Joy, 2014).
Correlational research design uses empirical evidence to describe the relationship among
variables. It is used to establish if there is a relationship between two variables, as well
as the direction and the magnitude of the relationship (Cohen, Manion & Morrison,
2005). The two research designs were therefore used to determine the role of
entrepreneurial management on promotion of intrapreneurship in the small and medium
manufacturing enterprises in Kenya.
50
3.2.1 Research Philosophy
This research leaned towards the positivist’s research philosophy. Positivism uses
quantitative tools and techniques that emphasize measuring and counting. It emphasizes
empirical data and scientific method (Jakobsen, 2013). According to Trochim (2006),
positivism’s position is that the goal of knowledge is to describe the phenomenon that is
being experienced, by sticking to what is observable and measurable. It is the position of
positivism as pointed out by Cohen, Manion and Lawrence (2007) that science provides
the clearest ideal of knowledge.
There are several assumptions that underpin the scientific faith as Cohen, Manion and
Lawrence (2007) continue to point out. First is the assumption of determinism which
means that events have causes and are determined by other circumstances. In this case
science believes that the causal links can eventually be uncovered and understood.
Under this assumption, scientists formulate laws so as to account for the occurrences
inthe world thereby gaining a firm basis for prediction and control.
The second assumption as per Cohen, Manion and Lawrence (2007) is empiricism
which avers that experience derives certain kinds of reliable knowledge, thus
scientifically a theory or a hypothesis is justified by the nature of the empirical evidence
that supports it. The third assumption is the principle of parsimony, that is explaining
phenomena in the most economical way possible, for example accounting for a
phenomenon by use of two concepts rather than three, or preferring a simple theory to a
complex one.
The fourth and final assumption is generality, meaning that scientists are able to begin
with the observations of the particular, and then generalize their findings to the world at
large. The research on the role of entrepreneurial management on promotion of
intrapreneurship in the SMMEs in Kenya was based on hypotheses that were tested on a
sample, data analyzed, and the results generalized on the rest of SMMEs in Kenya.
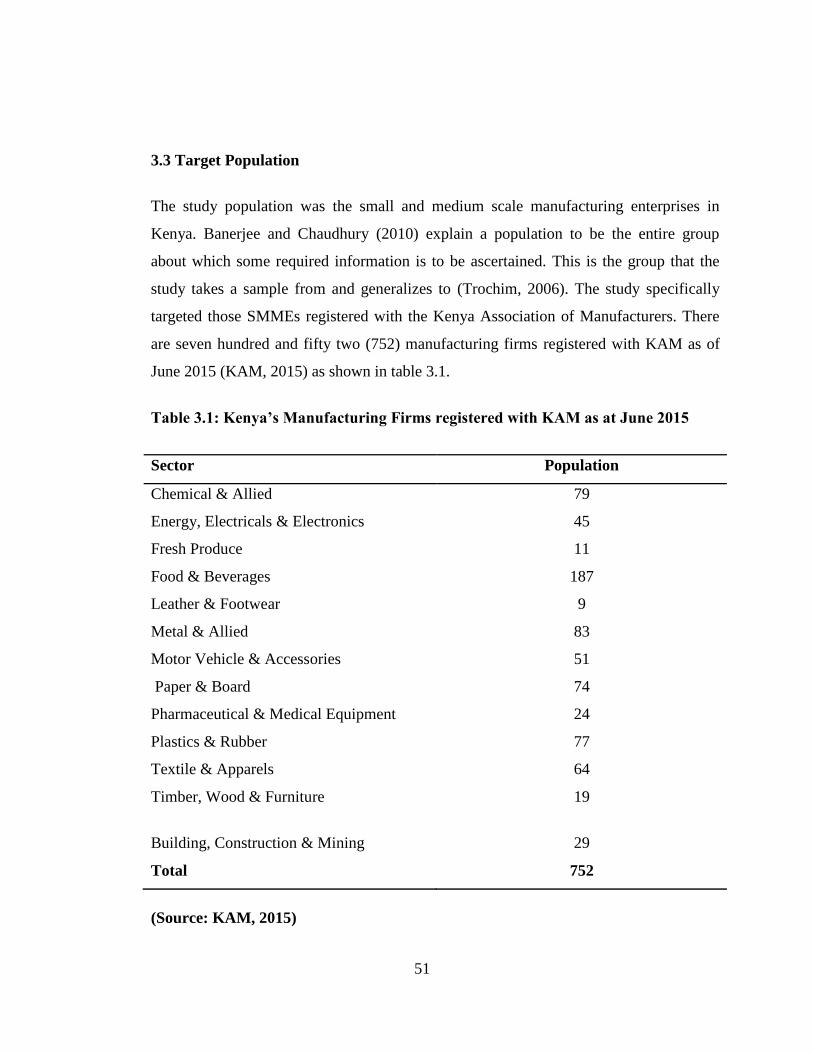
51
3.3 Target Population
The study population was the small and medium scale manufacturing enterprises in
Kenya. Banerjee and Chaudhury (2010) explain a population to be the entire group
about which some required information is to be ascertained. This is the group that the
study takes a sample from and generalizes to (Trochim, 2006). The study specifically
targeted those SMMEs registered with the Kenya Association of Manufacturers. There
are seven hundred and fifty two (752) manufacturing firms registered with KAM as of
June 2015 (KAM, 2015) as shown in table 3.1.
Table 3.1: Kenya’s Manufacturing Firms registered with KAM as at June 2015
Sector Population
Chemical & Allied 79
Energy, Electricals & Electronics 45
Fresh Produce 11
Food & Beverages 187
Leather & Footwear 9
Metal & Allied 83
Motor Vehicle & Accessories 51
Paper & Board 74
Pharmaceutical & Medical Equipment 24
Plastics & Rubber 77
Textile & Apparels 64
Timber, Wood & Furniture
Building, Construction & Mining
19
29
Total 752
(Source: KAM, 2015)
52
3.4 Sample Size and Sampling Technique
Latham (2007) defines a sample as representative selection of the population. Sampling
is the selection of a portion of the population that truly represents the said population. It
involves selection of units from the population of interest, which forms the sample.
Generalization of results back to the population from which that sample was chosen
from is made possible (Trochim, 2006).
A sampling frame is a listing of the accessible population from which the sample is
drawn (Trochim, 2006). The sample frame for this study was the KAM Directory 2015
for those SMMEs registered with Kenya Association of Manufacturers. According to
Kothari (2004), some of the characteristics of a good sample design are that the sample
should be truly representative, result in a small sampling error, and whose results of
study can be in general applied for the universe with a reasonable level of confidence.
The sample size should neither be too big nor too small but optimum, that which fulfils
efficiency, representativeness, reliability and flexibility requirements (Kothari, 2004). A
big sample size is more reliable and precise but costly in terms of resources, while a
small sample size would be unreliable. According to Kasiulevicius, Sapoka and
Filipaviciute (2006), statistically for the central limit theorem to hold, a sample size of
greater than 30 is needed for normal theory approximations for measures like the
standard error of the mean. The sample size increases with the degree of statistical
confidence and precision required (Turner, 2003). It is common practice for most studies
for the confidence level to be set at 95% and a precision of +/- 5% (Turner, 2003; Gupta,
2012).
KAM’s directory does not however differentiate the firms in terms of size. According to
KIPPRA (2013), the SME sector constitutes over 70% of the manufacturing firms in
Kenya. The Micro and Small Enterprises (MSE) Act 2012 defines the MSE sector as
those firms with an annual turnover not exceeding Kshs 5,000,000/= and not more than
53
50 employees. This sector as per the MSE Act includes the manufacturing sector where
investment in machinery and plant does not exceed Kshs 50,000,000/= (ROK, 2013).
Wanjau, Gakure and Kahiri (2012) define Small and medium manufacturing enterprises
in Kenya’s manufacturing sector as those with up to 100 fulltime employees and annual
sales turnover not exceeding Kshs 150 million. It is evident that a common definition of
an SME does not exist in Kenya as pointed out by Guitard (2007), in the report on SME
trade finance, reviewing of facilities available in Kenya. The report therefore adopted
the SME Solution Center’s definition of a formally registered entity, 5 to 150 employees
and a turnover of below US dollars 5 million. In the absence of a common definition for
SMEs in Kenya, this study adopted the World Bank’s definition of an SME as given by
Berisha and Pula (2015), as the one with 10 to 300 employees and an annual sales not
exceeding US dollars 15 million.
A representative sample was obtained using the stratified random sampling with a
proportional allocation of each stratum. In random sampling, each item in the population
has a probability of selection same as any other item in the population. Stratified
sampling on the other hand is used for data which does not constitute a homogenous
group but is heterogeneous. The population is divided into subgroups with common
characteristics, when representatives from each subgroup need to be part of the sample.
Random or systematic samples are then computed from each subgroup (Kothari, 2004;
Westfall, 2008).
At least 30% of the population is adequate to form the sample size as pointed out by
Mugenda and Mugenda (2003). According to Hill (2012), at least 10% sample size of
the population is adequate in descriptive research, while for a small population, 20%
should form the sample. The sample size for this study was determined using the sample
table developed by Krejcie and Morgan in 1970 as shown in appendix two.
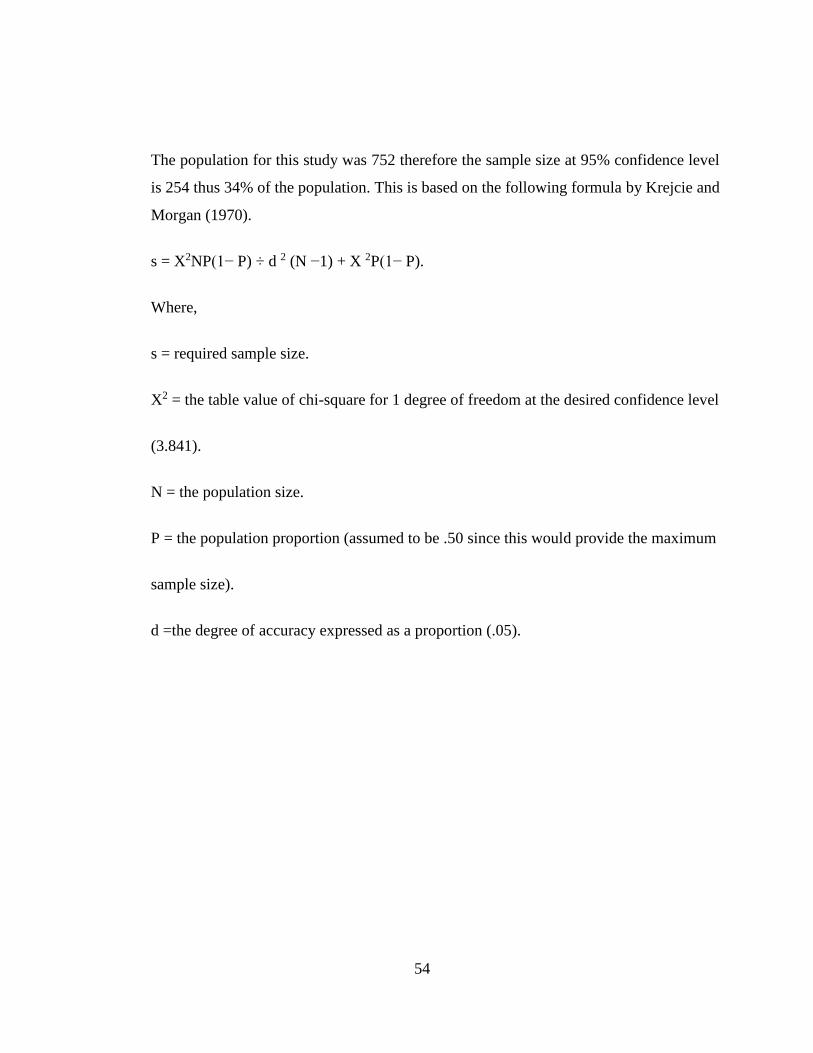
54
The population for this study was 752 therefore the sample size at 95% confidence level
is 254 thus 34% of the population. This is based on the following formula by Krejcie and
Morgan (1970).
s = X2NP(1− P) ÷ d 2 (N −1) + X 2P(1− P).
Where,
s = required sample size.
X2 = the table value of chi-square for 1 degree of freedom at the desired confidence level
(3.841).
N = the population size.
P = the population proportion (assumed to be .50 since this would provide the maximum
sample size).
d =the degree of accuracy expressed as a proportion (.05).
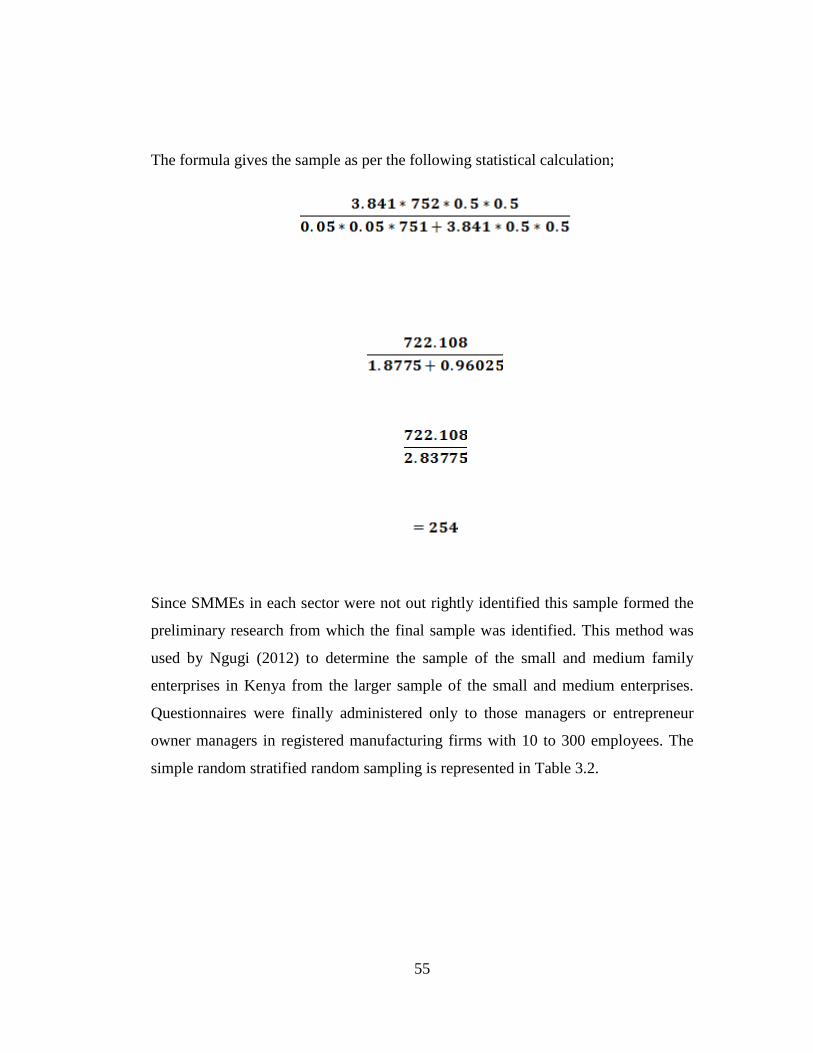
55
The formula gives the sample as per the following statistical calculation;
Since SMMEs in each sector were not out rightly identified this sample formed the
preliminary research from which the final sample was identified. This method was
used by Ngugi (2012) to determine the sample of the small and medium family
enterprises in Kenya from the larger sample of the small and medium enterprises.
Questionnaires were finally administered only to those managers or entrepreneur
owner managers in registered manufacturing firms with 10 to 300 employees. The
simple random stratified random sampling is represented in Table 3.2.

56
Table 3.2: The Sample Size
Sector Population (Firms) Sample Size
Chemical & Allied 79 27
Energy, Electricals &
Electronics
45 15
Fresh Produce 11 4
Food & Beverages 187 63
Leather & Footwear 9 3
Metal & Allied 83 28
Motor Vehicle &
Accessories
51 17
Paper & Board 74 25
Pharmaceutical &
Medical Equipment
24 8
Plastics & Rubber 77 26
Textile & Apparels 64 22
Timber, Wood &
Furniture
Building, Construction &
Mining
19
29
6
10
Total 752 254

57
3.5 Data Collection and Instruments
Data for this study was collected through a questionnaire. Both open-ended and closed-
ended question format were used. The data collection method was interviewer
administered questionnaire, to the managers or entrepreneur owners of the firms. The
advantage of this method even though time consuming, is that it allows probing and
clarification where the interviewer feels that the answer given is either not adequate or
not clear. It therefore gives in depth information on the structured questions asked
during the interview, and the response rate is high (Ngugi, 2012). To give support to this
data collection method, the questions were designed in a clear and simple language
understandable by the average person.
Since the questionnaire, as the data collection instrument was filled on both the
dependent and independent variables by the managers or the entrepreneur owners, the
instrument may be subject to common method bias or variance. According to Chang,
Witteloostuijn and Eden (2010), common method variance occurs when a researcher
uses self report questionnaires to collect data at the same time on both the independent
and dependent variables from the same source or participants. The result may be an
internal false consistency or an obvious correlation among variables, which calls for
remedies to be provided either before or after the use of the questionnaires. One way to
address this before data collection is by mixing the order of questions and designing
questions that are not vague, as well as encouraging the respondents to be as honest as
possible as there is no right or wrong answer. This is the remedy that was used for this
research.
3.6 Pilot Study
Cargan (2007) describes a pre-test or a pilot study as a means of checking whether the
study can be undertaken and provide data that is accurate. Its role is to examine the
feasibility of an approach intended for use in a larger scale study (Leon, Davis&
58
Kraemer, 2011). Pilot studies pretest the research instruments such as the questionnaire
(Gumbo, 2014). Kimberlin and Winterstein (2008) posit that the quality of an instrument
used in research in terms of reliability and validity can be known through undertaking a
pilot test. This identifies sources of error in an instrument thereby reducing these errors.
The pilot test was undertaken on 10% of the sample that is 25 firms. According to
Mugenda (2008), 10% of the sample is adequate for pilot test. A split test method was
used whereby questionnaires were divided into two halves of even and odd question
numbers. Data from each half was separately analysed and the two results correlated to
determine the reliability of the study instrument in consistently measuring the variables.
A correlation coefficient of 0.7indicates that the instrument is reliable. According to
Korb (2012), split test is the most important reliability type of evidence for
questionnaires.
After undertaking the pilot study, some questions were found to be ambiguous and
others abit complex thereby not getting clear answers from the respondents. According
to Choi and Pak (2004), an ambiguous question may lead to respondents understanding
the question in a manner that was not intended, leading to answering a question that was
not intended. This necessitated changing and simplifying some of the questions so as to
make them understandable. The questionnaire was also shortened to avoid apathy by the
respondents while answering the questions.
To explain the questions deeply and in a clear manner, well trained research assistants
were used so as to clarify the questions that were seemingly not understandable to some
of the respondents. This was especially the case with those firms run by foreigners not
acquainted with English as their first language. Other terms were found to be too
academic thus further clarification was provided which helped get the necessary
response.

59
3.6.1 Validity of Research Instrument
Validity concerns itself with the meaningfulness of research components so that the
research can measure what it intends to measure (Drost, 2011). Validity requires that an
instrument be reliable, though it can be reliable without being valid. It is the extent to
which the test results’ interpretations are warranted (Kimberlin & Winterstein, 2008).
This study was guided by face, content and criterion types of validity as discussed by
Kimberlin & Winterstein (2008), and Drost (2011).
Face validity is not determined through statistical analysis but depends on face value
judgmental view of one who is checking the instrument to determine whether it will
measure what it is supposed to measure. Content validity on the other hand is
determined by experts in the field, and this study was reviewed by experts to determine
its validity. Criterion validity determines the correlation of constructs that are supposed
to be correlated, and this study brought out this. All the above were done to ensure that
the instrument was valid.
3.6.2 Reliability of Research Instrument
Reliability according to (Drost, 2011) is the extent to which measurements can be
repeatable if performed by different persons on different occasions. It is the degree to
which measures are free from error thus yielding consistent results, therefore it involves
consistency and reproducibility of test scores (Thanasegaran, 2009). Repeatability or
stability overtime, and internal consistency are types of reliability estimation. It is
important to determine internal consistency before a test is undertaken so that validity
can be ensured.
Although there are various methods of measuring internal consistency, the most
commonly used is coefficient alpha with the most widely used being Cronbach’s
coefficient alpha (Thanasegaran, 2009). This was developed by Lee Cronbach in 1951
as a measure of internal consistency of a test or scale, and normally expressed as a
60
number between 0 and 1. A reliability coefficient of 0.7 and above is generally accepted
to be appropriate, and the higher the score is the more reliable it is. It is commonly used
when multiple-item measures of a concept or construct are employed, as it requires only
one test administration as opposed to test-retest reliability (Mohsen & Dennick, 2011).
3.7 Data Analysis and Presentation
This study involved both qualitative and quantitative data. As Kothari (2004) points,
after the questionnaires are received back the raw data should be edited and cleaned for
any errors or omissions and correction made where possible. This was done to ensure
data’s accuracy and consistency with other gathered facts. Coding and classification was
done for efficient analysis of the data. The data was fed into a computer and analysis
made using Statistical Package for Social Sciences (SPSS). Both descriptive and
inferential statistics were used in the analysis. Descriptive statistics describe and
summarize the data in a meaningful way using tables and bar charts, while inferential
statistics draw conclusions on the analyzed data thus helping in generalization.
Predictions or inferences based on the results of the analysis were made and the results
generalized on the population of study given that the test sample was part of the
population.
Factor analysis was used to statistically determine the suitability of all the variables to
the study. The collected data was also tested for the assumptions of the various
analytical models for example the diagnostic for the use of linear regression requires that
the data is normally distributed and no multicollinearity, and these were established. The
results of the data analysis were presented by the use of bar graphs, pie charts,
percentages and frequencies.
61
3.8 Measurement of variables
In testing the variables, relevant statements which established the relationship between
the variables were used. Intrapreneurship, (innovativeness, pro-activeness and
competitive aggressiveness) was the dependent variable, while the independent variables
were commitment of resources (undertaking research and development, upgrading
production equipment, training employees and engaging marketing
activities),management’s need for achievement (setting goals, opportunity seeking,
feedback for improvement and risk taking propensity) reward system ( promotion,
monetary reward, shareholding and grants for individual projects), and entrepreneurial
management structure (flat levels of management, open communication channels,
flexible management structure and inclusive decision making). Linear regression
analysis in this case was used to determine the strength and the significance of the
relationship between the dependent and each of the independent variables.
3.8.1 Linear Regression Analysis
Both simple and multiple regression analysis were undertaken to determine the effect of
the dependent variable(s) on the independent variable. Simple regression analysis uses
only two variables namely the independent variable which causes the behavior of the
other variable known as the dependent variable (Kothari, 2004). For this study, each of
the independent variables under entrepreneurial management was individually regressed
against the dependent variable promotion of intrapreneurship. This was achieved under
each specific objective by fitting the respective model.
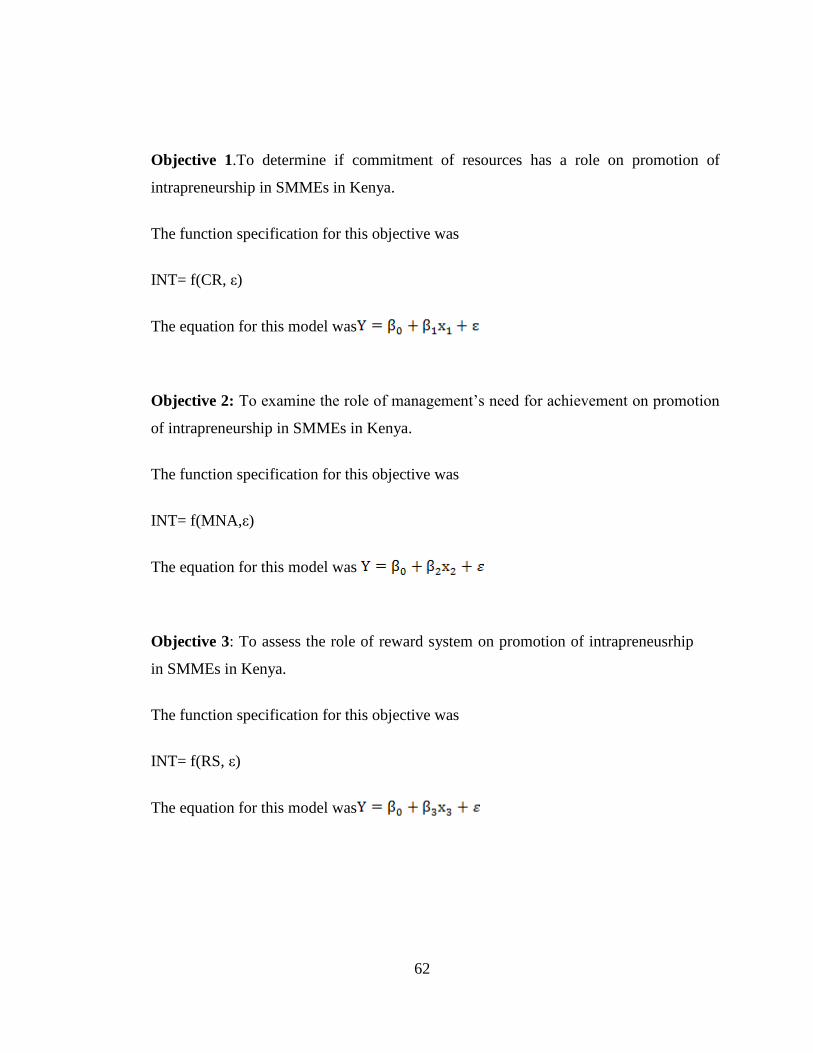
62
Objective 1.To determine if commitment of resources has a role on promotion of
intrapreneurship in SMMEs in Kenya.
The function specification for this objective was
INT= f(CR, ε)
The equation for this model was
Objective 2: To examine the role of management’s need for achievement on promotion
of intrapreneurship in SMMEs in Kenya.
The function specification for this objective was
INT= f(MNA,ε)
The equation for this model was
Objective 3: To assess the role of reward system on promotion of intrapreneusrhip
in SMMEs in Kenya.
The function specification for this objective was
INT= f(RS, ε)
The equation for this model was
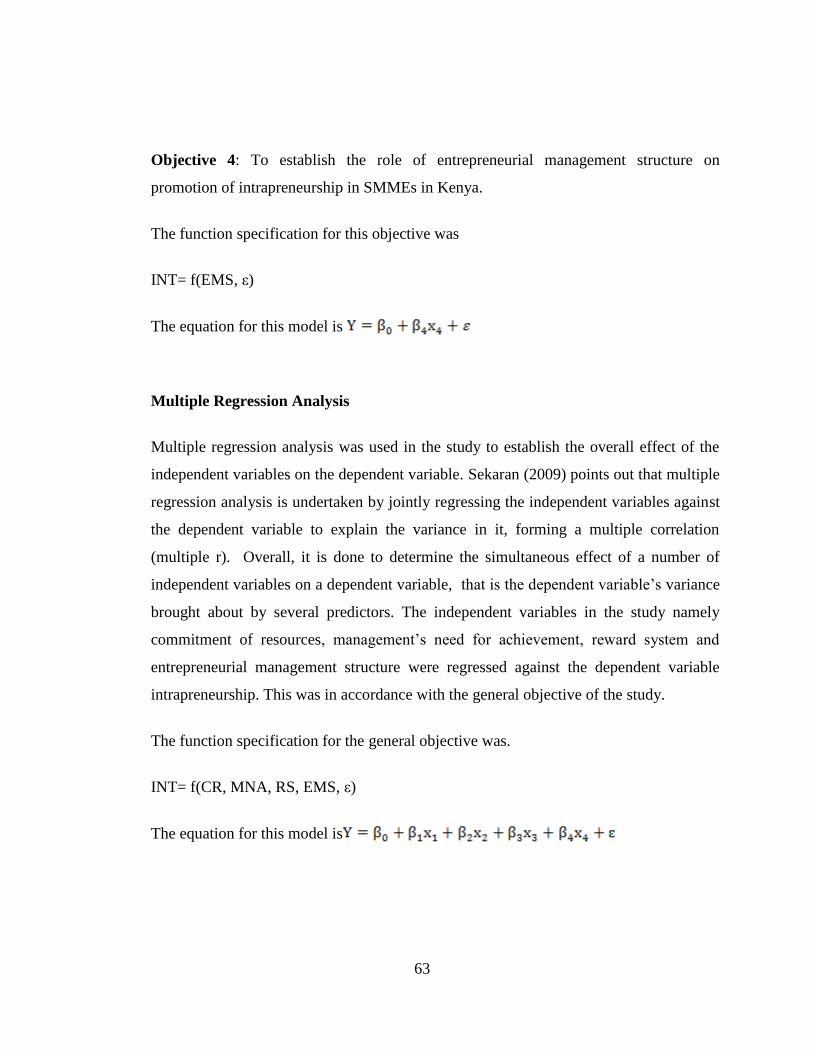
63
Objective 4: To establish the role of entrepreneurial management structure on
promotion of intrapreneurship in SMMEs in Kenya.
The function specification for this objective was
INT= f(EMS, ε)
The equation for this model is
Multiple Regression Analysis
Multiple regression analysis was used in the study to establish the overall effect of the
independent variables on the dependent variable. Sekaran (2009) points out that multiple
regression analysis is undertaken by jointly regressing the independent variables against
the dependent variable to explain the variance in it, forming a multiple correlation
(multiple r). Overall, it is done to determine the simultaneous effect of a number of
independent variables on a dependent variable, that is the dependent variable’s variance
brought about by several predictors. The independent variables in the study namely
commitment of resources, management’s need for achievement, reward system and
entrepreneurial management structure were regressed against the dependent variable
intrapreneurship. This was in accordance with the general objective of the study.
The function specification for the general objective was.
INT= f(CR, MNA, RS, EMS, ε)
The equation for this model is
64
Where;
Y= Promotion of Intrapreneurship (INT)
X1= Commitment of Resources (CR)
X2= Management’s Need for Achievement (MNA)
X3= Reward System (RS)
X4= Entrepreneurial Management Structure (EMS)
β0 = Constant Term
β1, β2, β3 and β4= coefficients of commitment of resources, management need for
achievement, reward system and entrepreneurial management structure respectively.
ε= error term
3.8.2 Hypotheses Testing
According to Kothari (2004), a hypothesis is an assumption or some supposition that can
either be disproved or proved, by objective verification and testing. Research hypotheses
are formal questions intended for resolving a phenomenon, and are either propositions or
set of propositions which explain the occurrence of a specified group of phenomena.
Research hypotheses are often predictive statements that have capability of being tested
by scientific methods relating an independent variable to a dependent variable. For this
study, the t-test was used and the statistical significance of the coefficient determined. If
t-value was found to be significantly different from zero, and a p-value less than 0.05,
then the alternative hypothesis was accepted and the null hypothesis rejected.
65
A t-test was used to test the hypotheses. A t-test is a test statistic which is a standardized
value calculated from the data of the sample in testing of hypothesis. The data is
compared to the expected result of the null hypothesis. If the t-value equals zero, then
the results of the sample equal the null hypothesis (Frost, 2016). In a t-test, the greater
the magnitude of t-value, the greater the evidence against the null hypothesis in stating
that there is no significant difference. This leads to the rejection of the null hypothesis
and to the acceptance of the alternative hypothesis. The probability values which go
hand in hand with the t-test should be lower than the stated significance for the null
hypothesis to be rejected. In this study, the stated significance level was 0.05. The higher
t-value, the lower the p-value and greater the evidence that the null hypothesis should be
rejected (Runkel, 2016)
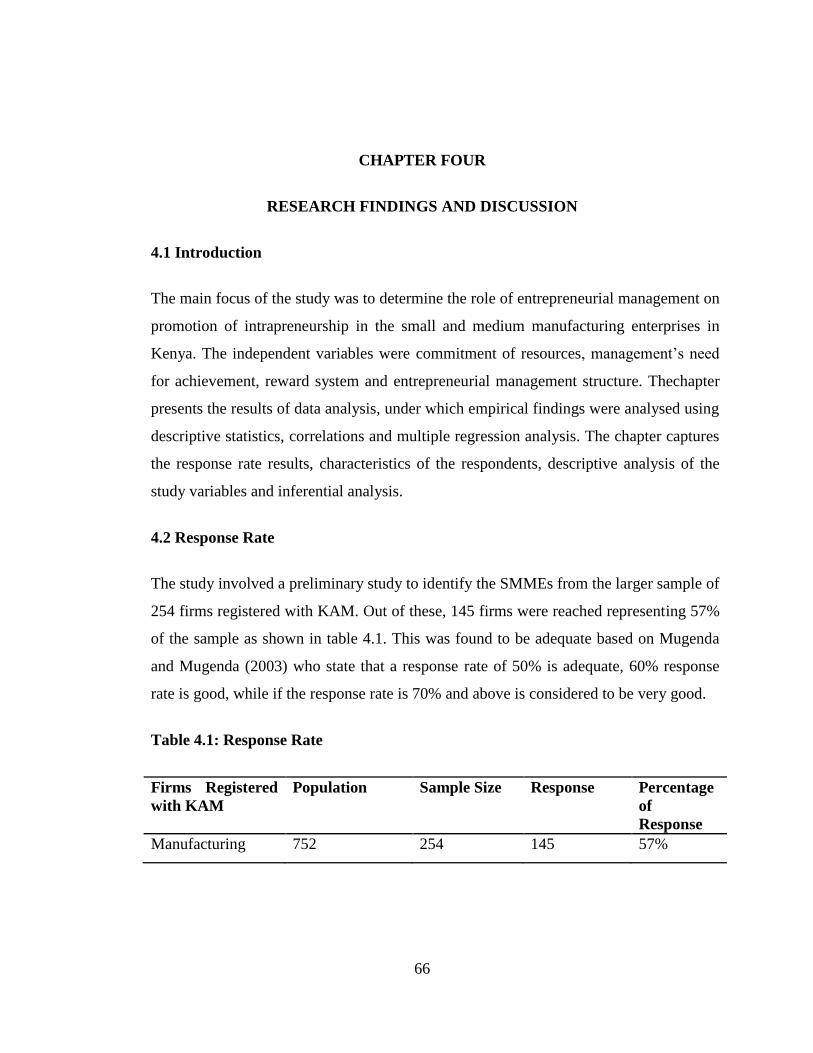
66
CHAPTER FOUR
RESEARCH FINDINGS AND DISCUSSION
4.1 Introduction
The main focus of the study was to determine the role of entrepreneurial management on
promotion of intrapreneurship in the small and medium manufacturing enterprises in
Kenya. The independent variables were commitment of resources, management’s need
for achievement, reward system and entrepreneurial management structure. Thechapter
presents the results of data analysis, under which empirical findings were analysed using
descriptive statistics, correlations and multiple regression analysis. The chapter captures
the response rate results, characteristics of the respondents, descriptive analysis of the
study variables and inferential analysis.
4.2 Response Rate
The study involved a preliminary study to identify the SMMEs from the larger sample of
254 firms registered with KAM. Out of these, 145 firms were reached representing 57%
of the sample as shown in table 4.1. This was found to be adequate based on Mugenda
and Mugenda (2003) who state that a response rate of 50% is adequate, 60% response
rate is good, while if the response rate is 70% and above is considered to be very good.
Table 4.1: Response Rate
Firms Registered
with KAM
Population Sample Size
Response Percentage
of
Response
Manufacturing 752 254 145 57%

67
4.2.1 Proportion of Small and Medium Manufacturing Enterprises
As shown in table 4.2, the preliminary study identified that 91.7% (133) of firms out of
the 145 reached to be SMMEs and this formed the final sample for the research. These
findings were found to be in line with those of ILO (2007) and Fjose, Grünfeld and
Green (2010) who state that SMEs constitute over 90% of all the enterprises in the
economies especially the developing ones. It can therefore be implied that SMMEs in
Kenya form over 90% of the firms in the manufacturing sector. Out of the 133
questionnaires administered by targeting either the managers or entrepreneur owners of
the SMME firms, 85.7% (114) were adequately completed therefore forming about 86%
response rate which is very good according to Mugenda and Mugenda (2003).
Table 4.2: Proportion of SMMEs in Manufacturing Sector and SMMEs
Response Rate
Firms
Registered
with KAM
Sample
Response
SMMEs
Frequency
Percentage
of SMMEs
Frequency
Response
(%)
SMMEs
Sample
Response
Percentage
of SMMEs
Sample
Response
(%)
Manufacturing 145 133 91.7 114 85.7
4.3 Results of the Pilot Study
After undertaking and analysing the pilot study data, some questions were found to be
ambiguous and others abit complex thereby not getting clear answers from the
respondents. According to Choi and Pak (2004), an ambiguous question may lead to
respondents understanding the question in a manner that was not intended, leading to
answering a question that was not intended. This necessitated changing and simplifying
some of the questions so as to make them understandable. The questionnaire was also
shortened to avoid apathy by the respondents as they answered the questions.
68
4.3.1 Construct Validity Test
According to Drew and Rosenthal (2003), construct validity is viewed by many
researchers as that which encompasses all the other forms of validity, and which is
the extent to which the measure used effectively measures the construct it intends to
measure. Through face validity, face value judgment which is the view of the person
checking the research instrument was established, while content validity which
depends on the view of experts in the field was also undertaken. Criterion validity
determines the correlation of the constructs that are supposed to be correlated as
pointed out by Kimberlin and Winterstein (2008). All the above was done to
determine the validity of the instrument.
4.3.2 Reliability of the Data
Reliability of a research instrument is undertaken to determine the internal consistency
of the instrument. A reliable research instrument should produce consistent results over
time even when used by different researchers on different occasions. Cronbach
coefficient alpha was used to test reliability in this case. If the reliability coefficient is
0.7 and above, then the reliability is strong, while if it is 0.6 and below, it is weak
(Thanasegaran, 2009; Drost, 2011). Table 4.3 shows that the variables were all
consistent with alpha values greater than 0.7 which is the recommended alpha value for
reliability, therefore all were accepted.
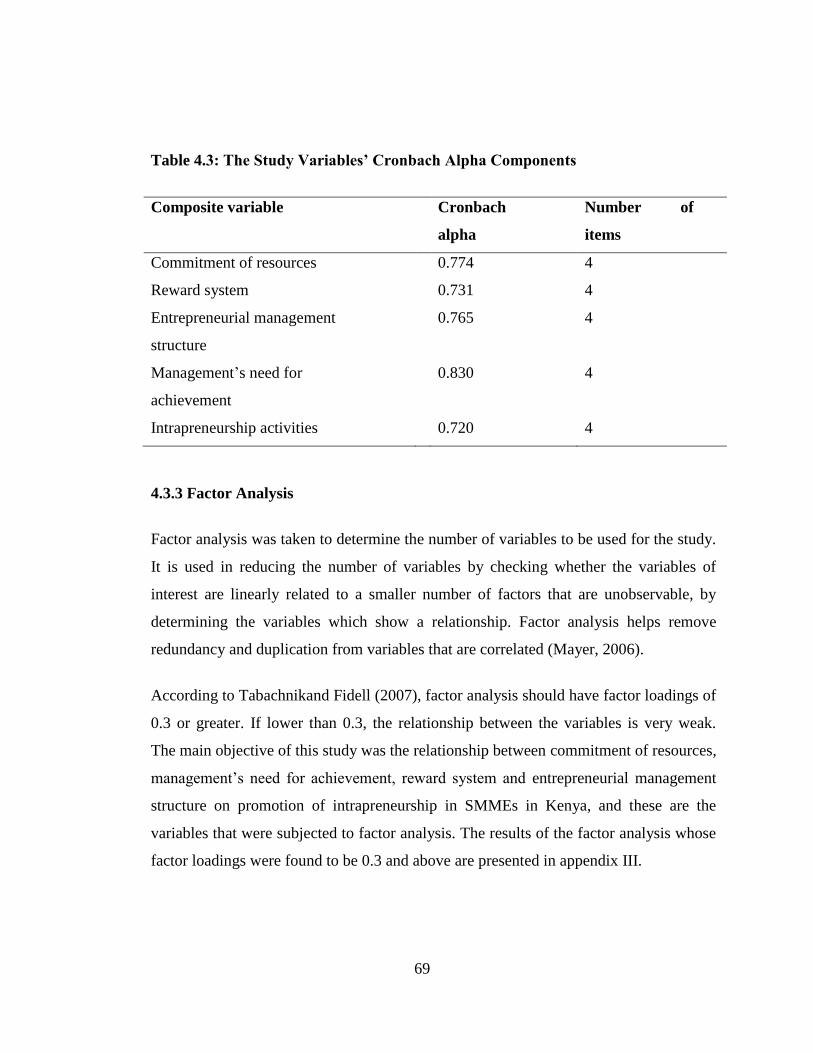
69
Table 4.3: The Study Variables’ Cronbach Alpha Components
4.3.3 Factor Analysis
Factor analysis was taken to determine the number of variables to be used for the study.
It is used in reducing the number of variables by checking whether the variables of
interest are linearly related to a smaller number of factors that are unobservable, by
determining the variables which show a relationship. Factor analysis helps remove
redundancy and duplication from variables that are correlated (Mayer, 2006).
According to Tabachnikand Fidell (2007), factor analysis should have factor loadings of
0.3 or greater. If lower than 0.3, the relationship between the variables is very weak.
The main objective of this study was the relationship between commitment of resources,
management’s need for achievement, reward system and entrepreneurial management
structure on promotion of intrapreneurship in SMMEs in Kenya, and these are the
variables that were subjected to factor analysis. The results of the factor analysis whose
factor loadings were found to be 0.3 and above are presented in appendix III.
Composite variable Cronbach
alpha
Number of
items
Commitment of resources 0.774 4
Reward system 0.731 4
Entrepreneurial management
structure
0.765 4
Management’s need for
achievement
0.830 4
Intrapreneurship activities 0.720 4
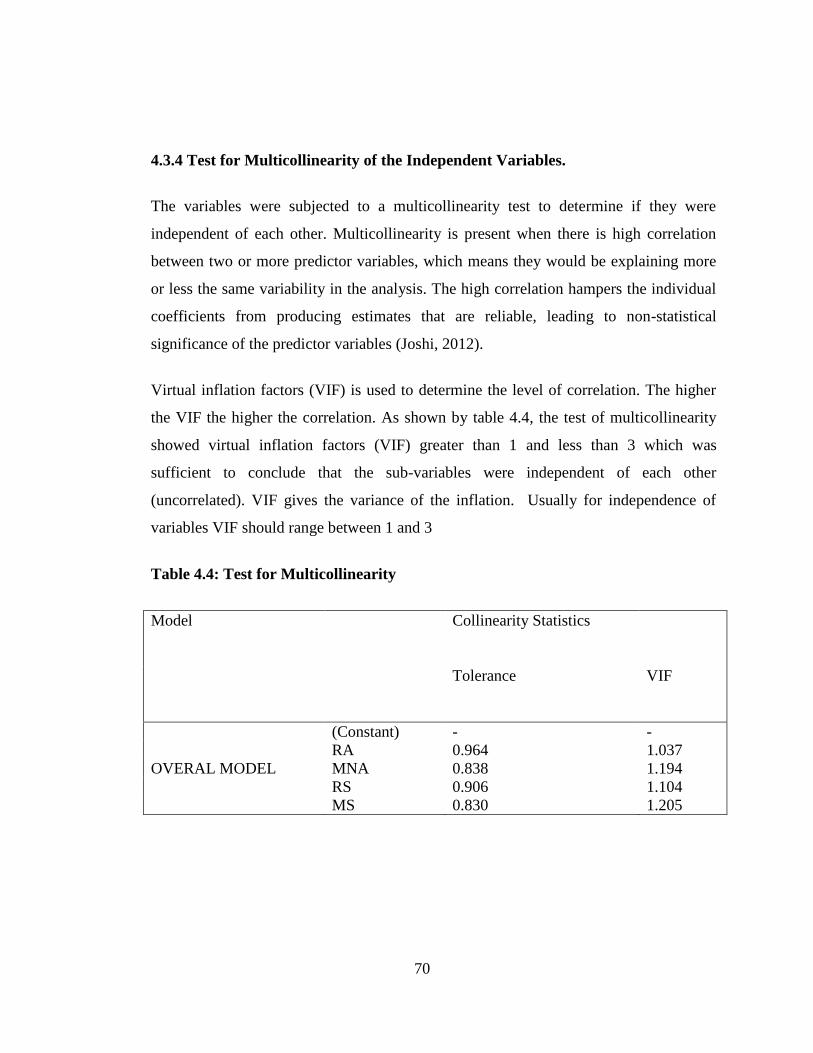
70
4.3.4 Test for Multicollinearity of the Independent Variables.
The variables were subjected to a multicollinearity test to determine if they were
independent of each other. Multicollinearity is present when there is high correlation
between two or more predictor variables, which means they would be explaining more
or less the same variability in the analysis. The high correlation hampers the individual
coefficients from producing estimates that are reliable, leading to non-statistical
significance of the predictor variables (Joshi, 2012).
Virtual inflation factors (VIF) is used to determine the level of correlation. The higher
the VIF the higher the correlation. As shown by table 4.4, the test of multicollinearity
showed virtual inflation factors (VIF) greater than 1 and less than 3 which was
sufficient to conclude that the sub-variables were independent of each other
(uncorrelated). VIF gives the variance of the inflation. Usually for independence of
variables VIF should range between 1 and 3
Table 4.4: Test for Multicollinearity
Model
Collinearity Statistics
Tolerance VIF
(Constant) - -
RA 0.964 1.037
OVERAL MODEL MNA 0.838 1.194
RS 0.906 1.104
MS 0.830 1.205
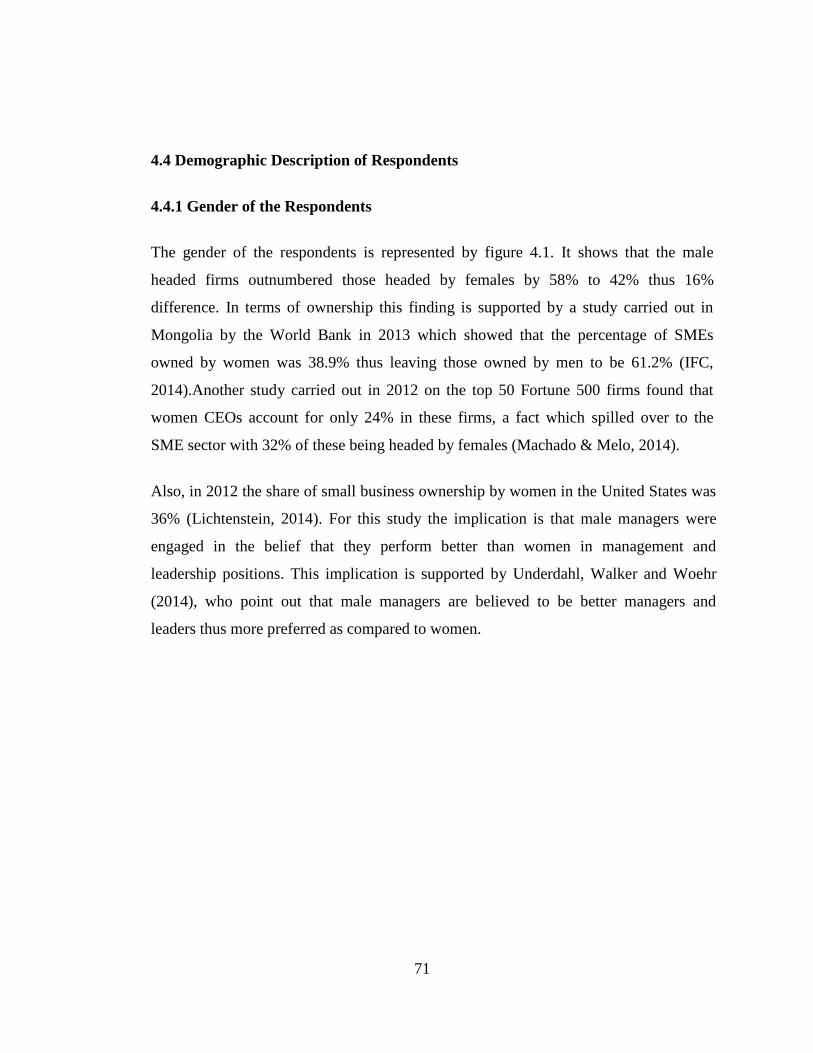
71
4.4 Demographic Description of Respondents
4.4.1 Gender of the Respondents
The gender of the respondents is represented by figure 4.1. It shows that the male
headed firms outnumbered those headed by females by 58% to 42% thus 16%
difference. In terms of ownership this finding is supported by a study carried out in
Mongolia by the World Bank in 2013 which showed that the percentage of SMEs
owned by women was 38.9% thus leaving those owned by men to be 61.2% (IFC,
2014).Another study carried out in 2012 on the top 50 Fortune 500 firms found that
women CEOs account for only 24% in these firms, a fact which spilled over to the
SME sector with 32% of these being headed by females (Machado & Melo, 2014).
Also, in 2012 the share of small business ownership by women in the United States was
36% (Lichtenstein, 2014). For this study the implication is that male managers were
engaged in the belief that they perform better than women in management and
leadership positions. This implication is supported by Underdahl, Walker and Woehr
(2014), who point out that male managers are believed to be better managers and
leaders thus more preferred as compared to women.
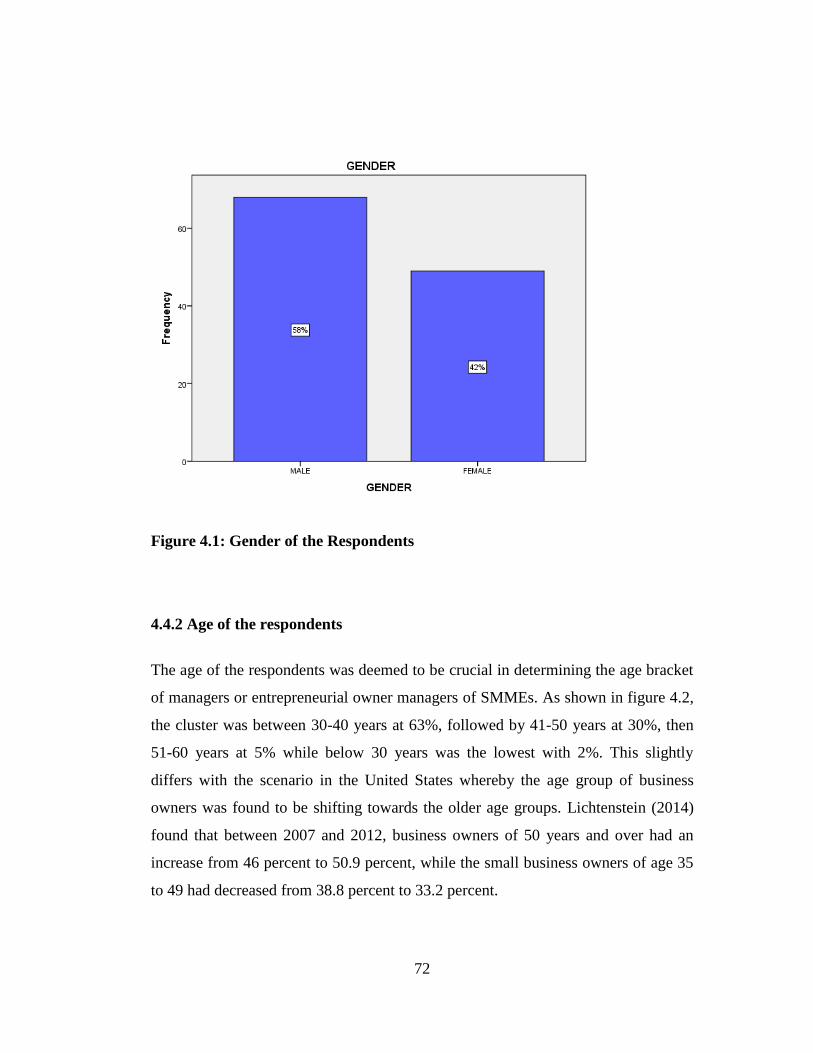
72
Figure 4.1: Gender of the Respondents
4.4.2 Age of the respondents
The age of the respondents was deemed to be crucial in determining the age bracket
of managers or entrepreneurial owner managers of SMMEs. As shown in figure 4.2,
the cluster was between 30-40 years at 63%, followed by 41-50 years at 30%, then
51-60 years at 5% while below 30 years was the lowest with 2%. This slightly
differs with the scenario in the United States whereby the age group of business
owners was found to be shifting towards the older age groups. Lichtenstein (2014)
found that between 2007 and 2012, business owners of 50 years and over had an
increase from 46 percent to 50.9 percent, while the small business owners of age 35
to 49 had decreased from 38.8 percent to 33.2 percent.
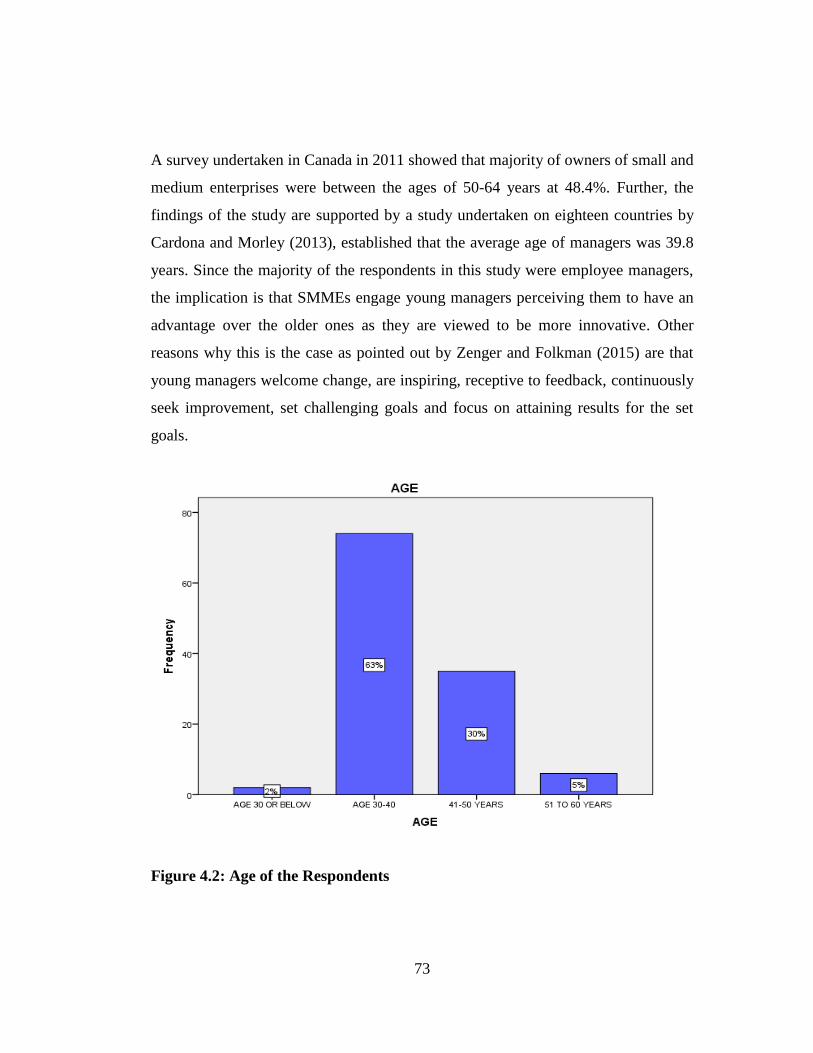
73
A survey undertaken in Canada in 2011 showed that majority of owners of small and
medium enterprises were between the ages of 50-64 years at 48.4%. Further, the
findings of the study are supported by a study undertaken on eighteen countries by
Cardona and Morley (2013), established that the average age of managers was 39.8
years. Since the majority of the respondents in this study were employee managers,
the implication is that SMMEs engage young managers perceiving them to have an
advantage over the older ones as they are viewed to be more innovative. Other
reasons why this is the case as pointed out by Zenger and Folkman (2015) are that
young managers welcome change, are inspiring, receptive to feedback, continuously
seek improvement, set challenging goals and focus on attaining results for the set
goals.
Figure 4.2: Age of the Respondents
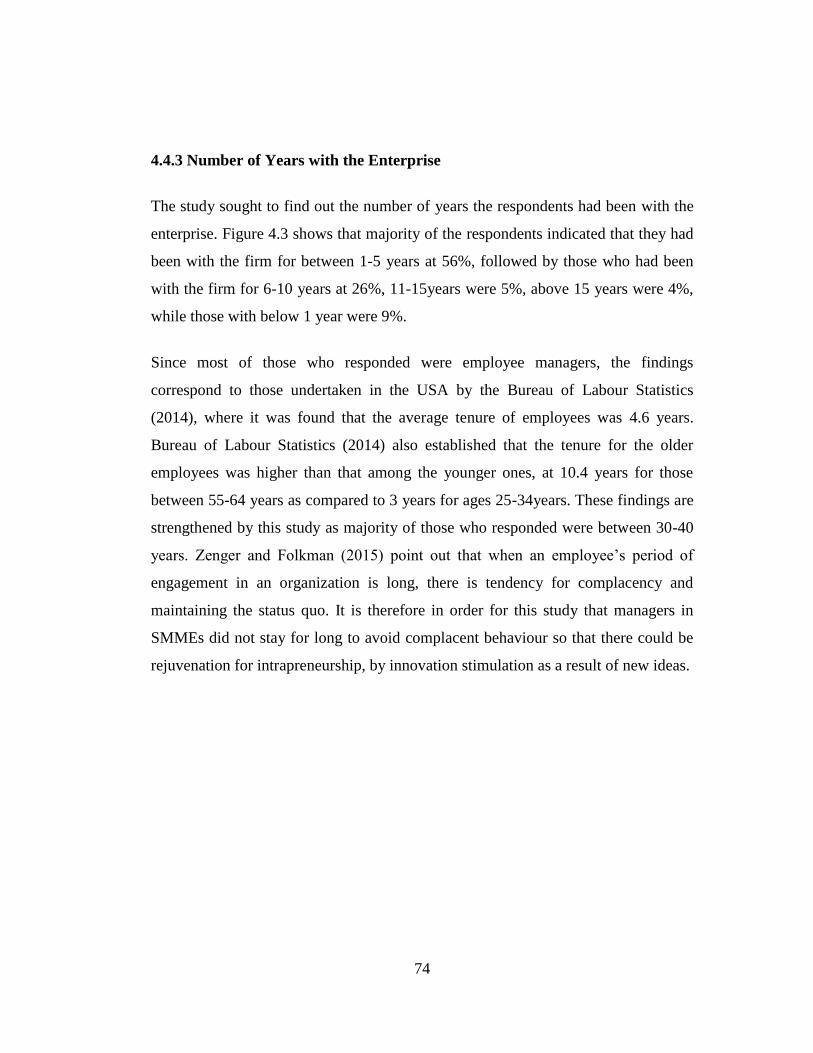
74
4.4.3 Number of Years with the Enterprise
The study sought to find out the number of years the respondents had been with the
enterprise. Figure 4.3 shows that majority of the respondents indicated that they had
been with the firm for between 1-5 years at 56%, followed by those who had been
with the firm for 6-10 years at 26%, 11-15years were 5%, above 15 years were 4%,
while those with below 1 year were 9%.
Since most of those who responded were employee managers, the findings
correspond to those undertaken in the USA by the Bureau of Labour Statistics
(2014), where it was found that the average tenure of employees was 4.6 years.
Bureau of Labour Statistics (2014) also established that the tenure for the older
employees was higher than that among the younger ones, at 10.4 years for those
between 55-64 years as compared to 3 years for ages 25-34years. These findings are
strengthened by this study as majority of those who responded were between 30-40
years. Zenger and Folkman (2015) point out that when an employee’s period of
engagement in an organization is long, there is tendency for complacency and
maintaining the status quo. It is therefore in order for this study that managers in
SMMEs did not stay for long to avoid complacent behaviour so that there could be
rejuvenation for intrapreneurship, by innovation stimulation as a result of new ideas.
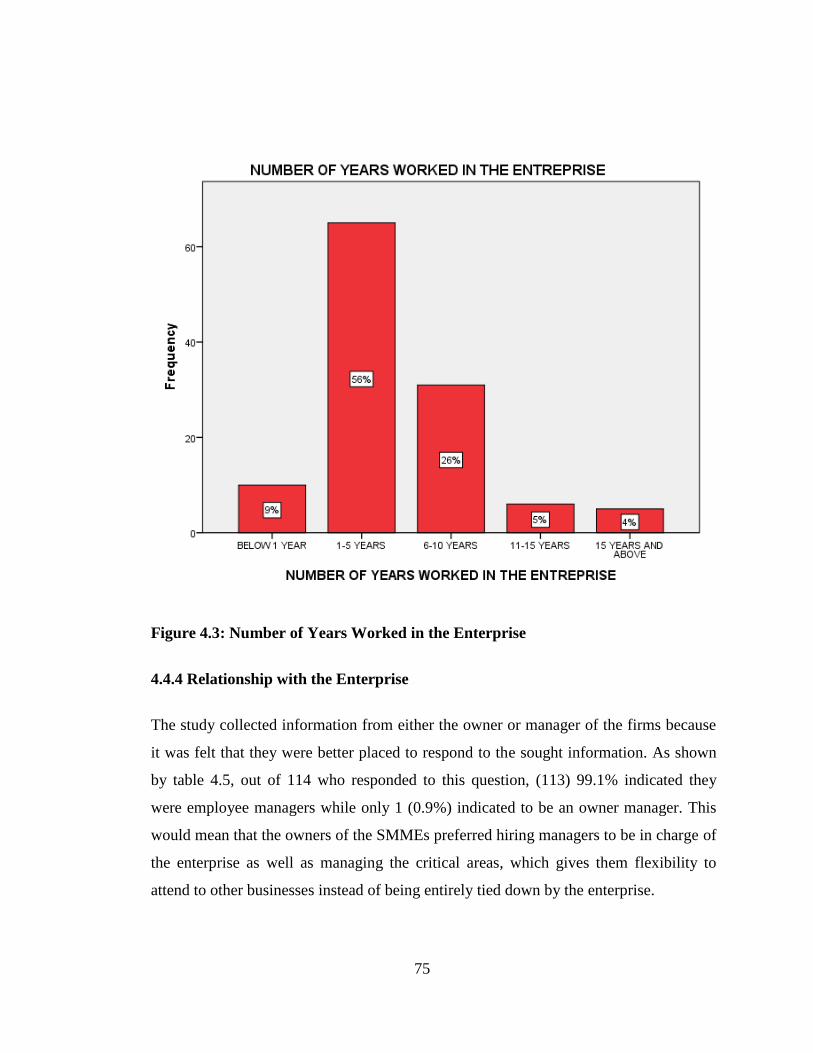
75
Figure 4.3: Number of Years Worked in the Enterprise
4.4.4 Relationship with the Enterprise
The study collected information from either the owner or manager of the firms because
it was felt that they were better placed to respond to the sought information. As shown
by table 4.5, out of 114 who responded to this question, (113) 99.1% indicated they
were employee managers while only 1 (0.9%) indicated to be an owner manager. This
would mean that the owners of the SMMEs preferred hiring managers to be in charge of
the enterprise as well as managing the critical areas, which gives them flexibility to
attend to other businesses instead of being entirely tied down by the enterprise.
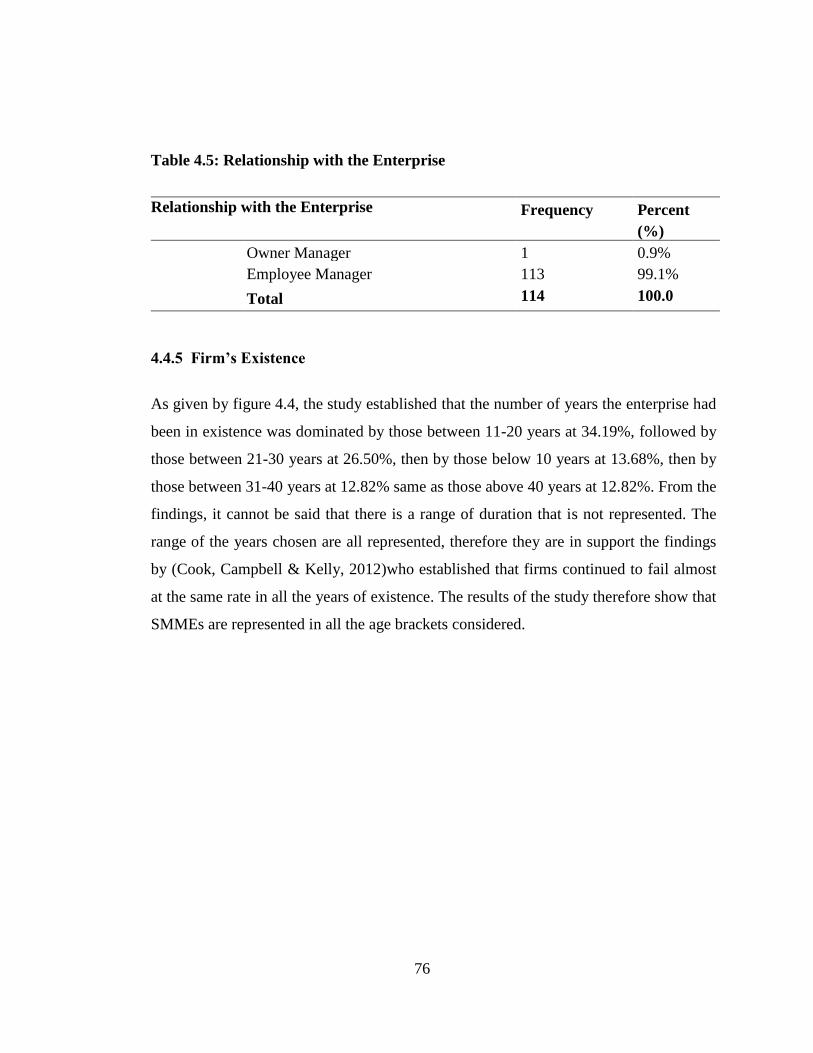
76
Table 4.5: Relationship with the Enterprise
Relationship with the Enterprise Frequency Percent
(%)
Owner Manager 1 0.9%
Employee Manager 113 99.1%
Total 114 100.0
4.4.5 Firm’s Existence
As given by figure 4.4, the study established that the number of years the enterprise had
been in existence was dominated by those between 11-20 years at 34.19%, followed by
those between 21-30 years at 26.50%, then by those below 10 years at 13.68%, then by
those between 31-40 years at 12.82% same as those above 40 years at 12.82%. From the
findings, it cannot be said that there is a range of duration that is not represented. The
range of the years chosen are all represented, therefore they are in support the findings
by (Cook, Campbell & Kelly, 2012)who established that firms continued to fail almost
at the same rate in all the years of existence. The results of the study therefore show that
SMMEs are represented in all the age brackets considered.
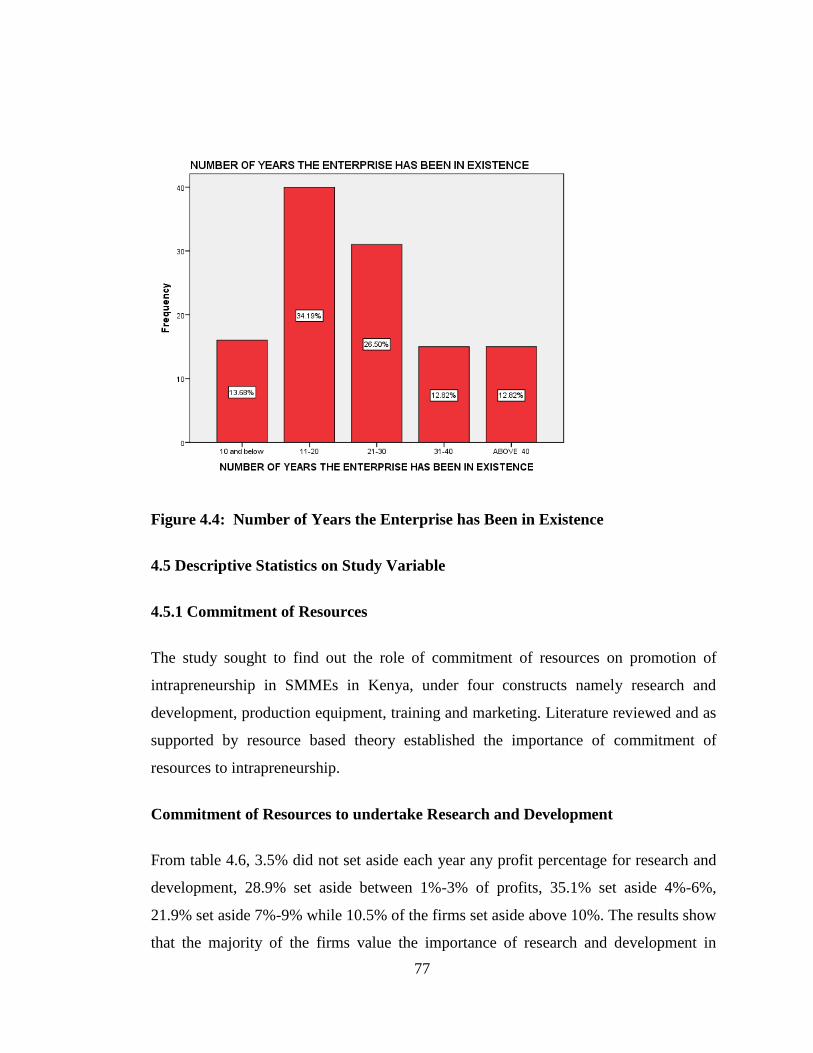
77
Figure 4.4: Number of Years the Enterprise has Been in Existence
4.5 Descriptive Statistics on Study Variable
4.5.1 Commitment of Resources
The study sought to find out the role of commitment of resources on promotion of
intrapreneurship in SMMEs in Kenya, under four constructs namely research and
development, production equipment, training and marketing. Literature reviewed and as
supported by resource based theory established the importance of commitment of
resources to intrapreneurship.
Commitment of Resources to undertake Research and Development
From table 4.6, 3.5% did not set aside each year any profit percentage for research and
development, 28.9% set aside between 1%-3% of profits, 35.1% set aside 4%-6%,
21.9% set aside 7%-9% while 10.5% of the firms set aside above 10%. The results show
that the majority of the firms value the importance of research and development in
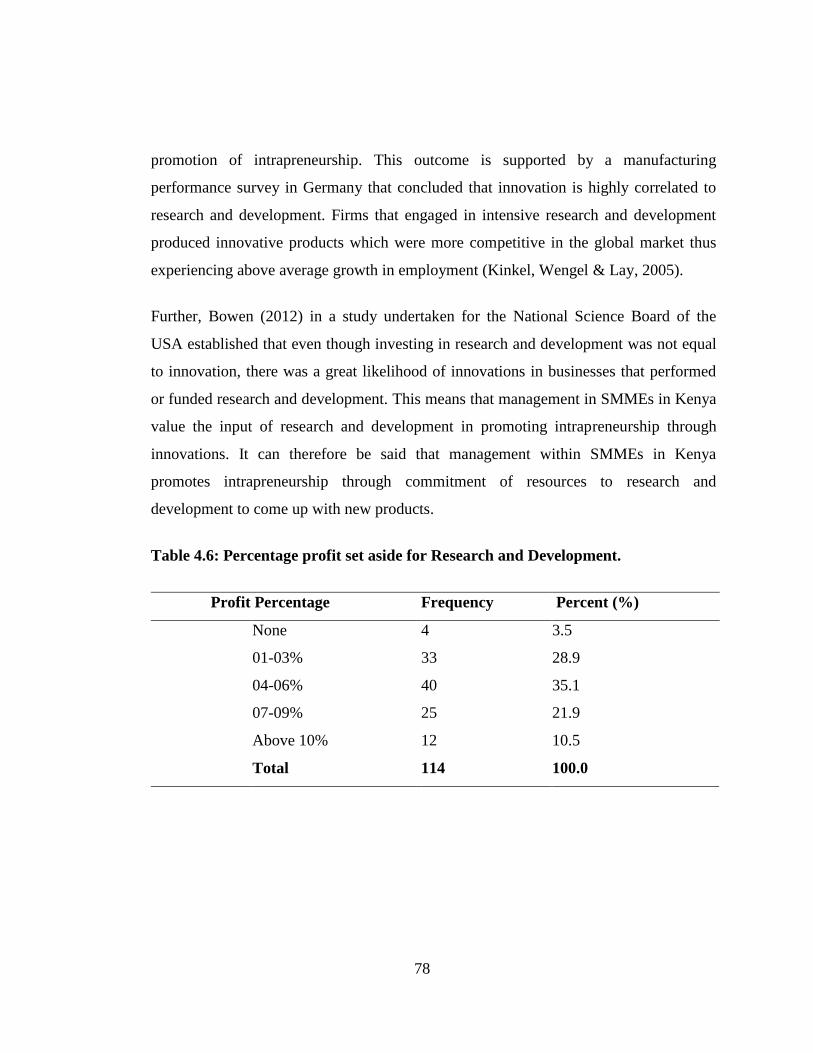
78
promotion of intrapreneurship. This outcome is supported by a manufacturing
performance survey in Germany that concluded that innovation is highly correlated to
research and development. Firms that engaged in intensive research and development
produced innovative products which were more competitive in the global market thus
experiencing above average growth in employment (Kinkel, Wengel & Lay, 2005).
Further, Bowen (2012) in a study undertaken for the National Science Board of the
USA established that even though investing in research and development was not equal
to innovation, there was a great likelihood of innovations in businesses that performed
or funded research and development. This means that management in SMMEs in Kenya
value the input of research and development in promoting intrapreneurship through
innovations. It can therefore be said that management within SMMEs in Kenya
promotes intrapreneurship through commitment of resources to research and
development to come up with new products.
Table 4.6: Percentage profit set aside for Research and Development.
Profit Percentage Frequency Percent (%)
None 4 3.5
01-03% 33 28.9
04-06% 40 35.1
07-09% 25 21.9
Above 10% 12 10.5
Total 114 100.0
79
Commitment of Resources to Upgrade Production Equipment
In checking whether firms committed resources for acquiring new production
equipment, the results presented by table 4.7 show majority of the firms provided the
resources, as 47(41.2%) were 5 years and below, 43(37.7%)between 6-10 years,
19(16.7%) between 11-15years,4(3.5%) were between 16-20 years, and only 1(0.9%)
was above 20years. This study conforms to the one undertaken by Yang (2014) who
pointed out that manufacturing firms consider production equipment as one of the assets
that are major in the production process. For this reason, there is tendency for the firms
to continually improve the equipment so as to remain competitive and attain their
production goals as they seek customer satisfaction thereby increase profits.
Other reasons for production equipment upgrade or replacement are to lower overall
cost of production, improve quality, performance delivery, develop products of high
quality that have shorter lead times. Singh and Mahmood (2015) in their study on
Malaysian manufacturing firms established that SMEs, that kept up to date process
equipment lowered their operation costs by quick and efficient production. Management
within SMMEs in Kenya therefore values the upgrade of the production equipment
which would increase productivity as well as lowering the production cost.
However, the study also established that majority of the firms at 94.02% felt that the
production equipment that they had was not sufficient for the production process. This
implies that even though resources were allocated for acquiring of new production
equipment, the resources were not enough to acquire sufficient equipment, thus
management in SMMEs would do better by ensuring that enough resources are provided
for acquiring of the sufficient equipment.

80
Table 4.7: Age of Current Production Equipment
Age Frequency Percent(%)
5 yrs and below 47 41.2
6-10 yrs 43 37.7
11-15 yrs 19 16.7
16-20 yrs 4 3.5
Above 20 yrs 1 0.9
Total 114 100.0
Commitment of Resources to Training of Employees
Table 4.8 shows that most of the firms committed resources for training of employees.
This in recognition that training enhanced the employees’ knowledge and skills thus
promoting intrapreneurship. The response was that 1(0.9%) very rarely trained their
employees, 31(27.2%) rarely trained their employees, 70(61.4%) often trained their
employees while 12(10.5%) very often trained their employees. None failed to take
their employees for training.
The statistics led to the conclusion that management in SMMEs allocated resources for
training. This outcome supports the view of Aguinis and Kraiger (2009) that employees
who were trained and their skills developed were more innovative and productive than
those who were not trained, thus the more reason why firms engage skilled employees
and continue to upgrade them. Shaheen, Naqvi & Khan (2013) established that there
was a significant relationship between employee and organizational performance. Still,
training acts as a motivator for employees since they feel knowledgeable in the areas of
operation. Out of this realization, SMMEs in Kenya therefore value training thus were
found to allocate resources to it.
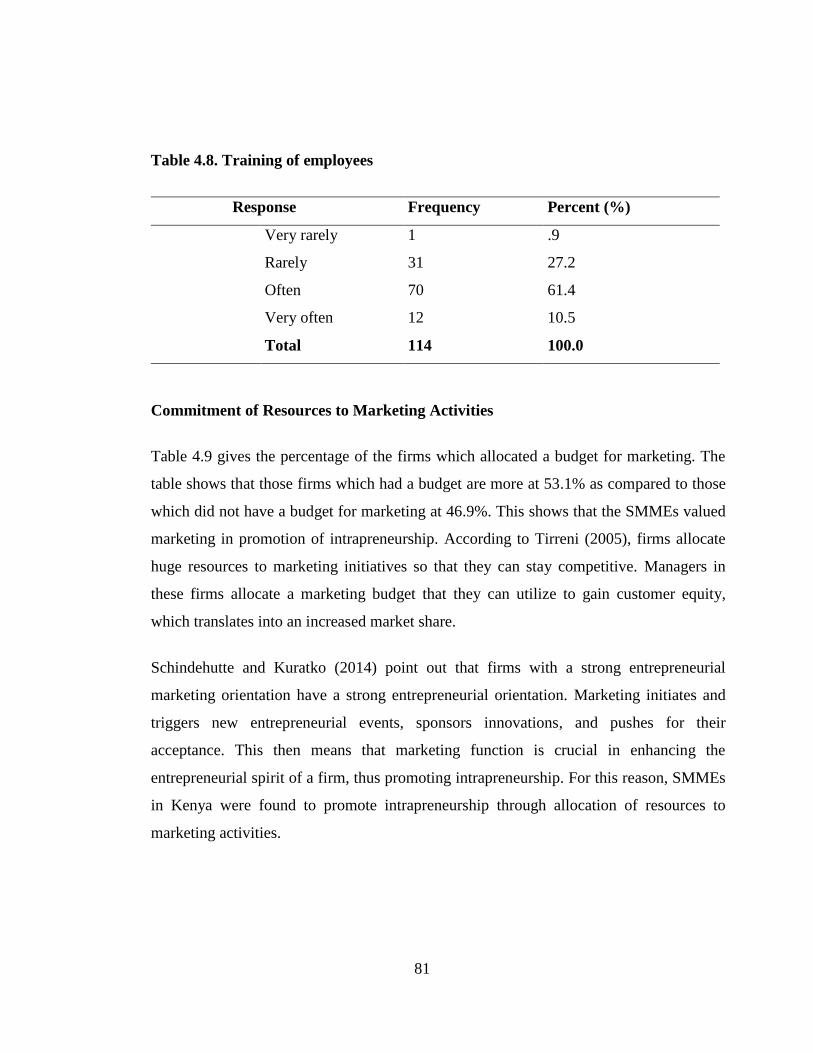
81
Table 4.8. Training of employees
Response Frequency Percent (%)
Very rarely 1 .9
Rarely 31 27.2
Often 70 61.4
Very often 12 10.5
Total 114 100.0
Commitment of Resources to Marketing Activities
Table 4.9 gives the percentage of the firms which allocated a budget for marketing. The
table shows that those firms which had a budget are more at 53.1% as compared to those
which did not have a budget for marketing at 46.9%. This shows that the SMMEs valued
marketing in promotion of intrapreneurship. According to Tirreni (2005), firms allocate
huge resources to marketing initiatives so that they can stay competitive. Managers in
these firms allocate a marketing budget that they can utilize to gain customer equity,
which translates into an increased market share.
Schindehutte and Kuratko (2014) point out that firms with a strong entrepreneurial
marketing orientation have a strong entrepreneurial orientation. Marketing initiates and
triggers new entrepreneurial events, sponsors innovations, and pushes for their
acceptance. This then means that marketing function is crucial in enhancing the
entrepreneurial spirit of a firm, thus promoting intrapreneurship. For this reason, SMMEs
in Kenya were found to promote intrapreneurship through allocation of resources to
marketing activities.

82
Table 4.9: Budget for Marketing
Response Frequency Percent(%)
Yes 61 53.1
No 53 46.9
Total 114 100.0
4.5.2 Management’s Need for Achievement
The study sought to establish the role of management’s need for achievement on the
promotion of intrapreneurship. This was done under four constructs namely setting goals,
opportunity seeking, feedback for improvement and risk taking propensity.
Setting of Goals by Management
Entrepreneurs who have a high need for achievement set goals. Achievement motivation
is a desire to achieve targets and this pushes those individuals with a high need for
achievement to set achievable goals. The tables 4.10 and 4.11show that management in
SMMEs had clear goals to achieve thus implying that goal setting supports
intrapreneurship in SMMEs.
The two tables show targets were put in place in terms of increase in profits and market
share. Wu, Matthews and Dagher (2007) in the study on prospective entrepreneurs in
USA propose that entrepreneurs should set goals that are in alignment with their need for
achievement. Those with high need for achievement set up moderate, realistic and
achievable goals which act as a motivation rather than a discouragement.
As can be seen from table 4.10, majority of the respondents had set profit targets at an
increase of 1-25% in the considered years of 2011 to 2015. This was followed by those
who set their profit increase goals at 26%-50%. Those who set their profit increase goals
at 51%-75%, were the third, the fourth were those who did not set any profit increase
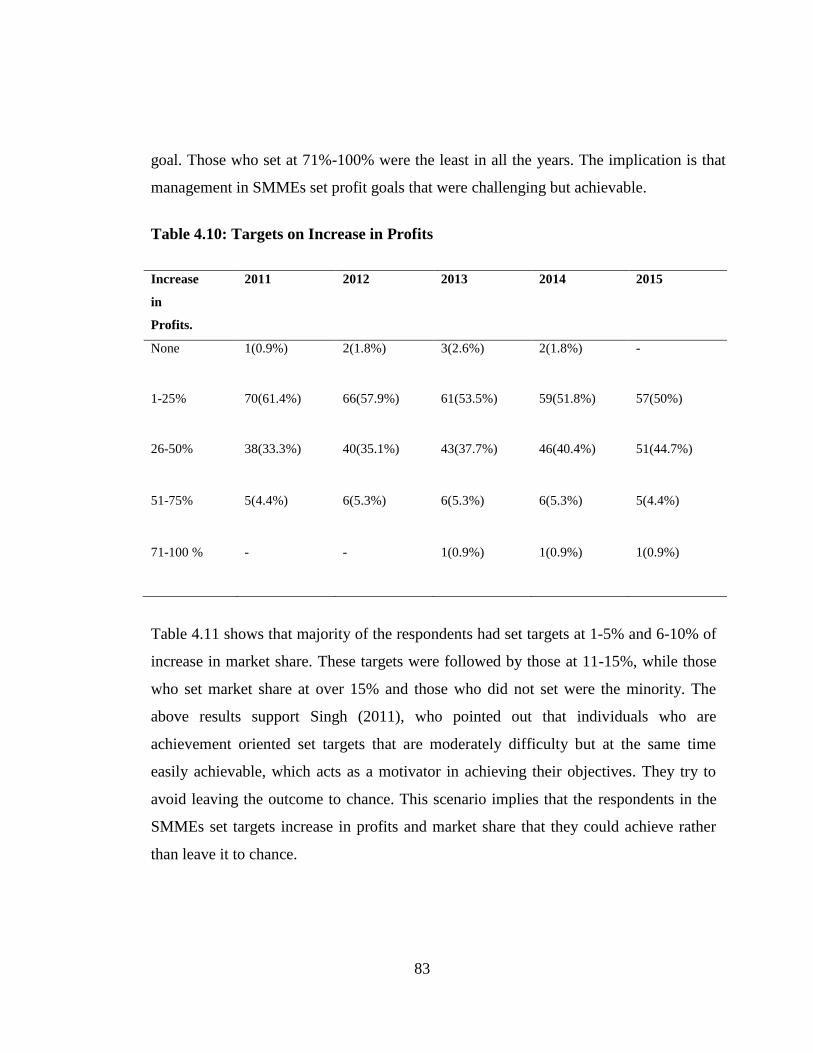
83
goal. Those who set at 71%-100% were the least in all the years. The implication is that
management in SMMEs set profit goals that were challenging but achievable.
Table 4.10: Targets on Increase in Profits
Increase
in
Profits.
2011 2012 2013 2014 2015
None 1(0.9%) 2(1.8%) 3(2.6%) 2(1.8%) -
1-25% 70(61.4%) 66(57.9%) 61(53.5%) 59(51.8%) 57(50%)
26-50% 38(33.3%) 40(35.1%) 43(37.7%) 46(40.4%) 51(44.7%)
51-75% 5(4.4%) 6(5.3%) 6(5.3%) 6(5.3%) 5(4.4%)
71-100 % - - 1(0.9%) 1(0.9%) 1(0.9%)
Table 4.11 shows that majority of the respondents had set targets at 1-5% and 6-10% of
increase in market share. These targets were followed by those at 11-15%, while those
who set market share at over 15% and those who did not set were the minority. The
above results support Singh (2011), who pointed out that individuals who are
achievement oriented set targets that are moderately difficulty but at the same time
easily achievable, which acts as a motivator in achieving their objectives. They try to
avoid leaving the outcome to chance. This scenario implies that the respondents in the
SMMEs set targets increase in profits and market share that they could achieve rather
than leave it to chance.

84
Table 4.11: Targets on Increase in Market Share
Market
Share
2011 2012 2013 2014 2015
None 3 (2.6%) 1(0.9%) 1(0.9%) - -
1-5% 51(44.7%) 48(42.1%) 46(40.4%) 44(38.6%) 46(40.4%)
6-10% 53(46.5%) 57(50%) 58(50.9%) 61(53.5%) 57(50%)
11-15% 7(6.1%) 8(7%) 8(7.0%) 7(6.1%) 9(7.9%)
Over
15%
- - 1(0.9%) 2(1.8%) 2(1.8%)
Opportunity Seeking by Management
The study sought to know whether the mangers/entrepreneur owners were drawn to new
opportunities by looking at the number of opportunities that they had exploited within a
range of five years. As shown by figure 4.5 majority indicated that they had exploited
four and above new opportunities at 63%, 26% exploited three, 20% exploited two
opportunities while only 1% exploited one opportunity.
According to Zhao (2006) entrepreneurs are opportunity seekers and being innovative
provides them with an instrument for success, therefore the results of this study support
this. Further Botha and Nyanjom (2011) point out that opportunity seeking and
recognition is the core aspect of intrapreneurship and resources should be allocated to
pursuance of opportunities if a business has to thrive. Management within SMMEs in
Kenya support these scholars views as results show that they seek opportunities thus
promoting intrapreneurship.
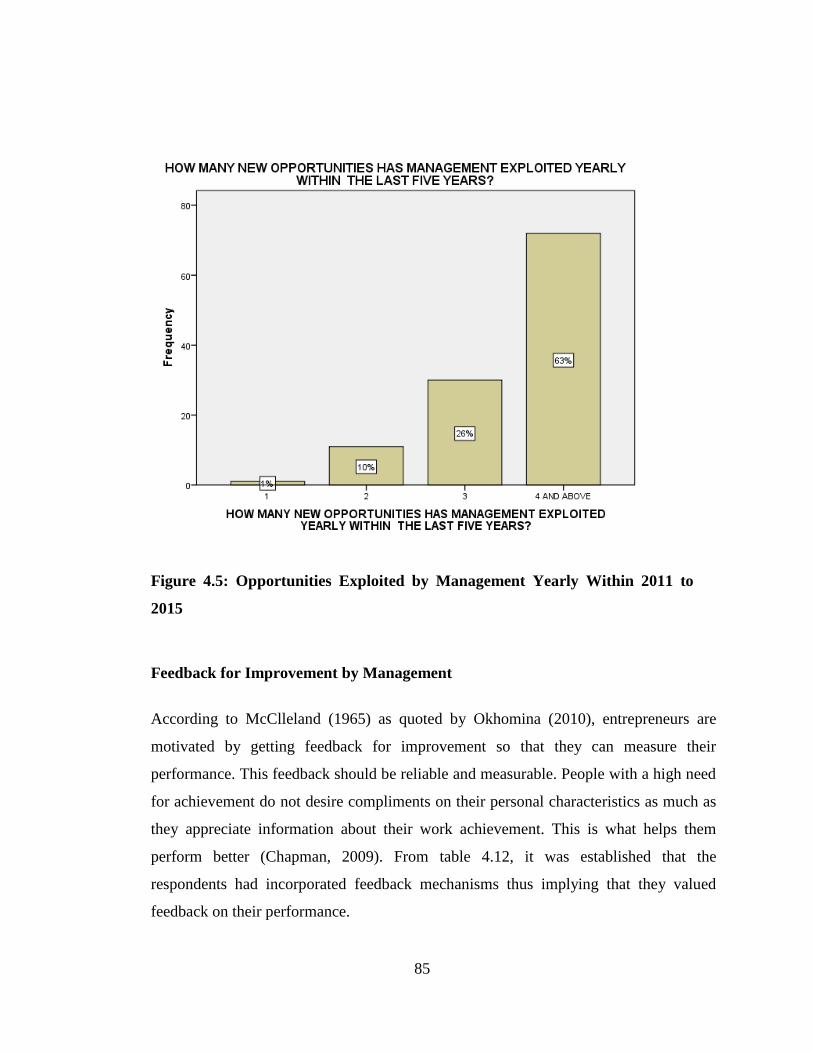
85
Figure 4.5: Opportunities Exploited by Management Yearly Within 2011 to
2015
Feedback for Improvement by Management
According to McClleland (1965) as quoted by Okhomina (2010), entrepreneurs are
motivated by getting feedback for improvement so that they can measure their
performance. This feedback should be reliable and measurable. People with a high need
for achievement do not desire compliments on their personal characteristics as much as
they appreciate information about their work achievement. This is what helps them
perform better (Chapman, 2009). From table 4.12, it was established that the
respondents had incorporated feedback mechanisms thus implying that they valued
feedback on their performance.
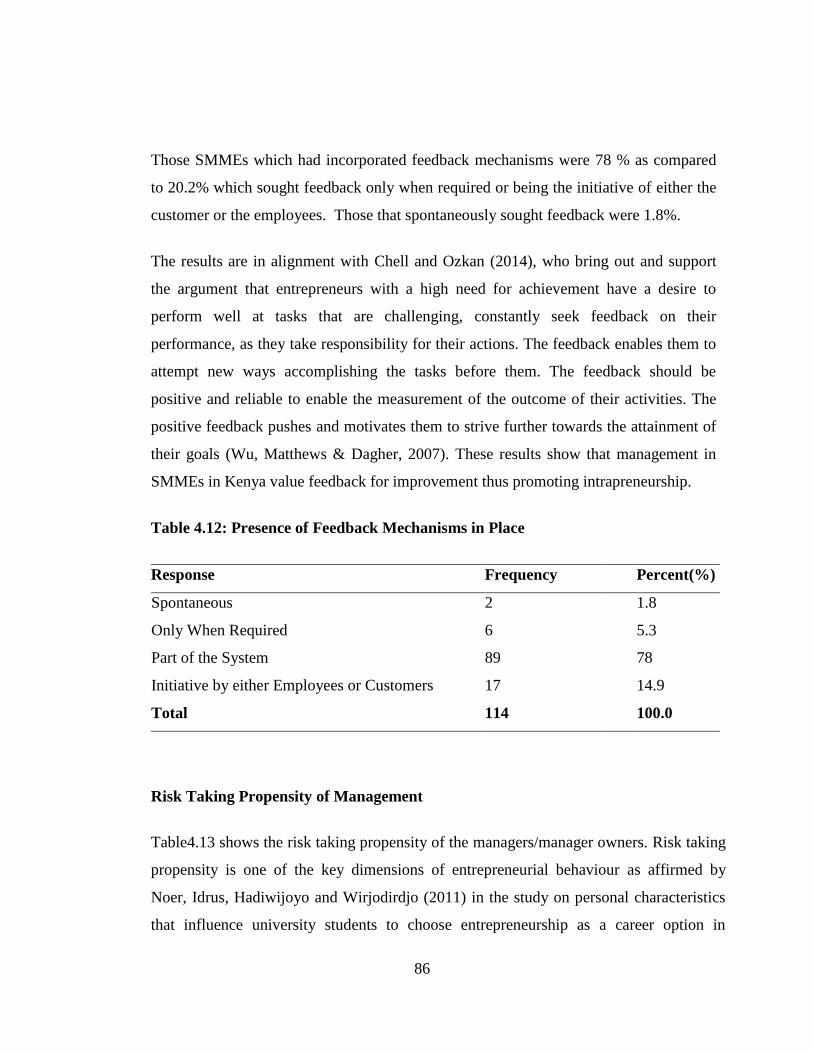
86
Those SMMEs which had incorporated feedback mechanisms were 78 % as compared
to 20.2% which sought feedback only when required or being the initiative of either the
customer or the employees. Those that spontaneously sought feedback were 1.8%.
The results are in alignment with Chell and Ozkan (2014), who bring out and support
the argument that entrepreneurs with a high need for achievement have a desire to
perform well at tasks that are challenging, constantly seek feedback on their
performance, as they take responsibility for their actions. The feedback enables them to
attempt new ways accomplishing the tasks before them. The feedback should be
positive and reliable to enable the measurement of the outcome of their activities. The
positive feedback pushes and motivates them to strive further towards the attainment of
their goals (Wu, Matthews & Dagher, 2007). These results show that management in
SMMEs in Kenya value feedback for improvement thus promoting intrapreneurship.
Table 4.12: Presence of Feedback Mechanisms in Place
Response Frequency Percent(%)
Spontaneous 2 1.8
Only When Required 6 5.3
Part of the System 89 78
Initiative by either Employees or Customers 17 14.9
Total 114 100.0
Risk Taking Propensity of Management
Table4.13 shows the risk taking propensity of the managers/manager owners. Risk taking
propensity is one of the key dimensions of entrepreneurial behaviour as affirmed by
Noer, Idrus, Hadiwijoyo and Wirjodirdjo (2011) in the study on personal characteristics
that influence university students to choose entrepreneurship as a career option in
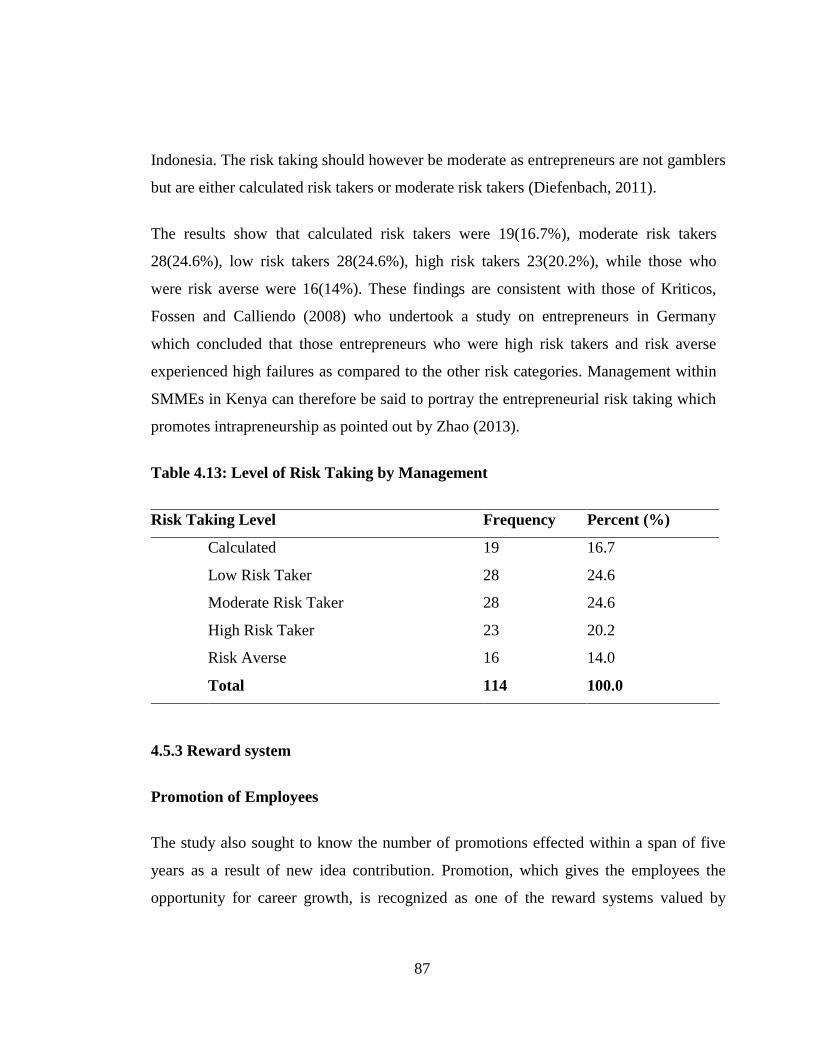
87
Indonesia. The risk taking should however be moderate as entrepreneurs are not gamblers
but are either calculated risk takers or moderate risk takers (Diefenbach, 2011).
The results show that calculated risk takers were 19(16.7%), moderate risk takers
28(24.6%), low risk takers 28(24.6%), high risk takers 23(20.2%), while those who
were risk averse were 16(14%). These findings are consistent with those of Kriticos,
Fossen and Calliendo (2008) who undertook a study on entrepreneurs in Germany
which concluded that those entrepreneurs who were high risk takers and risk averse
experienced high failures as compared to the other risk categories. Management within
SMMEs in Kenya can therefore be said to portray the entrepreneurial risk taking which
promotes intrapreneurship as pointed out by Zhao (2013).
Table 4.13: Level of Risk Taking by Management
Risk Taking Level Frequency Percent (%)
Calculated 19 16.7
Low Risk Taker 28 24.6
Moderate Risk Taker 28 24.6
High Risk Taker 23 20.2
Risk Averse 16 14.0
Total 114 100.0
4.5.3 Reward system
Promotion of Employees
The study also sought to know the number of promotions effected within a span of five
years as a result of new idea contribution. Promotion, which gives the employees the
opportunity for career growth, is recognized as one of the reward systems valued by
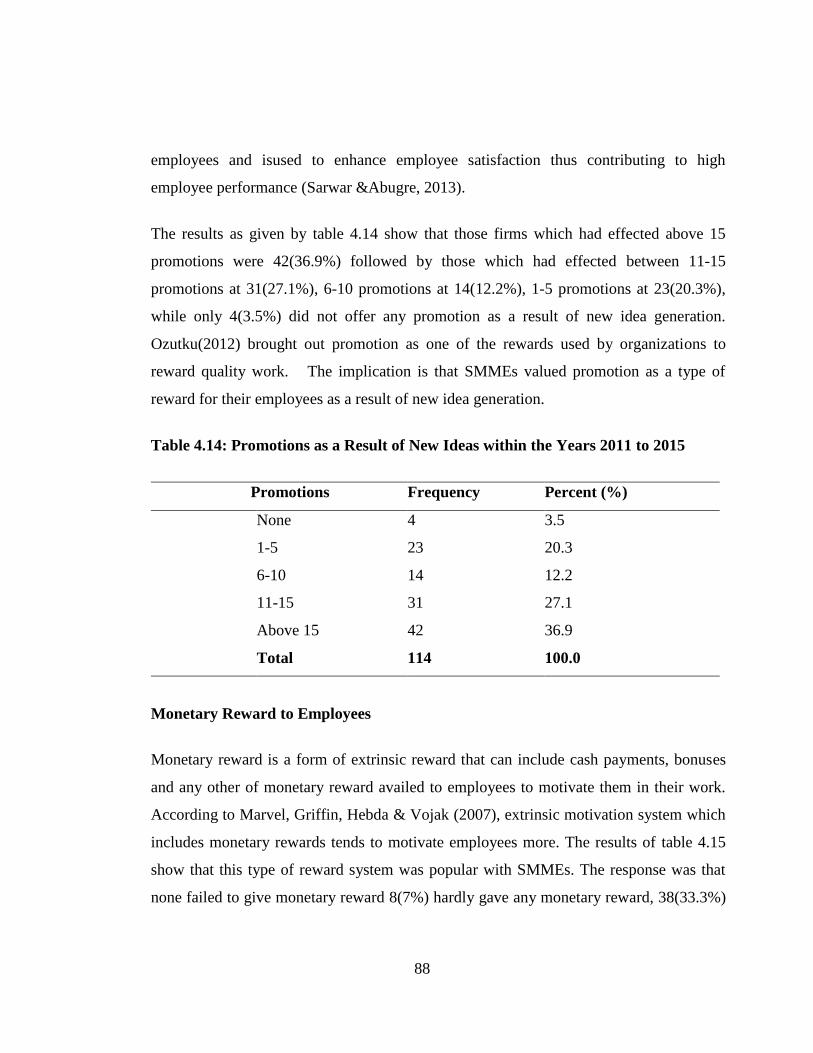
88
employees and isused to enhance employee satisfaction thus contributing to high
employee performance (Sarwar &Abugre, 2013).
The results as given by table 4.14 show that those firms which had effected above 15
promotions were 42(36.9%) followed by those which had effected between 11-15
promotions at 31(27.1%), 6-10 promotions at 14(12.2%), 1-5 promotions at 23(20.3%),
while only 4(3.5%) did not offer any promotion as a result of new idea generation.
Ozutku(2012) brought out promotion as one of the rewards used by organizations to
reward quality work. The implication is that SMMEs valued promotion as a type of
reward for their employees as a result of new idea generation.
Table 4.14: Promotions as a Result of New Ideas within the Years 2011 to 2015
Promotions Frequency Percent (%)
None 4 3.5
1-5 23 20.3
6-10 14 12.2
11-15 31 27.1
Above 15 42 36.9
Total 114 100.0
Monetary Reward to Employees
Monetary reward is a form of extrinsic reward that can include cash payments, bonuses
and any other of monetary reward availed to employees to motivate them in their work.
According to Marvel, Griffin, Hebda & Vojak (2007), extrinsic motivation system which
includes monetary rewards tends to motivate employees more. The results of table 4.15
show that this type of reward system was popular with SMMEs. The response was that
none failed to give monetary reward 8(7%) hardly gave any monetary reward, 38(33.3%)

89
often gave monetary reward, 56(49.1%) very often gave monetary reward while
12(10.5%) considered the reward to be part of the employees’ work therefore not given.
The results are in agreement with those of Sarwar and Abugre (2013) who found that
monetary reward was rated highly when looking at the factors that were considered as
an encouragement to employees within the service sector in Ghana. Management in
SMMEs in Kenya can therefore be said to value monetary reward as one of the rewards
to motivate employees to be entrepreneurial, which promotes intrapreneurship.
Table 4.15: Monetary Reward for New Idea Contribution
Monetary Reward Frequency Percent
(%)
None - -
Hardly 8 7.0
Often 38 33.3
Very Often 56 49.1
Considered as Part of Employees Work 12 10.5
Total 114 100.0
Shareholding Given to Employees
In seeking to find out if the firm gave shareholding to employees in recognition of new
ideas, the study established some firms used shareholding as a reward mechanism. Those
firms which gave no shareholding were 41(35.9%), followed by those firms that gave
three shareholdings were 37(32.5%), followed by those which gave two shareholdings at
13(11.8%), and those who gave above three at 13(11.8%) and the last being those who
gave one shareholding at 10(8.8%).
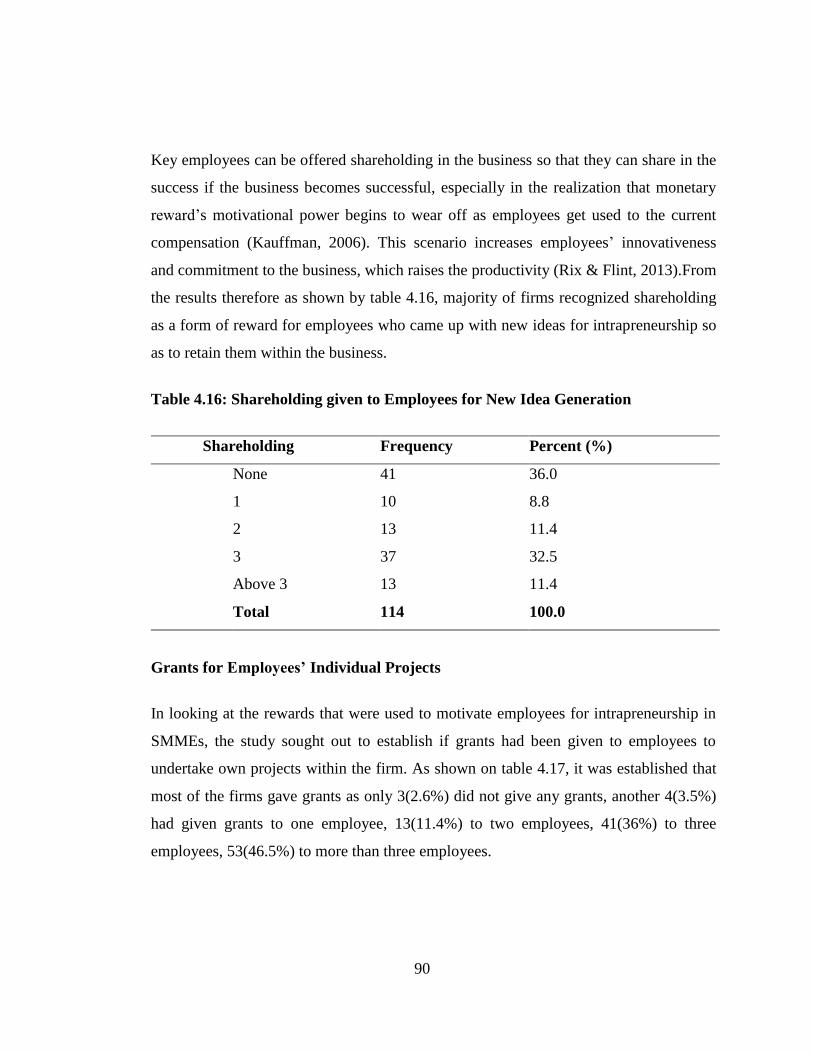
90
Key employees can be offered shareholding in the business so that they can share in the
success if the business becomes successful, especially in the realization that monetary
reward’s motivational power begins to wear off as employees get used to the current
compensation (Kauffman, 2006). This scenario increases employees’ innovativeness
and commitment to the business, which raises the productivity (Rix & Flint, 2013).From
the results therefore as shown by table 4.16, majority of firms recognized shareholding
as a form of reward for employees who came up with new ideas for intrapreneurship so
as to retain them within the business.
Table 4.16: Shareholding given to Employees for New Idea Generation
Shareholding Frequency Percent (%)
None 41 36.0
1 10 8.8
2 13 11.4
3 37 32.5
Above 3 13 11.4
Total 114 100.0
Grants for Employees’ Individual Projects
In looking at the rewards that were used to motivate employees for intrapreneurship in
SMMEs, the study sought out to establish if grants had been given to employees to
undertake own projects within the firm. As shown on table 4.17, it was established that
most of the firms gave grants as only 3(2.6%) did not give any grants, another 4(3.5%)
had given grants to one employee, 13(11.4%) to two employees, 41(36%) to three
employees, 53(46.5%) to more than three employees.
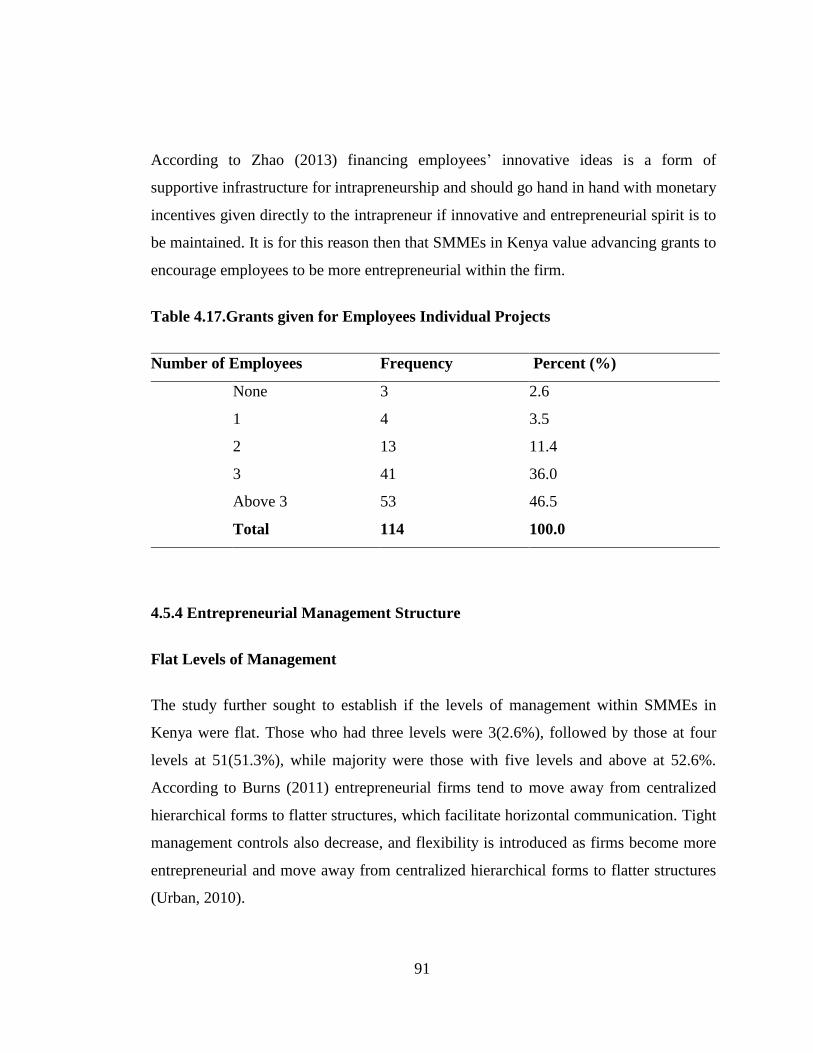
91
According to Zhao (2013) financing employees’ innovative ideas is a form of
supportive infrastructure for intrapreneurship and should go hand in hand with monetary
incentives given directly to the intrapreneur if innovative and entrepreneurial spirit is to
be maintained. It is for this reason then that SMMEs in Kenya value advancing grants to
encourage employees to be more entrepreneurial within the firm.
Table 4.17.Grants given for Employees Individual Projects
Number of Employees Frequency Percent (%)
None 3 2.6
1 4 3.5
2 13 11.4
3 41 36.0
Above 3 53 46.5
Total 114 100.0
4.5.4 Entrepreneurial Management Structure
Flat Levels of Management
The study further sought to establish if the levels of management within SMMEs in
Kenya were flat. Those who had three levels were 3(2.6%), followed by those at four
levels at 51(51.3%), while majority were those with five levels and above at 52.6%.
According to Burns (2011) entrepreneurial firms tend to move away from centralized
hierarchical forms to flatter structures, which facilitate horizontal communication. Tight
management controls also decrease, and flexibility is introduced as firms become more
entrepreneurial and move away from centralized hierarchical forms to flatter structures
(Urban, 2010).

92
Shoghi and Safiepoor (2013) in their study on metal industries in Iran found that the
complexity of the levels affected the entrepreneurial orientation of employees. The
preference was flatter, organic and non complex structures which increase
innovativeness in an organization. Reading from the results of the study on table 4.18, it
can be implied that management in SMMEs is neutral as concerns levels of
management as the structure is neither flat nor is it high. The majority however
indicated lower levels than five and above. Management in SMMEs in Kenya should
therefore strive for clear flatter structures that promote intrapreneurship.
Table 4.18: Levels of Management.
Management Levels Frequency Percent (%)
3 3 2.6
4 51 44.7
5& Above 60 52.6
Total 114 100.0
Open Communication Channels in Management
Further the study sought to determine whether management openly communicates with
the employees. Finch, Hansen and Alexander (2010) point out that when employees are
consulted regularly, listened to and action taken upon their suggestions, they feel
appreciated and are more effective as they perform to a higher standard. On the other
hand, horizontal communication is important for firms to remain entrepreneurial as
posited by Burns (2010). The study reinforces these views as table 4.19 shows that
employees are often consulted by management in SMMEs in Kenya as70(61.4%) often
get direct information from their employees, 37(32.5%) very often got direct
information from their employees, while only 7(6.1%) indicated that they rarely got
direct information from their employees.

93
Yan and Josef (2011) in their study in China on the role that communication plays in
enhancing employees’ organizational commitment, concluded that where there was
abundant both upward and downward communication, employees were able to receive
information and feedback from management therefore improving their performance. At
the same time they were able to give feedback and suggestions to management which
improved the organizational performance. Management in SMMEs in Kenya can be
said to have put in place mechanisms to engage employees in direct communication
which is good for intrapreneurship.
Table 4.19: How often Management gets Direct Information from Lower Levels
Of Management
Direct Information Frequency Percent (%)
Rarely 7 6.1
Often 70 61.4
Very Often 37 32.5
Total 114 100.0
Flexible Management Structure
The study sought to know how flexibility in management plays a role in
intrapreneurship in SMMEs. Entrepreneurial firms put in place structures that are
supportive and flexible to enable employees manage their own work and solve problems
(Srivastava & Agrawal, 2010). From tables 4.20 and 4.21, it can be seen that there is no
flexible management in SMMEs as employees actions are guided by the control
measures put in place.
The results in table 4.20 on the expectation of employees to await managements
direction before taking any action, 15(13.2%) were neutral, 72(63.2%) agreed while
27(23.7% strongly agreed. These results continue to support the views by Markovska
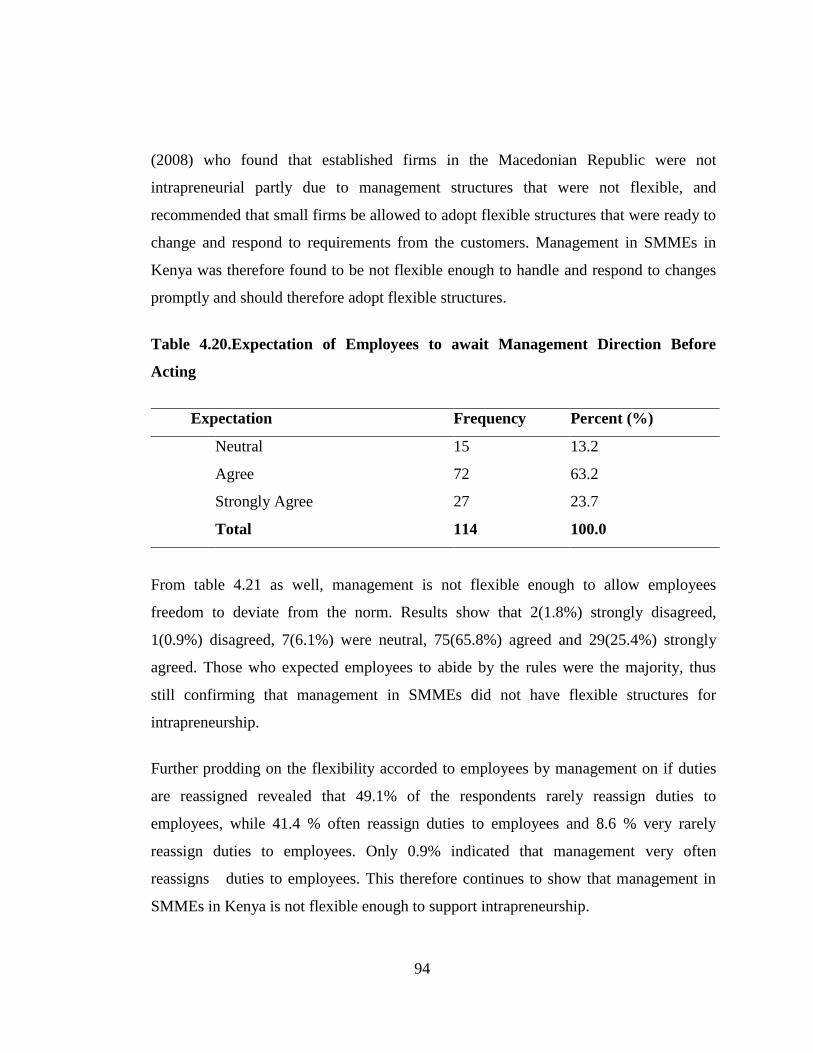
94
(2008) who found that established firms in the Macedonian Republic were not
intrapreneurial partly due to management structures that were not flexible, and
recommended that small firms be allowed to adopt flexible structures that were ready to
change and respond to requirements from the customers. Management in SMMEs in
Kenya was therefore found to be not flexible enough to handle and respond to changes
promptly and should therefore adopt flexible structures.
Table 4.20.Expectation of Employees to await Management Direction Before
Acting
Expectation Frequency Percent (%)
Neutral 15 13.2
Agree 72 63.2
Strongly Agree 27 23.7
Total 114 100.0
From table 4.21 as well, management is not flexible enough to allow employees
freedom to deviate from the norm. Results show that 2(1.8%) strongly disagreed,
1(0.9%) disagreed, 7(6.1%) were neutral, 75(65.8%) agreed and 29(25.4%) strongly
agreed. Those who expected employees to abide by the rules were the majority, thus
still confirming that management in SMMEs did not have flexible structures for
intrapreneurship.
Further prodding on the flexibility accorded to employees by management on if duties
are reassigned revealed that 49.1% of the respondents rarely reassign duties to
employees, while 41.4 % often reassign duties to employees and 8.6 % very rarely
reassign duties to employees. Only 0.9% indicated that management very often
reassigns duties to employees. This therefore continues to show that management in
SMMEs in Kenya is not flexible enough to support intrapreneurship.
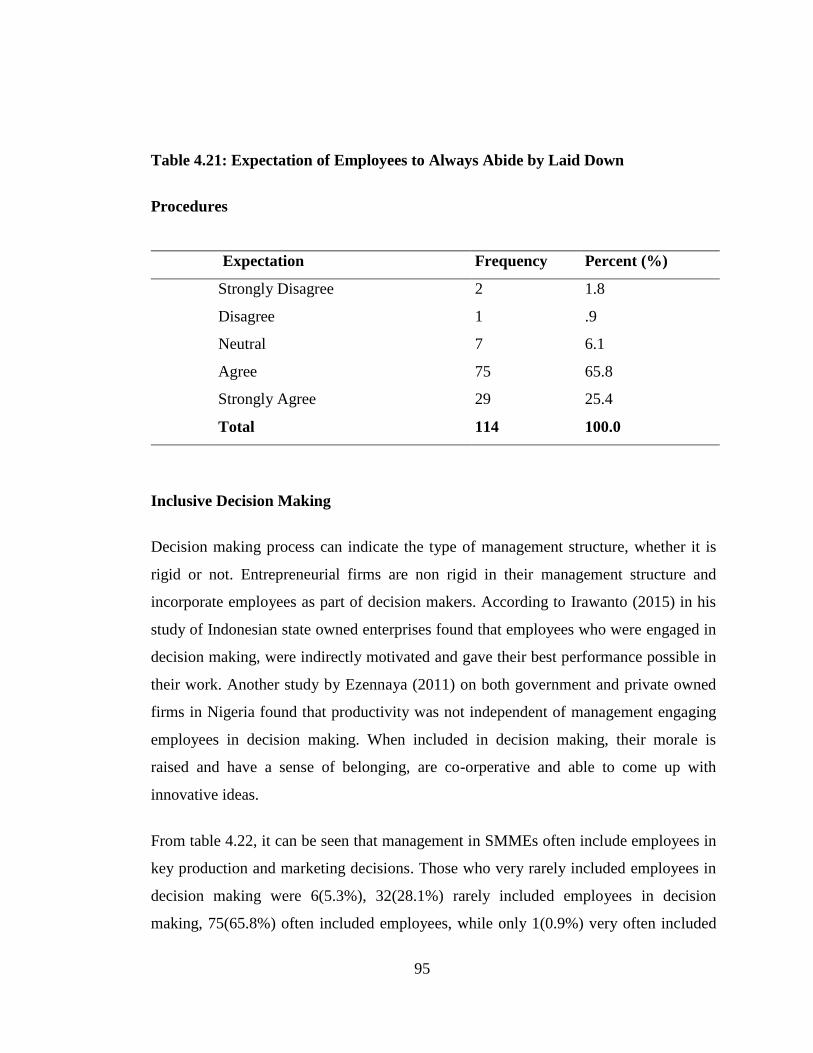
95
Table 4.21: Expectation of Employees to Always Abide by Laid Down
Procedures
Inclusive Decision Making
Decision making process can indicate the type of management structure, whether it is
rigid or not. Entrepreneurial firms are non rigid in their management structure and
incorporate employees as part of decision makers. According to Irawanto (2015) in his
study of Indonesian state owned enterprises found that employees who were engaged in
decision making, were indirectly motivated and gave their best performance possible in
their work. Another study by Ezennaya (2011) on both government and private owned
firms in Nigeria found that productivity was not independent of management engaging
employees in decision making. When included in decision making, their morale is
raised and have a sense of belonging, are co-orperative and able to come up with
innovative ideas.
From table 4.22, it can be seen that management in SMMEs often include employees in
key production and marketing decisions. Those who very rarely included employees in
decision making were 6(5.3%), 32(28.1%) rarely included employees in decision
making, 75(65.8%) often included employees, while only 1(0.9%) very often included
Expectation Frequency Percent (%)
Strongly Disagree 2 1.8
Disagree 1 .9
Neutral 7 6.1
Agree 75 65.8
Strongly Agree 29 25.4
Total 114 100.0
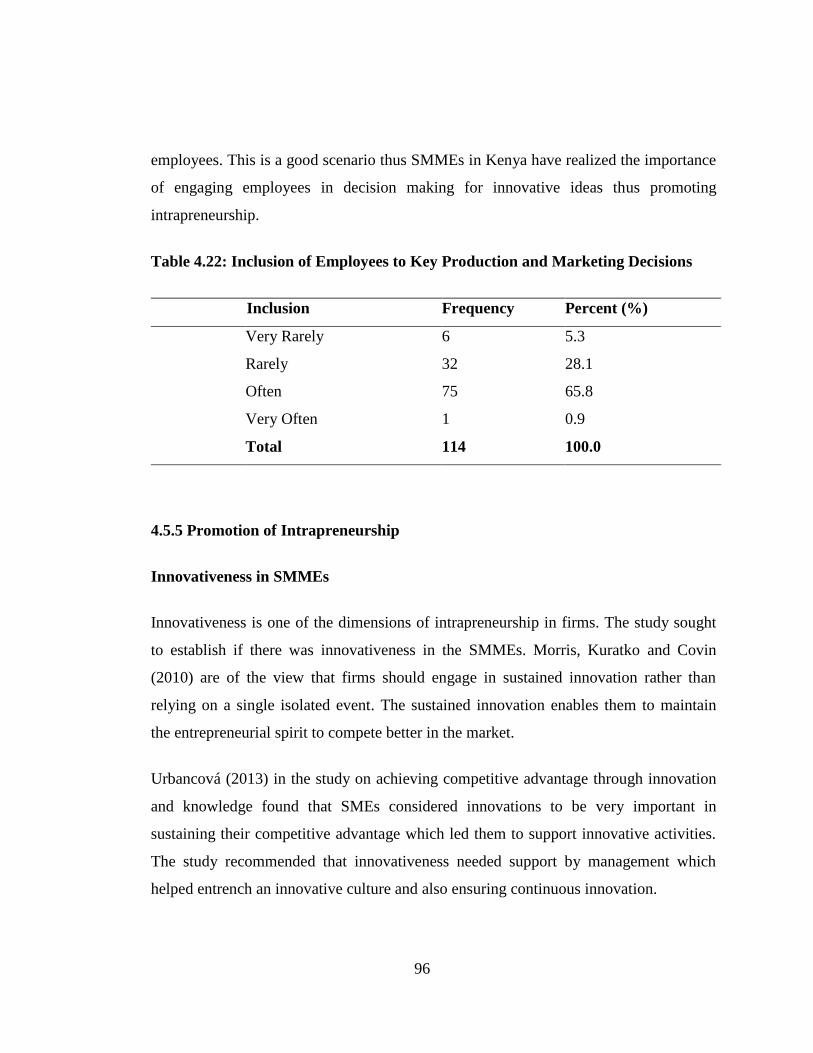
96
employees. This is a good scenario thus SMMEs in Kenya have realized the importance
of engaging employees in decision making for innovative ideas thus promoting
intrapreneurship.
Table 4.22: Inclusion of Employees to Key Production and Marketing Decisions
Inclusion Frequency Percent (%)
Very Rarely 6 5.3
Rarely 32 28.1
Often 75 65.8
Very Often 1 0.9
Total 114 100.0
4.5.5 Promotion of Intrapreneurship
Innovativeness in SMMEs
Innovativeness is one of the dimensions of intrapreneurship in firms. The study sought
to establish if there was innovativeness in the SMMEs. Morris, Kuratko and Covin
(2010) are of the view that firms should engage in sustained innovation rather than
relying on a single isolated event. The sustained innovation enables them to maintain
the entrepreneurial spirit to compete better in the market.
Urbancová (2013) in the study on achieving competitive advantage through innovation
and knowledge found that SMEs considered innovations to be very important in
sustaining their competitive advantage which led them to support innovative activities.
The study recommended that innovativeness needed support by management which
helped entrench an innovative culture and also ensuring continuous innovation.
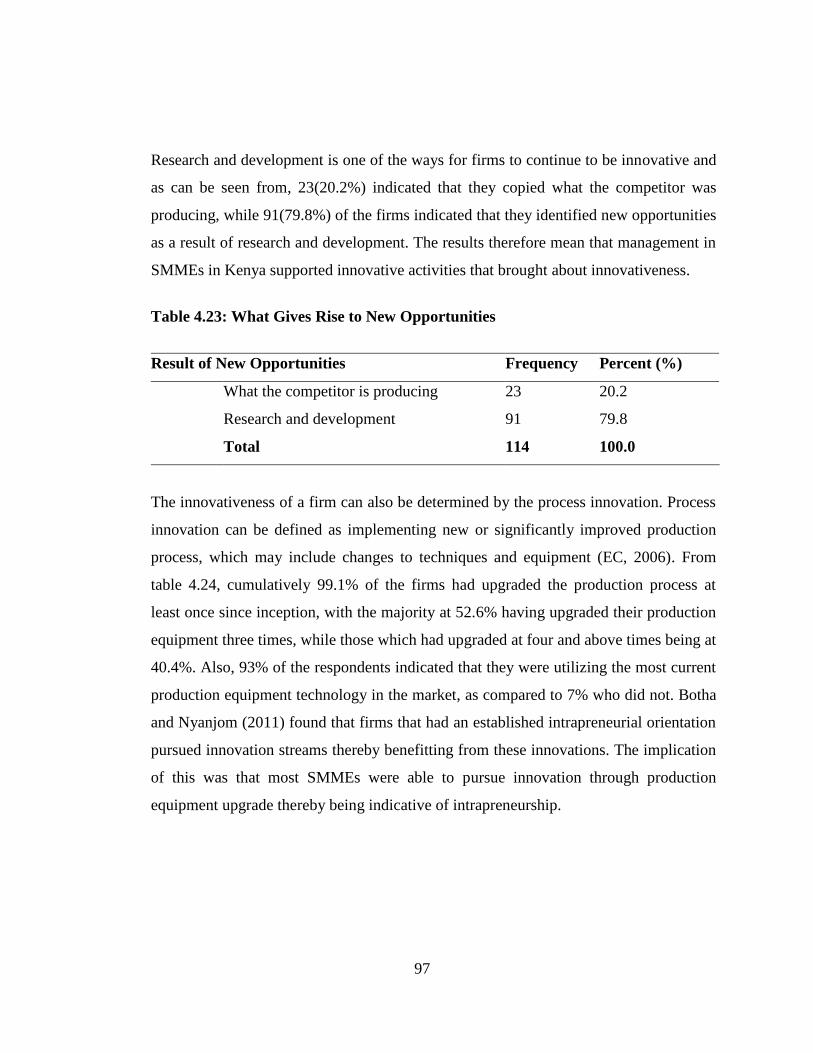
97
Research and development is one of the ways for firms to continue to be innovative and
as can be seen from, 23(20.2%) indicated that they copied what the competitor was
producing, while 91(79.8%) of the firms indicated that they identified new opportunities
as a result of research and development. The results therefore mean that management in
SMMEs in Kenya supported innovative activities that brought about innovativeness.
Table 4.23: What Gives Rise to New Opportunities
Result of New Opportunities Frequency Percent (%)
What the competitor is producing 23 20.2
Research and development 91 79.8
Total 114 100.0
The innovativeness of a firm can also be determined by the process innovation. Process
innovation can be defined as implementing new or significantly improved production
process, which may include changes to techniques and equipment (EC, 2006). From
table 4.24, cumulatively 99.1% of the firms had upgraded the production process at
least once since inception, with the majority at 52.6% having upgraded their production
equipment three times, while those which had upgraded at four and above times being at
40.4%. Also, 93% of the respondents indicated that they were utilizing the most current
production equipment technology in the market, as compared to 7% who did not. Botha
and Nyanjom (2011) found that firms that had an established intrapreneurial orientation
pursued innovation streams thereby benefitting from these innovations. The implication
of this was that most SMMEs were able to pursue innovation through production
equipment upgrade thereby being indicative of intrapreneurship.
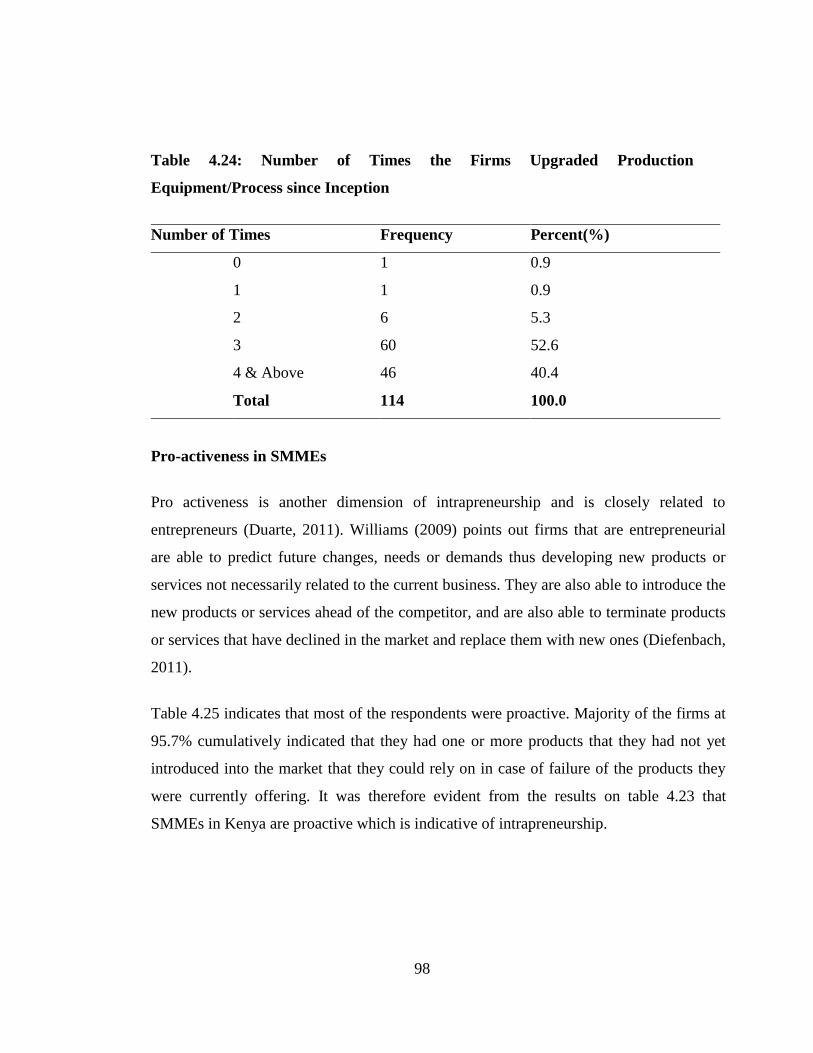
98
Table 4.24: Number of Times the Firms Upgraded Production
Equipment/Process since Inception
Number of Times Frequency Percent(%)
0 1 0.9
1 1 0.9
2 6 5.3
3 60 52.6
4 & Above 46 40.4
Total 114 100.0
Pro-activeness in SMMEs
Pro activeness is another dimension of intrapreneurship and is closely related to
entrepreneurs (Duarte, 2011). Williams (2009) points out firms that are entrepreneurial
are able to predict future changes, needs or demands thus developing new products or
services not necessarily related to the current business. They are also able to introduce the
new products or services ahead of the competitor, and are also able to terminate products
or services that have declined in the market and replace them with new ones (Diefenbach,
2011).
Table 4.25 indicates that most of the respondents were proactive. Majority of the firms at
95.7% cumulatively indicated that they had one or more products that they had not yet
introduced into the market that they could rely on in case of failure of the products they
were currently offering. It was therefore evident from the results on table 4.23 that
SMMEs in Kenya are proactive which is indicative of intrapreneurship.
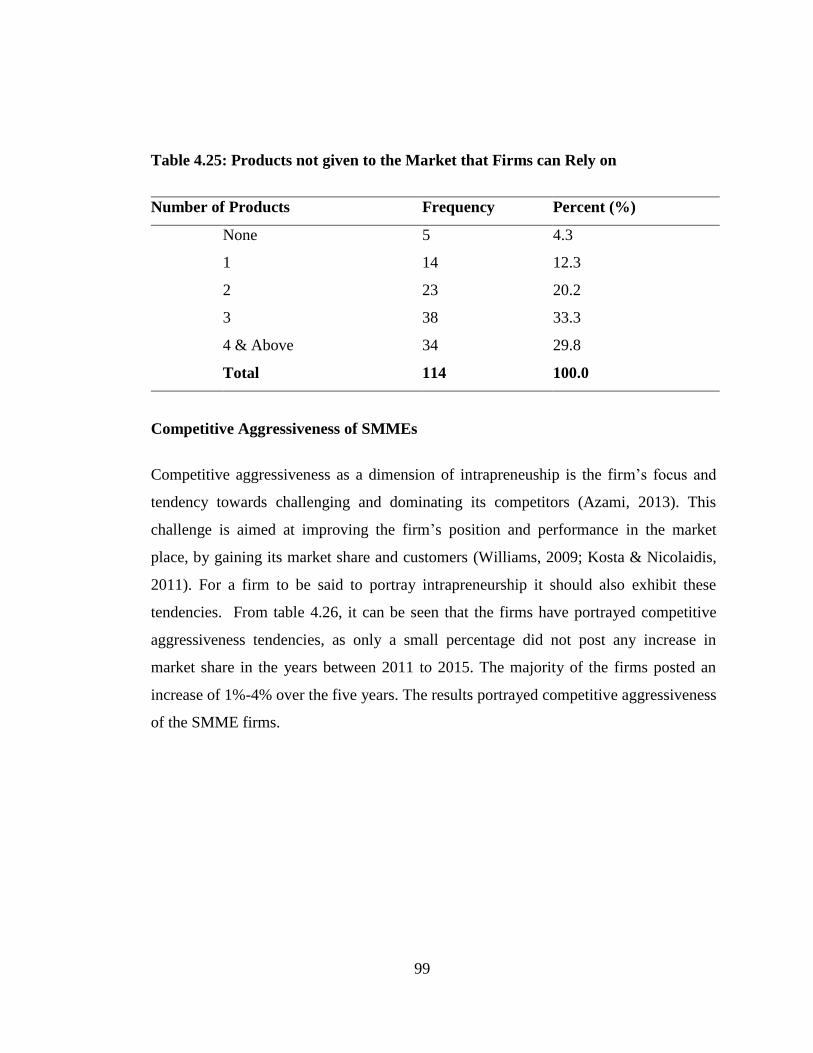
99
Table 4.25: Products not given to the Market that Firms can Rely on
Number of Products Frequency Percent (%)
None 5 4.3
1 14 12.3
2 23 20.2
3 38 33.3
4 & Above 34 29.8
Total 114 100.0
Competitive Aggressiveness of SMMEs
Competitive aggressiveness as a dimension of intrapreneuship is the firm’s focus and
tendency towards challenging and dominating its competitors (Azami, 2013). This
challenge is aimed at improving the firm’s position and performance in the market
place, by gaining its market share and customers (Williams, 2009; Kosta & Nicolaidis,
2011). For a firm to be said to portray intrapreneurship it should also exhibit these
tendencies. From table 4.26, it can be seen that the firms have portrayed competitive
aggressiveness tendencies, as only a small percentage did not post any increase in
market share in the years between 2011 to 2015. The majority of the firms posted an
increase of 1%-4% over the five years. The results portrayed competitive aggressiveness
of the SMME firms.
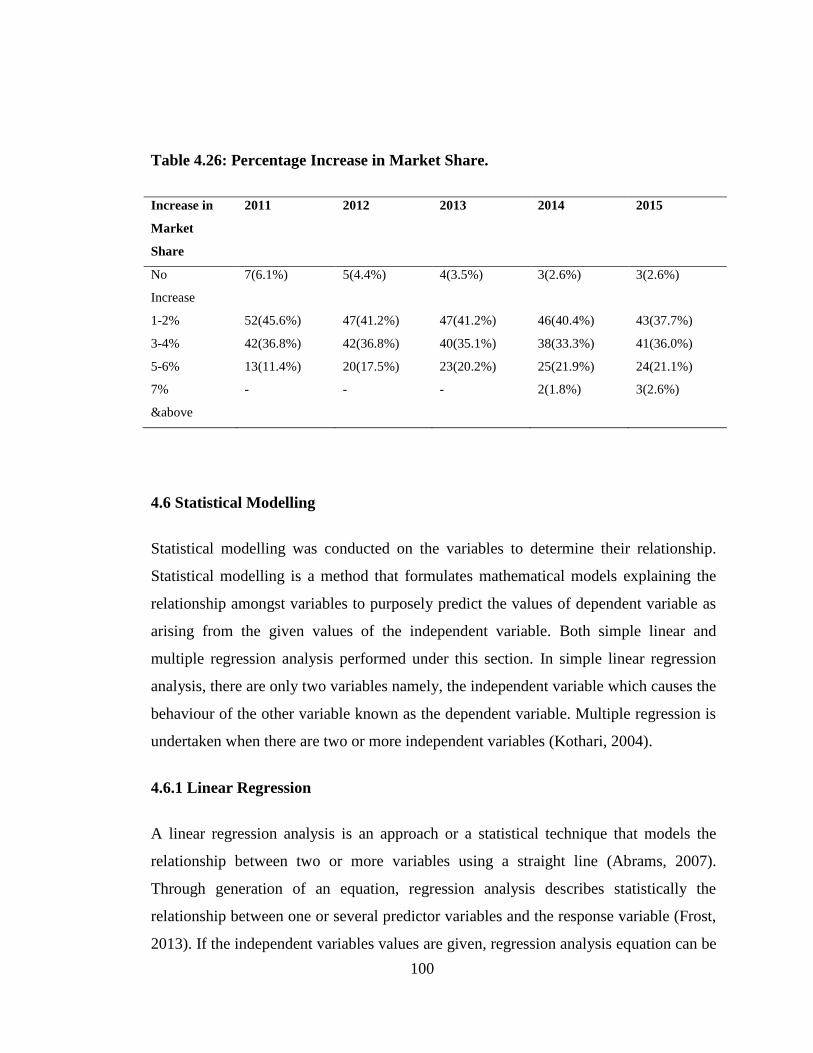
100
Table 4.26: Percentage Increase in Market Share.
Increase in
Market
Share
2011 2012 2013 2014 2015
No
Increase
7(6.1%) 5(4.4%) 4(3.5%) 3(2.6%) 3(2.6%)
1-2% 52(45.6%) 47(41.2%) 47(41.2%) 46(40.4%) 43(37.7%)
3-4% 42(36.8%) 42(36.8%) 40(35.1%) 38(33.3%) 41(36.0%)
5-6% 13(11.4%) 20(17.5%) 23(20.2%) 25(21.9%) 24(21.1%)
7%
&above
- - - 2(1.8%) 3(2.6%)
4.6 Statistical Modelling
Statistical modelling was conducted on the variables to determine their relationship.
Statistical modelling is a method that formulates mathematical models explaining the
relationship amongst variables to purposely predict the values of dependent variable as
arising from the given values of the independent variable. Both simple linear and
multiple regression analysis performed under this section. In simple linear regression
analysis, there are only two variables namely, the independent variable which causes the
behaviour of the other variable known as the dependent variable. Multiple regression is
undertaken when there are two or more independent variables (Kothari, 2004).
4.6.1 Linear Regression
A linear regression analysis is an approach or a statistical technique that models the
relationship between two or more variables using a straight line (Abrams, 2007).
Through generation of an equation, regression analysis describes statistically the
relationship between one or several predictor variables and the response variable (Frost,
2013). If the independent variables values are given, regression analysis equation can be
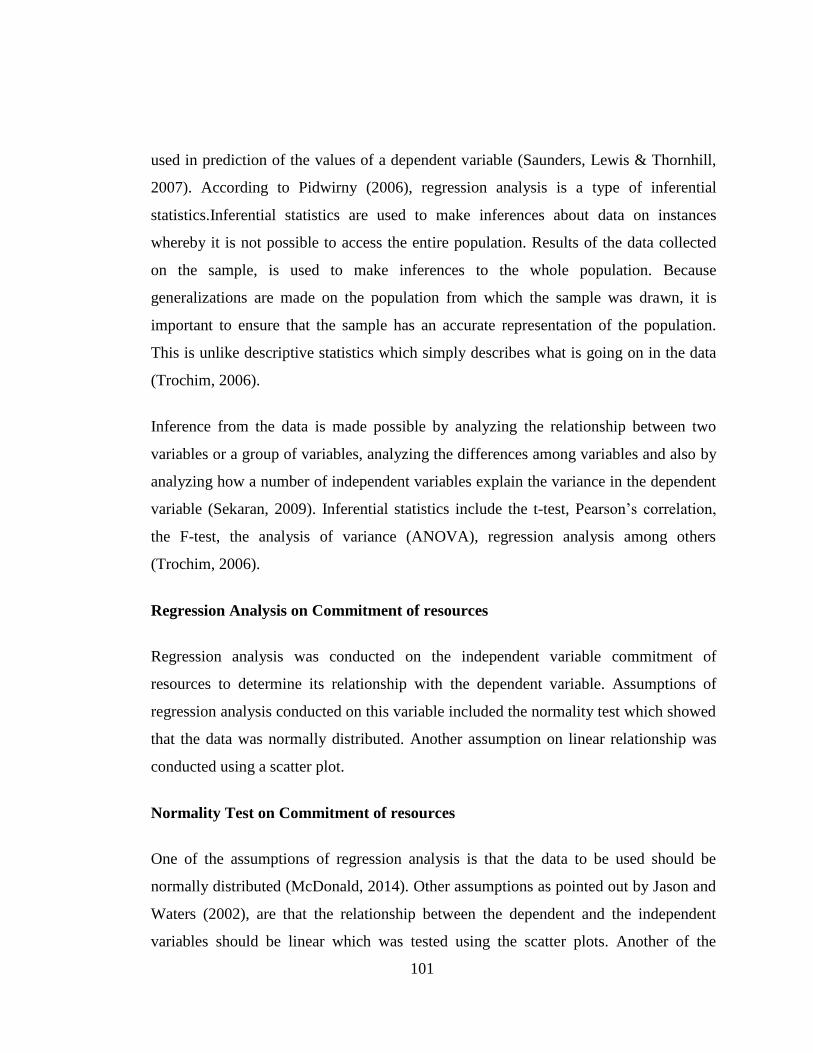
101
used in prediction of the values of a dependent variable (Saunders, Lewis & Thornhill,
2007). According to Pidwirny (2006), regression analysis is a type of inferential
statistics.Inferential statistics are used to make inferences about data on instances
whereby it is not possible to access the entire population. Results of the data collected
on the sample, is used to make inferences to the whole population. Because
generalizations are made on the population from which the sample was drawn, it is
important to ensure that the sample has an accurate representation of the population.
This is unlike descriptive statistics which simply describes what is going on in the data
(Trochim, 2006).
Inference from the data is made possible by analyzing the relationship between two
variables or a group of variables, analyzing the differences among variables and also by
analyzing how a number of independent variables explain the variance in the dependent
variable (Sekaran, 2009). Inferential statistics include the t-test, Pearson’s correlation,
the F-test, the analysis of variance (ANOVA), regression analysis among others
(Trochim, 2006).
Regression Analysis on Commitment of resources
Regression analysis was conducted on the independent variable commitment of
resources to determine its relationship with the dependent variable. Assumptions of
regression analysis conducted on this variable included the normality test which showed
that the data was normally distributed. Another assumption on linear relationship was
conducted using a scatter plot.
Normality Test on Commitment of resources
One of the assumptions of regression analysis is that the data to be used should be
normally distributed (McDonald, 2014). Other assumptions as pointed out by Jason and
Waters (2002), are that the relationship between the dependent and the independent
variables should be linear which was tested using the scatter plots. Another of the
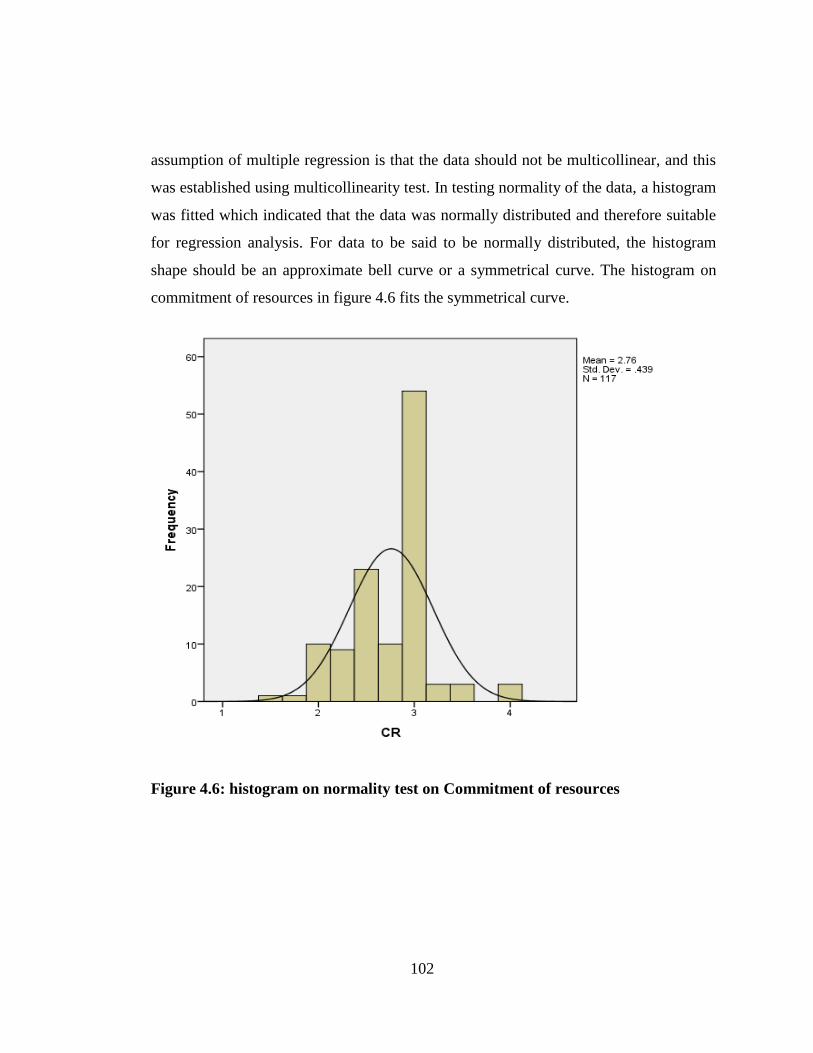
102
assumption of multiple regression is that the data should not be multicollinear, and this
was established using multicollinearity test. In testing normality of the data, a histogram
was fitted which indicated that the data was normally distributed and therefore suitable
for regression analysis. For data to be said to be normally distributed, the histogram
shape should be an approximate bell curve or a symmetrical curve. The histogram on
commitment of resources in figure 4.6 fits the symmetrical curve.
Figure 4.6: histogram on normality test on Commitment of resources
103
Scatter Plot on Commitment of resources
A scatter plot was further fitted to describe the associations of the independent variable
commitment of resources with intrapreneurship. The results of the scatter plot in the
figure 4.7 indicate that there is a positive linear relationship between the independent
variable and the dependent variable, which implies that commitment of resources
positively contributes to intrapreneurship in SMMEs. This led to the conclusion that
commitment of resources influences intrapreneurship in SMMEs.
Figure 4.7: Scatter Plot on Effect of Commitment of resources on Promotion of
Intrapreneurship.
104
Results of Regression Analysis on Commitment of resources
The model on regression analysis in table 4.27 shows a positive linear relationship
between commitment of resources and intrapreneurship at R=0.37, thus their association
was very significant. Also with R2= 0.137, the statistical explanation implies that 13.7%
of change in intrapreneurship in SMMEs can be explained by a unit change in
commitment of resources. However the model did not explain 82.3% of variation in
intrapreneurship, meaning that there are other factors associated with intrapreneurship
which were not fitted in the model.
From ANOVA, the results of the F test (F (1,113) =17.74, p =0.000<0.05) were also
significant with a p value =0.000 which is less than the standard p value of 0.05 thus
reinforcing the significance of the model. These results led to the comfortable
conclusion that the contribution of commitment of resources to promotion of
intrapreneurship in SMMEs in Kenya is significant. It was therefore concluded that
management in SMMEs need to allocate resources to areas that enhance
intrapreneurship.
Further tests on the beta coefficients revealed that the coefficient for commitment of
resources (β) was equally significant with (β = 0.313, t=4.212, p=0.000< 0.05)
indicating that commitment of resources significantly has a positive increase in
intrapreneurship. Under objective one and hypothesis one, the study sought to establish
the magnitude and the direction of the effect of commitment of resources on promotion
of intrapreneurship by fitting a model Y=β0 + β1X1+ε
Objective 1: To determine if commitment of resources has a role on promotion of
intrapreneurship in SMMEs in Kenya.
H1: Commitment of resources has a positive significant role on promotion of
intrapreneurship in SMMEs in Kenya
105
This hypothesis was tested at 5% significance level. A t-test was used to test the
relationship between commitment of resources and promotion of intrapreneurship in
SMMEs in Kenya. A beta coefficient in the process was computed which was found to
be statistically significant. The results as indicated on table 4.27 show that the beta
coefficient at β = 0.313 is significantly different from zero, and a t-value of 4.212 which
is also significantly different from zero. The P-value at 0.000 is less than the p-value of
0.05.
These results led to the acceptance of the alternative hypothesis and conclusion made
that there is a statistically significant relationship between commitment of resources and
promotion of intrapreneurship in SMMEs in Kenya. The null hypothesis that
commitment of resources does not have significant role on promotion of
intrapreneurship in SMMEs in Kenya was rejected. The model was therefore
determined to be statistically fit, thus Y= 1.986+0.313*X1
The results conform to the study by Zhao (2013) which concluded that resources both
financial and no-financial resources should be allocated for intrapreneurship to thrive in
an organization. The commitment of the financial resources should be to both the
intrapreneur and to the areas of the entrepreneurial focus, which should be allocated
enough resources for success to be attained. Apart from financial resources, another
resource that the researcher identified to be of importance to intrapreneurship is time
resource which managers should allow employees to dedicate and commit to the new
innovations for the period necessary to have the innovations succeed.
This study however differs with the study undertaken by Nafiel, Nimran, Musadieqand
Suyadi (2014) who used the corporate entrepreneurship assessment instrument and
concluded that availing resources does not have a positive significant effect on
intrapreneurship. The results of the study, and in comparison with the results of the
other studies referred to led the researcher to suggest that management within SMMEs
should commit resources to areas that out rightly promote intrapreneurship. Committing

106
resources to the areas studied that is research and development, upgrading or acquiring
new production equipment, training of staff to upgrade their skills and marketing
activities would promote intrapreneurship training in SMMEs.
Table 4.27: Linear Regression analysis model results for commitment of
Resources on promotion of intrapreneurship
Model Summary
Model R R Square Adjusted R Square Std. Error of the Estimate
1 .370 .137 .1299 .349
ANOVA
Model Sum of Squares Df Mean Square F Sig.
1
Regression 2.157 1 2.157 17.740 .000
Residual 13.619 112 .122
Total 15.776 113
Coefficients
Model Unstandardized
Coefficients
Standardized
Coefficients
T Sig.
B Std. Error Beta
1
(Constant) 1.986 .208 9.565 .000
Commitment
of resources
.313 .074 .370 4.212 .000
a) Predictors(c) Commitment of resources
b) Dependent variable – Promotion of Intrapreneurship
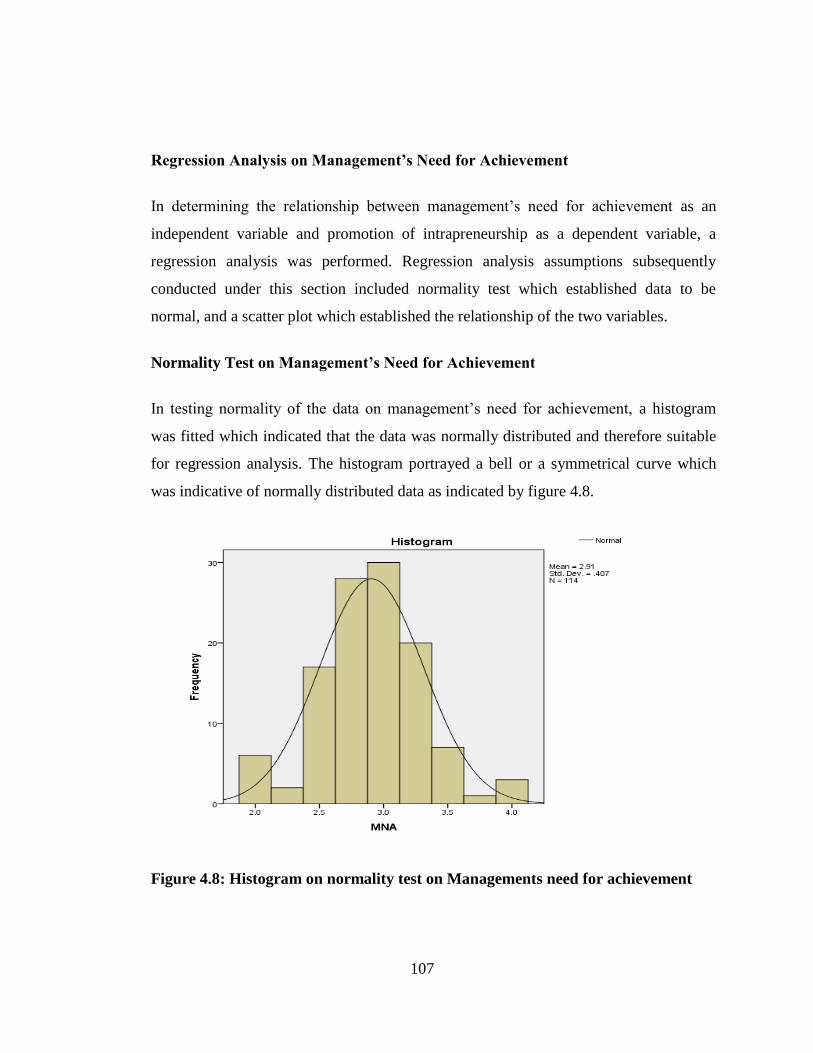
107
Regression Analysis on Management’s Need for Achievement
In determining the relationship between management’s need for achievement as an
independent variable and promotion of intrapreneurship as a dependent variable, a
regression analysis was performed. Regression analysis assumptions subsequently
conducted under this section included normality test which established data to be
normal, and a scatter plot which established the relationship of the two variables.
Normality Test on Management’s Need for Achievement
In testing normality of the data on management’s need for achievement, a histogram
was fitted which indicated that the data was normally distributed and therefore suitable
for regression analysis. The histogram portrayed a bell or a symmetrical curve which
was indicative of normally distributed data as indicated by figure 4.8.
Figure 4.8: Histogram on normality test on Managements need for achievement
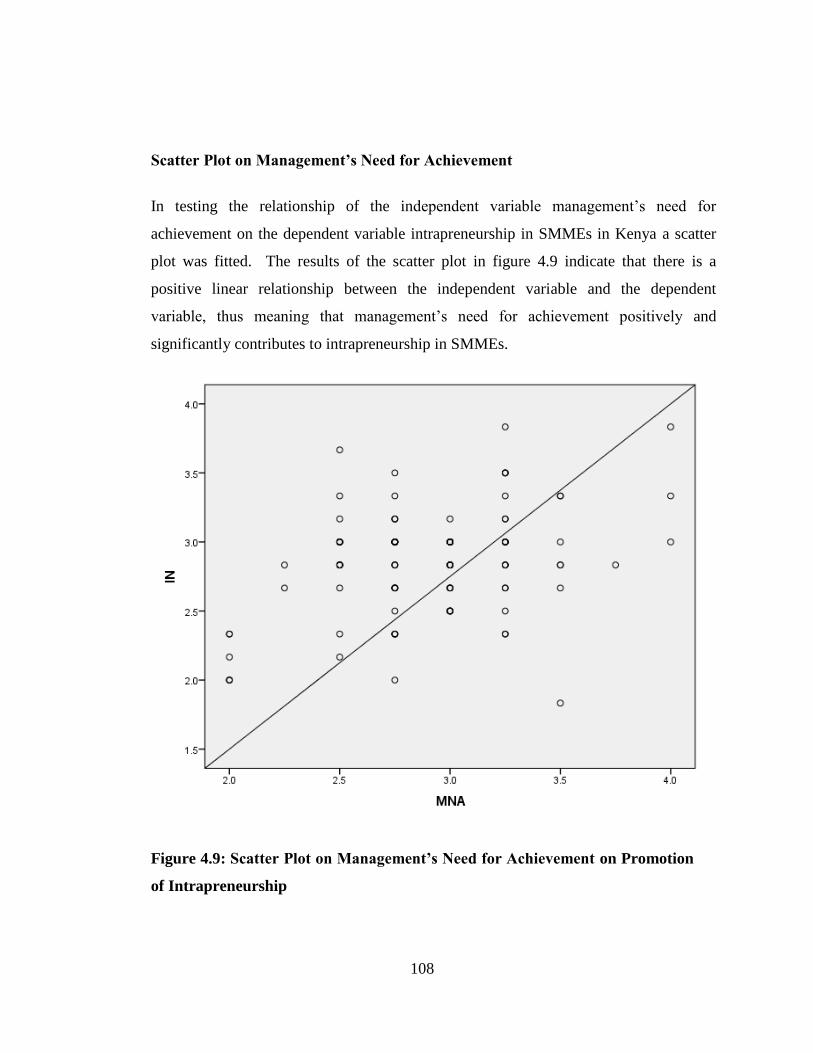
108
Scatter Plot on Management’s Need for Achievement
In testing the relationship of the independent variable management’s need for
achievement on the dependent variable intrapreneurship in SMMEs in Kenya a scatter
plot was fitted. The results of the scatter plot in figure 4.9 indicate that there is a
positive linear relationship between the independent variable and the dependent
variable, thus meaning that management’s need for achievement positively and
significantly contributes to intrapreneurship in SMMEs.
Figure 4.9: Scatter Plot on Management’s Need for Achievement on Promotion
of Intrapreneurship

109
Results of Regression Analysis on Management’s Need for Achievement
The results of the regression analysis model in table 4.28further show that there is
positive linear relationship between management’s need for achievement and
intrapreneurship at R=37.2, implying a significant association. With R2=0.138,
statistically the implication is that 13.8% variation in intrapreneurship in SMMEs is
brought about by a unit change in management’s need for achievement. Further
implication is that 86.2% change in intrapreneurship in SMMEs is brought about by
other factors.
The F test (F (1,113)=17.96, p=0.000<0.05) as shown in the ANOVA was significant
with a p value =0.000 which is less than the standard p value of 0.05 and this meant that
the model was significant. These results led to the conclusion that the contribution of
management’s need for achievement to promotion of intrapreneurship in SMMEs in
Kenya is significant, therefore for SMMEs to be entrepreneurial, management in these
firms need to portray management’s need for achievement tendencies.
Tests on the beta coefficient for managements need for achievement (β) was equally
significant with (β = 0.342, t=4.238, p =0.000<0.05) indicating that an increase in
management’s need for achievement significantly increases intrapreneurship. The study
sought to establish the magnitude and direction of the effect of management need for
achievement on intrapreneurship in SMMEs in Kenya under objective two and
hypothesis two, by fitting the model Y= β0 + β2X2+ε.
Objective 2: To determine if management’s need for achievement has a role on
promotion ofintrapreneurship in SMMEs.
H2: Management’s need for achievement has a positive significant role on
promotion of intrapreneurship in SMMEs in Kenya.
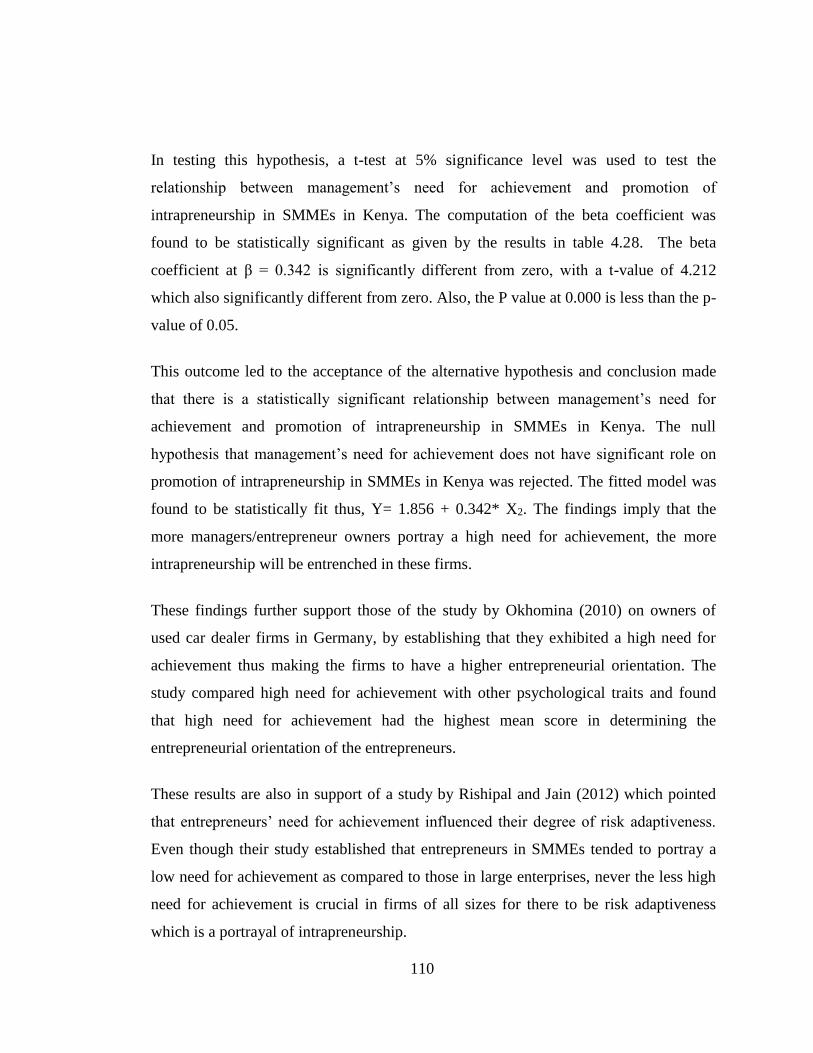
110
In testing this hypothesis, a t-test at 5% significance level was used to test the
relationship between management’s need for achievement and promotion of
intrapreneurship in SMMEs in Kenya. The computation of the beta coefficient was
found to be statistically significant as given by the results in table 4.28. The beta
coefficient at β = 0.342 is significantly different from zero, with a t-value of 4.212
which also significantly different from zero. Also, the P value at 0.000 is less than the p-
value of 0.05.
This outcome led to the acceptance of the alternative hypothesis and conclusion made
that there is a statistically significant relationship between management’s need for
achievement and promotion of intrapreneurship in SMMEs in Kenya. The null
hypothesis that management’s need for achievement does not have significant role on
promotion of intrapreneurship in SMMEs in Kenya was rejected. The fitted model was
found to be statistically fit thus, Y= 1.856 + 0.342* X2. The findings imply that the
more managers/entrepreneur owners portray a high need for achievement, the more
intrapreneurship will be entrenched in these firms.
These findings further support those of the study by Okhomina (2010) on owners of
used car dealer firms in Germany, by establishing that they exhibited a high need for
achievement thus making the firms to have a higher entrepreneurial orientation. The
study compared high need for achievement with other psychological traits and found
that high need for achievement had the highest mean score in determining the
entrepreneurial orientation of the entrepreneurs.
These results are also in support of a study by Rishipal and Jain (2012) which pointed
that entrepreneurs’ need for achievement influenced their degree of risk adaptiveness.
Even though their study established that entrepreneurs in SMMEs tended to portray a
low need for achievement as compared to those in large enterprises, never the less high
need for achievement is crucial in firms of all sizes for there to be risk adaptiveness
which is a portrayal of intrapreneurship.
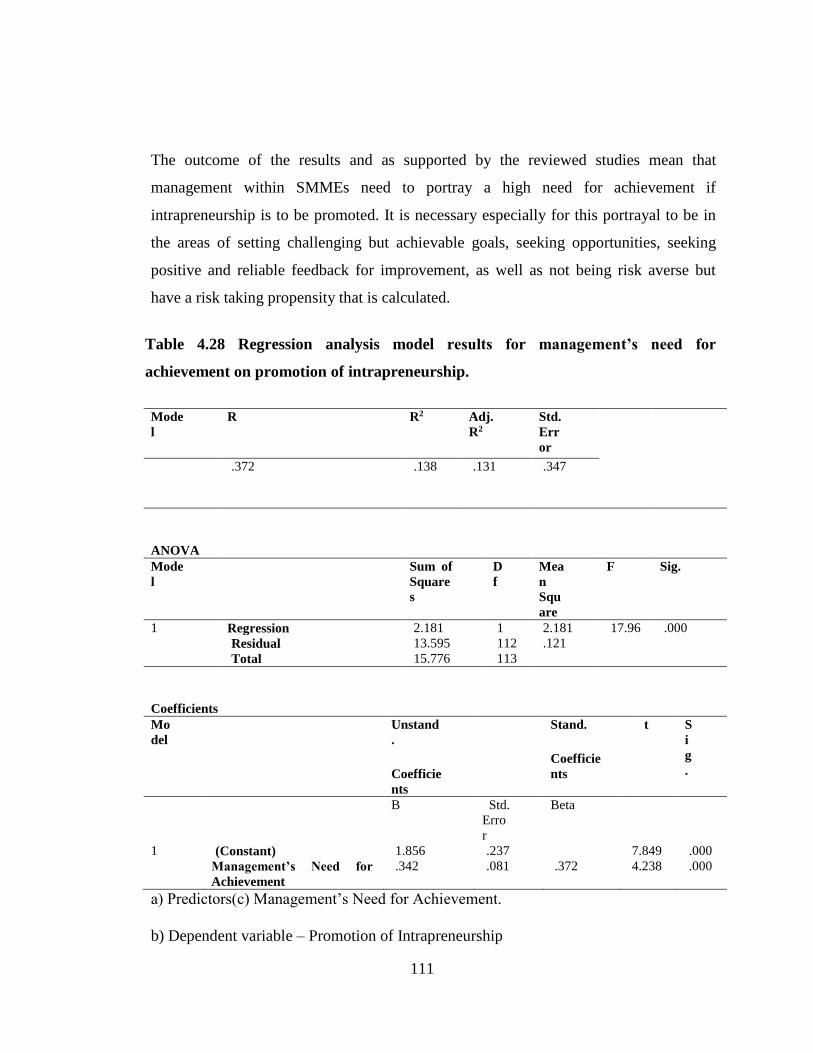
111
The outcome of the results and as supported by the reviewed studies mean that
management within SMMEs need to portray a high need for achievement if
intrapreneurship is to be promoted. It is necessary especially for this portrayal to be in
the areas of setting challenging but achievable goals, seeking opportunities, seeking
positive and reliable feedback for improvement, as well as not being risk averse but
have a risk taking propensity that is calculated.
Table 4.28 Regression analysis model results for management’s need for
achievement on promotion of intrapreneurship.
Mode
l
R R2 Adj.
R2
Std.
Err
or
.372 .138 .131 .347
ANOVA
Mode
l
Sum of
Square
s
D
f
Mea
n
Squ
are
F Sig.
1 Regression 2.181 1 2.181 17.96 .000
Residual 13.595 112 .121
Total 15.776 113
Coefficients
Mo
del
Unstand
.
Coefficie
nts
Stand.
Coefficie
nts
t S
i
g
.
B Std.
Erro
r
Beta
1 (Constant) 1.856 .237 7.849 .000
Management’s Need for
Achievement
.342 .081 .372 4.238 .000
a) Predictors(c) Management’s Need for Achievement.
b) Dependent variable – Promotion of Intrapreneurship
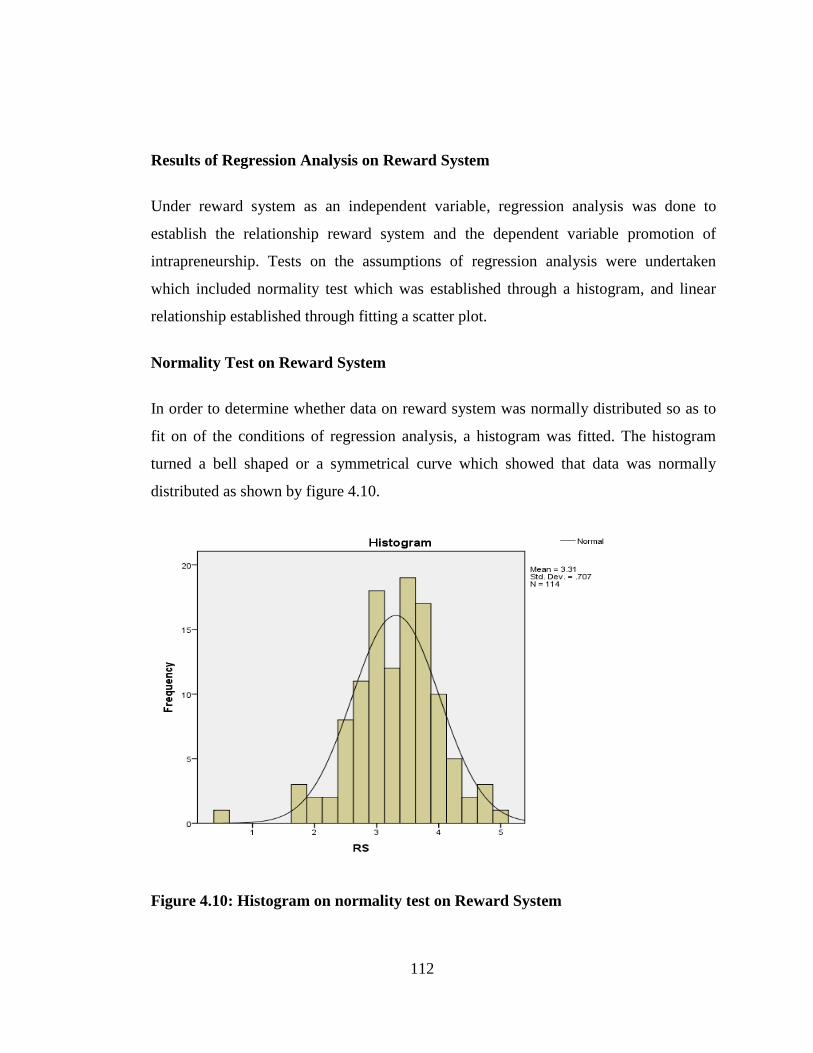
112
Results of Regression Analysis on Reward System
Under reward system as an independent variable, regression analysis was done to
establish the relationship reward system and the dependent variable promotion of
intrapreneurship. Tests on the assumptions of regression analysis were undertaken
which included normality test which was established through a histogram, and linear
relationship established through fitting a scatter plot.
Normality Test on Reward System
In order to determine whether data on reward system was normally distributed so as to
fit on of the conditions of regression analysis, a histogram was fitted. The histogram
turned a bell shaped or a symmetrical curve which showed that data was normally
distributed as shown by figure 4.10.
Figure 4.10: Histogram on normality test on Reward System
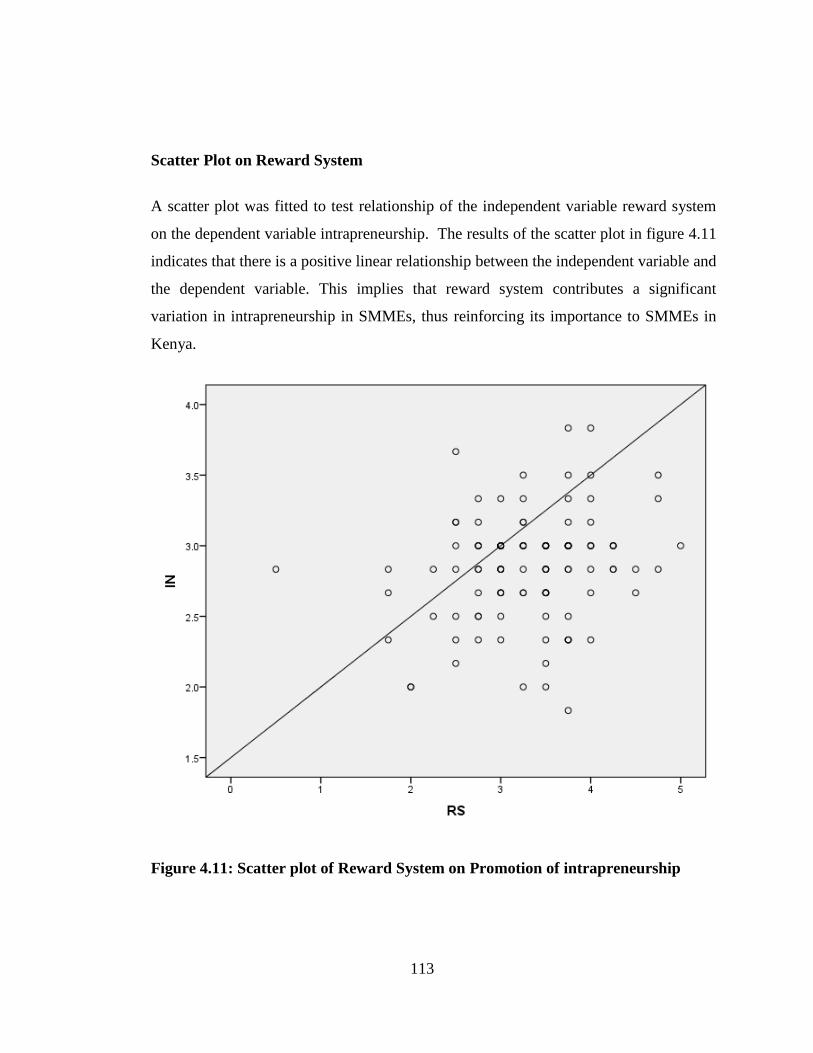
113
Scatter Plot on Reward System
A scatter plot was fitted to test relationship of the independent variable reward system
on the dependent variable intrapreneurship. The results of the scatter plot in figure 4.11
indicates that there is a positive linear relationship between the independent variable and
the dependent variable. This implies that reward system contributes a significant
variation in intrapreneurship in SMMEs, thus reinforcing its importance to SMMEs in
Kenya.
Figure 4.11: Scatter plot of Reward System on Promotion of intrapreneurship
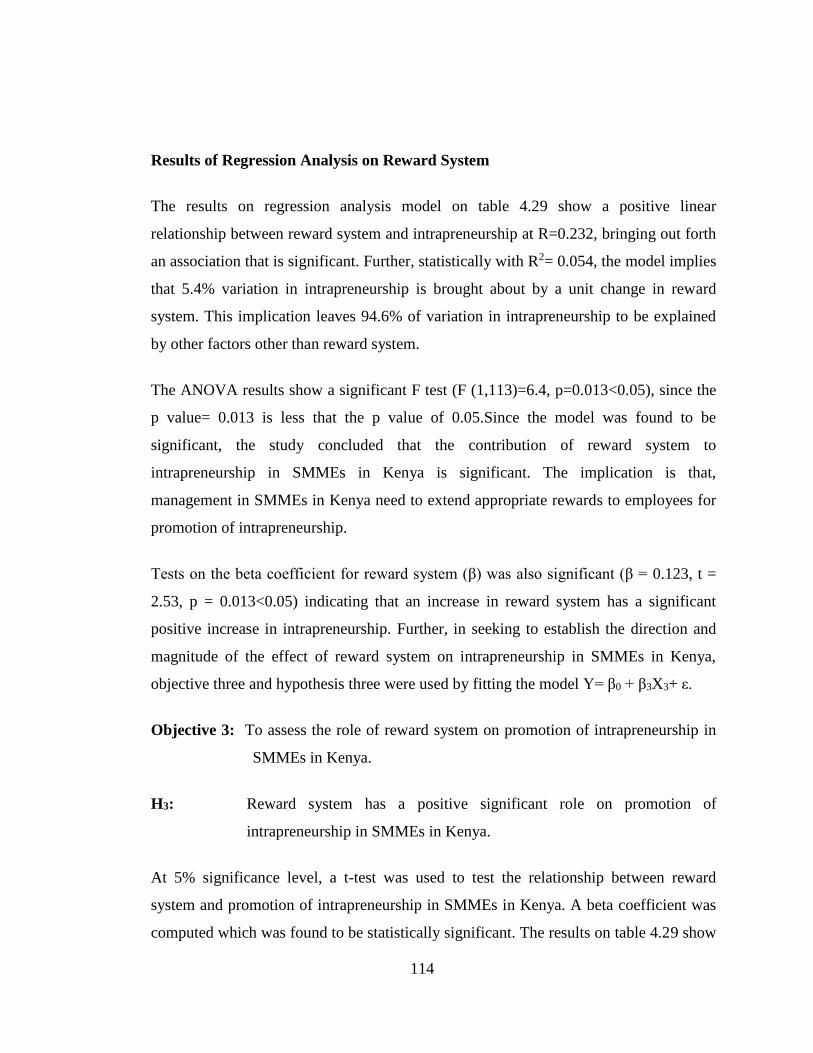
114
Results of Regression Analysis on Reward System
The results on regression analysis model on table 4.29 show a positive linear
relationship between reward system and intrapreneurship at R=0.232, bringing out forth
an association that is significant. Further, statistically with R2= 0.054, the model implies
that 5.4% variation in intrapreneurship is brought about by a unit change in reward
system. This implication leaves 94.6% of variation in intrapreneurship to be explained
by other factors other than reward system.
The ANOVA results show a significant F test (F (1,113)=6.4, p=0.013<0.05), since the
p value= 0.013 is less that the p value of 0.05.Since the model was found to be
significant, the study concluded that the contribution of reward system to
intrapreneurship in SMMEs in Kenya is significant. The implication is that,
management in SMMEs in Kenya need to extend appropriate rewards to employees for
promotion of intrapreneurship.
Tests on the beta coefficient for reward system (β) was also significant (β = 0.123, t =
2.53, p = 0.013<0.05) indicating that an increase in reward system has a significant
positive increase in intrapreneurship. Further, in seeking to establish the direction and
magnitude of the effect of reward system on intrapreneurship in SMMEs in Kenya,
objective three and hypothesis three were used by fitting the model Y= β0 + β3X3+ ε.
Objective 3: To assess the role of reward system on promotion of intrapreneurship in
SMMEs in Kenya.
H3: Reward system has a positive significant role on promotion of
intrapreneurship in SMMEs in Kenya.
At 5% significance level, a t-test was used to test the relationship between reward
system and promotion of intrapreneurship in SMMEs in Kenya. A beta coefficient was
computed which was found to be statistically significant. The results on table 4.29 show
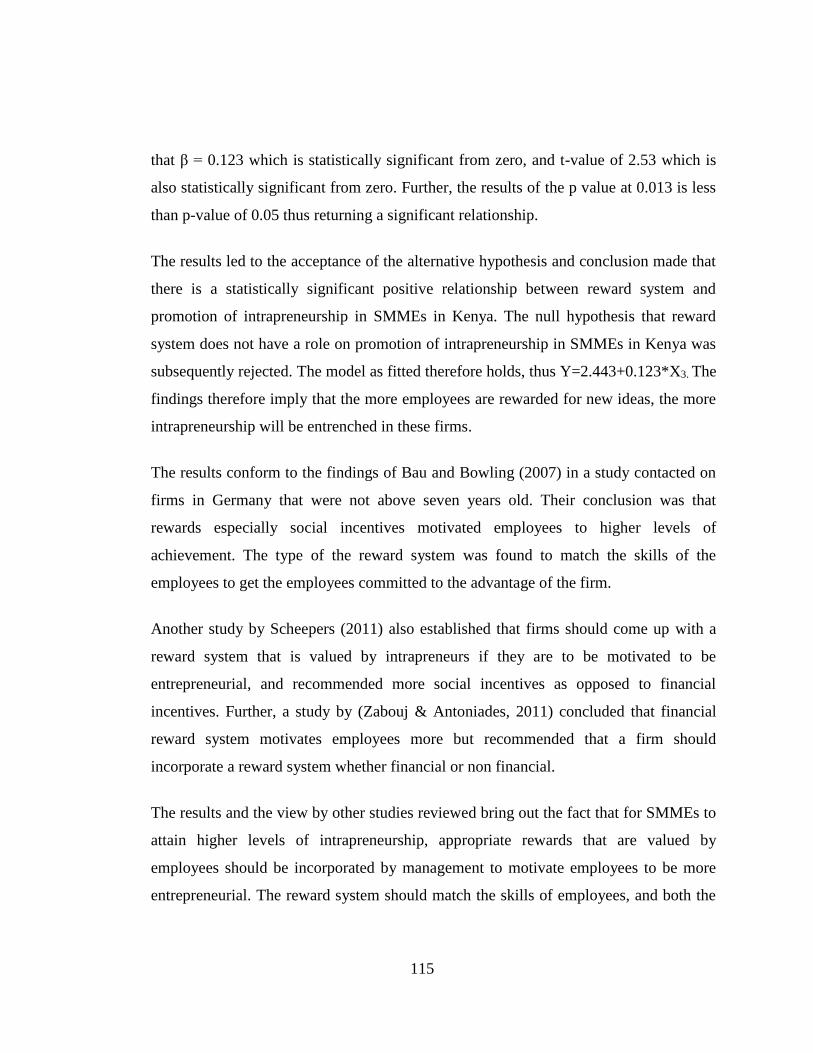
115
that β = 0.123 which is statistically significant from zero, and t-value of 2.53 which is
also statistically significant from zero. Further, the results of the p value at 0.013 is less
than p-value of 0.05 thus returning a significant relationship.
The results led to the acceptance of the alternative hypothesis and conclusion made that
there is a statistically significant positive relationship between reward system and
promotion of intrapreneurship in SMMEs in Kenya. The null hypothesis that reward
system does not have a role on promotion of intrapreneurship in SMMEs in Kenya was
subsequently rejected. The model as fitted therefore holds, thus Y=2.443+0.123*X3. The
findings therefore imply that the more employees are rewarded for new ideas, the more
intrapreneurship will be entrenched in these firms.
The results conform to the findings of Bau and Bowling (2007) in a study contacted on
firms in Germany that were not above seven years old. Their conclusion was that
rewards especially social incentives motivated employees to higher levels of
achievement. The type of the reward system was found to match the skills of the
employees to get the employees committed to the advantage of the firm.
Another study by Scheepers (2011) also established that firms should come up with a
reward system that is valued by intrapreneurs if they are to be motivated to be
entrepreneurial, and recommended more social incentives as opposed to financial
incentives. Further, a study by (Zabouj & Antoniades, 2011) concluded that financial
reward system motivates employees more but recommended that a firm should
incorporate a reward system whether financial or non financial.
The results and the view by other studies reviewed bring out the fact that for SMMEs to
attain higher levels of intrapreneurship, appropriate rewards that are valued by
employees should be incorporated by management to motivate employees to be more
entrepreneurial. The reward system should match the skills of employees, and both the

116
expectations of management and the intrapreneurs. This scenario would promote
intrapreneurship which would give the SMMEs a competitive advantage in the market.
Table 4.29: Regression model results for reward system on promotion of
intrapreneurship
Model Summary
Model R R2 Adj.R2 Std. Error
1 .232 .054 .046 .365
ANOVA
Model
Sum of
Squares
Df Mean
Square
F Sig.
1 Regression .852 1 .852 6.40 .013
Residual 14.924 112 .133
Total 15.776 113
Coefficients
Model
Unstand.
Coefficients
Std.
Err
or
Stand.
Coefficients
t Si
g
B Beta
1 (Constant) 2.443 .164
14.86 .000
Reward
System
.123 .049 .232 2.53 .013
a) Predictors(c) Reward system
b) Dependent variable – Promotion of Intrapreneurship
Regression Analysis Results for Entrepreneurial Management Structure
Regression analysis was also conducted on entrepreneurial management structure as an
independent variable to establish its relationship with the dependent variable promotion
of entrepreneurship. The assumptions of regression analysis performed under this

117
section included establishing whether the data was normally distributed, and whether
there was a linear relationship through fitting a scatter plot.
Normality Test on Entrepreneurial management structure
Before the regression analysis was performed on entrepreneurial management structure,
a normality test to establish the suitability of the analysis was undertaken. This as
depicted by the histogram on figure 4.12 established that the data was normally
distributed, as the histogram was symmetrical or bell shaped.
Figure 4.12: Histogram on Normality Test on Entrepreneurial management
structure

118
Scatter Plot on Entrepreneurial management structure
In testing the relationship between the independent variable entrepreneurial
management structure on the dependent variable promotion of intrapreneurship, a
scatter plot was fitted whose results as depicted in figure 4.13indicate that there is a
positive linear relationship between the independent variable and the dependent
variable. It was concluded that entrepreneurial management structure has a significant
contribution to intrapreneurship in SMMEs in Kenya. Given the highly significant
contribution to intrapreneurship, SMMEs in Kenya need supportive entrepreneurial
management structures.
Figure 4.13: Scatter plot on entrepreneurial management structure and
intrapreneurship

119
Results of Regression Analysis on Entrepreneurial management structure
The results of the regression model on table 4.30 show a positive linear relationship
between entrepreneurial management structure and intrapreneurship at R=0.543,
making their association to be significant. With R2=0.295, statistically the implication is
that an addition of an extra unit of entrepreneurial management structure would cause a
variation of about 29.5% in intrapreneurship. This means that 70.5% variation in
promotion of intrapreneurship is caused by other factors apart from entrepreneurial
management structure.
The results of the F test (F (1,113) = 45.9, p = 0.000<0.05) from the ANOVA were
significant with a p value =0.000 which is less than the standard p value of 0.05 further
reinforcing the significance of the model. The study concluded that the contribution of
entrepreneurial management structure to intrapreneurship in SMMEs in Kenya is
significant, therefore SMMEs need to adopt proper entrepreneurial management
structures for intrapreneurship to thrive.
The coefficient of entrepreneurial management structure was also significant (β = 0.524,
t = 6.849, p < 0.000) indicating that an increase in entrepreneurial management structure
has a significant positive increase in intrapreneurship in SMMEs. The magnitude and
direction of the effect of entrepreneurial management structure on intrapreneurship in
SMMEs in Kenya was tested under objective four and hypothesis four by fitting the
model Y= β0 + β4X4+ε.
Objective 4: To establish if entrepreneurial management structure has a role on
promotion of intrapreneurship in SMMEs in Kenya
H4: Entrepreneurial management structure has a positive significant role on
promotion of intrapreneurship in SMMEs in Kenya.
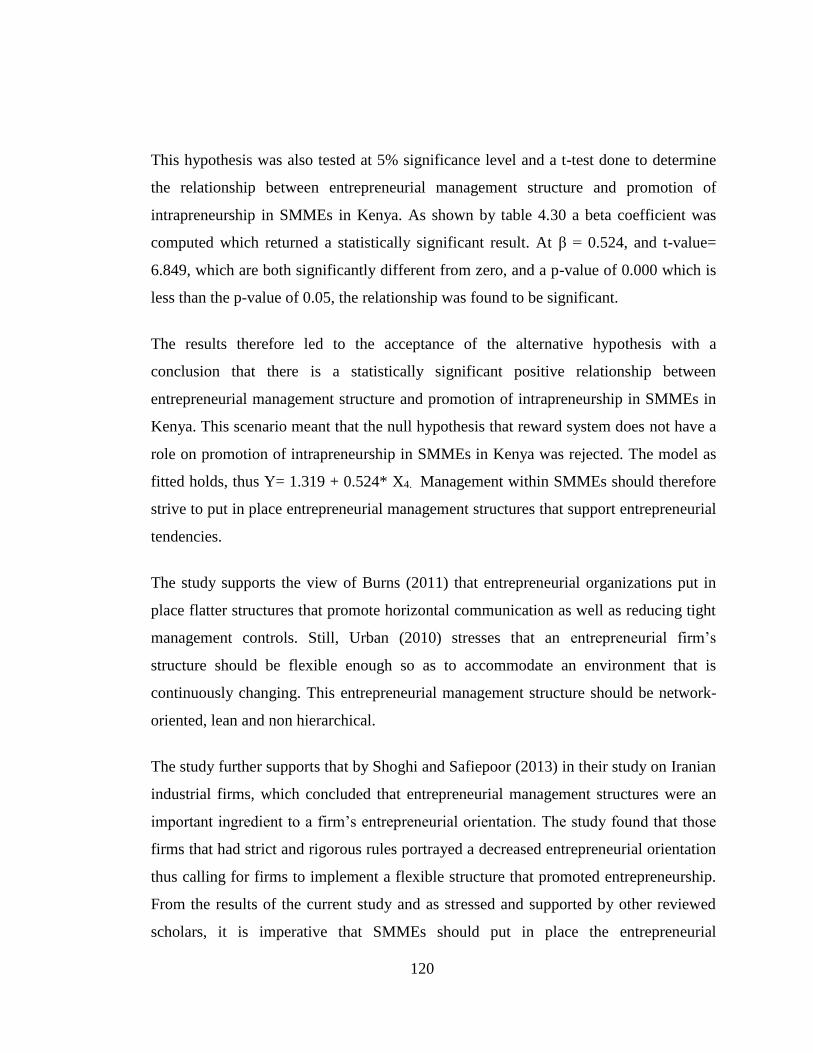
120
This hypothesis was also tested at 5% significance level and a t-test done to determine
the relationship between entrepreneurial management structure and promotion of
intrapreneurship in SMMEs in Kenya. As shown by table 4.30 a beta coefficient was
computed which returned a statistically significant result. At β = 0.524, and t-value=
6.849, which are both significantly different from zero, and a p-value of 0.000 which is
less than the p-value of 0.05, the relationship was found to be significant.
The results therefore led to the acceptance of the alternative hypothesis with a
conclusion that there is a statistically significant positive relationship between
entrepreneurial management structure and promotion of intrapreneurship in SMMEs in
Kenya. This scenario meant that the null hypothesis that reward system does not have a
role on promotion of intrapreneurship in SMMEs in Kenya was rejected. The model as
fitted holds, thus Y= 1.319 + 0.524* X4. Management within SMMEs should therefore
strive to put in place entrepreneurial management structures that support entrepreneurial
tendencies.
The study supports the view of Burns (2011) that entrepreneurial organizations put in
place flatter structures that promote horizontal communication as well as reducing tight
management controls. Still, Urban (2010) stresses that an entrepreneurial firm’s
structure should be flexible enough so as to accommodate an environment that is
continuously changing. This entrepreneurial management structure should be network-
oriented, lean and non hierarchical.
The study further supports that by Shoghi and Safiepoor (2013) in their study on Iranian
industrial firms, which concluded that entrepreneurial management structures were an
important ingredient to a firm’s entrepreneurial orientation. The study found that those
firms that had strict and rigorous rules portrayed a decreased entrepreneurial orientation
thus calling for firms to implement a flexible structure that promoted entrepreneurship.
From the results of the current study and as stressed and supported by other reviewed
scholars, it is imperative that SMMEs should put in place the entrepreneurial

121
management structures for promotion of intrapreneurship. These structures are
accommodative of employees’ entrepreneurial ideas and as well include employees to
crucial decision making, which helps nurture their innovative ideas.
Table 4.30: Regression analysis model results for entrepreneurial management
Structure on promotion of intrapreneurship
Model Summary
Mod
el
R R2 Adj.R2 Std.
Err
or
1 .543 .295 .289 .315
ANOVA
Mod
el
Su
m
of
Sq
uar
es
Df Mea
n
Squ
are
F Sig.
1 Regression
4.657 1 4.657 45.
9
.000
Residual 11.119 112 .099
Total 15.776 113
Coefficients
M
od
el
Unstan
d.
Coeffici
ents
Std.
Error
Stand.
Coeffi
cients
t S
g
.
1 (Constant)
1.319 .225 5.8
49
.00
0
Entrepreneurial
management structure
.524 .077 .543 6.8
49
.00
0
a) Predictors(c) Entrepreneurial management structure
b) Dependent variable – Promotion of Intrapreneurship
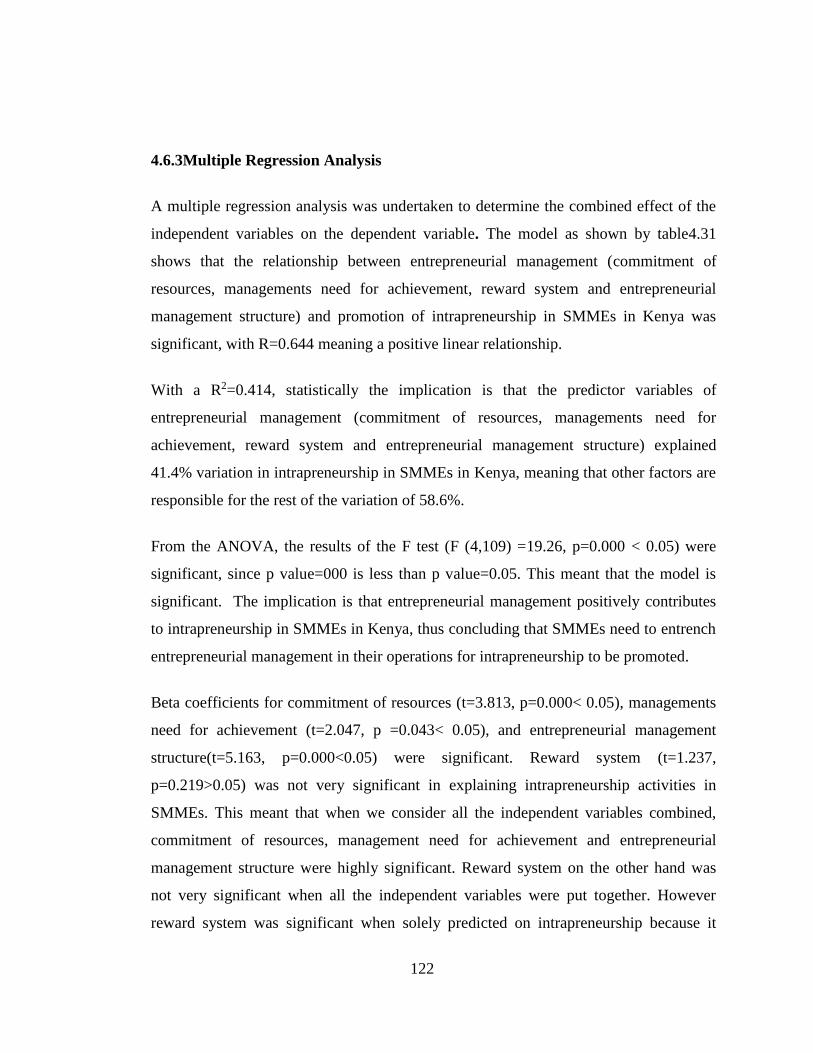
122
4.6.3Multiple Regression Analysis
A multiple regression analysis was undertaken to determine the combined effect of the
independent variables on the dependent variable. The model as shown by table4.31
shows that the relationship between entrepreneurial management (commitment of
resources, managements need for achievement, reward system and entrepreneurial
management structure) and promotion of intrapreneurship in SMMEs in Kenya was
significant, with R=0.644 meaning a positive linear relationship.
With a R2=0.414, statistically the implication is that the predictor variables of
entrepreneurial management (commitment of resources, managements need for
achievement, reward system and entrepreneurial management structure) explained
41.4% variation in intrapreneurship in SMMEs in Kenya, meaning that other factors are
responsible for the rest of the variation of 58.6%.
From the ANOVA, the results of the F test (F (4,109) =19.26, p=0.000 < 0.05) were
significant, since p value=000 is less than p value=0.05. This meant that the model is
significant. The implication is that entrepreneurial management positively contributes
to intrapreneurship in SMMEs in Kenya, thus concluding that SMMEs need to entrench
entrepreneurial management in their operations for intrapreneurship to be promoted.
Beta coefficients for commitment of resources (t=3.813, p=0.000< 0.05), managements
need for achievement (t=2.047, p =0.043< 0.05), and entrepreneurial management
structure(t=5.163, p=0.000<0.05) were significant. Reward system (t=1.237,
p=0.219>0.05) was not very significant in explaining intrapreneurship activities in
SMMEs. This meant that when we consider all the independent variables combined,
commitment of resources, management need for achievement and entrepreneurial
management structure were highly significant. Reward system on the other hand was
not very significant when all the independent variables were put together. However
reward system was significant when solely predicted on intrapreneurship because it
123
individually caused a variation of 5.4% though a weak contribution as compared to the
other independent variables. As Sekaran (2009) points out, since also all the
independent variables contribute to overall effect on the dependent variable, they should
be retained on the model. Based on this argument, reward system was retained.
Given that intrapreneurship promotes a firm’s performance (Mokaya,2013), the results
of the study differ with those of the study undertaken byKuhn, Sassmannshausen, and
Zollin (2010) which established that entrepreneurial management does not influence
firm performance but recommended that since the sample used for the study was small,
further research should be undertaken using a lager sample. However the study
corresponds to that of Sijde, Veenker and During (2013) which was conducted on Dutch
firms of different sizes which concluded that the view and the behaviour of management
is important for championing intrapreneurship so that it can thrive in firms.
This type of managerial behaviour is especially needed for intrapreneurship propagation
as well as helping remove obstacles that hinder entrepreneurial behaviour in the firm. A
further research by Nafie, Nimran, Musadieq & Suyadi (2014) also confirms the results
of this study that entrepreneurial management is important for intrapreneurship. Their
study established that management that is supportive through for example provision of
resources increases the implementation of intrapreneurship in firms.
From the results of the study, and as supported by other scholars, management within
SMMEs would be advised to entrench and practice entrepreneurial management
especially in the areas of entrepreneurial management structure, cultivate a high need
for achievement and commit resources to the areas that promote intrapreneurship.
Further advice to the management would be to come up with a reward system that is
accepted and appreciated by employees so that they are encouraged to come up with
innovative and entrepreneurial ideas for promotion of intrapreneurship.

124
Table 4.31: Multiple regression model results for entrepreneurial management
on promotion of intrapreneurship
Model Summary
Mode
l
R R2 Adj.R2 Std.
Error
.644 .414 .393 .291
ANOVA
Model
Sum
of
Squar
es
Df Mean
Square
F Sig.
Regressio
n
6.534 4 1.633 19.2
6
.000
Residual 9.243 109 .085
Total 15.776 113
Coefficients
Model
Unstand.
Coefficients
Stand.
Coefficient
s
t Sig
.
B Std.
Erro
r
Beta
(Consta
nt)
.409 .287 1.42
7
.156
MNA .151 .074 .164 2.04
7
.043
CA
.241 .063 .285 3.81
3
.000
RS
.050 .041 .095 1.23
7
.219
AMS
.401 .078 .416 5.16
3
.000
a) Predictors: Management’s Need for Achievement, Commitment of resources,
Reward System, Entrepreneurial management structure.
b) Dependent variable – Promotion of intrapreneurship.
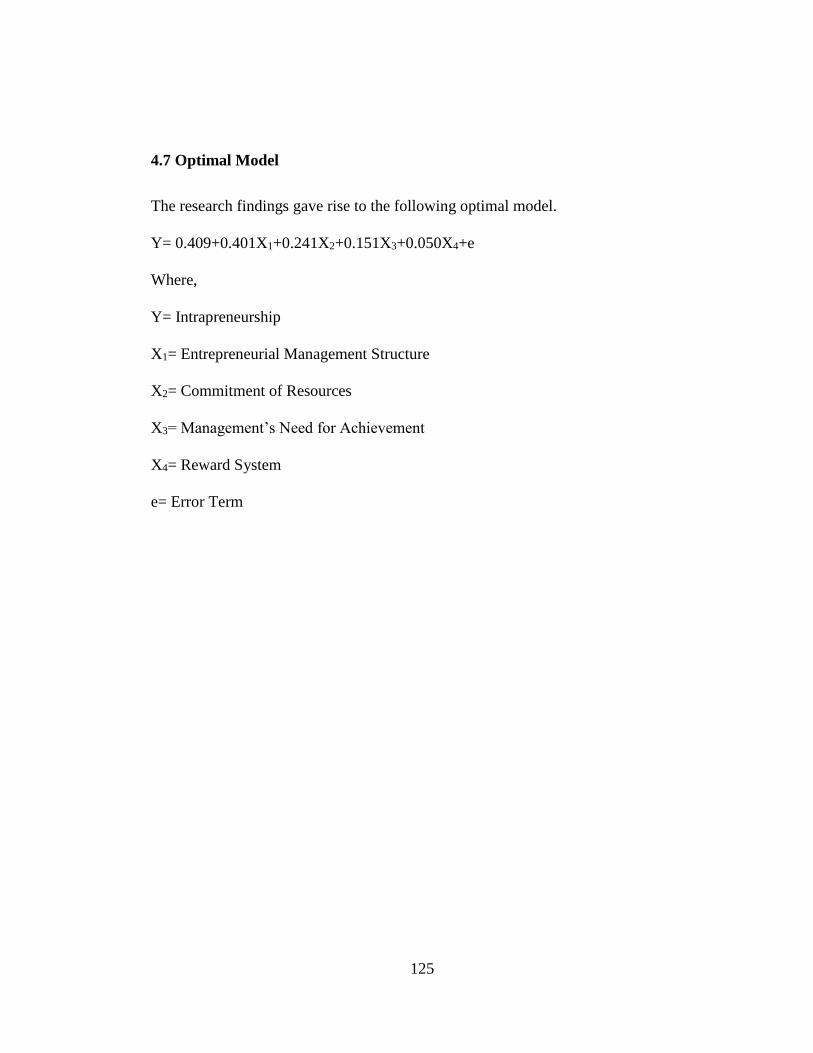
125
4.7 Optimal Model
The research findings gave rise to the following optimal model.
Y= 0.409+0.401X1+0.241X2+0.151X3+0.050X4+e
Where,
Y= Intrapreneurship
X1= Entrepreneurial Management Structure
X2= Commitment of Resources
X3= Management’s Need for Achievement
X4= Reward System
e= Error Term
126
CHAPTER FIVE
SUMMARY, CONCLUSIONS AND RECOMMENDATIONS
5.1 Introduction
This chapter gives a summary of the study findings as per the study objectives,
hypotheses tested and the conceptual framework. The analysis, discussion of the results
based on the analysis were done and this chapter summarizes all these. Further, the
chapter makes conclusions based on the results of the analysis. Recommendations based
on the study on the role of entrepreneurial management on promotion of
intrapreneurship in SMMEs are made in the chapter. Areas for further study to guide
subsequent research are also made.
5.2 Summary of Study Findings
The study sought to find out the role of entrepreneurial management on promotion of
intrapreneurship in SMMEs in Kenya. The independent variables of the study were
commitment of resources, management’s need for achievement, reward system and
entrepreneurial management structure while the independent variable was promotion of
intrapreneurship. Review of the literature showed that SMMEs belong to the SME
sector which contributes immensely to the economic growth of a country and especially
the developing countries like Kenya. But in spite of their importance to the economy,
they are faced with a number of challenges which could partly be addressed by
intrapreneurship.
5.2.1 Commitment of Resources to Promotion of Intrapreneurship in SMMEs
Descriptive data analysis was undertaken on each construct under commitment of
resources before further types of analysis were undertaken. The study established that
SMMEs committed resources to undertaking research and development, upgrading

127
production equipment, training employees and engaging in marketing activities which
promoted intrapreneurship in SMMEs in Kenya. Further tests were done using linear
regression analysis on the relationship between commitment of and promotion of
intrapreneurship in SMMEs in Kenya, which showed that there was a strong
association.
A scatter plot diagram was fitted to further determine the relationship between
commitment of resources and promotion of intrapreneurship in SMMEs. The results
showed a linear positive relationship between commitment of resources and promotion
of SMMEs in Kenya. Thus the implication is that commitment of resources positively
influences intrapreneurship in SMMEs. Based on the statistical results, the researcher
concluded that if SMMEs commit resources to areas such as undertaking research and
development, upgrading production equipment, training employees and engaging in
marketing activities, intrapreneurship will be promoted thus making them
entrepreneurial.
Regression analysis was also done to test the alternative hypothesis that there is a
significant relationship between commitment of resources and promotion of
intrapreneurship in SMMEs in Kenya. The results showed that commitment of resources
highly contributed to intrapreneurship in SMMEs in Kenya. The outcome led to the
acceptance of the alternative hypothesis and to the rejection of the null hypothesis that
commitment of resources does not have significant role on promotion of
intrapreneurship in SMMEs in Kenya.
5.2.2 Management’s Need for Achievement on Promotion of Intrapreneurship In
SMMEs
All the constructs under management’s need for achievement were subjected to
descriptive data analysis. It was found that managers or owner managers within SMMEs
had a high need for achievement as they set achievable goals, they were opportunity
128
seekers, they sought feedback for improvement and portrayed a risk-taking
responsibility, which are some of the characteristics portrayed by individuals who have
a high need for achievement.
The results of the descriptive analysis brought out management’s need for achievement
as having a strong positive role on promotion of intrapreneurship in SMMEs in Kenya.
Further tests using regression analysis were undertaken which returned a strong positive
relationship between management’s need for achievement and intrapreneurship in
SMMEs thus the results were found to be statistically highly significant. Fitting a scatter
plot was used to further explain the relationship between management’s need for
achievement and intrapreneurship in SMMEs.
The results showed a strong linear relationship between management’ need for
achievement and intrapreneurship. The implication therefore is that managements need
for achievement positively influences intrapreneurship in SMMEs in Kenya. The
statistical results led the researcher to conclude that if management in SMMEs
portrayed the management’s need for achievement characteristics such as setting goals,
being opportunity seekers, seeking feedback for improvement and portraying a risk
taking responsibility, intrapreneurship would be promoted in SMMEs in Kenya.
Regression analysis was further used to test the alternative hypothesis that
management’s need for achievement has a significant role on promotion of
intrapreneurship in SMMEs in Kenya. The result was that management’ need for
achievement highly contributed to intrapreneurship which led to the acceptance of the
alternative hypothesis and to the rejection of the null hypothesis that management’s
need for achievement does not have a significant role on promotion of intrapreneurship
in SMMEs in Kenya.
129
5.2.3 Reward System on Promotion of Intrapreneurship in SMMEs
Further the study had sought to establish the role of reward system on promotion of
intrapreneurship in SMMEs under four constructs which were as well subjected to
descriptive data analysis. It was found that the managers or owner managers valued
promotion, monetary reward, shareholding and grants for employee’s individual
projects within the firms, as some of the rewards offered to the employees. The scenario
promoted intrapreneurship in SMMEs.
The independent variable reward system on promotion of intrapreneurship was
subjected regression analysis to establish the magnitude and the direction of the
relationship. The relationship was found to be a weak but statistically positive
relationship. When a scatter plot was used to further establish the relationship between
reward system and promotion of intrapreneurship in SMMEs, the result was that there
was a positive linear relationship.
This implies that reward system plays a positive role on promotion of intrapreneurship
in SMMEs in Kenya. Based on the statistical results, the study concluded that if
management in SMMEs rewarded employees for their performance and idea
contribution, then intrapreneurship would be promoted in the firms. Management in
SMMEs should therefore strive to entrench a form of reward system in their firms.
Still regression analysis was used to test the alternative hypothesis that reward system
has a significant role on promotion of intrapreneurship in SMMEs in Kenya. The results
returned a positive significant contribution of reward system to promotion of
intrapreneurship. The statistical results led to the acceptance of the alternative
hypothesis and to the rejection of the null hypothesis that reward system does not have a
significant role on promotion of intrapreneurship in SMMEs in Kenya.
130
5.2.4 Entrepreneurial management structure on Promotion of Intrapreneurship in
SMMEs
Entrepreneurial management structure was the fourth independent variable that was as
well considered under the four constructs for promotion of intrapreneurship in SMMEs.
After subjecting each of the constructs to descriptive data analysis, flexible
entrepreneurial management structure was found to be weak in the SMMES. Flat levels
of management, open communication channels and inclusive decision making were
found to be embedded in the SMMEs, thus being promoters of intrapreneurship in the
firms.
Entrepreneurial management structure and its role on promotion of intrapreneurship in
SMMEs in Kenya, was subjected to further tests using regression analysis to bring out
the relationship between the two variables. The regression analysis established the
magnitude and the direction of the effect of entrepreneurial management structure on
promotion of intrapreneurship in SMMEs in Kenya. The results returned a statistically
highsignificant positive relationship between entrepreneurial management structure and
promotion of intrapreneurship.
In addition, a scatter plot was fitted to still further determine the relationship between
entrepreneurial management structure and promotion of intrapreneurship. The results
showed a strong linear relationship thus implying that putting in place entrepreneurial
management structure positively influences promotion of intrapreneurship in SMMEs in
Kenya. The statistical results led the researcher to conclude that if management in
SMMEs put in place entrepreneurial management structures, intrapreneurship in
SMMEs would be enhanced.
The alternative hypothesis that entrepreneurial management structure has a positive
significant role on promotion of intrapreneurship in SMMEs in Kenya was tested using
regression analysis. The results showed that entrepreneurial management structure had a
131
high contribution to SMMEs which led to the acceptance of the alternative hypothesis
and to the rejection of the null hypothesis that entrepreneurial management structure
does not have a positive significant role on promotion of intrapreneurship in SMMEs in
Kenya.
5.2.5 Promotion of Intrapreneurship in SMMEs in Kenya
Descriptive analysis revealed that there was promotion of intrapreneurship in SMMEs
in Kenya as a result of the four combined independent variables under entrepreneurial
management. The firms portrayed innovativeness, pro-activeness and competitive
aggressiveness thus implying presence of intrapreneurship. A multiple regression
analysis was undertaken to test the magnitude and the direction of effect of
entrepreneurial management on promotion of intrapreneurship in SMMEs in Kenya.
This turned a positive linear relationship.
The regression analysis on the overall model indicated that the relationship between
entrepreneurial management under commitment of resources, management’s need for
achievement, reward system and entrepreneurial management structure in
intrapreneurship in SMMEs in Kenya had a high significant contribution. The
independent variables were therefore found to contribute and explain a significant
variation in promotion of intrapreneurship in the SMMEs in Kenya. However, reward
system when combined with the other three independent variables under entrepreneurial
management was found to be insignificant. Reward system was however retained in the
revised model since it was part of the overall entrepreneurial management’s
contribution to promotion of intrapreneurship in SMMEs. These results led to the
conclusion that entrepreneurial management was important for SMMEs to maintain the
entrepreneurial spirit.
132
Management within SMMEs in Kenya would portray entrepreneurial management for
promotion of intrapreneurship by committing resources to areas crucial to promoting
intrapreneurship, cultivating a high need for achievement, and putting in place
entrepreneurial management structures appropriate for intrapreneurship. A Reward
system that is accepted by employees should also be entrenched in the SMMEs given its
importance as supported by past studies. The implication is that SMMEs seeking to be
entrepreneurial would benefit immensely from engaging these variables in their journey
to promoting intrapreneurship.
5.2.6 Contribution of the Study to Theory
The resource based theory stresses the importance of resources to organizations. It is not
only the availability of these resources but also the utilization of these resources that is
of benefit to firms. The study brought out the need for management to commit resources
to areas that enhance performance in pursuit of attaining the organizational goals.
The McClelland’s high need for achievement theory was used in this study to anchor
management’s high need for achievement in pursuit of promotion of intrapreneurship.
The result was that managers need especially to set goals, seek new opportunities, seek
feedback so that they can improve their operations, as well as being risk takers. The risk
should be moderate to provide enough challenge and not too high for it to be
discouraging. This scenario validates the need for achievement theory.
Herzberg’s motivation theory was used in this study to explain rewards extended to the
employees for intrapreneurship to thrive. The study established that management in
SMMEs value rewards, therefore for firms to promote intrapreneurship rewards should
be programmed for motivation. The study therefore supports the theory. This theory
goes hand in hand in with the expectancy theory of motivation, which in a nutshell
states that employees expect compensation for hard work, and that the compensation

133
should match the performance. The study brought out the importance of rewarding
employees for ideas concerning intrapreneurship.
Structural contingency theory was used to support and explain entrepreneurial
management structure. The theory explained that entrepreneurial management structure
should be adaptive to the environment in which the organization is operating under. The
study clearly brought out this scenario and recommended that entrepreneurial
management structure should be contingent on the situation which the firm is in. Of
particular, for intrapreneurship to thrive, management should employ flatter structures
which enhance employees’ participation.
5.2.7 Contribution of the Study to Methodology
The study used both simple and multiple linear regression model which showed a linear
relationship between the dependent and the independent variables. Some assumptions of
linear regression are that the data under observation portrays normality distribution, is
not multicollinear and that the dependent and the independent variables have a linear
relationship. The study established these therefore contributing to entrenchment of the
methodology.
5.2.8 Contribution of the Study to the Existing Knowledge
The study focussed on the role of entrepreneurial management on promotion of
intrapreneurship in SMMEs in Kenya. The outcome was that entrepreneurial
management has a significant influence on promotion of intrapreneurship in the
SMMEs. Entrepreneur owners or managers in these firms should therefore practise
entrepreneurial management for entrepreneurial enhancement. Further studies can also
be undertaken linking entrepreneurial management to other sectors.

134
5.3 Conclusion
The study made several conclusions based on the research findings. Data analysis was
organized as per the research objectives and hypotheses which were statistically tested.
Under the research objectives, the role of entrepreneurial management on promotion of
intrapreneurship in SMMEs in Kenya was established, under the independent variables
commitment of resources, management’s need for achievement, reward system and
entrepreneurial management structure.
The first objective was to determine the role of commitment of resources on promotion
of intrapreneurship in SMMEs in Kenya. The study concluded that commitment of
resources was statistically significant to the promotion of intrapreneurship in SMMEs in
Kenya. This commitment was in the areas of undertaking research and development,
upgrading production equipment, training employees and engaging in marketing
activities. It was therefore concluded that management in SMMEs should commit
resources to these areas to promote intrapreneurship.
The second objective was to examine the role of management’s need for achievement
on promotion of intrapreneurship in SMMEs in Kenya. The results of the study
statistically concluded that management’s need for achievement positively influenced
intrapreneurship in SMMEs. Management’s need for achievement in areas of setting
goals, opportunity seeking, seeking feedback for improvement and having a risk taking
propensity promotes intrapreneurship in SMMEs. It was therefore concluded that for
management in SMMEs in Kenya to should portray need for achievement to so as to
enhance intrapreneurship.
The third objective was to assess the role of reward system on promotion of
intrapreneurship in SMMEs in Kenya. The influence of reward system on
intrapreneurship in SMMEs in Kenya was statistically concluded to be significantly
positive. This was in areas of promotion, monetary reward, shareholding and grants for
135
employees’ individual projects within the firm. It was therefore concluded that for
SMMEs to be entrepreneurial and promote intrapreneurship, management should
reward employees for improved performance and contribution of new ideas.
The fourth objective was to establish the role of entrepreneurial management structure
on promotion of intrapreneurship in SMMEs in Kenya. Statistically, the study
concluded that entrepreneurial management structure significantly influenced promotion
of intrapreneurship in SMMEs in Kenya. The areas looked at are flat levels of
management, open communication channels, flexible management structure and
inclusive decision making.
Descriptive statistics however showed that SMMEs did not fully entrench flat levels of
management but were neutral. Flexible management structure was also not strongly
entrenched as a promoter of intrapreneurship in SMMEs in Kenya. Open
communication channels and inclusive decision making on the other hand were found to
be strong promoters of intrapreneurship in SMMEs in Kenya. The conclusion was that
SMMEs in Kenya should put in place favourable entrepreneurial management structures
especially in the areas of management levels to make them flat, open communication
channels and include employees in decision making so that intrapreneurship can be
promoted, and at the same time strive to be flexible enough to allow employees’
initiatives, which support intrapreneurship.
It was therefore concluded that entrepreneurial management under the independent
variables namely commitment of resources, management’s need for achievement and
entrepreneurial management structure significantly promoted intrapreneurship in
SMMEs in Kenya. The fourth independent variable, reward system should be
strengthened by providing the appropriate rewards acceptable to the employees.
Management in the SMMEs should therefore practice entrepreneurial management as
opposed to administrative management, for promotion of intrapreneurship.
136
5.4 Recommendation
Based on the results of the study as per the objectives and hypotheses, recommendations
are made to the managers/owner managers of the SMMEs that they should practice
more of entrepreneurial management to enhance intrapreneurship in the SMMEs. They
should commit resources to the areas of undertaking research and development,
upgrading production equipment, training of employees and engaging in marketing
activities for promotion of intrapreneurship. New production equipment is essential in
enhancing innovativeness of the firms especially in production of new and improved
products that are competitive in the global market.
Managers and owner managers of SMMEs should also portray a high need for
achievement which is a motivator for high performance. This is through setting
achievable goals that are not discouraging. The high need for achievement also ensures
that managers/owner managers seek new opportunities, seek feedback for improvement
and have a propensity for risk taking which are all essential for promotion of
intrapreneurship.
It is also important that managers/owner managers in SMMEs employ reward systems
which motivate employees to perform better and be entrepreneurial within the firm.
Apart from financial rewards, other rewards which employees value should be
incorporated for example promotion and shareholding. Motivated employees come up
with new ideas which promote intrapreneurship in the SMMEs.
The way management constitutes its structure is crucial in encouraging intrapreneurship
in SMMEs. An entrepreneurial management structure that is flat, organic, not complex
and controls that are not too tight is a good promoter of intrapreneurship as it gives
employees inclusion in decision making and flexibility to explore new ideas. Managers
or entrepreneur manager owners should therefore engage this type of entrepreneurial
management structure so as to experience intrapreneurship in their firms.
137
SMMEs are important to the economy of Kenya as they affect the economic growth
through the gross domestic product. Their value addition is a crucial factor in marketing
of their products both locally and internationally, which helps in maximization of their
earnings. They are also part of the larger SME sector which is deemed to be the engine
of economic growth especially in developing countries, and for provision of
employment. Intrapreneurship which can be promoted by entrepreneurial management
can enhance the SMMEs performance, out of this realization, as a policy the
Government of Kenya should include entrepreneurial management as part of the
training that is offered to entrepreneur owners in this sector, as well as the nascent
entrepreneurs who aspire to be future entrepreneurs. This can be achieved through
inculcation of entrepreneurial management into the entrepreneurship education offered
in colleges and universities.
5.5 Areas for Further Research
The study looked at the role of entrepreneurial management in promotion of
intrapreneurship in SMMEs in Kenya, under independent variables commitment of
resources, management’s need for achievement, reward system and entrepreneurial
management structure. Given the crucial importance of the SMMEs to the growth of the
economy of Kenya, more areas are open for further research which will lead to the
strengthening of the sector.
The SME sector in general is faced with a very high mortality rate which diminishes the
productivity and the attractiveness of the sector. Further research can therefore be on
how entrepreneurial management can lead to sustainability of SMMEs to maturity and
beyond. The research did not use a moderator variable and further research can be
undertaken on including a moderating variable to the role of entrepreneurial
management on promotion of intrapreneurship. The role of entrepreneurial management
on promotion of intrapreneurship can be studied on other SME sectors as well. Other
constructs under entrepreneurial management can be studied as well.
138
The study directly linked entrepreneurial management to intrapreneurship. Further study
can be undertaken introducing a moderating variable so as to check the strength of the
relationship between the independent and the dependent variable. The research findings
showed that entrepreneurial management accounted for only 41.4% of promotion of
intrapreneurship in SMMEs in Kenya. Studies on other variables that promote
intrapreneurship in SMMEs in Kenya can therefore be taken.
139
REFERENCES
Abrams, D. R. (2007). Introduction to Regression. Princeton university Library,
Data and Statistical Services. Retrieved from
http://[email protected].
Achakul, C. & Yolles, M. (2013).Intrinsic and Extrinsic Motivation in Personality:
Assessing Knowledge Profiling and the Work Preference Inventory in a
Thai Population. Journal of organizational transformation & social
change, 10(3), 196–217
Aktan, B. & Bulut, C. (2008). Financial Performance Impacts of Corporate
Entrepreneurship In Emerging Markets: A case of Turkey. European
Journal of Economics, Finance and Administrative Studies. 12 (2008)
Aguinis, H. & Kraiger, K. (2009). Benefits of Training and Development for
Individuals and Teams, Organizations, and Society. The Annual Review
of Psychology, 60, 451–74
Amar, A. D. (2004) "Motivating knowledge workers to innovate: a model
integrating motivation dynamics and antecedents". European Journal of
Innovation Management, 7 (2), 89 – 100.
Antoncic, J. A. & Antoncic, B. (2011). Employee Satisfaction, Intrapreneurship and
Firm Growth: A Model. Industrial Management and Data Systems, 3(4),
589 - 607
Argawal, R. & Helfat, C. E. (2009).Strategic Renewal of Organizations.
Organization Science, 20 (2), 281–293
Armstrong, M. (2007).Employee Reward Management and Practice, (2nd Ed).
London and Philadelphia: Kogan Page Limited
140
Azami, S. (2013). Intrapreneurship-“An Exigent Employment” International
Journal of Scientific &Technology Research, 2(4), 194-198.
Banerjee, A. & Chaudhury, S. (2010). Statistics without tears: Populations and
samples. Industrial Psychiatry Journal, 19(1), 60–65.
Bau, F. & Dowling, M. (2007). Incentive Systems: An Empirical Study of Reward
and Incentive systems in German entrepreneurial firms.SBR, 59, 160-
175.
Barney, J. (1991). Firm Resources and Sustained Competitive Advantage. Journal of
Management, 17(1), 99-120.
Beck, T., Demirguc-Kunt, A. & Levine, R. (2005). SMEs, Growth, and Poverty:
Cross-Country Evidence. Geneva:World bank
Berisha, G. & Pula, J. S. (2015). Defining Small and Medium Enterprises: a critical
review. Academic Journal of Business, Administration, Law and Social
Sciences, 1(1), 17-28.
Beyene, A. (2002). Enhancing the Competitiveness and Productivity of Small and
Medium Scale Enterprises (SMEs) in Africa: An Analysis of Differential
Roles of National Governments Through Improved Support Services.
Africa Development, 27(3), 130–156.
Boone, L. E. & Kurtz, D. L. (2015). Contemporary Business, (16thEd). John Wiley
& Sons, Inc. New York.
Botha, M. & Nyanjom, M. D. O. (2011). Corporate entrepreneurship Orientation
and the Pursuit of Innovating Opportunities in Botswana. Acta
Commercii 2011, PP 30-44.
141
Bowen, R. M (2012). Research and Development, Innovation and the Science and
Engineering Workforce. USA: The National Science Board.
Bridoux, F (n.d). A resource-based approach to performance and competition: An
Overview of the Connections between Resources and Competition.
Retrieved fromhttps://www.uclouvain.be/cps/ucl/doc/iag
Bwisa, (2010). Towards the Improvement of Entrepreneurship Education in Africa.
Conference Proceedings of the JKUAT Scientific, Technological and
Innovation Nairobi, Kenya.
Burns, P. (2011). Entrepreneurship and Small Business: Start-Up, Growth and
Maturity, 3rd Ed., New York, USA: Paulgrave Macmillan.
Casson, M., Yeung, B., Basu, A. & Wadeson, N. (2006).The Oxford Handbook of
Entrepreneurship. Oxford University Press, Inc. New York, United
States.
Cargan, L. (2007). Doing Social Research. Rowman & Littlefield Publishers Inc.
Maryland, USA.
Chang, S. J., Witteloostuijn, A. &Eden, L. (2010). Common Method Variance in
International Business Research. Journal of International Business
Studies, 41, 178–184
Chapman, A. (2009). David C MCclelland's Motivational Needs Theory. Retried
from http://www.businessballs.com › leadership/management.
Chell, E. & Ozkan, M. K. (2014).Handbook of Research on Small Business and
Entrepreneurship. Cheltenham, UK: Edward Elgar Publishing Ltd.

142
Cherry, K. (2015). Introduction to Research Methods. Theory and Hypothesis.
Retrieved from http://www.psychology.about.com.
Cieslinska, K. (2007). The Basic Roles of Manager in Business Organization.
Retrieved from http://www.jard.edu.pl.
CIMA, (2010). The Global Manufacturing Sector: Current Issues. Retrieved from
http://www.cimaglobal.com/Documents
Cohen, L., Manion, L. & Morrison, K. (2007).Research Methods in Education, (6th
Ed). Routledge Taylor & Francis Group, London and New York.
Collins, C. J., Hanges, P. J. & Locke, E. A. (2004). The Relationship of
Achievement Motivation to Entrepreneurial Behavior: A Meta-Analysis.
Human Performance, 17: (1), 95-117,
Cook, R., Campbell, D. & Kelly, C. (2012). Survival Rates of New Firms: An
Exploratory Study. Small Business Institute Journal 8(2), 35-42
Covin, J. G. & Miles, M.P. (1999). Corporate Entrepreneurship and the Pursuit of
Competitive Advantage. Entrepreneurship: Theory and Practice, 23(4),
47-63.
Covin, J. G. & Slevin, D.P. (1991). A Conceptual Model of Entrepreneurship as
Firm Behavior. Entrepreneurship: Theory and Practice, 16 (1), 7-25.
Dess, G. D., Lumpkin, G.T. & McGee, J.E. (1999). Linking corporate
entrepreneurship to strategy, structure and process: suggested research
directions. Entrepreneurship: Theory and Practice, 23(3), 85-102.
Dermer, J. (2001). The Interrelationship of Intrinsic and Extrinsic Motivation.
Academy of Management Journal.

143
Diefenbach, F. B. (2011).Entrepreneurship in the Public Sector: When Middle
Managers Create Public Value, 1st Edition. Gabler Verlag, Germany.
Dizgah, M. R., Gilaninia, S., Alipour, H. R. & Asgari, A. (2011). High Performance
Human Resource and Corporate Entrepreneurship: the Mediating Role
of Organizations Citizenship Behavior and Procedure Justice. Australian
Journal of Basic and Applied Sciences, 5(3), 492-499.
Donaldison, L. (2013). Structural Contingency Theory/Information Processing
Theory. Retrieved from http://www.oxfordbibliographies.com/view.
Donaldson, L. (2005). Studying Organization: Theory and Method. “The Normal
Science of Structural Contingency Theory”. Sage Publications Ltd,
London
Drew, W. & Rosenthal, R. (2003). Quantifying construct validity: Two simple
measures. Journal of Personality and Social Psychology 84(3), 608-618.
Drost, E. (2011). Validity and Reliability in Social Science Research. Education
Research and Perspectives, Vol.38, No.
Duarte, N. (2011). Innovation, Risk and Proactivity: Are Firms Following These
Strategies? WSEAS Transactions on Business and Economics, 8(3),110-
1200.
Edinburg Group, (2014). Growing Global Economy Through SMEs. Retrieved from
http://www.edinburgh-group.org .
Elango, B. (2003) Does Excess Resources Influence Entry Mode Decisions of
Firms: A Resource Imbalance Perspective. Journal of Transnational
Management Development, 8(3), 47-69.
144
Elasrag, H. (2013). The Role of Small and Medium-Sized Enterprises in the
Industrial Development of Egypt. Ministry of Industry & Foreign Trade,
Arab Republic of Egypt.
Elahi, M & Dehdashti, M. (2011).Classification of Researches and Evolving a
Consolidating Typology of Management Studies. Annual Conference on
Innovations in Business &Management London, UK, 2011
European Commission, (2006). Community Framework for State Aid for Research
and Development and Innovation. Official Journal of the European
Union, (2006/C 323/01).
Ezennaya, N. P. (2011). Employee Participation in Decision Making and its Impact
on Productivity: An Appraisal of Government Printing Press and Two
Other Private Publishing Firms in Enugu. Retrieved from
http://www.unn.edu.ng/publications/file.
Fayolle, A. (2007). Contextual Perspectives. Handbook of Research in
Entrepreneurship Education, Volume 2., Inc. Northampton,
Massachusetts, USA: Edward Elgar Publishing.
Finch, K. Hansen, C. & Alexander, K. (2010). Internal communication is no Rocket
Science: A Manager’s Guide to Communicating with Employees. Crown,
Nova Scotia. Retrieved from
http//www.novascotia.ca/cns/pubs/ItsNotRocketScience
Fini, R., Ginmaldi, R., Marzochi, G. L., & Sobrero, M. (2012). The determinants of
corporate entrepreneurship intention within small and newly established
firms. Baylor University.
145
Fjose, S., Grünfeld, L. A. & Green, C. (2010). SMEs and growth in Sub-Saharan
Africa: Identifying SME roles and obstacles to SME growth. MENON
Business Economics, MENON-publication no. 14
Fogleman, S. L. & McCorkle, D. (2009).Human Resource Management: Employee
Compensation Guide. Agrilife Extension , Texas A&M System.
Frost, J. (2016). Understanding t-Tests: t-values and t-distributions. Retrieved from
http://blog.minitab.com/blog/adventures-in-statistics/understanding-t-
tests-t-values
Frost, J. (2013). How to Interpret Regression Analysis Results: P-values and
Coefficients. Retrieved from http://www.blog.minitab.com/.../how-to-
interpret-regression-analysis-results-p-value.
Gathogo, G. M. (2013). An analysis of factors affecting the performance of small
and medium enterprises in the manufacturing sector in Kenya (Case of
selected firms in Thika Municipality). Kenyatta University Repository
Gautam, V. & Verma, V. (1997). Corporate Entrepreneurship: Changing
Perspectives. Journal of Entrepreneurship, 6, 233
Gibson, R. (2013). Strategic Renewal in the Business Model. Retrieved from
http://www.innovationexcellence.com
Gottschalg, O. & Zollo, M. (2007). Interest Alignment and Competitive Advantage.
Academy of Management Review 32(2), 418–431
Guitard, P. H. (2007). SME Trade Finance- Review of Facilities Available in Kenya.
Financial Sector Deepening (FSD) Kenya.
146
Gumbo, M. T. (2014). An Action Research Pilot Study on the Integration of
Indigenous Technology in Technology Education. Mediterranean
Journal of Social Sciences, 5 (10). MCSER Publishing, Rome-Italy
Gupta, S. K. (2012). The relevance of confidence interval and P-value in inferential
statistics. Indian Journal of Pharmacology. 44(1), 143–144
Gürbüz, G. & Aykol, S. (2009).Entrepreneurial Management, Entrepreneurial
Orientation And Turkish Small Firm Growth. Management Research
News, 32(4), 321 - 336
Hayton, J. C. & Kelley, D. J. (2006). A Competency-Based Framework for
Promoting Corporate Entrepreneurship. Human Resource Management
Fall, 45(3), 407–427.Wiley Periodicals, Inc.
Hawkins, R. & Davis, C.H. (2012). Innovation and Experience Goods: A Critical
Appraisal of a Missing Dimension in Innovation Theory. Prometheus:
Critical Studies in Innovation. 30(3), 2012.
Hersey, F. F., Blanchard, V. & Yetton, (2014).The Influence of Constraints on
Organizations. Value based management.net.
Hisrich, R. D., Peters, M. P. & Shepherd, D. A. (2010).Entrepreneurship(8th Ed).
McGraw-Hill/Irwin, London, United Kingdom.
Hong, T. T. & Waheed, A. (2011). Herzberg's Motivation-Hygiene Theory and Job
Satisfaction in the Malaysian Retail sector: The Mediating Effect of
Love of Money. Asian Academy of Management Journal,16(1), 73–94.
Holmes, N. Carvalho, G. & Powers, M. (2010).Reward Systems & Incentives.
Human Resources & Labor Management August 2nd, 2010

147
Hornsby, J.S., Kuratko, D.F. & Montagno, R.V. (1999). Perception of Internal
Factors for Corporate Entrepreneurship: A Comparison of Canadian and
US managers. Entrepreneurship: Theory & Practice, 24(2), 9-24.
Hortoványi, L. (2012). Entrepreneurial Management. AULA KiadóKft, Corvinus
University of Budapest, Hungary.
Howard, L. W. & Dougherty, T. W. (2004).Compensation & Benefits Review:
Alternative Reward Strategies and Employee Reactions. Sage
Publications. Retrieved from http://cbr.sagepub.com/content/36/1/41
IFAC, (2010).The Role of Small and Medium Practices in Providing Business
Support to Small-and Medium-Sized Enterprises. Information Paper
April 2010, New York, USA.
ILO, (2007).Assessing the Enabling Environment for Women in Growth Enterprises.
An AfDB/ILO Integrated Framework Assessment Guide.ILO Geneva.
Irawanto, D. W. (2015). Employee Participation in Decision-Making: Evidence
From a State Owned Enterprise in Indonesia. Management, 20(1), 159-
172
Islam, J & Hu, H. (2012). A Review of Literature on Contingency Theory in
Managerial Accounting. African Journal of Business Management.6(15),
5159-5164.
Jackal, M. L. (2010). Corporate Entrepreneurship.Institut Pro Technologicks,
Prague. Retrieved from Kpsr.rse.cz
Jakobsen, T. G. (2013). Theory of Science- What is Positivism? Popular Social
Science: Bridging the Gap. Retrieved
fromhttp://www.popularsocialscience.com.
148
Jong, J.P.J., Parker. S. K., Wennekers, S. &Wu. C. (2011).Corporate
Entrepreneurship at the Individual Level: Measurement and
Determinants. Scientific Analysis of Entrepreneurship and SMEs. EIM
Research Reports, Netherlands. Retrieved from
http://www.entrepreneurship-sme.eu.
Joshi, H. (2012). Multicollinearity Diagnostics in Statistical Modeling and
Remedies to Deal With it Using SAS. Retrieved from
http://www.cytel.com.
Joy, C. (2014). Descriptive Method. Retrieved from
https://prezi.com/3rdptjum29u9/descriptive-method.
Kahkha, A.O., Kahrazeh, A., Armesh, H. (2014). Corporate Entrepreneurship and
Firm Performance: Important Role of Small and Medium Enterprise.
International Journal of Academic Research in Business and Social
Sciences, 4(6), 8-25.
KAM, (2015). Kenya Association of Manufacturers and Exporters Directory.
Nairobi: KAM.
KAM, (2012).The KAM Industrial Business Agenda: Proposals for the Incoming
Government. Retrieved from http://www.kam.co.ke
Karacaoglu, K.,Bayrakdarog, A. &San, F. B. (2013).The Impact of Corporate
Entrepreneurship on Firms’ Financial Performance: Evidence from
Istanbul Stock Exchange Firms. International Business Research, 6(1),
2013.
Kasiulevičius, V., Šapoka, V. & Filipavičiūtė, R. (2006). Sample Size Calculation in
Epidemiological Studies. Gerontologija.7(4), 225–231
149
Katua, N. T. (2014). The Role of SMEs in Employment Creation and Economic
Growth in Selected Countries. International Journal of Education and
Research 2(12)
Kauffman, E. M. (2006). Compensation and Rewards. Retrieved from
www.entrepreneurship.org/resourcecenter.
Kennedy, L. J. (2013). Manufacturing Future Economic Growth and Job Creation. ,
USA: World Economic Forum
Kifle, Y. (2016). Small and Medium-Size Companies Key to American
Manufacturing Sector’s Success. Retrieved
fromhttps://www.allbusiness.com/small-and-medium-size-companies.
Kimberlin, C. L. & Winterstein, A. G. (2008). Validity and Reliability of
Measurement Instruments Used in Research. American Journal of
Health-System Pharmacists, 65, 2008
Kinkel, S., Lay, G., & Wengel, J. ( 2005). Innovation: More than Research and
Development. Bulletins of the Manufacturing Performance Survey, No.
33. Retrieved fromhttp/:www.isi.fraunhofer.de/isi-wAssets/docs/i/en/pi-
mitteilungen.../pi33e.pdf
KIPPRA, (2014).Kenya Economic Report 2014: Navigating Global Challenges
While Exploiting Opportunities for Sustainable Growth. Nairobi:
KIPPRA.
KIPPRA, (2013).Kenya Economic Report 2013: Creating an Enabling Environment
for Stimulating Investment for Competitive and Sustainable Counties.
Nairobi: KIPPRA.
150
KPMG International, (2015).China Outlook 2015. Retrieved
fromhttp://www.kpmg.com
Knupfer, N. N. & McLellan, H. (2001). Descriptive Research Methodologies. The
Handbook of Research for Educational Communications and
Technology, AECT, Bloomington, UK.
Kothari, C. R. (2004). Research Methodology: Methods and Techniques. (2nd
revised Ed). New Delhi, India: New Age International (P) Ltd.
Korb, K. A. (2012). Conducting Educational Research. Reliability of Instruments.
Retrieved from http://www.korbedpsych.com
Kuhn, B, Sassmannshausen, S. P. & Zollin, R. (2010). “Entrepreneurial
Management” As a Strategic Choice in Firm Behavior: Linking It with
Performance. Conference Proceedings of the HTSF in Twente, The
Netherlands: HTSF.
Kuratko, D. F., Ireland, R. D., Covin, J. G. & Hornsby, J. S. (2005). A Model of
Middle-Level Managers’ Entrepreneurial Behavior. Entrepreneurship:
Theory &Practice, Baylor: Baylor University.
Kuratko, D. (2014). Entrepreneurship: Theory, Process, and Practice, (9th Ed).
South-Western, USA:. Cengage Learning.
Kuratko, D.F. (2003).Entrepreneurship Education: Emerging Trends and
Challenges for The21st Century. 2003 Coleman Foundation White Paper
Series for the U.S. Association of Small Business and Entrepreneurship
Kolokavic, M., Sisek, B., & Milovanovic, B. M. (n.d).Influence of Corporate
Entrepreneurship on the Performance of Croatian Large Companies.
Retrieved from. https://bib.irb.hr.
151
Kraus, S., Harms, R., & Fink, M. (2009). Entrepreneurial marketing: moving beyond
marketing in new ventures. International Journal of Entrepreneurship
and Innovation Management, 11(1), 19–34.
Krejcie, R. V. & Morgan, D. W. (1970). Determining Sample Size for Research
Activities. Educational and Psychological Measurement1970, 30, 607-
610.
Kriticos, A., Fossen, F. & Calliendo, M., (2008).The Impact of Risk Attitudes on
Entrepreneurial Survival.IZA Discussion Paper No. 3525. Retrieved
from http://www.ftp.iza.org/dp3525.pdf
Labaree, R. (2013). Organizing Your Social Sciences Research Paper: Theoretical
Framework. Research Guides, University of South Carolina Libraries.
Retrieved fromhttp://libguides.usc.edu/writingguide.
Laosirihongthong T., Prajogo, D. I & Adebanjo, D. (2014).The Relationships
Between Firm’s Strategy, Resources and Innovation Performance:
Resources-Based View Perspective. Planning & Control: The
Management of Operations, (25)15, 1231-1246.
Latham, B. (2007). Sampling: What is it? Quantitative Research Methods. ENGL
5377, Spring 2007.Retrieved fromwebpages.acs.ttu.edu/rlatham.
Lawson, M. (2014).The Impact of Risk Propensity on Corporate Entrepreneurhip.
Unpublished Research Project, Gordon Institute of Business Science,
University of Pretoria, South Africa.
Leon, A. C., Davis, L. L, & Kraemer, H. C. (2011). Journal of Psychiatric Research.
45(5), 626-629.
152
León, I. M. M. & García, J. A. M. (2011) "The Influence of Organizational Structure
on Organizational Learning" .International Journal of Manpower,
32(5/6), 537 – 567
Levinson, M. (2015).U.S. Manufacturing in International Perspective.
Congregational Research Service: Informing the Legislative Debate
Since 1914. Retrieved from https://fas.org/sgp/crs/misc/R42135.pdf
Leweling, T. A. (2007). Extending Organizational Contingency Theory to Team
Performance – An Information Processing and Knowledge Flows
Perspective. Dissertation , Naval Postgraduate School Monterey,
California
Lichtenstein, J. (2014). Demographic Characteristics of Business Owners.
Advocacy:The Voice of Small Business in Government. Issue Brief
Number 2. Retrieved from http://www.sba.gov/advocacy.
Liu, C. & Wang, H. (2012). The Mediating Role of Entrepreneurial Efficiency on
the Relationship between Human Resource Management and Corporate
Entrepreneurship. Advances in Computer Science and Education, 140,
359-364.
Long, N. (2016). Definition of Structural Contingency Theory. Retrieved from
http://www.oxfordindex.oup.com/view.
Loy, A. Follet, L. & Hofmann, H. (2014).Variations of Q-Q Plots {The Power of our
Eyes! Retrieved from https://arxiv.org/pdf/1503.02098.
153
Lotz, H, M. & Merwe, S. P. (2013). An assessment of selected organisational-based
factors on the perceived success of agribusinesses: a corporate
entrepreneurship perspective. Southern African Business Review 17(3),
187-217
Lunenburg, F. C. (2011). Expectancy Theory of Motivation: Motivating by Altering
Expectations: International Journal of Management, Business, and
Administration, 15(1), 1-6.
Maes. J.(2003). The Search for Corporate Entrepreneurship: A Clarification of the
Concept and its Measures. Katholieke Universiteit, Naamsestraat, 69
Marcati, A., Guido, G. & Peluso, A. M. (2008). The Role of SME
Entrepreneurs’Innovativeness and Personality in the Adoption of
Innovations. Research Policy, 37(9), 1579–1590.
Markovska, M. (2008). Intrapreneurship – Way of Work in Organizations for
Improvement of Working Quality. 5th International Scientific
Conference, Business and Management, 16-17 May 2008, Vilnius,
Lithuania.
Marvel, M. R., Griffin, A., Hebda, J., & Vojak, B. (2007). Examining the Technical
Corporate Entrepreneurs’ Motivation: Voices from the Field.
Entrepreneurship: Theory &Practice 31 (5), 753-768.Baylor University
Medium Enterprises: Global Perspectives. Busisness Science Reference,
USA.International Finance Corporation (IFC), (2014). SMEs and
Women-owned SMEs in Mongolia: Market Research Study. Retrieved
from http://www.ifc.org/wps/wcm/connect.
154
Mensah, A. A. (Strategic Resources and Performance of Rural SMEs). International
Journal of Business and Social Research (IJBSR), 3(4), 106
Okhomina, D. (2010). Entrepreneurial Orientation and Psychological Traits: The
Moderating Influence of Supportive Environment. Journal of Behavioral
Studies in Business; 3, 1-6.
McDonald, J.H. (2014. Handbook of Biological Statistics (3rd ed.). Baltimore:
Sparky House Publishing,
McGlone, C. (2014). Corporate Entrepreneurship: An Investigation into Factors
which Contribute to Entrepreneurial Activities within the Financial
Services Industry. Dissertation Submitted to the National College of
Ireland. Retrieved from
http:/www.trap.ncirl.ie/1751/1/catherinemcglone.pdf
Mitchel, L. (2011). Overcoming the Gender Gap: Women Entrepreneurs as
Economic Drivers. Ewing Marion Kauffman Foundation
Mugenda, A. (2008). Social Sciences Research: Theory and Principles. Applied
Research and Training Services, Nairobi: Acts Press.
Mugenda, O. M., & Mugenda, A. G. (2003). Research Methods. Quantitative and
Qualitative Approaches., Nairobi, Kenya: Acts Press.
Mohsen, T. & Dennick, R. (2011). Making sense of Cronbach’s Alpha International
Journal of Medical Education. 2, 53-55
Mokaya, S. O. (2012). Corporate Entrepreneurship and Organizational Performance:
Theoretical Perspectives, Approaches and Outcomes. International
Journal of Commerce and Art, 1(4).

155
Mokua, L. O. & Ngugi, P. K. (2013).Determinants of Effective Corporate
Entrepreneurship in The Banking Industry in Kenya: A case of Equity
Bank Limited. International Journal of Social Sciences and
Entrepreneurship, 1(5), 936-952
Morley, M. & Cardona, P. (2013). Manager-subordinate Trust: A Global
Perspective. New York, USA: Routledge,
Morris, M.H., Kuratko, D. F. & Covin, J. G. (2010). Corporate entrepreneurship
and innovation., USA: South-Western Cengage Learning.
Nafukho, F. M. Machuma, A. &Muyia, H. (2010) "Entrepreneurship and
Socioeconomic Development in Africa: A Reality or Myth?", Journal of
European Industrial Training, 34(2),96 – 109
NAM, (2015). Facts About Manufacturing. Retrieved from
http://www.nam.org/Newsroom/Facts-About-Manufacturing.
Nath, L. (2005). Corporate Entrepreneurship: A Strategic and Structural
Perspective. Lakshmi NathPG, Department of Business Administration
ANR College Gudivada Andhra.
Ngugi, P.K. (2012). Challenges Hindering Sustainability of Small and Medium
Family Enterprise After the Exit of the Founders in Kenya, Unpublished
PhD Thesis, juja: .Jomo Kenyatta University of Agriculture and
Technology.
Ni, J. (2015). China’s Manufacturing Successes and Pitfalls. Retrieved from
http://www3.weforum.org/docs/Manufacturing.
156
Nicolaidis, C. S. & Kosta, G. C. (2011). Intrapreneurship as a Unique Competitive
Advantage. World Academy of Science, Engineering and Technology
International Journal of Social, Behavioral, Educational, Economic,
Business and Industrial Engineering, 5(11), 1468-1472.
Nafiel, N. A., Nimran, U., Musadieq, M. &Suyadi, I. (2014).Organizational Internal
Factors, Corporate Entrepreneurship, and Organizational Performance.
European Journal of Business and Management, 6(36).
Nieuwenhuizen, C. (2008). Basics of Entrepreneurship. South Africa: Juta & Co.
Ltd.
Nkosi, T. (2011).Corporate Entrepreneurship and Organisational Performance in
the Information and Communications Technology Industry, unpublished
Masters Thesis, South Africa: University of the Witwatersrand.
Noer, B. A., Idrus, M. S., Hadiwijoyo, D. & Wirjodirdjo, B. (2011). Entrepreneur as
a Career Choice: Interrelationship between Risk Taking, Competitive
Aggressiveness, Proactiveness, Innovativeness, and Autonomy. IOSR
Journal of Business and Management, Volume 11(5), 21-28
Organization for Economic Co-operation and Development, (2004).Promoting
SMEs for Development: The Enabling Environment and Trade and
Investment Capacity Building. Proceedings of Conference in Istanbul,
Turkey.
Okhomina, D. (2010). Entrepreneurial Orientation and Psychological Traits: The
Moderating Influence of Supportive Environment. Journal of Behavioral
Studies in Business; 3, 1-6.
157
Omukoro, J. O. (2009). Problem-Solving in Management: Peculiarities of the Arts.
Retrieved from http://www.ajol.info/index.php/cajtms/article.
Osborne, Jason & Elaine Waters, (2002). Four Assumptions of Multiple Regression
that Researchers Should Always Test. Practical Assessment, Research &
Evaluation, 8(2). Retrieved from
http://PAREonline.net/getvn.asp?v=8&n=2.
Ozutku, H. (2012). The Influence of Intrinsic and Extrinsic Rewards on Employee
Results: An Empirical Analysis in Turkish Manufacturing Industry.
Business and Economics Research Journal, 3(3), 29-48.
Parijat, P. & Bagga, S. (2014).Victor Vroom’s Expectancy Theory of Motivation –
An Evaluation. International Research Journal of Business and
Management, 7(9), 1-8.
Pidwirny, M. (2006). "Inferential Statistics: Regression and Correlation".
Fundamentalsof Physical Geography, 2nd Edition. Retrieved from
http://www.physicalgeography.net/fundamentals/3h.html.
Perrigot, R. & Pénard, T. (2013).Determinants of E-Commerce Strategy in
Franchising: A Resource-Based View. International Journal of
Electronic Commerce Spring 2013, 17 (3), 109-130.
Porter, M. E. (1985). Competitive Advantage: Creating and Sustaining Superior
Performance. New York, USA: Free Press.
Porter, M. (1990).The Competitive Advantage of Nations., New York, USA: Free
Press.
158
Pradesh. Naldi, L., Achtenhagen, L. & Davidsson, P. (2015). International
CorporateEntrepreneurship among SMEs: A Test of Stevenson's Notion
of Entrepreneurial Management. Journal of Small Business Management
Special Issue: Entrepreneurial Leadership and Gender, 53(3), 780–800.
Ragui M, Wainaina A (2013). Corporate Entrepreneurship: The Way Forward for
SMEs Growth. Prime Journal of Social Science 2(7): 369-37
Rahim, M. A. &Daud, N. (2012). A Proposed Conceptual Framework for Rewards
and Motivation among Administrators of Higher Educational Provider in
Malaysia.
Ramachandran, K., Devarajan,T. P., Ray, S. (n.d.). Corporate Entrepreneurship:
How?.Working Paper Series, Indian School of Business. Retrieved from
http://www.isb.edu
Ratzburg, W. H. (n.d).McClelland's Achievement Motivation Theory. Retrieved from
http://www.jam3c.tripod.com
Reddy, M. R. S. & Rao, V. G. (2014.Application of the Resource-Based View: A
Case of an Indian Pharma Multinational.IUP Journal of Business
Strategy,11(1), 54-67.
Republic of Kenya, (2015).Economic Survey 2015. Nairobi, Kenya: Kenya National
Bureau of Statistics,.
Republic of Kenya, (2012).Micro and Small Enterprises Act No. 55 of 2012. The
National Council for Law Reporting, Nairobi, Kenya
Republic of Kenya, (2007).Kenya Vision 2030. A Globally Competitive and
Prosperous Kenya. Nairobi, Kenya.
159
Research Advisors (2006).Sample Size Table. Retrieved from http://www.research-
advisors.com/tools/SampleSize.htm
Rebublic of Kenya, (2005). Sessional Paper No.2 of 2005 on Development of Micro
and Small Enterprises for Wealth and Employment Creation for Poverty
Reduction. Department Micro and Small Enterprises Development,
Nairobi, Kenya.
Republic of South Africa, (2015).Economic Growth. Statistics South Africa.
Retrieved from http://www.statssa.gov.za/?page_id=735&id=1
Republic of Uganda, (2010).National Industrial Sector Strategic Plan 2010/11-
2014/15. Ministry of Tourism, Trade and Industry, Kampala, Uganda.
Rishipal& Jain, N. (2012). Need for Achievement an Antecedent for Risk
Adaptiveness Among Entrepreneurs. Global Journal of Management
and Business Research, 12(22),1-7.
Rix, J. & Flint, A. (2013). Offering Employees a Stake in the Business is a Very
Effective Way of Rewarding Key Individuals. Retrieved from
http://www.grantthornton.co.uk.
Runkel, P. (2016). What Are T Values and P Values in Statistics?. Retrieved from
http://blog.minitab.com/blog/statistics-and-quality-data-analysis/what-
are-t-values-and-p-values-in-statistics
Sakhdari, K., Burgers, H & Davidsson, P. (2014). The Moderating Role of
Entrepreneurial Management in the Relationship between Absorptive
Capacity and Corporate Entrepreneurship: An Attention-Based View.
Retrieved from https://eprints.qut.edu.au/71124/1/Sakhdari_-
_The_moderating_role_-_ACERE.pdf

160
Saunders, M., Lewis, P. & Thornhill, A. (2007).Research Methods for
BusinessStudents,4th Ed. Tottenham, UK: Pearson Education Ltd.
Sarwar, S. & Abugre, J. (2013). The Influence of Rewards and Job Satisfaction on
Employees in the Service Industry. The Business & Management
Review, 3(2), 22-32
Scheepers, M. J. V. (2011). Motivating Intrapreneurs: The Relevance of Rewards.
Industry &Higher Education25(4), 249–263.
Scheepers,M. J., Hough, J. & Bloom , J.Z. (2008). Nurturing the Corporate
Entrepreneurship Capability. Southern African Business Review, 12
(3).
Schmelter, R., Mauer, R., Börsch C., &Brettel M. (2010).Boosting Corporate
Entrepreneurship Through HRM Practices: Evidence from German
SMEs. Human Resource Management Special Issue: Special Section:
Entrepreneurship—Part 2, 49(4), 715–741.
Sehgal, V. (2008).Supply Chain Mussings: Connecting Supply Chain to your
Business Strategy. Retrieved http://fromwww.supplychainmusings.com.
Sekaran, U. (2009). Research Methods for Business. A Skill-Building Approach,
5thEdition., New Delhi, India: John Wiley & Sons Inc.
Senaji, T. A. & Kamau, J. N. (2013). Entrepreneurial Intensity and Performance
Outcomes Among Kenyan Firms. Kabarak Journal of Research and
Innovation, 2012-09, pp 10-31
Shaheen, A. Naqvi, S. M. H. & Khan, M. A. (2013). Employees Training and
Organizational Performance. Interdisciplinary Journal of Contemporary
Research in Business, 5(4), 490-503.
161
Shane, S. A. (2003). A General Theory of Entrepreneurship: The Individual-
Opportunity Nexus. Edward Elgar Publishing Ltd, Cheltenham, United
Kingdom
Shariatmadari, M., Hajimohammadian, M., Mahdi, S. & Jarad, R. (2012). Barriers
to Corporate Entrepreneurship in Small and Medium Size Enterprises.
Chronicle of The Neville Wadia Institute Of Management Studies And
Research. Retrieved fromwww.nevillewadia.com/images/
Cronicle2012/Dr.-Mehdi-Shariatmadari12.pd
Schindehutte, M. & Kuratko, D. F. (2014). The Role of Marketing in Initiating
Entrepreneurial Activity in Established Firms. Developments in
Marketing Science: Proceedings of the Academy of Marketing Science,
pp 291-295
Shoghi, B. & Safieepoor, A. (2013).International Journal of Academic Research in
Business and Social Sciences,3(11)
Sibin Wu, Matthews, Linda, Grace K. Dagher, (2007) "Need for Achievement,
Business Goals, and Entrepreneurial Persistence". Management
Research News, 30(12), 928 - 941
Sijde, P., Veenker, S. & During, W. (2013). Intrapreneurship in SMEs: About the
Role of Management and R&D. European Journal of Business and
Social Sciences, 1(11), 24-30.
Singh, K. (2011). Study of Achievement Motivation in Relation to Academic
Achievement of Students. International Journal of Educational
Planning & Administration. 1(2), 161-171
162
Singh, H. & Mahmood, R. (2014).Manufacturing Strategy and Export Performance
of Small and Medium Enterprises in Malaysia: Moderating Role of
External Environment. International Journal of Business and
Commerce, 3(5), 37-52.
Sirmon, D.G., Hitt, M.A., Ireland, R.D., & Gilbert, B.A. (2011). Resource
Ochestration To Create Competitive Advantage: Breadth, depth and life
cycle effects. Journal Of Management, 37, 1390-1412.
Sledzik, K. (2013). Schumpeter’s View on Innovation and Entrepreneurship.
Management Trends.
Smith, U. S., Hampson,Y., Chaston, I. & Badger, B. (2003). Managerial Behavior,
Entrepreneurial Style, and Small Firm Performance. Journal of Small
Business Management, 41(1), 47–67.
Soylu, A. (2008). Structural Contingency Theory In Population-ecology Theory Out.
The Journal of Human Resource and Adult Learning.4 (1).
Spector, B. (2007). Implementing Organizational Change: Theory and Practice.
New Delhi: Prentice Hall.
Srivastava, N. & Agrawal, A. (2010). Factors Supporting Corporate
Entrepreneurship: An Exploratory Study. Vision: The Journal of Business
Perspective 14, 163.
Statistics Canada.(2011). Survey on Financing and Growth of Small and Medium
Enterprises. Survey on Financing of Small and Medium Enterprises,
2004 and 2007; and calculations by Industry, Canada.

163
Stewart, W. H. & Roth, P. L. (2007). A Meta-Analysis of Achievement Motivation
Differences between Entrepreneurs and Managers. Journal of Small
Business Management, 45(4), 401–421
Stewart, W.H. Carland, J.C., Carland, J.W., Watson, W.E. & Sweo, R. (2003).
“Entrepreneurial dispositions and Goal Orientations: A Comparative
Exploration of United States and Russian Entrepreneurs” in, Shawn M.
Carraher, Jason K. Buchanan, George Puia, (2010) "Entrepreneurial
Need for Achievement in China, Latvia, and the USA", Baltic Journal of
Management, 5(3), 378 – 396.
Stokes, D., Wilson, N. & Mador, M. (2010). Entrepreneurship: Cengage Learning
EMEA, Hampshire, UK.
Stone &Associates, (2013).On the Threshold: Refocusing U.S. Export Assistance
Strategy for Manufacturers. Retrieved from http/:www.stone-assoc.com
Sunday, K. G. & Somoye, R. O. C. (2011).Organization Performance. The Roles
and Duties of Managers. Journal of African Macroeconomic Review,
1(1).
Sullivan, J. (2011). Increasing Employee Productivity: The Strategic Role That
HREssentially Ignores. Retrieved from http//www.eremedia.com
Tabachnick, B. G., & Fidell, L. S. (2013). Using Multivariate Statistics. 5th ed.
Boston: Allyn & Bacon/Pearson.
Taiwo A. M, Ayodeji M. A & Yusuf A. B (2012). Impact of Small and Medium
Enterprises on Economic Growth and Development. American Journal
of Business and Management, 1(1), 18–22.
164
Tarboda, J. (2015). South Africa GDP Annual Growth Rate. Retrieved from
http://www.tradingeconomics.com/south-africa/gdp-growth-annual
Tarus, D. K. & Nganga, S. I. (2013). Small and Medium Size Manufacturing
Enterprises Growth and Work Ethics in Kenya. School of Business and
Economics, Moi University, Kenya
Teece, D. J. (2012). Dynamic Capabilities: Routines versus Entrepreneurial Action.
Journal of Management Studies. 49(8), 1395–1401.
Teixeira, R., Koufteros, X. A., Peng, X. D (2012). Organizational Structure,
Integration, and Manufacturing Performance: A Conceptual Model and
Propositions. Journal of Operations and Supply Chain Management, 5
(1), 69 – 81.
Thanasegaran, G. (2009).Reliability and Validity Issues in Research.Integration and
Dissemination, 4, 35-40.
The U.S. Bureau of Labor Statistics (2014).About the manufacturing sector.
Retrieved fromhttp://www.bls.gov.
The Organisation for Economic Co-operation and Development (OECD). (2005).
The Measurement of Scientific and Technological Activities, Proposed
Guidelines for
Collecting and Interpreting Technological Innovation Data. Oslo Manual Tirreni, R.
G. (2005). Allocation of Marketing Resources to Optimize Customer
Equity. Dissertation No. 3038 of the University of Allen. Retrieved from
http://www1.unisg.ch/www/edis.nsf
165
Trestl, M. (2014). Driving Innovation and Business Performance through Corporate
Entrepreneurship: Innovativeness, Proactiveness, Risk-taking and
People. Proc. of the Second Intl. Conf. on Advances In Social Science,
Management and Human Behaviour –SMHB 2014.Institute of Research
Engineers and Doctors, USA.
Trochim, W. M. K., (2006). Sampling. Research Methods Knowledge Base.
Retrieved From http://www.socialresearchmethods.net/kb/sampling.php.
Trochim, W. M. K. (2006). Positivism & Post-Positivism. Research Methods
Knowledge Base. Retrieved from
www.socialresearchmethods.net/kb/positvsm.php
Turner, A.G. (2003). Sampling Strategies. United Nations Secretariat, Statistics
Division. Retrieved from http://www.unstats.un.org.
Underdahl, S. C. P., Walker, L. S. & Woehr, D. J. (2014). Gender and Perceptions
of Leadership Effectiveness: A Meta-Analysis of Contextual
Moderators. Journal of Applied Psychology 99(6), 1129–1145
UNIDO, (2015).World Manufacturing Production. Statistics for Quarter II, 2015.
Retrieved from http://www.unido.org/statistics
UNIDO, (2012).Tanzania Industrial Competitiveness Report 2012. Retrieved from
https://www.unido.org
United Nations, (2009).Supporting Performance Management in the Organization.
A guide for Staff and Managers. Leadership, Management and
Organization Development, United Nations.
Urban, B. (2010). Frontiers in Entrepreneurship. Johannesburg, South Africa:
Heinemann Publishers (Pty) Ltd,

166
Urbancová, H. (2013). Competitive Advantage Achievement Through Innovation
and Knowledge. Journal of Competitiveness, 5(1), 82-96.
Vaughan, R. (2008). Conceptual Framework. Bournemouth University.
Retrievedfrom http://www.bournemouth.ac.uk
Vasiliauskiene, L., Stanikuniene, B. & Lipinskiene, D. (2005). The Employees’
Competence Development inside Organization: Managerial Solutions.
Engineering Economics, 5 (45)
Wanjau, k. L., Gakure, R.W. & Kahiri. (2012). The Role of Quality in Growth of
Small and Medium Enterprises and Economic Development in Kenya.
Retrieved fromhttp://www.elearning.jkuat.ac.ke/journals.
Williams, C. (2009). Management. South-Western Cengage Learning,
CanadaWeihrich, H. & Koontz, H. (2004).Management: A Global
Perspective, 11th Edition (Paperback). New York: McGraw Hill.
Westfall, L. (2008). Sampling Methods: Excerpt from The Certified Software
Quality Engineer Handbook by Linda Westfall. The Westfall Team.
Retrieved from http://www.westfallteam.com/Papers/Sampling
%20Methods.pdf.
Wu, S. Matthews Dagher, G. K. (2007) "Need for Achievement, Business Goals,
and Entrepreneurial Persistence". Management Research News, 30(12),
928 – 941.
Wüstenhagen, R. (2008). Sustainable Innovation and Entrepreneurship.
Northampton, USA: Edward Elgar.
167
Yan, W. & Josef, P. (2011). The Role of Communication in Enhancing Employees’
Organizational Commitment: Exploring the Relationship Between
Social-Emotional-Oriented Communication, Work Oriented
Communication and Organizational Commitment in China. Retrieved
from https://www.diva-portal.org/.
Yang, Q. (2014).Remanufacturing Versus New Acquisition of Production
Equipment: Definitions and Decision-making Checklist. Malardalen
University, Sweden.
Zabouj, N. & Antoniades, N. (2015).A study about the use of reward systems and
employee motivation in a call centre. Retrieved from
https://gupea.ub.gu.se/bitstream.
Zenger, J. & Folkman, J. (2015). What Younger Managers Should Know About
HowThey’re Perceived. Harvard Business Review. Retrieved from
https://hbr.org.
Zhao, F. (2006). Entrepreneurship and Innovations in E-Business: An Integrative
Perspective., London, UK: Idea. Group Publishing.
Zhao, L. L. (2013). Corporate Intrapreneurship: Steps to Building a Sustainable
Startup Mentality Within an Established Organization. Retrieved from
http://lucyzhao.com/wp-content.

168
APPENDICES
Appendix 1: Questionnaire/Interview Guide
Please fill in as honestly as possible. All information will be treated with utmost
confidentiality. There is no right or wrong answer that the researcher is looking for.
Part A: Participant Information
1. Gender Male [ ] Female [ ]
2. Age
30 years and below [ ] 31-40 [ ] 41-50 [ ]
51-60 [ ] 61 & above [ ]
3. Number of years worked in the enterprise
Below 1 year [ ] 1-5 [ ] 6 - 10 [ ]
11- 15 [ ] Above 15 [ ]
4. Number of years the enterprise has been in existence
10 and below [ ] 11-20 [ ] 21-30 [ ]
31-40 [ ] Above 40 [ ]
5. Relationship with enterprise
Owner Manager [ ] Employee Manager [ ]
6. Type of manufacturing business………………………………………………………..
7. Number of employees
10-100 [ ] 101- 200 [ ] 201- 300 [ ]
301- 400 [ ] Above 400 [ ]
8. Turnover in Kenya Shillings.................................................................................
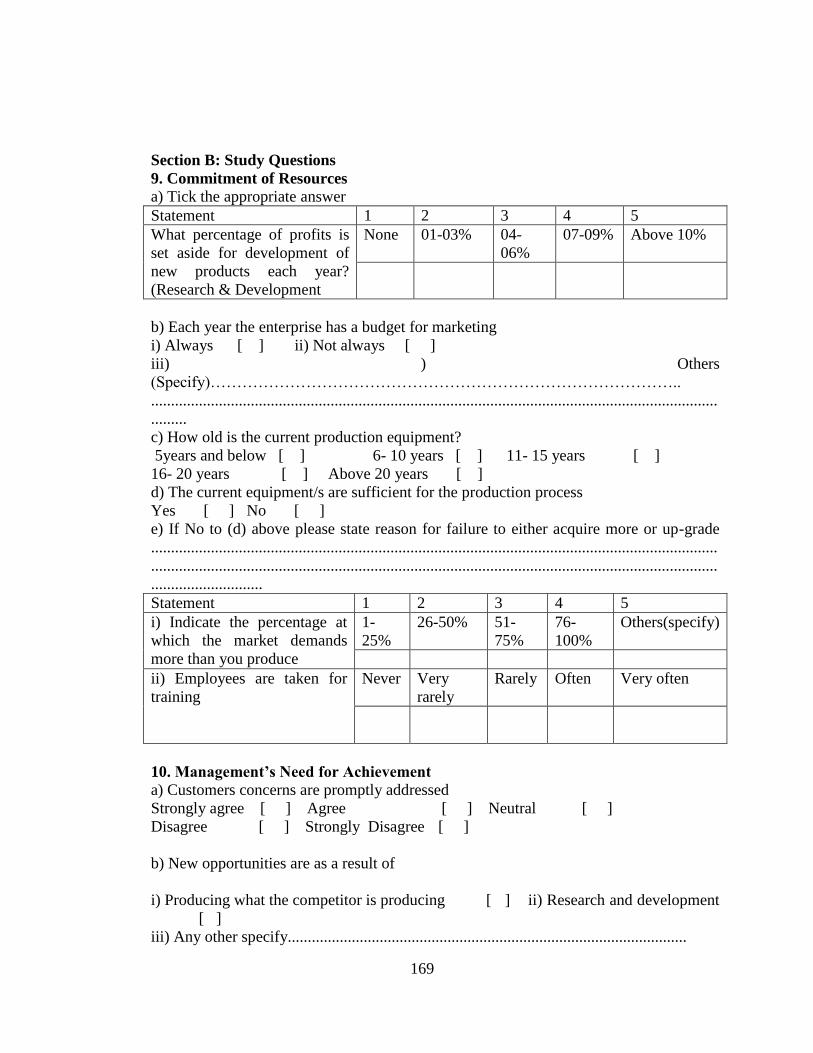
169
Section B: Study Questions
9. Commitment of Resources
a) Tick the appropriate answer
Statement 1 2 3 4 5
What percentage of profits is
set aside for development of
new products each year?
(Research & Development
None 01-03% 04-
06%
07-09% Above 10%
b) Each year the enterprise has a budget for marketing
i) Always [ ] ii) Not always [ ]
iii) ) Others
(Specify)……………………………………………………………………………..
..............................................................................................................................................
.........
c) How old is the current production equipment?
5years and below [ ] 6- 10 years [ ] 11- 15 years [ ]
16- 20 years [ ] Above 20 years [ ]
d) The current equipment/s are sufficient for the production process
Yes [ ] No [ ]
e) If No to (d) above please state reason for failure to either acquire more or up-grade
..............................................................................................................................................
..............................................................................................................................................
............................
Statement 1 2 3 4 5
i) Indicate the percentage at
which the market demands
more than you produce
1-
25%
26-50% 51-
75%
76-
100%
Others(specify)
ii) Employees are taken for
training
Never Very
rarely
Rarely Often Very often
10. Management’s Need for Achievement
a) Customers concerns are promptly addressed
Strongly agree [ ] Agree [ ] Neutral [ ]
Disagree [ ] Strongly Disagree [ ]
b) New opportunities are as a result of
i) Producing what the competitor is producing [ ] ii) Research and development
[ ]
iii) Any other specify....................................................................................................
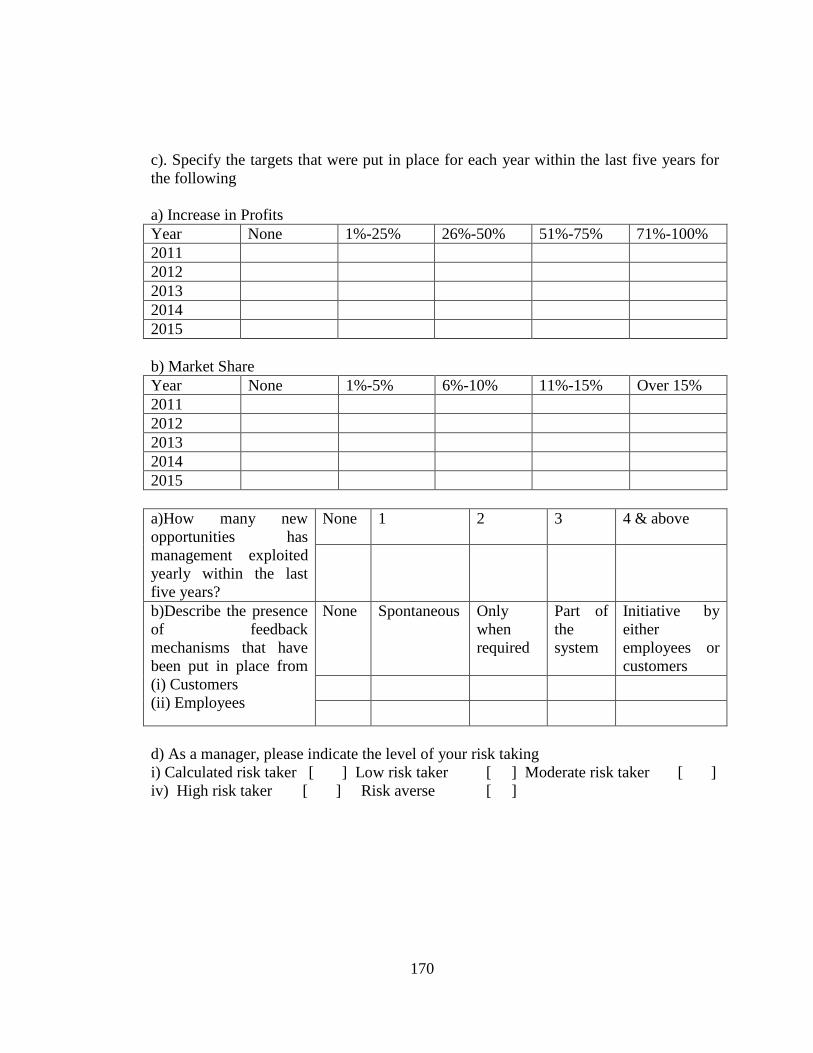
170
c). Specify the targets that were put in place for each year within the last five years for
the following
a) Increase in Profits
Year None 1%-25% 26%-50% 51%-75% 71%-100%
2011
2012
2013
2014
2015
b) Market Share
Year None 1%-5% 6%-10% 11%-15% Over 15%
2011
2012
2013
2014
2015
a)How many new
opportunities has
management exploited
yearly within the last
five years?
None 1 2 3 4 & above
b)Describe the presence
of feedback
mechanisms that have
been put in place from
(i) Customers
(ii) Employees
None Spontaneous Only
when
required
Part of
the
system
Initiative by
either
employees or
customers
d) As a manager, please indicate the level of your risk taking
i) Calculated risk taker [ ] Low risk taker [ ] Moderate risk taker [ ]
iv) High risk taker [ ] Risk averse [ ]
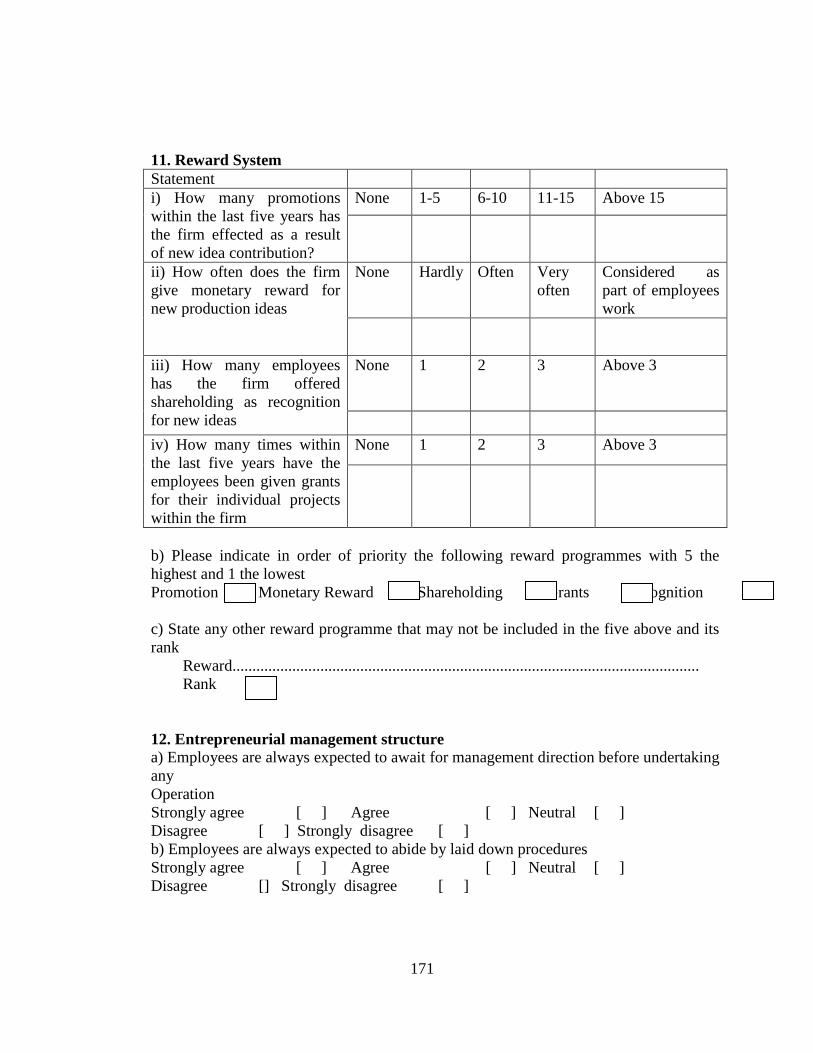
171
11. Reward System
Statement
i) How many promotions
within the last five years has
the firm effected as a result
of new idea contribution?
None 1-5 6-10 11-15 Above 15
ii) How often does the firm
give monetary reward for
new production ideas
None Hardly Often Very
often
Considered as
part of employees
work
iii) How many employees
has the firm offered
shareholding as recognition
for new ideas
None 1 2 3 Above 3
iv) How many times within
the last five years have the
employees been given grants
for their individual projects
within the firm
None 1 2 3 Above 3
b) Please indicate in order of priority the following reward programmes with 5 the
highest and 1 the lowest
Promotion Monetary Reward Shareholding Grants Recognition
c) State any other reward programme that may not be included in the five above and its
rank
Reward.....................................................................................................................
Rank
12. Entrepreneurial management structure
a) Employees are always expected to await for management direction before undertaking
any
Operation
Strongly agree [ ] Agree [ ] Neutral [ ]
Disagree [ ] Strongly disagree [ ]
b) Employees are always expected to abide by laid down procedures
Strongly agree [ ] Agree [ ] Neutral [ ]
Disagree [] Strongly disagree [ ]
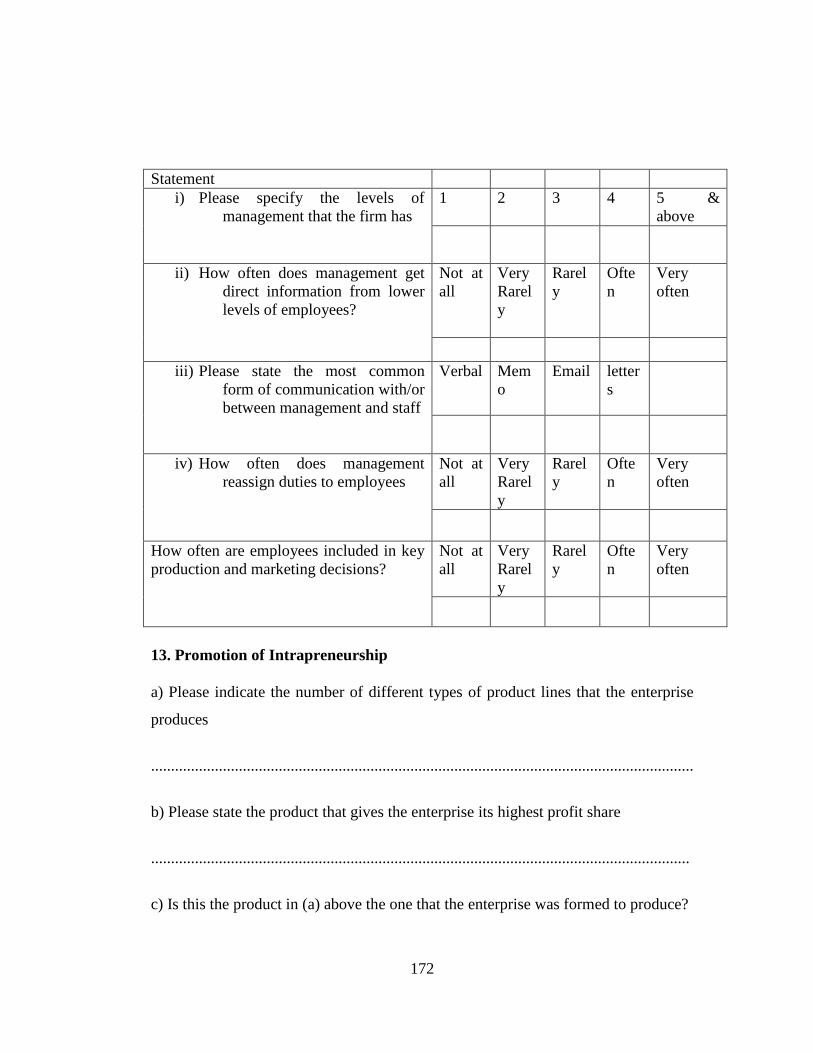
172
Statement
i) Please specify the levels of
management that the firm has
1 2 3 4 5 &
above
ii) How often does management get
direct information from lower
levels of employees?
Not at
all
Very
Rarel
y
Rarel
y
Ofte
n
Very
often
iii) Please state the most common
form of communication with/or
between management and staff
Verbal Mem
o
Email letter
s
iv) How often does management
reassign duties to employees
Not at
all
Very
Rarel
y
Rarel
y
Ofte
n
Very
often
How often are employees included in key
production and marketing decisions?
Not at
all
Very
Rarel
y
Rarel
y
Ofte
n
Very
often
13. Promotion of Intrapreneurship
a) Please indicate the number of different types of product lines that the enterprise
produces
........................................................................................................................................
b) Please state the product that gives the enterprise its highest profit share
.......................................................................................................................................
c) Is this the product in (a) above the one that the enterprise was formed to produce?
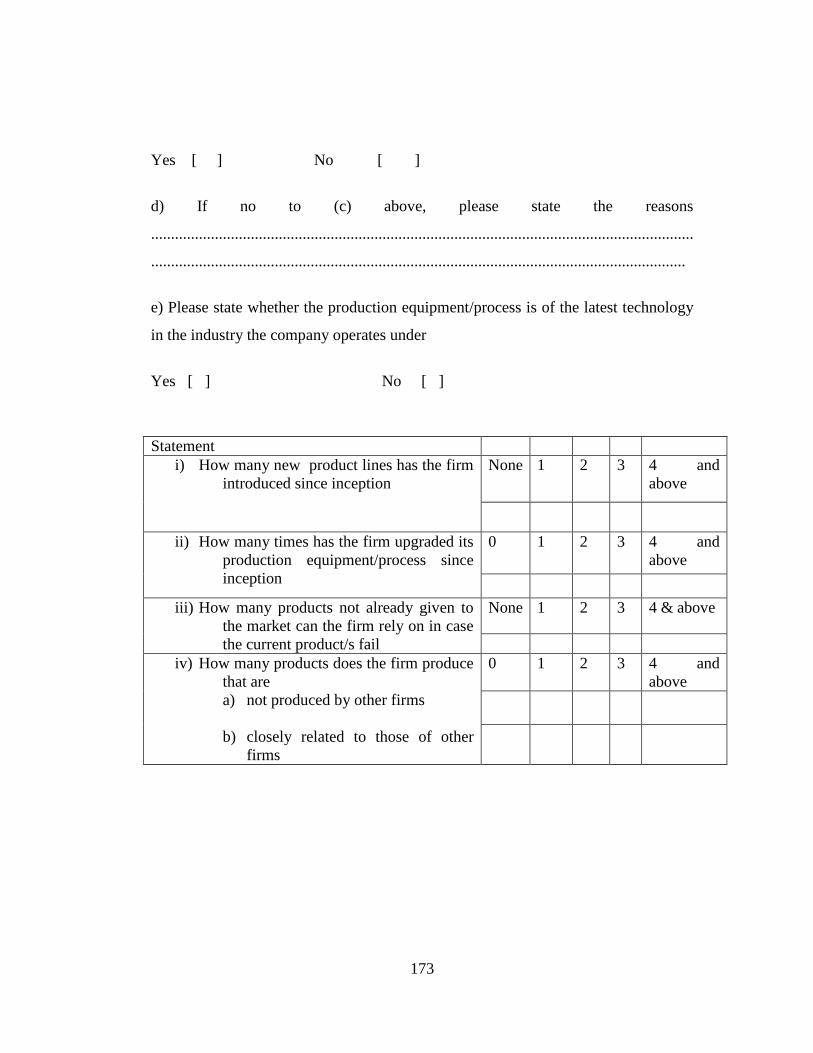
173
Yes [ ] No [ ]
d) If no to (c) above, please state the reasons
........................................................................................................................................
......................................................................................................................................
e) Please state whether the production equipment/process is of the latest technology
in the industry the company operates under
Yes [ ] No [ ]
Statement
i) How many new product lines has the firm
introduced since inception
None 1 2 3 4 and
above
ii) How many times has the firm upgraded its
production equipment/process since
inception
0 1 2 3 4 and
above
iii) How many products not already given to
the market can the firm rely on in case
the current product/s fail
None 1 2 3 4 & above
iv) How many products does the firm produce
that are
a) not produced by other firms
b) closely related to those of other
firms
0 1 2 3 4 and
above
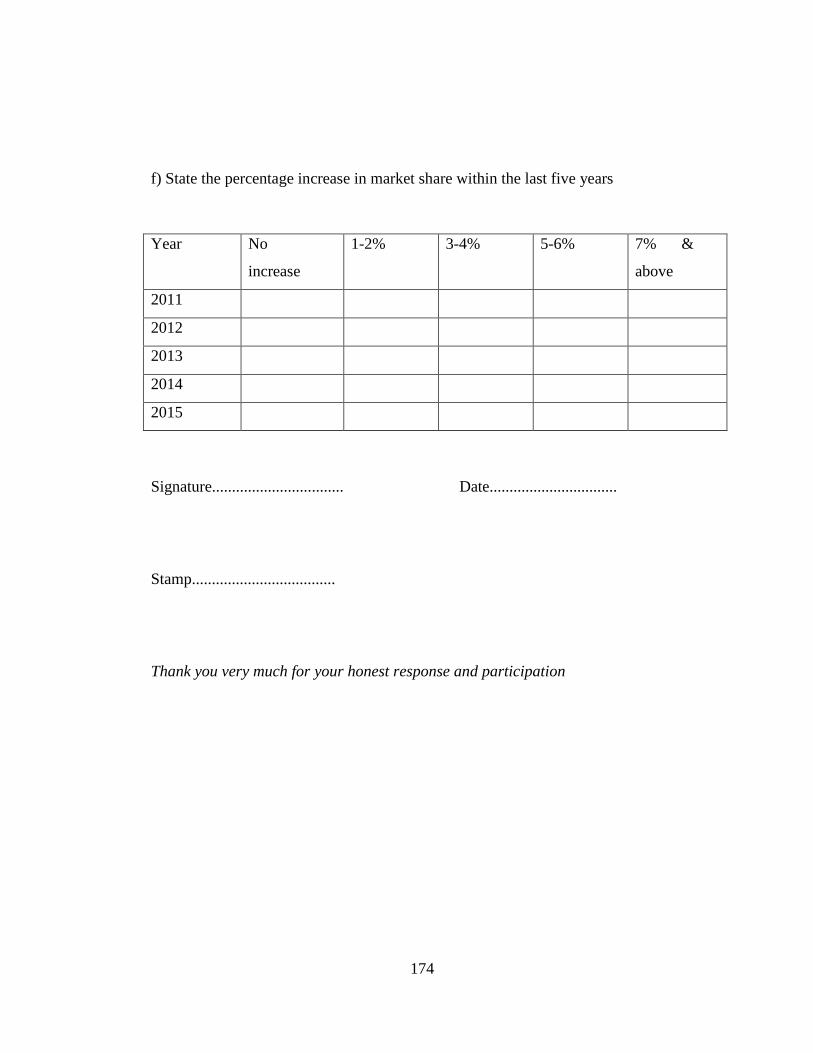
174
f) State the percentage increase in market share within the last five years
Year No
increase
1-2% 3-4% 5-6% 7% &
above
2011
2012
2013
2014
2015
Signature................................. Date................................
Stamp....................................
Thank you very much for your honest response and participation

175
Appendix II: Sample Size Calculation Table
Required Sample Size at 5% Confidence Level
Source: Krejcie and Morgan (1970)
N= Population Size
n= Sample Size
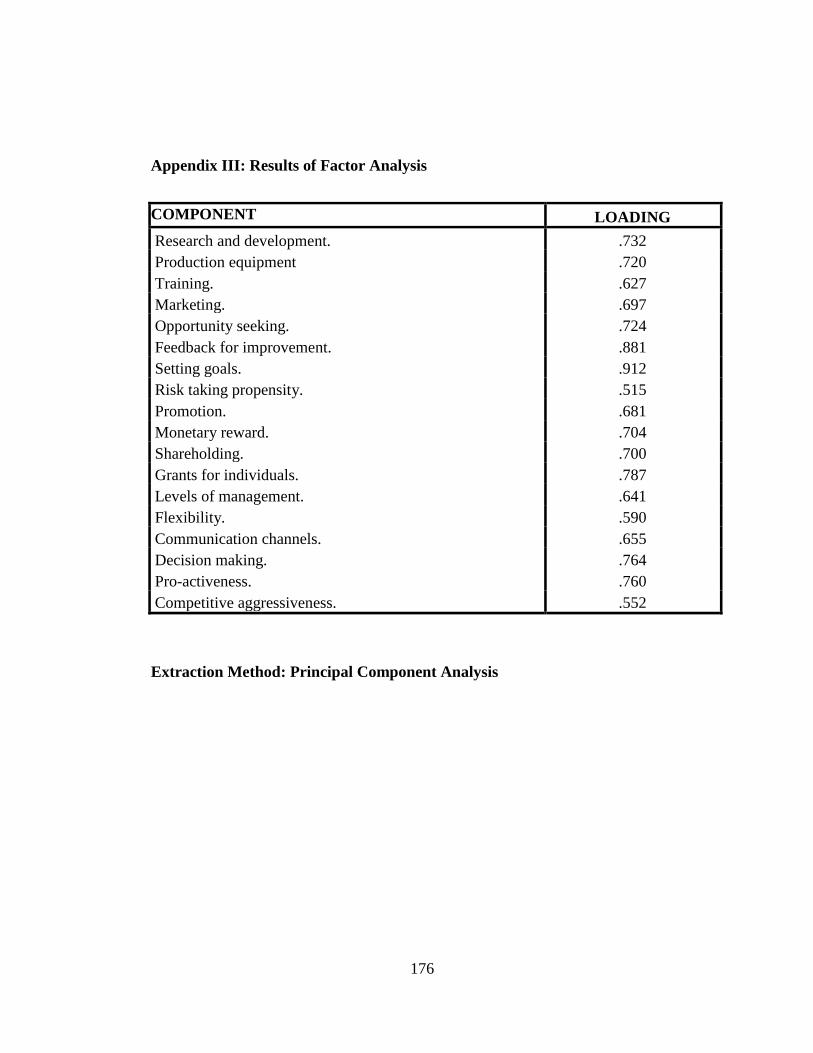
176
Appendix III: Results of Factor Analysis
COMPONENT LOADING
Research and development. .732
Production equipment .720
Training. .627
Marketing. .697
Opportunity seeking. .724
Feedback for improvement. .881
Setting goals. .912
Risk taking propensity. .515
Promotion. .681
Monetary reward. .704
Shareholding. .700
Grants for individuals. .787
Levels of management. .641
Flexibility. .590
Communication channels. .655
Decision making. .764
Pro-activeness. .760
Competitive aggressiveness. .552
Extraction Method: Principal Component Analysis