the role of fluorescence and human factors in quantitative
TRANSCRIPT
Syracuse University Syracuse University
SURFACE SURFACE
Biomedical and Chemical Engineering - Dissertations College of Engineering and Computer Science
8-2012
The Role of Fluorescence and Human Factors in Quantitative The Role of Fluorescence and Human Factors in Quantitative
Transdermal Blood and Tissue Analysis Using NIR Raman Transdermal Blood and Tissue Analysis Using NIR Raman
Spectroscopy Spectroscopy
Bin Deng Syracuse University
Follow this and additional works at: https://surface.syr.edu/bce_etd
Part of the Biomedical Engineering and Bioengineering Commons
Recommended Citation Recommended Citation Deng, Bin, "The Role of Fluorescence and Human Factors in Quantitative Transdermal Blood and Tissue Analysis Using NIR Raman Spectroscopy" (2012). Biomedical and Chemical Engineering - Dissertations. 64. https://surface.syr.edu/bce_etd/64
This Dissertation is brought to you for free and open access by the College of Engineering and Computer Science at SURFACE. It has been accepted for inclusion in Biomedical and Chemical Engineering - Dissertations by an authorized administrator of SURFACE. For more information, please contact [email protected].

ABSTRACT
The Role of Fluorescence and Human Factors
in Quantitative Transdermal Blood and Tissue Analysis
Using NIR Raman Spectroscopy
Bin Deng
Syracuse University, August 2012
This research is part of an ongoing project aimed at the application of combined near
infrared (NIR) Raman and fluorescence spectroscopy to noninvasive in vivo blood
analysis including but not limited to glucose monitoring. Coping with practicalities of
human factors and exploring ways to obtain and use knowledge gained about
autofluorescence to improve algorithms for blood and tissue analysis are the general
goals of this research. Firstly, the study investigated the various sources of human factors
pertinent to our concerns, such as fingerprints, turgor, skin hydration and pigmentation.
We then introduced specialized in vivo apparatus including means for precise and
reproducible placement of the tissues relative to the optical aperture, i.e., the position
detector pressure monitor (PDPM). Based on solid instrumental performances,
appropriate methodology is now provided for applying and maintaining pressure to keep
surface tissues immobile during experiments while obtaining the desired blood content
and flow. Secondly, in vivo human fingertip skin autofluorescence photobleaching under
200 mW 830 nm NIR irradiation is observed and it is characterized that: i) the majority of
the photobleached fluorescence originates from static tissue not blood, ii) the bleaching
(1/e point) occurs in 101-10
2 sec timescale, and also iii) a photobleached region remains
bleached for at least 45 min but recovers completely within several hours. A
corresponding extensive but not exhaustive in vitro systematic study narrowed down the
major contributors of such fluorescence and bleaching to collagen, melanin, plasma and
hemoglobin: two major static tissue constituents and two major blood proteins. Thirdly,
we established that measuring the inelastic and elastic emissions simultaneously leads to
a sensitive probe for volume changes of both red blood cells and plasma. An algorithm
based on measurements obtained while performing research needed for this thesis, as
well as some empirical calibration approaches, was presented. The calibrated algorithm
showed real potential to track hematocrit variations in cardiac pulses, centrifugal loading,
blood vessel blockage using tourniquet, and even during as subtle an occurrence as in a
Valsalva maneuver. Finally, NIR fluorescence and photochemistry of pentosidine, a
representative of the advanced glycation endproducts (AGEs) which accumulate with age
and hyperglycemia, was studied. The results indicate that oxygen plays a pivotal role in
its photobleaching process. We hypothesized and offered proofs showing that pentosidine
is a 1O2 sensitizer that is also subject to attack by the
1O2 resulting in the photobleaching
that is observed when probing tissue using NIR. The photobleaching reaction is
kinetically first order in pentosidine and ground state oxygen, and in vivo effectively first
order with NIR irradiation also.

Syracuse University
The Role of Fluorescence and Human Factors
in Quantitative Transdermal Blood and Tissue Analysis
Using NIR Raman Spectroscopy
by
Bin Deng
B.S. Tianjin University, Tianjin, China 2004
M.S. Tianjin University, Tianjin, China 2007
Dissertation
Submitted in partial fulfillment of the requirements for the degree of
Doctor of Philosophy in Bioengineering
Syracuse University
August 2012

Copyright © 2012 by Bin Deng
All Rights Reserved

Dedicated to my parents,
Aiqin Cao and Lintong Deng,
for their unconditional love and continuous support

vi
ACKNOWLEDGEMENTS
Sunshine in the summer time of upstate New York is gorgeous and I could not feel
better to finish my five years of doctoral study in my favorite season of Syracuse. Along
this fantastic journey there are many unforgettable moments I share with people who
have helped, encouraged, and advised me. No truer words have ever been penned. And I
would like to express my tremendous gratitude to those who have contributed to the final
delivery of this thesis.
First and foremost, my utmost appreciation to my advisor, Prof. Joseph Chaiken,
whose guidance and support from the beginning to the end I will never forget. Joe is not
only the advisor who inspires and enlightens me as I hurdle all the obstacles in
completion of this research, but also the mentor whose work ethics motivate me to be a
better person. I am grateful that he lets me take initiative in research, respects my input
into the project, and treats me like a colleague not a mere student. I appreciate his
complete trust, confidence and belief in me which means more than words could express.
I am thankful to Prof. Julie Hasenwinkel for her continuous help and advice during
my pursuit of doctoral degree. Prof. Patrick Mather is a role model, for I see in him a
successful combination of science and artistic genius whose personality I greatly admire.
I thank Prof. Jerry Goodisman for his belief and long-term constructive participation in
this project. I am grateful to Prof. Daniel Clark for helping us understand the AGE
chemistry. Prof. Rebecca Bader always reminds me the importance of a cheerful and
positive attitude toward both life and career. I appreciate Prof. Gus Engbretson for

vii
introducing me to this wonderful journey in Syracuse University and I am thankful for his
guidance, confidence and trust in me.
I am especially grateful for the funding from LighTouch Medical Inc., the trust and
support of Mr. Donald Schmucker, and the opportunity to work with the experienced
“young” doctor Mr. George Shaheen, whose insightful opinions have always been the
inspiration and fountain of new thoughts. It has been a great pleasure and honor to work
with the sophisticated and experienced engineers in Critical Link LLC and mechanists in
Physics Department Machine Shop.
I feel blessed to have so many dearest friends around. I want to thank my ex-roomies
Yi Shi and Qianqian Cao for bringing me joy and certainty, and your support and care
helped me overcome setbacks. I feel lucky to have two joyful souls, my roomies Yiqing
Zhang and Hui Gong, who accompanied me through the most stressful time of writing up
my dissertation. I am thankful to Erika Rodriguez and miss those days when we studied,
ate, volunteered and almost did everything together. I want to thank Tarun Saxena for all
the discussions on research, science, books; you awoke my thirst for reading. It is simply
impossible to name everyone but my deepest gratitude is sent wherever you are. I also
appreciate the help from these excellent undergraduates: Colin Wright, Anabel Simental,
Ruben Guadalupe and Patrick Lutz.
Last but not the least, I would like to give my special thanks to my amazing parents
for their unconditional love and support to me. I feel so blessed to have such
understanding parents like them who believe in me and set me free to pursue my dream.
You always say I make you proud, but I would like to say that I could not be more proud
to have you, my dearest mom and dad!

viii
TABLE OF CONTENTS
Acknowledgements ............................................................................................................ vi
Table of Contents ............................................................................................................. viii
List of Symbols and Acronyms ......................................................................................... xii
List of Figures .................................................................................................................. xvi
List of Tables .................................................................................................................. xxii
1. Introduction ................................................................................................................... 1
1.1 Motivation for Noninvasive Blood Analytes Monitoring .................................... 1
1.2 Contemporary Technologies ................................................................................ 7
1.3 Tissue Modulated Raman Spectroscopy ............................................................ 10
1.4 Terminology ....................................................................................................... 12
1.5 Previous Work and Limitations ......................................................................... 15
1.6 Overall Scope of the Dissertation ...................................................................... 17
1.7 Specific Hypothesis ........................................................................................... 19
1.8 Layout of the Dissertation .................................................................................. 20
2. In Vivo Apparatus Innovation .................................................................................... 22
2.1 Introduction ........................................................................................................ 22
2.1.1 Haptics of Volar Side of Human Fingertips ............................................ 22
2.1.2 Optical Layouts of the In Vivo Apparatus .............................................. 25
2.1.3 Human Factors ........................................................................................ 31
2.1.4 Modulation Pressure ................................................................................ 34
2.2 Position Detector Pressure Monitor (PDPM) .................................................... 39
2.2.1 Features and Limitations of Previous Versions ....................................... 39
ix
2.2.2 Overall and General Description of Current PDPM ............................... 41
2.2.3 Placement and Contact Area ................................................................... 45
2.2.4 Force, Pressure and the Measurement Cycle ........................................... 48
2.3 Evaluation of PDPM Performances ................................................................... 52
2.3.1 History of PDPM Outputs ....................................................................... 52
2.3.2 Pressure Registration ............................................................................... 56
2.3.3 Fingertip Topography .............................................................................. 64
2.4 Conclusions ........................................................................................................ 71
3. Simultaneous Noninvasive In Vivo Observation of IE and EE .................................. 74
3.1 Elastic and Inelastic Emissions .......................................................................... 74
3.1.1 Background ............................................................................................. 74
3.1.2 Potential In Vivo Application of EE and IE ............................................ 76
3.1.3 Negative Influences of Fluorescence Quench ......................................... 82
3.2 Characterizing Human Fingertip Autofluorescence .......................................... 84
3.2.1 Dependence on NIR Irradiation .............................................................. 84
3.2.2 Relative Contribution from Static Tissue and Blood .............................. 91
3.2.3 Recoverability of Quenched Fluorescence .............................................. 96
3.2.4 Summary ................................................................................................. 98
3.3 Hct Monitoring Using Combined EE and IE ..................................................... 98
3.3.1 The Theoretical Model and Algorithm .................................................... 98
3.3.2 In Vivo Calibrations .............................................................................. 101
3.3.3 In Vivo Monitoring of Hct .................................................................... 105
3.3.4 Summary ............................................................................................... 114
3.4 Conclusions ...................................................................................................... 115
4. In Vitro Study of Endogenous Fluorophores ............................................................ 117

x
4.1 Motivation ........................................................................................................ 117
4.2 Experimental .................................................................................................... 118
4.2.1 Methodology of the Study ..................................................................... 118
4.2.2 In Vitro Apparatus ................................................................................. 121
4.2.3 Materials and Sample Preparation ......................................................... 124
4.3 Results .............................................................................................................. 129
4.3.1 Antioxidants & Coenzymes ................................................................... 129
4.3.2 Collagen ................................................................................................. 133
4.3.3 Melanin .................................................................................................. 139
4.3.4 Blood Components ................................................................................ 143
4.4 Discussion ........................................................................................................ 147
4.5 Conclusions ...................................................................................................... 150
5. Photochemistry of Advanced Glycation Endproducts (AGEs) ............................... 152
5.1 Advanced Glycation Endproducts (AGEs) ...................................................... 152
5.1.1 Motivation of AGEs Study .................................................................... 152
5.1.2 Endogenous Formation Pathways of AGEs .......................................... 155
5.1.3 Clinical Aspects of AGEs ...................................................................... 156
5.1.4 Pentosidine and Tri – Mixture (TMX) .................................................. 158
5.2 Singlet Oxygen (1O2) Chemistry ...................................................................... 160
5.2.1 Triplet Oxygen (3O2) & Singlet Oxygen (
1O2) ...................................... 160
5.2.2 Photosensitized Process of 1O2 Formation ............................................ 161
5.2.3 Detection of 1O2 ..................................................................................... 164
5.3 Experimental .................................................................................................... 166
5.4 Results .............................................................................................................. 170
5.4.1 TMX Fluorescence with NIR excitation ............................................... 170

xi
5.4.2 TMX UV/Vis Absorption ...................................................................... 173
5.4.3 TMX Fluorescence with UV/Vis Excitation ......................................... 177
5.5 1O2 Involved Photochemistry of Pentosidine ................................................... 181
5.5.1 Role of Dissolved Oxygen in Pentosidine Photobleaching ................... 181
5.5.2 Rate of Dissolved Oxygen Loss ............................................................ 183
5.5.3 Generation of 1O2 in TMX .................................................................... 186
5.5.4 Gaussian Calculation of Pentosidine Electronic States ......................... 189
5.6 Conclusions ...................................................................................................... 194
6. Overall Discussion, Future Work and Conclusions .................................................. 195
6.1 Overall Discussion ........................................................................................... 195
6.2 Future Work ..................................................................................................... 207
6.3 Conclusions ...................................................................................................... 214
Appendix A ..................................................................................................................... 216
Appendix B ..................................................................................................................... 222
Appendix C ..................................................................................................................... 230
References ....................................................................................................................... 243
Vita .................................................................................................................................. 261

xii
LIST OF SYMBOLS AND ACRONYMS
ADA American Diabetes Association
AGEs advanced glycation endproducts
ANSI American National Standards Institute
ARF acute respiratory failure
BP blood pressure
BV blood volume
CCD charge-coupled device
CML N-carboxy-methyl lysine
COPD chronic obstructive pulmonary disease
CW continuous wave
DI de-ionized water
EE elastic scattering emission
ET electron transfer
FDA U.S. Food and Drug Administration
GUI graphical user interface

xiii
Hb hemoglobin
HbA1c hemoglobin A1c
Hct hematocrit
HFs human factors
HMI human-machine interface
HPFS high purity fused silica
IACUC Institutional Animal Care and Use Committee
ICP intracranial pressure
ICU intensive care unit
IRB Institutional Review Board
ISC intersystem crossing
ISF interstitial fluid
IE inelastic scattering emission
LED light emitting diode
MAP mean arterial pressure
MIR mid-infrared
NAD nicotinamide adenine dinucleotiede

xiv
NADH nicotinamide adenine dinucleotiede (reduced form)
NAS net analyte signal
NICU neurotrauma intensive care unit
NIH U.S. National Institutes of Health
NIR near infrared
OCT optical coherence tomography
OPE one photon excitation
PBS phosphate buffered saline
PDPM position detector pressure monitor
PLS partial least square
POCT point-of-care testing
QE quantum efficiency
R&D research and development
RBCs red blood cells
RTE radiation transfer equation
SNR signal-to-noise ratio
SOSG singlet oxygen sensor green
xv
SOSG-EP singlet oxygen sensor green – endoperoxide
TM tissue modulator
TMX tri-mixture of lysine, arginine and ribose
TPE two photon excitation
TTA triplet-triplet annihilation
UV/Vis ultraviolet/visible
1O2 singlet oxygen (excited state)
3O2 triplet oxygen (ground state)

xvi
LIST OF FIGURES
Figure 1-1: Principal light-absorbing molecules in the skin ............................................... 4
Figure 1-2: Schematic drawing of tissue modulation. ...................................................... 11
Figure 1-3: Raw typical single 20 ms frame of Andor CCD output for the volar
side of human fingertip under 200 mW 830 nm exposure ...............................13
Figure 1-4: Screenshot of a BV vs. Time curve generated within the custom
LighTouchTM
software. ................................................................................... 15
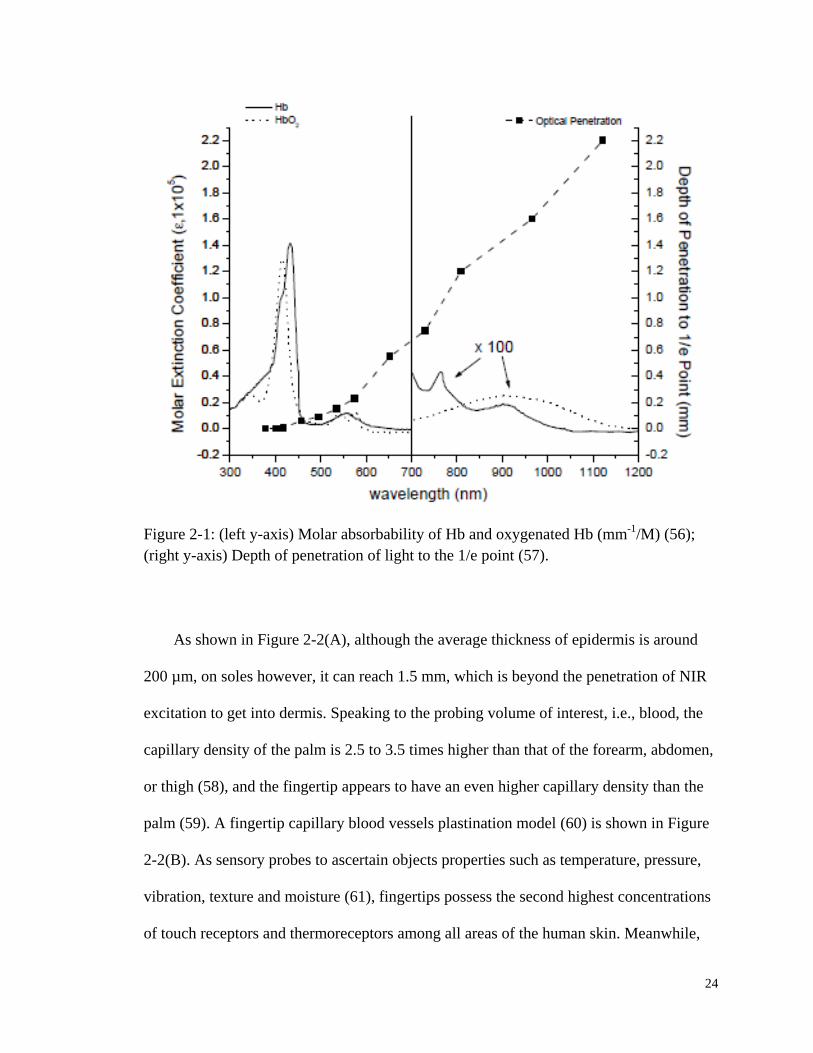
Figure 2-1: (left) Molar absorbability of Hb and oxygenated Hb (mm-1
/M);
(right) Depth of penetration of light to the 1/e point. ..................................... 24
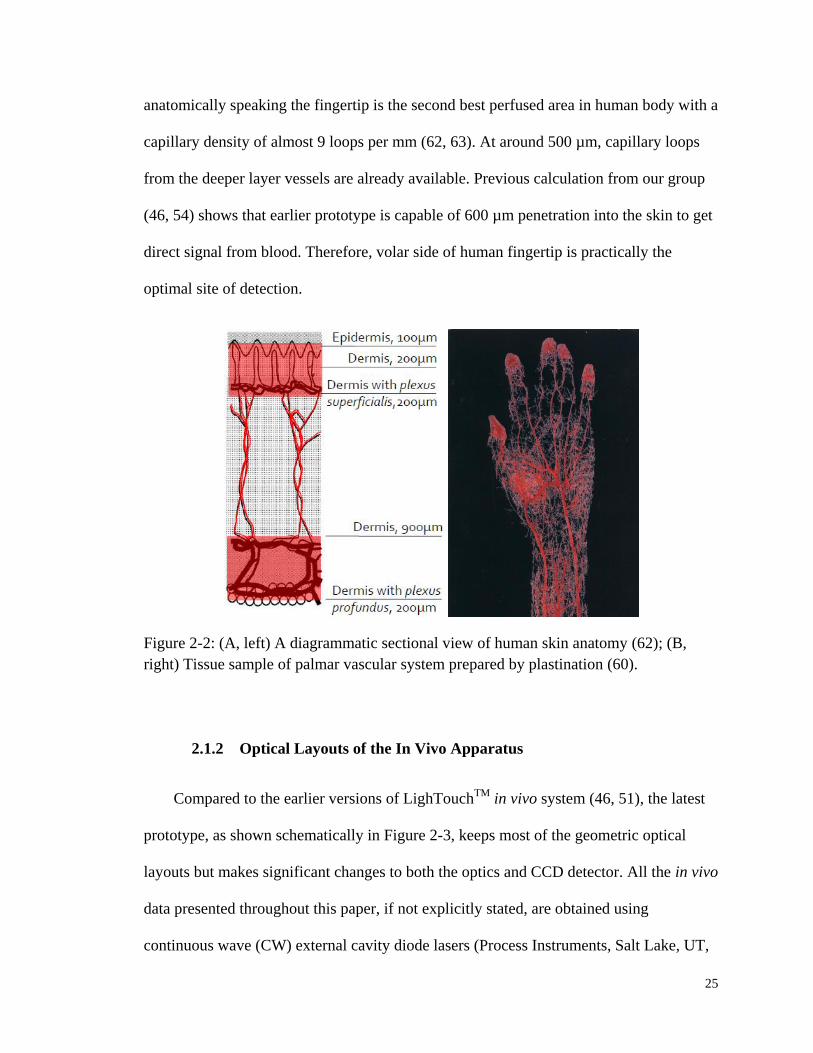
Figure 2-2: (left) A diagrammatic sectional view of human skin anatomy; (right)
Tissue sample of palmar vascular system prepared by plastination ............... 25
Figure 2-3: Schematic diagrams of optical layouts of the current in vivo
apparatus. ........................................................................................................ 26
Figure 2-4: A microscope image of a ZAP-IT®
paper burn hole.. .................................... 28
Figure 2-5: Typical images of fingertip deformation against a BaF2 optical
window at each target force. ........................................................................... 35
Figure 2-6: In vivo observed human cardiac pulses, both mechanically and
optically........................................................................................................... 36
Figure 2-7: Sample recording of cuff pressure during oscillometric blood
pressure measurements. .................................................................................. 37
Figure 2-8: Schematic diagram of the 1st generation “Tissue Modulator” ....................... 39
Figure 2-9: Details of the current used PDPM module and the control GUI. .................. 42
Figure 2-10: Splint fixtures for fingertip positioning. ...................................................... 49
Figure 2-11: Coupling between splint, fixture and the back of fingertip. ......................... 50
xvii
Figure 2-12: PDPM sensor outputs for a 20 sec measurement cycle showing
the rolling motion of a fingertip. ..................................................................... 54
Figure 2-13: Tremor is shown on the logged force, contact area and IE curves
for a senior Caucasian male. ........................................................................... 55
Figure 2-14: IE vs. Time curve collected corresponding to the sensor history in
Figure 2-12. ..................................................................................................... 57
Figure 2-15: Force records of 4 subjects in a series of short in vivo experiments
showing the difference between using or not using PDPM. ........................... 59
Figure 2-16: Comparison of force and IE variation between subject 1 and 3. ................. 60
Figure 2-17: Offset force and IE curves under evenly spaced four increasing
pressures for subject 4 who has the highest BP. ............................................. 62
Figure 2-18: Optical pulses from subject 1, 2, and 4 showing various pulse
amplitudes under different pressures. ............................................................. 63
Figure 2-19: Imaging of the LighTouchTM
aperture. ........................................................ 66
Figure 2-20: IE and EE integrals from scan of laser and detector across
fingerprint ridges plotted against displacement of fingertip alone
across a stationary aperture. ............................................................................ 68
Figure 2-21: IE and EE curves as a function of displacement of aperture with
respect to collection and excitation optics. ..................................................... 69
Figure 3-1: Jablonski diagram illustrating the electronic states within a
molecule and transitions between them. ......................................................... 75
Figure 3-2: IE and EE as a function of time for a single very short and weak
mechanical impulse ......................................................................................... 78
Figure 3-3: Same data as in Figure 3-2, shown at higher temporal resolution to
show complementary behavior of EE versus IE. ............................................ 80
Figure 3-4: Fluorescence from various tissues and cells investigated in vivo or
ex vivo under NIR excitation. .......................................................................... 82
Figure 3-5: BV vs. Time curve screenshots of a typical in vivo collected human
fingertip (A, top) and gelatin tissue phantom (B, bottom). ............................. 83

xviii
Figure 3-6: In vivo photobleaching and hydrostatic relaxation study. .............................. 85
Figure 3-7: Laser power dependence of the skin autofluorescence. ................................. 88
Figure 3-8: Photobleaching study of various test subjects at different power
levels. .............................................................................................................. 90
Figure 3-9: Time constants of the two-component exponential decay fit to the
in vivo skin autofluorescence photobleaching. ............................................... 91
Figure 3-10: Shuttered in vivo IE profile of a human fingertip. ....................................... 92
Figure 3-11: Comparison of two 100 sec IE vs. Time curves obtained under
805 nm and 830 nm excitation respectively ................................................... 94
Figure 3-12: Re-plot of the IE vs. Time curves with expanded x-axis range
from 0 to the first 10 sec. ................................................................................ 95
Figure 3-13: Two individual IE fingertip topography scans performed on the
same subject w/o moving hand out in between.. ............................................ 97
Figure 3-14: IE and EE as functions of time for two different modulation
cycles............................................................................................................. 102
Figure 3-15: Calculated Hct based on the parameters predetermined by a
separate calibration trial. ............................................................................... 106
Figure 3-16: Typical Hct changes observed when executing the Valsalva
maneuver. ...................................................................................................... 108
Figure 3-17: EE/EE0 and IE/IE0 versus time for application of tourniquet at t ≈
60 sec and release at t ≈ 120 sec. ................................................................ 110
Figure 3-18: Volume fractions and Hct calculated from the data of Figure 3-17. .......... 112
Figure 3-19: Box plot of Hct changes before and after the tourniquet
experiment for three different test subjects. .................................................. 113
Figure 4-1: Flow chart showing the interconnection between the in vivo and in
vitro photochemical studies of NIR fluorescence of various
endogenous species. ...................................................................................... 120
Figure 4-2: Schematic diagram of in vitro experimental setup. ...................................... 122
xix
Figure 4-3: Raw and normalized Raman spectra for melanin solutions with
various pore sizes of filtration. ...................................................................... 128
Figure 4-4: NIR spectra of three water soluble antioxidants, namely L-
glutathione, uric acid and α-Tocopherol. ...................................................... 130
Figure 4-5: NIR spectra of three antioxidants that do not dissolve in water,
namely β-carotene, cholecalciferol, and (±)-α-tocopherol ............................ 131
Figure 4-6: NIR raw spectra of crystalline NAD and its solutions with various
concentrations ............................................................................................... 132
Figure 4-7: Spectra of gelatin powder with 10 min accumulation. ................................. 134
Figure 4-8: Fluorescence integral growth with increasing gelatin concentrations
in jelly form................................................................................................... 135
Figure 4-9: Three 1 hr bleaching curves for gelatin. ...................................................... 136
Figure 4-10: Gelatin control experiments showing texture variation during the
experiments. .................................................................................................. 137
Figure 4-11: Fluorescence of three gelatin samples measured on different days
using in vivo apparatus .................................................................................. 138
Figure 4-12: (A, left) Raw spectra of melanin solutions at various
concentrations with 100 nm pore-size filtration; (B, right) Linear fit
of fluorescence integrals vs. concentration for melanin.. ............................. 140
Figure 4-13: Photobleaching of 200 nm pore-size filtered melanin solution.. ............... 141
Figure 4-14: Bleaching curves of melanin with argon or oxygen purge. ....................... 142
Figure 4-15: NIR fluorescence of plasma at various concentrations. ............................. 144
Figure 4-16: Photobleaching study of plasma and Hb .................................................... 145
Figure 4-17: Recovery study of Hb photobleaching. ...................................................... 146
Figure 5-1: IE integrals collected on the same day for four individuals showing
the fluorescence from senior and diabetic patients are stronger than
others. ............................................................................................................ 153
Figure 5-2: One possible endogenous pathway of AGEs formation from the
free sugar D-glucose. .................................................................................... 156
xx
Figure 5-3: Molecular structure of pentosidine. ............................................................. 159
Figure 5-4: Normal processes of electron interaction with light inside a
molecule. ....................................................................................................... 162
Figure 5-5: Schematic drawing of singlet oxygen photosensitization.. .......................... 164
Figure 5-6: Mechanism of SOSG reacting with 1O2. ...................................................... 166
Figure 5-7: Browning of the TMX along the timeline of preparing the stock ................ 170
Figure 5-8: Fluorescence and bleaching properties of the TMX. ................................... 171
Figure 5-9: Fluorescence yields for various lysine, ribose, and arginine
combinations. ................................................................................................ 172
Figure 5-10: UV/Vis absorption peak growth for aliquots taken every 20 min
during the process of TMX synthesis ........................................................... 174
Figure 5-11: Baseline corrected absorption spectrum of pentosidine producing
TMX .............................................................................................................. 175
Figure 5-12: Difference absorption spectrum obtained by subtracting UV/Vis
absorption spectrum of TMX obtained after irradiation ............................... 176
Figure 5-13: Emission and excitation scans in UV/Vis spectral range for TMX
at various concentrations. .............................................................................. 177
Figure 5-14: NIR fluorescence of TMX at various concentrations. ............................... 178
Figure 5-15: Steady state and time gated emission of 10% TMX stock after
excitation at 385 nm. ..................................................................................... 180
Figure 5-16: Hypothetical photochemical process between pentosidine and
oxygen. .......................................................................................................... 182
Figure 5-17: Integrated emission using 785 nm excitation, as a function of time,
for solutions saturated with gases in the legend............................................ 183
Figure 5-18: Oxygen electrode response as a function of time for various
starting combinations of O2 concentration and TMX dilutions .................... 185
Figure 5-19: SOSG monitoring of 1O2 for different solutions with and without
NIR laser irradiation.. ................................................................................... 187
Figure 5-20: A close-up view of the same data sets shown in the bottom of
Figure 5-19. ................................................................................................... 188
xxi
Figure 5-21: Jabronski diagram of Gaussian calculated pentosidine singlet and
triplet excited states ....................................................................................... 189
Figure 5-22: Double logarithmic plots showing the laser power dependence of
TMX fluorescence under 450 mW 785 nm laser excitation. ........................ 193
Figure 6-1: IE vs. Time curves showing different shapes of pulses under two
pressures, a low and a high, in a single tissue modulated experiment
for a test subject.. .......................................................................................... 196
Figure 6-2: Sequence of 5 min raw spectra and fluorescence integrals from
extended irradiation by a 200 mW 785 nm NIR laser of a single
point on a saline perfused rat spinal cord. ..................................................... 198
Figure 6-3: Correlation between standard HemoCue Hb hemoglobin
measurements and LighTouchTM
Hematocrit measurements. ...................... 202
Figure 6-4: Hct estimations from measured Hb concentrations based on various
assumptions on mean corpuscular Hb concentrations.. ................................ 204
Figure A-1: Simplified drawing, not to scale, of tissue modulator. ................................ 217
Figure A-2: Screenshot of the “PDPM Settings” panel on LighTouchTM
GUI. ............. 218
Figure A-3: Schematic drawing of PDPM feedback cycle in set-up and
experiment process........................................................................................ 219
Figure A-4: Calibration curves of using different standard weights as
“Calibrate High Pressure”. ............................................................................ 220
Figure B-1: Screenshot of LighTouchTM
“Configuration Parameters” panel. ................ 222
xxii
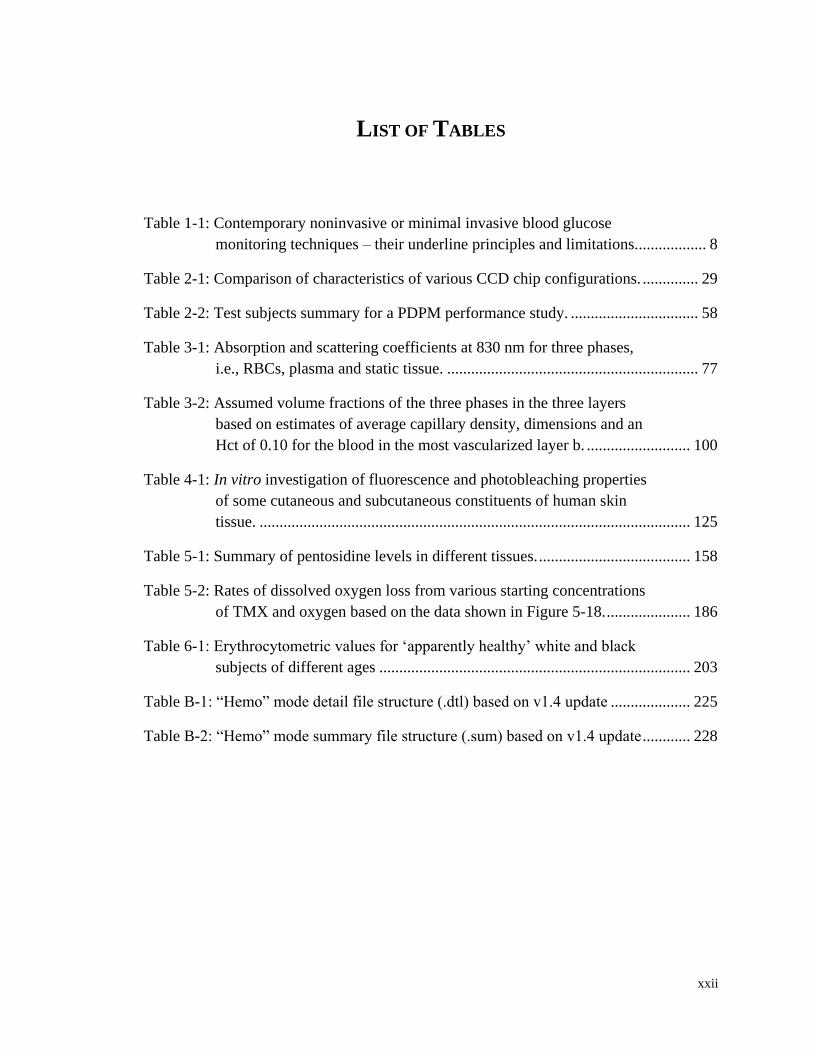
LIST OF TABLES
Table 1-1: Contemporary noninvasive or minimal invasive blood glucose
monitoring techniques – their underline principles and limitations. ................. 8
Table 2-1: Comparison of characteristics of various CCD chip configurations. .............. 29
Table 2-2: Test subjects summary for a PDPM performance study. ................................ 58
Table 3-1: Absorption and scattering coefficients at 830 nm for three phases,
i.e., RBCs, plasma and static tissue. ............................................................... 77
Table 3-2: Assumed volume fractions of the three phases in the three layers
based on estimates of average capillary density, dimensions and an
Hct of 0.10 for the blood in the most vascularized layer b. .......................... 100
Table 4-1: In vitro investigation of fluorescence and photobleaching properties
of some cutaneous and subcutaneous constituents of human skin
tissue. ............................................................................................................ 125
Table 5-1: Summary of pentosidine levels in different tissues. ...................................... 158
Table 5-2: Rates of dissolved oxygen loss from various starting concentrations
of TMX and oxygen based on the data shown in Figure 5-18. ..................... 186
Table 6-1: Erythrocytometric values for ‘apparently healthy’ white and black
subjects of different ages .............................................................................. 203
Table B-1: “Hemo” mode detail file structure (.dtl) based on v1.4 update .................... 225
Table B-2: “Hemo” mode summary file structure (.sum) based on v1.4 update ............ 228

1
1. INTRODUCTION
1.1 Motivation for Noninvasive Blood Analytes Monitoring
Today the physical principles behind the most common “state-of-the-art” medical
instruments can be traced back decades with the main differences between the “old” and
“new” devices entailing differences in the degree of automation involved. Such
differences mostly affect the degree to which operating the devices are physical labor
intensive, produce measurements that can be interpreted by less highly trained medical
practitioners, e.g., medical assistants, or can be networked in order to interface with
existing or planned patient telemetry systems. Essentially the current paradigms of
medical practice conventional laboratorial tests provide sufficient accuracy and
specificity to facilitate clinical diagnosis and treatment. But there are always increasingly
challenging demands for new and improved medical products.
For example in these times, in acknowledgment of the benefits of earlier diagnosis
and more prompt treatment, doctors and scientists are looking forward to subsequent
rounds of innovation. Minimal or noninvasive approaches to decrease stress and
discomfort, continuous monitoring to facilitate better disease control and therapy
management, and transportable or portable test kits to support point-of-care testing
(POCT) are a few examples of newly posed challenges in the medical device research
and development (R&D) community. Triggered by these, we set out seeking
spectroscopic applications in noninvasive continuous monitoring medical devices,
especially those offering blood analyte information.

2
As a specialized transportation vehicle between cells and tissues, blood contains
enormous critical health related information. Usually, blood is sampled through arterial
puncture, indwelling arterial catheters, venous blood draw or fingerpricks, and then sent
for lab test. These procedures suffer from drawbacks such as being clumsy during surgery,
having insufficient monitoring capability, as well as providing delayed feedback.
Therefore, such conventional laboratory techniques should certainly be improved in cases
where blood analytes information could indicate life-threatening conditions.
For example, in neurotrauma intensive care unit (NICU) the cardiopulmonary
monitoring of blood pH and bicarbonate concentration is particularly vital to high
intracranial pressure (ICP) patients as an indicator of airway, breathing and oxygenation
(1). Blood bicarbonate is also a critical diagnostic parameter for acute respiratory failure
(ARF) among chronic obstructive pulmonary disease (COPD) patients (2). In another
extreme scenario, internal hemorrhage after traumatic injuries, such as in the case of car
accidents and battlefield wounds, is well documented to be one of the most avoidable
common causes of death for all people between 18 and 45 years old (3, 4). However, as
research has shown, the delay in pre-hospital and in-hospital hemorrhage control is the
primary contributor to potential preventability (5, 6). A timely screening showing the
existence and location of any hidden internal bleeding before the patient is transported to
ICU will undoubtedly favor the rescuing of a life.
As examples speak for themselves, a noninvasive continuous fast in-situ blood
analytes monitoring system is in immediate need. Having drawn the attention of many
scientists, optical and spectroscopic methods are perhaps the most promising to achieve
such a goal. By solving the so-called “inverse problem” for the radiation transfer equation

3
(RTE), Tuchin et al. (7-9) from Saratov State University modeled the propagation of light
in turbid media, i.e., human tissue, thereby modeling the production of elastic emission
(EE, including Rayleigh/Mie) that can be detected experimentally. The reasonable
agreement between experiment and theoretical calculation suggests that such a treatment
accurately and precisely describes the average propagation and production of externally
observable, e.g., EE and fluorescence and Raman scattered light. Further, Chaiken and
Goodisman (10) exploited this in order to calculate the EE in their unique probing
geometry. This will be revisited in Section 3.3 of Chapter 3 in the context of testing the
new algorithm for measuring hematocrit (Hct) in blood.
As shown in Figure 1-1, human tissue is relatively “transparent” in the near infrared
(NIR) spectral range which gives us several “optical windows” (11-14) allowing NIR
light to penetrate up to several hundred microns into the skin. However, chance or false
correlations due to confounding factors and broad overlapping bands of NIR absorption
spectra have largely limited its use in noninvasive in vivo monitoring. To address this
obstacle, Arnold’s group (15, 16) from the University of Iowa started in early 1990s
using multivariate chemometrics, e.g., partial least square (PLS) and net analyte signal
(NAS), to eliminate such influence.

4
Figure 1-1: Principal light-absorbing molecules in the skin. Redrawn from Anderson
(14). The most penetrating wavelengths are from 600 to 1300 nm, the so-called “optical
window” of the skin.
Meanwhile, varieties of optical and spectroscopic approaches have been adopted to
study wide range of medical applications. Puppels et al. from Erasmus Medical College
Netherlands has applied Raman spectroscopy and microscopy in rapid identification of
pathogenic microorganisms (17), determination of atherosclerotic plaque composition (18,
19), and discrimination of healthy (20, 21) and cancerous tissues (22). The Feld group
from MIT has used endoscopic and optical tomography to image and diagnose cancer in
addition to noninvasive blood analysis, e.g., glucose (23-25). The Michael Morris group
from University of Michigan – Ann Arbor has done instrumentation (26) to analyze
mineral composition and related progressive bone diseases (27, 28). The biomedical
photonics lab from Vanderbilt University led by Prof. Anita Mahadevan-Jansen has

5
explored the optical imaging and diagnosis of cervical cancer (29), as well as optical
stimulation of neural tissues (30, 31).
Most importantly, the aforementioned researches in biomedical optics and
spectroscopy are largely depended on the advances in semiconductor, laser, high
precision opto-mechanical industries. Major innovations over the past 20 to 25 years
involving enabling technologies broke the old technical limits and significantly
broadened the applicability of fundamental optical and spectroscopic principles to
progressively more complicated problems. Recent advancement of NIR lasers, charge-
coupled device (CCD) detectors, compact spectrographs and effective laser rejection
filters have increased the instrumental sensitivity by factors as large as 105 plus decreased
both interferences and noise (32). A revolution of biomedical optics and spectroscopy is
on the nearest horizon.
Despite the fact that these various novel techniques have potential to be applied in
sensing many physiologically valuable blood analytes, such as bicarbonate, urea,
cholesterol and total protein, this project concentrates on noninvasive blood glucose
monitoring. Glucose is the most important carbohydrate in biology: a ubiquitous source
of energy and especially the only source of energy for the brain and nervous system.
Because of such importance, whenever the blood glucose is not properly regulated
various symptoms can occur. Metabolic homeostasis tightly controls the normal blood
glucose level between about 3.6 and 5.8 mM (64.8 and 104.4 mg/dl). Sudden
hypoglycemia (low blood sugar) hits the nervous system first and triggers drowsiness or
impaired cognitive function. In severe glucose deficiency, temporary memory loss, and
even fatal condition like coma could happen. In the short term, it is far more dangerous to

6
have too little glucose than too much. However in some diseases, diabetes mellitus for
example, hyperglycemia (high blood sugar) can be chronic. Diabetes itself is not
immediately lethal, but most diabetic patients actually die from the complications caused
by this continuous elevated blood sugar such as cardiovascular disease, chronic renal
failure, retinal damage, and neuropathy.
So far, diabetes is a serious disease that strikes 25.8 million, or 8.3% of the
population in the United States, according to the American Diabetes Association (ADA)
(33). Meticulous regulation of insulin intake based on intensive self-monitoring of the
blood glucose concentration is still the first recommended tactic for management of
diabetes mellitus by ADA. By far, the most widely adopted blood glucose self-
monitoring technique is the U.S. Food and Drug Administration (FDA) approved finger
stick capillary blood sampling method. However, few patients can comply with the
recommended 5 to 6 measurements per day consistently using this painful and infection-
risky approach. Even healthy people who might want to take some tests for prevention’s
sake are deterred. Sadly the truth is that early diagnosis has unfortunately been
consistently overlooked and it plays a critical part in successful treatment and delaying or
preventing some of the complications of diabetes. People’s reluctance to endure extra
pain and handle blood contributes to the failure of early diagnosis, leaving 27% of
diabetes undiagnosed until it is too late.
Under the industry’s current standard for point-of-care meters, readings may error up
to 20% from standardized concentrations of 75 mg/dL or less. That means a meter
reading of normoglycemia may actually be a failure to diagnose hypoglycemia, which as
mentioned earlier is a very severe and dangerous situation, and serious consequences may
7
occur. Although those meters are considered home-use or over the counter in vitro
diagnostic devices, some have been used professionally as a substitute for standardized
plasma glucose measurements in clinical settings. Therefore, FDA is not satisfied with
the performance of current commercial glucose meters and is recently considering
tightening the standards. It is a challenge for the conventional finger stick meters, and
also a chance for new technologies to step in.
The aforementioned opportunities and challenges comprise the motivations for the
current project of utilizing combined Raman and fluorescence spectroscopy in the
development of a noninvasive in vivo glucose monitoring system to assist in diabetes
therapy.
1.2 Contemporary Technologies
The commercial opportunity, as well as the advancement in bio-optical technologies,
drives the development of noninvasive blood glucose monitoring devices (34, 35). Table
1-1 lists the most popular contemporary technologies that have been adopted in pursuit
this ultimate goal. However, in order to get FDA approval as a substitute for finger stick
meters, noninvasive devices must provide straightforward glucose information from
blood, rather than any other indirect information, e.g., interstitial fluid (ISF) glucose
concentration. Therefore, products based on micro needle fluid harvesting, ocular
spectroscopy and iontophoresis, which do not obtain a glucose measurement directly
from blood, will have to face the public doubt concerning use of ISF or tear glucose as a
substitute for blood glucose (36, 37). For other electrical signal based technologies, such

8
as electromagnetic sensing and impedance spectroscopy, their measuring precision can
easily be influenced by minor temperature fluctuation (35). Similarly, thermal
spectroscopy cannot work under physiological or pathological conditions which would
also induce temperature variations (38).
Table 1-1: Contemporary noninvasive or minimal invasive blood glucose monitoring
techniques – their underline principles and limitations.
TECHNIQUE PRINCIPLE LIMITATIONS
NIR 750 – 2500 nm absorption Strong water absorption
MIR 2500 – 10000 nm absorption Poor penetration
OCT Interferometric signal Motion sensitive
Raman Laser induced Confounding factors
Polarization change Chiral molecule Scattering depolarization
Ultrasound Photoacoustic Sensitive to environment
Fluorescence Fluorescence intensity Ultraviolet excitation
Thermal Different approaches Pathological temp change
Ocular Chemical bond Glucose in tears
Impedance CNa+ & CK
+ change Various hydration status
Electromagnetic Dielectric parameters Temperature sensitive
Fluid harvesting Microscopic holes Glucose in ISF
Iontophoresis Glucose transportation Skin irritation, sweating
Major technological and scientific innovations over the past several decades have
significantly broadened the applicability of spectroscopy in exploring this challenging
project. Among all the optical and spectroscopic approaches, Raman spectroscopy is one
of the most intensively explored technique (20, 23, 39, 40). As stated earlier in Section

9
1.1, in NIR spectral range, human tissue is relatively “transparent” which gives us several
“spectral windows” (11, 12) to allow more light to penetrate into the tissue. For example,
the penetration depth of the in-house LighTouchTM
device is about 600 µm, which is deep
enough to shed light on the epidermis and superficial part of dermis layer where the
blood perfusion is acceptable (3 to 5%) particularly in fingertips (41-43). Furthermore,
fundamental vibrations observed by Raman are sharper and have less overlap with other
bands from the same and other molecules compared with NIR absorption or “diffuse
reflectance” bands that predominantly involve overtones and combinations. Water,
protein and lipids all have badly overlapping absorption bands in the NIR absorption
spectra. But water, comprising 60% of body weight and 95% of blood (44), has a very
small Raman cross section.
Nevertheless, major challenges for Raman spectroscopy include the presence of a
strong background fluorescence signal and inherently low signal-to-noise ratios (SNR)
(32). In general, the quantitative detection limit for spontaneous Raman scattering
technology is roughly 10-3
M. However, the physiological glucose concentration, even for
the hypoglycemic patient, is rarely less than about 2.3 mM. Our lab, from 1998 to recent
years, published a sequence of papers (45-51) on the development of a novel tissue
modulated NIR Raman spectrometer and in those cases demonstrated a detection limit of
about 4.45 mM with a precision of 1.22 mM in vivo (50). These specifications are
comparable to existing finger stick technology but better performance is possible.
10
1.3 Tissue Modulated Raman Spectroscopy
Transdermal in vivo spectroscopic analysis or imaging of tissue analysis involving
NIR excitation always produces some broadband NIR fluorescence that, depending on
what spectroscopy is being employed, can degrade SNR and dynamic range. Hardware
and software have been devised to perform wavelength shifting, time gating, frequency
domain first- and second- order derivatives, and simple or modified polynomial curve
fitting (52, 53) for the purpose of fluorescence suppression. However, their
implementation either relies on spurious assumptions, laborious spectroscopic system
modification or user intervention, which makes them less reliable, time consuming and
less commercially viable.
Tissue modulation as a methodology attempts to obtain more information in a
measurement cycle and the measurement cycle is designed specifically for differentiating
blood information from that of static tissue in vivo. Properly executed modulated spectra
can reduce the fluorescence contribution to closer to that of the Raman contribution and
also provide information bearing on the physiology of the probed tissue. As shown in
Figure 1-2, tissue modulation is the use of spatiotemporally localized mechanical,
thermal, chemical and/or other external influences to manipulate the mobile components,
i.e., blood of the probed volume, relative to the static components. Thus, the resulting
difference spectra could be used to isolate the spectral features of blood components from
those of static tissues. The idea behind this approach is analogous to the difference
spectroscopy which is widely adopted in infrared absorption spectroscopy to eliminate
background interference and extract a signal of interest.
11
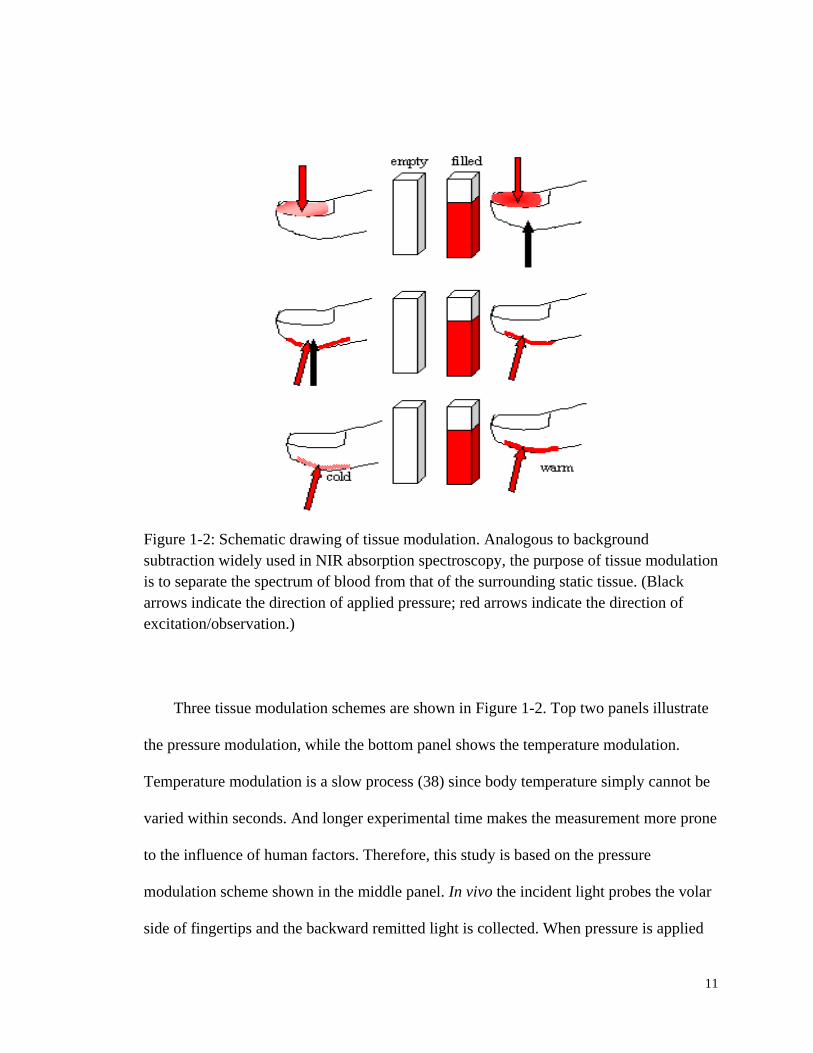
Figure 1-2: Schematic drawing of tissue modulation. Analogous to background
subtraction widely used in NIR absorption spectroscopy, the purpose of tissue modulation
is to separate the spectrum of blood from that of the surrounding static tissue. (Black
arrows indicate the direction of applied pressure; red arrows indicate the direction of
excitation/observation.)
Three tissue modulation schemes are shown in Figure 1-2. Top two panels illustrate
the pressure modulation, while the bottom panel shows the temperature modulation.
Temperature modulation is a slow process (38) since body temperature simply cannot be
varied within seconds. And longer experimental time makes the measurement more prone
to the influence of human factors. Therefore, this study is based on the pressure
modulation scheme shown in the middle panel. In vivo the incident light probes the volar
side of fingertips and the backward remitted light is collected. When pressure is applied
12
adjacent to the probed volume as suggested by the black arrow in the middle panel of
Figure 1-2, blood travels from the venous side to outside the probed volume creating an
effect analogous to an “empty cuvette”. Therefore, by subtracting spectra with pressure
from the corresponding ones at lower pressure, i.e., a “full cuvette”, one can get
differential spectra that manifest the effect of blood on the spectroscopy and tissue optics
of the whole probed volume.
To achieve a successful modulation, the ideal scenario is that in the unpressed part of
the measurement cycle the applied force is well below threshold so that sufficient blood
perfusion is guaranteed and the capillaries can maintain mechanical stability. While in the
pressed part of the tissue modulation cycle the force is only slightly above the threshold
of capillary collapse so that blood is modulated, i.e., moved, but limited deformation is
introduced to static tissue. The difference spectrum will thus contain a minimum
contribution from static tissue and be mostly composed of blood borne Raman and
fluorescence features. This additional contribution to the difference spectrum is due to
different light propagation, i.e., turbidity, because of the modulated blood. This
contribution is calculated using the same algorithm as for hematocrit to be described later
in Section 3.3 of Chapter 3.
1.4 Terminology
In the tissue modulated Raman spectroscopy, there are several terms that will be
frequently repeated in the following context. Therefore, it would be beneficial to make
the terminology clear first before we go in-depth justification and discussion in the
13
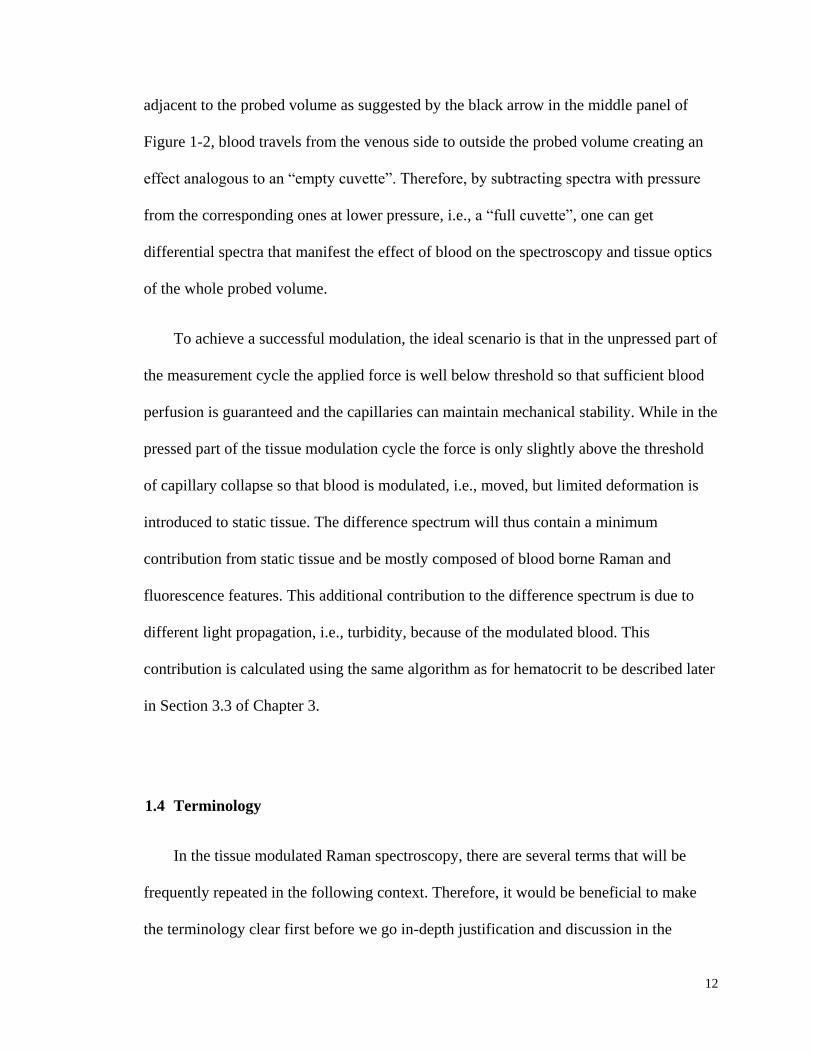
subsequent chapters. Figure 1-3 shows a typical 20 ms frame spectrum of a human volar
side of fingertip under 200 mW 830 nm laser exposure. By scrupulously adjusting the
laser line rejecting filter to make sure no signal saturation occurs at the Rayleigh line, two
piece of separate information could be obtained simultaneously:
0 200 400 600 800 1000 1200 1400 1600
0
200
400
600
800
1000
1200
1400
1600
1800
2000
2200
2400
2600
2800
0 200 400 600 800 1000 1200 1400 1600
0
50
100
150
200
250
300
350
400
co
un
ts
Raman shift cm-1
counts
Raman shift (cm-1)
Rayleigh (EE)
fluorescence and Raman (IE)
> 50,000 counts
Figure 1-3: Raw typical single 20 ms frame of Andor CCD output for the volar side of
human fingertip under 200 mW 830 nm exposure. Shaded areas show the integrals for IE
(500 to 1750 cm-1
) and EE (-30 to +10 cm-1
) respectively. Insert: the same frame on an
expanded scale to show the sections of emission integrated to obtain combined
fluorescence and Raman emission, i.e., IE.
i) The elastically scattered light, or elastic emission (EE), contains only reflected
or scattered light that no wavelength shift has occurred. The EE integral covers
the Raman shift from -30 to +10 cm-1
on a spectrum and the overwhelmingly
14
majority of it is Rayleigh and Mie scattering light. EE, a probe based on
physical optics, provides information relating to the presence and disposition of
red blood cells (RBCs) in the probed volume.
ii) The inelastically scattered light, or inelastic emission (IE), is the spectral region
that is chosen to exclude as much as possible of the Rayleigh line and off-axis
reflected light from the outermost stratum corneum. Based on the current
system setup, the Raman shift range from 500 to 1750 cm-1
which is comprised
of undifferentiated Raman scattering and fluorescence is chosen to represent the
IE integral. As a feature of vibronic spectroscopy, IE provides chemically
specific and quantitative information concerning molecules in complex mixtures
such as blood in vivo.
All of the in vivo data are exclusively collected using custom LighTouchTM
software
programmed by Critical Link (Critical Link, LLC, Syracuse, NY, USA). A typical tissue
modulated experiment takes 200 sec, however 20, 50 and 100 sec experiments are also
performed based on the purpose of a study. The single frame exposure is maintained
constant at 20 ms. Thus, for a typical 200 sec experiment ten thousand frames of such 20
ms spectrum like the one shown in Figure 1-3 are collected. Toward the end of each
experiment the IE and EE integrals for each frame are calculated and plotted against
frame numbers, which are basically the time axis. An example of such IE vs. frame
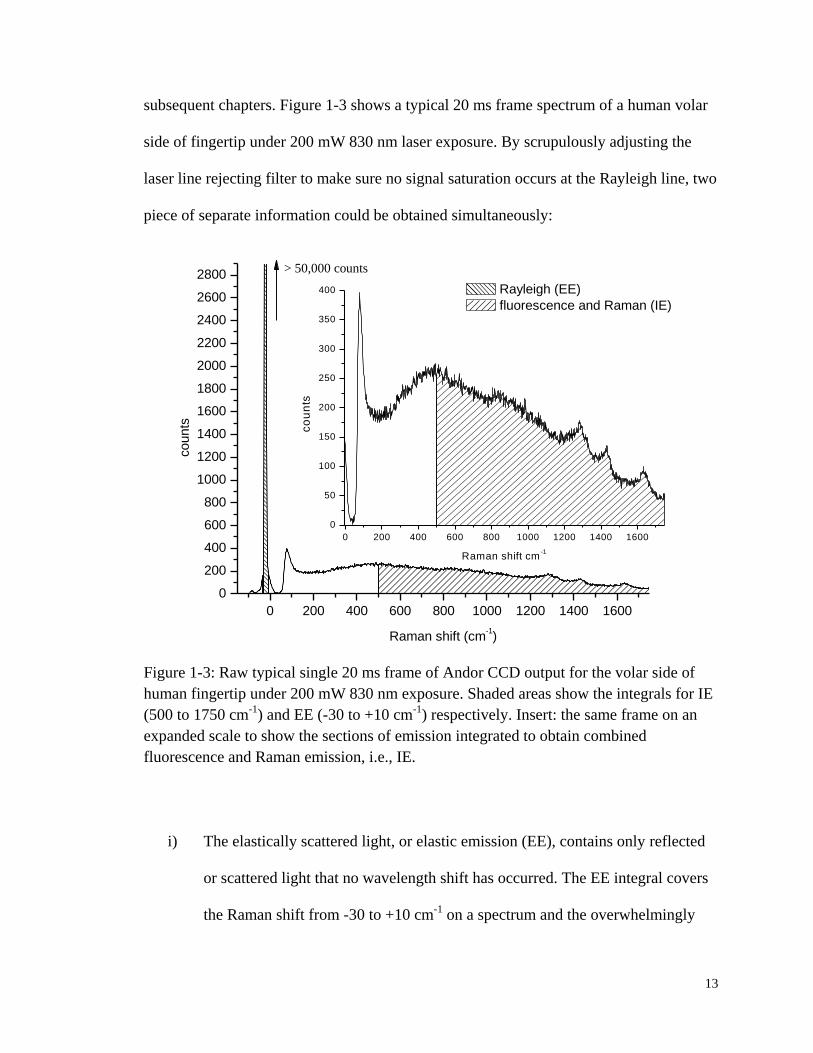
numbers curve is shown in Figure 1-4.
15
Figure 1-4: Screenshot of a BV vs. Time curve generated within the custom LighTouchTM
software. The panel below shows a close-up look of only eleven IE integrals from the
curve. Each blue dot indicates an individual IE integral calculation based on a 20 ms
single frame spectrum.
In earlier work with noninvasive glucose monitoring (54), using IE was proposed as
a measure of probed volume or blood volume (BV) in a modulated approach. Despite the
very low volume fraction (41-44) of RBCs, the optical constants of plasma, RBCs, and
other skin constituent materials are such that the net propagation of light is mostly
determined by the RBCs. Empirically, this is especially true for EE. Therefore, the IE vs.
frame numbers and EE vs. frame numbers curves are thereinafter mentioned
interchangeably as BV vs. Time and RBC vs. Time curves respectively. Detailed
discussion will be continued in Chapter 3.
1.5 Previous Work and Limitations
Since 1998, most previous work (45-51, 54) has been done in the following aspects:

16
i) The earliest research was conducted to collect in vitro evidence for
demonstrating the feasibility of the noninvasive spectroscopic approach to
quantitative glucose level determination. Raman spectra of various chemicals
presented in blood, such as glucose, hemoglobin (Hb), albumin, urea, tyrosine,
bicarbonate and glutathione have been investigated in either crystalline,
solution, or gelatin tissue phantom forms. (54) This comprehensive work led to
the selection of 373-686 cm-1
Raman shift range as an indicator of glucose
concentration. Since this range corresponds to two very strong Raman of
glucose skeletal modes at 423 cm-1
and 547 cm-1
and has little interference with
prominent protein peaks, quantitative measurements using these features
reached the resolution of ±1.5 mM in vitro. However, Raman spectroscopy’s
millimolar sensitivity may not be achievable when applying to in vivo
physiological environment. It is also worthwhile to notice that despite the
chemical and optical similarities with human epidermal tissue gelatin phantom
can only be used as a calibration tool. Human factors, which will be elaborated
later in Chapter 2, need to be considered to further understand the limitations
and potentials of such technology.
ii) Earlier work applied the concept of tissue modulation to the in vivo glucose
concentration calculation. Previous work achieved acceptable results in a
clinical study on 41 individuals in cooperation with the Joslin Diabetes Center
at Upstate Medical University in Syracuse, NY. In this stage, to improve the
accuracy and sensitivity, a more rigorous approach should be sought to utilize

17
the information encoded in Raman, fluorescence, as well as Rayleigh scattering
emission, rather than just a crude subtraction.
iii) The earlier research led to advanced instrument development including the
tissue modulator (TM) (46). The previous prototypes made progress in
maintaining the stable pressure applied to the back of fingertips, but there was
no way to tell exactly how much force was exerted. Therefore, it was hard to
fulfill the same setting across various test subjects. Besides, in the R&D phase
of a product, it is important to monitor the changes in force and pressure in
order to better control variables, design reproducible experiments and interpret
any abnormal outcomes. A human-machine interface which can offer real-time
force, contact area and pressure feedback and thus in turn perform better motion
control is a necessity.
Aware of the limitation of previous research, the current work is to incorporate the
human errors that have not been previously considered and interpret the modulated
spectra in a much more systematic way. By interpreting a viable theoretical model we
strive to engineer appropriate solutions that further improve the reproducibility, stability
and sensitivity of this tissue modulated quantitative noninvasive in vivo Raman
spectroscopy technique for blood analyte sensing.
1.6 Overall Scope of the Dissertation
This research is part of an ongoing project aimed at the application of combined NIR
Raman and fluorescence spectroscopy to noninvasive in vivo blood analysis including but
18
not limited to glucose monitoring. Coping with practicalities of human factors and
exploring ways to obtain and use knowledge gained about autofluorescence to improve
algorithms for blood and tissue analysis are the general goals of the long term project.
Based on the various results from this long-term project that was initiated in 1998, this
doctoral research aims at tackling two main factors that can degrade the analyte specific
spectroscopic signal: human factors and autofluorescence background. These are two
different types of research challenges and so they will be introduced separately.
Previous research results show that the raw spectroscopic signals must be obtained
from a well-defined location on stationary, perfusion controlled and monitored,
plethysmographically confirmed tissue, and achieving this involves coping with the so-
called “human factors”. Human factors arise inevitably in the design and engineering of
all medical devices that try to obtain signal from a transducer directly connected to the
human body. In this thesis, we adopt a novel pressure based, tissue modulation
methodology in order to exploit the spectroscopic benefits of differential spectra. Results
have shown a dramatic improvement of stability by introducing an advanced human-
machine interface, called “position detector pressure monitor” (PDPM). Given the PDPM
we can methodically investigate the influences of skin tone, fingertip topography, skin
hydration and possibly long term hyperglycemia on the precision, reproducibility and
accuracy of the spectroscopic signals. PDPM measurements provide a synchronized
plethysmographic record that complements the optical record.
The totality of the volume of tissue probed remits a background fluorescence signal,
i.e., “autofluorescence”, which cannot be removed from either the Raman scattered light
or other identifiable, e.g., Hb, sources of fluorescence. Of the spectroscopic signals
19
available, usually any fluorescence background is not desirable when Raman is wanted.
On the other hand it can be critical when or if it can be used as a measure of plasma
volume and perhaps tissue volumes generally. Results have shown an interesting
quenching of fluorescence which does not necessarily come from blood. Therefore, in-
depth study in vitro and in vivo of potential fluorophores in static tissue and blood is
performed. Pentosidine, an advanced glycation endproduct (AGE) that can be found in
most tissues, has emerged as a central player and further study is conducted to uncover
and quantify its fluorescence and quenching mechanism.
1.7 Specific Hypothesis
i) Some human factors, such as a) spontaneous tremor, and b) fingertip
topography variance, can be controlled or coped with using an advanced
human-machine interface, PDPM.
ii) Given that inelastic scattering emission (IE) and elastic scattering emission (EE)
contain complementary optical information from the same skin constituents
(static tissue and whole blood) through two different processes, relative volume
percentage change of these constituents could be deduced from simultaneous
EE and IE measurements.
iii) Autofluorescence quenching is due to laser exposure; potential candidates that
contribute to the observed fluorescence include but are not limited to collagen,
melanin, Hb, and albumin.

20
iv) Observed superabundant autofluorescence from aged and long-term
hyperglycemia subjects is related with the abundance of advanced glycation
endproducts (AGEs) within the skin. We further hypothesize that their
photodynamic characteristics are related to dissolved oxygen.
1.8 Layout of the Dissertation
The dissertation is organized in the following chapters:
Chapter 1 will first address the necessity and significance of this research for the
public health. This is followed by a brief introduction to the fundamental concepts of
tissue modulated NIR Raman and fluorescence spectroscopy in the context of other
published noninvasive human blood analytes sensing technology. A summary of previous
achievements of the Chaiken/LighTouch Group is followed by a statement of the scope
of the thesis and the hypothesis that is going to tackle.
Chapter 2 is designated, first of all, to demonstrate why human factors are relevant
to this study. Some specific sources of errors attributed to human factors are located.
Later on, the innovation of a human-machine interface, called PDPM, is introduced.
Performance of the PDPM is quantitatively evaluated. How the PDPM feedback
information could be used to guide in vivo experimental set-up is also discussed.
Chapter 3 relates various in vivo empirical observations regarding human volar side
fingertip fluorescence quenching that any model will need to explain. Qualitative analysis
indicates the potential origins of the so observed phenomenon. The in vivo calibration for

21
a proposed hematocrit (Hct) algorithm deduced by using combined elastically and
inelastically scattered light is also described.
Chapter 4 puts the emphasis on a series of systematically performed in vitro
experiments intended to supplement the database for known ultraviolet/visible (UV/Vis)
chromophores to include their NIR excitation emission properties. Fluorescence of
various endogenous molecules, such as antioxidants, blood proteins, skin and cellular
pigments, are studied.
Chapter 5 focuses on the photochemistry of pentosidine, a specific representative of
the AGEs family. Exogenously synthesized pentosidine tri-mixture (TMX) is used to
study its NIR excitation induced fluorescence and bleaching characteristics. A
hypothetical mechanism to account for the autofluorescence photobleaching behavior
involving with dissolved oxygen is proposed and tested with multiple independent lines
of evidence.
Chapter 6 concludes the thesis and proposes areas for future work. Considering the
combined influence of human factors and photobleaching on quantitative analysis of
tissue modulated Raman spectroscopy, a standard pre-experimental procedure is
proposed to collect the spectral data in a much more systematic manner, thus greatly
improves the reproducibility and comparability across various test subjects.
22
2. IN VIVO APPARATUS INNOVATION
2.1 Introduction
2.1.1 Haptics of Volar Side of Human Fingertips
To obtain spectroscopic information from blood embedded in dermis, the incident
light must first penetrate the epidermis. How this occurs determines how the
subsequently remitted light must be detected and processed to yield the desired
information. Therefore managing, i.e., engineering, this initial process is essential to
making in vivo spectroscopic probing of humans more technology than art. The term
“haptics” refers to the sense of touch generally but often more specifically to the context
of the human-machine interface (HMI). In this chapter a number of issues are raised
relating to the specific and peculiar requirements that must be met by apparatus and
procedures to allow methodical and reproducible probing of fingertip skin tissues in vivo
noninvasively.
Initially the issue of choice of incident wavelength is discussed in some detail and it
will be clear that this choice is influenced by considerations beyond simple propagation
effects. The choice of which skin location to probe, detection schemes and apparatus
among other such issues are discussed and subsequently, a substantial effort is made to
describe the human factors engineering required to accommodate the highly irregularly
shaped, highly variable sized fingers of human beings. In addition to the physical
23
dimension challenges, the hands are all connected to a human brain and that poses
challenges of compliance that will also be discussed.
Propagation of light is affected by absorption and scattering losses and our goal is to
obtain information from the vessels above the superficial dermal plexus, i.e., the
capillaries between the skin surface and the superficial dermal plexus. One of the strong
NIR absorbers in human tissue is Hb, and the red blood cells (RBCs) are the strongest
Rayleigh/Mie scattering centers. As shown in Figure 2-1, despite the strong absorption
between 400 nm and 450 nm, the molar absorptivity in the NIR range is three orders of
magnitude less. Using a NIR excitation wavelength of either 785 nm, 805 nm, or 830 nm,
the depth of penetration (1/e) could reach above 1.0 mm without the consideration of
other factors.
However, melanin, which is another dominant absorber and also a strong scatterer,
heavily influences how light will propagate within the turbid tissue and its strong
absorption will further reduce the penetration depth. More importantly, the degree of
pigmentation, i.e., the level of melanin, is quite variable across different ethnic groups
and even across different individuals within the same group. Therefore, a testing site with
relatively uniform pigmentation among people should be chosen. There are several
candidates, namely the posterior chamber of eye, the tongue, the palm and the sole. First
of all, tongue is not an easily accessible site and there are also problems related with
hygiene concerns (11, 55). Secondly, areas around eyes are sensitive and pose special
risks. Tightly regulated permitted power of laser radiation together with limited blood
perfusion will produce a measurement with weak signal and low signal-to-noise ratio
(SNR).
24
Figure 2-1: (left y-axis) Molar absorbability of Hb and oxygenated Hb (mm-1
/M) (56);
(right y-axis) Depth of penetration of light to the 1/e point (57).
As shown in Figure 2-2(A), although the average thickness of epidermis is around
200 µm, on soles however, it can reach 1.5 mm, which is beyond the penetration of NIR
excitation to get into dermis. Speaking to the probing volume of interest, i.e., blood, the
capillary density of the palm is 2.5 to 3.5 times higher than that of the forearm, abdomen,
or thigh (58), and the fingertip appears to have an even higher capillary density than the
palm (59). A fingertip capillary blood vessels plastination model (60) is shown in Figure
2-2(B). As sensory probes to ascertain objects properties such as temperature, pressure,
vibration, texture and moisture (61), fingertips possess the second highest concentrations
of touch receptors and thermoreceptors among all areas of the human skin. Meanwhile,
25
anatomically speaking the fingertip is the second best perfused area in human body with a
capillary density of almost 9 loops per mm (62, 63). At around 500 µm, capillary loops
from the deeper layer vessels are already available. Previous calculation from our group
(46, 54) shows that earlier prototype is capable of 600 µm penetration into the skin to get
direct signal from blood. Therefore, volar side of human fingertip is practically the
optimal site of detection.
Figure 2-2: (A, left) A diagrammatic sectional view of human skin anatomy (62); (B,
right) Tissue sample of palmar vascular system prepared by plastination (60).
2.1.2 Optical Layouts of the In Vivo Apparatus
Compared to the earlier versions of LighTouchTM
in vivo system (46, 51), the latest
prototype, as shown schematically in Figure 2-3, keeps most of the geometric optical
layouts but makes significant changes to both the optics and CCD detector. All the in vivo
data presented throughout this paper, if not explicitly stated, are obtained using
continuous wave (CW) external cavity diode lasers (Process Instruments, Salt Lake, UT,

26
USA and Sacher Lasertechnik Tiger Model, Marburg, Germany) with a clean-up filter
(Semrock, Rochester, NY,USA). Due to the complicated errors caused by using an
optical window, which will be discussed shortly, the 830 nm NIR excitation is free space
coupled from the laser to the fingertip using a 15 cm focal length lens. In order to achieve
reliable and reproducible optical registration the volar side of a fingertip is placed in
contact with a rigid flat stiff spring steel surface having a 2 mm hole, chamfered 15° on
the side facing the incident light. The size of this hole and the chamfering are chosen to
minimize extrusion of tissue and to minimize the scattered light produced by interaction
of the laser with the edges of the hole.
Figure 2-3: Schematic diagrams of optical layouts of the current in vivo apparatus.
Based on calculations (10), an angle of incidence of 53°, i.e., the Brewster’s Angle
for an air-water interface, gives optimal results. It is primarily due to the fact that human
tissue is mostly composed of water, and the Brewster’s Angle from air to water allows

27
the best penetration into the skin instead of being scattered or reflected from the surface.
Therefore, the incident light that actually reaches the flat plane of the spring steel plate,
instead of being a perfectly round spot, produces an elliptical spot with a 100 µm minor
axis and 237 µm major axis. A microscope image of a ZAP-IT®
paper burn hole is shown
in Figure 2-4. The hole is created by allowing a 20 µs blip of incident light onto the ZAP-
IT®
paper to create a detailed mark of the laser. The measurement of the laser spot size is
made where the beam energy density is big enough to burn through the coated layer of
the paper. For the image shown, an 830 nm Process Instruments laser is driven by a 2300
mA current, which generates approximately 180 mW output emissions measured by an
optical power meter (Model 1830-C, Newport Corporation, Irvine, CA, USA).
Despite the capability of higher throughput capacity of the CW laser, the maximum
NIR power that we have ever used on any human subject is no more than 200 mW,
according to the Crouse Hospital Institutional Research Board (IRB) approval. Very rare
cases have been reported to cause small superficial tissue burns on unclean skin at 200
mW CW power at 830 nm after as much as 200 sec. Others (64) have been granted IRB
approval for using as much as 300 mW NIR laser on human forearm tissue and there
were no obvious safety issues. As will be shown in Chapter 3, at this power level, it is
readily sufficient to obtain spectra with good sensitivity and reproducibility in relatively
short time.

28
Figure 2-4: A microscope image of a ZAP-IT®
paper burn hole. The driving current of
2300 mA (equivalent of 180 mW output) is applied to a Process Instruments 830 nm CW
laser. Image is taken using a Stereo Discovery V8 Stereomicroscope (Carl Zeiss, Inc.,
Oberkochen, Germany).
All optics must be thin and fused silica, e.g., Corning HPF Series, particularly in the
excitation side, to reduce background fluorescence and Raman originating with the lenses.
However the optics can be thick on the collection side of the optical system because the
total signal power incident on the first collection lens is very small, i.e., approximately
equal to four to five orders of magnitude smaller than the incident laser power. Back
scattered light containing physiological information is collected by an optical train
consisting of a custom triplet collection lens (Avo Photonics, Inc., Horsham, PA, USA),
followed by a laser line filter (Semrock 830nm Razor Edge, Rochester, NY, USA), and
then a custom doublet refocusing lens (Edmund Optics, f=50 mm, Barrington, NJ, USA).
A 61-fiber bundle presents an anti-reflection coated circular target to the refocusing lens
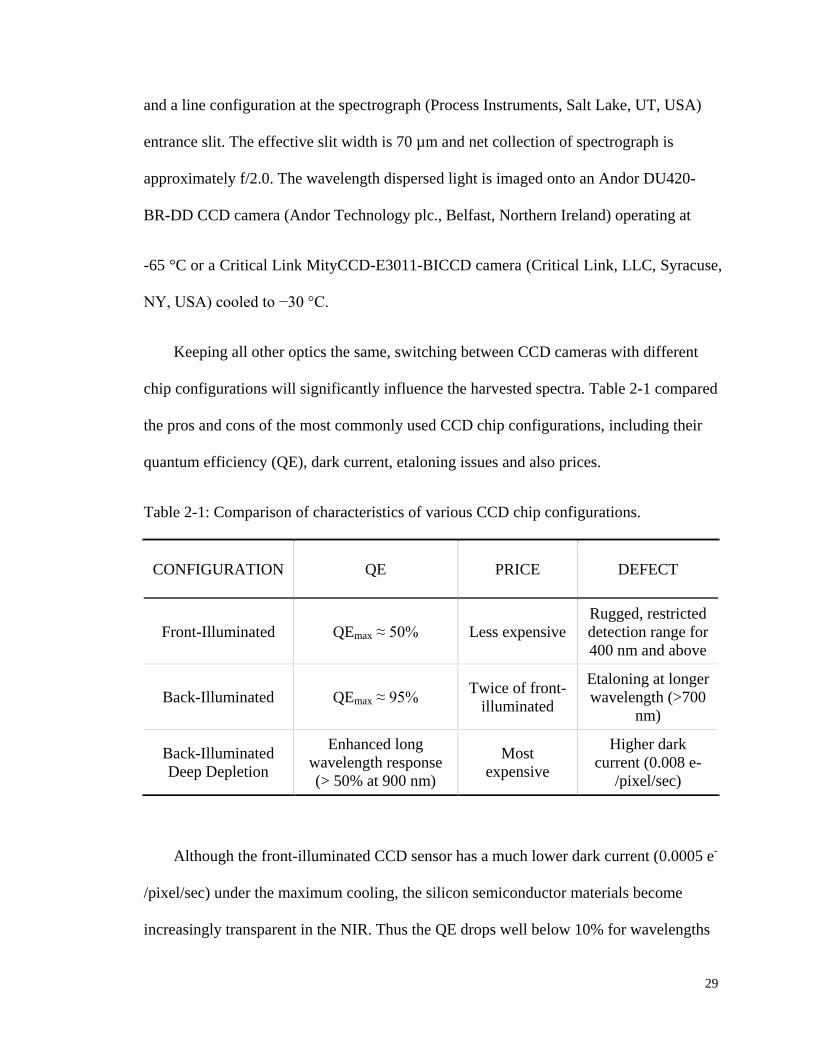
29
and a line configuration at the spectrograph (Process Instruments, Salt Lake, UT, USA)
entrance slit. The effective slit width is 70 µm and net collection of spectrograph is
approximately f/2.0. The wavelength dispersed light is imaged onto an Andor DU420-
BR-DD CCD camera (Andor Technology plc., Belfast, Northern Ireland) operating at
-65 °C or a Critical Link MityCCD-E3011-BICCD camera (Critical Link, LLC, Syracuse,
NY, USA) cooled to −30 °C.
Keeping all other optics the same, switching between CCD cameras with different
chip configurations will significantly influence the harvested spectra. Table 2-1 compared
the pros and cons of the most commonly used CCD chip configurations, including their
quantum efficiency (QE), dark current, etaloning issues and also prices.
Table 2-1: Comparison of characteristics of various CCD chip configurations.
Although the front-illuminated CCD sensor has a much lower dark current (0.0005 e-
/pixel/sec) under the maximum cooling, the silicon semiconductor materials become
increasingly transparent in the NIR. Thus the QE drops well below 10% for wavelengths
CONFIGURATION QE PRICE DEFECT
Front-Illuminated QEmax ≈ 50% Less expensive
Rugged, restricted
detection range for
400 nm and above
Back-Illuminated QEmax ≈ 95% Twice of front-
illuminated
Etaloning at longer
wavelength (>700
nm)
Back-Illuminated
Deep Depletion
Enhanced long
wavelength response
(> 50% at 900 nm)
Most
expensive
Higher dark
current (0.008 e-
/pixel/sec)
30
above 1000 nm. As a tradeoff, the Critical Link camera uses a back-illuminated
configuration to gain extra QE in the NIR spectral range. However, etaloning at
wavelengths above 700 nm is observed, which complicates the interpretation of the
Raman features.
Most of the in vivo data before the end of 2009 were collected using the Andor back-
illuminated deep depletion CCD camera. The deep depletion CCD chip is comprised of
high-resistance silicon with a highly doped structure that boosts the QE to above 50% at
900 nm. Nevertheless, non-negligible thermal background noise hurts the SNR. Using
extra coolant or liquid nitrogen cooling, the dark current density can be effectively
lowered to around 0.008 e-/pixel/sec. Dark current decreases approximately twofold for
every 8 to 9 °C drop in CCD array temperature (32, 65). Especially, at low temperature
ranges, 1 °C change of temperature changes a significant amount of dark current. This
means that whenever deep cooling (-80 to -100 °C) is desired, the temperature must be
maintained with high precision. Therefore, besides the coolant circulation system, the
Andor camera is also equipped with an extra temperature control box. It is thus
unrealistic to make a portable version with such a bulky unit. By contrast, the Critical
Link camera uses only a Peltier thermoelectric cooling to -30 °C with no need of precise
temperature control. It is clear that tradeoffs in CCD camera selection are inevitable, and
two cameras are used for different purposes of study.
Now it comes to the discussion of whether or not to use a window to attain optical
registration with the probed tissue. When IE is used as a part of the measurement process,
any fluorescence or Raman scattering from a window material, or even Rayleigh/Mie
process involving the window that produces highly off-axis elastic photon emission (66),
31
adds a background to all measurements and thereby a shot noise contribution that cannot
be eliminated. In the optical layout and configuration the depth of focus of the input
coupling lens ensures that some of the incident light will be focused inside the window, at
or very near the focus of our very fast emission collection system. It is not possible to
include any window surface, or wire grid or other approach spanning the orifice, that is
not a source of excessive stray light of all kinds, e.g., Raman, Rayleigh, fluorescence. It is
possible to exclude a large proportion of light from the window-laser interaction using
more optics and confocal apertures (67) in the collection train but not without sacrifice of
simplicity, extreme loss of total signal, and imposition of spatial resolution that does
more harm than good to the overall measurement process. Achieving maximum SNR is
one strong reason to free space couple the probing light into the tissue without use of a
window and thereby eliminate or at least minimize related noise contributions. Also,
improved SNR by not using a window allows a decreased measurement time and shorter
measurement times favor better control of human factors, i.e., extraneous motion, tremors,
etc., which will be discussed in the following section.
2.1.3 Human Factors
Human factors (HFs), or cognitive ergonomics, involve the engineering of what we
know about human capabilities and limitations to the design of equipment and devices in
order to enable more productive, safe, and effective use (68). It has gained attention to
increasing number of healthcare device manufacturers, such as Masimo, who recently
release a new signal extraction technology (69, 70) to their pulse oximeters (the Masimo

32
“SET” series). This technology is mainly focused on using algorithm to eliminate the
extreme motion artifacts.
One example of the most obvious HFs pertinent to our study is force or pressure
maintenance. The delicate threshold force of blood flow disruption requires an active
part to exert the additional force during modulation and the force needs to be controlled
with a precision of ±0.1 N. However, due to the intrinsic limitations of human control, no
matter how hard one would try, the human sense of touch is inadequate in the contact
force range as low as 1-2 N. When trying to maintain 100 mmHg, the normal mean
arterial pressure (MAP), for a 1 cm2 fingertip, the total force needed will be 1.33 N. It is a
substantially small force that needs additional assistance involving human factor
engineering to maintain. Human factor engineering has become a notable part of the
design of many modern safety critical systems, especially in the delivery of healthcare. In
many cases it focuses on HMI, which by the definition of FDA (71) includes all
components and accessories necessary to operate and properly maintain the device.
Apparently when tissue is pressed against an open aperture of the correct size the
stress field is less a reflection of the shape of the underlying bone and the exact
positioning of the tissues and more of the viscoelastic properties of the local tissue,
including the possible motion of subsurface tissues, i.e., blood. Yet for a free space
coupled interface like the current LighTouchTM
prototype, human factors are such that
there is inherent variability in contacting different sized and shaped fingers or even the
same finger at different times to the same aperture, no matter how the aperture is formed.
Moreover, choosing to probe through an open aperture is at the expense of having to
accommodate other HFs associated with some intrinsic characteristics of fingertip tissues:
33
i) Fingerprints: All skin has surface topography, even relatively smooth forearm
skin, and the effect on optical probing can be anticipated (10) using Fresnel’s
equations. Ridged skin (72) such as is found on volar side fingertips provides an
important thermoregulation function and due to the uniqueness in patterns and
minutiae of each person fingerprints are widely used in forensic science and
security applications. However, depending on the relative size of the probing
light beam and the scale of surface topographical features, the presence of
topography may lead the results to have a strong dependence on the placement
of the laser beam on the skin surface. As showed earlier in Figure 2-4, the size
of the incident laser spot (100 µm in minor axis and 237 µm in major axis) is
commensurate with the breadth of fingertip ridges (on average 480 µm for male
and 430 µm for female with a depth of 200-300 µm) (73). Whether the light
contacts the skin on top of a ridge or at the bottom of a furrow directly
determines the local angle of incidence and thus the propagation into the tissue.
Therefore, in any optical instrument including the LighTouchTM
apparatus the
sample, e.g., the tissue, must be brought into reproducible registration with an
optical system.
ii) Fingertip doming: The collection side of the optical system is aligned to obtain
the maximum emission from the collecting cone by assuming a flat surface.
Although minor adjustment is made according to sample fingertip, the extrusion
into the optical orifice moved the center of incident light. Dome height also
varies among test subjects. Note that, now, in the context of probing skin
through an open aperture, the depth of focus of the incident laser beam can be
34
an advantage. Being much longer than any motion or extrusion of tissue caused
by doming or pressure in the direction of propagation of the incident laser, the
properties of the incident laser can be taken as constant regardless of the motion
of the tissue.
iii) Turgor: Turgor is the normal state of turgidity and tension in living cells. In
other words, it vividly shows the “puffiness” of a finger. The U.S. National
Institutes of Health (NIH) define it as “the skin’s ability to change shape and
return to normal (elasticity)” and use it as a sign to assess the degree of fluid
loss or dehydration. Turgor is also related with the extrusion into the aperture,
but empirical experience shows it is more relevant to skin impedance and the
resulting stability of the PDPM dots pattern (detailed in Section 2.2.3).
In an earlier study (50), the distribution of deviations between the noninvasive
LighTouch™ measurements and the reference fingerstick measurements reflected various
sources of random and systematic error. Better management of the measurement process
with regard to the aforementioned human factors emerged as a strategy for improvement
with feedback based on applied pressure and tissue placement.
2.1.4 Modulation Pressure
Research on human and machine haptics suggests that for contact forces below some
threshold, probably around 0.5 N, the blood vessels in the finger pad are barely affected
by compression (74, 75). Above that threshold, however, blood vessels in the region of
compression collapse and the blood is driven away from the contact area. As shown in
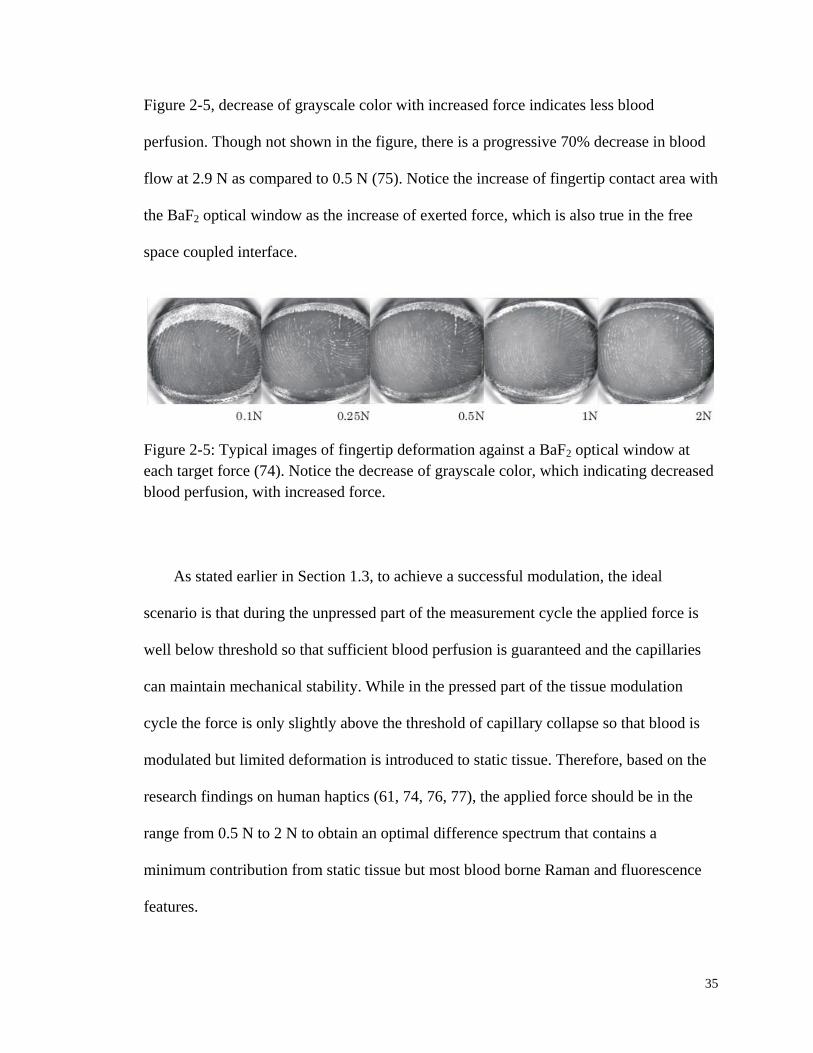
35
Figure 2-5, decrease of grayscale color with increased force indicates less blood
perfusion. Though not shown in the figure, there is a progressive 70% decrease in blood
flow at 2.9 N as compared to 0.5 N (75). Notice the increase of fingertip contact area with
the BaF2 optical window as the increase of exerted force, which is also true in the free
space coupled interface.
Figure 2-5: Typical images of fingertip deformation against a BaF2 optical window at
each target force (74). Notice the decrease of grayscale color, which indicating decreased
blood perfusion, with increased force.
As stated earlier in Section 1.3, to achieve a successful modulation, the ideal
scenario is that during the unpressed part of the measurement cycle the applied force is
well below threshold so that sufficient blood perfusion is guaranteed and the capillaries
can maintain mechanical stability. While in the pressed part of the tissue modulation
cycle the force is only slightly above the threshold of capillary collapse so that blood is
modulated but limited deformation is introduced to static tissue. Therefore, based on the
research findings on human haptics (61, 74, 76, 77), the applied force should be in the
range from 0.5 N to 2 N to obtain an optimal difference spectrum that contains a
minimum contribution from static tissue but most blood borne Raman and fluorescence
features.
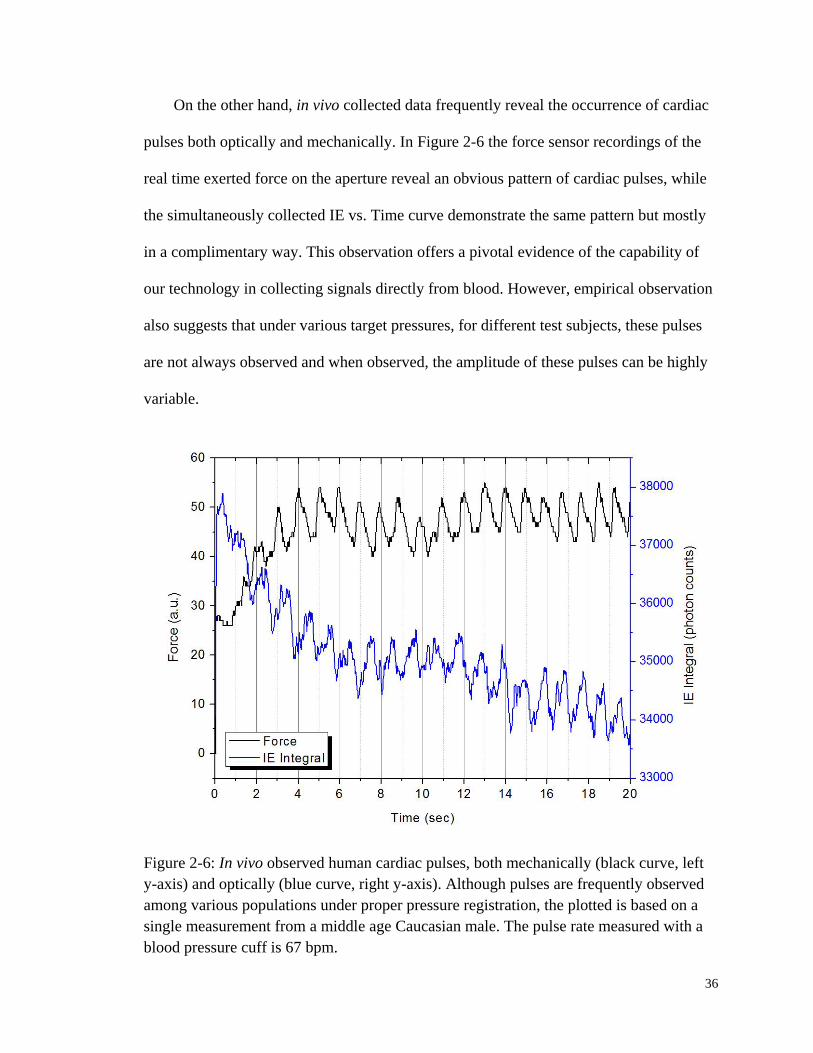
36
On the other hand, in vivo collected data frequently reveal the occurrence of cardiac
pulses both optically and mechanically. In Figure 2-6 the force sensor recordings of the
real time exerted force on the aperture reveal an obvious pattern of cardiac pulses, while
the simultaneously collected IE vs. Time curve demonstrate the same pattern but mostly
in a complimentary way. This observation offers a pivotal evidence of the capability of
our technology in collecting signals directly from blood. However, empirical observation
also suggests that under various target pressures, for different test subjects, these pulses
are not always observed and when observed, the amplitude of these pulses can be highly
variable.
Figure 2-6: In vivo observed human cardiac pulses, both mechanically (black curve, left
y-axis) and optically (blue curve, right y-axis). Although pulses are frequently observed
among various populations under proper pressure registration, the plotted is based on a
single measurement from a middle age Caucasian male. The pulse rate measured with a
blood pressure cuff is 67 bpm.

37
We postulate that the mechanism of this phenomenon is similar to the principles
applied in determining the blood pressure (BP). Generally speaking, there are three
mostly used techniques to take BP measurement: auscultatory, oscillometric, and
photoplethysmographic. The in vivo observed pulse response to the applied force or
pressure works in a very similar way as the oscillometric method. When fingertip is in
registration with the HMI that will be introduced in Section 2.2.2, the setup is analogous
to the upper arm confined by a sphygmomanometer cuff. Therefore, the electronic force
transducer senses the pressure fluctuations caused by the oscillation of blood flow.
Nowadays, the oscillometric measurement has been used as a standard among various
commercial automated noninvasive BP monitors.
Figure 2-7: Sample recording of cuff pressure during oscillometric blood pressure
measurements. Bottom panel shows oscillations in cuff pressure obtained by high pass
filtering above 0.5 Hz (78).

38
The upper panel of Figure 2-7 shows a typical oscillometric measurement cycle (78).
The automated pressure cuff is initially inflated rapidly above the systolic pressure as
indicated by the complete cessation of pulses and then deflated gradually. The recorded
cuff pressure is high-pass-filtered above 0.5 Hz to observe the pulsatile oscillations as
shown in the bottom panel of Figure 2-7. Clearly, on one hand, the cuff pressure
fluctuates with the pulses, while on the other hand the magnitude of the fluctuation varies
with the applied cuff pressure also.
It has been shown that the pressure at which the pulse oscillations have the
maximum amplitude is the mean arterial pressure (MAP). Knowing that MAP = 2/3
Pdiastolic + 1/3 Psystolic, the pulses are best sensed, i.e., the observed amplitude is maximized,
when the applied pressure is roughly the average of diastolic and systolic pressure. When
attempting to maintain a normal MAP of 100 mmHg for a test subject with 1 cm2
fingertip contact area, the force needed is 1.33 N. Such force is in the 0.5 – 2 N range for
optimal tissue modulation. Therefore, it is highly feasible to find a suitable applied
pressure range for each individual in order to guarantee best blood modulation while
maintaining a continuous flow. Last but not the least, it is worthwhile to note that after
performing an absolute pressure calibration the potential exists to design a LighTouchTM
device to measure pulse rate and BP with other analytical goals simultaneously.
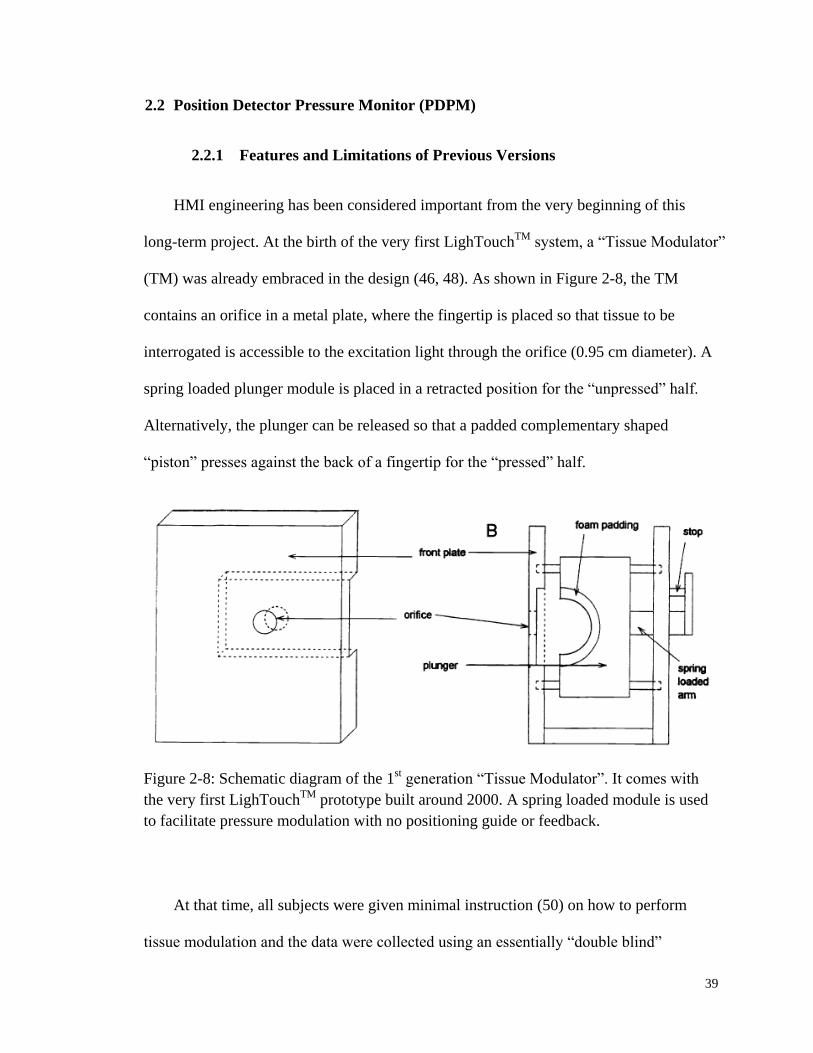
39
2.2 Position Detector Pressure Monitor (PDPM)
2.2.1 Features and Limitations of Previous Versions
HMI engineering has been considered important from the very beginning of this
long-term project. At the birth of the very first LighTouchTM
system, a “Tissue Modulator”
(TM) was already embraced in the design (46, 48). As shown in Figure 2-8, the TM
contains an orifice in a metal plate, where the fingertip is placed so that tissue to be
interrogated is accessible to the excitation light through the orifice (0.95 cm diameter). A
spring loaded plunger module is placed in a retracted position for the “unpressed” half.
Alternatively, the plunger can be released so that a padded complementary shaped
“piston” presses against the back of a fingertip for the “pressed” half.
Figure 2-8: Schematic diagram of the 1st generation “Tissue Modulator”. It comes with
the very first LighTouchTM
prototype built around 2000. A spring loaded module is used
to facilitate pressure modulation with no positioning guide or feedback.
At that time, all subjects were given minimal instruction (50) on how to perform
tissue modulation and the data were collected using an essentially “double blind”
40
procedure. The 2nd
generation TM comes along around 2006 and contains many
improvements over earlier prototype. Firstly, rubber Braille-like “nubs” are arranged near
the orifice to allow the test subject to orient the position of fingertip to the hole by way of
touch. Secondly, the TM also employs a load cell to measure the force applied to the
aperture. A linear array of several light emitting diodes (LEDs) in a pattern of red,
yellow, green, yellow, and red. During the modulation cycle, an audio cue is given to the
test subject while the LEDs light up depending on how much force is actually being
exerted. Light-up of the green LEDs indicate the desired force is met; while yellow LEDs
mean mediocre satisfactory force and red LEDs warn of way-off compliance. In this way,
real time feedback to the test subject could be offered.
As aforementioned in the engineering of first two generation TM modules (46, 48,
51), we employed muscle memory, visual memory, and visual and audio cues in order to
direct the test subject him/herself to apply the appropriate force and maintain an
appropriate finger posture in order to modulate the blood content of the capillaries.
Perhaps, not surprisingly, even when humans are given very accurate and precise
feedback, they vary in their competence to execute the required actions. Further, even if
compliance requires the test subject to be passive, as for an unconscious patient, the
probability of involuntary tremor and the known occurrence of inadvertent or
unconscious pressing or unpressing against the aperture by the test subject requires the
instrumentation to play an active role in producing, measuring, and recording the actual
position and actual applied stress field in the test subject.
It is also an empirical fact that pressure on the fingertip, even constant pressure, has
at least two effects. As mentioned in Section 2.1.3, the pressure causes “doming” or
41
extrusion of tissues into the aperture, i.e., the exposed skin surface is not flat,
independently of the presence or lack of ridges. In addition, over time, constant pressure
causes some fluid, e.g., blood, to flow out of the irradiated region, without many changes
to the static tissue. Note that as fluid moves in response to the applied pressure, the
contact area between the tissue and the surface containing the aperture, i.e., the
“modulating surface,” must increase necessitating an external real-time contact area
monitoring and pressure servo system in order to produce consistent results.
Thus, in addition to focusing our attention on the optical and spectroscopic issues of
a particular experimentation, it is helpful to have a record of the test subject’s actual
compliance (or noncompliance) during the measurement process in order to help sort out
motion and placement artifacts from actual spectroscopic content. Experience with each
of these and the desire to have a device that would be applicable to unconscious people
led us to seek a way to modulate the skin and blood automatically under external control.
2.2.2 Overall and General Description of Current PDPM
In what follows the current instrumentation and experimental methods used to obtain
reproducible and reliable measurements on fingertip capillary beds will be described. The
entire apparatus is coordinated using a C++ programmed graphical user interface (GUI),
with embedded MityDSP for the PDPM and in the CCD camera control. All transducers
are commercial-off-the-shelf and the circuitry needed to implement them is available
from their manufacturers. Initially an overview of apparatus and procedures will be given
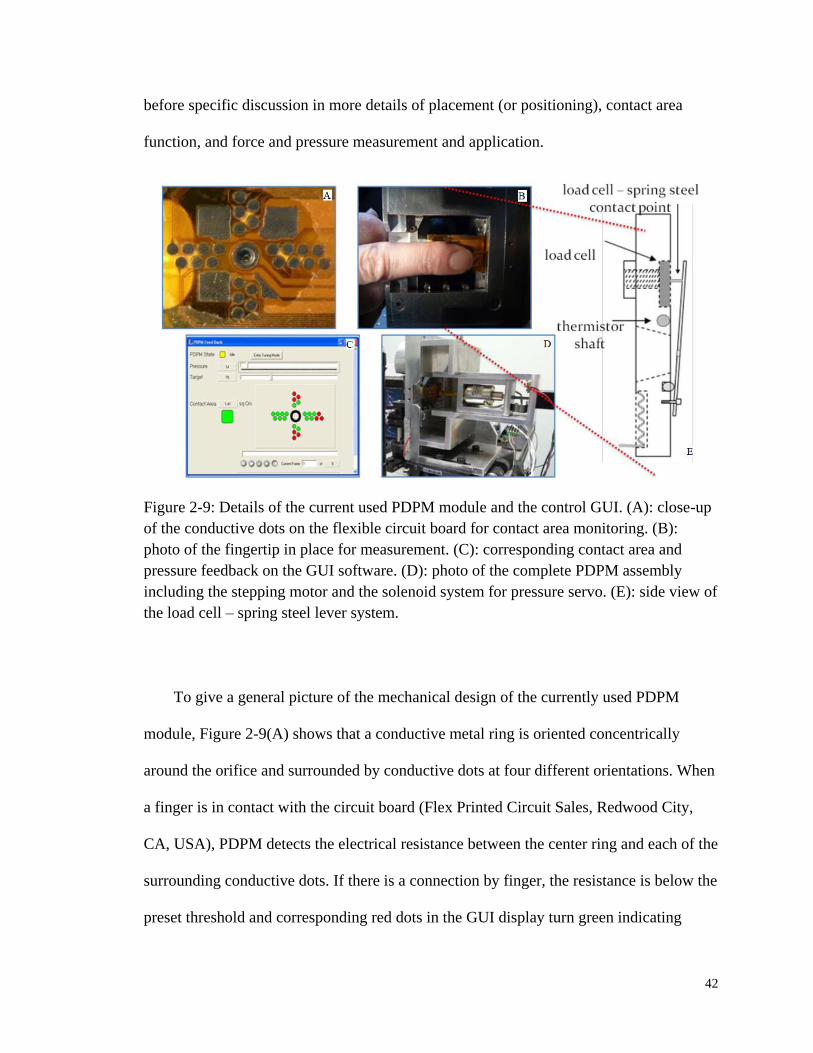
42
before specific discussion in more details of placement (or positioning), contact area
function, and force and pressure measurement and application.
Figure 2-9: Details of the current used PDPM module and the control GUI. (A): close-up
of the conductive dots on the flexible circuit board for contact area monitoring. (B):
photo of the fingertip in place for measurement. (C): corresponding contact area and
pressure feedback on the GUI software. (D): photo of the complete PDPM assembly
including the stepping motor and the solenoid system for pressure servo. (E): side view of
the load cell – spring steel lever system.
To give a general picture of the mechanical design of the currently used PDPM
module, Figure 2-9(A) shows that a conductive metal ring is oriented concentrically
around the orifice and surrounded by conductive dots at four different orientations. When
a finger is in contact with the circuit board (Flex Printed Circuit Sales, Redwood City,
CA, USA), PDPM detects the electrical resistance between the center ring and each of the
surrounding conductive dots. If there is a connection by finger, the resistance is below the
preset threshold and corresponding red dots in the GUI display turn green indicating
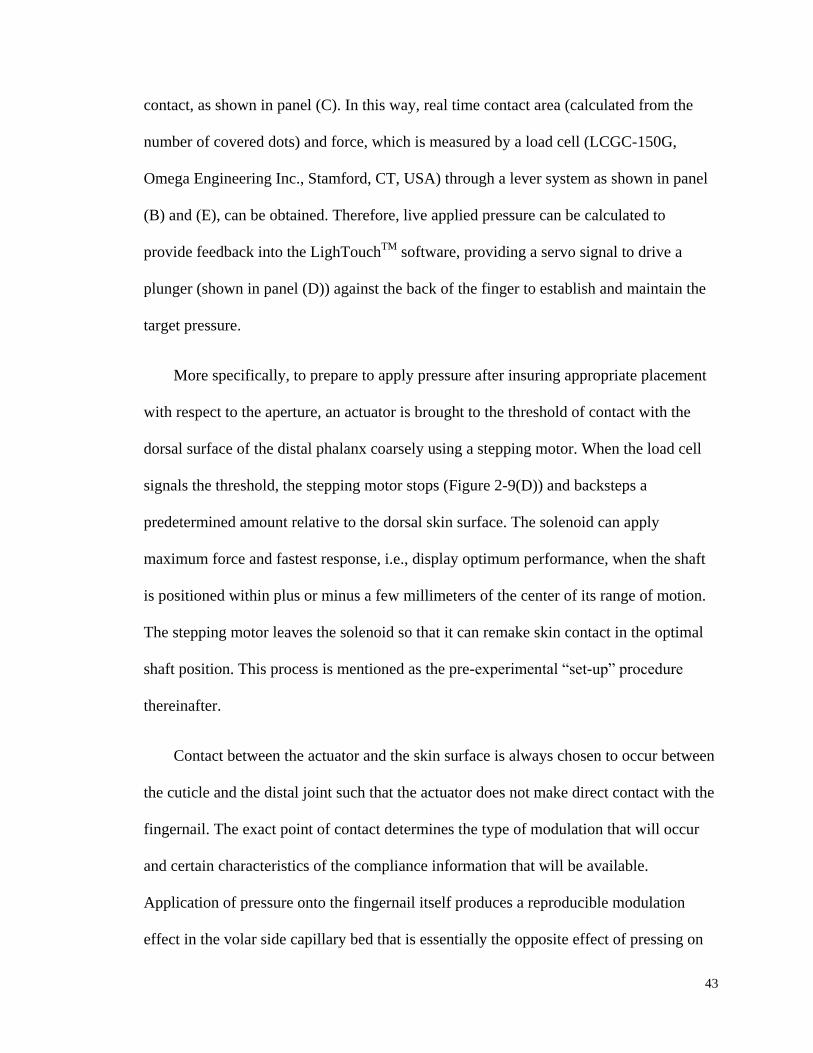
43
contact, as shown in panel (C). In this way, real time contact area (calculated from the
number of covered dots) and force, which is measured by a load cell (LCGC-150G,
Omega Engineering Inc., Stamford, CT, USA) through a lever system as shown in panel
(B) and (E), can be obtained. Therefore, live applied pressure can be calculated to
provide feedback into the LighTouchTM
software, providing a servo signal to drive a
plunger (shown in panel (D)) against the back of the finger to establish and maintain the
target pressure.
More specifically, to prepare to apply pressure after insuring appropriate placement
with respect to the aperture, an actuator is brought to the threshold of contact with the
dorsal surface of the distal phalanx coarsely using a stepping motor. When the load cell
signals the threshold, the stepping motor stops (Figure 2-9(D)) and backsteps a
predetermined amount relative to the dorsal skin surface. The solenoid can apply
maximum force and fastest response, i.e., display optimum performance, when the shaft
is positioned within plus or minus a few millimeters of the center of its range of motion.
The stepping motor leaves the solenoid so that it can remake skin contact in the optimal
shaft position. This process is mentioned as the pre-experimental “set-up” procedure
thereinafter.
Contact between the actuator and the skin surface is always chosen to occur between
the cuticle and the distal joint such that the actuator does not make direct contact with the
fingernail. The exact point of contact determines the type of modulation that will occur
and certain characteristics of the compliance information that will be available.
Application of pressure onto the fingernail itself produces a reproducible modulation
effect in the volar side capillary bed that is essentially the opposite effect of pressing on

44
the volar side soft tissue. Attempt has been made to contact the nail bed capillary blood
through the fingertip for spectroscopic purposes before (46) but the difficulty in that
approach is bringing the rigid nail surface into reproducible registration with the aperture.
Thus, in the present context making contact between the cuticle and the joint ensures that
the induced stress field does not produce opposing effects on the volar side.
Trial and error has shown that, once a measurement cycle has begun, the aperture
must be stationary (in the direction of incident light propagation) with respect to the
collection optics and the laser delivery lens to at most ±25 µm throughout any experiment
to obtain consistent results. It appears that inconsistent aperture movement combined
with inconsistent extrusion of tissue into the aperture produces an unmanageable
spectroscopic response. However, all force transducers (in our case a 12-bit Omega
LCGC-150 g transducer) require motion of some kind to produce an electrical signal.
Therefore, a lever system, a simplified on-scale drawing is given in Figure 2-9 (E), is
used to magnify the motion of the modulating surface at the transducer contact point and
minimize the motion at the optical aperture so as to achieve sufficient sensitivity and
stability with respect to knowing the total applied force at the aperture. Consistent with
the specifications of the transducer no hysteresis in this system is detected, so the design
seems acceptable.
The position of the aperture with respect to the fulcrum determines the largest finger
size that can be used in this type of apparatus. Related to this is the fact that the fingertip
is not a point load. The perceived force applied to a specific point on the fingertip
increases as the distance between the fulcrum and the point of interest increases. The load
cell does not detect any force applied to a region of a fingertip that overlaps the fulcrum.
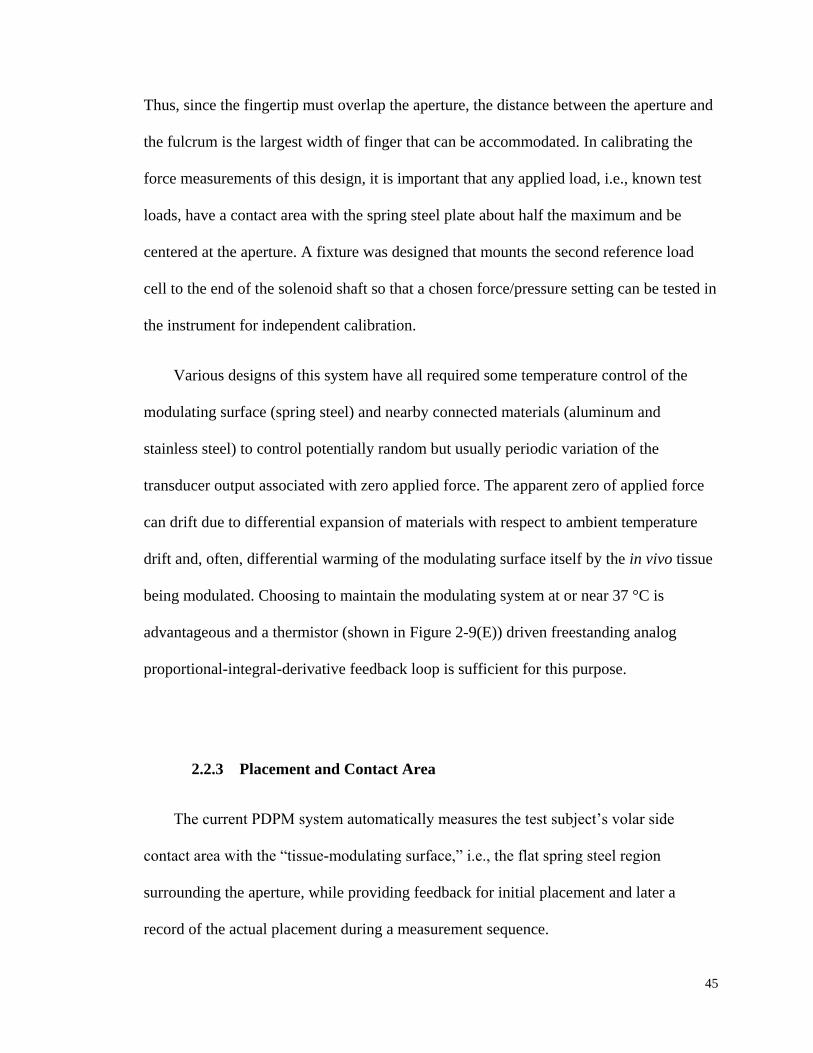
45
Thus, since the fingertip must overlap the aperture, the distance between the aperture and
the fulcrum is the largest width of finger that can be accommodated. In calibrating the
force measurements of this design, it is important that any applied load, i.e., known test
loads, have a contact area with the spring steel plate about half the maximum and be
centered at the aperture. A fixture was designed that mounts the second reference load
cell to the end of the solenoid shaft so that a chosen force/pressure setting can be tested in
the instrument for independent calibration.
Various designs of this system have all required some temperature control of the
modulating surface (spring steel) and nearby connected materials (aluminum and
stainless steel) to control potentially random but usually periodic variation of the
transducer output associated with zero applied force. The apparent zero of applied force
can drift due to differential expansion of materials with respect to ambient temperature
drift and, often, differential warming of the modulating surface itself by the in vivo tissue
being modulated. Choosing to maintain the modulating system at or near 37 °C is
advantageous and a thermistor (shown in Figure 2-9(E)) driven freestanding analog
proportional-integral-derivative feedback loop is sufficient for this purpose.
2.2.3 Placement and Contact Area
The current PDPM system automatically measures the test subject’s volar side
contact area with the “tissue-modulating surface,” i.e., the flat spring steel region
surrounding the aperture, while providing feedback for initial placement and later a
record of the actual placement during a measurement sequence.
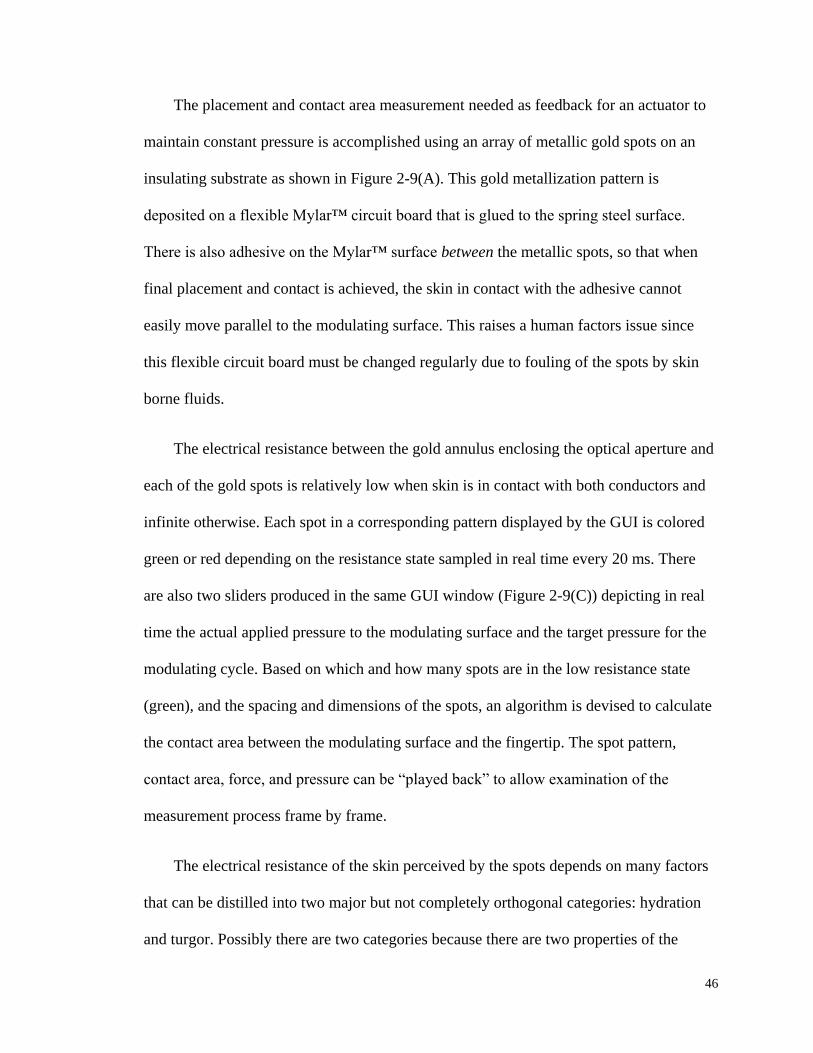
46
The placement and contact area measurement needed as feedback for an actuator to
maintain constant pressure is accomplished using an array of metallic gold spots on an
insulating substrate as shown in Figure 2-9(A). This gold metallization pattern is
deposited on a flexible Mylar™ circuit board that is glued to the spring steel surface.
There is also adhesive on the Mylar™ surface between the metallic spots, so that when
final placement and contact is achieved, the skin in contact with the adhesive cannot
easily move parallel to the modulating surface. This raises a human factors issue since
this flexible circuit board must be changed regularly due to fouling of the spots by skin
borne fluids.
The electrical resistance between the gold annulus enclosing the optical aperture and
each of the gold spots is relatively low when skin is in contact with both conductors and
infinite otherwise. Each spot in a corresponding pattern displayed by the GUI is colored
green or red depending on the resistance state sampled in real time every 20 ms. There
are also two sliders produced in the same GUI window (Figure 2-9(C)) depicting in real
time the actual applied pressure to the modulating surface and the target pressure for the
modulating cycle. Based on which and how many spots are in the low resistance state
(green), and the spacing and dimensions of the spots, an algorithm is devised to calculate
the contact area between the modulating surface and the fingertip. The spot pattern,
contact area, force, and pressure can be “played back” to allow examination of the
measurement process frame by frame.
The electrical resistance of the skin perceived by the spots depends on many factors
that can be distilled into two major but not completely orthogonal categories: hydration
and turgor. Possibly there are two categories because there are two properties of the
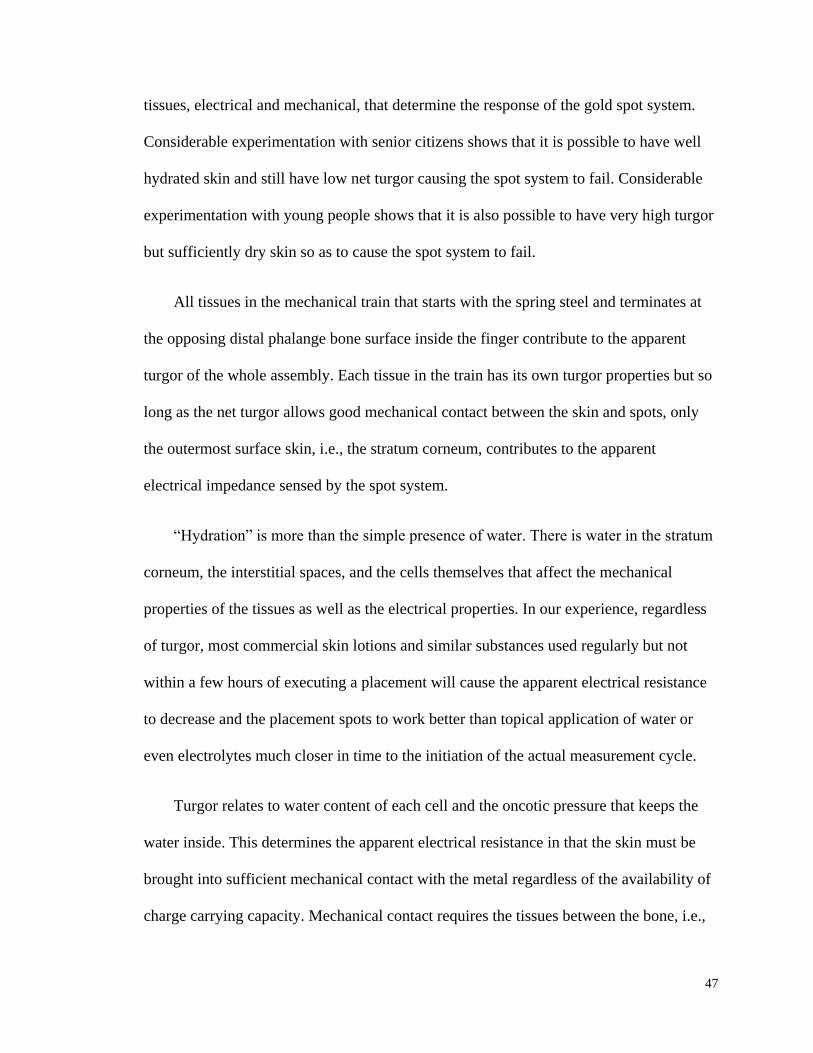
47
tissues, electrical and mechanical, that determine the response of the gold spot system.
Considerable experimentation with senior citizens shows that it is possible to have well
hydrated skin and still have low net turgor causing the spot system to fail. Considerable
experimentation with young people shows that it is also possible to have very high turgor
but sufficiently dry skin so as to cause the spot system to fail.
All tissues in the mechanical train that starts with the spring steel and terminates at
the opposing distal phalange bone surface inside the finger contribute to the apparent
turgor of the whole assembly. Each tissue in the train has its own turgor properties but so
long as the net turgor allows good mechanical contact between the skin and spots, only
the outermost surface skin, i.e., the stratum corneum, contributes to the apparent
electrical impedance sensed by the spot system.
“Hydration” is more than the simple presence of water. There is water in the stratum
corneum, the interstitial spaces, and the cells themselves that affect the mechanical
properties of the tissues as well as the electrical properties. In our experience, regardless
of turgor, most commercial skin lotions and similar substances used regularly but not
within a few hours of executing a placement will cause the apparent electrical resistance
to decrease and the placement spots to work better than topical application of water or
even electrolytes much closer in time to the initiation of the actual measurement cycle.
Turgor relates to water content of each cell and the oncotic pressure that keeps the
water inside. This determines the apparent electrical resistance in that the skin must be
brought into sufficient mechanical contact with the metal regardless of the availability of
charge carrying capacity. Mechanical contact requires the tissues between the bone, i.e.,

48
the distal phalanx and the modulating surface, to resist further compression at some
applied pressure. When the oncotic pressure (79) is sufficiently low, all the tissues
between the bone and the Mylar™ surface are so compressible that the mechanical
contact is insufficient to allow adequate electrical current to flow, even though the
stratum corneum is sufficiently well hydrated to make the spots respond. Although better
approaches to this problem may emerge, with regular usage of almost any over-the-
counter skin lotion, the approach presented here allows a very wide variety of test
subjects to easily achieve proper placement and reliable contact area measurements
without any apparent spectroscopic consequences.
2.2.4 Force, Pressure and the Measurement Cycle
There are two modes for i) positioning the fingertip in proximity to the aperture and
ii) moving the actuator into proximity to the fingertip thereby initiating a measurement
cycle. In one (66) the test subject places his/her own fingertip against the modulating
surface, shown in close-up in Figure 2-9(B), achieving desired placement by visual
feedback using the GUI provided colored spot pattern. Or as shown in Figure 2-10, a
fixture is mounted on the solenoid, the finger is placed in a splint outside the device, and
then the finger with the splint attached is slid into the fixture all as described in greater
detail below. In this case positioning is followed by the “set-up” process, i.e., the stepper
motor/solenoid moves the fixture holding the passive splint-mounted fingertip toward the
aperture. If positioned without the splint, pressing a button in the GUI causes the actuator
to approach the stationary finger from the dorsal side using the stepping motor.

49
Figure 2-10: Splint fixtures for fingertip positioning. Right: splint is taped onto dorsal
side of finger. Left: a finger is attached to splint that in turn is engaged into fixture.
In either case, upon first simultaneous three-way contact between the modulating
surface, the finger and the actuator surface, the stepping motor stops and then retracts a
few millimeters. The actuator position is then further adjusted using a solenoid to achieve
a pre-unpressed pressure between actuator, finger, and spring steel of ≈10 gf/cm2 pressure
in the feedback system. This is very light pressure that most test subjects cannot discern.
Utilizing the solenoid from this point forward allows continuous adjustment of actuator
force and displacement, in order to keep the measured pressure, i.e., the ratio of the total
applied force and the measured contact area, constant.
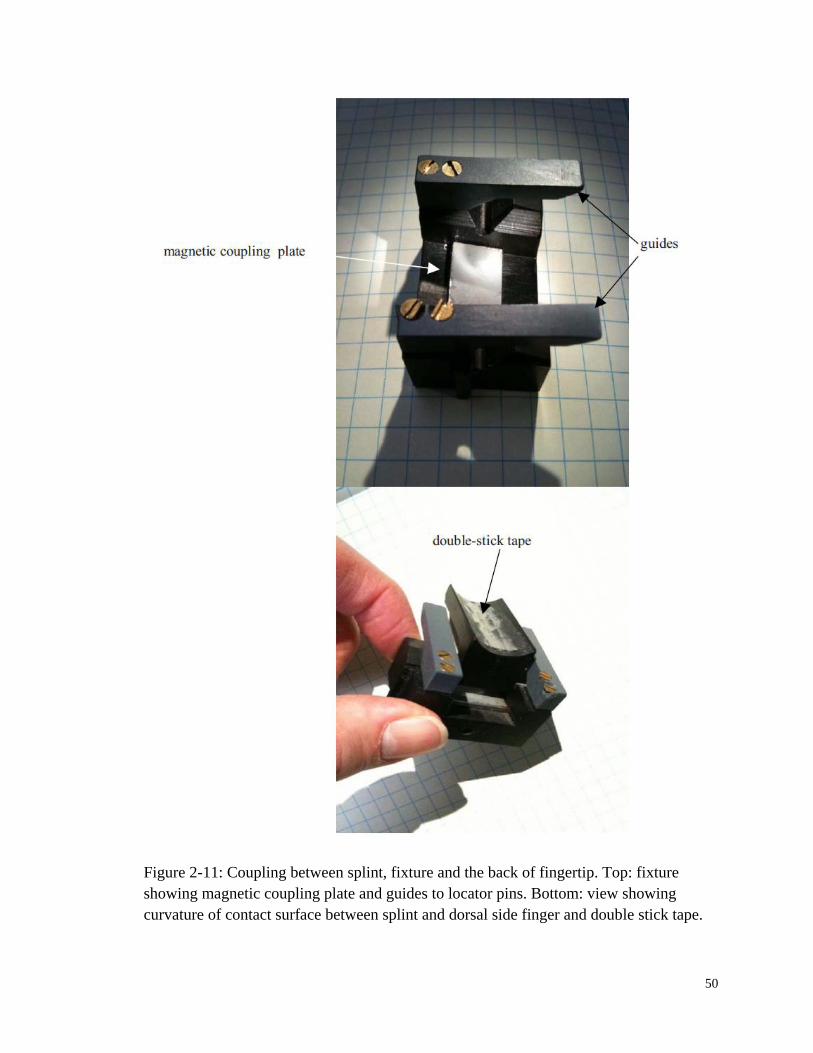
50
Figure 2-11: Coupling between splint, fixture and the back of fingertip. Top: fixture
showing magnetic coupling plate and guides to locator pins. Bottom: view showing
curvature of contact surface between splint and dorsal side finger and double stick tape.
51
The actuator for applying force can be made to contact the dorsal side of the distal
phalanx between the nailfold and the first joint in a few different ways. This can be as
basic as a simple cylinder, or a foam-pad-tipped cylinder attached to the end of the
solenoid shaft. An example of mounting the finger to a “splint” is shown in Figure 2-10.
The splint clicks into place on a fixture mounted to the end of the solenoid shaft. The
splint is magnetically coupled as shown in Figure 2-11 and swivels with movement of the
finger at the proximal joint. The splint, i.e., actual area of contact between the dorsal side
and the actuator, is a shaped plastic piece that is fastened to the finger with double-stick
tape.
This approach has the advantage that the splint can be positioned on the finger
outside the aperture housing assuring appropriate alignment when subsequently engaged
to the fixture, and unassisted compliance is possible for most test subjects. The fixture
has guides that, once the locator pins are engaged, allow forward motion until the
magnetic pins approach the magnetic plate embedded in the fixture and reproducible
placement occurs. Providing comfortable support for the elbow and general posture of the
arm and wrist greatly facilitates compliance. In addition, an easily adjusted vertical rod
that fits into the webbing between thumb and forefinger placed in proximity to the
modulator is also very helpful for hand stabilization.
The pressure servo has several sets of important details. When the measurement
cycle is initiated, the existing contact area and the simultaneous total force between the
volar side fingertip and the modulating surface is measured, divided by the contact area,
to produce a pressure feedback signal for the actuator. The actuator is driven by the
solenoid in contact with the dorsal side of the finger to achieve and maintain the preset

52
“unpressed” target pressure. Since the contact area between the volar side skin and the
modulating surface increases in time as the blood leaves the capillary bed, the force must
be increased in proportion to maintain constant target pressure. The placement spots and
the load cell are polled at 20 Hz giving the approximate bandwidth of the pressure servo.
The initial target pressure is achieved and the system becomes mechanically stable in
about 100 ms.
When a tissue modulation cycle is required, after a suitable “unpressed” collection
period, the target pressure is changed to reflect the transition to the “pressed” state, the
actuator applies more force to achieve the new target pressure and 20 ms CCD frames are
collected for an equal time period as the unpressed state. Afterwards, the actuator is
retracted, and the CCD frames are stored as a record of the applied force, applied
pressure, net contact area, and contact history of the individual placement spots. In a
separate step, the CCD frames are processed (46, 50) for calculation of glucose or
bicarbonate concentrations or hematocrit (Hct). Of course, other modulation schemes can
be employed for other purposes using the same apparatus (80).
2.3 Evaluation of PDPM Performances
2.3.1 History of PDPM Outputs
To clarify the two different measurement procedures and algorithms that are both
enabled in the LighTouchTM
GUI, experiments for in vivo glucose and other blood
constituents monitoring is configured to be done under “Glucose” mode, while Hct
measurements are taken under “Hemo” mode. For both modes, all sensor recordings

53
including force, pressure, contact area and in-contact quadrant dots of the four directions,
together with CCD spectra for each 20 ms frame are logged. The record of the
measurement sequence provided by LighTouchTM
device allows deduction of the course
of events. Human factor induced unexpected variations on the collected spectra could be
verified by double checking with the sensor outputs. Therefore, rejection of unreliable
data could be based on objective quantitative criteria and would ultimately help the
glucose monitoring in making solid and trustworthy predictions.
While there are many types of motion and placement artifacts, Figure 2-12 and
Figure 2-13 show data demonstrating two frequently observed motion artifacts made
detectable by this instrumentation. In Figure 2-12, the sensor records of an intentional
“rolling motion” of the type described by Asada (77) are shown. In this case the initial
placement of the finger is skewed (uneven number of spots top and bottom, i.e.,
quadrants 1 and 0, at t=0) and apparently becomes acceptable (not equal but stable
numbers of spots for each) for the last third of the experiment. But the asymmetry evident
in the quadrant dot pattern in the middle graph shows that the finger rolled somewhat
from top to bottom during the first part of the measurement.
The placement was skewed initially and remained slightly skewed after the rolling
motion occurred, i.e., no twisting motion occurred simultaneously. We know it was a
rolling motion and not a scraping motion because the quadrants 2 and 3 (spots are on
either side of aperture along the axis of the finger) are relatively constant. The change in
contact area was abrupt, so we know there was gross motion and not normal subsurface
fluid movement due to the applied pressure. On this basis alone the data should be
rejected. This record was generated intentionally but it also corresponds to the situation
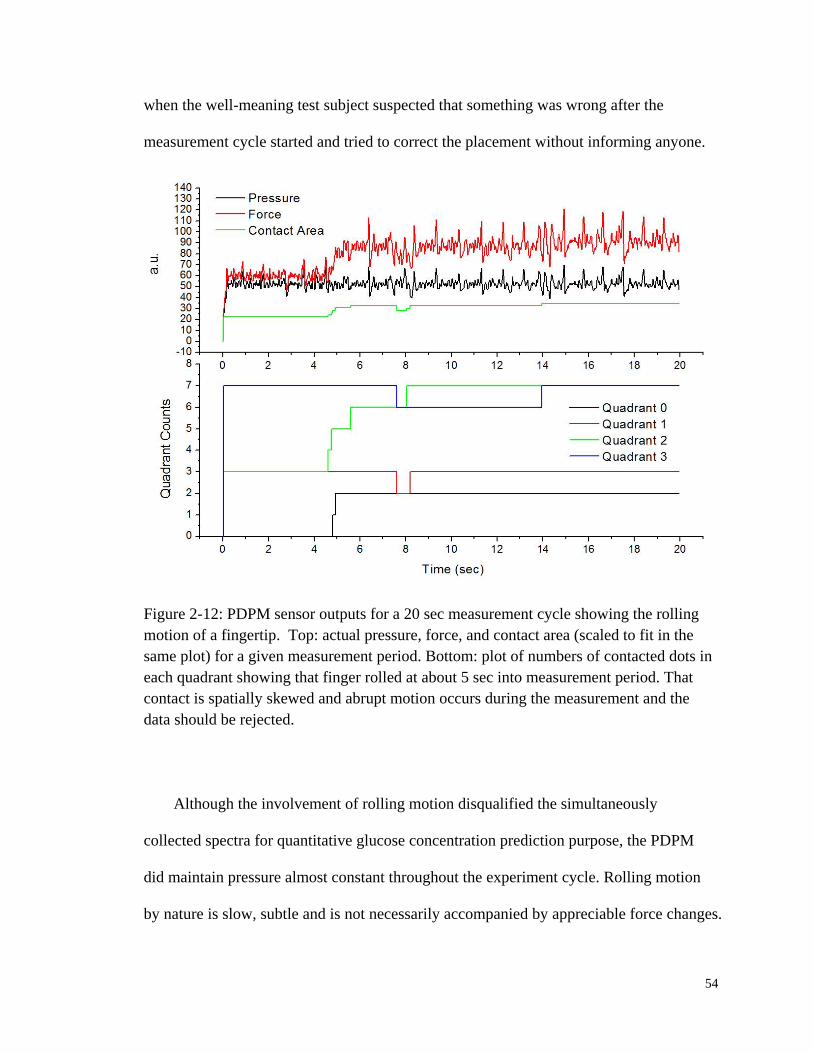
54
when the well-meaning test subject suspected that something was wrong after the
measurement cycle started and tried to correct the placement without informing anyone.
Figure 2-12: PDPM sensor outputs for a 20 sec measurement cycle showing the rolling
motion of a fingertip. Top: actual pressure, force, and contact area (scaled to fit in the
same plot) for a given measurement period. Bottom: plot of numbers of contacted dots in
each quadrant showing that finger rolled at about 5 sec into measurement period. That
contact is spatially skewed and abrupt motion occurs during the measurement and the
data should be rejected.
Although the involvement of rolling motion disqualified the simultaneously
collected spectra for quantitative glucose concentration prediction purpose, the PDPM
did maintain pressure almost constant throughout the experiment cycle. Rolling motion
by nature is slow, subtle and is not necessarily accompanied by appreciable force changes.
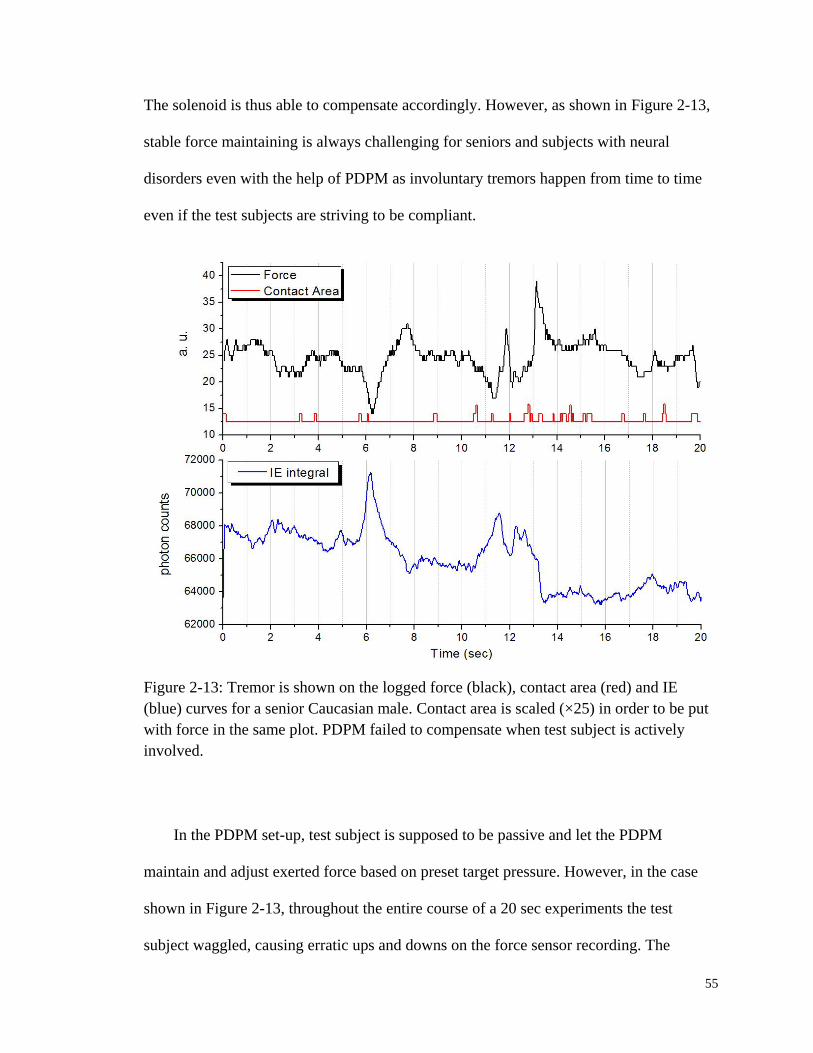
55
The solenoid is thus able to compensate accordingly. However, as shown in Figure 2-13,
stable force maintaining is always challenging for seniors and subjects with neural
disorders even with the help of PDPM as involuntary tremors happen from time to time
even if the test subjects are striving to be compliant.
Figure 2-13: Tremor is shown on the logged force (black), contact area (red) and IE
(blue) curves for a senior Caucasian male. Contact area is scaled (×25) in order to be put
with force in the same plot. PDPM failed to compensate when test subject is actively
involved.
In the PDPM set-up, test subject is supposed to be passive and let the PDPM
maintain and adjust exerted force based on preset target pressure. However, in the case
shown in Figure 2-13, throughout the entire course of a 20 sec experiments the test
subject waggled, causing erratic ups and downs on the force sensor recording. The
56
amplitude of such force variation exceeded the dynamic range of PDPM itself, therefore
pressure compensation failed in this scenario. Even worse, several tremors happened
right after 6 sec, before 12 sec and after 13 sec respectively. The abrupt push and
releasing of force obviously interrupted collecting of spectra, as clearly shown in the IE
vs. Time curve. Empirically, pulsatile blood flow usually causes 1000 – 2000 photon
counts variation on IE curve. But these tremors made changes of almost 5000 counts, two
times more than the pulses. Not shown in this figure is that the horizontal quadrant 2
increased as the quadrant 3 on the opposite direction decreased, meaning the tremor also
resulted in a change of fingertip position. Without question, the collected spectra could
not be used in glucose concentration calculation.
2.3.2 Pressure Registration
Acknowledging the benefits by keep a recording of the PDPM sensor outputs, it is
even more important to feed this piece of information back into the loop and achieve
automated pressure servo. It is already been shown in Figure 2-13 that involuntary
motions like tremor deteriorate the spectra. Yet it is not surprising that slight skew of
fingertip position could also be easily captured spectroscopically. Figure 2-14 shows the
IE vs. Time curve collected corresponding to the rolling motion in Figure 2-12. Decrease
of IE integral around 4 sec is induced by force compensation due to an increased contact
area, while a brief increase at 7.5 sec corresponds to a sudden contact area drop that
might result from a poor contact.

57
Figure 2-14: IE vs. Time curve collected corresponding to the sensor history in Figure
2-12. Rolling motion of fingertip, although not as detrimental as tremors, still produces a
noticeable influence on the harvested spectra. Decrease of IE integral around 4 sec is
induced by force compensation due to an increased contact area. A brief increase at 7.5
sec corresponds to a sudden contact area drop that might result from a poor contact.
Currently, the resistance change between the annular metal and surrounding gold
dots is used as a measure of contact surface. Thus the issue arises when a fingertip is
actually in contact, but due to lack of hydration or other possible reasons, e.g., very low
turgor, flickering of the dots results in unstable contact area calculation. Frequent
adjustment of force by PDPM will end up with undesired disturbance of blood flow.
However, as mentioned in Section 2.2.3, application of a thin layer of any commercial
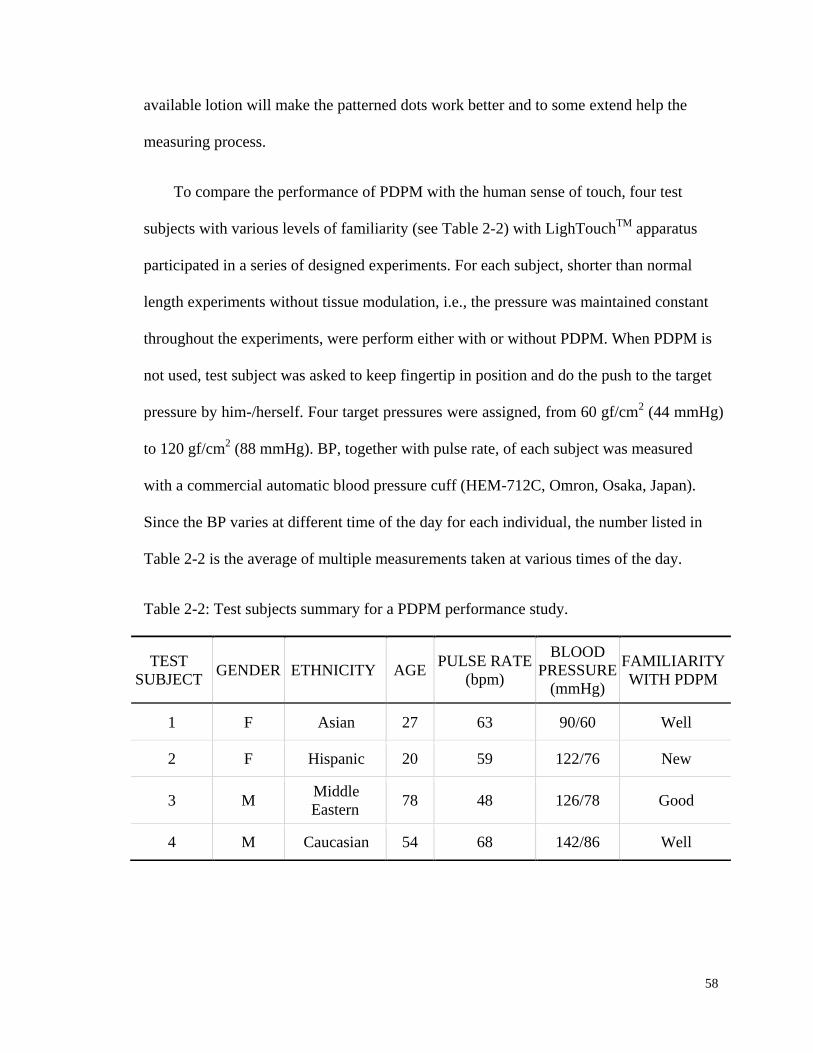
58
available lotion will make the patterned dots work better and to some extend help the
measuring process.
To compare the performance of PDPM with the human sense of touch, four test
subjects with various levels of familiarity (see Table 2-2) with LighTouchTM
apparatus
participated in a series of designed experiments. For each subject, shorter than normal
length experiments without tissue modulation, i.e., the pressure was maintained constant
throughout the experiments, were perform either with or without PDPM. When PDPM is
not used, test subject was asked to keep fingertip in position and do the push to the target
pressure by him-/herself. Four target pressures were assigned, from 60 gf/cm2 (44 mmHg)
to 120 gf/cm2 (88 mmHg). BP, together with pulse rate, of each subject was measured
with a commercial automatic blood pressure cuff (HEM-712C, Omron, Osaka, Japan).
Since the BP varies at different time of the day for each individual, the number listed in
Table 2-2 is the average of multiple measurements taken at various times of the day.
Table 2-2: Test subjects summary for a PDPM performance study.
TEST
SUBJECT GENDER ETHNICITY AGE
PULSE RATE
(bpm)
BLOOD
PRESSURE
(mmHg)
FAMILIARITY
WITH PDPM
1 F Asian 27 63 90/60 Well
2 F Hispanic 20 59 122/76 New
3 M Middle
Eastern 78 48 126/78 Good
4 M Caucasian 54 68 142/86 Well
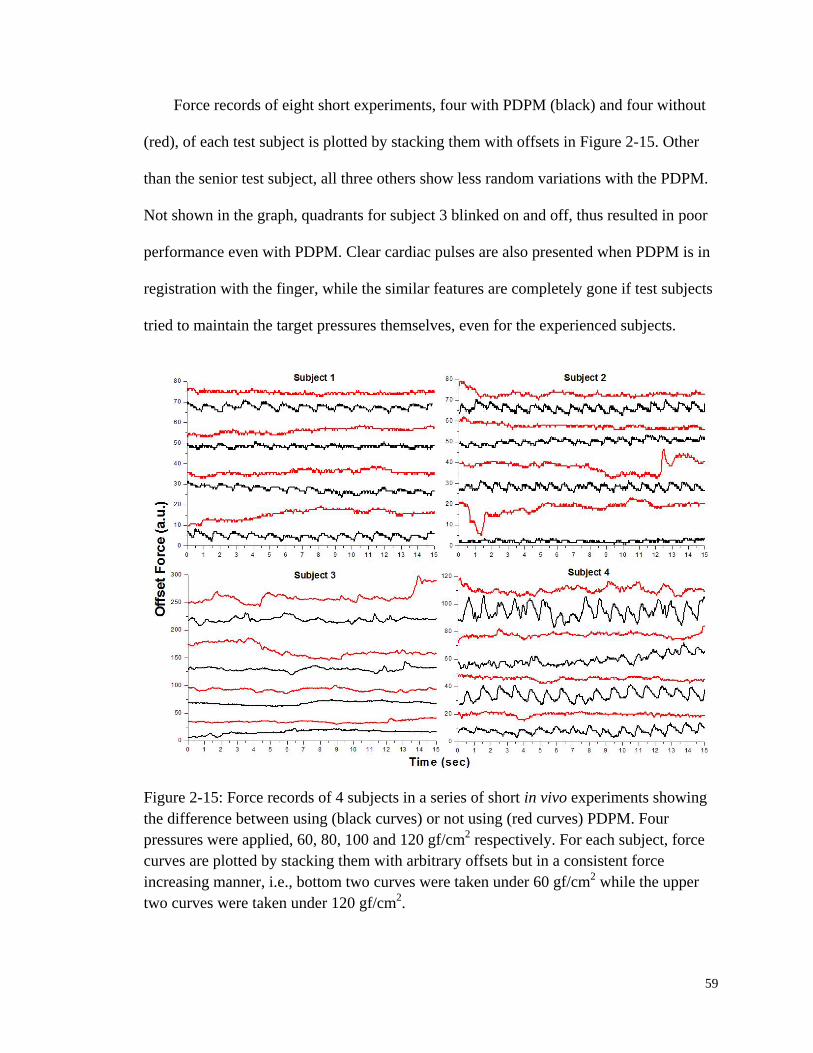
59
Force records of eight short experiments, four with PDPM (black) and four without
(red), of each test subject is plotted by stacking them with offsets in Figure 2-15. Other
than the senior test subject, all three others show less random variations with the PDPM.
Not shown in the graph, quadrants for subject 3 blinked on and off, thus resulted in poor
performance even with PDPM. Clear cardiac pulses are also presented when PDPM is in
registration with the finger, while the similar features are completely gone if test subjects
tried to maintain the target pressures themselves, even for the experienced subjects.
Figure 2-15: Force records of 4 subjects in a series of short in vivo experiments showing
the difference between using (black curves) or not using (red curves) PDPM. Four
pressures were applied, 60, 80, 100 and 120 gf/cm2 respectively. For each subject, force
curves are plotted by stacking them with arbitrary offsets but in a consistent force
increasing manner, i.e., bottom two curves were taken under 60 gf/cm2 while the upper
two curves were taken under 120 gf/cm2.

60
Although arbitrary offsets make the force axis lose its numeric meaning, relative
comparison indicates that for people with high BP such as subject 4 the maximum size of
pulses well exceeds that for lower BP subjects such as 1 and 2. Mechanical pulses are
always easier to be seen, which is not surprising. The y-axis span for subject 3 is almost 4
times bigger than that for the first two subjects, indicating a much more instability, as
shown in Figure 2-16.
Figure 2-16: Comparison of force and IE variation between subject 1 and 3. For both
subjects, no PDPM facilitation was supplied. Test subjects used their own sense of touch
trying to maintain pressure at 100 gf/cm2.
Usually, as shown in Figure 2-16, with a good contact the force varies within 5 units,
but this can be magnified up to 10 times bigger in situations like tremor or random finger

61
movements, which is more likely to happen among senior test subjects. As mentioned
before, such motions are what we are trying to avoid. By either monitoring sensor or
optical outputs, selecting rules can be developed and used to automatically screen out
invalid data. By taking a scrupulous look at the IE curve for subject 1 in Figure 2-16, one
may notice a trend of decreasing. Part of such decrease corresponds to the slowly
increased force, but most of this quench is related with some photochemistry that will be
discussed in detail in Section 3.2 of Chapter 3.
Most of the time, whenever mechanical pulses are observed, one could expect to see
optical pulses. But they are not necessarily connected. Depending on how the fingertip is
engaged with the PDPM, mechanical pulses could be easily invisible. For example, a
simple cylinder (Nylon with a contact area of ≈0.27 cm2) was once used to replace the
splint and fixture design, shown previously in Figure 2-10 and Figure 2-11. The shaft
could easily fit a wide range of fingertips, no matter how big the width and curvature.
However, it is hard to detect mechanical pulses with this arrangement, even for subjects
with high BP.
We notice that the way shaft is mounted to the solenoid makes it waggle, and the
small contact with the back of fingertip causes it to slip off the finger from time to time.
By contrast, the currently used design guarantees a much more solid contact, and that
favors the sensitivity of force measurement. Moreover, load cell calibration also
determines the sensitivity of the force detection. A poorly calibrated transducer will result
in a limited dynamic range that may or may not enable us to see the mechanical pulses.
The step-by-step instruction on how to perform a solid load cell calibration is elaborated
in APPENDIX A.
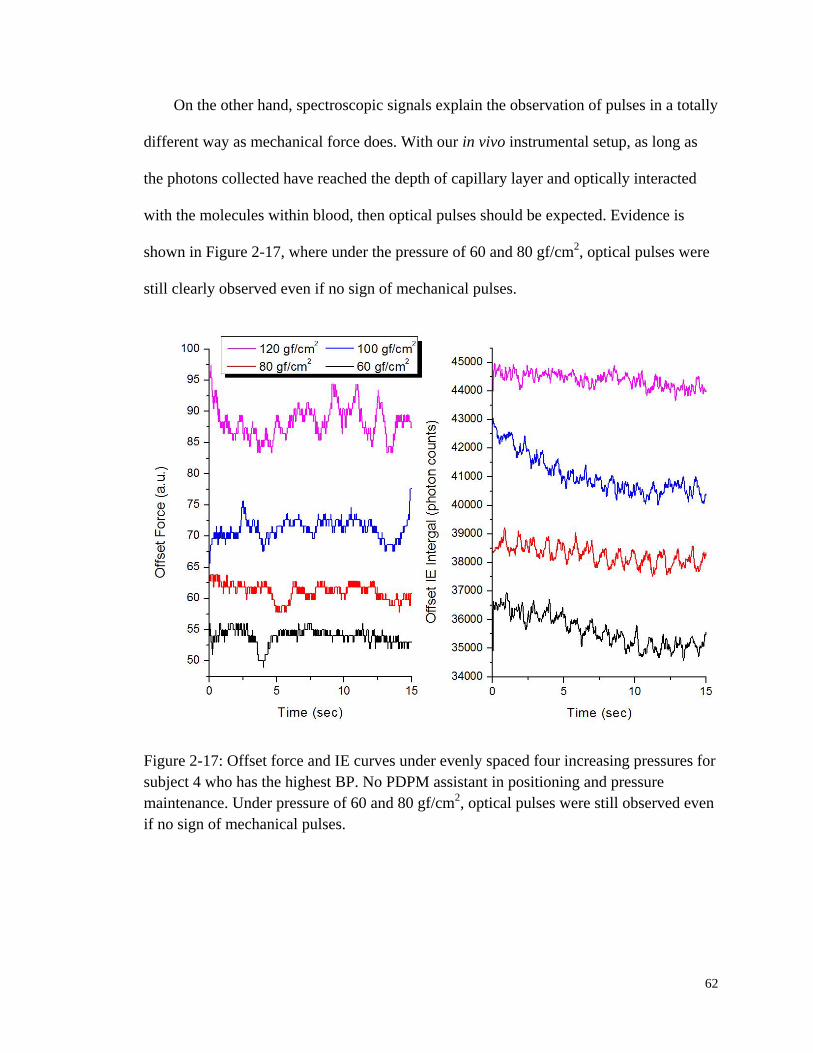
62
On the other hand, spectroscopic signals explain the observation of pulses in a totally
different way as mechanical force does. With our in vivo instrumental setup, as long as
the photons collected have reached the depth of capillary layer and optically interacted
with the molecules within blood, then optical pulses should be expected. Evidence is
shown in Figure 2-17, where under the pressure of 60 and 80 gf/cm2, optical pulses were
still clearly observed even if no sign of mechanical pulses.
Figure 2-17: Offset force and IE curves under evenly spaced four increasing pressures for
subject 4 who has the highest BP. No PDPM assistant in positioning and pressure
maintenance. Under pressure of 60 and 80 gf/cm2, optical pulses were still observed even
if no sign of mechanical pulses.

63
Figure 2-18: Optical pulses from subject 1, 2, and 4 showing various pulse amplitudes
under different pressures. Spectra were all collected under PDPM registration.

64
Finally, as demonstrated in Section 2.1.4, principles in oscillometer indicate that
while pulses can be detected within a relatively wide range of pressures, i.e., from below
diastolic to well above systolic pressure, the best mechanically translated pulses can be
achieved at MAP. Forces plotted in Figure 2-15 have already shown mechanical pulses
for almost all test subjects in the pressure range of 44 to 88 mmHg. For comparison,
optical pulses for subject 1, 2 and 4 are plotted in Figure 2-18. As expected, IE vs. Time
curve also shows the existence of cardiac pulses, however slightly different amplitudes
are observed.
Although it is subjective to judge the quality of pulses, for subject 1 under the
pressure of 60 gf/cm2 (44 mmHg) the IE curve shows the strongest pulses. Similarly,
subject 2 shows best optical pulses under 100 gf/cm2 (74 mmHg) and that pressure for
subject 4 is 120 gf/cm2 (88 mmHg). From Table 2-2, the MAPs calculated for subject 1, 2,
and 4 are 70 mmHg, 91 mmHg and 105 mmHg, respectively. A reasonable connection
could be found here that could be used to guide the selection of modulation pressure in
order to reach the maximum optical pulses. Such a selecting standard will help in
producing reproducible spectra for individuals and also make it possible to compare data
collected from same person in different days.
2.3.3 Fingertip Topography
As mentioned in section 2.1.3, due to the commensurate size of the laser spot with
the breadth of fingertip ridges, the incident light could either contact the surface skin on
top of a ridge or at the bottom of a furrow. To validate this statement, images of fingertip
65
over the opposite side of the apertures were taken by inserting an ultra-thin
semitransparent pellicle mirror after the triplet lens in the collection side. Additional
white light illumination and neutral density filters were utilized to help visualize the
bright laser spot and minimize blooming. The pellicle guided 10% of the reflected light
into a CCD camera and frames of image were taken using Snappy video digitizer (Play
Inc., Folsom, CA, USA). Over the time span of a week, images for seven individuals
were collected and several typical images for a single subject are plotted in Figure 2-19.
Direct observation through the collection system shows that nearly all test subjects
can remain stationary to within ±10 µm relative to the aperture for hundreds of seconds,
not including inevitable involuntary tremors and similar random motions. In panel (B),
fingerprints together with the sweat glands could be clearly seen and in this scenario the
laser hits across the edge of a ridge into a groove. Despite of the over glow on the right
side of laser spot, it is still clear that the size of laser is in the similar scale as fingertip
ridges. When a different pressure was applied, the laser spot shifted and hit right on top
of ridge. Attributed to the uneven topography of fingertips, the local angle of incidence
could easily deviate wildly from 53°, the angle to guarantee maximal penetration into the
skin if it were flat. As a result, propagation into the tissue is to a nonnegligible extent
dependant on the precise positioning of the fingertips of test subjects.

66
Figure 2-19: Imaging of the LighTouchTM
aperture. (A) Backlit flat DelrinTM
block. (B)
Unpressed fingertip (pressure ≈45 gf/cm2), showing illumination at center. (C) Fingertip
pressed hard (pressure >140 gf/cm2), showing displacement of illuminated area. (D)
Difference between pressed (C) and unpressed (D). The images are taken by putting an
ultra-thin semitransparent pellicle mirror right after the triplet lens in the collection train.
These images also show the doming issue that is mentioned in section 2.1.3. The
optical system is initially aligned so that the light is incident at the middle of the aperture
if the sample is flat and in the plane of the aperture, as can be seen in Figure 2-19(A) for
a thick flat piece of light gray DelrinTM
. When a finger is registered into the aperture in an
unpressed state, as in Figure 2-19(B), the ellipse of contact is slightly shifted to the side
67
of the tissue toward the incoming laser light. If additional pressure is applied, the point of
contact moves farther toward the side of the incoming laser, as in Figure 2-19(C). This
motion, as we discuss in detail in the following, is down the side of the extruded dome of
tissue. However, Figure 2-19(D) shows the difference between images (B) and (C) and
demonstrates that the total displacement, even for a very hard applied pressure, is only 10
to 30 µm.
In order to probe skin topography, the skin is translated relative to the laser beam,
either by moving the finger relative to the aperture with the aperture stationary relative to
the excitation and collection optics, or by moving the aperture relative to the excitation
and collection optics with the skin stationary relative to the aperture. In the latter case, the
amount of off-axis elastic light production depends on the location of the edges of the
aperture relative to the laser. Figure 2-20 shows data obtained by the former approach.
Here, a part of the fingertip was scanned where the ridges run perpendicular to the
direction of motion. No precise control of distance translated per step was possible.
Instead the total distance moved over the total observation time was divided into equal
segments and displacement was assigned accordingly. While observing the color changes
of the placement spots and the pressure slider on the PDPM feedback window, the
fingertip was moved through a known distance in a known amount of time with relatively
constant applied pressure. The calculated distance travelled was roughly 10 µm per step.
The IE and EE integrals shown in Figure 2-20 are plotted versus steps taken. Both
fluctuated by roughly 20% with a spacing of about 500 µm, characteristic of fingerprint
ridges.
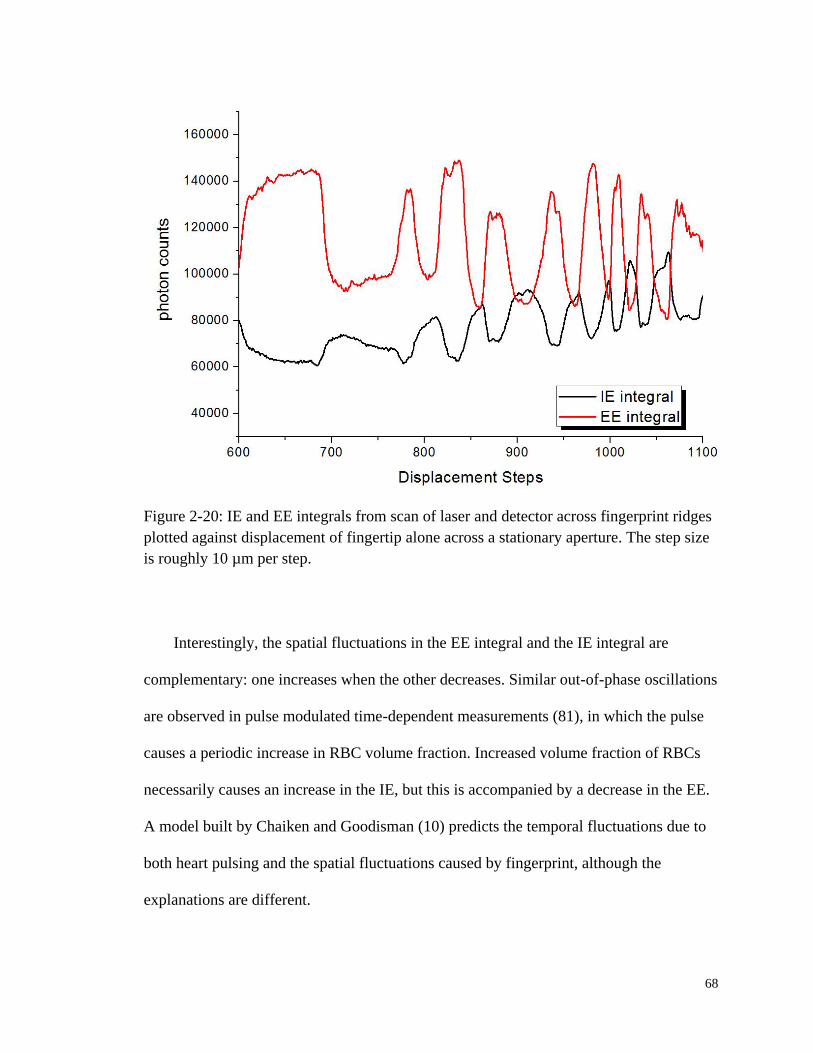
68
Figure 2-20: IE and EE integrals from scan of laser and detector across fingerprint ridges
plotted against displacement of fingertip alone across a stationary aperture. The step size
is roughly 10 µm per step.
Interestingly, the spatial fluctuations in the EE integral and the IE integral are
complementary: one increases when the other decreases. Similar out-of-phase oscillations
are observed in pulse modulated time-dependent measurements (81), in which the pulse
causes a periodic increase in RBC volume fraction. Increased volume fraction of RBCs
necessarily causes an increase in the IE, but this is accompanied by a decrease in the EE.
A model built by Chaiken and Goodisman (10) predicts the temporal fluctuations due to
both heart pulsing and the spatial fluctuations caused by fingerprint, although the
explanations are different.
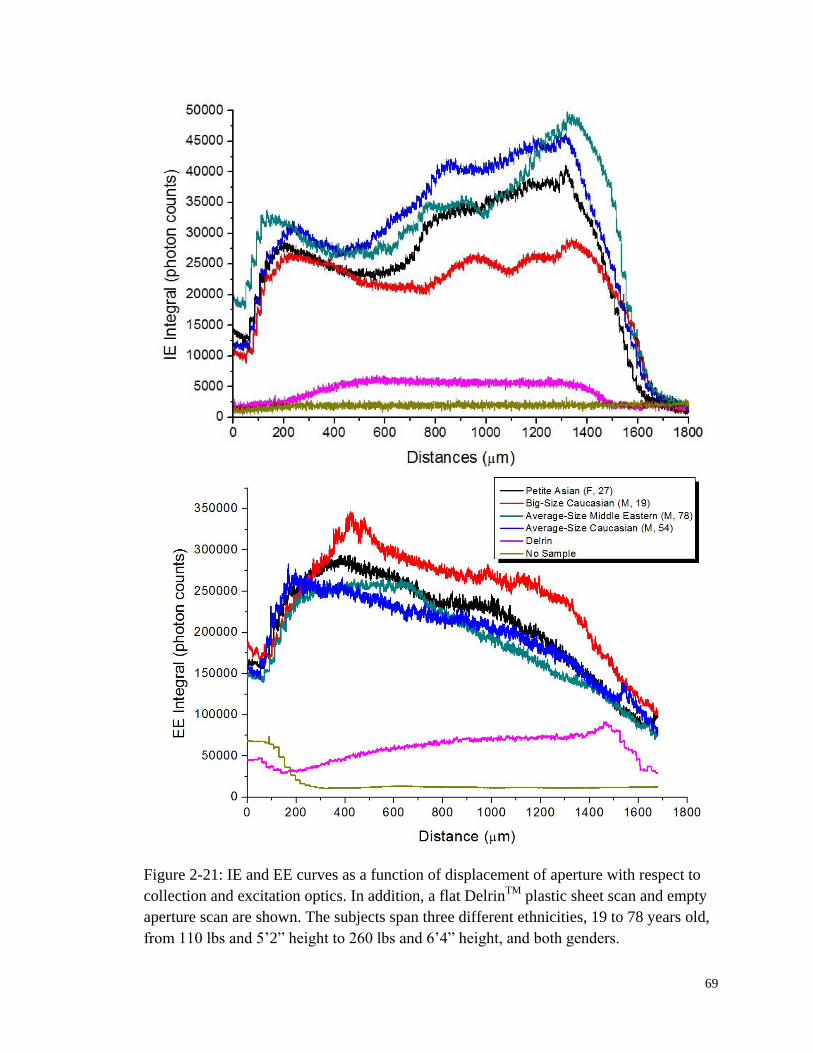
69
Figure 2-21: IE and EE curves as a function of displacement of aperture with respect to
collection and excitation optics. In addition, a flat DelrinTM
plastic sheet scan and empty
aperture scan are shown. The subjects span three different ethnicities, 19 to 78 years old,
from 110 lbs and 5’2” height to 260 lbs and 6’4” height, and both genders.
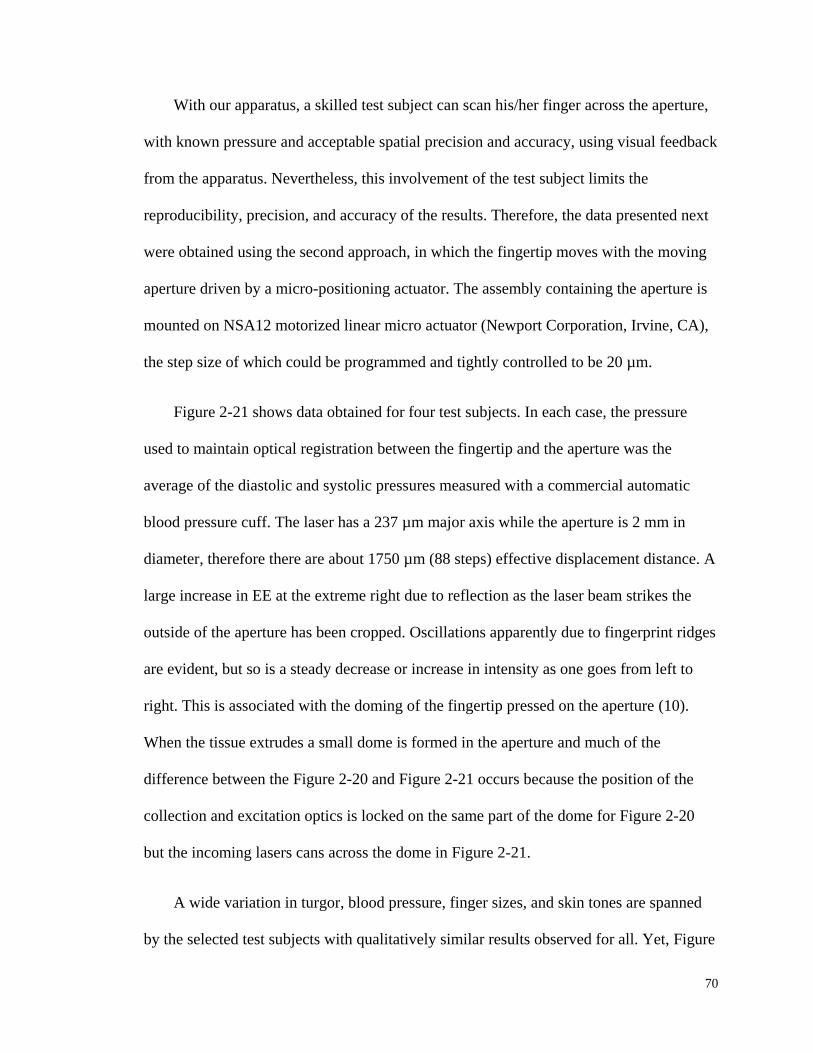
70
With our apparatus, a skilled test subject can scan his/her finger across the aperture,
with known pressure and acceptable spatial precision and accuracy, using visual feedback
from the apparatus. Nevertheless, this involvement of the test subject limits the
reproducibility, precision, and accuracy of the results. Therefore, the data presented next
were obtained using the second approach, in which the fingertip moves with the moving
aperture driven by a micro-positioning actuator. The assembly containing the aperture is
mounted on NSA12 motorized linear micro actuator (Newport Corporation, Irvine, CA),
the step size of which could be programmed and tightly controlled to be 20 µm.
Figure 2-21 shows data obtained for four test subjects. In each case, the pressure
used to maintain optical registration between the fingertip and the aperture was the
average of the diastolic and systolic pressures measured with a commercial automatic
blood pressure cuff. The laser has a 237 µm major axis while the aperture is 2 mm in
diameter, therefore there are about 1750 µm (88 steps) effective displacement distance. A
large increase in EE at the extreme right due to reflection as the laser beam strikes the
outside of the aperture has been cropped. Oscillations apparently due to fingerprint ridges
are evident, but so is a steady decrease or increase in intensity as one goes from left to
right. This is associated with the doming of the fingertip pressed on the aperture (10).
When the tissue extrudes a small dome is formed in the aperture and much of the
difference between the Figure 2-20 and Figure 2-21 occurs because the position of the
collection and excitation optics is locked on the same part of the dome for Figure 2-20
but the incoming lasers cans across the dome in Figure 2-21.
A wide variation in turgor, blood pressure, finger sizes, and skin tones are spanned
by the selected test subjects with qualitatively similar results observed for all. Yet, Figure

71
2-21 shows consistent results using this instrument for a wide variety of test subjects. The
consistency of these observations indicates that monitoring the variation in EE and IE
with fine adjustment of the aperture position after the set-up procedure described above
could allow the device to automatically find and interrogate the tissues at a location of
consistent, predetermined topography and signal content. Specifically, positions of
maximized IE and minimized EE are preferred because they correlate to the tops of
primary fingerprint ridges (10).
2.4 Conclusions
Fingertip skin capillary beds are highly vascularized relative to other tissues and
present a desirable target for noninvasive probing of blood. But human hands and fingers
in particular are also highly idiosyncratic body parts requiring specific apparatus to allow
rigorous and methodical spectroscopic probing. In an earlier study (50), the distribution
of deviations between the noninvasive LighTouch™ glucose measurements and the
reference fingerstick measurements reflected various sources of random and systematic
error. Better management of the measurement process with regard to human factors
emerged as a strategy for improvement with feedback based on applied pressure and
tissue placement. Therefore, instrumentation for probing of volar side fingertip capillary
beds with free space coupled near infrared light while collecting Raman, Rayleigh, and
Mie scattered light as well as fluorescence is described in great detail in this chapter.
The apparatus includes means for precise and reproducible placement of the tissues
relative to the optical aperture. Appropriate means are provided for applying and
72
maintaining pressure to keep surface tissues immobile during experiments while
obtaining the desired blood content and flow. Soft matter, e.g., skin, extrudes into the
aperture in response to any applied pressure, e.g., to keep the tissue in registration with
the optical system, so the position, contact area, pressure, and force are continuously
measured and recorded to produce feedback for an actuator applying force and to discern
the compliance of the test subject. The compliance strongly affects the reliability of the
measurement and human factors must be adequately managed in the case of in vivo
probing. The present device is even more advanced since the actual application of
pressure is automatic and could work for an unconscious test subject.
The digital quantitative records of the measurement cycle could be used for
interpreting sources of errors in glucose concentrations in order to improve performance
and better understand the total measurement process. Together with appropriate criteria
based on general quantitative experience, any specific human factor data can be
processed to allow objective rejection or acceptance of associated spectroscopic data
before calculation of a glucose concentration for example without operator involvement.
Finally, despite the idiosyncratic aspects of in vivo human spectroscopic probing, the
gross anatomy of ridged fingertip skin is constant across all but the most abnormal test
subjects. The fingertip topographic results are reasonably consistent because the scanning
of the different tissues samples, i.e., test subjects, has been relatively consistent. This
general consistency suggests that the pressure is a universal variable appropriate for
characterizing the state of perfused tissue and soft matter generally during spectroscopic
probing. Thus it is important that the pressure be well defined in order to perform a
spectroscopic experiment that can be executed reproducibly. It is possible that under
73
appropriate constant pressure conditions, the turbidity and relative density of the tissues
in the probed volume do not vary much across individuals. Using this instrument, except
for pulse driven motions and acoustic waves, the tissues can be isobaric and motionless
during the measurement process. This does not necessarily mean that further processing
of data acquired using this instrument for purposes of a turbidity correction (82-84) to the
quantitative analysis of blood and other tissues are unnecessary. This must be ascertained
with more experimentation, but using this instrument data collected for different test
subjects or at different times for the same test subject can be compared and reproduced in
an objective and quantitatively consistent manner. Many of the same ideas in this device
would be applicable to spectroscopic probing of other types of soft matter, including ex
vivo tissue samples for biopsy.
74
3. SIMULTANEOUS NONINVASIVE IN VIVO
OBSERVATION OF IE AND EE
3.1 Elastic and Inelastic Emissions
3.1.1 Background
Figure 3-1 shows a Jablonski diagram that illustrates various vibrational and
electronic states within a typical molecule with arrows to present scattering processes and
electronic transitions associated with Raman, fluorescence and phosphorescence.
Rayleigh scattering can happen when the incident photons hit an object, e.g., a molecule,
which is much smaller than the wavelength of light with no energy transferred but only
altered direction of propagation. Thus, this process is elastic. Not shown in the diagram,
another similar elastic scattering i.e., Mie scattering, can happen when the size of the
object is roughly the same as the incident wavelength. In our experiments we cannot
differentiate between these two sources of elastic emission.
Of all the incident photons, roughly only one out of a hundred million will scatter
from the sample at a shifted wavelength generating the extremely weak Raman scattering
(32). A molecule in a very strong electric field, e.g., produced by a laser, has excited
states, i.e., “virtual states”, that only exist in the presence of the radiation field.
Interaction with another photon from that same laser field in the manner indicated by the
arrows can produce Raman scattered light as well as the aforementioned Rayleigh and
Mie scattered light. Usually, part of the energy in an incident photon is transferred to the
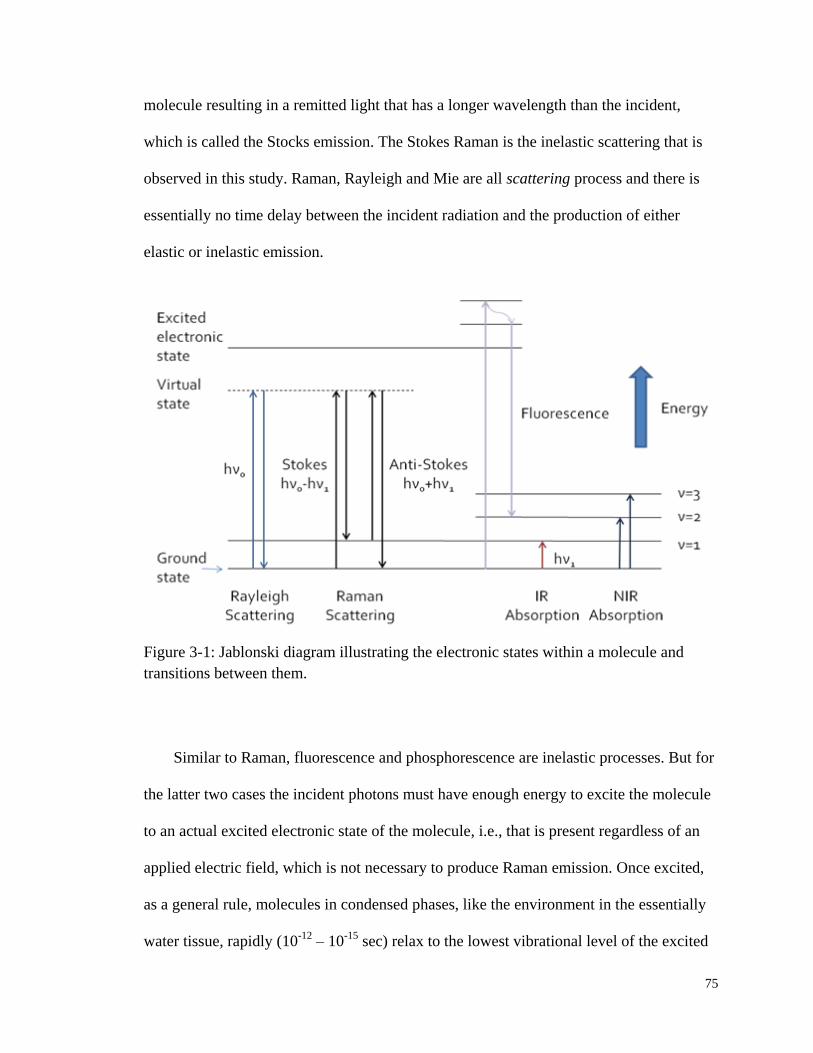
75
molecule resulting in a remitted light that has a longer wavelength than the incident,
which is called the Stocks emission. The Stokes Raman is the inelastic scattering that is
observed in this study. Raman, Rayleigh and Mie are all scattering process and there is
essentially no time delay between the incident radiation and the production of either
elastic or inelastic emission.
Figure 3-1: Jablonski diagram illustrating the electronic states within a molecule and
transitions between them.
Similar to Raman, fluorescence and phosphorescence are inelastic processes. But for
the latter two cases the incident photons must have enough energy to excite the molecule
to an actual excited electronic state of the molecule, i.e., that is present regardless of an
applied electric field, which is not necessary to produce Raman emission. Once excited,
as a general rule, molecules in condensed phases, like the environment in the essentially
water tissue, rapidly (10-12
– 10-15
sec) relax to the lowest vibrational level of the excited

76
electronic state and then give off an emission with a typical lifetime of 10-7
– 10-9
sec for
fluorescence and 10-3
– 10-6
sec for phosphorescence (85). The excited state has different
spin angular momentum from the ground electronic state for phosphorescence and it is
the same for fluorescence. From the Jablonski diagram, it is obvious that both Stocks
Raman and fluorescence processes involve energy loss and thus are both inelastic
emissions. Experimentally we cannot separate the different sources of inelastic emission
from each other without additional information, e.g., temporal properties.
In this study, the EE is Rayleigh and Mie scattered light, whereas the IE consists
mostly of fluorescence and in absolute magnitude, only a small amount of Raman
scattered light. The collected EE reflects the net absorption at the excitation wavelength
but more importantly in terms of the relative amounts of collected EE, propagation losses
due to physical scattering from structural and formed elements, e.g., collagen fibers and
RBCs. Production of IE is initiated by absorption of the excitation light but there are
other factors, e.g., the quantum yields for fluorescence and the cross sections for Raman,
that contribute to determine the net collected IE. At least some of these factors would
seem to be independent of the absorption process and thus for analytical purposes the
measured EE and IE are effectively independent quantities with regard to their
information content.
3.1.2 Potential In Vivo Application of EE and IE
In vivo, the NIR spectral range is the most advantageous for probing blood in human
skin mainly because of the relatively low propagation loss and the low net absorption
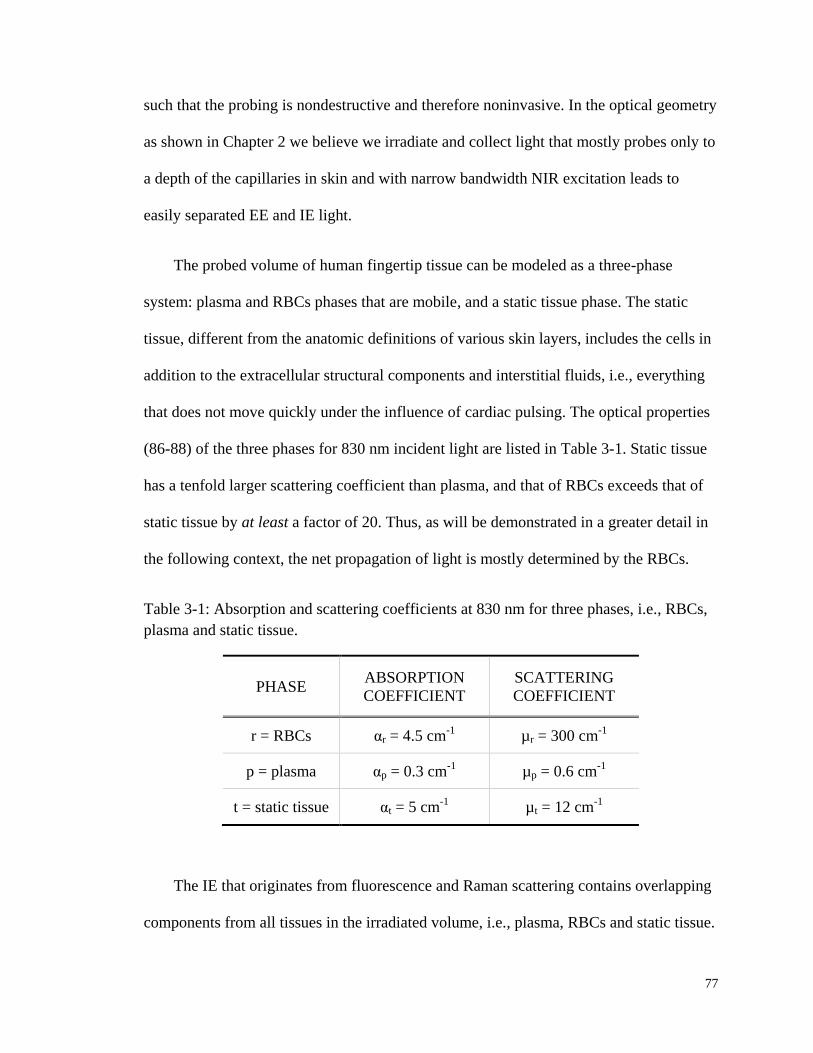
77
such that the probing is nondestructive and therefore noninvasive. In the optical geometry
as shown in Chapter 2 we believe we irradiate and collect light that mostly probes only to
a depth of the capillaries in skin and with narrow bandwidth NIR excitation leads to
easily separated EE and IE light.
The probed volume of human fingertip tissue can be modeled as a three-phase
system: plasma and RBCs phases that are mobile, and a static tissue phase. The static
tissue, different from the anatomic definitions of various skin layers, includes the cells in
addition to the extracellular structural components and interstitial fluids, i.e., everything
that does not move quickly under the influence of cardiac pulsing. The optical properties
(86-88) of the three phases for 830 nm incident light are listed in Table 3-1. Static tissue
has a tenfold larger scattering coefficient than plasma, and that of RBCs exceeds that of
static tissue by at least a factor of 20. Thus, as will be demonstrated in a greater detail in
the following context, the net propagation of light is mostly determined by the RBCs.
Table 3-1: Absorption and scattering coefficients at 830 nm for three phases, i.e., RBCs,
plasma and static tissue.
PHASE ABSORPTION
COEFFICIENT
SCATTERING
COEFFICIENT
r = RBCs αr = 4.5 cm-1
µr = 300 cm-1
p = plasma αp = 0.3 cm-1
µp = 0.6 cm-1
t = static tissue αt = 5 cm-1
µt = 12 cm-1
The IE that originates from fluorescence and Raman scattering contains overlapping
components from all tissues in the irradiated volume, i.e., plasma, RBCs and static tissue.

78
Yet their fluorescence yields per unit volume are different. Resulting from fundamentally
different physical processes, the apparent IE yields differ between RBCs, plasma, and
skin in a manner that is uncorrelated with the variation in elastic scattering yields across
the same tissues. Therefore, a model that takes these parameters into account should
allow us to simultaneously estimate the relative volume fractions of the three phases in
the probed volume, in vivo and noninvasively.
Figure 3-2: IE and EE as a function of time for a single very short and weak mechanical
impulse starting at t=0 sec, followed by active pressure maintenance at 50 gf/cm2. Inset:
same data at shortest times.
Figure 3-2 shows the complete EE and IE curves collected for a typical 100 sec
experiment with the pre-experiment “set-up” as described in Chapter 2. The IE and EE
integrals are each plotted as a function of time. The data were transformed to have a
79
mean of 0 and standard deviation of 1 to facilitate their comparison. In the inset, we show
the data for t<0.5 sec. Initially, the IE drops rapidly while the EE is nearly constant.
Figure 3-3 shows some of the same data as Figure 3-2 but using an expanded temporal
scale to show the complementary and very nearly proportional behavior of EE versus IE
light.
To understand the relative time dependence of the EE and IE data on the time scale
of the pulses and faster, two facts are important. First, the previously published (49, 50,
54) in vitro data for 785 nm excitation of methemoglobin over the concentration spanning
the normal capillary blood range demonstrates that the integrated fluorescence, i.e., IE,
increases linearly with increasing hemoglobin (Hb) volume percent. Moreover, as will be
shown in Chapter 4, in vitro plasma fluorescence also increases linearly from infinite
dilution in Normocarb™ to pure plasma. Thus, fluorescence measured in vivo is a
measure of both plasma volume and Hb volume.
Second, the amount of elastically scattered light collected decreases as the volume
percent of RBCs increases. In perfused skin, the volume percentages of the plasma, RBCs,
and static tissues are constantly changing. A volume containing only static tissue and
plasma would not scatter appreciably because the scattering coefficients are small. But
propagation through a perfused volume may experience much larger changes because of
changed RBCs volume fraction, because RBCs scattering coefficients are very large as
shown in Table 3-1. If, for a heart-driven pressure wave, i.e., pulse, the volume
percentage of plasma decreases, the volume percent of RBCs must increase, even if none
actually moved, and the net elastically scattered light collected will decrease.

80
Figure 3-3: Same data as in Figure 3-2, shown at higher temporal resolution to show
complementary behavior of EE versus IE.
At the shortest times as shown in the inset of Figure 3-2, when the actuator is
establishing control over the pressure applied to the tissue, the behavior of the two plots
(substantial decrease in IE with a small relative change in the EE) suggests that mostly
plasma motion occurs. Because plasma motion out of the irradiated volume decreases the
relative total blood volume percent and causes a decrease in the collected inelastically
scattered light, we infer that the observed change in IE over the long timescale is due
mostly to plasma removal. Apparently the small observed change in EE signal is due to a
small movement of RBCs out of the irradiated volume, which keeps the change in
volume percent of RBCs in the irradiated volume very small. This seems reasonable
because, in the depth range we observe in Figure 3-2 plasma and erythrocytes are mostly

81
confined to narrow capillaries and the discharge and tube hematocrit (Hct) are very
nearly equal (89). The effect of a relatively large change in IE due to plasma motion is
compensated by a very small modulation of RBCs so the RBCs volume fraction is nearly
constant.
Once the desired pressure value has been established, the pulses and other regular
temporal oscillations in both the IE and EE data can be observed. The IE temporal
behavior corresponds to the increasing and decreasing local blood volume as blood
pressure pulses propagate through the capillaries in the irradiated volume. The capillaries
become slightly distended as an increased volume of plasma and RBCs occupies the
capillary lumen during the increasing pressure pulse. Because the RBCs have by far the
largest scattering coefficient, change of EE collected light is most strongly associated
with RBCs movement. Although most of the observed Rayleigh/Mie light originates from
static tissue because that tissue has the highest volume fraction, the efficiency of
propagation of the excitation light to the static tissue and of the elastically scattered light
to the collection zone decreases as RBCs volume percent increases.
Therefore, simultaneous observation of elastic scattering, fluorescence, and inelastic
scattering from in vivo NIR probing of human skin allows discrimination of the
movement and presence of RBCs independently from plasma. Control of the mechanical
force needed to obtain reliable optical registration of in vivo tissue with the optical system
allows reproducible observation of blood flow in capillary beds of human volar side
fingertips. The time dependence of the elastically scattered light is complementary to that
of the combined fluorescence and Raman scattered light due to the changing volume
fractions of the three phases in the irradiated volume with normal homeostatic processes
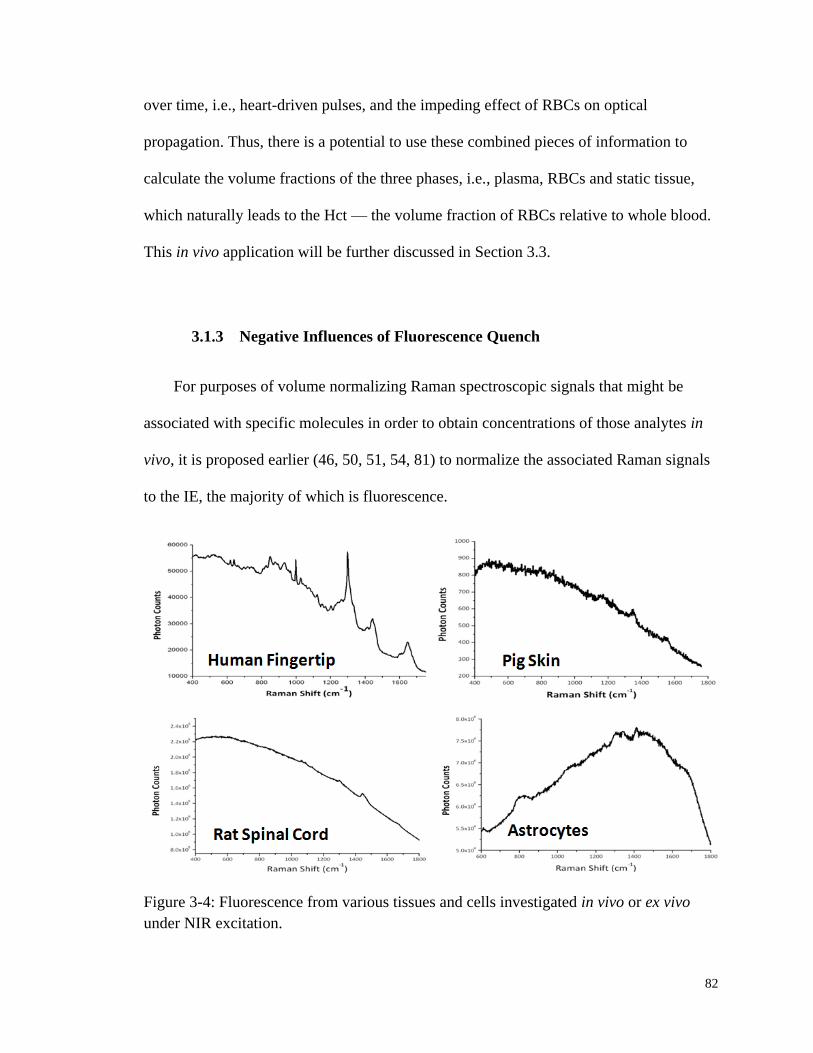
82
over time, i.e., heart-driven pulses, and the impeding effect of RBCs on optical
propagation. Thus, there is a potential to use these combined pieces of information to
calculate the volume fractions of the three phases, i.e., plasma, RBCs and static tissue,
which naturally leads to the Hct — the volume fraction of RBCs relative to whole blood.
This in vivo application will be further discussed in Section 3.3.
3.1.3 Negative Influences of Fluorescence Quench
For purposes of volume normalizing Raman spectroscopic signals that might be
associated with specific molecules in order to obtain concentrations of those analytes in
vivo, it is proposed earlier (46, 50, 51, 54, 81) to normalize the associated Raman signals
to the IE, the majority of which is fluorescence.
Figure 3-4: Fluorescence from various tissues and cells investigated in vivo or ex vivo
under NIR excitation.

83
As shown in Figure 3-4, for various tissues and cells that have been probed in vivo or
ex vivo, fluorescence is ubiquitously observed and is related with the fluorophores within
the probed volume. If all tissues produce fluorescence in proportion to the concentrations
of fluorophores in those tissues and if the concentrations are constant in time then the
hypothesis for volume normalization is supported.
Figure 3-5: BV vs. Time curve screenshots of a typical in vivo collected human fingertip
(A, top) and gelatin tissue phantom (B, bottom). Obvious trend of gradual IE decrease is
observed in volar side human fingertip spectra.
Unfortunately, except for the drop of fluorescence in the middle of an experiment
due to the pressure modulation of tissue, as shown in Figure 3-5(A), a typical in vivo BV
vs. Time curve always shows an abrupt drop at the very beginning (usually within the
first few seconds), and then slowly decreases with time. Ideally, as shown in the bottom
panel of Figure 3-5, fluorescence change should only be observed when tissue
84
modulation occurs. Clearly, the in vivo decay indicates the change of fluorophore
concentrations that is oppose to our hypothesis. Therefore, using the decreasing IE for
volume normalizing will introduce uncertainties of inelastic emission that does not result
from tissue modulation, which is detrimental to proper normalization.
To tackle the negative influences of such skin tissue fluorescence quenching, it is
essential to study the origins and characteristics of in vivo human skin NIR fluorescence.
Hopefully, the study in Section 3.2 provides an understanding to guide us in modifying
our algorithm or experimental procedures to eliminate its detrimental effects. The
relevance to the quantitative monitoring of glucose concentrations or Hct will be
discussed in Section 3.3.
3.2 Characterizing Human Fingertip Autofluorescence
3.2.1 Dependence on NIR Irradiation
Besides the pressure administration exerted by PDPM, all the tissues of an organism
are simultaneously under i) the oncotic pressure exerted by the osmotic pressure across
physiological compartments due to changing electrolyte balance (44, 79), ii) the pressure
exerted within the circulatory system, and iii) the hydrostatic pressure exerted by gravity
on all the body tissues. From the outset we were suspicious that these pressure factors
could be contributors to the gradual fluorescence drop as observed in the BV vs. Time
curve in Figure 3-5(A). Thus, it is important to determine the timescale of possible fluid
equilibration driven by hydrostatic pressure, if any, due to the changing body posture of
the test subject in contacting with the apparatus, i.e., changing from a standing position to
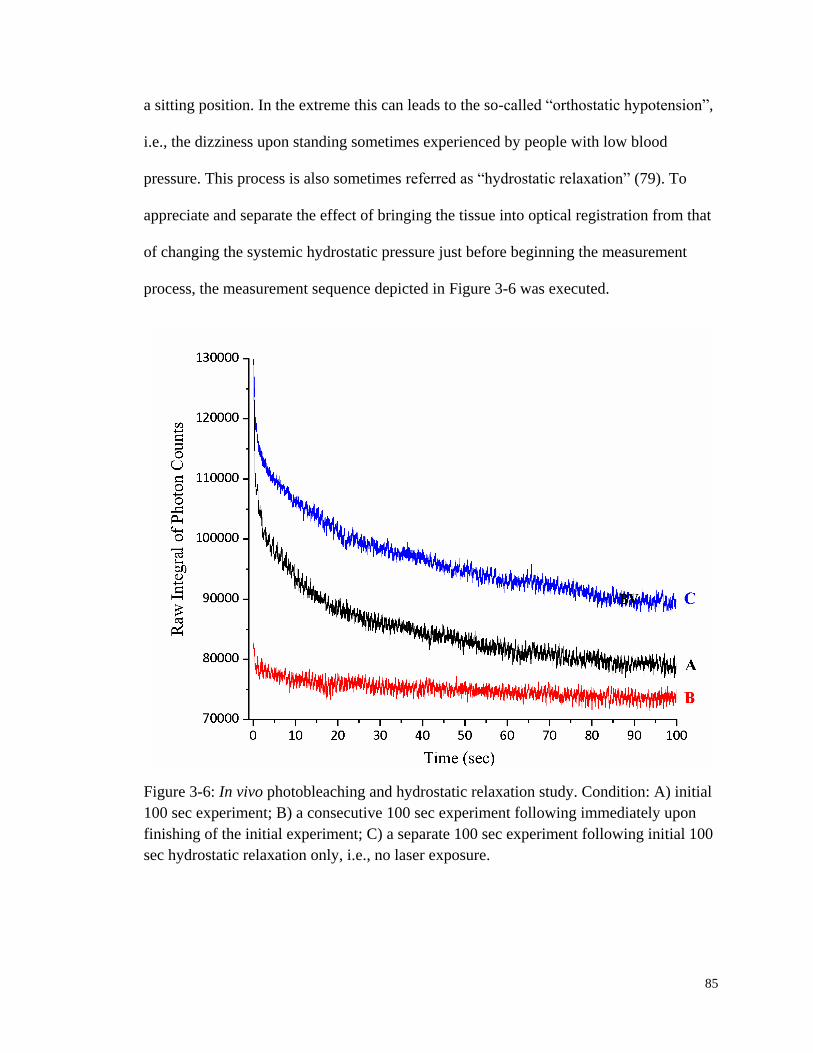
85
a sitting position. In the extreme this can leads to the so-called “orthostatic hypotension”,
i.e., the dizziness upon standing sometimes experienced by people with low blood
pressure. This process is also sometimes referred as “hydrostatic relaxation” (79). To
appreciate and separate the effect of bringing the tissue into optical registration from that
of changing the systemic hydrostatic pressure just before beginning the measurement
process, the measurement sequence depicted in Figure 3-6 was executed.
Figure 3-6: In vivo photobleaching and hydrostatic relaxation study. Condition: A) initial
100 sec experiment; B) a consecutive 100 sec experiment following immediately upon
finishing of the initial experiment; C) a separate 100 sec experiment following initial 100
sec hydrostatic relaxation only, i.e., no laser exposure.
86
For the BV vs. Time curve A, a normally closed shutter placed immediately after the
incident laser source was triggered open by starting the spectrum acquisition process
following a quick “set-up” routine as described in Section 2.2.4, during which the finger
was passively under the pressure administration fulfilled by PDPM. Immediately
following the completion of curve A, the finger was maintained motionless (±20 µm or
less than about 10% of the physical dimensions of the laser spot) and the acquisition of
curve B started.
To obtain curve C, the finger was retracted from the device and the test subject stood
upright and walked around the laboratory for a total of at least 50 ft while executing
movements of all appendages in order to re-equilibrate the blood in the entire body,
thereby restoring normal hydrostatic status throughout. Then, with the laser blocked, the
test subject re-registered with the device by selecting a slightly different spot with respect
to the fingerprint ridges and running the same initial “set-up” routine. The hand was kept
motionless and in contact with both the actuator and the aperture as the A run but not
irradiated for 100 sec, a period of time equal to that of curve A collection. In this way,
any fluid redistribution due to the changing hydrostatic pressure associated with
assuming different body posture, i.e., sitting versus standing, would have the same time
to occur but without laser irradiation.
As shown in Figure 3-6, obvious heart pulsing was observed throughout all the data.
But in curve A, the initial value of the IE is large followed by a fast roughly 100-10
-1
seconds decay and then a slower exponential decay over the next tens of seconds. In the
case of curve B, however, the initial IE is nearly the same as the end of the A and not
much drop in IE is observed. The dynamics of the C curve is nearly identical to that of
87
the A although the value of IE is greater than that of the A data. Since the difference in
data acquisition between curve B and C is only the 100 sec pre-experiment laser exposure,
we conclude that the drop in IE is associated with the presence of the laser and not due to
any change in hydrostatic pressure. Hereafter, such laser induced decrease of
fluorescence is mentioned as “photobleaching” and this photobleaching has been
observed for all subjects without exception.
The power dependence of the observed skin autofluorescence was also measured for
three test subject. Not surprisingly, the results shown in Figure 3-7(A) demonstrated that
the in vivo autofluorescence increases as the laser power increases. In addition to the
increased size of probed volume with greater incident laser power, higher power also
increases the penetration depth from which signal is obtained. Therefore, the observed
fluorescence at various powers could probably contain different relative contributions
from superficial static tissue and deeper blood components. This could in turn result in
change of rates and characteristics of photobleaching. Radiation transfer equation (RTE)
modeling including the correct probing and collection geometry (10) suggests that the
signal that is the IE has a power index of 1.0 when the excitation transition that produces
fluorescence is a one photon transition.
Recognizing that interpretation of the power dependence of the autofluorescence is
therefore complicated at best, we measured the quantity in order to i) satisfy engineering
needs, i.e., the scaling of signal with incident power is an important design parameter,
and ii) check for any evidence that the excitation process is a multiphoton process.
Measurement of the power index, i.e., the slope of a log power vs. log fluorescence plot,
is commonly used in the laser chemistry literature (90) to establish the order of the

88
slowest excitation step in any multiphoton process. While non-integral indices are
commonly observed in complicated systems, e.g., representing an averaging over perhaps
more than one excitation sequence, in well defined and simpler systems, such indices are
rigorous proof in establishing the order of a multiphoton process.
Figure 3-7: Laser power dependence of the skin autofluorescence. (A, top) IE integrals
for three test subjects under six different laser powers. Data were collect on the same day.
(B, bottom) Linear fit to the logarithmic values of both laser power and fluorescence
integrals. Both panels show obvious IE increase as the increase of laser power.

89
As can be seen in Figure 3-7(B) the measured index was 0.74 for all the test
subjects. While we have not yet tried to observe emission e.g. at 415 nm for 830 nm
excitation, this index is consistent with the hypothesis that the autofluorescence is
produced with NIR excitation of skin by a one photon absorption process. In analogy
with simpler but possibly analogous systems, the power index could be less than 1.0
because in parallel with the excitation process, there is another laser induced process that
causes a decrease in the collected fluorescence with increasing incident power.
Another study on the characteristics of photobleaching at different laser powers was
performed on six test subjects. For each test subject, only one laser power was
investigated a day to avoid any possible accumulative influence of such bleaching. Thus
the data collected covered a relatively longer period of time. The firstly clear observation
in Figure 3-8 is that the data collected for a diabetic patient stand out. The
autofluorescence from the diabetic subject not only has almost three times bigger starting
fluorescence, but also bleaches more than 60% toward the end of a 200 sec experiment.
Similar excessive fluorescence and bleaching are observed for a senior subject, but not to
an extent like the diabetic patient. For all the rest subjects, fingertip autofluorescence
typically bleaches 15-20%, with a slight increase toward higher laser power to around 20-
30%.

90
Figure 3-8: Photobleaching study of various test subjects at different power levels. (A,
top left) Starting points of the skin autofluorescence; (B, top right) Ending points of
fluorescence after 200 sec of 830 nm laser exposure; and (C, bottom) Ratio of the
bleached fluorescence to the baseline, i.e., the equilibrium fluorescence after bleaching.
All fluorescence photobleaching curves were fitted into a two-component
exponential decay equation to obtain the two lifetime τ1 and τ2 which is shown in Figure
3-9. Despite of the relatively large deviation and spread of the data, the two time
constants definitely represent two separate processes, one quick and one slow. With not
much difference among test subjects, τ1 is of the order of magnitude of 101 to 10
2 sec,
while τ2 is typically below 10 sec. Lastly, although vaguely, τ1 decreases slightly with the
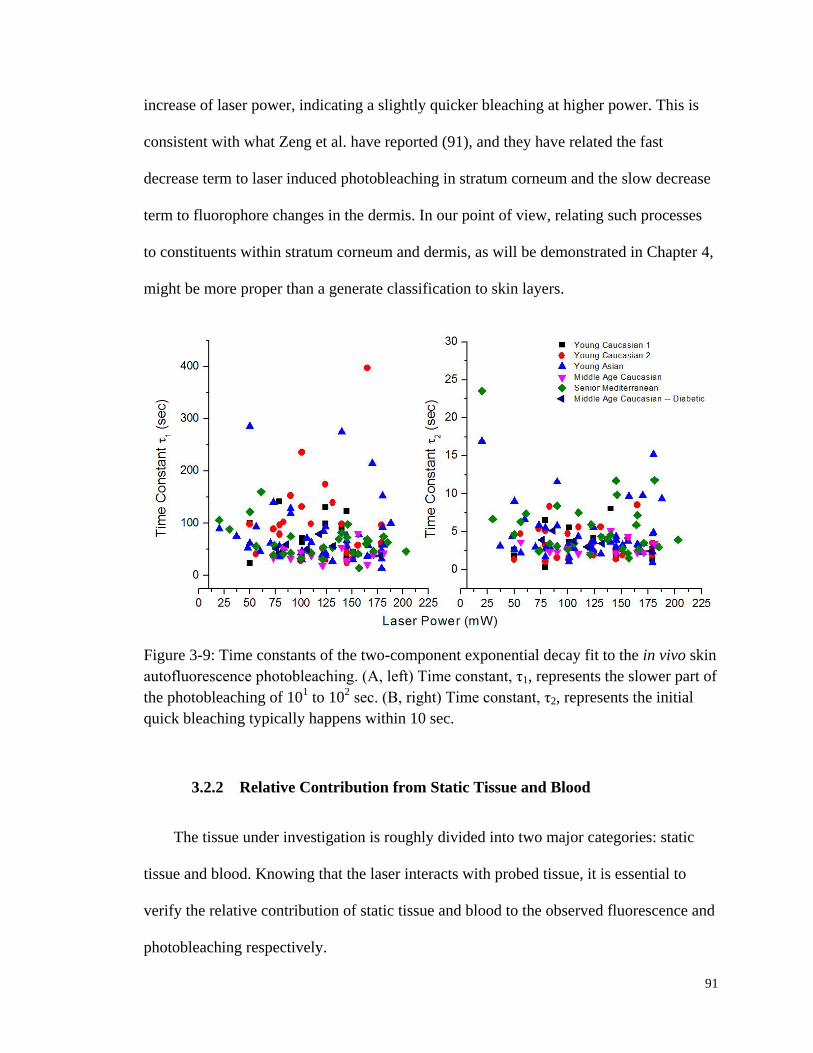
91
increase of laser power, indicating a slightly quicker bleaching at higher power. This is
consistent with what Zeng et al. have reported (91), and they have related the fast
decrease term to laser induced photobleaching in stratum corneum and the slow decrease
term to fluorophore changes in the dermis. In our point of view, relating such processes
to constituents within stratum corneum and dermis, as will be demonstrated in Chapter 4,
might be more proper than a generate classification to skin layers.
Figure 3-9: Time constants of the two-component exponential decay fit to the in vivo skin
autofluorescence photobleaching. (A, left) Time constant, τ1, represents the slower part of
the photobleaching of 101 to 10
2 sec. (B, right) Time constant, τ2, represents the initial
quick bleaching typically happens within 10 sec.
3.2.2 Relative Contribution from Static Tissue and Blood
The tissue under investigation is roughly divided into two major categories: static
tissue and blood. Knowing that the laser interacts with probed tissue, it is essential to
verify the relative contribution of static tissue and blood to the observed fluorescence and
photobleaching respectively.
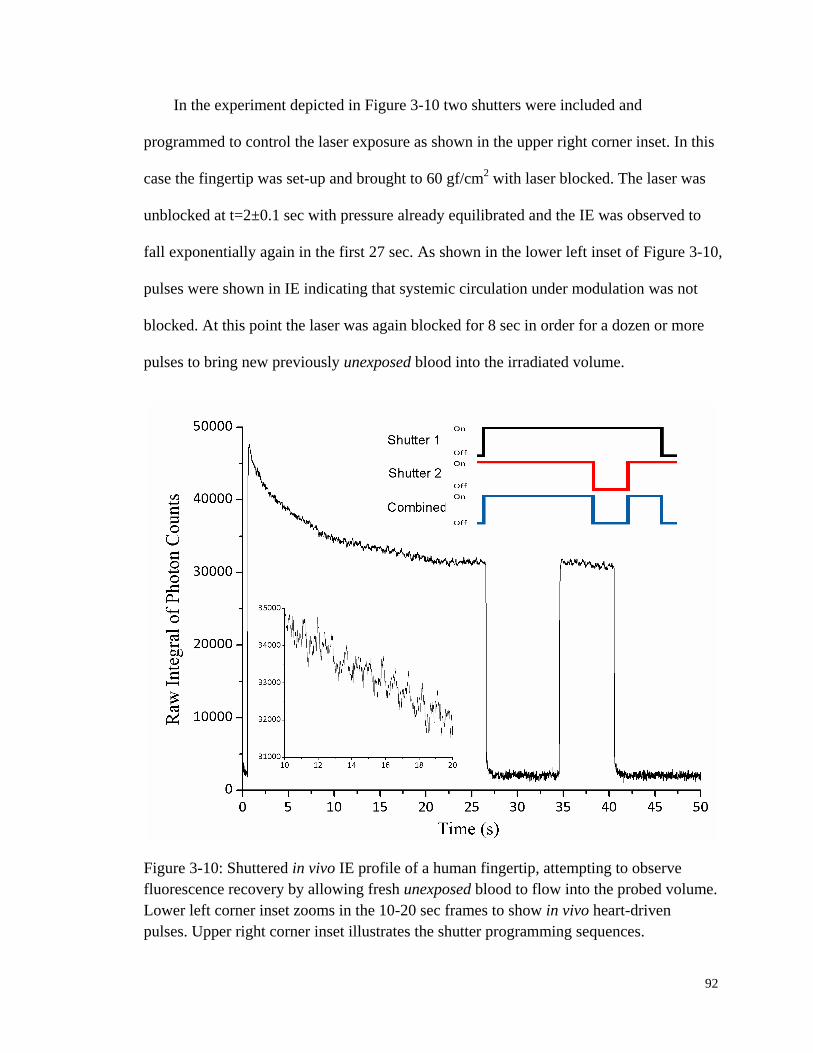
92
In the experiment depicted in Figure 3-10 two shutters were included and
programmed to control the laser exposure as shown in the upper right corner inset. In this
case the fingertip was set-up and brought to 60 gf/cm2 with laser blocked. The laser was
unblocked at t=2±0.1 sec with pressure already equilibrated and the IE was observed to
fall exponentially again in the first 27 sec. As shown in the lower left inset of Figure 3-10,
pulses were shown in IE indicating that systemic circulation under modulation was not
blocked. At this point the laser was again blocked for 8 sec in order for a dozen or more
pulses to bring new previously unexposed blood into the irradiated volume.
Figure 3-10: Shuttered in vivo IE profile of a human fingertip, attempting to observe
fluorescence recovery by allowing fresh unexposed blood to flow into the probed volume.
Lower left corner inset zooms in the 10-20 sec frames to show in vivo heart-driven
pulses. Upper right corner inset illustrates the shutter programming sequences.
93
The hypothesis here is that static tissue remains the same either before or after the
laser is blocked, while heart-driven pulses keep on pumping previously non-bleached
blood into the illuminated zone. Therefore, after the 8 sec “dark time” it is expected that
the bleaching effect on static tissue remains, if there is any, but now fresh unbleached
blood components are present. Checking the IE curve on the point of reopening the
shutters enables us to differentiate the influence of laser on the two separately. If blood is
the main contributor to the bleached fluorescence observed at t=2 sec of the test, then
fluorescence should recover back to the previous level on reopening of the shutters. As
shown in Figure 3-10, fluorescence returned to where it was before the shutter was closed
but not to a significantly greater level than where it was at the initiation of the experiment.
Also noticeably, upon reopening of the shutters no exponential decay was observed. Thus
it is evident that using 830 nm excitation most of the bleachable NIR autofluorescence
originates in the static tissue.
Figure 3-11 also shows a typical BV vs. Time curve collected by a precious
colleague using 805 nm excitation (51). Actually, under either 805 or 830 nm excitation,
the blood, i.e., the sum of plasma and RBCs, and unbleached static tissue fluorescence
per unit volume are comparable with the blood being somewhat greater. If the
fluorescence per unit volume of the blood and the static tissue were the same, then pulses
would not be observable. If the blood fluorescence were twice that of bleached tissue per
unit volume then increasing the perfusion due to a cardiac pulse by 2% would increase
the fluorescence by 2% and this is very roughly what has been observed. The appearance
of the dichotic notch (51) compared with that observed using photoplethysmography also
shows that the blood fluorescence per unit volume is larger than that of the tissue.
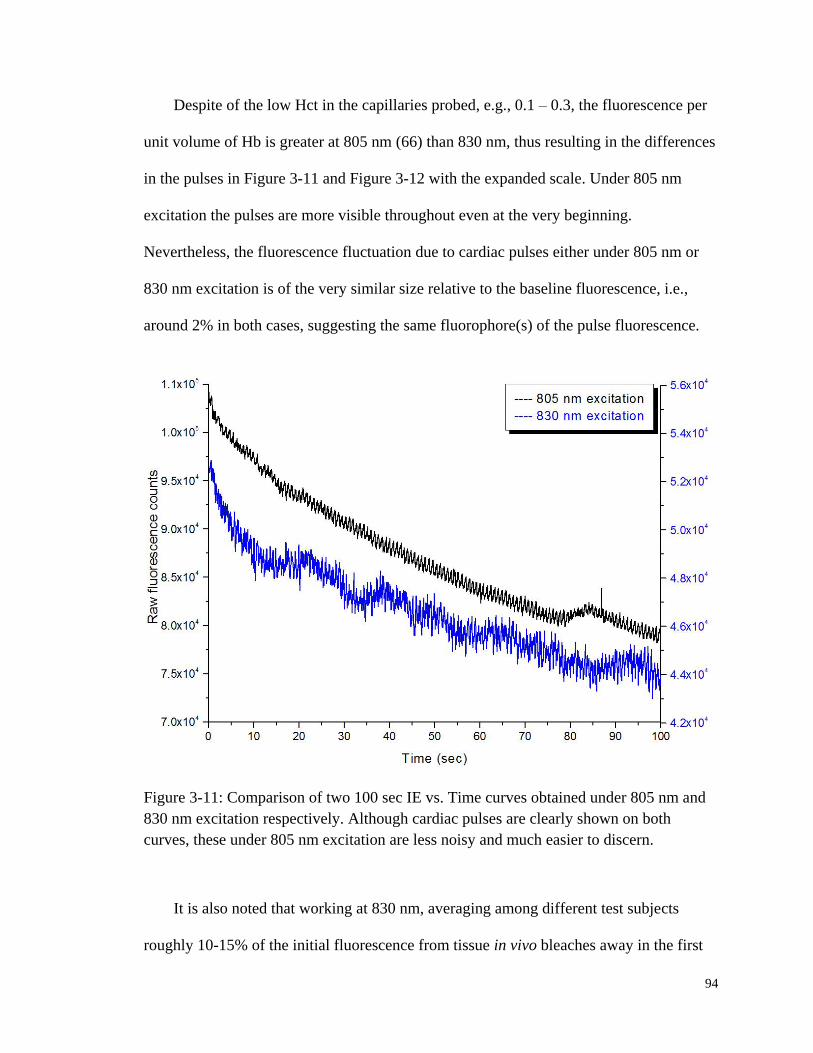
94
Despite of the low Hct in the capillaries probed, e.g., 0.1 – 0.3, the fluorescence per
unit volume of Hb is greater at 805 nm (66) than 830 nm, thus resulting in the differences
in the pulses in Figure 3-11 and Figure 3-12 with the expanded scale. Under 805 nm
excitation the pulses are more visible throughout even at the very beginning.
Nevertheless, the fluorescence fluctuation due to cardiac pulses either under 805 nm or
830 nm excitation is of the very similar size relative to the baseline fluorescence, i.e.,
around 2% in both cases, suggesting the same fluorophore(s) of the pulse fluorescence.
Figure 3-11: Comparison of two 100 sec IE vs. Time curves obtained under 805 nm and
830 nm excitation respectively. Although cardiac pulses are clearly shown on both
curves, these under 805 nm excitation are less noisy and much easier to discern.
It is also noted that working at 830 nm, averaging among different test subjects
roughly 10-15% of the initial fluorescence from tissue in vivo bleaches away in the first
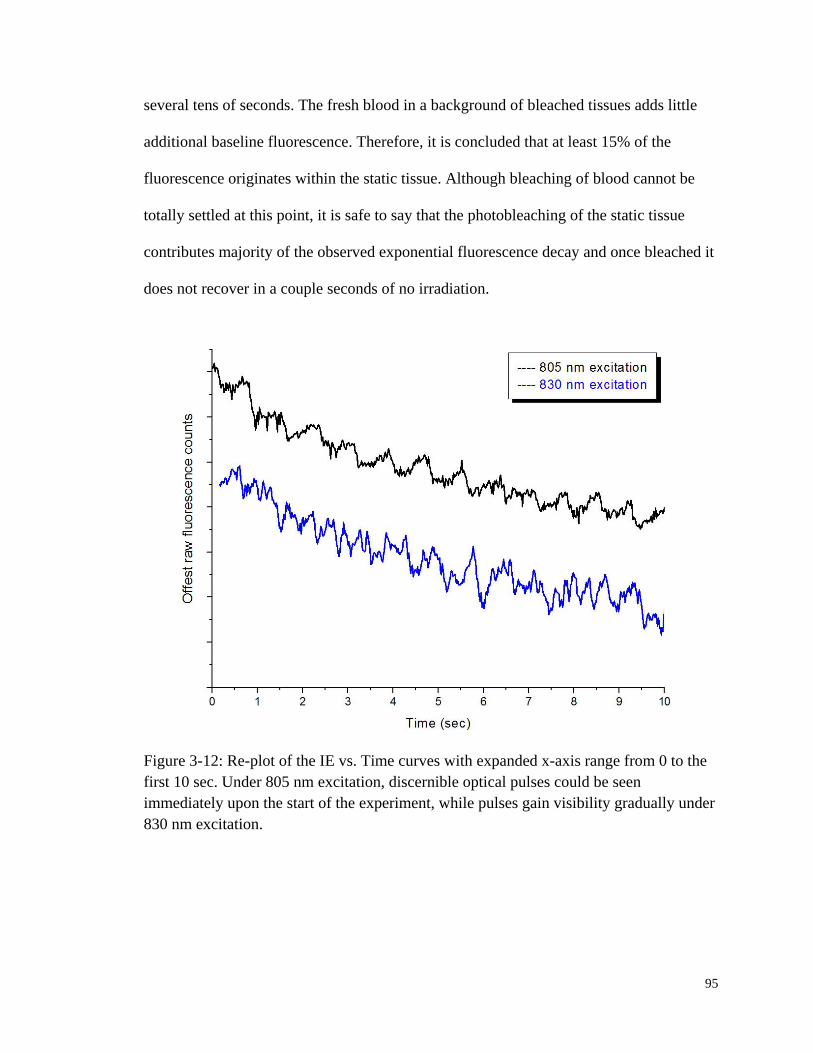
95
several tens of seconds. The fresh blood in a background of bleached tissues adds little
additional baseline fluorescence. Therefore, it is concluded that at least 15% of the
fluorescence originates within the static tissue. Although bleaching of blood cannot be
totally settled at this point, it is safe to say that the photobleaching of the static tissue
contributes majority of the observed exponential fluorescence decay and once bleached it
does not recover in a couple seconds of no irradiation.
Figure 3-12: Re-plot of the IE vs. Time curves with expanded x-axis range from 0 to the
first 10 sec. Under 805 nm excitation, discernible optical pulses could be seen
immediately upon the start of the experiment, while pulses gain visibility gradually under
830 nm excitation.
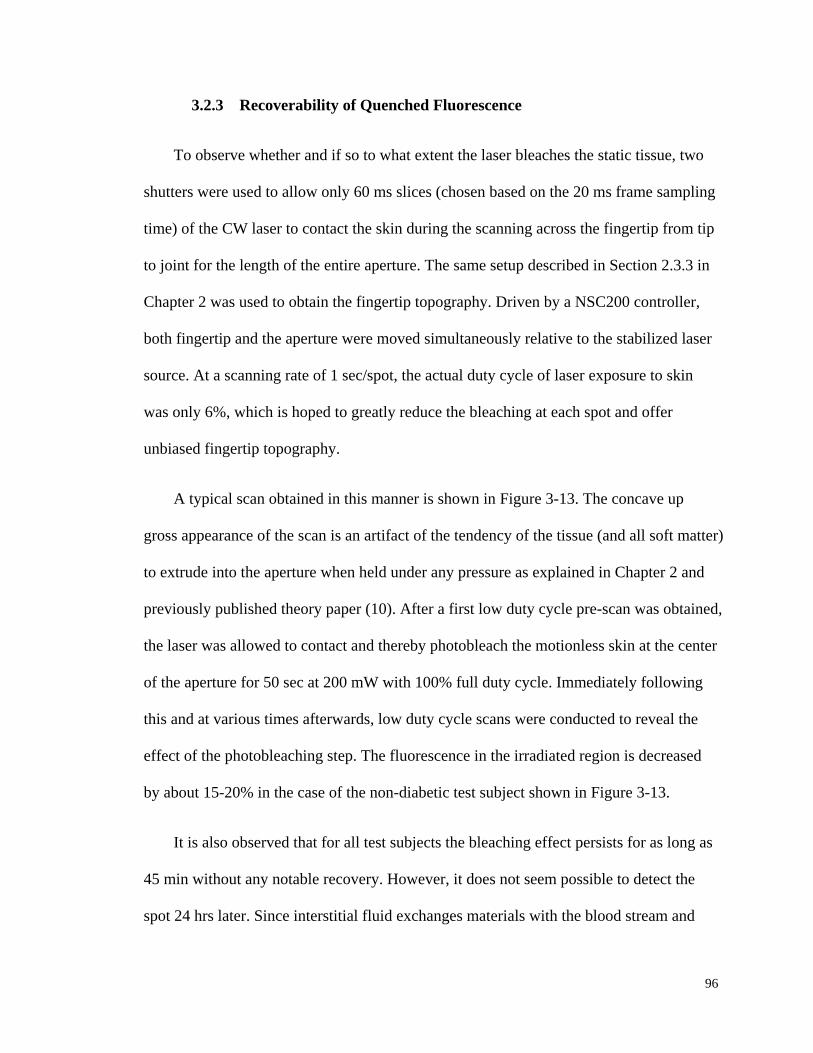
96
3.2.3 Recoverability of Quenched Fluorescence
To observe whether and if so to what extent the laser bleaches the static tissue, two
shutters were used to allow only 60 ms slices (chosen based on the 20 ms frame sampling
time) of the CW laser to contact the skin during the scanning across the fingertip from tip
to joint for the length of the entire aperture. The same setup described in Section 2.3.3 in
Chapter 2 was used to obtain the fingertip topography. Driven by a NSC200 controller,
both fingertip and the aperture were moved simultaneously relative to the stabilized laser
source. At a scanning rate of 1 sec/spot, the actual duty cycle of laser exposure to skin
was only 6%, which is hoped to greatly reduce the bleaching at each spot and offer
unbiased fingertip topography.
A typical scan obtained in this manner is shown in Figure 3-13. The concave up
gross appearance of the scan is an artifact of the tendency of the tissue (and all soft matter)
to extrude into the aperture when held under any pressure as explained in Chapter 2 and
previously published theory paper (10). After a first low duty cycle pre-scan was obtained,
the laser was allowed to contact and thereby photobleach the motionless skin at the center
of the aperture for 50 sec at 200 mW with 100% full duty cycle. Immediately following
this and at various times afterwards, low duty cycle scans were conducted to reveal the
effect of the photobleaching step. The fluorescence in the irradiated region is decreased
by about 15-20% in the case of the non-diabetic test subject shown in Figure 3-13.
It is also observed that for all test subjects the bleaching effect persists for as long as
45 min without any notable recovery. However, it does not seem possible to detect the
spot 24 hrs later. Since interstitial fluid exchanges materials with the blood stream and
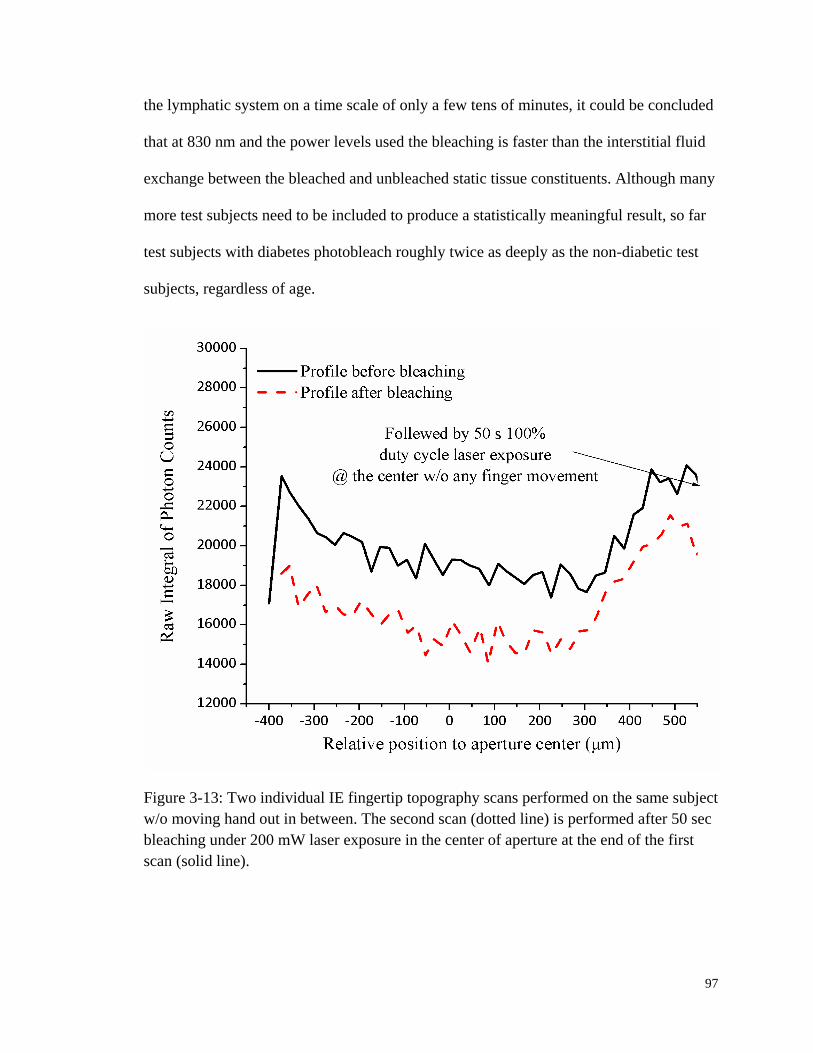
97
the lymphatic system on a time scale of only a few tens of minutes, it could be concluded
that at 830 nm and the power levels used the bleaching is faster than the interstitial fluid
exchange between the bleached and unbleached static tissue constituents. Although many
more test subjects need to be included to produce a statistically meaningful result, so far
test subjects with diabetes photobleach roughly twice as deeply as the non-diabetic test
subjects, regardless of age.
Figure 3-13: Two individual IE fingertip topography scans performed on the same subject
w/o moving hand out in between. The second scan (dotted line) is performed after 50 sec
bleaching under 200 mW laser exposure in the center of aperture at the end of the first
scan (solid line).

98
3.2.4 Summary
A series of measurements in vivo intended to establish some of the basic empirical
properties of the autofluorescence and photobleaching phenomena are described. To
summarize, in vivo results show that the observed bleaching of human fingertip skin with
830 nm excitation is laser induced coming mostly from the static tissue rather than blood
components, and is unrecoverable within the time span of 101-10
2 min. On a given trial
the exact amount of tissue fluorescence varies from person to person in manner that we
and others are actively studying (91-96). And an initial bleaching process always occurs
and the magnitude is roughly as what is suggested. Therefore, for a single test subject in
comparison with him or herself, utilizing a reasonable pre-bleaching period in a
consistent manner could still allow for using IE as a volume normalizer.
3.3 Hct Monitoring Using Combined EE and IE
3.3.1 The Theoretical Model and Algorithm
Since we are interested in using fluorescence for volume normalization, in this
section we first briefly review a new algorithm Goodisman and Chaiken developed to
include turbidity changes simultaneously with fluorescence changes in order to
consistently estimate plasma and RBC volumes. As we do we mention engineering issues
which are now important to consider. As briefly introduced in Section 3.1.2, probing
tissue with NIR radiation simultaneously produces IE plus EE that noninvasively give
chemical and physical information about the materials and objects within. Therefore, it is
reasonable to presume that EE and IE represent two independent observations that can be

99
used to obtain the volume fractions of two independent phases: the plasma and the RBCs.
Having these two quantities is equivalent to having the Hct and the total blood volume, as
shown in Equation 3-1and Equation 3-2 with ϕ being the volume fraction of each phase.
r
r p
Hct
Equation 3-1
Total Blood Volume r p Equation 3-2
Goodiman and Chaiken proposed a model (10) for the propagation and scattering of
radiation through skin based on radiative transfer equation (RTE) that includes the
attenuation of incoming radiation by scattering and absorption, the scattering of the
radiation from all tissues, and the propagation of scattered radiation from scattering
centers to the detector. As shown in Table 3-2, the model divides the structure of skin
into three layers: a relatively thin (100 µm), static, bloodless, and nonviable outer layer a,
covering a somewhat thicker (200 µm) relatively blood-rich layer b that is bounded from
below by dermis, a less blood-rich layer c whose depth is essentially infinite. Of course,
in reality the thicknesses of all the layers vary across all test subjects. But what is critical
here is the ability to reach the 200 µm thick layer b which is a contiguous volume
containing the perfused viable epidermis.

100
Table 3-2: Assumed volume fractions of the three phases in the three layers based on
estimates (41, 42) of average capillary density, dimensions and an Hct of 0.10 for the
blood in the most vascularized layer b.
Phase Layer a Layer b Layer c
r = RBCs 0.00 0.0040 0.00067
p = plasma 0.00 0.0360 0.00600
t = static tissue 1.00 0.9600 0.99333
In vivo, any volume of tissue naturally experiences spatial and temporal fluctuations
of blood plasma and RBCs content. Assuming there is no void volume in viable tissue, or
that void volume is constant. Then, this could be summarized in Equation 3-3 and
Equation 3-4.
1 r p s Equation 3-3
0 r p sd d d Equation 3-4
Chaiken and Goodisman have also proposed an algorithm (80) for calculating these
volume fractions based on their theoretical RTE-based model. Using literature absorption
and scattering coefficients as shown in Table 3-1, the RTE calculated contribution of IE
and EE from the three phases vary linearly with the various volume fractions of plasma
(ϕp) and RBCs (ϕr). This linear relation enables the prediction of two unknowns, i.e., ϕp
and ϕr, from the two known quantities, i.e., EE and IE, using Equation 3-5 and Equation
3-6.
r
0 0
EE IEa b c
EE IE
Equation 3-5

101
0 0
p
EE IEd e f
EE IE
Equation 3-6
In these equations IE0 and EE0 represent the average IE and EE for a specific test
subject and real time measured IE and EE will be fed into the model. Hct is then
calculated using Equation 3-1.
3.3.2 In Vivo Calibrations
There are six parameters a–f for which numerical values must be obtained by using
constraints based on empirical data or assumptions. First, consistent with Jacques (88)
and our own geometrical approach for very well-perfused skin, it is reasonable to assume
that ϕr = 0.004 and ϕp = 0.036 on average and that EEave = EE0 and IEave = IE0. A cursory
examination of other parameter sets suggests that some flexibility in choosing these
values could be exercised because only deviations from the baseline values, not the
absolute Hct, are the interested values to be monitored. According to Equation 3-5 and
Equation 3-6, this gives two constraints: a + b + c = 0.004 and d + e + f = 0.036.
Additional constraints can be obtained from changes in EE and IE that can be
correlated with known physiology. Normally with each cardiac pulse (97) about 75 ml of
0.45 Hct blood is injected into the arterial side of the 4000 ml total supply. Uniformly
distributed, this would result in a 1.9% transient increase in blood volume, i.e., in both ϕr
and ϕp assuming constant Hct. Thus, it could be assumed that with each pulse ϕr and ϕp
increase by 0.000076 and 0.0006.84, respectively. Meanwhile, the raw spectral data in
Figure 3-3 show −2.08% and +2.63% changes in EE and IE, respectively, with each
cardiac pulse, i.e., systolic EE and IE minus diastolic EE and IE. By taking derivatives of

102
Equation 3-5 and Equation 3-6, the changes of pulse ϕr and ϕp can be expressed using the
two equations below:
r
0 0
EE IEb c
EE IE
Equation 3-7
0 0
p
EE IEe f
EE IE
Equation 3-8
Therefore, the two aforementioned conditions can be inserted into Equation 3-7 and
Equation 3-8 to generate two more constraints on the values of the parameters a–f: b = -
0.00365 + 1.264 c and e = -0.0329 + 1.264 f.
Figure 3-14: IE and EE as functions of time for two different modulation cycles. In one
cycle, the pressure went from low = 60 gf/cm2 to high = 200 gf/cm
2; and in the other,
went the opposite. (A) EE for low to high, (B) EE for high to low, (C) IE for high to low,
and (D) IE for low to high. Trials (A) and (D) were used to provide the calibration.
103
Finally, it has been shown in Chapter 2 that tissue modulation could significantly
redistribute the blood flow. Figure 3-14 shows IE and EE integrals of a test subject whose
fingertip was modulated between 60 and 276 gf/cm2 of pressure. As shown, EE increased
by 3.03% and IE decreased by 9.6%.
In obtaining these results, the maximum applied pressure was three to four times the
normal systolic blood pressure; thus, the amount of blood displaced is roughly three to
four times the amount displaced by a pulse. The changes in ϕr and ϕp are estimated based
on: i) the applicability of the Poiseville–Hagen equation to optimization in the
cardiovascular system (98), and ii) the variation in appearance of tissue-modulated
spectra with varying amounts of modulating pressure (99). Although we probe the
capillaries, they are fed by the superficial dermal plexus, with vessels large enough to
demonstrate well-known microcirculation anomalies (100, 101), i.e., plasma skimming
and the Faraeus and Faraeus–Lindquist effects, associated with nonproportional plasma
and RBC movement. Under greater applied pressure, relatively more plasma is expected
to move than RBCs because the viscosity of plasma is less than that of RBCs.
Under our experimental conditions, we estimate the discharge Hct as 0.075. The
decrease in ϕr is therefore 3×0.019×0.004 = 0.000228 and the decrease in ϕp is
4×0.019×0.036 = 0.002736. This corresponds to three and four times the amount of
RBCs and plasma moved by a single pulse. Again, by putting these volume fraction
changes together with IE and EE changes in Equation 3-7 and Equation 3-8, two more
constraints could be obtained: b = −0.00752 + 3.168 c and e = −0.0903 + 3.168 f.
104
The above examples yield four constraints on the six parameters. The remaining two
parameters could be determined by minimizing the standard deviation of the Hct from the
mean over some time range of measurements when no blood interference is introduced in
any form. This is justified because, normally, Hct is constant under homeostasis (98). The
mean value will be ≈0.1 because the assumed reference values of ϕr and ϕp are 0.004 and
0.036, respectively. Again, it is emphasized that the assumed capillary Hct values are not
important – what matters is the deviation of the calculated ϕr and ϕp from the reference
values.
With no doubt, there are various more approaches involving empirical observations
of IE and EE modulations that are associated with known physiological effects that could
be applied to obtain constraints on the six parameters. Already, the empirical calibration
of the Hct model as described above could apparently lead to very stable results with
sufficient sensitivity. However, it is imported to obtain steady IE0 and EE0. From the
study on in vivo tissue fluorescence in Section 3.2, it is known that photobleaching
introduces artifacts. Therefore, to unambiguously and accurately observe and interpret
effects of blood volume changes, it is important to reach photobleaching equilibrium
before monitoring EE and IE for quantification. Nevertheless, the measurement of
absolute Hct could be limited in accuracy and precision if we cannot account for and
cope with the person to person variation in autofluorescence and photobleaching
characteristics.
105
3.3.3 In Vivo Monitoring of Hct
3.3.3.1 Arm Swings
To utilize and evaluate the algorithm, experiments were performed in which the
homeostatic blood volumes are intentionally perturbed in a manner that may be
comparable to an autonomic response to hemorrhage, e.g., shifts in peripheral body fluids.
Of a number of means for accomplishing such purpose (5), results for a method analog
to “centrifugal loading” was shown in Figure 3-15. Before taking the measurements of
Hct, test subject rotated the arm about the shoulder with the arm, elbow, and fingertips
outstretched so that all joints and long straight members of the circulatory system have a
projection along the centrifugal force direction. If the maneuver was properly executed,
then the test subject could feel tingling in the fingertips after the swinging.
Estimating the rotating arm length as >30 cm and the rotator motion as 120 rpm, we
calculate >4 G applied force using the standard relative centrifugal force equation. For
the results that follow, the loading was continuous for a period of at least 30 sec. Because
G-force induced loss of consciousness (102) is known to occur as a result of transient
application of 2-4 G forces to the human body, 30 sec of continuous motion 4 G force
could be expected to lead to transient minor hemoconcentration in the fingertips or
leakage through the capillary walls, just as centrifuging leads to hemoconcentration in an
Hct tube. And this is what has been observed in Figure 3-15. Several trials of soaking
hand in hot water before making Hct measurement were also performed. The vessel
dilation caused by heating, although does increase the blood volume fraction in the
irradiation zone, is not necessarily to cause significant changes in Hct.
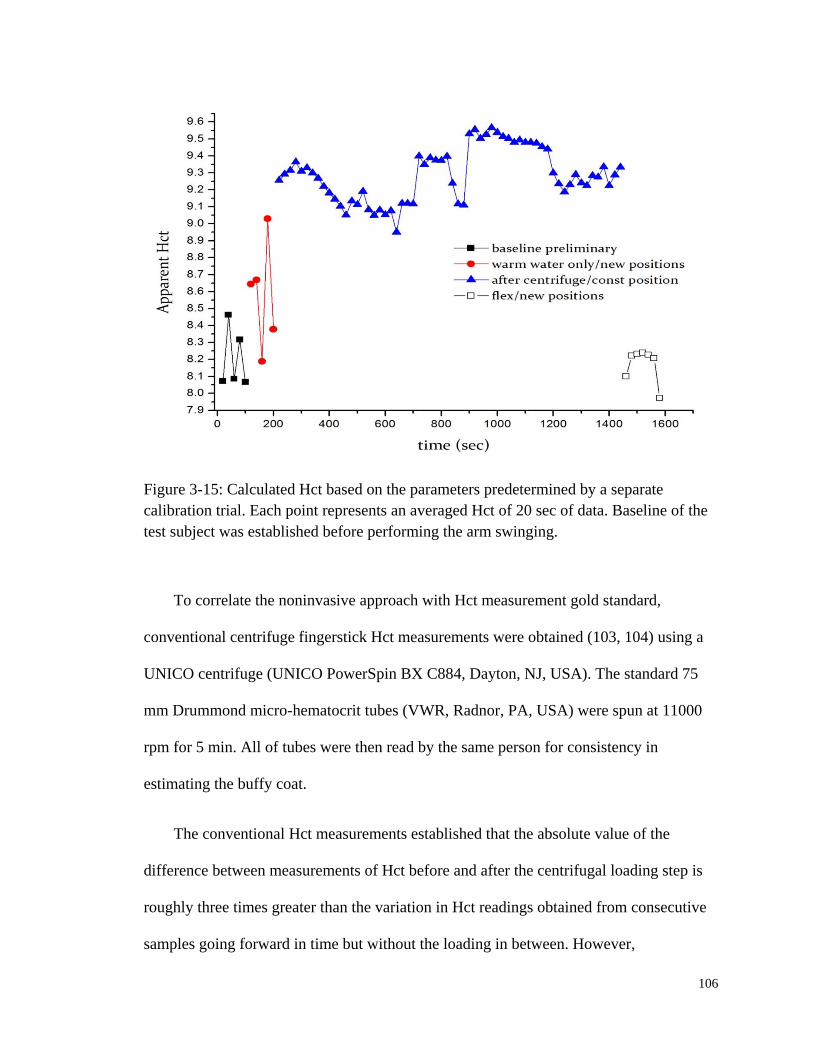
106
Figure 3-15: Calculated Hct based on the parameters predetermined by a separate
calibration trial. Each point represents an averaged Hct of 20 sec of data. Baseline of the
test subject was established before performing the arm swinging.
To correlate the noninvasive approach with Hct measurement gold standard,
conventional centrifuge fingerstick Hct measurements were obtained (103, 104) using a
UNICO centrifuge (UNICO PowerSpin BX C884, Dayton, NJ, USA). The standard 75
mm Drummond micro-hematocrit tubes (VWR, Radnor, PA, USA) were spun at 11000
rpm for 5 min. All of tubes were then read by the same person for consistency in
estimating the buffy coat.
The conventional Hct measurements established that the absolute value of the
difference between measurements of Hct before and after the centrifugal loading step is
roughly three times greater than the variation in Hct readings obtained from consecutive
samples going forward in time but without the loading in between. However,
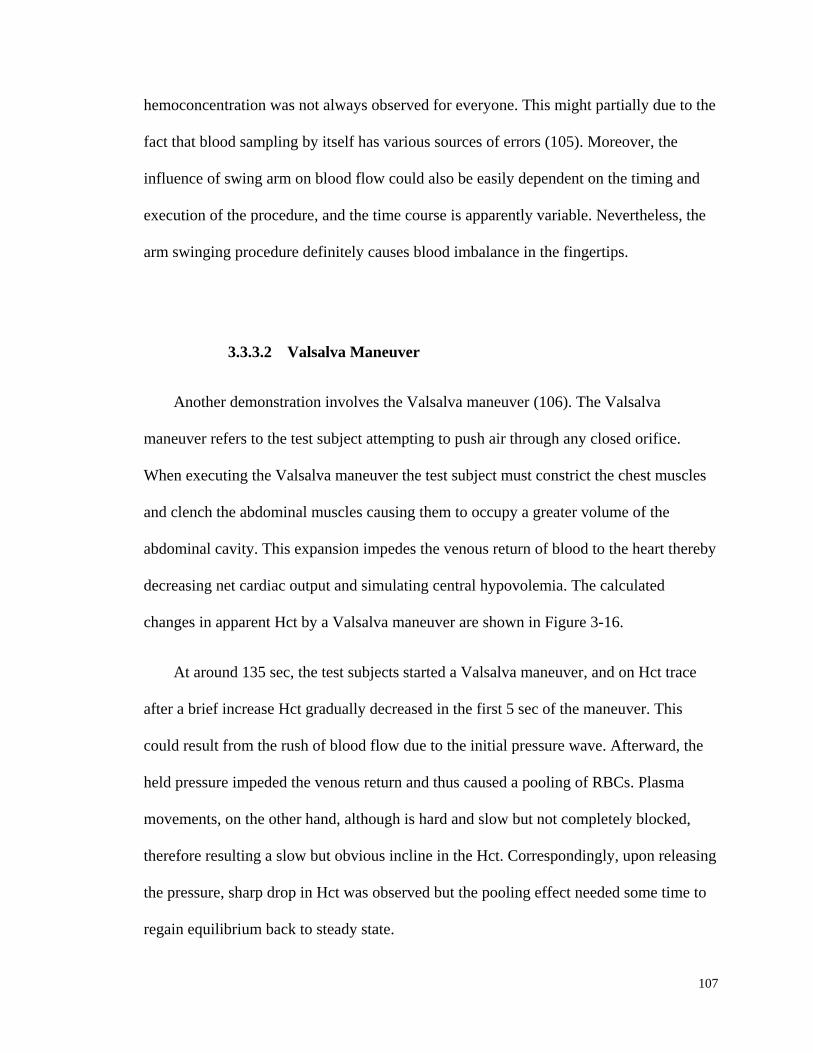
107
hemoconcentration was not always observed for everyone. This might partially due to the
fact that blood sampling by itself has various sources of errors (105). Moreover, the
influence of swing arm on blood flow could also be easily dependent on the timing and
execution of the procedure, and the time course is apparently variable. Nevertheless, the
arm swinging procedure definitely causes blood imbalance in the fingertips.
3.3.3.2 Valsalva Maneuver
Another demonstration involves the Valsalva maneuver (106). The Valsalva
maneuver refers to the test subject attempting to push air through any closed orifice.
When executing the Valsalva maneuver the test subject must constrict the chest muscles
and clench the abdominal muscles causing them to occupy a greater volume of the
abdominal cavity. This expansion impedes the venous return of blood to the heart thereby
decreasing net cardiac output and simulating central hypovolemia. The calculated
changes in apparent Hct by a Valsalva maneuver are shown in Figure 3-16.
At around 135 sec, the test subjects started a Valsalva maneuver, and on Hct trace
after a brief increase Hct gradually decreased in the first 5 sec of the maneuver. This
could result from the rush of blood flow due to the initial pressure wave. Afterward, the
held pressure impeded the venous return and thus caused a pooling of RBCs. Plasma
movements, on the other hand, although is hard and slow but not completely blocked,
therefore resulting a slow but obvious incline in the Hct. Correspondingly, upon releasing
the pressure, sharp drop in Hct was observed but the pooling effect needed some time to
regain equilibrium back to steady state.
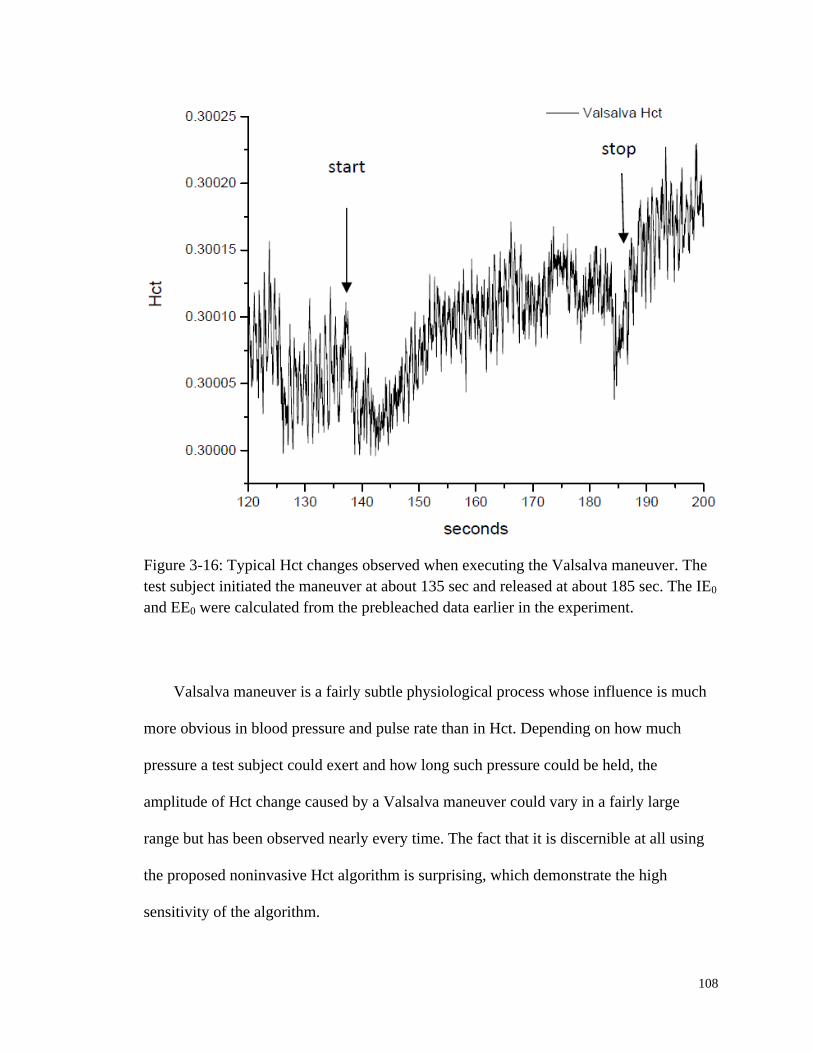
108
Figure 3-16: Typical Hct changes observed when executing the Valsalva maneuver. The
test subject initiated the maneuver at about 135 sec and released at about 185 sec. The IE0
and EE0 were calculated from the prebleached data earlier in the experiment.
Valsalva maneuver is a fairly subtle physiological process whose influence is much
more obvious in blood pressure and pulse rate than in Hct. Depending on how much
pressure a test subject could exert and how long such pressure could be held, the
amplitude of Hct change caused by a Valsalva maneuver could vary in a fairly large
range but has been observed nearly every time. The fact that it is discernible at all using
the proposed noninvasive Hct algorithm is surprising, which demonstrate the high
sensitivity of the algorithm.

109
3.3.3.3 Blood Pressure Cuff
As a final experiment, a manual blood pressure cuff was used as a tourniquet to
induce hemoconcentration for a sufficiently long enough time to make as much Hct
change as possible. After determining the test subject’s BP and pulse rate using an
automatic cuff, IE and EE were collected with no applied tourniquet beyond that needed
to maintain mechanical registration of the tissue with respect to the optical system, in
order to define homeostasis for 60 sec.
Then, the tourniquet brought the pressure to its final planned value within five to
seven cardiac pulses by a single increase in pressure (in several pumps on the manual
bulb), at around 60 sec. The final pressure was chosen to be just above the systolic
pressure in order to insure venous occlusion, which can be confirmed with a stethoscope.
Once complete occlusion was established, it was maintained without modification for 60
sec. Thus, at 120 sec from establishing homeostasis, the tourniquet was released as
quickly as possible. The associated changes in EE and IE can be seen in Figure 3-17.
Both scattering intensities decreases gradually after the tourniquet is applied and
rebounded quickly to their original values when the tourniquet is released. The decrease
is ≈10% for EE and ≈20% for IE.
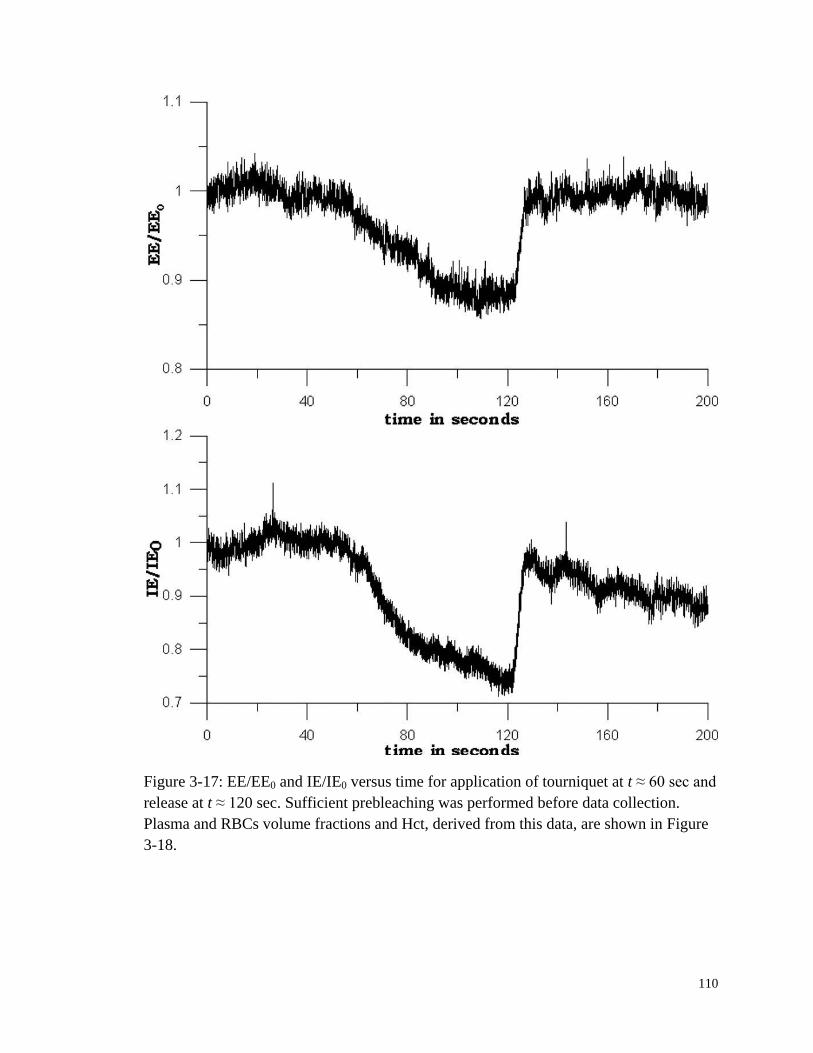
110
Figure 3-17: EE/EE0 and IE/IE0 versus time for application of tourniquet at t ≈ 60 sec and
release at t ≈ 120 sec. Sufficient prebleaching was performed before data collection.
Plasma and RBCs volume fractions and Hct, derived from this data, are shown in Figure
3-18.
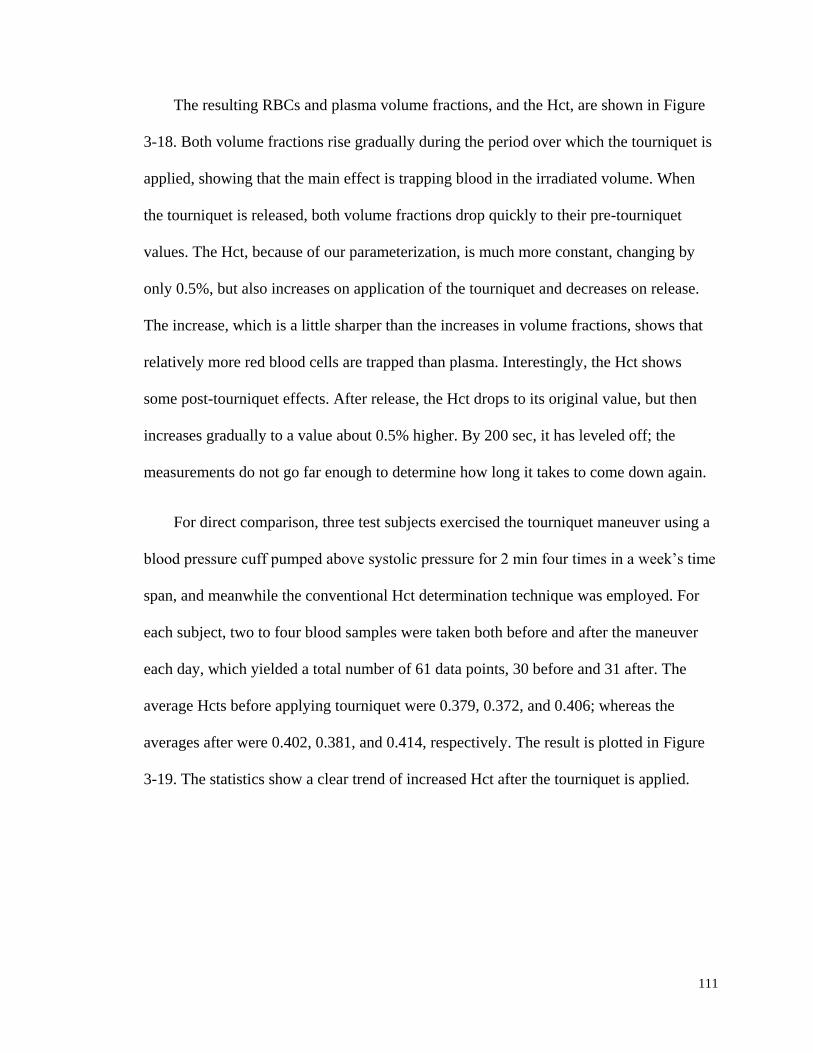
111
The resulting RBCs and plasma volume fractions, and the Hct, are shown in Figure
3-18. Both volume fractions rise gradually during the period over which the tourniquet is
applied, showing that the main effect is trapping blood in the irradiated volume. When
the tourniquet is released, both volume fractions drop quickly to their pre-tourniquet
values. The Hct, because of our parameterization, is much more constant, changing by
only 0.5%, but also increases on application of the tourniquet and decreases on release.
The increase, which is a little sharper than the increases in volume fractions, shows that
relatively more red blood cells are trapped than plasma. Interestingly, the Hct shows
some post-tourniquet effects. After release, the Hct drops to its original value, but then
increases gradually to a value about 0.5% higher. By 200 sec, it has leveled off; the
measurements do not go far enough to determine how long it takes to come down again.
For direct comparison, three test subjects exercised the tourniquet maneuver using a
blood pressure cuff pumped above systolic pressure for 2 min four times in a week’s time
span, and meanwhile the conventional Hct determination technique was employed. For
each subject, two to four blood samples were taken both before and after the maneuver
each day, which yielded a total number of 61 data points, 30 before and 31 after. The
average Hcts before applying tourniquet were 0.379, 0.372, and 0.406; whereas the
averages after were 0.402, 0.381, and 0.414, respectively. The result is plotted in Figure
3-19. The statistics show a clear trend of increased Hct after the tourniquet is applied.

112
Figure 3-18: Volume fractions and Hct calculated from the data of Figure 3-17. Both
calculated volume fractions increase gradually when the tourniquet is applied and drop
quickly to their initial values when it is released. The Hct follows roughly the same
pattern, but shows some residual effects after tourniquet release.
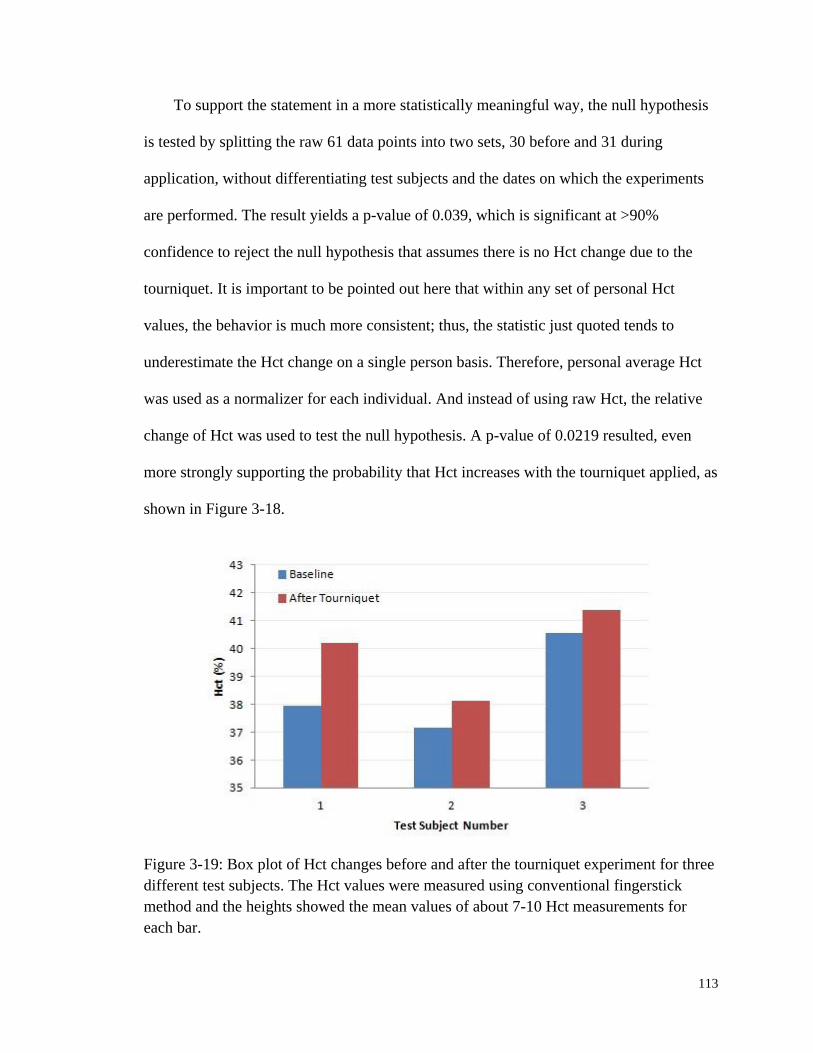
113
To support the statement in a more statistically meaningful way, the null hypothesis
is tested by splitting the raw 61 data points into two sets, 30 before and 31 during
application, without differentiating test subjects and the dates on which the experiments
are performed. The result yields a p-value of 0.039, which is significant at >90%
confidence to reject the null hypothesis that assumes there is no Hct change due to the
tourniquet. It is important to be pointed out here that within any set of personal Hct
values, the behavior is much more consistent; thus, the statistic just quoted tends to
underestimate the Hct change on a single person basis. Therefore, personal average Hct
was used as a normalizer for each individual. And instead of using raw Hct, the relative
change of Hct was used to test the null hypothesis. A p-value of 0.0219 resulted, even
more strongly supporting the probability that Hct increases with the tourniquet applied, as
shown in Figure 3-18.
Figure 3-19: Box plot of Hct changes before and after the tourniquet experiment for three
different test subjects. The Hct values were measured using conventional fingerstick
method and the heights showed the mean values of about 7-10 Hct measurements for
each bar.

114
3.3.4 Summary
Measuring the IE and EE simultaneously and applying the algorithm leads to a
sensitive probe for volume changes of both RBC and plasma. Obviously, a number of
approximations have been made to demonstrate calculation of volume fractions and Hct
from EE and IE. The first assumption is the Hct of layer b in the model. As might have
been noticed, the absolute Hct number assumption has been changed to generate different
a-f parameters. In the deduction of the algorithm and arm swinging experiment, an Hct of
0.1 was assumed; while in the Valsalva and tourniquet experiments 0.3 was assumed.
Nevertheless, in both cases meaningful Hct change predictions could still be produced.
Since the immediate goal is to monitor changes in Hct over a long time period. Thus, the
particular value assumed for the Hct is not very important.
What is essentially required in this model for the algorithm to work as designed is
for all three phases to remit detectable fluorescence at different rates per unit volume.
When the fluorescence per unit volume of any phase changes during a monitoring period,
as when photobleaching that has been elaborated in Section 3.2 occurs, or if the
parameters are not well chosen to properly balance the contributions from the different
phases to each type of remission, the algorithm can produce inaccurate results. Therefore,
unless we can quantitatively account for or otherwise cope with the effects of
autofluorescence and photobleaching, absolute calibration of this technique across
patients may not be possible. Nevertheless, Leypoldt et al. (99) have demonstrated
potentially useful clinical information having the capability to monitor relative variation
from homeostasis of Hct and fluid volumes.

115
Lastly but importantly, the same set of parameters a-f produces from a single
calibration has been used for different test subjects in different days to produce Hct
predictions as shown in Figure 3-16 and Figure 3-18. Although not shown in the graph,
Hct results of similar experiments have show surprisingly identical qualitative responses
for any number of different test subjects spanning a wide variety of skin tones and
textures. It indicates that it may be possible to empirically calibrate the LighTouchTM
device once and still produce quantitatively accurate Hct changes across various subjects
for a longer period of time, e.g., a month.
3.4 Conclusions
This chapter begins to tackle the empirical photophysical and photochemical
properties of human skin autofluorescence, which are of pivotal importance to the
implementation of volume normalization as proposed for the noninvasive in vivo human
blood glucose measurement. The quenching of IE is laser induced photobleaching, the
majority of which comes from the static tissue, not blood components. Nevertheless,
blood fluorescence from RBCs and plasma under 830 nm excitation is of similar order of
magnitude as that from static tissue, therefore optical pulses are always discernible. The
in vivo observed photobleaching is a process that starts with a relatively quicker
bleaching and follows a slower decay that could extend to hundreds of seconds. Once
bleached, the tissue does not readily recover within 100-10
1 min. Therefore, a
prebleaching process may allow for more effective use of fluorescence for in vivo data
normalization.

116
The potential of utilizing combined IE and EE to noninvasively monitor Hct change
is also introduced. Assuming constant blood perfusion, increase of Hct will cause an
increase in IE and decrease in EE. However, as shown in Figure 3-17, this
complementary IE and EE feature is no longer true when interference of blood perfusion
and flow is introduced intentionally to an extreme level that exceeds the normal range of
pressure that is typically applied by the PDPM. The empirical calibration of the Hct
algorithm built based on RTE could monitor the Hct deviations reasonably well with high
sensitivity that enables the observation of Hct changes due to Valsalva maneuver. It
might be equally important that the algorithm also produces the plasma and RBCs
volume. Notwithstanding the problems associated with autofluorescence photobleaching
in producing absolute measurements, these two quantities could be used in glucose
prediction as a better turbidity corrected volume normalizer.
117
4. IN VITRO STUDY OF ENDOGENOUS
FLUOROPHORES
4.1 Motivation
Chapter 3 has shown that transdermal in vivo spectroscopic analysis or imaging of
tissue analysis involving NIR excitation always produces some broadband NIR
fluorescence. Depending on what spectroscopy is being employed, such fluorescence
background can degrade SNR and dynamic range. Well known to originate from blood
and various other endogenous materials associated with the static tissue, such NIR
fluorescence of biological tissue is frequently mentioned as “autofluorescence” (107).
The propagation of NIR light in tissue in vivo can be described reasonably well and in
detail (10, 62, 108), nevertheless the production of fluorescence is much less so easily
explained and little investigation is reported in the literature to clarify the exact origins
and distribution of all of the NIR fluorophores in detail. The sources and characteristics
of such NIR fluorescence are important to us because as stated in Chapter 3 fluorescence
was proposed as a measure of the probed volume in the earlier work (46, 54, 81) for our
long-term project of noninvasive glucose monitoring.
From a chemical substance point of view, a significant amount of fluorescence might
be associated with the two biggest absorbers and scatterers in skin, i.e., Hb and melanin
(14, 57). In addition, substantial fluorescence is ubiquitously observed for all tissues,
therefore commonly existed proteins such as albumin and elastin are also suspected to
118
produce noticeable fluorescence. Advanced glycation endproducts (AGEs) which are the
products of a chain of chemical reactions initiated with the Maillard reaction have long
been found to fluorescence under UV/Vis excitation (109). Most importantly, AGEs level
has been shown (110, 111) to correlate with UV/Vis fluorescence but no work has been
done to extend the knowledge to the NIR. Therefore, it is also worthwhile to investigate
AGEs fluorescence properties in NIR. This topic will be elaborated separately later in
Chapter 5 due to the intriguing mechanism involved.
In fact there are probably a number of minor contributors, porphyrins and non-
porphyrin, and this makes a complete description of the net fluorescence more difficult.
From the experimental side, one difficulty in attempting to associate a specific amount of
fluorescence with a particular volume of tissue in vivo is that the sample is perfused and
so cannot be studied in the absence of blood, the single largest contributor to the net
fluorescence on a per unit volume basis. Therefore, although it is unlikely to settle all
relevant issues in this study, recent work directed at clarifying the origin and nature of
such fluorescence will be presented.
4.2 Experimental
4.2.1 Methodology of the Study
From the previous chapter, it is learned that volar side human fingertips fluoresce
copiously under NIR excitation. Not only that, but such fluorescence also gets quenched
about 10-15% within 101-10
2 sec with 200 mW 830 nm laser irradiation. The
photobleaching is not a quick process but it could finally reach a relatively steady state.
119
Once bleached, no recovery is observed up to 45 min. However, repeating the same in
vivo experiment next day on the same test subject showed no sign of revisiting the
bleached spot from any previous experiment. It is suggested that either the bleached
species could partially recover slowly or it could be cleared from the probed volume and
replenished through routine metabolic processes.
Trying to categorize the potential endogenous contributors and associate them with
the observed NIR fluorescence, the in vitro study is guided by the aforementioned
characteristics of in vivo human tissue fluorescence and carried out in the sequence as
shown in Figure 4-1. First of all, for every compound under investigation the first thing to
check is whether it fluoresces or not under NIR CW diode laser excitation. As shown
later in Section 4.2.3.1, the concentrations used were relevant to their physiological levels
although most of the species only have limited quantity in skin or blood. However, it is
fundamentally the absorption ability and fluorescence quantum yield that determine and
characterize the fluorescence activity per molecule. If these are zero or very small then
the relevant concentration is almost always too small to make that fluorophore
responsible for much in vivo emission. Therefore, experiments with much higher than
physiological concentrations were also carried out to determine whether there was even
weak fluorescence or not.
For those species that fluoresce, experiments were further performed to characterize
their photobleaching properties. To do that, samples were exposed to 450 mW 785 nm
irradiation for tens of minutes while continuous spectra were collected. Without
repositioning, samples were left in complete darkness for up to 24 hours and revisited to
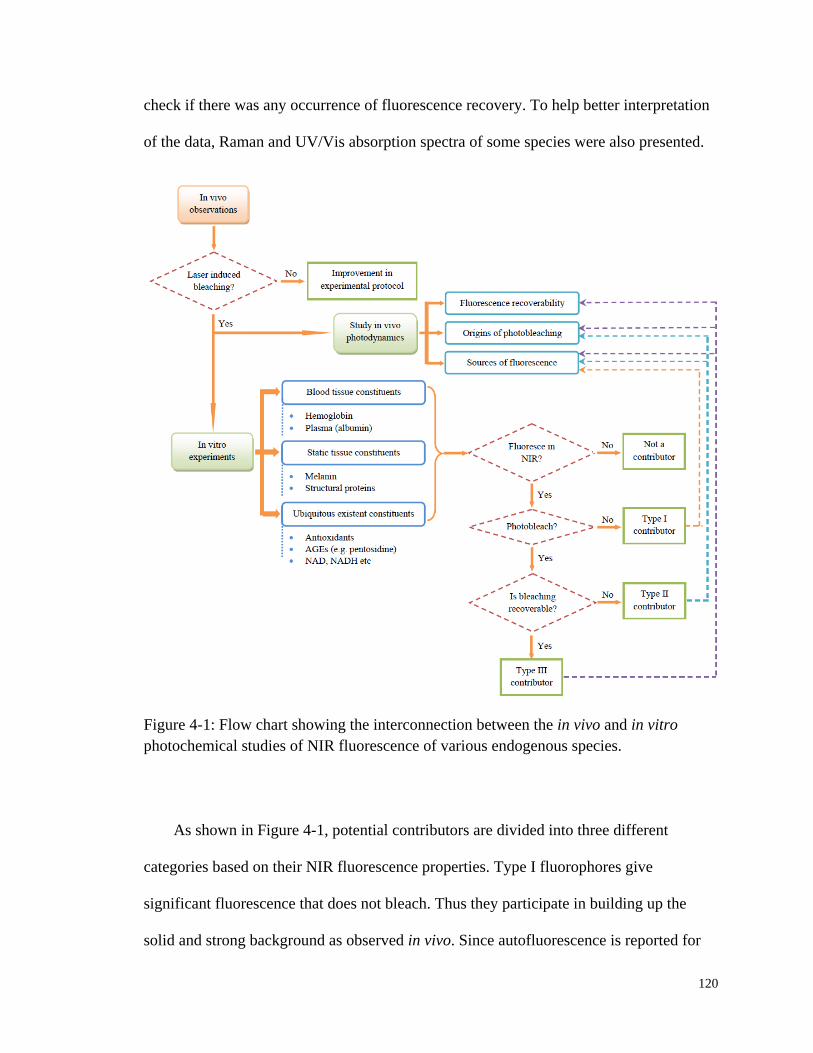
120
check if there was any occurrence of fluorescence recovery. To help better interpretation
of the data, Raman and UV/Vis absorption spectra of some species were also presented.
Figure 4-1: Flow chart showing the interconnection between the in vivo and in vitro
photochemical studies of NIR fluorescence of various endogenous species.
As shown in Figure 4-1, potential contributors are divided into three different
categories based on their NIR fluorescence properties. Type I fluorophores give
significant fluorescence that does not bleach. Thus they participate in building up the
solid and strong background as observed in vivo. Since autofluorescence is reported for
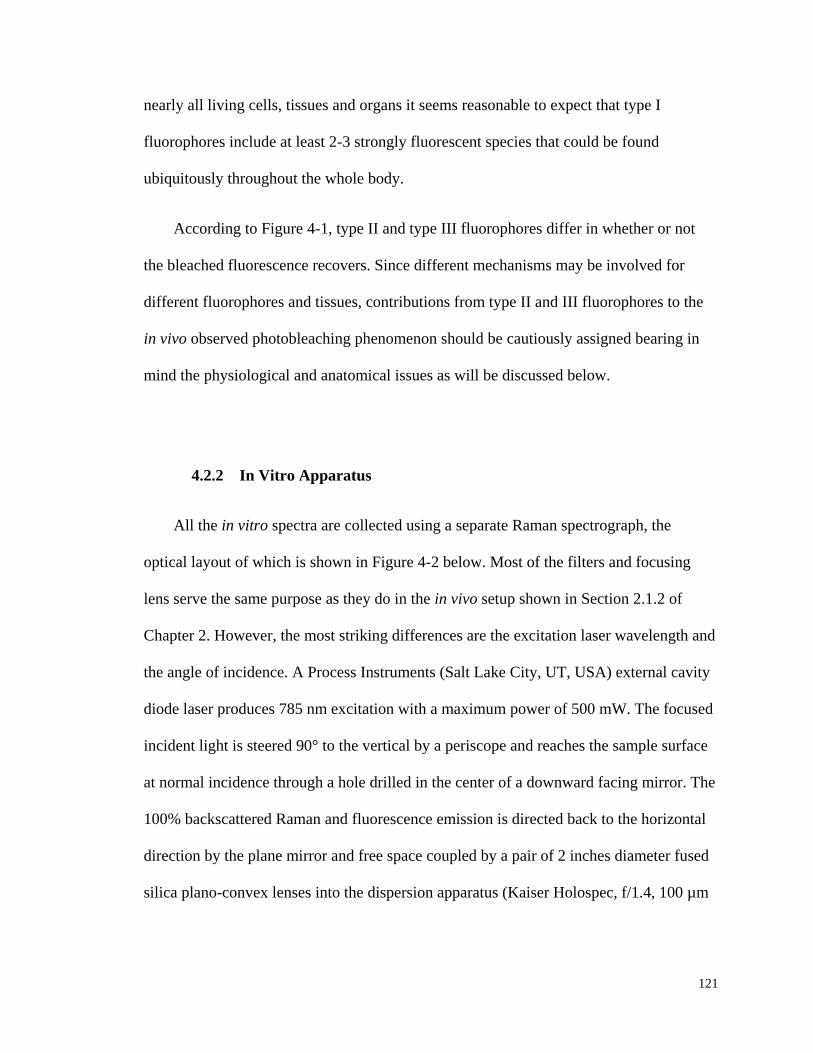
121
nearly all living cells, tissues and organs it seems reasonable to expect that type I
fluorophores include at least 2-3 strongly fluorescent species that could be found
ubiquitously throughout the whole body.
According to Figure 4-1, type II and type III fluorophores differ in whether or not
the bleached fluorescence recovers. Since different mechanisms may be involved for
different fluorophores and tissues, contributions from type II and III fluorophores to the
in vivo observed photobleaching phenomenon should be cautiously assigned bearing in
mind the physiological and anatomical issues as will be discussed below.
4.2.2 In Vitro Apparatus
All the in vitro spectra are collected using a separate Raman spectrograph, the
optical layout of which is shown in Figure 4-2 below. Most of the filters and focusing
lens serve the same purpose as they do in the in vivo setup shown in Section 2.1.2 of
Chapter 2. However, the most striking differences are the excitation laser wavelength and
the angle of incidence. A Process Instruments (Salt Lake City, UT, USA) external cavity
diode laser produces 785 nm excitation with a maximum power of 500 mW. The focused
incident light is steered 90° to the vertical by a periscope and reaches the sample surface
at normal incidence through a hole drilled in the center of a downward facing mirror. The
100% backscattered Raman and fluorescence emission is directed back to the horizontal
direction by the plane mirror and free space coupled by a pair of 2 inches diameter fused
silica plano-convex lenses into the dispersion apparatus (Kaiser Holospec, f/1.4, 100 µm
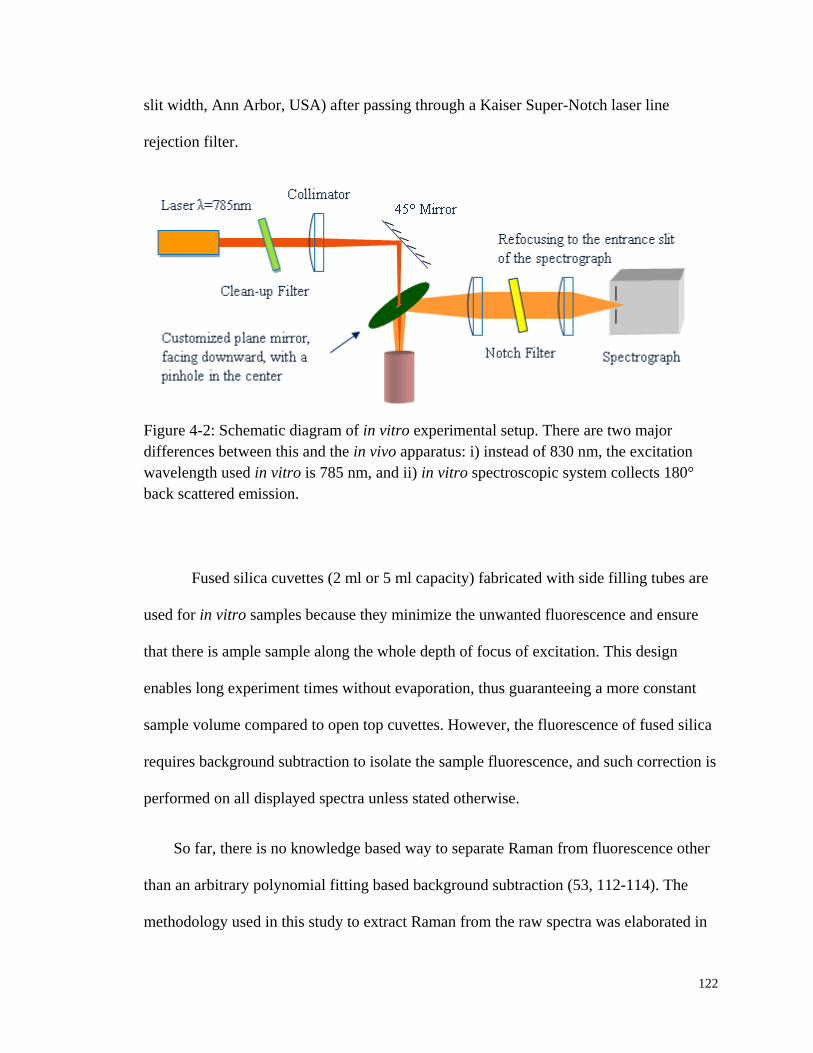
122
slit width, Ann Arbor, USA) after passing through a Kaiser Super-Notch laser line
rejection filter.
Figure 4-2: Schematic diagram of in vitro experimental setup. There are two major
differences between this and the in vivo apparatus: i) instead of 830 nm, the excitation
wavelength used in vitro is 785 nm, and ii) in vitro spectroscopic system collects 180°
back scattered emission.
Fused silica cuvettes (2 ml or 5 ml capacity) fabricated with side filling tubes are
used for in vitro samples because they minimize the unwanted fluorescence and ensure
that there is ample sample along the whole depth of focus of excitation. This design
enables long experiment times without evaporation, thus guaranteeing a more constant
sample volume compared to open top cuvettes. However, the fluorescence of fused silica
requires background subtraction to isolate the sample fluorescence, and such correction is
performed on all displayed spectra unless stated otherwise.
So far, there is no knowledge based way to separate Raman from fluorescence other
than an arbitrary polynomial fitting based background subtraction (53, 112-114). The
methodology used in this study to extract Raman from the raw spectra was elaborated in

123
multiple previous publications (54, 113). Simply put, a 101-point adjacent average
smoothing is performed on the background corrected raw spectrum which, based on
known electronic spectroscopy and the condensed phase nature of our spectra, is
dominated by fluorescence. Thus the wide window smoothed spectrum helps to establish
the broadband fluorescence features. This smoothed spectrum is then subtracted from the
raw and another narrower window 7-point adjacent average smoothing is applied to get
the final spectrum shown in this thesis.
But in this study we do not concern ourselves with the Raman contribution to the
fluorescence since by exciting with 785 nm light the amount of fluorescence produced
relative to Raman is at least 6-7 times greater and even greater compared to that produced
using e.g. 830 nm. Thus, photon counts in the Raman shift range of 400-1900 cm-1
,
including undifferentiated Raman and fluorescence emissions, are integrated as one
fluorescence data point.
Also notice that instrument function should be applied to harvested spectra for the
purpose of comparing features like Raman peak sizes or ratios collected on different
apparatus. However, in our application we pay attention only to broad band fluorescence,
and mostly the relative change of fluorescence. Therefore, no attempt is tried or needed to
implement the instrument function correction.
124
4.2.3 Materials and Sample Preparation
4.2.3.1 List of Materials
The specific materials chosen for study in vitro are certainly not expected to account
for all possible sources of in vivo fluorescence. Fluorescence is very easily detected.
Since a very tiny amount of fluorophore could have a strong emission and there are a
multitude of potential in vivo sources, there will always be some doubt that all sources in
vivo have been identified. The ultimate goal is to account for the majority of the total
fluorescence on a volume basis and a process of elimination has been started to approach
that goal. Certain specific materials chosen were intended to either i) sample classes of
materials that are commonly found in vivo, ii) account for materials that occupy a
significant volume of all tissues or iii) could contain chromophores with specific activity
in the production of NIR emission. Thus protein is ubiquitous both as structural materials,
e.g., collagen fibers in the extracellular matrix, and active molecular species in all tissues,
e.g., enzymes and transport proteins like albumin.
Table 4-1 lists the cutaneous and subcutaneous constituents of human skin and blood
tissue that are investigated. To get relevant result as reference for interpreting in vivo
observed human skin autofluorescence, physiological concentration of each constituent
was obtained (42). Yet, for those compounds that are found widely spread within the
whole body, such as antioxidants, coenzymes, and collagen, the physiological
concentrations refer to their levels in blood, interstitial fluid or in skin only. Some
compounds, e.g., melanin, fat-soluble β-carotene and α-tocopherol, are poorly soluble in
water as they are probably membrane bound or found in adipose tissues in vivo. In these

125
cases, stock solutions were made without knowing the exact concentrations. Various
dilutions however were made to offer a relative comparison of the absorption and
fluorescence capability. In this table, ×5 means five times of the physiological
concentration. Similarly, /2 means half the physiological or stock solution concentration.
Table 4-1: In vitro investigation of fluorescence and photobleaching properties of some
cutaneous and subcutaneous constituents of human skin tissue.
NAME SOLVENT
CONCENTRATION SOURCE
EXP. PHYSIOL. MFR CAT. #
L-Glutathione DI water ×5, ×125 ≈1.09 mM Sigma-Aldrich G4251
Uric Acid DI water ×2, stock 234-456 µM Aldrich 16,118-7
β-Carotene Cyclohexane Stock, /2, /4, /25 1.23-1.75 µM Sigma C9750
Cholecalciferol Cyclohexane ×5, ×125,
×3125, ×78125 40-80 nM Sigma C9756
L-Ascorbic
acid DI water ×5, ×125, ×3125 50-60 µM Sigma A5960
(±)-α-
Tocopherol Cyclohexane Stock, /4, /25 ≈24 µM Sigma T3251
Collagen DI water 0.5-7.5 g/dL N/A Aldrich 27,160-8
Melanin DI water Stock, /2, /4 Various Sigma M8631
NAD/NADH PBS ×10, ×50, ×100,
×500, ×1000 64 µM Sigma N3014
Hb DI water 1.3-14.5 g/dL 12-17 g/dL Freshly harvested
Plasma PBS Stock, /2, /3, /4 N/A Freshly harvested
126
4.2.3.2 Antioxidants & Coenzymes
Water soluble materials, e.g., L-glutathione (reduced), L-ascorbic acid and
nicotinamide adenine dinucleotiede (NAD/NADH), were readily dissolved either in de-
ionized (DI) water or phosphate buffered saline (PBS) with pH adjusted in physiological
level of 7.4 (44). The solubility of uric acid is dependent on both pH and temperature
(115). At room temp (25°C) neutral pH it only dissolves around 68 mg/L, which is about
404 µM. In order to prepare higher concentrated samples, pH of uric acid solution was
adjusted to a little bit alkaline (pH=8). Stable solution with two times the upper
physiological level could be obtained. More crystalline uric acid was added to form a
stock of an even higher concentration. However, the absolute amount dissolved was not
known.
For those that are not or are only barely soluble in water, such as β-carotene,
cholecalciferol, and (±)-α-tocopherol, cyclohexane was used as the solvent because of its
fairly flat baseline other than the six well-defined Raman peaks spanning the range of
interest (116). Evidence of fluorescence growth could still be quite discernible even with
the interference of cyclohexane Raman features. The nature of the study is for internal
comparisons of fluorescence coming from one particular sample itself at various
concentrations or under certain time of laser exposure. Therefore, constant Raman
features from the solvent system will not bias the results in such a substantial way that
would lead to misleading interpretation.
127
4.2.3.3 Collagen
Commercial product of gelatin produced from porcine skin was used. Though not a
pure form of collagen, gelatin is 98-99% protein by dry weight extracted by boiling swine
skin, tendons, ligaments and bones in water. The transparent, colorless solid substance
dissolves in water when heated and gels when cooled down. In this study, 0.5 g of gelatin
was dissolved in 10 mL DI water. The sample was contained in a cylindrical plastic cup
and put onto a water-containing glass Petri dish. An electric heater was used to offer a
warm “water bath” for the gelatin samples for 10 min. Then the samples were let cool in
room temperature for another 2 min. During this process, the sample was frequently
stirred to let the air bubbles release. It was then refrigerated for around 1 hr before the
formed gel was taken out for tests.
4.2.3.4 Melanin
Synthetic melanin is purchased from Sigma-Aldrich. This skin pigment and photo-
protector is isolated in the form of a biopolymer that does not easily dissolve in water and
other commonly used organic solvents. Therefore, an excess amount of melanin was
placed in DI water, stirred well and left overnight for maximal stock solution
concentration. The stock solution produced has light brown color with black particles
suspending throughout. Further filtration with various pore sizes filters, 20 nm, 100 nm or
200 nm (inorganic membrane syringe filters, Whatman Ltd., UK), was performed to
avoid accumulating additional particles apparently by precipitating from unfiltered
sample over a long experimental period.

128
As shown in Figure 4-3(A), raw spectra for filtered samples show significantly less
fluorescence than the unfiltered one, apparently associated with the successful removal of
larger aggregates. The sample without filtration shows broadband melanin Raman
features at 1380 and 1580 cm-1
, the similar bands observed in vivo of cutaneous melanin
(117). The Raman of filtered samples (Figure 4-3(B)) resemble with each other and both
show less melanin Raman, indicating the dissolved melanin might have less degree of
polymerization than that in vivo. Since the radius of melanin granules in vivo is estimated
to be 40-50 nm (118) we used 100 nm or 200 nm filtration to preserve as much soluble
melanin as possible.
Figure 4-3: Raw (A, left) and normalized Raman (B, right) spectra for melanin solutions
with various pore sizes of filtration.

129
4.2.3.5 Blood components
The blood sample was extracted from a healthy volunteer into a sodium heparin
Vacutainer®
tube (BD, Franklin Lakes, NJ, USA). The blood was centrifuged (3500 rpm
for 12 min) to form a buffy coat. The supernatant plasma was removed and because it
was not completely homogeneous, i.e., there were proteins and other materials that did
not dissolve, a certain amount of glucose was intentionally added into it so that the stock
plasma sample had a measurable glucose concentration (0-444 mg/dL) using HemoCue
D-glucose meter (HemoCue Inc., Lake Forest, CA, USA). Using this as an internal
reference provided dilution information for later sample preparation. Several drops of
normal saline solution were then added into the remaining RBCs to wash off any lipid or
proteins. Finally, Hb was released by adding DI water directly into hematocrit and Hb
concentrations were measured by HemoCue Hb meter for different dilutions. Before the
spectra were taken, Hb samples were further processed by passing through a 450 nm
glass fiber low protein binding Durapore ®
(PVDF) membrane syringe filter (Millex,
Millipore Corporation, Billerica, MA, USA) to remove any cell debris which might
introduce additional turbidity into samples.
4.3 Results
4.3.1 Antioxidants & Coenzymes
Raw spectra of all the six antioxidants and the coenzyme NAD are shown in Figure
4-4, Figure 4-5 and Figure 4-6.
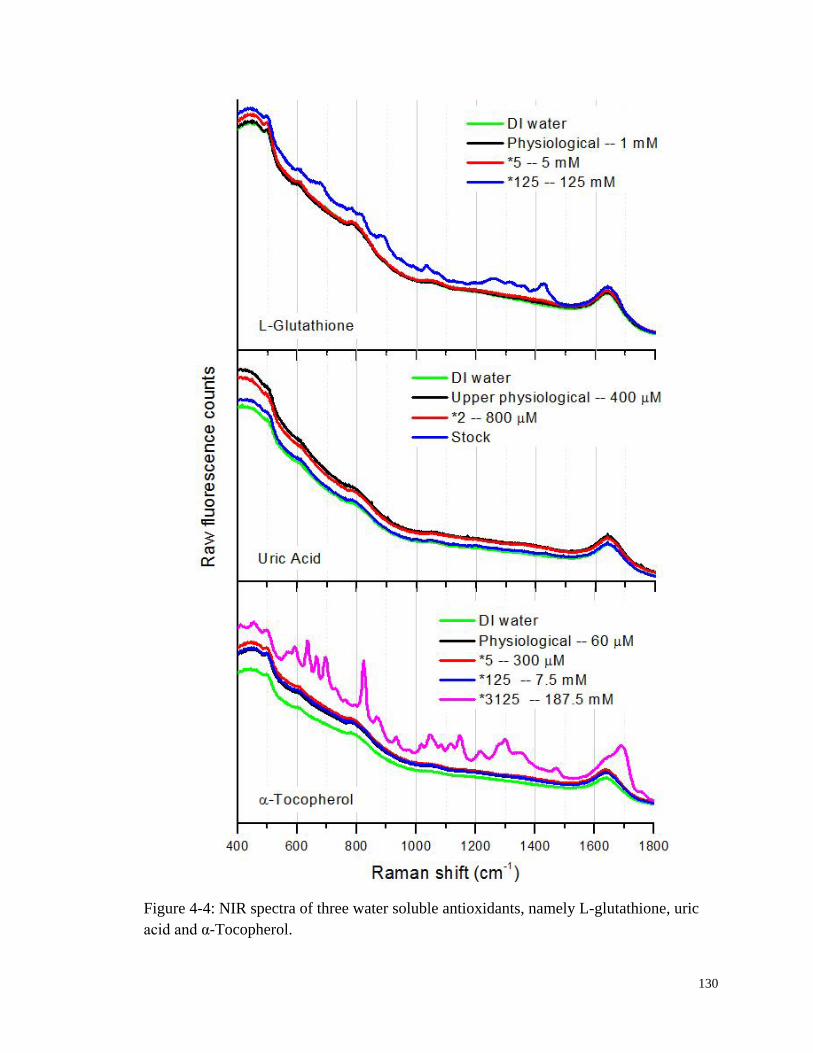
130
Figure 4-4: NIR spectra of three water soluble antioxidants, namely L-glutathione, uric
acid and α-Tocopherol.

131
Figure 4-5: NIR spectra of three antioxidants that do not dissolve in water, namely β-
carotene, cholecalciferol, and (±)-α-tocopherol. Cyclohexane was used as solvent.
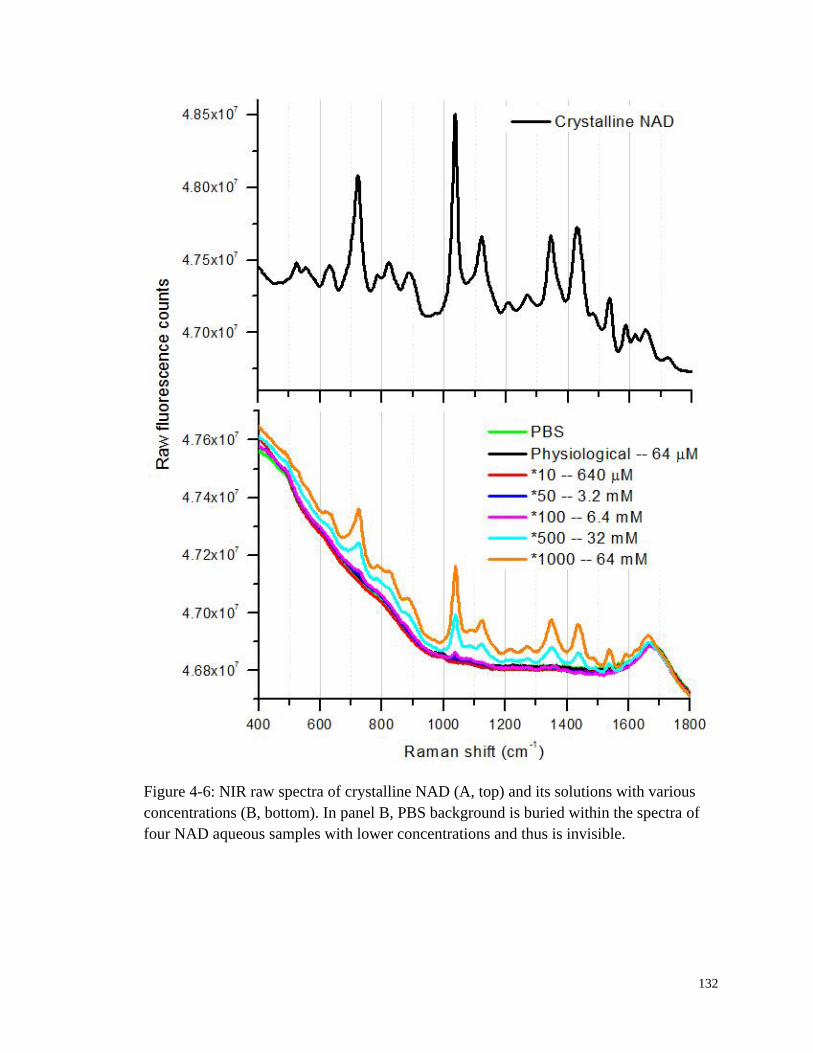
132
Figure 4-6: NIR raw spectra of crystalline NAD (A, top) and its solutions with various
concentrations (B, bottom). In panel B, PBS background is buried within the spectra of
four NAD aqueous samples with lower concentrations and thus is invisible.

133
Except for the samples with the highest concentration which also showed their
corresponding Raman features, others showed no difference from the background.
Considering their low physiological concentrations, these antioxidants and coenzymes
could not contribute to the observed human fingertip autofluorescence under NIR
excitation.
4.3.2 Collagen
Figure 4-7 shows a raw spectrum accumulated over 10 min for gelatin powder. As
shown in the top panel, the broadband fluorescence stretches through the whole spectra
range with Raman features visible on top. This feature is obviously absent from the
aforementioned spectra for the pure form antioxidants and coenzymes in Section 4.3.1.
Not shown in Figure 4-7 top panel is the flat baseline. Due to the dramatically different
amplitudes, such baseline is indistinguishable from the x-axis and thus is left out. The
bottom panel showed the Raman spectra for the same solid gelatin. The strong protein
peaks, i.e., amide I and amide III around 1668 and 1248 cm-1
, are obvious and consistent
with literature (119).
Not surprisingly, the fluorescence shown in Figure 4-7 is also concentration
dependent in jelly form samples. Figure 4-8 shows the fluorescence integral growth with
increasing gelatin concentrations used to prepare ten samples. Although the data has a
noticeably big standard deviation, a linear fit still yield a correlation coefficient of 0.8
with a positive slope.
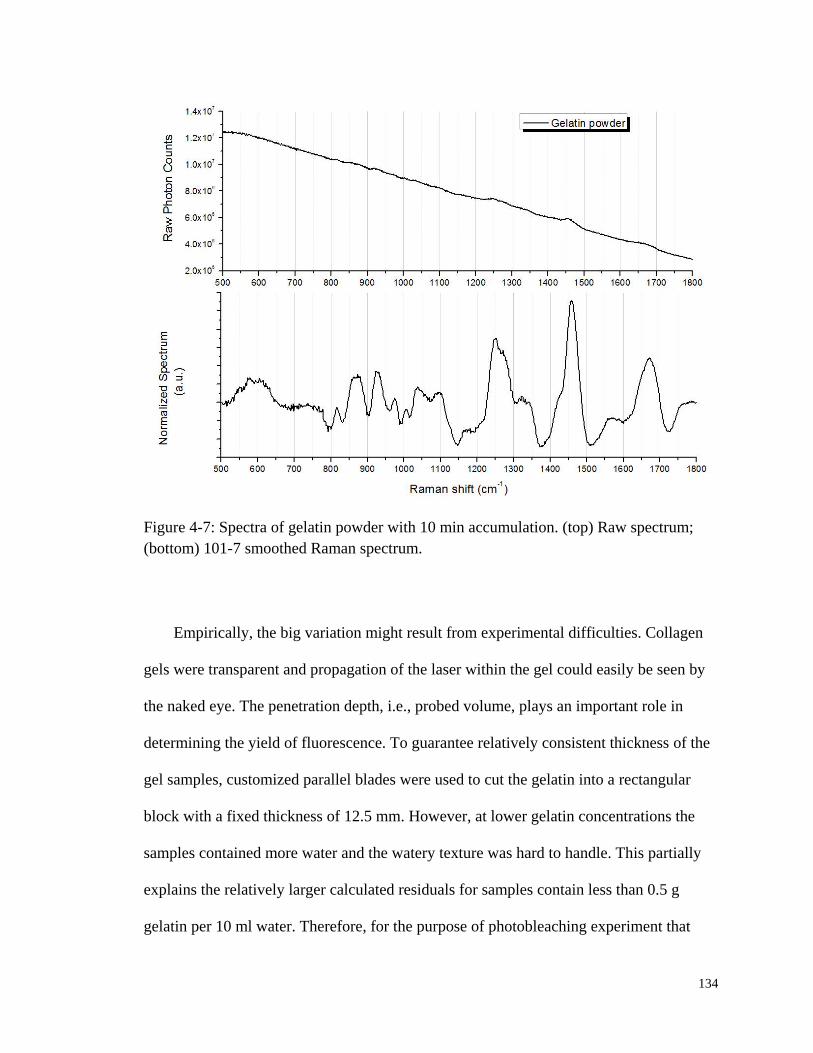
134
Figure 4-7: Spectra of gelatin powder with 10 min accumulation. (top) Raw spectrum;
(bottom) 101-7 smoothed Raman spectrum.
Empirically, the big variation might result from experimental difficulties. Collagen
gels were transparent and propagation of the laser within the gel could easily be seen by
the naked eye. The penetration depth, i.e., probed volume, plays an important role in
determining the yield of fluorescence. To guarantee relatively consistent thickness of the
gel samples, customized parallel blades were used to cut the gelatin into a rectangular
block with a fixed thickness of 12.5 mm. However, at lower gelatin concentrations the
samples contained more water and the watery texture was hard to handle. This partially
explains the relatively larger calculated residuals for samples contain less than 0.5 g
gelatin per 10 ml water. Therefore, for the purpose of photobleaching experiment that

135
will be presented next, samples were prepared to contain 0.5 g gelatin per 10 ml water for
the convenience of handling.
Figure 4-8: Fluorescence integral growth with increasing gelatin concentrations in jelly
form. The gelatin concentrations increased by 0.1 g per 10 mL water. The third sample
was left out as an outlier. Each spectrum was accumulated for 10 min.
Three bleaching curves are shown in Figure 4-9. Sequence 1 got the laser exposure
first and showed a substantial amount (around 8%) of quench in its fluorescence. After 85
min of recovery in complete darkness, although the similar photobleaching pattern was
expected, however, sequence 2 and 3 showed only randomly changing fluorescence
integrals. Other sets of results from similar experiments also could not give definite
answer on whether gelatin, i.e., collagen, fluorescence recovers or not.
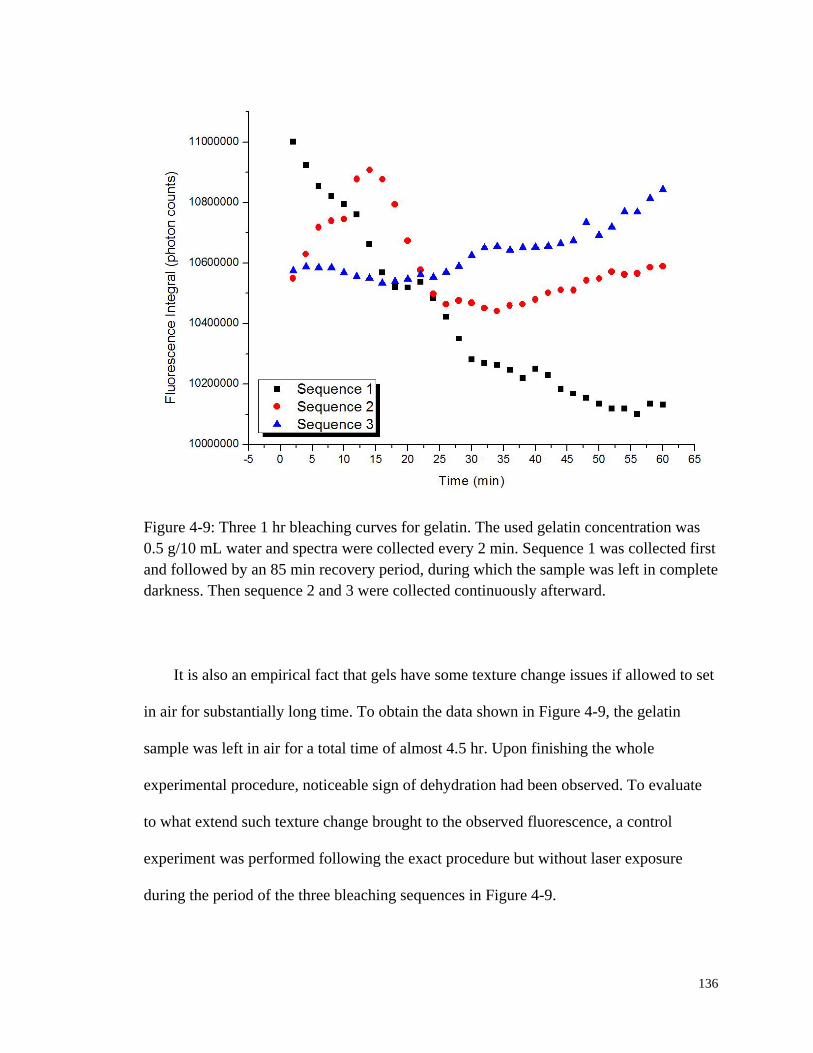
136
Figure 4-9: Three 1 hr bleaching curves for gelatin. The used gelatin concentration was
0.5 g/10 mL water and spectra were collected every 2 min. Sequence 1 was collected first
and followed by an 85 min recovery period, during which the sample was left in complete
darkness. Then sequence 2 and 3 were collected continuously afterward.
It is also an empirical fact that gels have some texture change issues if allowed to set
in air for substantially long time. To obtain the data shown in Figure 4-9, the gelatin
sample was left in air for a total time of almost 4.5 hr. Upon finishing the whole
experimental procedure, noticeable sign of dehydration had been observed. To evaluate
to what extend such texture change brought to the observed fluorescence, a control
experiment was performed following the exact procedure but without laser exposure
during the period of the three bleaching sequences in Figure 4-9.
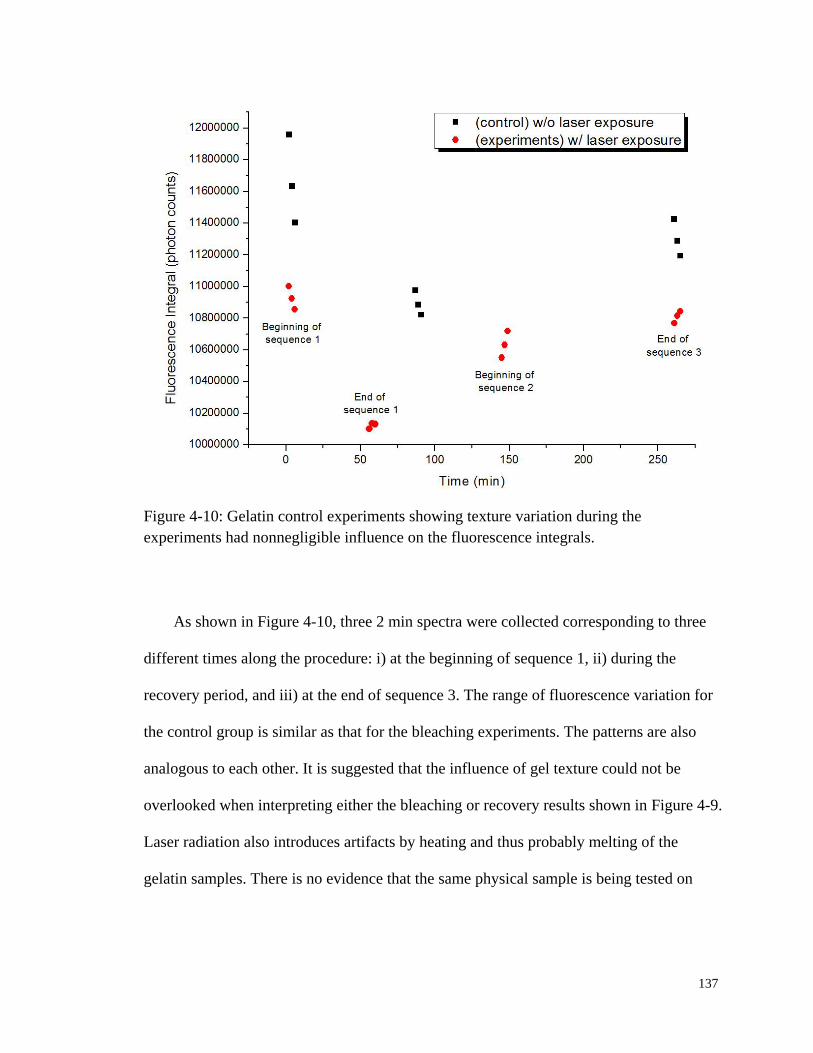
137
Figure 4-10: Gelatin control experiments showing texture variation during the
experiments had nonnegligible influence on the fluorescence integrals.
As shown in Figure 4-10, three 2 min spectra were collected corresponding to three
different times along the procedure: i) at the beginning of sequence 1, ii) during the
recovery period, and iii) at the end of sequence 3. The range of fluorescence variation for
the control group is similar as that for the bleaching experiments. The patterns are also
analogous to each other. It is suggested that the influence of gel texture could not be
overlooked when interpreting either the bleaching or recovery results shown in Figure 4-9.
Laser radiation also introduces artifacts by heating and thus probably melting of the
gelatin samples. There is no evidence that the same physical sample is being tested on

138
successive trials due to melting and resulting physical redistributions of the material,
therefore bleaching cannot be evaluated.
Despite of the ambiguity of the bleaching property of gelatin it is clear that collagen
fluoresces significantly under NIR excitation. Actually, in the timescale of an in vivo
experiment, collagen does not show discernible bleach as shown in Figure 4-11.
Therefore, it is evident that as a major constitute of extracellular matrix the structural
protein collagen contributes as type I fluorophore to the in vivo observed fluorescence
under NIR excitation.
Figure 4-11: Fluorescence of three gelatin samples measured on different days using in
vivo apparatus showing no sign of photobleaching during a 100 sec short period of time.
Y-axis has an offset. Before offset, the average fluorescence of each 20 ms frame was
3053, 2221 and 2350 respectively.
139
4.3.3 Melanin
Melanin, a chromophore carried in melanocytes, is one of the main light-absorbing
pigments in skin and is present only in stratum basale of the epidermis, i.e., it is not
possible to excite blood without also irradiating melanocytes. As a skin photoprotectant,
melanin absorbs UV/Vis radiation and disperses the energy through ultrafast internal
conversion as heat. Microscopically, melanin is a granular biopolymer which is an
aggregate of smaller component molecules. The melanin granule also has a much higher
refractive index and therefore behaves as a strong scatterer as well as an absorber (108,
120). The fluorescence of melanin under multi-photon excitation has long been observed
(121, 122), and it has been acknowledged as one of the major endogenous fluorophores
of human skin under UV/Vis excitation.
Figure 4-12 shows the melanin fluorescence spectra under NIR excitation. The
Raman and fluorescence from the cuvette and DI water is obvious. Nevertheless, the
growth of broadband Raman (Figure 4-12(A)) from melanin at 1380 and 1580 cm-1
almost makes the cuvette Raman at 1650 cm-1
a shoulder peak in the stock solution.
Fluorescence integrals for various melanin concentrations were calculated after the
background emission from the DI water containing cuvette was subtracted. As shown in
Figure 4-12(B), melanin fluorescence by NIR excitation increases linearly with
concentration.

140
Figure 4-12: (A, left) Raw spectra of melanin solutions (30 min accumulation each) at
various concentrations with 100 nm pore-size filtration; (B, right) Linear fit of
fluorescence integrals vs. concentration for melanin. All spectra have DI water
background subtracted. Correlation coefficient equals 0.999.
Figure 4-13 shows the bleaching curves for 200 nm pore-size filtered water soluble
melanin. For both curves, NIR irradiation caused a quench around 25-30% from its
original fluorescence. After 2 hr of exemption from the laser irradiation between the first
and second exposure, fluorescence integral almost stayed where it was indicating no
obvious recovery. Although not shown here, a 24 hr recovery time was also tested and
still the same was observed.
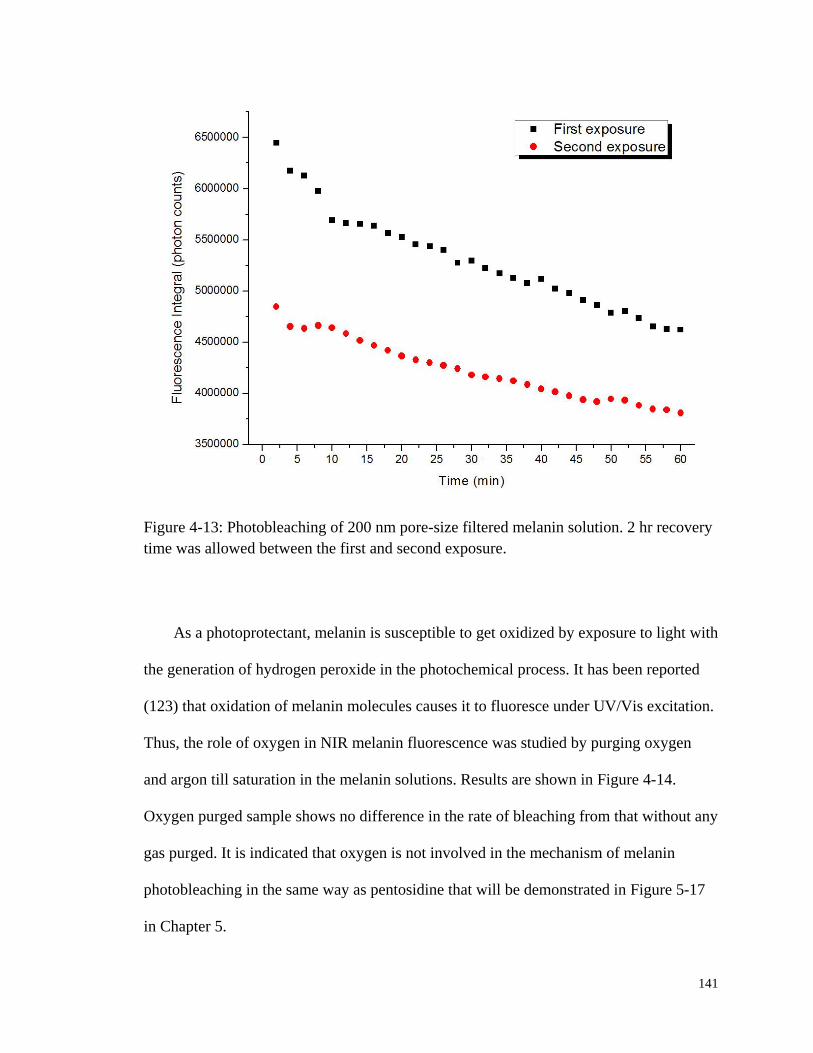
141
Figure 4-13: Photobleaching of 200 nm pore-size filtered melanin solution. 2 hr recovery
time was allowed between the first and second exposure.
As a photoprotectant, melanin is susceptible to get oxidized by exposure to light with
the generation of hydrogen peroxide in the photochemical process. It has been reported
(123) that oxidation of melanin molecules causes it to fluoresce under UV/Vis excitation.
Thus, the role of oxygen in NIR melanin fluorescence was studied by purging oxygen
and argon till saturation in the melanin solutions. Results are shown in Figure 4-14.
Oxygen purged sample shows no difference in the rate of bleaching from that without any
gas purged. It is indicated that oxygen is not involved in the mechanism of melanin
photobleaching in the same way as pentosidine that will be demonstrated in Figure 5-17
in Chapter 5.
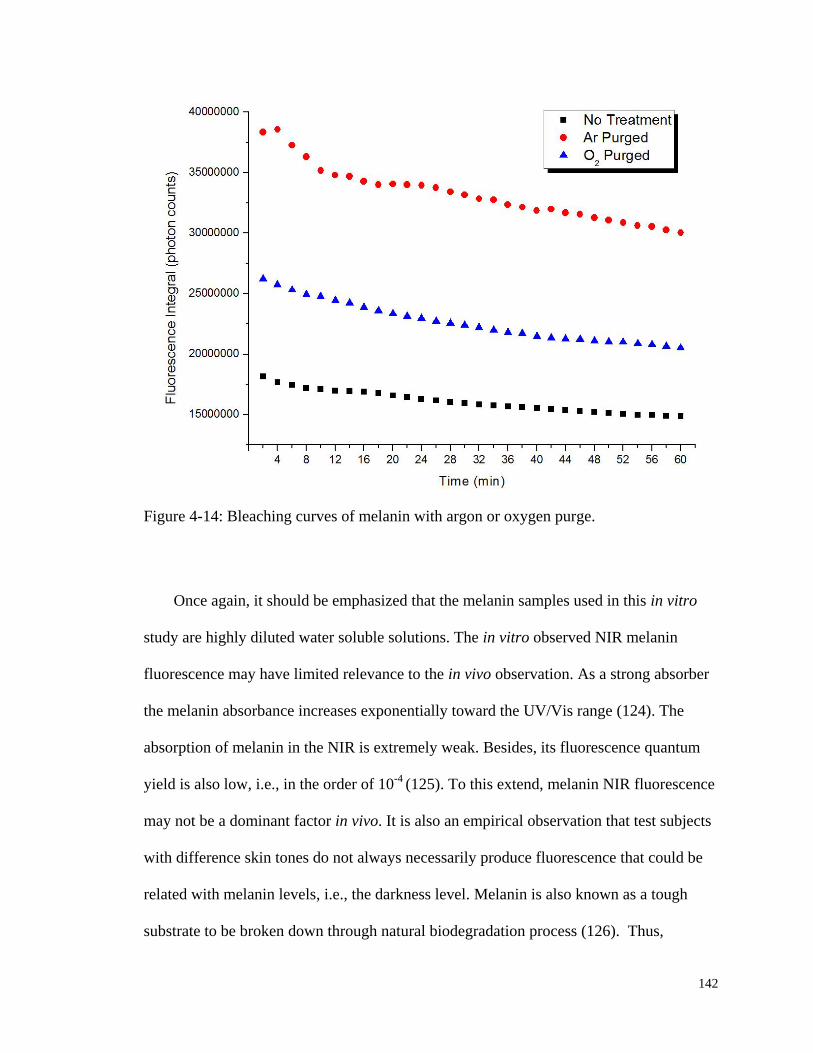
142
Figure 4-14: Bleaching curves of melanin with argon or oxygen purge.
Once again, it should be emphasized that the melanin samples used in this in vitro
study are highly diluted water soluble solutions. The in vitro observed NIR melanin
fluorescence may have limited relevance to the in vivo observation. As a strong absorber
the melanin absorbance increases exponentially toward the UV/Vis range (124). The
absorption of melanin in the NIR is extremely weak. Besides, its fluorescence quantum
yield is also low, i.e., in the order of 10-4
(125). To this extend, melanin NIR fluorescence
may not be a dominant factor in vivo. It is also an empirical observation that test subjects
with difference skin tones do not always necessarily produce fluorescence that could be
related with melanin levels, i.e., the darkness level. Melanin is also known as a tough
substrate to be broken down through natural biodegradation process (126). Thus,
143
unrecoverable bleaching of melanin would have an accumulative effect on test subjects
who frequently participated in this study, i.e., the more often a test subject is exposed to
the NIR laser, the less his/her fingertip fluoresces. However, no such photobleaching
effect has ever built up within the normal metabolic period of skin. Therefore, as a type II
contributor to the in vivo human skin autofluorescence, its contribution to the observed
photobleaching might also be limited.
4.3.4 Blood Components
As shown in Figure 4-15, plasma produced copious NIR fluorescence. By contrast,
although not shown here, the NIR fluorescence of the Hb samples actually decreases as
the increase of Hb concentrations. However, it should be noticed that in the NIR spectral
range, Hb absorbs more than 10 times of plasma (10). The mismatch of the refractive
index of the cuvette and the Hb samples formed a shielding effect that reduces the
contribution of the cuvette while the Hb fluorescence increases. Less incident light
reaches the cuvette as the Hb concentration increase. Actually, Hb fluoresces but the
contribution to the total is not adequate to replace the cuvette fluorescence that decrease.

144
Figure 4-15: NIR fluorescence of plasma at various concentrations. Both raw spectra (A,
left) and linear fit to fluorescence integrals (B, right) are presented. Fifteen 1 min spectra
were collected for each concentration. The relative percentages were calculated based on
the glucose added in to the plasma stock solution as an internal reference.
Nevertheless, evidence of Hb fluorescence could be suggested in the bleaching
experiments shown in Figure 4-16(B). An obvious trend of fluorescence loss can be
observed in Hb solutions, while in plasma solutions (Figure 4-16(A)) no such pattern is
shown and total fluorescence fluctuates randomly. This indicates that it is Hb, not blood
plasma, that contributes the most to the photobleaching in whole blood. In Hb samples,
about 50% of fluorescence loss happens in the first 5 min. Although photobleaching
slows down thereafter, there is no sign for the total fluorescence to become stable at 20
min. The rate of photobleaching is observed to increase with the increased concentration

145
of Hb. The most concentrated sample, which has an Hb concentration of 7.2 g/dL
(normal range for human blood Hb level is 12-15 g/dL) bleaches the quickest.
Figure 4-16: Photobleaching study of plasma (A, left) and Hb (B, right). The rate of
bleaching is concentration dependent for Hb samples.
To characterize the bleaching properties of Hb NIR fluorescence, the Hb sample was
put under laser exposure for 15 min and then left in the same place but without laser
exposure to allow any possible recovery for 1.5 hr before the collection of the second
spectra sequence. As shown in Figure 4-17 although not fully recovered, the total
fluorescence did mostly restore back and the whole bleaching process could be repeated.
Another similar overnight experiment also shows the same phenomenon, demonstrating
that the observed Hb photobleaching is recoverable, or in other words, is reversible.
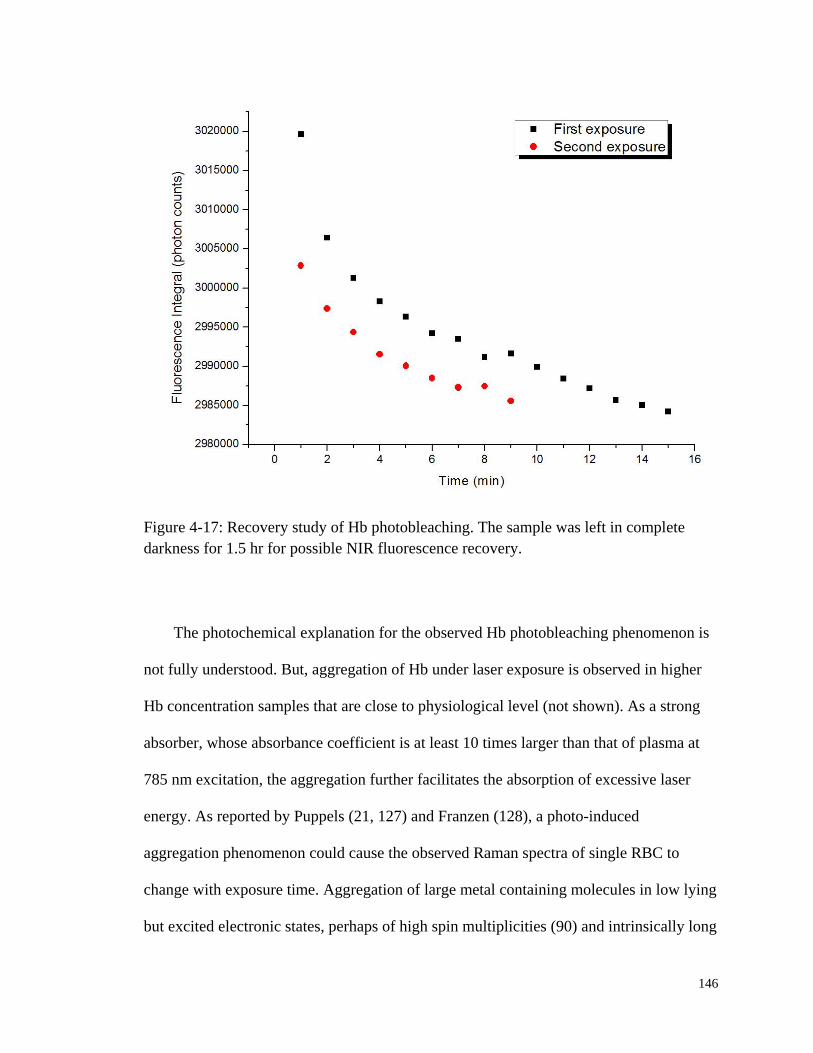
146
Figure 4-17: Recovery study of Hb photobleaching. The sample was left in complete
darkness for 1.5 hr for possible NIR fluorescence recovery.
The photochemical explanation for the observed Hb photobleaching phenomenon is
not fully understood. But, aggregation of Hb under laser exposure is observed in higher
Hb concentration samples that are close to physiological level (not shown). As a strong
absorber, whose absorbance coefficient is at least 10 times larger than that of plasma at
785 nm excitation, the aggregation further facilitates the absorption of excessive laser
energy. As reported by Puppels (21, 127) and Franzen (128), a photo-induced
aggregation phenomenon could cause the observed Raman spectra of single RBC to
change with exposure time. Aggregation of large metal containing molecules in low lying
but excited electronic states, perhaps of high spin multiplicities (90) and intrinsically long
147
emission lifetimes, would certainly create a very large density of vibronic states in which
to thermalize electronic excitation and quench fluorescence.
To summarize, similar to collagen, plasma is a type I contributor to the in vivo
observed human skin autofluorescence. While the bleaching and recovery properties of
Hb suggest that the emission from whole blood, reaches a steady state in vivo when the
laser induced emission is balanced against the photobleaching. Heart driven pulses are
always observable in vivo and so equilibrium is apparently reached very quickly, relative
to heart rate and blood flow rate in vivo.
4.4 Discussion
It should be pointed out firstly that in vitro solution environments, such as for Hb
and melanin, are by no means comparable to their in vivo ones, no matter how
concentrated the samples could be. Therefore the nature of the tissue fluorescence cannot
be described unequivocally in vitro. For example in tissue, i.e., RBCs, Hb is tightly
packed into erythrocytes, approximately 270 million per cell. Thus, biomolecular
photochemistry within a RBC is likely to be much faster and more efficient than any in
vitro environment which must be more dilute. Therefore, although the photodynamics
observed here is capable of offering reference to in vivo phenomenon, it is only partially
representative and should be interpreted warily in the context of in vivo observations.
A variety of antioxidants and free radical scavengers, i.e., vitamins and coenzymes,
were also tested in vitro. Functionally important in vivo (129), surprisingly these
materials generally do not produce NIR emission despite producing copious UV/Vis

148
emission. So while not every known metalloprotein was tested, the mere presence of
amide linkages without any metal present, even thousands of them, does not seem to offer
an explanation for the fact that nearly every protein displays some NIR fluorescence.
Endogenous and exogenous porphyrins (130) may also contribute as porphyrins are
well known to produce copious fluorescence under either UV/Vis (123, 124, 131, 132)
or NIR excitation. However, their fluorescence properties were not studied since
cytochrome species that are found exclusively in the static tissue, i.e., cytosol and
mitochondrial membranes, exist only in extremely small quantities (≈3 nM porphyrins
per gram tissue) in skin (133, 134). This is not surprising since most of the natural
porphyrins in human body are metabolic intermediates, such as protoporphyrin, and
photochemical reactions upon irradiation produce reactive oxygen species (ROS) that are
toxic to cells. Bacteria are known (130, 131) to produce porphyrins on the skin that for a
given test subject could be significant. However, fingertips skin tissue is less prone to
have abnormal overproduction of porphyrins through this pathway than facial skin as
inflammation and acne vulgaris (135). Therefore, endogenous porphyrins are probably at
most a minor contributor to the net in vivo fluorescence.
As shown in Figure 4-13 the melanin fluorescence does not recover but for the
specific in vivo experiments it is noted that there is much less melanin on the volar side of
fingertip skin, i.e., ridged skin is generally weakly pigmented if at all. Therefore, it is
concluded that most of the observed fluorescence does not originate with melanin.
Anecdotally strongly pigmented fingertips have only been observed in certain people, e.g.,
from the Indian subcontinent, but for most test subjects the pigmentation of ridged skin
actually is very low. Furthermore sun induced pigmentation, i.e., sun tan, requires tens of

149
hours to develop and this timescale is also in disagreement with the in vivo characteristics
of the fluorescence recovery that have been observed.
It is commonly stated in the cosmetic literature that natural exfoliation limits the
lifetime of viable skin cells to about 28 days. Clearly this depends on the type of skin, i.e.,
smooth body or facial skin is probably well described with ridged skin having a longer
lifetime. So skin that is bleached today is unlikely to be exfoliated completely by the next
day. Since the penetration is greater than the thickness of the nonviable and viable tissue,
i.e., 500-700 µm, the bleached spot should be able to be detected if that is the site of
bleaching chemistry and it does not repair overnight. Since we never have had evidence
of detecting a bleached spot under such conditions the contribution of the melanin to the
bleaching does not seem significant.
Even the dead outer cells of the stratum corneum in direct contact with the
atmosphere cannot be guaranteed to remain attached to the irradiated surface. Therefore
to obtain the result which is always observed in vivo it is suggested that the bleaching
behavior occurs below the outermost layers of cells whether they are viable or not. Thus
on the basis of direct in vivo observations and comparison with specific in vitro materials,
it is suggested that the fluorescence from so called “static tissue” mostly originates from
the cells and extracellular spaces and fluids in contact with the viable tissues.
Most commercially available proteins like gelatin or bovine serum albumin fluoresce
although it is possible that they could contain preservatives, e.g., antioxidants, and
impurities, e.g., ash. However, according to the manufacturer there are no preservative
impurities and the ash is an extremely small percentage of the material so these do not

150
seem to be viable sources of the observed emission. It should be also noted that many
proteinaceous materials as well as nonproteinaceous materials are purified on sucrose or
sepharose columns and these could promote the formation of AGEs as will be discussed
later in Chapter 5. Therefore freshly harvested serum and plasma were tested. These
samples were also found to fluoresce but it is difficult to obtain either plasma or serum in
vitro that absolutely contains no residual Hb. Therefore, to date it is hypothesized that
plasma has intrinsic fluorescence separate from that of RBCs but that it apparently does
not bleach. On this basis we suggest that in vivo the bleaching of blood that is not
impeded in its cardiac driven motion is not as important as tissue bleaching.
4.5 Conclusions
The presence of ubiquitous NIR fluorescence from human skin in vivo is well-known
but poorly understood at least partly because there are many potential sources with only
limited means for separating the different contributions. In this chapter, in vitro study on
the photochemistry of various blood and static tissue constituents was performed in an
effort to narrow down endogenous sources of the observed in vivo spontaneous NIR
fluorescence from biological tissues. Of all the substances investigated in this chapter,
four of them stand out, namely collagen, melanin, plasma and Hb: two major static tissue
constituents and two major blood proteins. The major skeletal protein in static tissue, e.g.,
collagen, and another important blood protein, e.g., plasma, contribute significantly to the
non-bleachable part of the baseline in vivo observed skin autofluorescence. Based on in
vivo observations at the site probed, it is suggested that melanin fluorescence though not

151
negligible has only limited influence. Hb fluorescence bleaches but also recovers quickly,
thus it is more likely to form a dynamic equilibrium with cardiac pulses during in vivo
measurements. However, no observations or statistics have been reported supporting the
idea that these tissue constituents vary in some way between healthy and diabetic patients.
But, as shown in Figure 3-8 in Chapter 3, it has been observed in vivo that there is
considerable difference between the autofluorescence and bleaching properties of healthy
and diabetic patients. Therefore, the photochemistry of another potential fluorophore, e.g.,
AGEs, needs to be investigated.
152
5. PHOTOCHEMISTRY OF ADVANCED
GLYCATION ENDPRODUCTS (AGES)
5.1 Advanced Glycation Endproducts (AGEs)
5.1.1 Motivation of AGEs Study
It was established in Chapter 3 on the basis of in vivo experiments on human volar
side fingertip skin that: i) the majority of the photobleached fluorescence does not
originate within blood, ii) the bleaching (1/e point) occurs in 101-10
2 sec timescale with
200 mW 830 nm excitation, and also iii) a photobleached region remains bleached for at
least 45 min but recovers completely within several hours. From the in vitro
investigations of various tissue and blood constituents in Chapter 4, it was shown that
among the constituents that fluorescence under NIR excitation, e.g., collagen, plasma,
melanin, and Hb, only the last two show the trend of photobleaching.
In vitro experiments suggest that when disconnected from biochemical processes
characteristic of metabolic homeostasis, Hb photobleaching is reversible whereas melanin
is not. However, melanin production requires longer than days to accumulate, resulting in
inconsistency with respect to the timescale of the fading of the bleached spot observed in
vivo. Combining these with the fact that volar side ridged skin is not usually strongly
pigmented it is suggested that the majority of the bleachable fluorescence that recovers
on a several hour to 1 day timescale may be associated with something else.

153
Among the different ethnic groups encountered, African American, some Indians
and Hispanic subjects are more pigmented than Caucasian and Asian. However, in vivo
spectra collected for tens of test subjects that participated in this study for the past several
years have indicated that the baseline IE is not necessarily positively related with skin
melanin levels. By saying baseline IE, it means the part of IE that is not modulated by the
blood movement. What has been observed in a systematic way is the excessive IE for
senior and diabetic patients, similar as what has been reported by others (136).
Figure 5-1: IE integrals collected on the same day for four individuals showing the
fluorescence from senior and diabetic patients are stronger than others. Six and eight data
points are used for non-diabetic and diabetic subjects respectively. Upper and lower
edges of box represent 75th
and 25th
percentile. Smaller square represents mean value.
Top and bottom whiskers represent maximum and minimum data respectively.

154
Figure 5-1 shows the in vivo IE integrals for four subjects collected on the same day
under the PDPM settings that are optimal for each individual respectively so that
differences cannot be attributed to differing blood content, i.e., perfusion. Within the
same ethnic group, diabetic patient fluoresces significantly more than healthy people.
Though not as distinctive, senior test subject also tends to produce more fluorescence.
Such tendency leads us to seek age or diabetes related endogenous tissue constituents that
have potential to contribute substantially to the in vivo observed fluorescence.
Advanced glycation endproducts, or AGEs, are a family of complex and reactive
compounds that result from a chain of chemical reactions started with a glycation
reaction (137, 138), i.e., a reaction between certain amino acid side chains, e.g., lysine or
arginine, and various sugars, e.g., ribose and glucose. After the formation of AGEs, the
accumulation in the tissues is dependent on the half-life of the proteins to which the
crosslink is bound (139). Therefore, on long-lived proteins like skin collagen, AGEs
accumulate over the lifetime. In the AGEs family, compounds like N-carboxy-methyl
lysine (CML) and pentosidine are known to be highly fluorescent in UV/Vis spectral
range. But before this work there was no knowledge of the photochemical behavior under
NIR excitation. Therefore, it was necessary to investigate the fluorescence features of
these compounds under NIR excitation in order to hopefully shed some light in
explaining our in vivo observations.
155
5.1.2 Endogenous Formation Pathways of AGEs
The formation of AGEs is part of normal metabolism in vivo. Although
physiologically there is more than one pathway leading to the ultimate synthesis (109,
140), they all include a glycation step at the early stage, which is called the Maillard
reaction. This chemical reaction involves bonding and crosslinking between amino group
containing compounds, such as proteins and amino acids, and the carbonyl group of
reducing sugars. During this process chemically reversible early glycosylation products
with proteins, such as Schiff bases and Amadori adducts, are formed. Over time, these
intermediate products undergo slow and complex processes comprising condensation,
rearrangement, fragmentation, and oxidation reactions to finally form AGEs. At this stage,
the alteration of circulating, cellular, and extracellular matrix proteins is final and
irreversible.
Of all reducing carbohydrates and sugars in protein glycation, the physiologically
relevant D-glucose is one of the least reactive. That is possibly an evolutionary reason
why it is the most important free sugar in vivo being widely used in organisms as a source
of energy (141). While by contrast, it is well known that D-ribose is much more reactive
in the Maillard reaction (109, 142) due to a higher fraction of the more reactive acyclic
form. However D-ribose does not elevate in human but D-glucose does when excessive
carbohydrates are consumed. Pooling of dietary D-glucose in interstitial fluid or blood
flow has been proved to result in an elevated AGEs level (139, 143, 144). Albeit at a
slower rate, AGEs formation in vivo from glucose is possible through oxidation of
glucose to arabinose or even ribose (145).
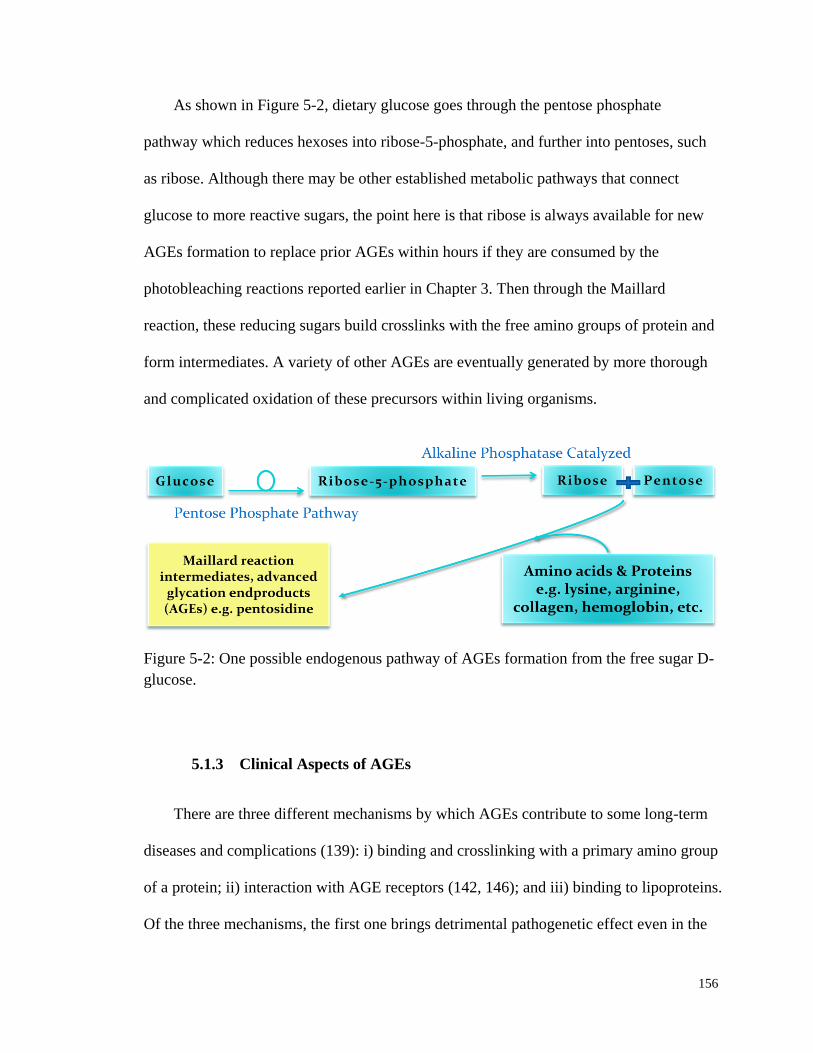
156
As shown in Figure 5-2, dietary glucose goes through the pentose phosphate
pathway which reduces hexoses into ribose-5-phosphate, and further into pentoses, such
as ribose. Although there may be other established metabolic pathways that connect
glucose to more reactive sugars, the point here is that ribose is always available for new
AGEs formation to replace prior AGEs within hours if they are consumed by the
photobleaching reactions reported earlier in Chapter 3. Then through the Maillard
reaction, these reducing sugars build crosslinks with the free amino groups of protein and
form intermediates. A variety of other AGEs are eventually generated by more thorough
and complicated oxidation of these precursors within living organisms.
Figure 5-2: One possible endogenous pathway of AGEs formation from the free sugar D-
glucose.
5.1.3 Clinical Aspects of AGEs
There are three different mechanisms by which AGEs contribute to some long-term
diseases and complications (139): i) binding and crosslinking with a primary amino group
of a protein; ii) interaction with AGE receptors (142, 146); and iii) binding to lipoproteins.
Of the three mechanisms, the first one brings detrimental pathogenetic effect even in the

157
process of AGEs formation. Upon bonding with structural protein within the extracellular
matrix, e.g., collagen, related tissue and organs lost their original elasticity. In vascular
system, increasing stiffness leads to angiosclerosis and related cardiovascular diseases. In
tissue, AGEs could cause widespread damage through up-regulation of inflammation and
oxidative stress.
As will be shown in Table 5-1, AGEs exist in almost every tissue and organ within
human body, with higher concentrations in cartilage, dura mater, vascular base membrane,
skin, and the circulatory system. By nature protein glycation is a slow process; however
the lifetime of AGEs is determined by the protein to which they are bound. In the
circulatory system, e.g., the blood stream, the turnover times for both albumin (15-20
days) and Hb (120 days) are short (147-149). Therefore, the best known AGE
hemoglobin H1c (HbA1c), is a biomarker for the 120-day moving average of plasma
glucose concentration (150, 151). Yet in long-lived protein as collagen or other structural
materials, AGEs could stay for the life time of the organism due to their low clearance
rate in kidney (152). It has been well established (143, 153) that AGEs build up with age
and the accumulation is increased under long-term hyperglycemia, which is common for
many diabetic patients.
Excessive accumulation of AGEs in long lived tissues is believed to play a pivotal
role in diabetes (154-156), and even a causative factor in several other age related chronic
diseases, such as vascular disease, cardiopathy, neuropathy, nephropathy, retinopathy,
cataract, and arthritis (137, 138, 157-159). On the other hand, monitoring the UV/Vis
fluorescence of AGEs has been proposed as a marker of inflammation and oxidative
stress in renal failure in kidney transplant, or as a substitute for the HbA1c as an indicator
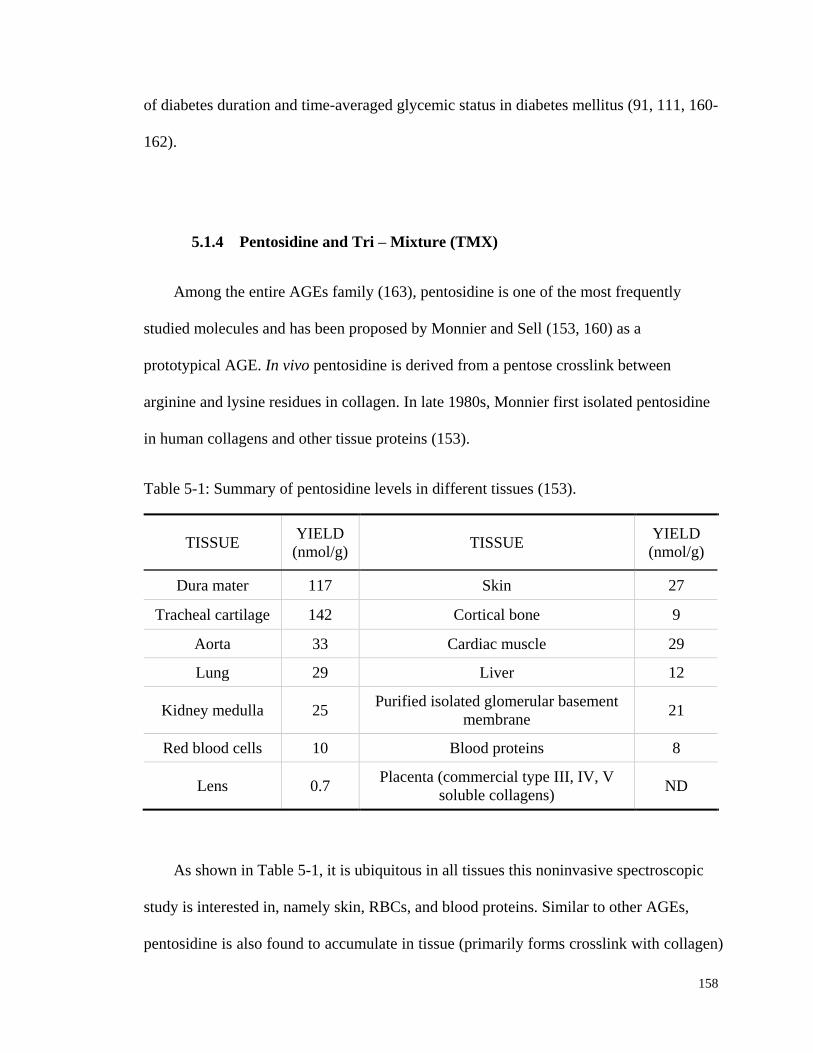
158
of diabetes duration and time-averaged glycemic status in diabetes mellitus (91, 111, 160-
162).
5.1.4 Pentosidine and Tri – Mixture (TMX)
Among the entire AGEs family (163), pentosidine is one of the most frequently
studied molecules and has been proposed by Monnier and Sell (153, 160) as a
prototypical AGE. In vivo pentosidine is derived from a pentose crosslink between
arginine and lysine residues in collagen. In late 1980s, Monnier first isolated pentosidine
in human collagens and other tissue proteins (153).
Table 5-1: Summary of pentosidine levels in different tissues (153).
TISSUE YIELD
(nmol/g) TISSUE
YIELD
(nmol/g)
Dura mater 117 Skin 27
Tracheal cartilage 142 Cortical bone 9
Aorta 33 Cardiac muscle 29
Lung 29 Liver 12
Kidney medulla 25 Purified isolated glomerular basement
membrane 21
Red blood cells 10 Blood proteins 8
Lens 0.7 Placenta (commercial type III, IV, V
soluble collagens) ND
As shown in Table 5-1, it is ubiquitous in all tissues this noninvasive spectroscopic
study is interested in, namely skin, RBCs, and blood proteins. Similar to other AGEs,
pentosidine is also found to accumulate in tissue (primarily forms crosslink with collagen)
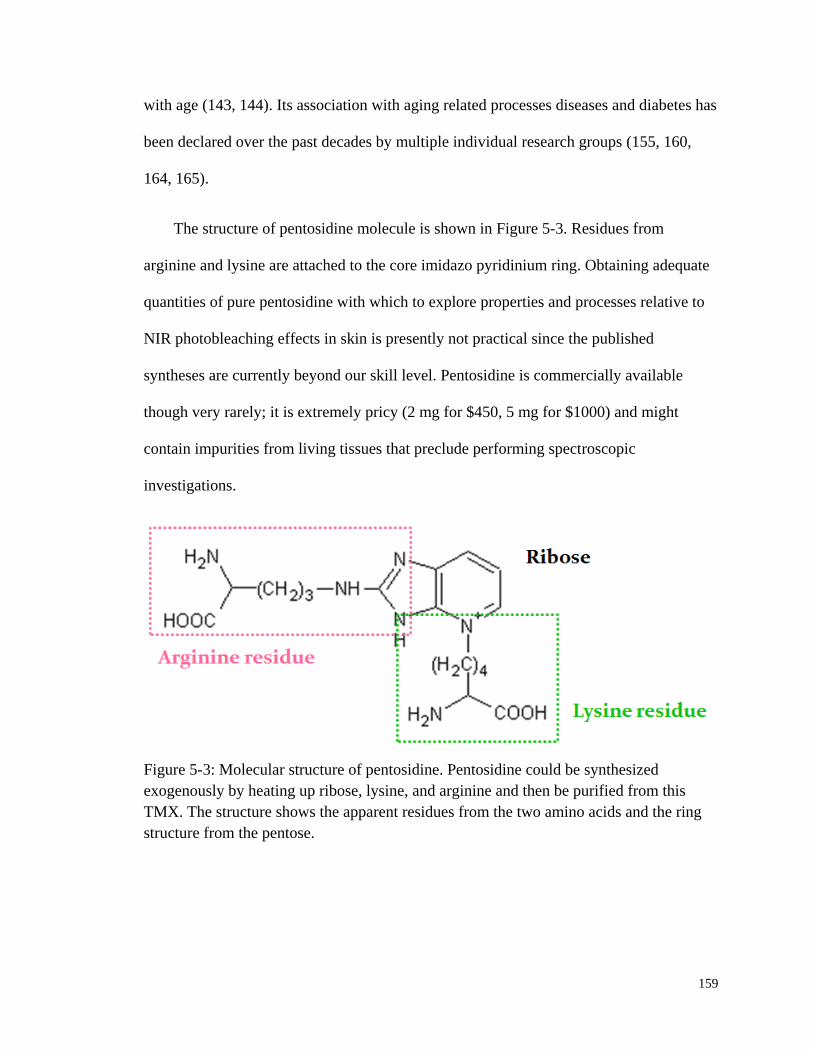
159
with age (143, 144). Its association with aging related processes diseases and diabetes has
been declared over the past decades by multiple individual research groups (155, 160,
164, 165).
The structure of pentosidine molecule is shown in Figure 5-3. Residues from
arginine and lysine are attached to the core imidazo pyridinium ring. Obtaining adequate
quantities of pure pentosidine with which to explore properties and processes relative to
NIR photobleaching effects in skin is presently not practical since the published
syntheses are currently beyond our skill level. Pentosidine is commercially available
though very rarely; it is extremely pricy (2 mg for $450, 5 mg for $1000) and might
contain impurities from living tissues that preclude performing spectroscopic
investigations.
Figure 5-3: Molecular structure of pentosidine. Pentosidine could be synthesized
exogenously by heating up ribose, lysine, and arginine and then be purified from this
TMX. The structure shows the apparent residues from the two amino acids and the ring
structure from the pentose.
160
Alternatively, pentosidine can be formed following the approach proposed by
Monnier (109, 153, 160). Theoretically, all reducing carbohydrates, pentoses, hexoses,
and even disaccharides can potentially be involved in the Maillard reaction and ultimately
form AGEs. D-ribose is the sugar counterpart in most of the in vitro studies, not only
because it reacts 30 times faster than D-glucose but also because of its 10 times higher
yield. Therefore, in this study an aqueous solution termed as the “tri-mixture” (TMX) is
produced in order to study the photochemistry of pentosidine.
TMX is produced by heating L-lysine, L-arginine and D-(-)-ribose in phosphate
buffered saline (PBS) solution at 65 °C for at least1 hr under continuous stirring. Further
purification of this TMX is available (166) but at extreme reduction of net yield.
Nevertheless in living tissues AGEs are accompanied by variety of intermediates. Thus,
keeping the unpurified form of TMX could be more appropriate for exploring the source
of our in vivo observations. As will be shown in Section 5.4, this solution displays many
of the properties of skin NIR autofluorescence photobleaching and it allows some in vitro
experiments that we hope will shed some light on the in vivo photobleaching process and
our hypotheses concerning volume normalization.
5.2 Singlet Oxygen (1O2) Chemistry
5.2.1 Triplet Oxygen (3O2) & Singlet Oxygen (
1O2)
Energetically more favorable, the oxygen molecule has a triplet ground state (3O2),
which is unusual for the vast majority of other molecules. When excited, 3O2 can get to
two singlet excited states, 95 kJ/mol and 155 kJ/mol above the ground state respectively.
161
However, in the condensed phase the singlet state which is 155 kJ/mol above the ground
state is not significant because of the increased chance of radiationless deactivation to the
lower 95 kJ/mol singlet state. Therefore, 1O2 is usually referred to the lower lying singlet
excited state of molecular oxygen.
Among the few species that exhibit a triplet electronic ground state, molecular
oxygen is the one that actively participates in a variety of chemical and biochemical
processes. During the normal metabolism of oxygen, the natural byproduct 1O2 is
generated, which has been known to play an important role in cell signaling and
homeostasis (167, 168). In fact 1O2 is way more reactive than ground state oxygen. It can
initiate a plethora of events that lead to cell death. Therefore, one of its major clinical
applications is to kill cancerous cells in photodynamic therapy (PDT) (169-172). In this
radiation treatment, 1O2 sensitizer is injected into the blood flow and depending on the
absorption property of the sensitizer either UV/Vis or NIR radiation from a laser or light
emitting diode (LED) is guided to the site of operation. When radiated, the sensitizer
excites the oxygen molecules in the surrounding tissue to 1O2. Malignant cancer tissue
and cells are characterized with high metabolic rate, thus are over-plethoric and highly
oxygenated. More 1O2 molecules are generated in cancer than in normal tissue. Therefore,
an effective treatment is achieved.
5.2.2 Photosensitized Process of 1O2 Formation
1O2 could be generated by direct photoexcitation from triplet ground state oxygen
(173). Alternatively, energy could be gained during the collision of 3O2 with another
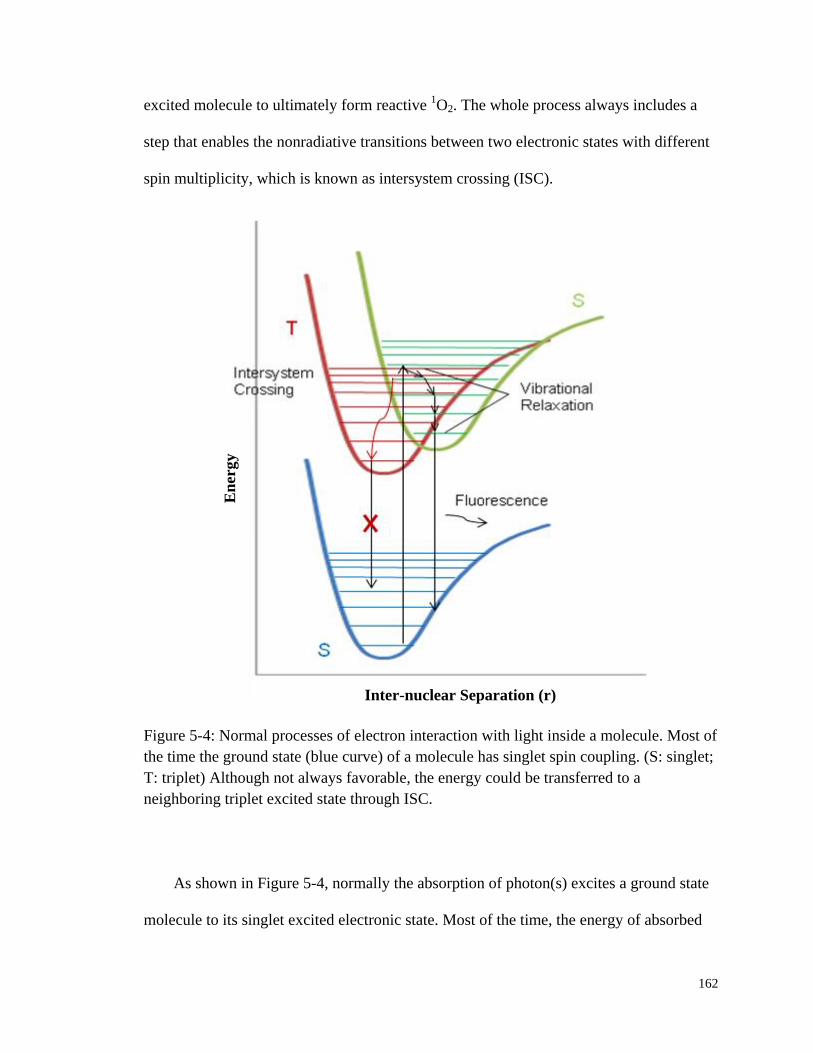
162
excited molecule to ultimately form reactive 1O2. The whole process always includes a
step that enables the nonradiative transitions between two electronic states with different
spin multiplicity, which is known as intersystem crossing (ISC).
Figure 5-4: Normal processes of electron interaction with light inside a molecule. Most of
the time the ground state (blue curve) of a molecule has singlet spin coupling. (S: singlet;
T: triplet) Although not always favorable, the energy could be transferred to a
neighboring triplet excited state through ISC.
As shown in Figure 5-4, normally the absorption of photon(s) excites a ground state
molecule to its singlet excited electronic state. Most of the time, the energy of absorbed
Inter-nuclear Separation (r)
En
ergy

163
photons is directly spent on fluorescence emission. However, for some heavy-atom
molecules, such as metal containing porphyrins and some iodine/bromine bearing
molecules, overlapping singlet and triplet excited vibrational levels exist. In this case, the
probability of ISC occurring is more favorable. Thus, the absorbed energy is transferred
from the singlet excited state to a metastable excited triplet state without any photon
emission.
ISC is one of the slowest forms of relaxation with a time scale on the order of 10-8
to
10-3
sec (174). In an isolated molecule, as a result of ISC, energy is trapped in the triplet
state since the electron transition from an excited triplet state to a singlet ground state is
quantum mechanically forbidden. However, phosphorescence still occurs at a
significantly slower rate (103 to 10
0 sec) for such “forbidden” transition (85). In a solvent
system where molecular oxygen is present, the trapped energy could be transferred to the
ground state oxygen through the well-known triplet-triplet annihilation (TTA) process,
which gives rise to 1O2 (175). A schematic drawing of this complete process of
1O2
photosensitization is shown in Figure 5-5. It is also the working principles of
photodynamic therapy (PDT) in treating cancer (172, 176).
Molecules that are capable of generating 1O2 by photosensitizing
3O2 are called
singlet oxygen sensitizer, or photosensitizing dye. To be a singlet oxygen sensitizer, the
molecule should first of all have two overlapping singlet and triplet excited states, since
in the ISC transition little or no energy must be gained or lost. In addition, the triplet
excited state of a sensitizer should be slightly higher than that of 1O2 relative to the
ground state to achieve effective energy transfer (177). Finally, its lifetime should be long
enough to undergo the TTA with ground state oxygen. For a sensitizer to be used in in

164
vivo PDT, not only should it be water soluble but also be able to exhibit a high quantum
yield of 1O2, leading to the death of a cell or biological tissue. Hypericin, rose bengal
diacetate, and methylene blue are all among the most efficient reagents for 1O2 generation.
Figure 5-5: Schematic drawing of singlet oxygen photosensitization. S0: singlet ground
state; S1: singlet excited state; T: triplet state; S: singlet state. Destination of the energy
from the absorbed photons: 1) emits as fluorescence; 2) goes through ISC, TTA and
finally excite the 3O2 to
1O2.
5.2.3 Detection of 1O2
Singlet oxygen can be directly detected by its characteristic NIR luminescence at
1270 nm, corresponding to its lower singlet state at 95 kJ/mol. The chemiluminescent
emission is so weak that highly sensitive optical system is needed in order to detect it.

165
Such system usually has a high power fast repetition rate Nd:YAG pulsed laser source
and an IR sensitive photomultiplier (169, 171). In low pressure gas phase, 1O2 has an
extremely long lifetime around 72 mins (178). In condensed phase, however, its lifetime
is significantly shortened to microseconds or even nanoseconds (179), and is highly
dependent on the medium. In water, the lifetime of 1O2 is around 2 to 3 ms (180).
Therefore, D2O is widely used as solvent to extend its lifetime to 10-fold longer (181,
182) for the detection purpose. However the fluorescence quantum yield is still extremely
low.
To overcome this limiting feature, one solution is to use fluorescent probes that
chemically trap 1O2 and consequently form compounds that bear different fluorescent
features from the original probes. Recently, some research groups (183, 184) have been
using a novel commercial 1O2 marker, called Singlet Oxygen Sensor Green
® (SOSG).
Unlike other fluorescence and chemiluminescent reagents, SOSG is designed to be highly
selective for 1O2 and shows no appreciable response to other reactive oxygen species
(ROS) like peroxide. Although the exact structure of SOSG is not disclosed by the
commercial source, according to literature speculation it consists of two components
tethered together (184-186).
Figure 5-6 shows a suggested SOSG structure and its mechanism of detecting singlet
oxygen (185). Prior to the reaction with 1O2, the bonding between the chromophore and
dimethylanthrancene derivative quenches the fluorescence by electron transfer (ET) from
the trapping moiety. Thus, only weak emissions at 395 and 416 nm are observed.
However, upon reacting with 1O2 the formed endoperoxide can no longer be an
intramolecular electron donor. Therefore, strong emission at 525 nm (green) with UV/Vis
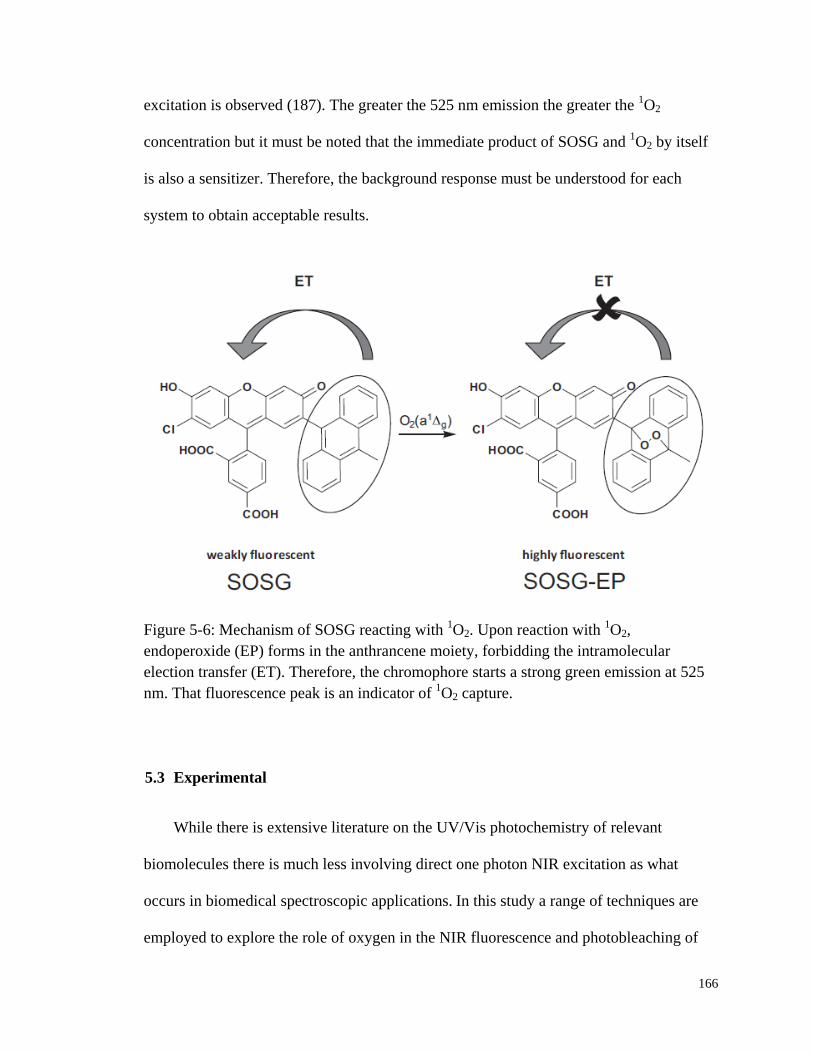
166
excitation is observed (187). The greater the 525 nm emission the greater the 1O2
concentration but it must be noted that the immediate product of SOSG and 1O2 by itself
is also a sensitizer. Therefore, the background response must be understood for each
system to obtain acceptable results.
Figure 5-6: Mechanism of SOSG reacting with 1O2. Upon reaction with
1O2,
endoperoxide (EP) forms in the anthrancene moiety, forbidding the intramolecular
election transfer (ET). Therefore, the chromophore starts a strong green emission at 525
nm. That fluorescence peak is an indicator of 1O2 capture.
5.3 Experimental
While there is extensive literature on the UV/Vis photochemistry of relevant
biomolecules there is much less involving direct one photon NIR excitation as what
occurs in biomedical spectroscopic applications. In this study a range of techniques are
employed to explore the role of oxygen in the NIR fluorescence and photobleaching of

167
the TMX system. In the subsequent paragraphs, experimental apparatus and setups will
be described before the results are presented.
First of all, TMX stock solution was produced by exogenous synthesis following the
procedure described by Monnier (153, 160). 25 mM (in some cases 100 mM) L-lysine
(16,971-4 or L6001), L-arginine (A5006) and D-(-)-ribose (R7500, all from Sigma-
Aldrich Co. LLC., St. Louis, MO, USA) solution was mixed in PBS and heated at 65 °C
for 2 hrs under continuous stirring. Since pentosidine is sensitive to ambient light, the
flask is kept in dark by shielding with aluminum foil throughout the process. Both
temperature and pH have an influence on the final yield of pentosidine. Based on
Monnier, in a slightly alkaline environment (pH=9) the yield (3.9%) is higher (153), yet
the more neutral environment is closer to physiological pH in living tissues and organs.
Under pH=7.8, a yield of 2.75% could still be achieved and a pentosidine concentration
on the order of several hundreds of micro molar could be anticipated in the TMX at
equilibrium. After stopping the reaction, the remaining amino acids and ribose might
continue to produce pentosidine and drive subsequent reactions to produce larger
agglomerates. However there is no evidence that they are involved in the observed
chemistry, which is an assumption at this point. During the synthesis, 5 mL TMX was
sampled every 20 min and investigated using the in vitro apparatus described in Section
4.2.2 of Chapter 4. It will be shown later in Section 5.4.1 that as described by Monnier
the mixture started out a colorless, transparent solution and then turned brown with a
little bit red hue toward the end. Further characterization and experimentation with this
TMX is described below.
168
UV/Vis absorption spectra of various TMX stock concentrations were collected
using Cary 50 UV/Vis spectrophotometer (Varian Inc., now Agilent Technologies, Santa
Clara, CA 95051). A medium sweep rate of 600 nm/min with 1 nm wavelength resolution
was set for all the UV/Vis absorption data that were collected. The fluorescence spectra
were collected using a PTI fluorimeter system (Photon Technology International, Inc.,
Birmingham, NJ). The entrance and exit lit widths were kept constant for all data
collected. Most of the time regular excitation or emission scans were performed at a scan
rate of 1 nm/sec. For the results shown in Section 5.5.3, each solution was monitored
consecutively 1) for emission at 525 nm for 30 sec under 488 nm excitation without the
laser present, and then 2) set in the dark without any excitation for 20 sec before
repeating step 1. This “baseline” cycle was repeated 4 times before actually irradiating
the solution with 500 mW 830 nm CW laser (Innovative Photonic Solutions, Monmouth
Junction, NJ, USA) during step 2 beginning 250 sec into the experiment.
The 1O2 reagent SOSG is extremely sensitive to light. It is packaged in sets of 10
vials of 100 µg effective compound. It was stored desiccated and protected from light at
below -20 °C until required for use. The SOSG stock solutions were prepared
immediately before use in 33 µL methanol due to its limited solubility in water. This
yielded a concentration of about 5 mM. The stock was further diluted by 500 or 1000
times in either PBS or water to get the suggested working solution concentration of 5-10
µM. No reuse of SOSG occurred and all solutions were disposed at the end of each work
session. It should be noted that the SOSG is provided as a small amount crystalline
material and great care must be taken in order to insure that all the crystals are dissolved
for consistent and reproducible baseline.
169
To observe the effect of the laser irradiation (450 mW, either 780 nm or 830 nm) on
the dissolved oxygen concentration, a Model DO-166MT-1SXS micro dissolved oxygen
electrode (LAZAR Research Laboratories Inc., Los Angeles, CA) is used. The oxygen
electrode produces a voltage reading proportional to the partial pressure of molecular
oxygen in contact with a semi-permeable membrane. The data logging system
automatically saves the data every 1 sec into an Excel workbook. A 10 cm long square
fused silica open top cuvette was used in this study for the convenience of gas purging.
Pure oxygen and argon was bubbled into the TMX samples in an extremely low flow rate
to avoid overflow. Although the TMX samples would be purged completely within
couple minutes, for all the samples tested in this study at least 30 min of either oxygen or
argon was bubbled before any measurements were taken to guarantee gas saturation. The
purged samples are sealed with Parafilm M®
all-purpose laboratory film to reduce gas
exchange. The cuvette was also fully covered with aluminum foil leaving only a 5 mm by
10 mm rectangular window for laser to enter if necessary.
An ab initio electronic structure calculation using Gaussian 03 program with
restricted Hartree Fock, 3-21G basis set (Revision E.01, Gaussian, Inc., Wallingford, CT,
USA) was also performed in order to guide our speculation of the possible underlying
photochemistry. The ground state singlet molecular structure was optimized for all bond
lengths and angles in Figure 5-3 before the energies of the lowest excited singlet and
triplet states were calculated (ZINDO) using that optimized ground state structure.
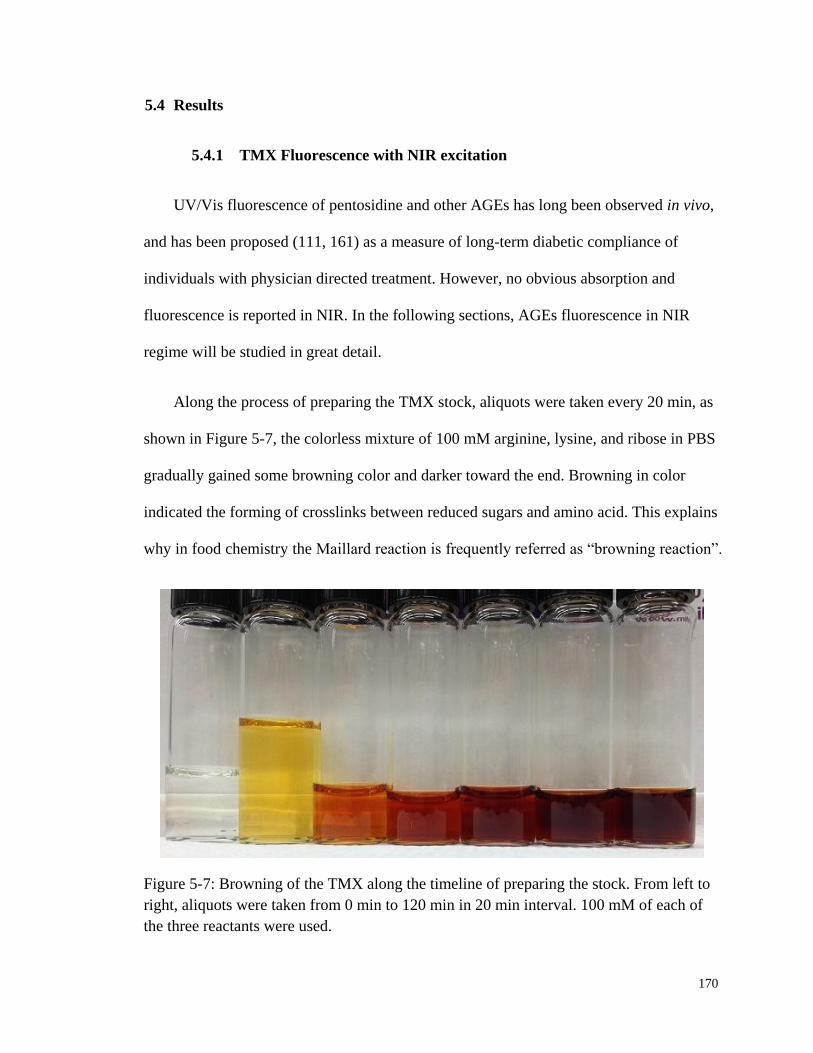
170
5.4 Results
5.4.1 TMX Fluorescence with NIR excitation
UV/Vis fluorescence of pentosidine and other AGEs has long been observed in vivo,
and has been proposed (111, 161) as a measure of long-term diabetic compliance of
individuals with physician directed treatment. However, no obvious absorption and
fluorescence is reported in NIR. In the following sections, AGEs fluorescence in NIR
regime will be studied in great detail.
Along the process of preparing the TMX stock, aliquots were taken every 20 min, as
shown in Figure 5-7, the colorless mixture of 100 mM arginine, lysine, and ribose in PBS
gradually gained some browning color and darker toward the end. Browning in color
indicated the forming of crosslinks between reduced sugars and amino acid. This explains
why in food chemistry the Maillard reaction is frequently referred as “browning reaction”.
Figure 5-7: Browning of the TMX along the timeline of preparing the stock. From left to
right, aliquots were taken from 0 min to 120 min in 20 min interval. 100 mM of each of
the three reactants were used.
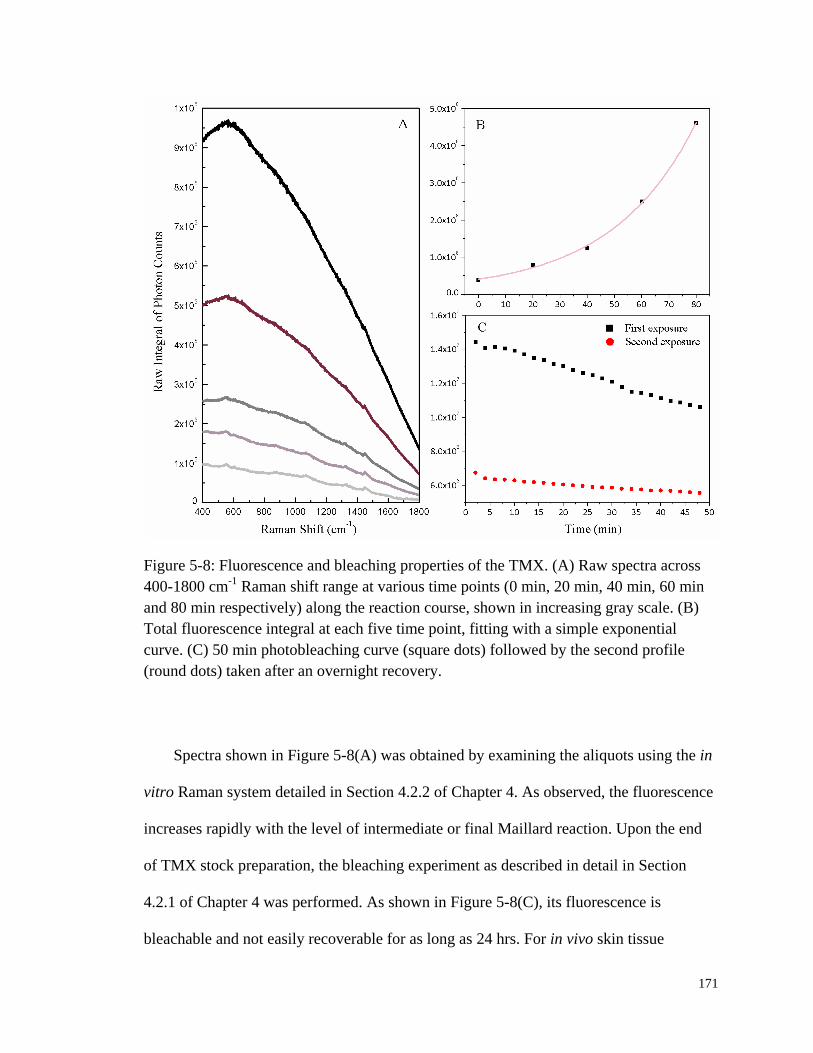
171
Figure 5-8: Fluorescence and bleaching properties of the TMX. (A) Raw spectra across
400-1800 cm-1
Raman shift range at various time points (0 min, 20 min, 40 min, 60 min
and 80 min respectively) along the reaction course, shown in increasing gray scale. (B)
Total fluorescence integral at each five time point, fitting with a simple exponential
curve. (C) 50 min photobleaching curve (square dots) followed by the second profile
(round dots) taken after an overnight recovery.
Spectra shown in Figure 5-8(A) was obtained by examining the aliquots using the in
vitro Raman system detailed in Section 4.2.2 of Chapter 4. As observed, the fluorescence
increases rapidly with the level of intermediate or final Maillard reaction. Upon the end
of TMX stock preparation, the bleaching experiment as described in detail in Section
4.2.1 of Chapter 4 was performed. As shown in Figure 5-8(C), its fluorescence is
bleachable and not easily recoverable for as long as 24 hrs. For in vivo skin tissue
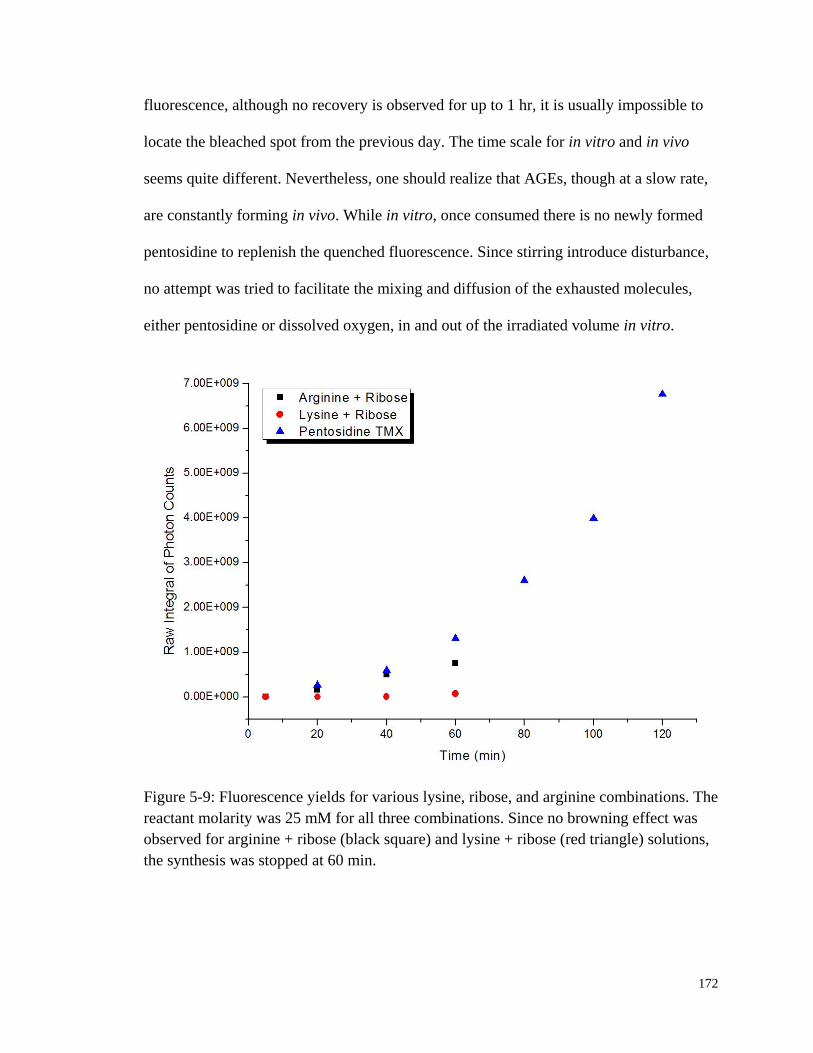
172
fluorescence, although no recovery is observed for up to 1 hr, it is usually impossible to
locate the bleached spot from the previous day. The time scale for in vitro and in vivo
seems quite different. Nevertheless, one should realize that AGEs, though at a slow rate,
are constantly forming in vivo. While in vitro, once consumed there is no newly formed
pentosidine to replenish the quenched fluorescence. Since stirring introduce disturbance,
no attempt was tried to facilitate the mixing and diffusion of the exhausted molecules,
either pentosidine or dissolved oxygen, in and out of the irradiated volume in vitro.
Figure 5-9: Fluorescence yields for various lysine, ribose, and arginine combinations. The
reactant molarity was 25 mM for all three combinations. Since no browning effect was
observed for arginine + ribose (black square) and lysine + ribose (red triangle) solutions,
the synthesis was stopped at 60 min.

173
Various combinations of the three reactants, i.e., lysine, arginine, and ribose, were
tested to establish the mechanism of pentosidine and possibly other fluorescent
compounds formation. Not surprisingly, as shown in Figure 5-9, pentosidine yield in
TMX increased almost exponentially, but the combination of lysine and ribose for
example barely gave rise to any pentosidine product. The combination of arginine and
ribose did get some nonnegligible yield, but was by no ways comparable to the yield
from TMX. Thus, it is suggested that the observed TMX fluorescence comprises of
mostly that from the formed AGE, i.e., pentosidine.
5.4.2 TMX UV/Vis Absorption
Fluorescence is a process that involves two steps, the first of which is the absorption
of a photon. Therefore, Figure 5-10 also checked the growth of the UV/Vis absorption
spectra for aliquots taken along the timeline. The successive increase of absorbance is
found to be consistent with that observed by Monnier and Sell (109, 153) as the
concentration of pentosidine increases for an identical TMX. Notice that also in Figure
5-10, the size of the 335 nm peak was comparable with that of 300 nm at the beginning of
the reaction. But the 300 nm absorption peak grew in faster toward the end, thus resulting
in a slight shifted absorption center.
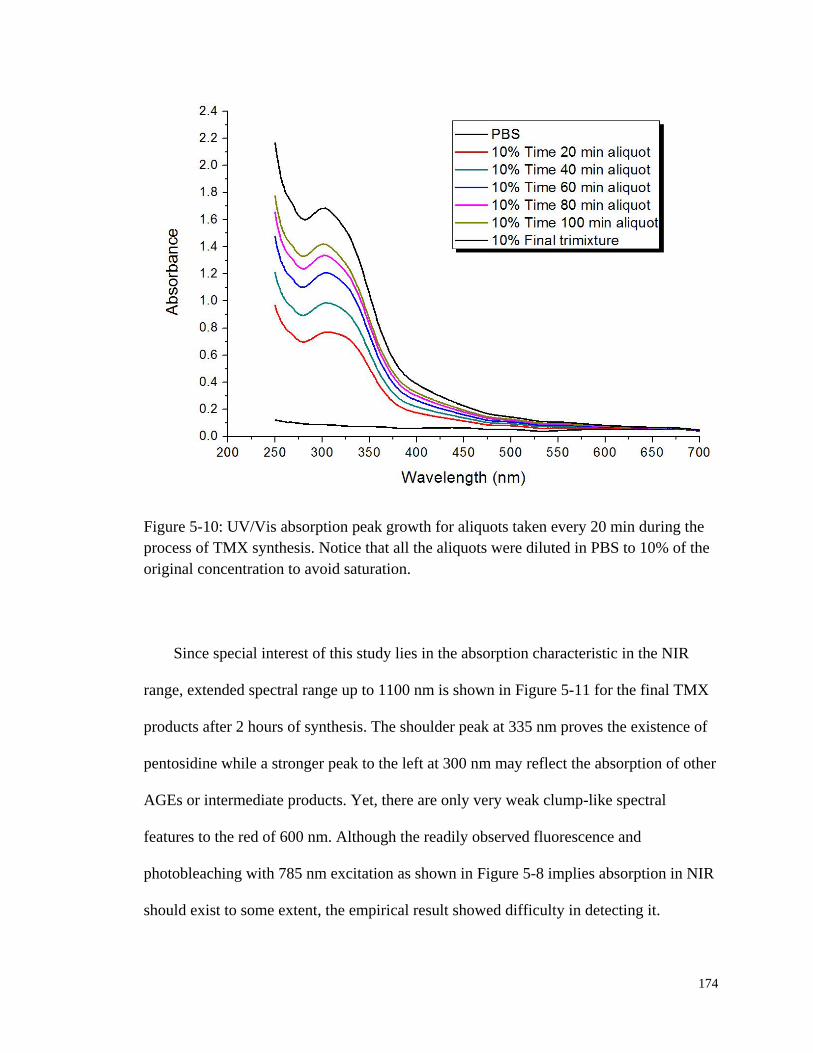
174
Figure 5-10: UV/Vis absorption peak growth for aliquots taken every 20 min during the
process of TMX synthesis. Notice that all the aliquots were diluted in PBS to 10% of the
original concentration to avoid saturation.
Since special interest of this study lies in the absorption characteristic in the NIR
range, extended spectral range up to 1100 nm is shown in Figure 5-11 for the final TMX
products after 2 hours of synthesis. The shoulder peak at 335 nm proves the existence of
pentosidine while a stronger peak to the left at 300 nm may reflect the absorption of other
AGEs or intermediate products. Yet, there are only very weak clump-like spectral
features to the red of 600 nm. Although the readily observed fluorescence and
photobleaching with 785 nm excitation as shown in Figure 5-8 implies absorption in NIR
should exist to some extent, the empirical result showed difficulty in detecting it.
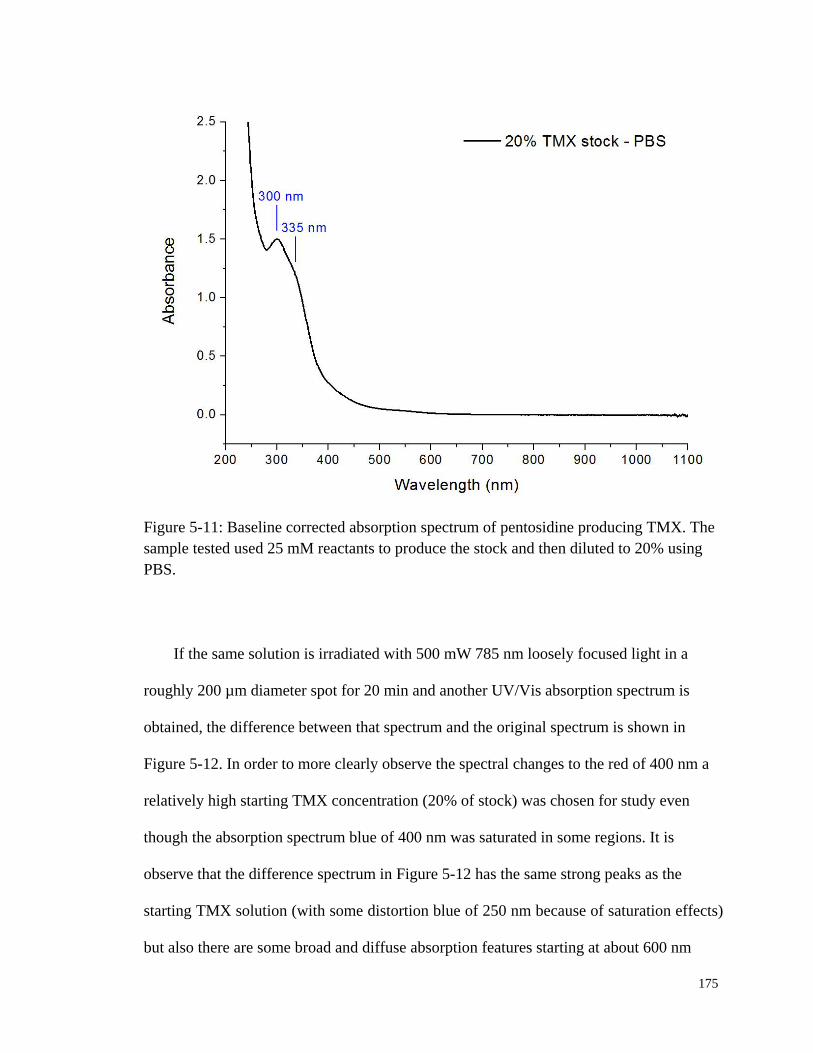
175
Figure 5-11: Baseline corrected absorption spectrum of pentosidine producing TMX. The
sample tested used 25 mM reactants to produce the stock and then diluted to 20% using
PBS.
If the same solution is irradiated with 500 mW 785 nm loosely focused light in a
roughly 200 µm diameter spot for 20 min and another UV/Vis absorption spectrum is
obtained, the difference between that spectrum and the original spectrum is shown in
Figure 5-12. In order to more clearly observe the spectral changes to the red of 400 nm a
relatively high starting TMX concentration (20% of stock) was chosen for study even
though the absorption spectrum blue of 400 nm was saturated in some regions. It is
observe that the difference spectrum in Figure 5-12 has the same strong peaks as the
starting TMX solution (with some distortion blue of 250 nm because of saturation effects)
but also there are some broad and diffuse absorption features starting at about 600 nm
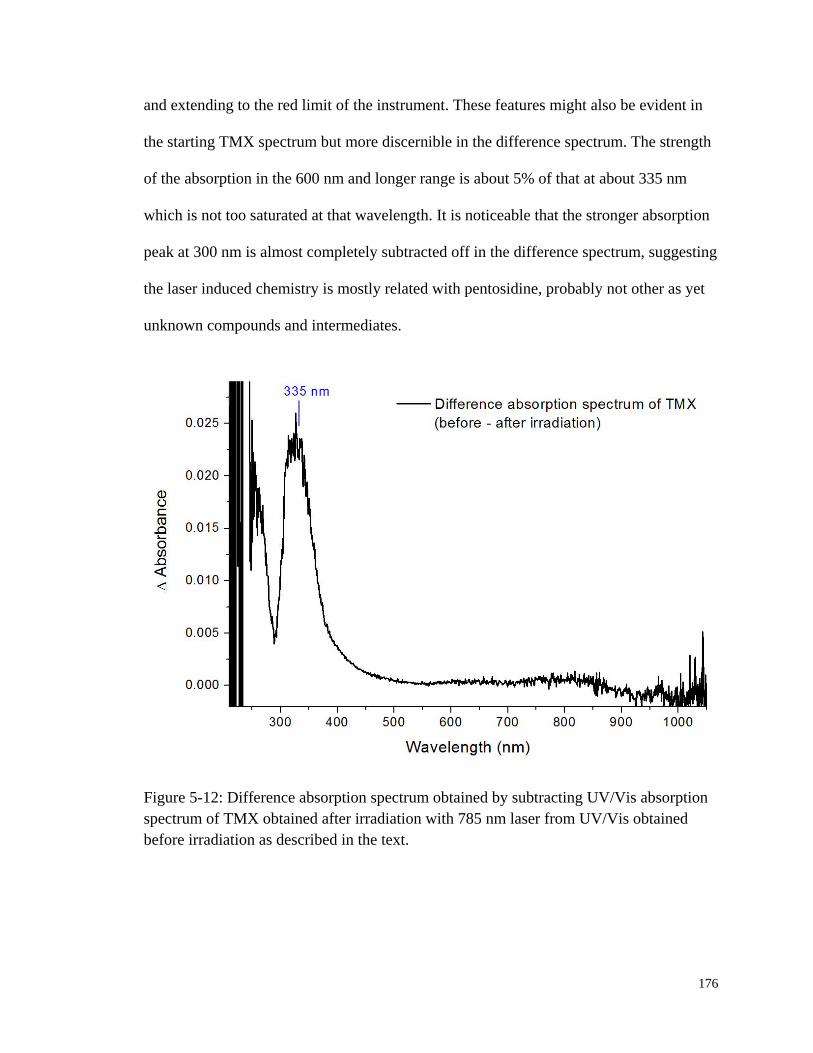
176
and extending to the red limit of the instrument. These features might also be evident in
the starting TMX spectrum but more discernible in the difference spectrum. The strength
of the absorption in the 600 nm and longer range is about 5% of that at about 335 nm
which is not too saturated at that wavelength. It is noticeable that the stronger absorption
peak at 300 nm is almost completely subtracted off in the difference spectrum, suggesting
the laser induced chemistry is mostly related with pentosidine, probably not other as yet
unknown compounds and intermediates.
Figure 5-12: Difference absorption spectrum obtained by subtracting UV/Vis absorption
spectrum of TMX obtained after irradiation with 785 nm laser from UV/Vis obtained
before irradiation as described in the text.

177
5.4.3 TMX Fluorescence with UV/Vis Excitation
The fluorescence excitation and emission spectra of TMX were collected and shown
in Figure 5-13, Figure 5-14, and Figure 5-15. The excitation/emission peak pair is
consistent with that reported by other groups (153). In addition, the emission was
extended into NIR spectral range to check the appearance of any possible emission.
Figure 5-13: Emission and excitation scans in UV/Vis spectral range for TMX at various
concentrations. The emission scans were extended to NIR range to check whether
emission could be observed. The insert is a close-up of the NIR spectral range from 600
nm to 950 nm. Though weak, fluorescence emission was observed.

178
Figure 5-14: NIR fluorescence of TMX at various concentrations. (top) Excitation scans
by detecting fluorescence emission at 785 nm and 830 nm respectively. These two
wavelengths correspond to the laser wavelengths used either in vivo or in vitro. (bottom)
Emission scans at two more UV/Vis excitation wavelengths, 372 nm and 385 nm.
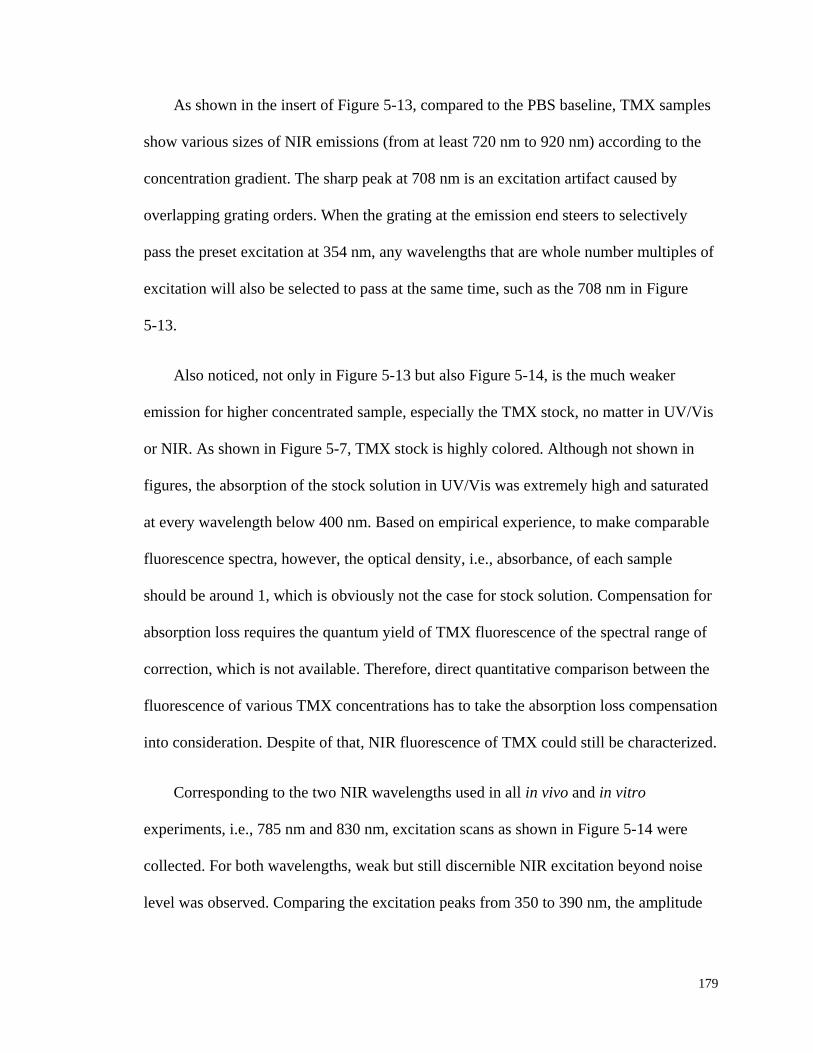
179
As shown in the insert of Figure 5-13, compared to the PBS baseline, TMX samples
show various sizes of NIR emissions (from at least 720 nm to 920 nm) according to the
concentration gradient. The sharp peak at 708 nm is an excitation artifact caused by
overlapping grating orders. When the grating at the emission end steers to selectively
pass the preset excitation at 354 nm, any wavelengths that are whole number multiples of
excitation will also be selected to pass at the same time, such as the 708 nm in Figure
5-13.
Also noticed, not only in Figure 5-13 but also Figure 5-14, is the much weaker
emission for higher concentrated sample, especially the TMX stock, no matter in UV/Vis
or NIR. As shown in Figure 5-7, TMX stock is highly colored. Although not shown in
figures, the absorption of the stock solution in UV/Vis was extremely high and saturated
at every wavelength below 400 nm. Based on empirical experience, to make comparable
fluorescence spectra, however, the optical density, i.e., absorbance, of each sample
should be around 1, which is obviously not the case for stock solution. Compensation for
absorption loss requires the quantum yield of TMX fluorescence of the spectral range of
correction, which is not available. Therefore, direct quantitative comparison between the
fluorescence of various TMX concentrations has to take the absorption loss compensation
into consideration. Despite of that, NIR fluorescence of TMX could still be characterized.
Corresponding to the two NIR wavelengths used in all in vivo and in vitro
experiments, i.e., 785 nm and 830 nm, excitation scans as shown in Figure 5-14 were
collected. For both wavelengths, weak but still discernible NIR excitation beyond noise
level was observed. Comparing the excitation peaks from 350 to 390 nm, the amplitude
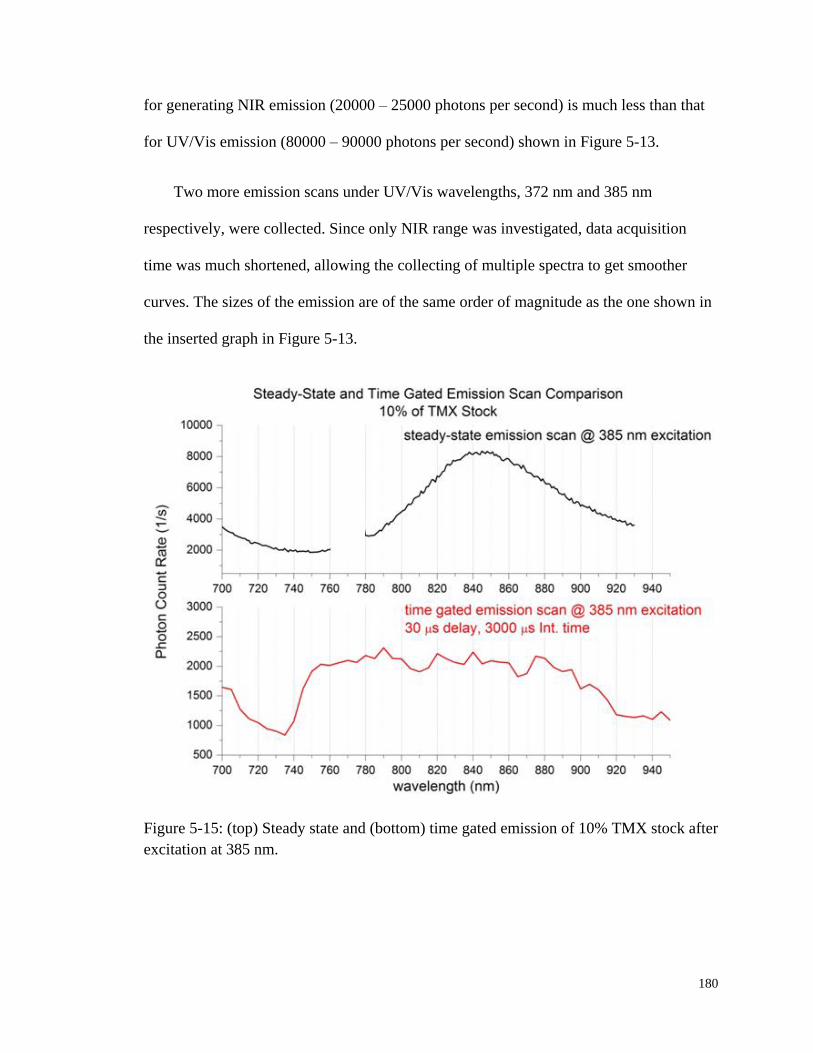
180
for generating NIR emission (20000 – 25000 photons per second) is much less than that
for UV/Vis emission (80000 – 90000 photons per second) shown in Figure 5-13.
Two more emission scans under UV/Vis wavelengths, 372 nm and 385 nm
respectively, were collected. Since only NIR range was investigated, data acquisition
time was much shortened, allowing the collecting of multiple spectra to get smoother
curves. The sizes of the emission are of the same order of magnitude as the one shown in
the inserted graph in Figure 5-13.
Figure 5-15: (top) Steady state and (bottom) time gated emission of 10% TMX stock after
excitation at 385 nm.

181
In addition to the observation of NIR emission from pentosidine containing TMX in
steady state fluorescence spectra, time correlated experiments as shown in Figure 5-15
showed the same emission, but with a 30 µs to 100 µs (no shown) delay. The time scale
of the delayed emission matches that of ISC mentioned in Section 5.2.2. This might
indicate a photochemical process involving the oxygen molecules dissolved in the solvent
system.
5.5 1O2 Involved Photochemistry of Pentosidine
5.5.1 Role of Dissolved Oxygen in Pentosidine Photobleaching
The observation of delayed emission encourages the consideration of a possible role
of dissolved gases. Given that most bleaching phenomena are oxidation reactions (175,
188-190), it is natural to explore the role of oxygen in the NIR excited autofluorescence
and photobleaching of TMX, i.e., pentosidine. Figure 5-16 shows a schematic depiction
of a hypothesis, where pentosidine acts as both a 1O2 sensitizer and scavenger. As
detailed in Section 5.2.2, ground state pentosidine gets excited by the incident photon to
its singlet excited state. Through ISC of a time scale from tenth to hundredth of seconds,
energy is transferred to a neighboring triplet excited state. If such triplet state satisfies all
the requirements as described in Section 5.2.2 to be a sensitizer, then the oxygen
molecules that are dissolved within the solvent can be excited to 1O2.
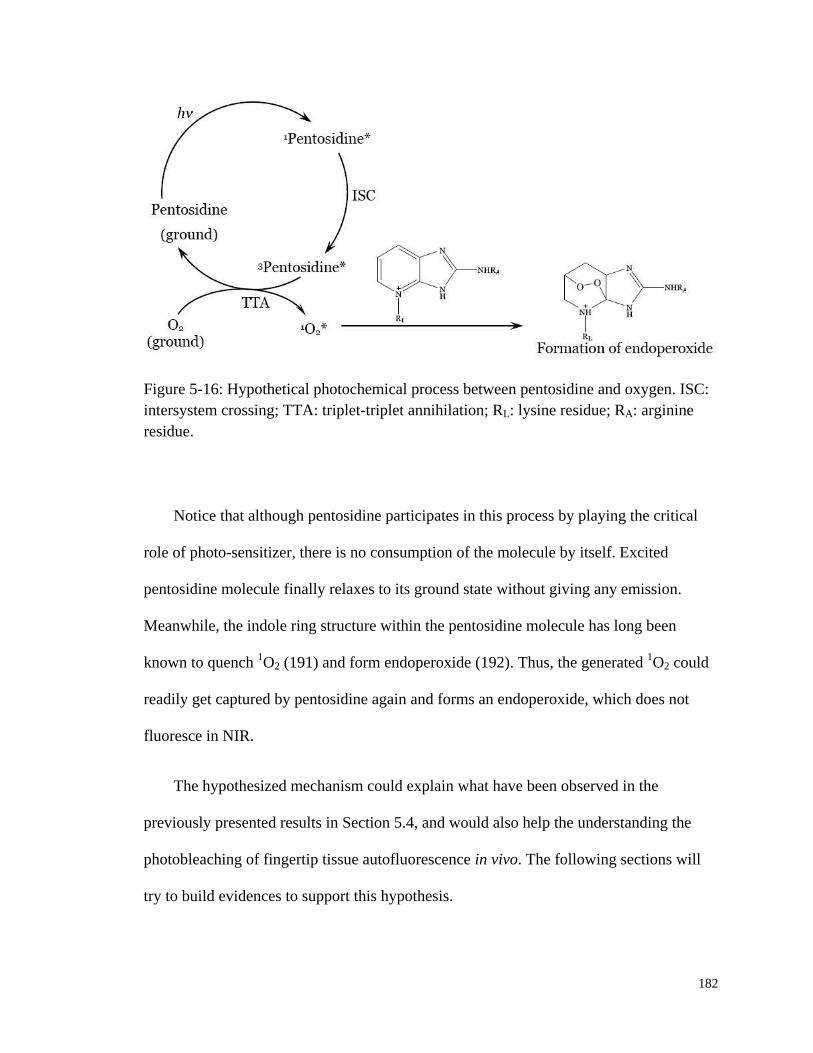
182
Figure 5-16: Hypothetical photochemical process between pentosidine and oxygen. ISC:
intersystem crossing; TTA: triplet-triplet annihilation; RL: lysine residue; RA: arginine
residue.
Notice that although pentosidine participates in this process by playing the critical
role of photo-sensitizer, there is no consumption of the molecule by itself. Excited
pentosidine molecule finally relaxes to its ground state without giving any emission.
Meanwhile, the indole ring structure within the pentosidine molecule has long been
known to quench 1O2 (191) and form endoperoxide (192). Thus, the generated
1O2 could
readily get captured by pentosidine again and forms an endoperoxide, which does not
fluoresce in NIR.
The hypothesized mechanism could explain what have been observed in the
previously presented results in Section 5.4, and would also help the understanding the
photobleaching of fingertip tissue autofluorescence in vivo. The following sections will
try to build evidences to support this hypothesis.
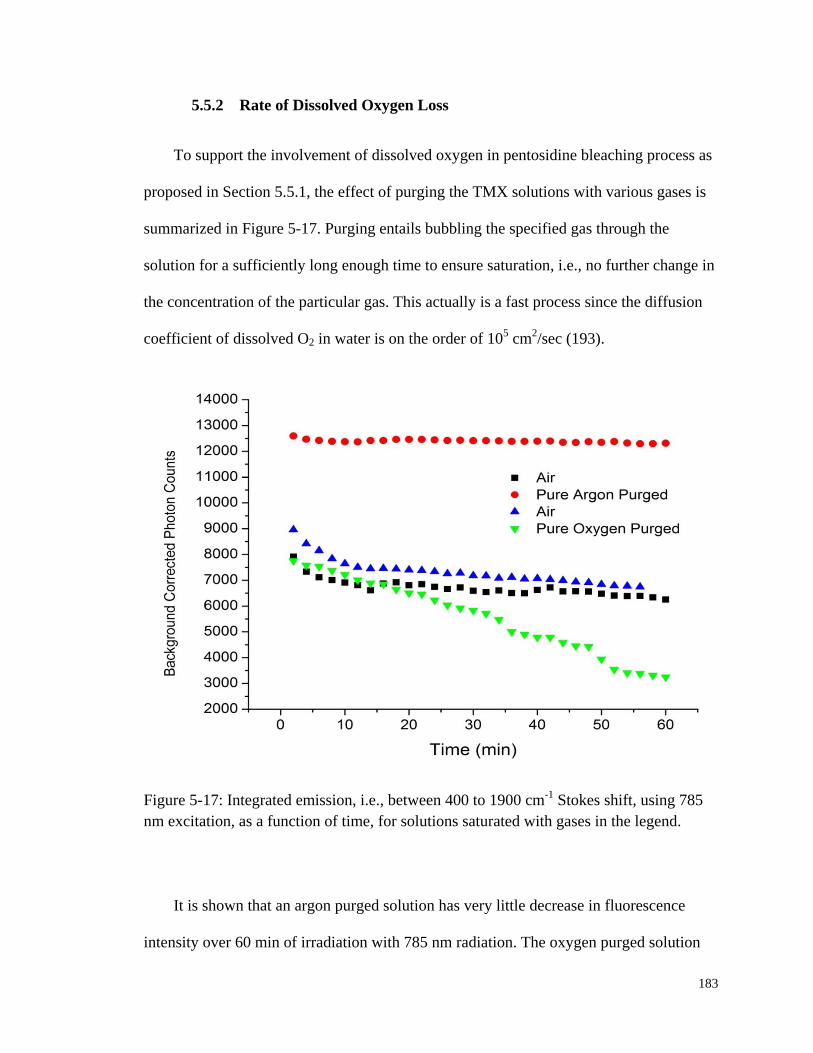
183
5.5.2 Rate of Dissolved Oxygen Loss
To support the involvement of dissolved oxygen in pentosidine bleaching process as
proposed in Section 5.5.1, the effect of purging the TMX solutions with various gases is
summarized in Figure 5-17. Purging entails bubbling the specified gas through the
solution for a sufficiently long enough time to ensure saturation, i.e., no further change in
the concentration of the particular gas. This actually is a fast process since the diffusion
coefficient of dissolved O2 in water is on the order of 105 cm
2/sec (193).
Figure 5-17: Integrated emission, i.e., between 400 to 1900 cm-1
Stokes shift, using 785
nm excitation, as a function of time, for solutions saturated with gases in the legend.
It is shown that an argon purged solution has very little decrease in fluorescence
intensity over 60 min of irradiation with 785 nm radiation. The oxygen purged solution

184
produces less IE than the solution in contact with air and only about half of that observed
from the argon purged solution. All solutions have a quick initial drop as if some emitting
species within the irradiated zone are quickly bleached and the later loss of emission are
slowed by the need for species to diffuse into the excitation-observation zone. Once again,
bear in mind that no stirring of mixing while bleaching curves were recorded. Purging
with oxygen produces an over 50% decrease during the same interval and purging with
air produces a decrease approximately 1/5 as much as the pure oxygen.
Given the obvious effect of oxygen on the bleaching of the TMX solution, i.e., the
decrease in fluorescence, an electrochemical oxygen sensor was employed to directly
observe the effect of 785 nm light irradiation on the oxygen concentration. It must be
noted from the outset that obtaining a saturated solution of a gas is much easier than
obtaining and maintaining any particular lesser concentration. Given this practical
challenge and limitation in experimental technique and methodology, the decrease in
oxygen partial pressure was still able to be observed in the irradiated volume of the TMX
solution for varying starting pressures of oxygen and dilutions of the TMX stock solution.
The best data are shown graphically in Figure 5-18 and Table 5-2. These four runs
compare the initial rates of oxygen loss, i.e., the slopes of the lines fit to the O2 vs. time
data in Figure 5-18, for varying TMX (in units of stock) and the same starting O2
concentration (in mV). Similarly, comparison could also be made to see the effect of
varying initial O2 concentrations with the same TMX concentration as shown in Table
5-2. The results in Table 5-2 are consistent with the empirical rate law given in Equation
5-1 in which the net rate of dissolved O2 loss is first order in both pentosidine and O2
concentration. Notice that the data in Figure 5-17 which is based on loss of fluorescence
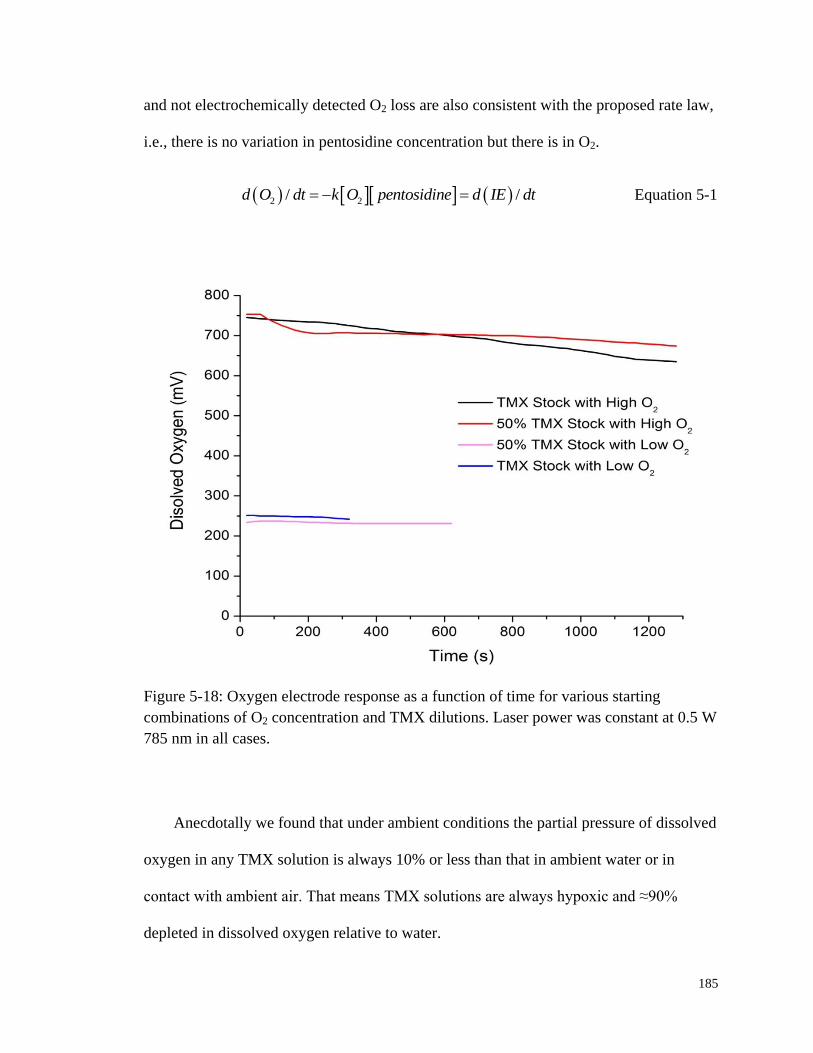
185
and not electrochemically detected O2 loss are also consistent with the proposed rate law,
i.e., there is no variation in pentosidine concentration but there is in O2.
2 2/ /d O dt k O pentosidine d IE dt Equation 5-1
Figure 5-18: Oxygen electrode response as a function of time for various starting
combinations of O2 concentration and TMX dilutions. Laser power was constant at 0.5 W
785 nm in all cases.
Anecdotally we found that under ambient conditions the partial pressure of dissolved
oxygen in any TMX solution is always 10% or less than that in ambient water or in
contact with ambient air. That means TMX solutions are always hypoxic and ≈90%
depleted in dissolved oxygen relative to water.
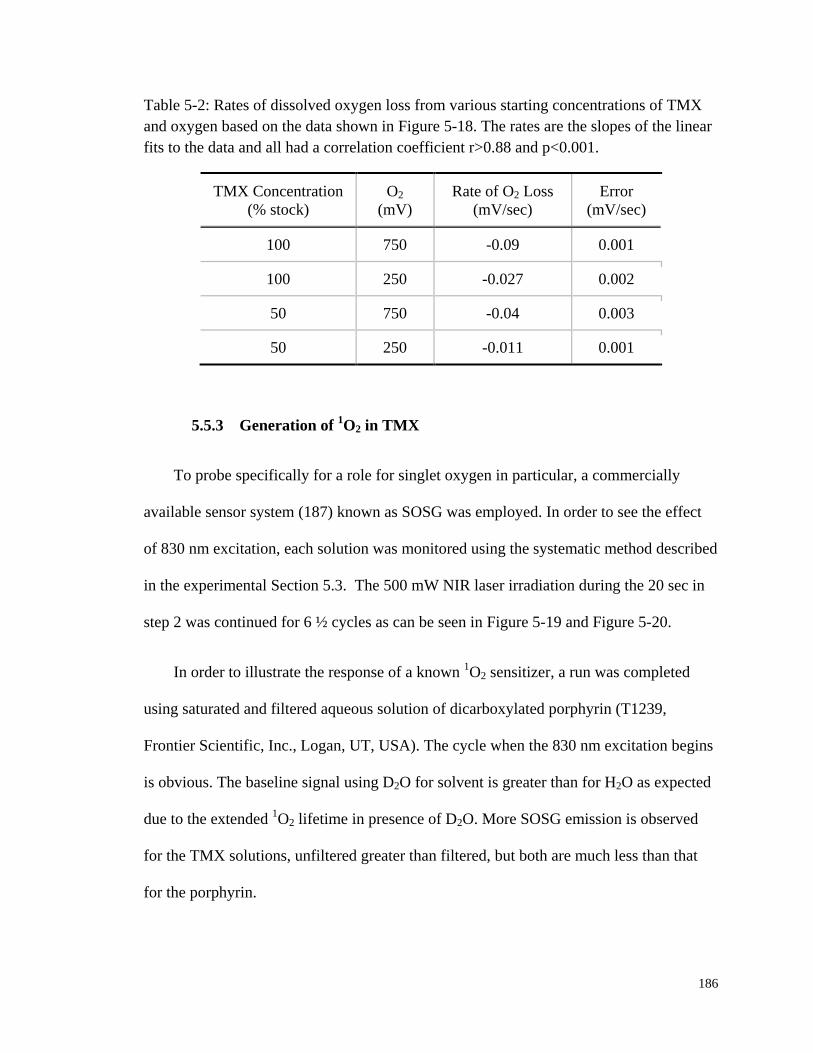
186
Table 5-2: Rates of dissolved oxygen loss from various starting concentrations of TMX
and oxygen based on the data shown in Figure 5-18. The rates are the slopes of the linear
fits to the data and all had a correlation coefficient r>0.88 and p<0.001.
TMX Concentration
(% stock)
O2
(mV)
Rate of O2 Loss
(mV/sec)
Error
(mV/sec)
100 750 -0.09 0.001
100 250 -0.027 0.002
50 750 -0.04 0.003
50 250 -0.011 0.001
5.5.3 Generation of 1O2 in TMX
To probe specifically for a role for singlet oxygen in particular, a commercially
available sensor system (187) known as SOSG was employed. In order to see the effect
of 830 nm excitation, each solution was monitored using the systematic method described
in the experimental Section 5.3. The 500 mW NIR laser irradiation during the 20 sec in
step 2 was continued for 6 ½ cycles as can be seen in Figure 5-19 and Figure 5-20.
In order to illustrate the response of a known 1O2 sensitizer, a run was completed
using saturated and filtered aqueous solution of dicarboxylated porphyrin (T1239,
Frontier Scientific, Inc., Logan, UT, USA). The cycle when the 830 nm excitation begins
is obvious. The baseline signal using D2O for solvent is greater than for H2O as expected
due to the extended 1O2 lifetime in presence of D2O. More SOSG emission is observed
for the TMX solutions, unfiltered greater than filtered, but both are much less than that
for the porphyrin.

187
Figure 5-19: SOSG monitoring of 1O2 for different solutions with and without NIR laser
irradiation. Blue stripes indicate the 30 sec 488/525 nm excitation/emission fluorometer
measurement cycle. Yellow stripes indicate 20 sec 500 mW 830 nm CW laser irradiation.
Whereas laser irradiation of porphyrin produced a large sustained increase in
reported emission and thus 1O2 signal, both TMX solutions only produced a decrease in
the loss of emission. Porphyrin produces a stronger SOSG response than TMX does
partially because of a greater porphyrin concentration. Also, pentosidine appears much
more vulnerable to be attacked by 1O2. Thus in Figure 5-19 there is no evidence for
pooling of 1O2 for the TMX samples.
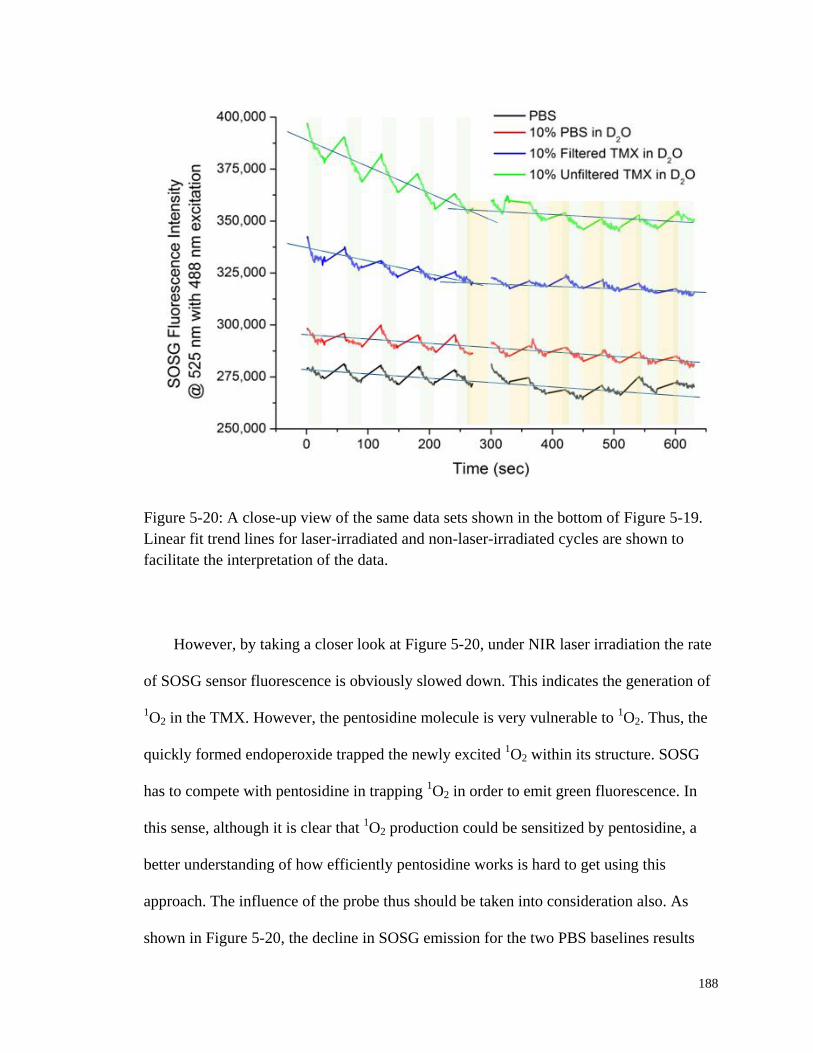
188
Figure 5-20: A close-up view of the same data sets shown in the bottom of Figure 5-19.
Linear fit trend lines for laser-irradiated and non-laser-irradiated cycles are shown to
facilitate the interpretation of the data.
However, by taking a closer look at Figure 5-20, under NIR laser irradiation the rate
of SOSG sensor fluorescence is obviously slowed down. This indicates the generation of
1O2 in the TMX. However, the pentosidine molecule is very vulnerable to
1O2. Thus, the
quickly formed endoperoxide trapped the newly excited 1O2 within its structure. SOSG
has to compete with pentosidine in trapping 1O2 in order to emit green fluorescence. In
this sense, although it is clear that 1O2 production could be sensitized by pentosidine, a
better understanding of how efficiently pentosidine works is hard to get using this
approach. The influence of the probe thus should be taken into consideration also. As
shown in Figure 5-20, the decline in SOSG emission for the two PBS baselines results
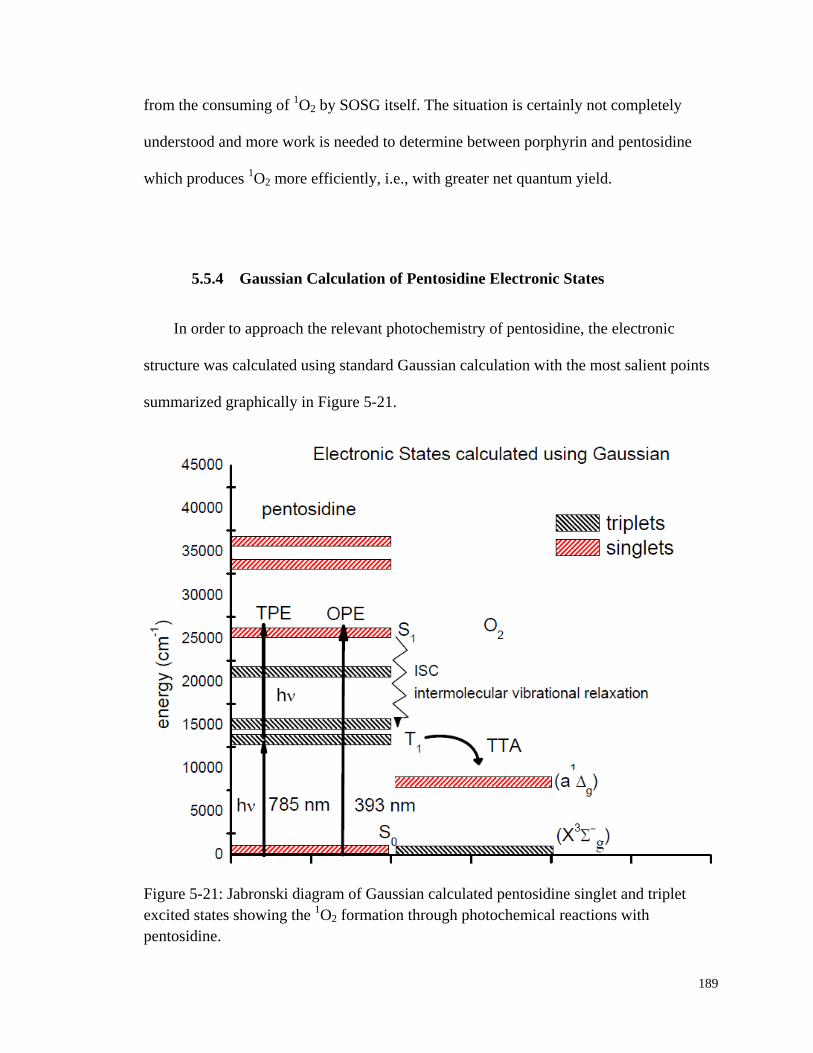
189
from the consuming of 1O2 by SOSG itself. The situation is certainly not completely
understood and more work is needed to determine between porphyrin and pentosidine
which produces 1O2 more efficiently, i.e., with greater net quantum yield.
5.5.4 Gaussian Calculation of Pentosidine Electronic States
In order to approach the relevant photochemistry of pentosidine, the electronic
structure was calculated using standard Gaussian calculation with the most salient points
summarized graphically in Figure 5-21.
Figure 5-21: Jabronski diagram of Gaussian calculated pentosidine singlet and triplet
excited states showing the 1O2 formation through photochemical reactions with
pentosidine.
190
The positions of the strongest UV/Vis absorption features in Figure 5-11 could be
rationalized given calculated positions of the singlet states and strengths, i.e., f values of
the transitions from the ground states (f = 0.30). According to the Gaussian calculation
for pentosidine there are no allowed one photon transitions involving NIR excitation at
all. Nevertheless the observed photobleaching and other observed “actions” caused by
NIR irradiation are obvious and energetically well-defined. For example it is clear from
difference spectrum in Figure 5-12 that one of the carriers of the spectrum in Figure 5-11,
i.e., pentosidine, is consumed by the action of the laser. The ratio of the two calculated f
values for the S0 → T1 (f = 0.02) and S0 → S1 (f = 0.30) transitions is roughly equal to the
ratio of the induced NIR absorption near ≈800 nm to that near ≈390 nm in the difference
spectrum in Figure 5-12. This reinforces the suggestion that 1) the difference spectrum is
that of a single species, i.e., pentosidine, and 2) that pentosidine itself is consumed by the
1O2.
Figure 5-13 and Figure 5-15 also show that direct one photon excitation (OPE) into
the predicted lowest excited singlet state (385 nm) produces copious UV/Vis emission as
reported by Monnier but also delayed emission across a wide range of NIR wavelengths
in accord with the predicted presence of relatively low lying triplet states for pentosidine
across the appropriate energy range. Because this emission can be observed in steady
state and in single photon time resolved mode, it can be concluded that NIR excitation
produces a long lived species associated with NIR emission that actually pools to some
undetermined extent.
The requirement that this species might be connected to oxygen is clearly
demonstrated by the purging experiments and the oxygen electrode experiments. That
191
D2O produced greater evidence of this species than experiments in H2O solvent in Figure
5-20 is also a specific connection to known 1O2 photochemistry. The specificity of SOSG
for singlet oxygen as opposed to superoxide, or any peroxide strongly supports the
mechanism depicted in Figure 5-16 and Figure 5-21.
To explain this mechanism and the subsequent reaction sequence that results in
photobleaching it is first asserted that in condensed phases, NIR or UV/Vis absorption
features are broad and that 5-10 nm variation in exact wavelength of excitation is not of
any consequence. Furthermore, the accuracy of the Gaussian calculations is far from
perfect. Small differences between the experimental results and the calculation are quite
consistent with the explanation provided.
Indeed, the ZINDO formalism applied to this problem is inappropriate to the extent
that the molecule is charged since ZINDO is only applicable to closed shell systems.
There are a number of resonance structures for pentosidine and some are charged and
others are not. The value of this calculation is to validate the possibility that pentosidine
has low lying triplet states available to participate in singlet oxygen sensitization. Future
experiments with solutions of the pure authentic material can reveal the solution
ionization states and these are planned.
It is essential to realize that two photon excitation (TPE) using a continuous wave
(CW) laser is commonplace in fluorescence microscopy (194, 195) and as shown in
Figure 5-21, the energy of two NIR photons is roughly resonant with the lowest energy
allowed one photon transition. The presence of near resonant interactions between lower
lying states and the incident photons makes the absorption of addition photons after the
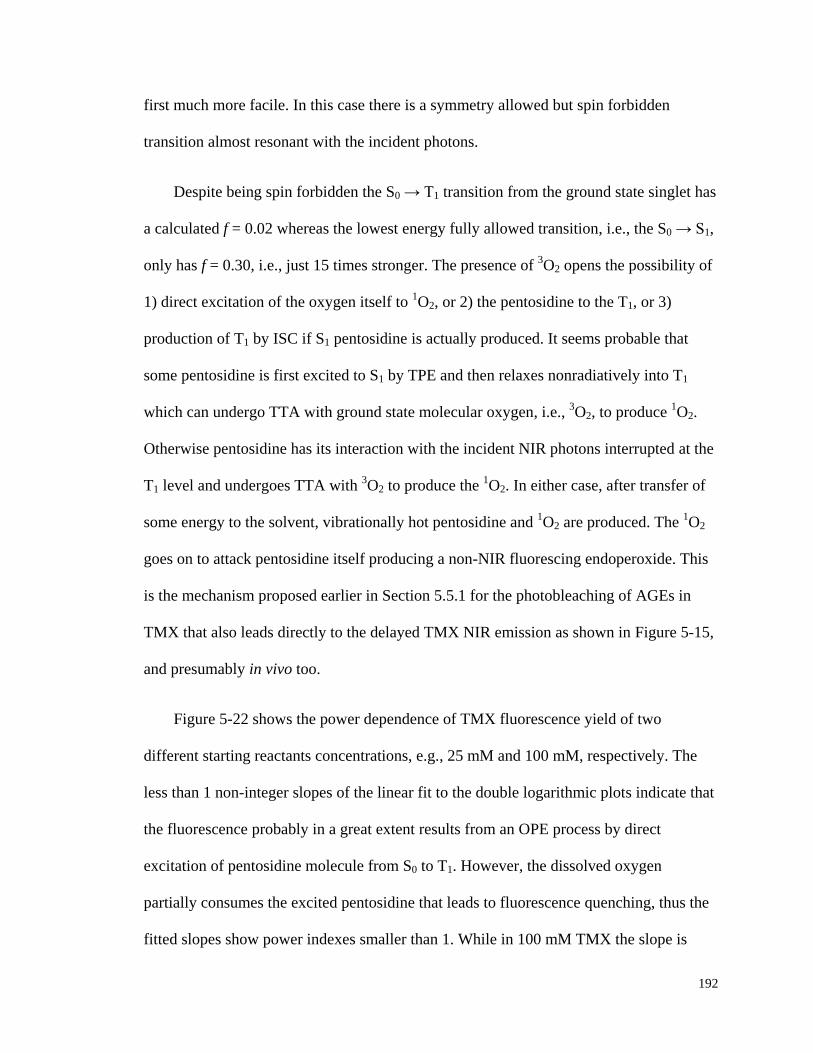
192
first much more facile. In this case there is a symmetry allowed but spin forbidden
transition almost resonant with the incident photons.
Despite being spin forbidden the S0 → T1 transition from the ground state singlet has
a calculated f = 0.02 whereas the lowest energy fully allowed transition, i.e., the S0 → S1,
only has f = 0.30, i.e., just 15 times stronger. The presence of 3O2 opens the possibility of
1) direct excitation of the oxygen itself to 1O2, or 2) the pentosidine to the T1, or 3)
production of T1 by ISC if S1 pentosidine is actually produced. It seems probable that
some pentosidine is first excited to S1 by TPE and then relaxes nonradiatively into T1
which can undergo TTA with ground state molecular oxygen, i.e., 3O2, to produce
1O2.
Otherwise pentosidine has its interaction with the incident NIR photons interrupted at the
T1 level and undergoes TTA with 3O2 to produce the
1O2. In either case, after transfer of
some energy to the solvent, vibrationally hot pentosidine and 1O2 are produced. The
1O2
goes on to attack pentosidine itself producing a non-NIR fluorescing endoperoxide. This
is the mechanism proposed earlier in Section 5.5.1 for the photobleaching of AGEs in
TMX that also leads directly to the delayed TMX NIR emission as shown in Figure 5-15,
and presumably in vivo too.
Figure 5-22 shows the power dependence of TMX fluorescence yield of two
different starting reactants concentrations, e.g., 25 mM and 100 mM, respectively. The
less than 1 non-integer slopes of the linear fit to the double logarithmic plots indicate that
the fluorescence probably in a great extent results from an OPE process by direct
excitation of pentosidine molecule from S0 to T1. However, the dissolved oxygen
partially consumes the excited pentosidine that leads to fluorescence quenching, thus the
fitted slopes show power indexes smaller than 1. While in 100 mM TMX the slope is
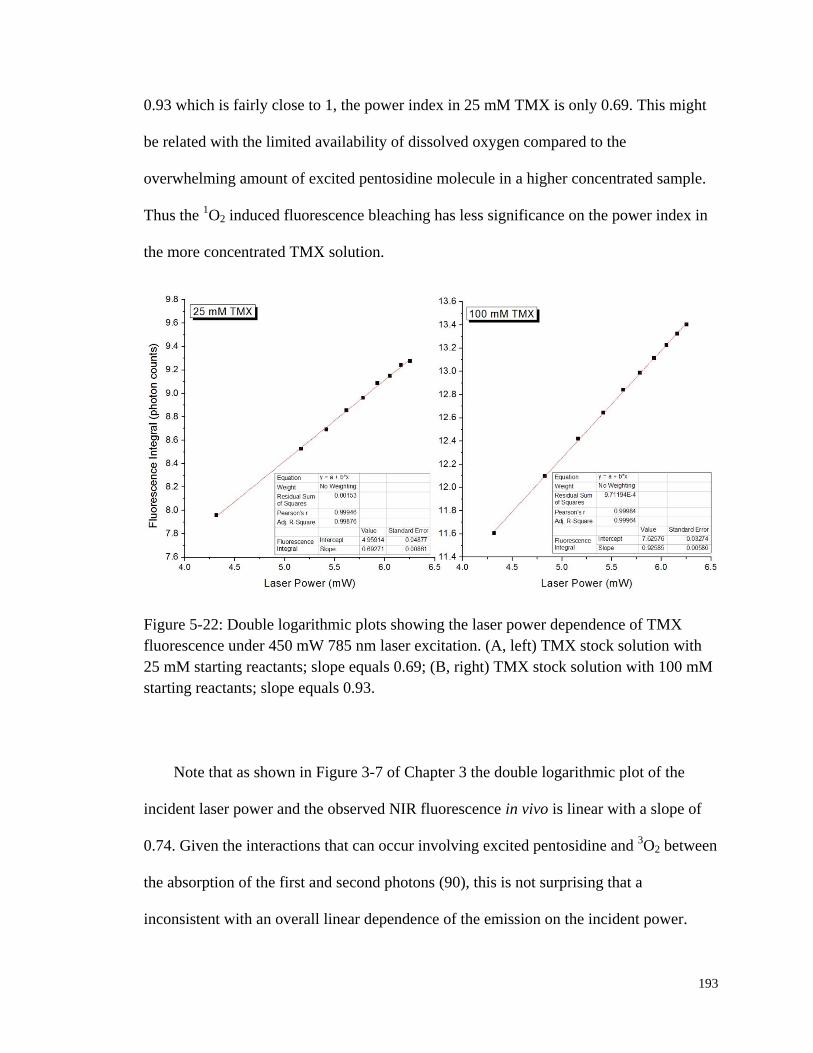
193
0.93 which is fairly close to 1, the power index in 25 mM TMX is only 0.69. This might
be related with the limited availability of dissolved oxygen compared to the
overwhelming amount of excited pentosidine molecule in a higher concentrated sample.
Thus the 1O2 induced fluorescence bleaching has less significance on the power index in
the more concentrated TMX solution.
Figure 5-22: Double logarithmic plots showing the laser power dependence of TMX
fluorescence under 450 mW 785 nm laser excitation. (A, left) TMX stock solution with
25 mM starting reactants; slope equals 0.69; (B, right) TMX stock solution with 100 mM
starting reactants; slope equals 0.93.
Note that as shown in Figure 3-7 of Chapter 3 the double logarithmic plot of the
incident laser power and the observed NIR fluorescence in vivo is linear with a slope of
0.74. Given the interactions that can occur involving excited pentosidine and 3O2 between
the absorption of the first and second photons (90), this is not surprising that a
inconsistent with an overall linear dependence of the emission on the incident power.

194
5.6 Conclusions
Nonenzymatic glycation and oxidation of ubiquitous proteins in vivo leads to
irreversible formation of AGEs. Due to their relatively long half life and low clearance
rate AGEs tend to accumulate within static tissues and the circulatory system. Spectra
obtained using 830 nm NIR excitation suggest that the so-called “autofluorescence” from
all tissues has a finite number of sources. But the fact that senior and diabetic subjects
produce more than other members of the general population suggests that a significant
portion of the total autofluorescence from all sources originates from AGEs. Using
pentosidine generated in a reaction mixture as representative, an in vitro study unveiled
very similar fluorescence and photobleaching pattern as observed for autofluorescence in
vivo. A series of oxygen, air and argon purging experiments on the TMX suggest that
pentosidine is a singlet oxygen sensitizer and secondary reactions between the
pentosidine itself and/or other fluorophores and the photosensitized singlet oxygen
explain the observed photobleaching. Ab initio Gaussian calculations on pentosidine
reveal the existence of low-lying triplet excited states required for the sensitization of
ground state oxygen. A commercially available product known as SOSG that specifically
serves as a singlet oxygen detection reagent suggests the generation of singlet oxygen
from NIR irradiated pentosidine TMX. This study provides one definite chemical
mechanism for understanding in vivo human skin autofluorescence and photobleaching.

195
6. OVERALL DISCUSSION, FUTURE WORK AND
CONCLUSIONS
6.1 Overall Discussion
The goal of the research presented in the dissertation is to better understand and
hopefully overcome two major obstacles, i.e., fluorescence and human factors, in
noninvasive in vivo blood analysis using Raman spectroscopy. Therefore, the research
seeks solutions in two seemingly irrelevant fields: one is more engineering and the other
one is more chemistry. Nevertheless, they are both critical to this study due to their close
relationships with the underlying physiological process, in other words, the human tissue
properties and blood flow dynamics.
We have established that maintaining a good contact and steady pressure helps
generate data with less random errors and uncertainty. With better reproducibility of the
collected spectra, it could be expected to reduce the experimental length. And this could
in turn further alleviates the influence of human factors. However, one should be aware
of the fact that the selection of optimal pressure is of equal importance. Since the optical
geometry of our in vivo apparatus only allows a penetration to less than 200 µm of the
most superficial blood-filled volume of the epidermis, the delicate capillary wall is
sensitive to tissue deformation either related with external pressure or not.
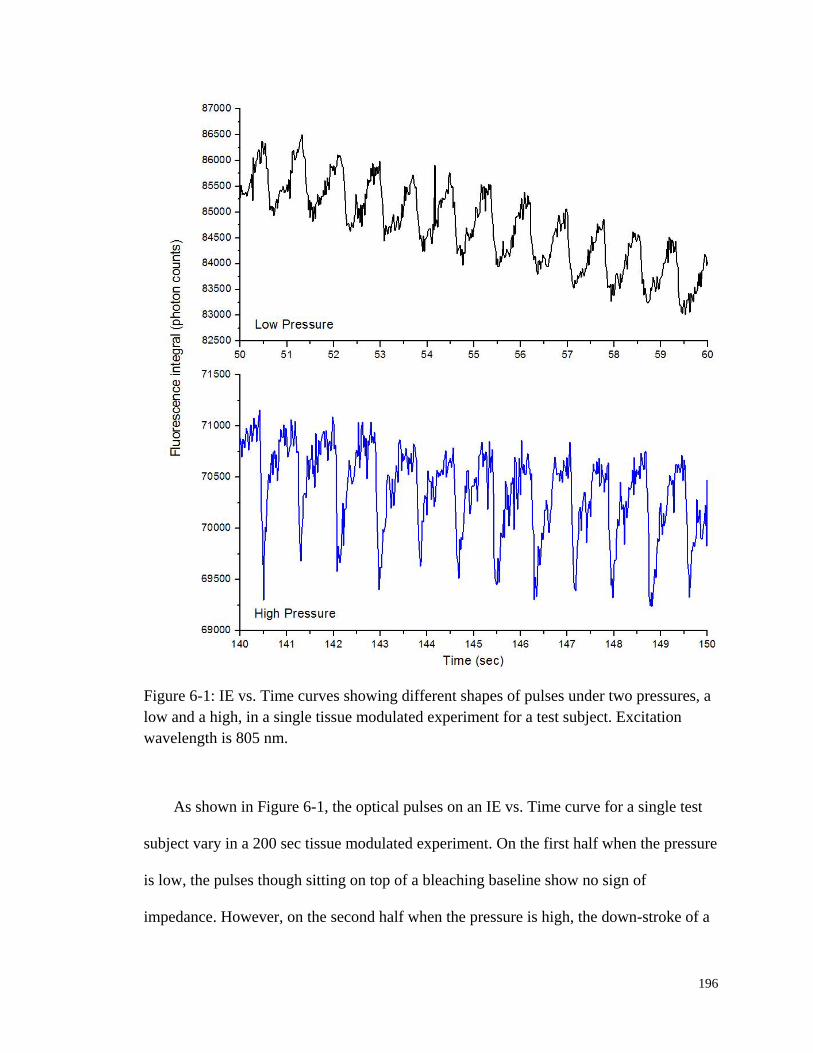
196
Figure 6-1: IE vs. Time curves showing different shapes of pulses under two pressures, a
low and a high, in a single tissue modulated experiment for a test subject. Excitation
wavelength is 805 nm.
As shown in Figure 6-1, the optical pulses on an IE vs. Time curve for a single test
subject vary in a 200 sec tissue modulated experiment. On the first half when the pressure
is low, the pulses though sitting on top of a bleaching baseline show no sign of
impedance. However, on the second half when the pressure is high, the down-stroke of a

197
pulse is much sharper than the up-stroke. Although it has not been verified, we speculate
that under high modulated pressure the capillaries are constantly squeezed but depending
on the relative pressures they get dilated upon arrivals of cardiac pulses. However,
halfway between relaxing from systolic to diastolic, the external pressure forces the blood
vessels to close, thus causing the abrupt drops on the optical pulses.
The phenomenon observed in Figure 6-1 not only further validates that our spectra
do contain information directly from blood but also justified the importance of
controlling experimental conditions including human factors. The two quantities that we
extract useful information from, i.e., EE and IE, are very sensitive to the relative volume
fraction changes of the three phases, i.e., static tissue, plasma and RBCs. And these
volume fractions could be easily disturbed by not tightly controlled human factors. Thus,
without proper apparatus, i.e., PDPM, that could address these issues, random errors
could not be effectively controlled which might lead to inaccurate interpretation of the
spectral results. This is of extreme importance in our noninvasive in vivo Hct monitoring
protocol.
However, it has to be pointed out that in order to allow PDPM perform the way it is
supposed to, the test subject should act passively pretending to be unconscious.
Practically, no automated self-compensated human machine interface could possibly
function without the compliance of the subjects. To facilitate evaluating the compliance,
real-time pressure, force and contact areas are logged along the acquisition of spectral
signals. These could be used as a separate piece of information to rule out any collected
spectra that are suspicious to involve human interference.
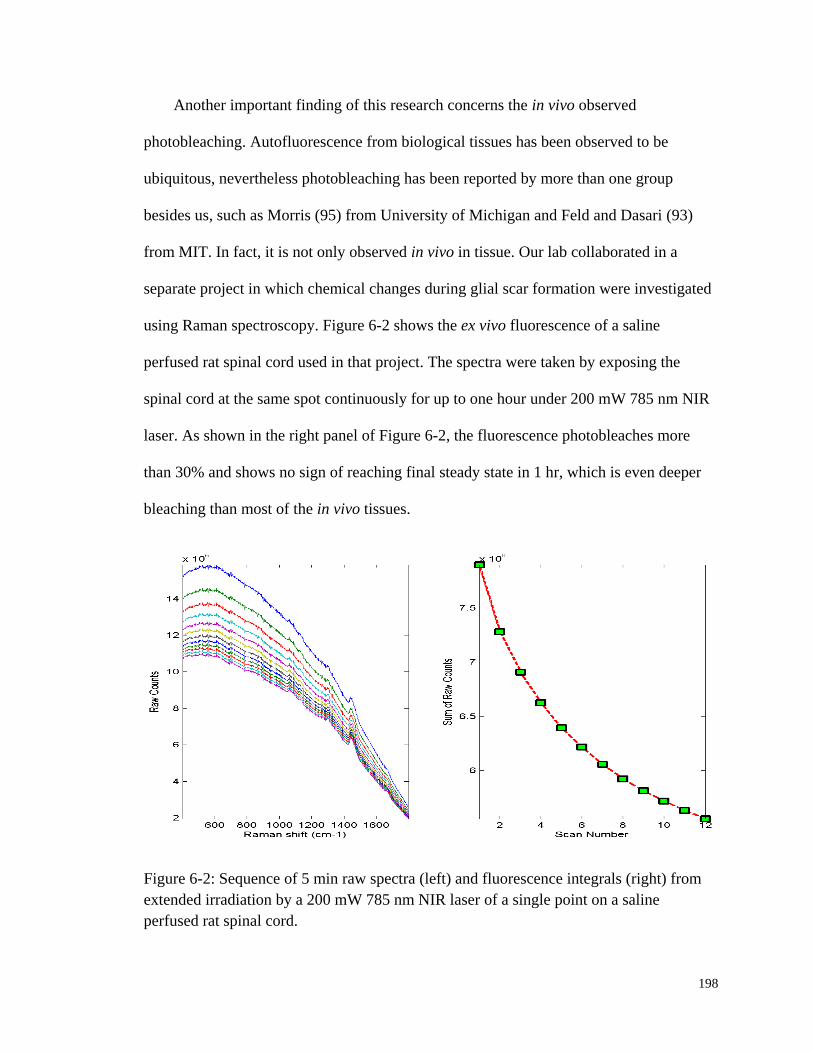
198
Another important finding of this research concerns the in vivo observed
photobleaching. Autofluorescence from biological tissues has been observed to be
ubiquitous, nevertheless photobleaching has been reported by more than one group
besides us, such as Morris (95) from University of Michigan and Feld and Dasari (93)
from MIT. In fact, it is not only observed in vivo in tissue. Our lab collaborated in a
separate project in which chemical changes during glial scar formation were investigated
using Raman spectroscopy. Figure 6-2 shows the ex vivo fluorescence of a saline
perfused rat spinal cord used in that project. The spectra were taken by exposing the
spinal cord at the same spot continuously for up to one hour under 200 mW 785 nm NIR
laser. As shown in the right panel of Figure 6-2, the fluorescence photobleaches more
than 30% and shows no sign of reaching final steady state in 1 hr, which is even deeper
bleaching than most of the in vivo tissues.
Figure 6-2: Sequence of 5 min raw spectra (left) and fluorescence integrals (right) from
extended irradiation by a 200 mW 785 nm NIR laser of a single point on a saline
perfused rat spinal cord.
199
The first thing to mention is that the spinal cord was thoroughly perfused with saline
water before testing. Therefore, little blood if any is present in such ex vivo sample. But
still, substantial photobleaching is observed. Although central nervous system tissue
bears very different cell types from skin tissues, the chemical constituents of cytosol and
extracellular matrix (113) are not that distinct at all. Therefore, in another angle the
photobleaching observed in Figure 6-2 supports our conclusion that it is static tissue not
blood that contributes the majority of the fingertip tissue photobleaching.
Another interesting phenomenon is that the fluorescence from saline perfused cord
not only bleaches but also bleaches in significant amount. Based on our in vitro study in
Chapter 4 and 5, only five major tissue constituents, i.e., plasma, Hb, melanin, collagen,
and AGEs, are narrowed down as contributors to the observed skin fluorescence and
photobleaching. Obviously, there is no melanin in spinal cord and only trace amounts of
Hb and plasma in the saline perfused rate spinal cord. Spinal cord does have collagen in
its extracellular matrix, but our in vitro results show that collagen by itself does not
bleach. However, when it gets crosslinked with sugars the resulting AGEs fluoresce and
also bleach substantially. As shown in Table 5-1, the outmost layer of the meninges
surrounding spinal cord, i.e., dura mater, contains the second highest levels of
pentosidine among the tissues investigated (153). Thus, it is speculated that
photobleaching of AGEs may play an important part here.
In the effort to associate our in vivo observed fingertip autofluorescence
photobleaching with static tissue and blood constituents, we performed a series of
systematic in vitro studies. Comparing Hb bleaching curves shown in Figure 4-16 with
pentosidine and melanin bleaching curves in Figure 5-8 and Figure 4-13, Hb only
200
bleaches 1% within 20 min while pentosidine and melanin bleaches more than 15% in an
hour. Both melanin and AGEs show stronger potential of photobleaching than Hb. But, as
stated previously, the in vitro environment of these tissue constituents are quite different
from in vivo. Therefore, these results could only offer limited explanations to what is
happening in vivo.
For purposes of understanding the role of the autofluorescence and photobleaching
in the technology of noninvasive blood and tissue analysis by NIR spectroscopy, the
results suggest that NIR emission per unit volume likely changes somewhat from test
subject to test subject. Nevertheless, our study shows that the possible interferences are
not that serious and can be overcome. For a single test subject in comparison with him or
herself, using fluorescence as a volume normalizer is quite adequate. Since the bleached
tissue does not easily recover after up to several hours, utilizing a reasonable
prebleaching period in a consistent manner in order to remove the contribution of the
bleachable components could provide a consistent basis for utilizing the fluorescence as a
volume normalizer.
With regard to calibration across test subjects the situation is more complicated.
Whereas the disposition of many of the most potent chromophores, specifically AGEs,
are defined by homeostasis in relation to eating, lifestyle and other habits, as well as other
factors like test subject disease state, i.e., whether the test subject is diabetic or not. The
AGE emission has the appropriate characteristics to account for all of the in vivo
observations. Clearly, whatever else occurs in vivo it is occurring in addition to the
possible sources we have described in this thesis.

201
So while we project no pretense that the experiments described in this paper are
exhaustive for all potential NIR chromophores, we do suggest that it is possible that we
have identified the major related cause of the observed in vivo NIR emission and its
characteristics. Indeed the fluorescence and bleaching under UV/Vis excitation are the
basis for new devices and protocols proposed by other researchers to screen for diabetes
(162), and the statistics for the success of these approaches are reasonable so far. Thus it
is clear that the effects and manifestations of AGEs must be large enough compared to all
other contributors.
Clearly the photobleaching issue matters in all measurements where IE is involved
quantitatively, such as our glucose measurements as well as the newly proposed
noninvasive in vivo Hct monitoring algorithm. Utilizing the separated IE and EE light
that carry two independent physical and chemical properties of the irradiated tissue, we
provided empirical calibrations for our noninvasive Hct algorithm based on a model that
is consistent with the anatomy, function of the skin and the geometry of the probing. Our
primary goal is simply to show that it is possible to monitor changes in the Hct by
analyzing scattering intensities. And its feasibility has been well justified.
The results presented in this thesis suggest an ability to monitor Hct continuously on
a 20 ms or less measurement time scale and with apparently high sensitivity, i.e., Hct
change of 0.02 in tens of seconds. This is encouraging but much needs to be done to
assess the true accuracy, precision, and sensitivity of this measurement. We note that
fluorescence based techniques are essentially zero background measurements that
typically permit 100–1000 times smaller detection limits (196) for absolute
concentrations and changes in concentration compared to absorption-based techniques.

202
However, so far absolute Hct values could not be offered directly from our approach.
Nevertheless, Leypoldt et al. (99) have demonstrated that potentially useful clinical
information is contained in monitoring relative variation from homeostasis of Hct and
fluid volumes, which are the earliest indicators of internal hemorrhage.
Figure 6-3: Correlation between standard HemoCue Hb hemoglobin measurements and
LighTouchTM
Hematocrit measurements.
As shown in Figure 6-3, although there is clearly a correlation between
LighTouchTM
Hct measurements and HemoCue hemoglobin readings, the physiological
implications of changes (197) in the two quantities are what determines the utility of their
measurement to a practitioner. Total Hb relates more to the oxygen-carrying capacity of

203
the blood, whereas Hct relates more to the viscosity of the blood and may therefore
present more unambiguous indications of impending circulatory collapse.
Recognizing the unique and irreplaceable clinical values of Hct, other groups have
been exploring ways to realize noninvasive Hct monitoring (99-101, 198). Leypoldt et
al.(99) have analyzed extracorporeal blood in the ultrafiltration unit to guide dialysis
therapy in renal patients. This approach is only “noninvasive” to a dialysis patient. Using
a truly noninvasive transcutaneous optical approach Jeon et al. (101) reported an absolute
mean percent error in estimating absolute Hct within ±8.3% (σ±3.67). However, to our
knowledge, all these currently existing noninvasive optical approaches to Hct exploit the
coupled oxy/deoxy Hb absorption spectra using at least one Hb isosbestic point(s) (e.g.,
at 569 or 805 nm). Since Hct could not be measured based only on one piece of Hb
absorption information, empirical calibrations of Twersky’s treatment (199) is applied, in
which it is assumed that the Hb concentration (in g/dL) is 35 times of Hct.
Table 6-1: Erythrocytometric values for “apparently healthy” white and black subjects of
different ages (42).
Subjects
Erythrocytes
Hct
Hb
concentration in
whole blood
Mean
corpuscular
Hb
concentration
Number
concentration
in whole
blood
Mean
corpuscular
volume
Mean 95%
range Mean
95%
range Mean 95%
range
Mean 95%
range Mean
95%
range
1012/L fL g/dL
Adults
Men 5.1 4.3-5.9 90 80-100 0.47 0.39-0.55 15.1 13.9-16.3 34 31-37
Adults
Women 4.5 3.5-5.5 88 79-98 0.42 0.36-0.48 13.5 12.0-15.0 35 30-36
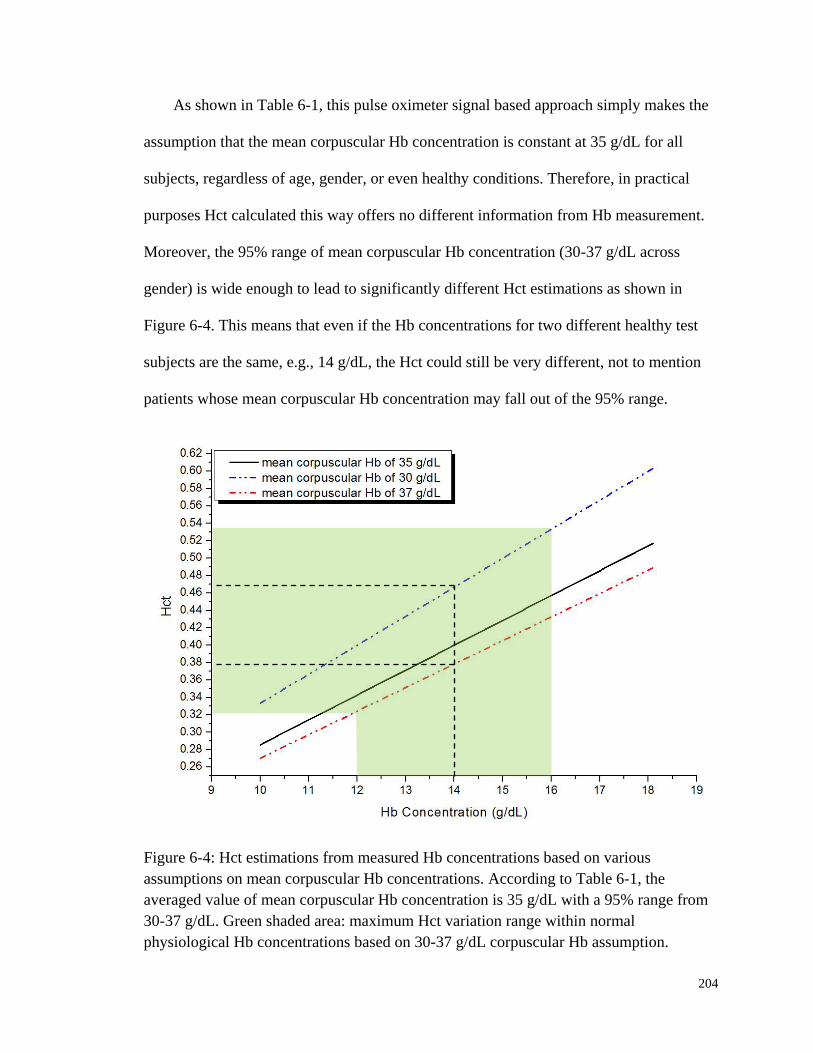
204
As shown in Table 6-1, this pulse oximeter signal based approach simply makes the
assumption that the mean corpuscular Hb concentration is constant at 35 g/dL for all
subjects, regardless of age, gender, or even healthy conditions. Therefore, in practical
purposes Hct calculated this way offers no different information from Hb measurement.
Moreover, the 95% range of mean corpuscular Hb concentration (30-37 g/dL across
gender) is wide enough to lead to significantly different Hct estimations as shown in
Figure 6-4. This means that even if the Hb concentrations for two different healthy test
subjects are the same, e.g., 14 g/dL, the Hct could still be very different, not to mention
patients whose mean corpuscular Hb concentration may fall out of the 95% range.
Figure 6-4: Hct estimations from measured Hb concentrations based on various
assumptions on mean corpuscular Hb concentrations. According to Table 6-1, the
averaged value of mean corpuscular Hb concentration is 35 g/dL with a 95% range from
30-37 g/dL. Green shaded area: maximum Hct variation range within normal
physiological Hb concentrations based on 30-37 g/dL corpuscular Hb assumption.
205
In fact, invasive approaches that give traditionally acceptable data (103, 104) are
also quite variable due mostly to sampling and handling issues (105). Nevertheless,
devices such as oximeters (200, 201) and hemoglobinometers (198, 202) produce results
that are apparently not sufficiently sensitive, precise, or accurate regarding blood changes
to give unambiguous indications to clinicians for diagnosis of internal hemorrhage and
determining the need for a transfusion. On the other hand, the Hct monitoring approach
introduced in this thesis adopts a totally different approach which is based fundamentally
on the photophysical and photochemical properties of RBCs and plasma. Therefore, it has
a pragmatic potential to monitor the Hct variation.
Finally, because the perfusion is affected by many things, experiments should
explore the variation of the observed spectra with systematic variation in the mechanical
coupling to the skin surface. Combining our findings in human factors control and in vivo
skin tissue fluorescence properties, it is apparent that a standard pre-experiment
procedure will be beneficial to follow. First of all, when necessary, such as for test
subject with dry skin or experiments taken in dry season like winter, a thin layer of
regular skin lotion or moisturizer could be applied to increase skin conductivity.
Although blinking dots caused by poor contact introduce unnecessary force compensation,
empirical experience has proved this to be an effective way to avoid such problem.
However, be cautious of any spectral ambiguity that might be introduced by the lotion
itself.
Then, before the taking of any spectral data, it is suggested to measure the BP and
heart rate from each test subject. Our research shows that for each individual both optical
and mechanical pulses happens when the applied pressure is around the mean arterial
206
pressure (MAP), which is close to the mean of the systolic and diastolic pressure. Also,
the force needed to apply MAP for a test subject with regular fingertip size is also in the
range that has been proved to cause moderate blood flow modulation. Thus the pre-taken
blood pressure could be used to guide the target pressure set-up that is optimized to each
individual. For the best outcome from a normal noninvasive glucose measurement, it is
optimal to set the target pressure of the unpressed part to the lowest pressure sufficient
enough to maintain fingertip stability, and that of the pressed part to the MAP. From a
purely engineering standpoint it would be very easy to incorporate blood pressure and
heart rate measurements in the LighTouchTM
device itself using the plethysmographic
data already collected using the PDPM.
When the fingertip is properly positioned, the laser could be switched on after the
test subject is informed. The pre-experimental laser exposure is made on purpose to
prebleach the skin region under investigation. Then a PDPM set-up procedure is
performed to take fingertip under initial pressure registration. The whole set-up step
usually takes less than 20 sec. Thus a separate 20 sec more prebleaching step is added to
bleach the skin even deeper. Although the total time of prebleaching is still less than what
is needed to reach a steady state fluorescence equilibrium which could be as along as
hundreds of seconds, the fast bleaching process should be done at this point.
Then another ridge set-up procedure follows, during which the fingertip will be
dragged back and forth by a motored micro actuator to take topographic scan. In our
current version, the second detected ridge will be located to guarantee the closest vicinity
to 53° incident angle. Once these steps are all done, either a regular single glucose
measurement or a continuous Hct monitoring could start. The research in this thesis

207
suggests that following these steps has promise to greatly improve the experimental
reproducibility and generate more accurate blood glucose concentration predictions.
These ideas need to be verified in the future work.
6.2 Future Work
As mentioned in the proceeding context of this thesis, while the current research has
led to many interesting observations and the in vivo apparatus is capable of performing
precise and reproducible glucose and Hct measurements, there is still room for both
technical refinements and conducting continuous study on the unsolved problems.
From the instrumental point of view, it could be envisioned that the next generation
of PDPM will be able to perform automatic target modulation pressure set-up. Using the
hardware of the current PDPM to fulfill this function, the step motor and solenoid system
could exert gradually increasing pressure under programmed pressure gradient.
Meanwhile the mechanical pulses are monitored and the amplitudes of these pulses are
fed into a BP measuring algorithm. Using the same principle as the oscillometric
approach in determining BP, the MAP as well as the pulse rate could be obtained
simultaneously.
Although we have been logging the force, pressure, and contact area signals that
come directly from the transducer, we have never used these sensor outputs as the criteria
in real-time automatic active data rejection. We have shown in Chapter 2 that the
amplitude of force variation caused by involuntary tremor is much bigger than cardiac
pulses and normal modulation. Therefore, abnormal force fluctuation could be an

208
indicator of poor test subject compliance. Either a checkup toward the end of an
experiment or a real-time monitoring of suspicious force variation would be beneficial
and time-saving.
Besides the two aforementioned refinements, there is still one obstacle that needs to
be overcome. In our effort to modify experimental skills and improve the procedure along
the way for making the in vivo findings presented in this thesis, we have been adapting
most of the aforementioned steps of the proposed standard pre-experiment procedure,
except the ridge set-up. This is simply because anatomic difficulties we encountered
when trying to implement our current ridge set-up procedure. In this procedure, the
transverse motored micro actuator is first positioned at a position called “center”. This is
where the test subject originally positioned their finger. Upon starting of the ridge scan,
the actuator, together with the finger, first backs up about 2 mm and then scans
unidirectionally form the joint to end. While performing a topographic scan, the IE vs.
Time curve records the position of the ridges and the actuator drags the finger back to
where the ridge index is logged.
Although this sounds plausible, in reality this procedure is hard to perform because
there exists a tissue stretching issue. We noticed that moving finger together with the
actuator always needs to overcome the initial stretching of the skin tissue that is also in
contact with the printed circuit board surface before it actually begins to move. In other
words, the distance travelled does not correspond to the logged actuator steps. Besides,
upon finishing the first scan the finger is dragged in the opposite direction. This time the
skin must restore to its original state first and then once again overcome the same
stretching as the first time. Thus, the final position could easily be far from a ridge.

209
To solve this problem, we have to seek new approaches in locating fingertip ridges.
Supposedly, the fingertip could be dragged to travel in only one direction in a much
slower pace to allow short “move-measure” cycles. In other words, the actuator moves
one step and CCD camera takes spectra to calculate IE. When this “move-measure” cycle
is finished, the actuator drags the fingertip to the next step and repeats the cycle. Since
our laser is not shuttered or synchronized with the actuator, at least 2 frames need to be
allowed each step since the first frame IE may have some timing issues relating with
CCD clearing. Both the absolute IE and the first derivatives need to be logged and
calculated in real-time in order to stop advancing forward when a sufficient amount of
decline in IE is observed.
It can be foreseen that this ridge set-up procedure will be time-consuming, i.e., it
might require as much as 20-30 seconds, but it has the potential to guarantee a ridge
could be located accurately each time. However, how to select the parameters, such as
thresholds and criteria needed to stop the scan, could be tricky. Each test subject’s
fingerprints have unique widths and depths, and the fluorescence baseline could vary to
an even bigger extent. Therefore, substantial testing will be necessary in order to realize
this procedure in practical application.
Concerning noninvasive Hct monitoring, as a practical matter, the spectroscopic
experimental requirements for obtaining EE and IE measurements that are adequate for
application of this algorithm do not seem to be very stringent. The main requirement is a
clean separation of the EE and IE, with no need to separate the Raman contribution from
the fluorescence; this would not require spectrographs or very narrow line width lasers or
even particularly stable laser sources. Probably, simple filters and simple lasers may be
210
used and the measurement system can use fiber-coupled incoming laser and outgoing IE
and EE light. Therefore, although the Hct results presented in this thesis were obtained
using CCD detection, it would be feasible to use optical fiber, an optical filter, a low-
grade laser, or possibly only a LED and two photodiode detectors to access the same
information. A system using these simplified optical components will greatly decrease
the complexity and price of a real product while increasing the portability and
convenience for clinical applications.
As to the empirical calibrations for the in vivo noninvasive Hct algorithm, there are
definitely more than the two approaches proposed in this thesis. Actually, the second
assumption about the blood modulated by a typical pressure modulation is somehow
related with the first assumption about cardiac pulses. In the process of testing the
sensitivity of the algorithm, it is clear that we can use the tourniquet experiment as a
separate calibration method. First of all, conventional fingerstick references can be
compared in parallel with the spectra data. Absolute Hct change can be fed directly into
the algorithm. Although errors do exist depending on how the tourniquet is performed
and blood is sampled, it could be expected that this approach is at least more accurate
than assumptions. Moreover, the tourniquet experiment by far shows the most obvious
blood disturbance ever observed in vivo. A calibration based on this is expected to yield a
more reliable set of parameters a-f.
Another limitation of our in vivo Hct algorithm calibration is the narrow range of Hct
variation. Even with the tourniquet trials, the biggest change before and after a tourniquet
is only approximately 0.03. For one test subject, the Hct increase from 0.38 to 0.41 after
the blood flow has been block by a tourniquet for 1 min. Although theoretically feasible,

211
we never know whether our algorithm is able to track Hct to an extreme level. To
investigate that, an animal model needs to be employed. We have currently proposed a
protocol for Institutional Animal Care and Use Committee (IACUC) approval to perform
an animal study at Syracuse University.
In this propose study, the rats will be exsanguinated while a portable Hct device will
be used to simultaneously monitor IE and EE changes. Notice that losing blood does not
necessarily cause an immediate change of Hct since the change will not happen until the
compensatory phase (203, 204) is initiated. During this physiologically manifested body
fluid compensation process, compartment-scale fluid shifts, surface fluid redistribution,
and change in blood composition happens to compensate for blood volume loss, and thus
result in Hct change. To actively control the rat Hct, body fluid replacements with
Normocarb™, plasma, and whole blood are also planned.
It is also noteworthy that, during the compensatory phase of hemorrhagic shock,
protein and glucose concentration in the plasma are known to increase precipitously;
measurement of the IE offers the possibility of simultaneously monitoring both Hct and
analyte concentrations. The amide I Raman band at ≈1670 cm−1 Raman shift, is a measure
of protein content over all three phases. The Raman features of the IE we have long used
for glucose monitoring could also be useful in this context as an indicator of whether a
compensatory mechanism is triggered or not in an internal hemorrhage case.
Measuring the IE and EE simultaneously and applying the algorithm leads to a
sensitive probe for volume changes of not only RBCs, but also plasma. Detection of Hb
or RBCs is of course routine, but to our knowledge obtaining a plasma volume
212
simultaneously is unique. Normalizing to the internally consistent and turbidity-corrected
plasma volume fraction calculated from our algorithm offers the possibility of calculating
concentrations of various analytes, including but not limited to glucose. It could turn out
to be a more accurate and straightforward volume normalizer than directly utilizing
undifferentiated inelastic emission, but further validation needs to be planned for our
future studies.
Due to the importance of prebleaching, we have been thinking about solutions to
shorten the time needed to reach the steady state fluorescence baseline. It is natural to
propose using higher laser powers since the power dependence of photobleaching has
been established (91). Shorter wavelength laser could also be tried. As shown in Figure
3-11, using 805 nm laser the skin bleached about twice as much as that with 830 nm laser
in 100 sec for two healthy test subjects, and the power used for 805 nm excitation is only
half of 830 nm laser. However, laser safety concerns arise when trying to increase the
power or using shorter wavelength. The American National Standards Institute (ANSI)
allowed maximum permissible exposure is determined by laser wavelength, exposure
length and incident spot size (205). Therefore, one possible solution is to use laser
sources that are not tightly focused or the ones that originally have big spot sizes. By
reducing the power density, higher allowable power is possible. Prebleaching over a
broader area could be preferred from an engineering standpoint to implement the ridge
set-up procedure.
Finally, interesting chemistry between dissolved oxygen and pentosidine (possibly
other AGEs or Maillard reaction intermediates) has been observed. However, there are
some technical difficulties involved in this study. First of all, the TMX turns out to be

213
very efficient at depleting dissolved oxygen and extremely sensitive to light. Therefore,
in the process of making the stock solution it is critical to keep the TMX out of any
possible light source. Moreover, our results show that pentosidine bearing TMX has very
similar photobleaching properties as what we observed in vivo. Therefore, the bleaching
behavior of pentosidine itself is conceivably useful in order to quantify the fluorescence
and thereby assign a volume numerically to the probed volume. These are presently under
review but we believe a better understanding of the bleaching chemistry itself is
necessary to proceed. And this leads to our further investigation of the pure form of
pentosidine, the synthesis of which has recently been achieved by our collaborators (206).
To explain the pentosidine fluorescence properties under NIR excitation, ZINDO
calculations on the singlet and triplet excitation states was performed. Although the
results support our speculation of that interesting physical chemistry underlies the
fluorescence and photobleaching phenomenology, such as TPE and singlet oxygen
sensitizing, more proof is needed to be certain. Actually, the ZINDO formalism applied
to this problem could be inappropriate since the pentosidine molecule may be charged
under physiological conditions but ZINDO is only applicable to closed shell systems. The
power dependence of autofluorescence production is also consistent with our proposed
involvement with pentosidine but more work is required to obtain greater confidence in
the hypothesis.
In the thesis, we proposed a hypothesized pentosidine photochemical pathway in
which it reacts with dissolved oxygen as a sensitizer and also a scavenger. The research
presented demonstrates its potential as a sensitizer but only provides limited evidence to
support the formation of the endoperoxide. Therefore, traditional analytical approaches,
214
such as mass spectroscopy and high-performance liquid chromatography, could be used
to perform the product analysis. These studies will have real potential to unveil the role of
dissolved oxygen in pentosidine photochemistry.
Without question, there are many possibilities to use the outcomes presented in this
thesis to explore a much broader range of possible applications, either in vivo or in vitro.
Continued work along the lines of this project will further advance the development of
such noninvasive blood analytes monitoring systems for final clinical availability.
6.3 Conclusions
This research is part of an ongoing project aimed at the application of combined NIR
Raman and fluorescence spectroscopy to noninvasive in vivo blood analysis including but
not limited to glucose monitoring. Coping with practicalities of human factors and
exploring ways to obtain and use knowledge gained about autofluorescence to improve
algorithms for blood and tissue analysis are the general goals of this research.
Firstly, the study investigated the various sources of human factors pertinent to our
concerns, such as fingerprints, turgor, skin hydration and pigmentation. We then
introduced specialized in vivo apparatus including means for precise and reproducible
placement of the tissues relative to the optical aperture, i.e., the PDPM. Based on solid
instrumental performances, appropriate methodology is now provided for applying and
maintaining pressure to keep surface tissues immobile during experiments while
obtaining the desired blood content and flow.
215
Secondly, in vivo human fingertip skin autofluorescence photobleaching under 200
mW 830 nm NIR irradiation is observed and it is characterized that: i) the majority of the
photobleached fluorescence originates from static tissue not blood, ii) the bleaching (1/e
point) occurs in 101-10
2 sec timescale, and also iii) a photobleached region remains
bleached for at least 45 min but recovers completely within several hours. A
corresponding extensive but not exhaustive in vitro systematic study narrowed down the
major contributors of such fluorescence and bleaching to collagen, melanin, plasma and
Hb: two major static tissue constituents and two major blood proteins.
Thirdly, we established that measuring the IE and EE simultaneously leads to a
sensitive probe for volume changes of both RBCs and plasma. An algorithm based on
measurements obtained while performing research needed for this thesis, as well as some
empirical calibration approaches, was presented. The calibrated algorithm showed real
potential to track Hct variations in cardiac pulses, centrifugal loading, blood vessel
blockage using tourniquet, and even during as subtle an occurrence as a Valsalva
maneuver.
Finally, NIR fluorescence and photochemistry of pentosidine, a representative of the
AGEs which accumulate with age and hyperglycemia, was studied. The results indicate
that oxygen plays a pivotal role in its photobleaching process. We hypothesized and
offered proofs showing that pentosidine is a 1O2 sensitizer that is also subject to attack by
the 1O2 resulting in the photobleaching that is observed when probing tissue using NIR.
The photobleaching reaction is kinetically first order in pentosidine and ground state
oxygen, and in vivo effectively first order with NIR irradiation also.

216
APPENDIX A: LOAD CELL CALIBRATION PROCEDURE
In order to allow PDPM measure absolute force and pressure, the load cell (LCGC-
150G, Omega Engineering Inc., Stamford, CT, USA) needs to be properly calibrated.
Figure A-1 shows a simplified drawing of load cell mounting and working scheme. A
lever system is used and the aperture is positioned between the fulcrum and the tip of the
load cell. The drawing is not to scale, but the distance between the aperture and the
fulcrum is the same as that between the load cell and the fulcrum. According to the law of
lever, displacement at the tip of the load cell is twice of that at the aperture. Therefore,
the force measured by the load cell is twice of that is actually applied at the back of the
fingertip. However, as will be shown later, the calibration procedure has naturally
incorporate this ratio in the calibrating process. Therefore, no further scaling is necessary.
Two screws are used to hold the spring steel board in position. While the screw close
to the end of fulcrum (referred as “calibration screw” thereinafter) is used to fasten the
board down, the other one between the aperture and the load cell is just loosely fitted to
keep the board properly oriented. A rubber O-ring is used while tightening the calibration
screw down. The fulcrum is designed to have the same height as the tip of load cell
transducer and also the rubber O-ring, Therefore, the spring steel board is almost parallel
to the aluminum main body. The side-view of the spring steel board shown in Figure A-1
has a much exaggerated angle.
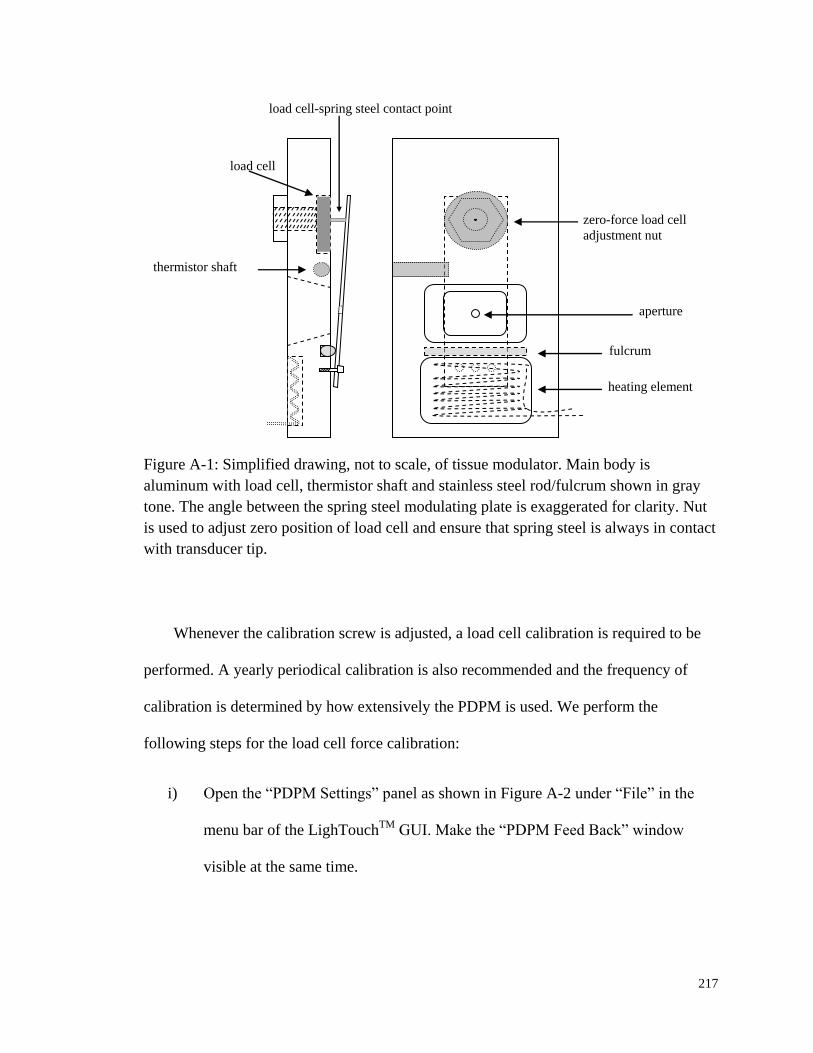
217
Figure A-1: Simplified drawing, not to scale, of tissue modulator. Main body is
aluminum with load cell, thermistor shaft and stainless steel rod/fulcrum shown in gray
tone. The angle between the spring steel modulating plate is exaggerated for clarity. Nut
is used to adjust zero position of load cell and ensure that spring steel is always in contact
with transducer tip.
Whenever the calibration screw is adjusted, a load cell calibration is required to be
performed. A yearly periodical calibration is also recommended and the frequency of
calibration is determined by how extensively the PDPM is used. We perform the
following steps for the load cell force calibration:
i) Open the “PDPM Settings” panel as shown in Figure A-2 under “File” in the
menu bar of the LighTouchTM
GUI. Make the “PDPM Feed Back” window
visible at the same time.
zero-force load cell
adjustment nut
fulcrum
heating element
thermistor shaft
load cell
aperture
load cell-spring steel contact point

218
Figure A-2: Screenshot of the “PDPM Settings” panel on the LighTouchTM
GUI. In the
load cell calibration process, the button “Calibrate Low Pressure”, “Calibrate High
Pressure” and “256 counts represents ___ grams” are the ones that will be used.
ii) Adjust the calibration screw when a slight turn shows force variation on the low
end of the slide bar in the “PDPM Feed Back” window of the LighTouchTM
GUI click “Calibrate Low Pressure”. Alternatively, electronic signal from the
load cell could be directly displayed on an oscilloscope. In this case, voltage
variation could be referenced.
iii) Put standard weights (100 g, 200 g or 250 g) on the aperture to saturate on the
real-time force slide bar and click “Calibrate High Pressure”. The manufacture
specification of the LCGC-150G load cell is to output 20 mV for 150 g force.
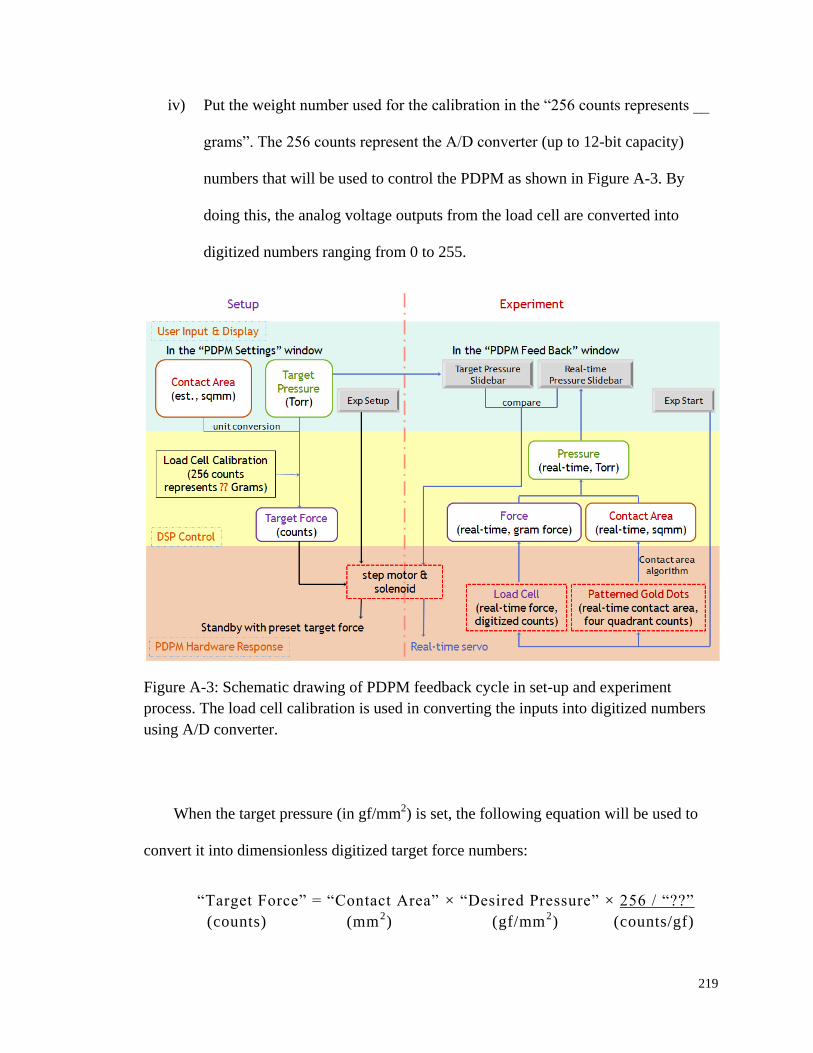
219
iv) Put the weight number used for the calibration in the “256 counts represents __
grams”. The 256 counts represent the A/D converter (up to 12-bit capacity)
numbers that will be used to control the PDPM as shown in Figure A-3. By
doing this, the analog voltage outputs from the load cell are converted into
digitized numbers ranging from 0 to 255.
Figure A-3: Schematic drawing of PDPM feedback cycle in set-up and experiment
process. The load cell calibration is used in converting the inputs into digitized numbers
using A/D converter.
When the target pressure (in gf/mm2) is set, the following equation will be used to
convert it into dimensionless digitized target force numbers:
“Target Force” = “Contact Area” × “Desired Pressure” × 256 / “??”
(counts) (mm2) (gf/mm
2) (counts/gf)

220
The underscored part is derived from the load cell calibration. Currently, the force
and pressure logged in the .sen and .dtl files are in dimensionless converted digital
numbers. Therefore, the load cell calibration equation needs to be used reversely to get
the meaningful force with proper unit.
Figure A-4: Calibration curves of using different standard weights as “Calibrate High
Pressure”. Using heavier weight extends the dynamic range, while using lighter weight
increase the sensitivity.
Usually after a load cell calibration is done, another load cell connected to a single
channel signal conditioner-indicator (Model GM, SENSOTEC Inc., Columbus, OH, USA)
will be used to check the linearity, sensitivity, and dynamic range of the calibration.
Examples of typical curves are shown in Figure A-4. It is obvious that how much
standard weights used as “Calibrate High Pressure” determines the dynamic range and

221
sensitivity of the PDPM module. Using heavier weights could extend the dynamic range,
while using lighter weights increase the sensitivity. There is a tradeoff and the selection
of calibration weight should be based on needs. Besides, extra attention needs to be paid
on the drift of calibrated zero.
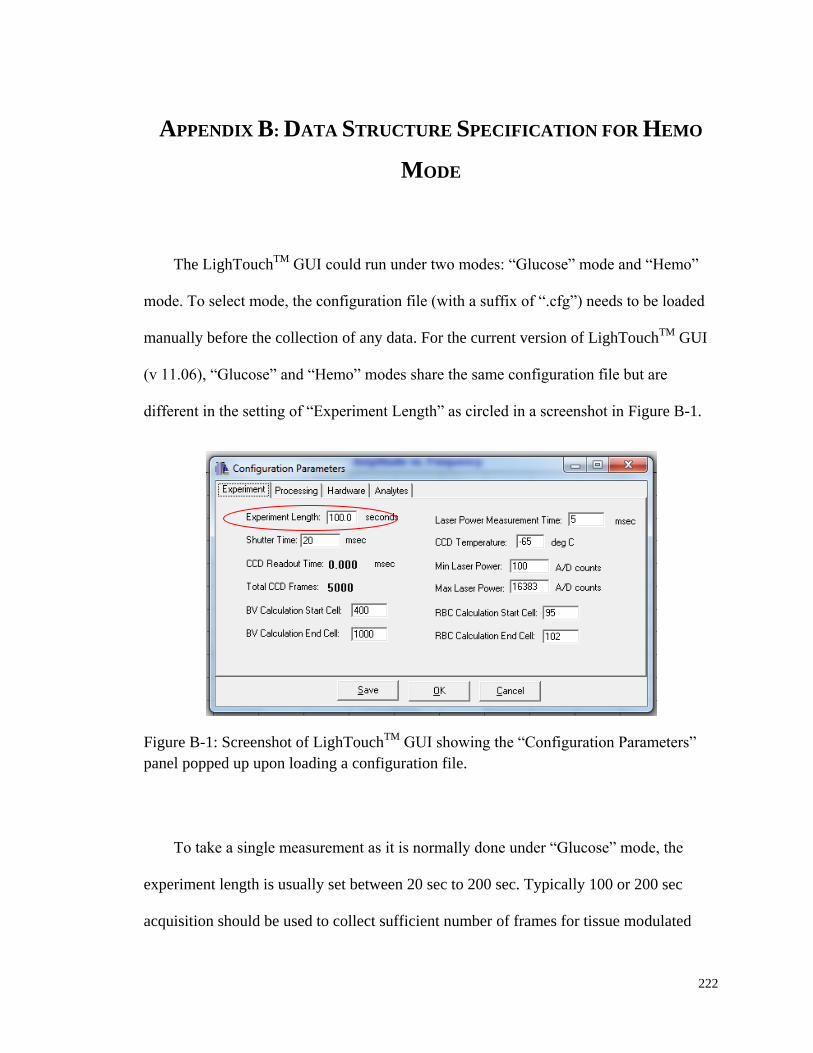
222
APPENDIX B: DATA STRUCTURE SPECIFICATION FOR HEMO
MODE
The LighTouchTM
GUI could run under two modes: “Glucose” mode and “Hemo”
mode. To select mode, the configuration file (with a suffix of “.cfg”) needs to be loaded
manually before the collection of any data. For the current version of LighTouchTM
GUI
(v 11.06), “Glucose” and “Hemo” modes share the same configuration file but are
different in the setting of “Experiment Length” as circled in a screenshot in Figure B-1.
Figure B-1: Screenshot of LighTouchTM
GUI showing the “Configuration Parameters”
panel popped up upon loading a configuration file.
To take a single measurement as it is normally done under “Glucose” mode, the
experiment length is usually set between 20 sec to 200 sec. Typically 100 or 200 sec
acquisition should be used to collect sufficient number of frames for tissue modulated

223
Raman calculation. The maximum length of an experiment that could be performed under
“Glucose” mode is 200 sec.
“Hemo” mode allows continuous data collection until quitting the mode by clicking
“Stop Hemo”. Under this mode, the setting of “Experiment Length” means the length of a
hemo cycle. The hemo cycle will be repeated and data will be generated for each cycle
and automatically pooled under the designated folder specified by the initiation file, i.e.,
“LighTouch.ini”.
Under both modes, spectral and mechanical transducer data will be logged in frame
basis. The amount of frames generated is determined by two settings: experiment length
and shutter time. Both of them could be set in the configuration panel shown in Figure B-
1. Frames logged in each hemo cycle could be calculated using Equation B-1 and the
same equation could be applied to data collected under “Glucose” mode.
frames per hemo cycle "Experiment Length"/ "Shutter Time" Equation B-1
At the end of a single “Glucose” experiment, .ccd and .sen files will be allowed to be
manually saved in local hard drive. The .ccd file contains all frames of spectra captured
by the CCD camera. The.sen file contains force, pressure, quadrants and contact area
information detected by the mechanical transducers. Data processing procedure and
MATLAB routines used to bulk convert these binary format files will be elaborated in
following APPENDIX C.
Back to the hemo data structure issue, it is important to know the number of frames
per hemo cycle for a successful MATLAB implement. Although 40 ms shutter time has
been occasionally used for better SNR, 20 ms is of primary preference since such setting
224
give better data density per pulse. Therefore, for every hemo cycle, typically 3 sec, 150
CCD frames will be recorded and automatically saved as a miniature .ccd file. Usually,
when “Hemo” mode is started, the experiment will uninterruptedly collect data and
output the calculated RBC volumes, plasma volumes and Hct results into a consecutively
updating graph within the GUI. Meanwhile, .ccd and .dtl files are logged sequentially in
the designated directory every hemo cycle. The structure of the .dtl file is specified below
in Table B-1.
In Table B-1, the “Hemo Cycle Size” in .dtl file equals the “frames per hemo cycle”
determined by Equation B-1, while “Hemo Cycle Instance” represents the relative
position of a particular hemo cycle within a continuous Hct monitoring experiment. The
Hct, plasma volumes and RBC volumes calculated from IE and EE integrals as
elaborated in Chapter 3 are also logged in each hemo cycle. Notice that no .sen file is
logged since the basic PDPM feedbacks, such as pressure, contact area, and quadrants,
have been backed up in .dtl file. Force is not logged since it could be readily calculated
based on the pressure and contact area. Pressure values are represented by dimensionless
digitized numbers that come directly from A/D converter. Absolute real-time pressure
with meaningful units could be got by applying the aforementioned force load cell
transducer calibration in APPENDIX A. Finally, two more fields are included to save the
data collected from the two channels, TP9 and TP10, of a commercial pulse oximeter
(Nellcor®
N200, Nellcor Inc., Pleasanton, CA, USA) for parallel comparison with
LighTouchTM
signals.

225
Table B-1: “Hemo” mode detail log file structure (.dtl) based on version 1.4 update
Item
Number Item Name
File
Granularity
Logging
Granularity
Data
Type
Type Size
(byte)
Data Size
(byte) Notes
1 File Revision Tag Cycle Once int 4 4
2 Hemo Cycle Size Cycle Once int 4 8 Header
3 Hemo Cycle Instance Cycle Once int 4
4 Red Blood Cell Volume Cycle Frame float 4
24
Data
Fields 4 - 12 are written as a set
for each frame and consist of 24
bytes of data
5 Plasma Volume Cycle Frame float 4
6 Hct Result Cycle Frame float 4
7 Pressure Cycle Frame float 4
8 Contact Area Cycle Frame float 4
9 Quadrant “Down” Contact Count Cycle Frame char 1
10 Quadrant “Up” Contact Count Cycle Frame char 1
11 Quadrant “Out” Contact Count Cycle Frame char 1
12 Quadrant “In” Contact Count Cycle Frame char 1
13 Test Point 9 (TP9) Cycle Frame short 2 4
Fields 13 & 14 are new to
REV2 14 Test Point 10 (TP10) Cycle Frame short 2
File Size (bytes): 4 + 8 + (24 + 4) * (Hemo Cycle Size)

226
Thus, based on the lasted update (v1.4) on .dtl file structure, the detail file size (in
bytes) of each hemo cycle can be calculated. For example, assuming 150 frames of data
are generated for each cycle (3 sec hemo cycle length and 20 ms shutter time), then 4212
bytes or 4.11 KB .dtl file will be logged. Meanwhile, 622 KB (637320 bytes) .ccd file
will also be backed up simultaneously. Bear in mind that these just calculated storage
spaces needed for logged data are only for a single hemo cycle, i.e., 3 sec. Thus, for a 1
min monitoring under “Hemo” mode, about 18.34 MB of data will be logged.
However, in order to monitor the Hct fluctuation of a test subject, one experiment
normally takes tens of minutes, or much longer if necessary. This will eventually
generate thousands of CCD and detail files and also take up a tremendous amount of hard
disk spaces. While at the R&D phase raw data are favorable in optimizing parameters
that feed into the algorithm and evaluating system performance, the redundancy of data
logging could be significantly reduced once the testing phase ends.
At the end of one Hct monitoring trial, a summary file with a suffix of .sum is
logged. The .sum file only backs up the final results and the most important system
operation parameters. Table B-2 shows the structure of a summary file. “Hemo Cycle
Counts” records the total number of hemo cycles one continuous monitoring has taken.
Parameters a-f are predetermined constants using the approaches elaborated in Section
3.3 of Chapter 3. These numbers are fetched directly from .ini file where the six
parameters are set. The “CCD Exposure Time” is another expression of the
aforementioned “Shutter Time”. Different from the .dtl file, the Hct, plasma volumes and
RBC volumes in the .sum file are the average for each cycle and could be plotted readily
in the LighTouchTM
GUI at the end of an experiment.

227
Two Boolean fields, i.e., “Bleach” and “Stable”, are also included in the .sum,
representing the fingertip tissue photobleaching status and compliance of the test subjects
respectively. A “0” is false and “1” is true. The Hct related fields are only calculated
when both of the fields are true. Therefore, no output could be shown during a
monitoring process if one or both of the red LED lights on the GUI lit up. IE0 and EE0
will be recalculated once a new cycle that passes the two tests starts. The .sum file takes
much less hard drive spaces compared to the .dtl and .sum files generated along the data
acquisition process.
Finally, the data structures listed in Table B-1 and Table B-2 for .dtl and .sum files
respectively should be used as references for implementing the MATLAB routines in
hemo data processing. Changes in MATLAB codings should be made accordingly
whenever there is a change to these structures.

228
Table B-2: “Hemo” mode summary log file structure (.sum) based on version 1.4 update
Item
Number Item Name
File
Granularity
Logging
Granularity Data Type
Type Size
(byte)
Data Size
(byte) Notes
1 File Revision Tag Procedure Once int 4 4
2 Hemo Cycle Count Procedure Once int 4
40
Header
Laser Power in mW
CCD Exposure in ms
3 Hemo Cycle Size Procedure Once int 4
4 Parameter A Procedure Once float 4
5 Parameter B Procedure Once float 4
6 Parameter C Procedure Once float 4
7 Parameter D Procedure Once float 4
8 Parameter E Procedure Once float 4
9 Parameter F Procedure Once float 4
10 Laser Power Procedure Once float 4
11 CCD Exposure Time Procedure Once float 4

229
Table B-2 (Continued): “Hemo” mode summary log file structure (.sum) based on version 1.4 update
Item
Number Item Name
File
Granularity
Logging
Granularity Data Type
Type Size
(byte)
Data Size
(byte) Notes
12 Hemo Cycle Instance Procedure Cycle int 4
32
Data
Fields 12-22 are written as
a set for each cycle and
consist of 32 bytes of data;
For Bleached and Stable
fields, a value of 0
indicates false and a value
of 1 indicates true.
13 Red Blood Cell Volume Procedure Cycle float 4
14 Plasma Volume Procedure Cycle float 4
15 Hct Result Procedure Cycle float 4
16 CCD Exposure Temp (°C) Procedure Cycle float 4
17 IE0 Value Procedure Cycle float 4
18 EE0 Value Procedure Cycle float 4
19 Bleached Procedure Cycle char 1
20 Stable Procedure Cycle char 1
21 Spare1 Procedure Cycle char 1
22 Spare2 Procedure Cycle char 1
File Size (bytes): 4 + 40 + (32 * Hemo Cycle Size)
230
APPENDIX C: IN VIVO DATA PROCESSING PROCESSURE
The excessive headers in the .ccd and .sen files generated in vivo either using
“Glucose” or “Hemo” mode could be cleaned using a C++ based command line tool
called “ConversionTool.exe”. Either a .ccd, or .sen file, or a path to a folder which has
these files could be specified to implement this command. More than one file or folder
could be specified at the same time by adding them as arguments.
The format of the .sec file, which is the converted file from .sen data, is:
Frame Count (16 bit unsigned int)
% Then the sensor data for each frame
% Sensor Frame Data Format:
Force (32 bit int)
Pressure (32 bit int)
Contact Area (32 bit int) % scaled by multiplying by 1000
Q1 Sum (32 bit int) % scaled by multiplying by 1000
Q2 Sum (32 bit int) % scaled by multiplying by 1000
Q3 Sum (32 bit int) % scaled by multiplying by 1000
Q4 Sum (32 bit int) % scaled by multiplying by 1000
The format of the .vec file, which is the converted file from .ccd data, is:
Frame Count (16 bit unsigned int)
Frame 1 Data (1024 32 bit signed values)
...
Frame n Data (1024 32 bit signed values)

231
Only the .vec and .sec files could be recognized by the MATLAB routines for bulk
processing. Therefore, file type conversion is a must. To use the “ConversionTool.exe”,
follow the following steps:
i) Open a “Command Prompt” window.
ii) Direct the path to where “ConversionTool.exe” is located. For example, it is
located under the root directory of disk C:\, then input in the command line:
iii) > C:\ConversionTool.exe "C:\2011-06-20 data" (assuming data is also saved
under the root directory of disk C:\).
iv) The program should then tell you it is converting the files and that they were
successfully converted in to the original folder.
The following MATLAB routines and subfunctions are used to bulk convert the
binary formatted .dtl, .sum and the converted .vec data files into summarized Excel files.
It is important to modify the routine according to any changes made to the data
structures as shown in APPENDIX B.
1. Main function: Hemolog.m
% Save binary Hemo log files (.vec,.dtl,.sum) into .xlsx with captions;
% Hemo Cycle Size means the number of CCD frames in a single Hemo cycle;
% Hemo Cycle Size can be found in the Hemo.cfg settings;
% Bin Deng 6/28/2010

232
function HemoLog()
clc;
clear all;
% Changed the current directory for Matlab
cd('C: \LighTouch Data\2011-06-20');
% Default Hemo Cycle Size is 3 sec, 20ms per frame, thus 150 frames
FramesPerCycle = 150;
Summary;
Detail_LT(FramesPerCycle);
CCD(FramesPerCycle);
msgbox('Conversion is done!')
end
2. Subfunction – Summary.m
% Subfunction for HemoLog.m
% Process of .sum for each Hemo experiment
% Based on v1.4 .sum file data structure
% Bin Deng 6/28/2010
function Summary
Files = dir('*.sum');
for n=1:length(Files);
SumID = fopen(Files(n).name, 'r', 'ieee-le');

233
% the equation below is determined by the .sum file structure
% TotalHemoCycle = (SumCount-44)/32; % the number of Hemo cycles run for
each experiment
FileRevisionTag = {fread(SumID,[1,4],'*char')}; % header for each .sum is '1VER'
HemoCycleCount = fread(SumID,1,'int32');
HemoCycleSize = fread(SumID,1,'int32'); % The number of CCD frames in each
Hemo cycle
ParaA = fread(SumID,1,'float32'); % The six parameters for the Hemocrit caculation
algorithm
ParaB = fread(SumID,1,'float32');
ParaC = fread(SumID,1,'float32');
ParaD = fread(SumID,1,'float32');
ParaE = fread(SumID,1,'float32');
ParaF = fread(SumID,1,'float32');
LaserPower = fread(SumID,1,'float32'); % in volts, can be convert to milliwatts
using the calibration curve
CcdExposureTime = fread(SumID,1,'float32'); % in milliseconds
% define the data space for all the variables
HemoCycleInstance = zeros(HemoCycleCount,1);
RBCVolume = zeros(HemoCycleCount,1);
PlasmaVolume = zeros(HemoCycleCount,1);
HctResult = zeros(HemoCycleCount,1);
CcdExposureTemp = zeros(HemoCycleCount,1);
IE0 = zeros(HemoCycleCount,1);
EE0 = zeros(HemoCycleCount,1);
BleachStatus = zeros(HemoCycleCount,1);
StabilityStatus = zeros(HemoCycleCount,1);
Unused1 = zeros(HemoCycleCount,1);

234
Unused2 = zeros(HemoCycleCount,1);
for i=1:HemoCycleCount;
HemoCycleInstance(i,1) = fread(SumID,1,'int32');
RBCVolume(i,1) = fread(SumID,1,'float32'); % RBC,plasma volume & Hct is the
average for each Hemo cycle
PlasmaVolume(i,1) = fread(SumID,1,'float32');
HctResult(i,1) = fread(SumID,1,'float32');
CcdExposureTemp(i,1) = fread(SumID,1,'float32'); % in celsius
IE0(i,1) = fread(SumID,1,'float32'); % IE0 & EE0 used for the Hct calculation
EE0(i,1) = fread(SumID,1,'float32');
BleachStatus(i,1) = fread(SumID,1,'bool'); % 1 is true, 0 is false
StabilityStatus(i,1) = fread(SumID,1,'bool');
Unused1(i,1) = fread(SumID,1,'*char'); % two unused variables for future
expension
Unused2(i,1) = fread(SumID,1,'*char');
end
Title1 = {'File Revision Tag';'HemoCycleCount';'Hemo Cycle Size';'Parameter
A';'Parameter B';'Parameter C';'Parameter D';'Parameter E';'Parameter F';'Laser
Power';'CCD Exposure Time'};
Title2 = {'Hemo Cycle Instance' 'Red Blood Cell Volume' 'Plasma Volume' 'Hct
Result' 'CCD Exposure Temp' 'IE0 Value' 'EE0 Value' 'Bleach Status' 'Stability
Status' 'Unused_1' 'Unused_2'};
xlswrite([Files(n).name,'_summary','.xls'],Title1,[Files(n).name,'_summary'],'A1');
xlswrite([Files(n).name,'_summary','.xls'],FileRevisionTag,[Files(n).name,'_summar
y'],'B1');
xlswrite([Files(n).name,'_summary','.xls'],HemoCycleCount,[Files(n).name,'_summa
ry'],'B2');
xlswrite([Files(n).name,'_summary','.xls'],HemoCycleSize,[Files(n).name,'_summary
'],'B3');
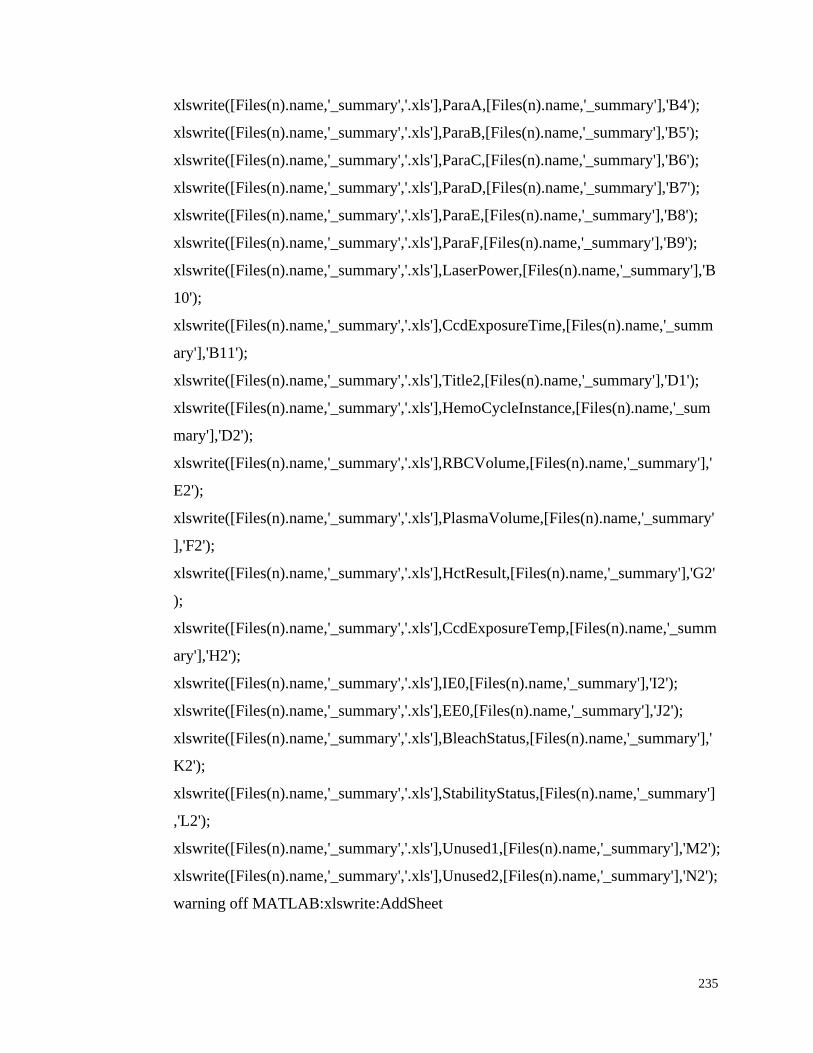
235
xlswrite([Files(n).name,'_summary','.xls'],ParaA,[Files(n).name,'_summary'],'B4');
xlswrite([Files(n).name,'_summary','.xls'],ParaB,[Files(n).name,'_summary'],'B5');
xlswrite([Files(n).name,'_summary','.xls'],ParaC,[Files(n).name,'_summary'],'B6');
xlswrite([Files(n).name,'_summary','.xls'],ParaD,[Files(n).name,'_summary'],'B7');
xlswrite([Files(n).name,'_summary','.xls'],ParaE,[Files(n).name,'_summary'],'B8');
xlswrite([Files(n).name,'_summary','.xls'],ParaF,[Files(n).name,'_summary'],'B9');
xlswrite([Files(n).name,'_summary','.xls'],LaserPower,[Files(n).name,'_summary'],'B
10');
xlswrite([Files(n).name,'_summary','.xls'],CcdExposureTime,[Files(n).name,'_summ
ary'],'B11');
xlswrite([Files(n).name,'_summary','.xls'],Title2,[Files(n).name,'_summary'],'D1');
xlswrite([Files(n).name,'_summary','.xls'],HemoCycleInstance,[Files(n).name,'_sum
mary'],'D2');
xlswrite([Files(n).name,'_summary','.xls'],RBCVolume,[Files(n).name,'_summary'],'
E2');
xlswrite([Files(n).name,'_summary','.xls'],PlasmaVolume,[Files(n).name,'_summary'
],'F2');
xlswrite([Files(n).name,'_summary','.xls'],HctResult,[Files(n).name,'_summary'],'G2'
);
xlswrite([Files(n).name,'_summary','.xls'],CcdExposureTemp,[Files(n).name,'_summ
ary'],'H2');
xlswrite([Files(n).name,'_summary','.xls'],IE0,[Files(n).name,'_summary'],'I2');
xlswrite([Files(n).name,'_summary','.xls'],EE0,[Files(n).name,'_summary'],'J2');
xlswrite([Files(n).name,'_summary','.xls'],BleachStatus,[Files(n).name,'_summary'],'
K2');
xlswrite([Files(n).name,'_summary','.xls'],StabilityStatus,[Files(n).name,'_summary']
,'L2');
xlswrite([Files(n).name,'_summary','.xls'],Unused1,[Files(n).name,'_summary'],'M2');
xlswrite([Files(n).name,'_summary','.xls'],Unused2,[Files(n).name,'_summary'],'N2');
warning off MATLAB:xlswrite:AddSheet

236
fclose(SumID);
end
end
3. Subfunction – Detail.m
% Subfunction for HemoLog.m
% Process of .dtl for each Hemo Cycle
% Based on v1.4 .dtl data structure
% Bin Deng 12/10/2010
function Detail_CL(FramesPerCycle)
% define the data space for all .dtl variables
RBCVolume = zeros(FramesPerCycle,1);
PlasmaVolume = zeros(FramesPerCycle,1);
HctResult = zeros(FramesPerCycle,1);
QuadrantCount = zeros(FramesPerCycle,4);
Pressure = zeros(FramesPerCycle,1);
ContactArea = zeros(FramesPerCycle,1);
TP9 = zeros(FramesPerCycle,1);
TP10 = zeros(FramesPerCycle,1);
% get all the .dtl files
Files = dir('*.dtl');
TotalFrames = length(Files)* FramesPerCycle;
% define the data space for all the summary variables
HemoCycleInstanceAll = zeros(TotalFrames,1);
RBCVolumeAll = zeros(TotalFrames,1);
PlasmaVolumeAll = zeros(TotalFrames,1);
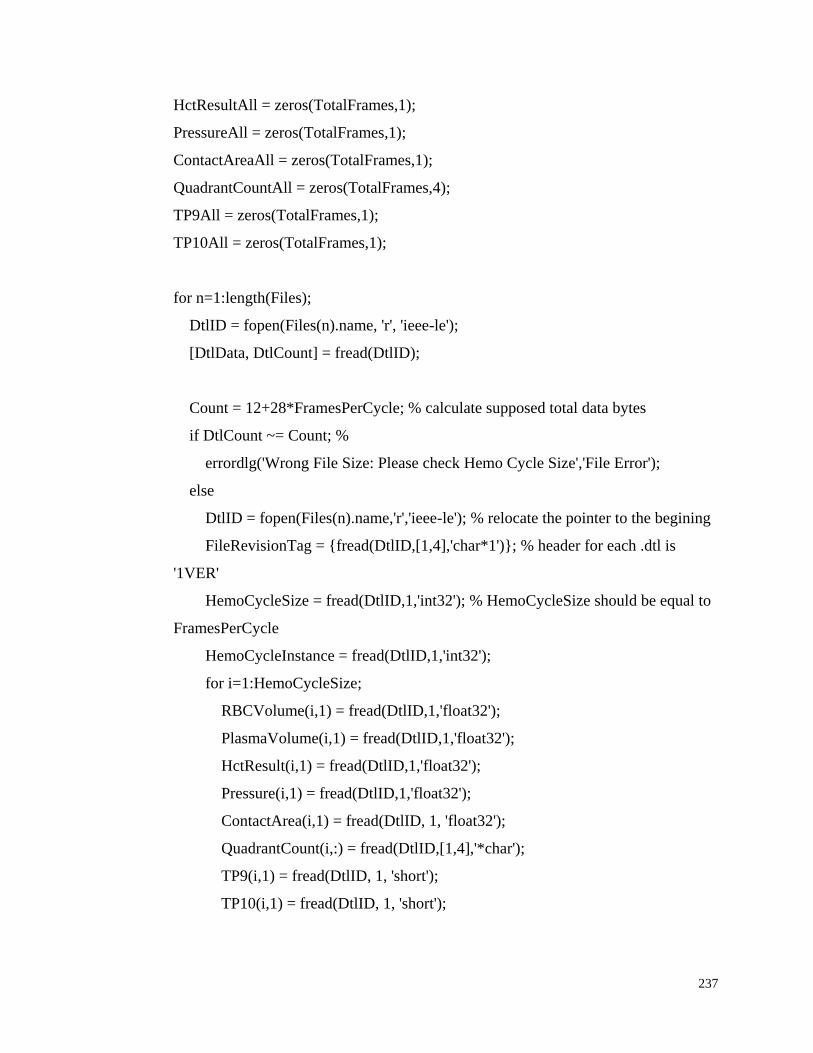
237
HctResultAll = zeros(TotalFrames,1);
PressureAll = zeros(TotalFrames,1);
ContactAreaAll = zeros(TotalFrames,1);
QuadrantCountAll = zeros(TotalFrames,4);
TP9All = zeros(TotalFrames,1);
TP10All = zeros(TotalFrames,1);
for n=1:length(Files);
DtlID = fopen(Files(n).name, 'r', 'ieee-le');
[DtlData, DtlCount] = fread(DtlID);
Count = 12+28*FramesPerCycle; % calculate supposed total data bytes
if DtlCount ~= Count; %
errordlg('Wrong File Size: Please check Hemo Cycle Size','File Error');
else
DtlID = fopen(Files(n).name,'r','ieee-le'); % relocate the pointer to the begining
FileRevisionTag = {fread(DtlID,[1,4],'char*1')}; % header for each .dtl is
'1VER'
HemoCycleSize = fread(DtlID,1,'int32'); % HemoCycleSize should be equal to
FramesPerCycle
HemoCycleInstance = fread(DtlID,1,'int32');
for i=1:HemoCycleSize;
RBCVolume(i,1) = fread(DtlID,1,'float32');
PlasmaVolume(i,1) = fread(DtlID,1,'float32');
HctResult(i,1) = fread(DtlID,1,'float32');
Pressure(i,1) = fread(DtlID,1,'float32');
ContactArea(i,1) = fread(DtlID, 1, 'float32');
QuadrantCount(i,:) = fread(DtlID,[1,4],'*char');
TP9(i,1) = fread(DtlID, 1, 'short');
TP10(i,1) = fread(DtlID, 1, 'short');
238
k=(n-1)*HemoCycleSize+i;
HemoCycleInstanceAll(k,1) = HemoCycleInstance;
RBCVolumeAll(k,1) = RBCVolume(i,1);
PlasmaVolumeAll(k, 1) = PlasmaVolume(i,1);
HctResultAll(k,1) = HctResult(i,1);
PressureAll(k,1) = Pressure(i,1);
ContactAreaAll(k,1) = ContactArea(i,1);
QuadrantCountAll(k,:) = QuadrantCount(i,:);
TP9All(k,:) = TP9(i,1);
TP10All(k,:) = TP10(i,1);
end
end
fclose(DtlID);
% Title1 = {'File Revision Tag' 'Hemo Cycle Size' 'Hemo Cycle Instance' 'Frame
Count' 'Red Blood Cell Volume' 'Plasma Volume' 'Hct Result' 'Pressure' 'Contact
Area' 'Quadrant Down' 'Quadrant Up' 'Quadrant Out' 'Quadrant In'};
% FrameCount = transpose(1:FramesPerCycle);
% xlswrite([Files(n).name,'.xls'],Title1,[Files(n).name],'A1');
% xlswrite([Files(n).name,'.xls'],FileRevisionTag,[Files(n).name],'A2');
% xlswrite([Files(n).name,'.xls'],HemoCycleSize,[Files(n).name],'B2');
% xlswrite([Files(n).name,'.xls'],HemoCycleInstance,[Files(n).name],'C2');
% xlswrite([Files(n).name,'.xls'],FrameCount,[Files(n).name],'D2');
% xlswrite([Files(n).name,'.xls'],RBCVolume,[Files(n).name],'E2');
% xlswrite([Files(n).name,'.xls'],PlasmaVolume,[Files(n).name],'F2');
% xlswrite([Files(n).name,'.xls'],HctResult,[Files(n).name],'G2');
% xlswrite([Files(n).name,'.xls'],Pressure,[Files(n).name],'H2');
% xlswrite([Files(n).name,'.xls'],ContactArea,[Files(n).name],'I2');
% xlswrite([Files(n).name,'.xls'],QuadrantCount,[Files(n).name],'J2');
warning off MATLAB:xlswrite:AddSheet
239
end
Title2 = {'Hemo Cycle Instance' 'Frame' 'RBC Volume' 'Plasma Volume'
'Hematocrit' 'BV' 'RBC' 'TP9' 'TP10'};
FrameCount2 = transpose(1:TotalFrames);
xlswrite(['Frame by Frame Summary','.xlsx'],Title2,['Hct'],'A1');
xlswrite(['Frame by Frame Summary','.xlsx'],HemoCycleInstanceAll,['Hct'],'A2');
xlswrite(['Frame by Frame Summary','.xlsx'],FrameCount2,['Hct'],'B2');
xlswrite(['Frame by Frame Summary','.xlsx'],RBCVolumeAll,['Hct'],'C2');
xlswrite(['Frame by Frame Summary','.xlsx'],PlasmaVolumeAll,['Hct'],'D2');
xlswrite(['Frame by Frame Summary','.xlsx'],HctResultAll,['Hct'],'E2');
xlswrite(['Frame by Frame Summary','.xlsx'],TP9All,['Hct'],'H2');
xlswrite(['Frame by Frame Summary','.xlsx'],TP10All,['Hct'],'I2');
Title3 = {'Hemo Cycle Instance' 'Frame' 'Pressure' 'Contact Area' 'Quadrant Down'
'Quadrant Up' 'Quadrant Out' 'Quadrant In'};
xlswrite(['Frame by Frame Summary','.xlsx'],Title3,['PDPM'],'A1');
xlswrite(['Frame by Frame Summary','.xlsx'],HemoCycleInstanceAll,['PDPM'],'A2');
xlswrite(['Frame by Frame Summary','.xlsx'],FrameCount2,['PDPM'],'B2');
xlswrite(['Frame by Frame Summary','.xlsx'],PressureAll,['PDPM'],'C2');
xlswrite(['Frame by Frame Summary','.xlsx'],ContactAreaAll,['PDPM'],'D2');
xlswrite(['Frame by Frame Summary','.xlsx'],QuadrantCountAll,['PDPM'],'E2');
end
4. Subfunction -- CCD.m
% Subfunction for HemoLog.m
% Process of .ccd files for each Hemo Cycle

240
% .ccd needed to be converted to .vec file using the conversion tool first!!
% Excel 2003: max rows = 65,536; max columns = 256
% Excel 2007: max rows = over 1 million; max columns = 16,384
% Bin Deng 6/28/2010
function CCD(FramesPerCycle)
% get all the .vec files
Files = dir('*.vec');
TotalFrames = length(Files)* FramesPerCycle;
% define BV and RBV start and end cell (.cfg number +1)
% the following sets of params are for the old LT system
BVStart = 401;
BVEnd = 926;
RBCStart = 96;
RBCEnd = 105;
% the following sets of params are for the new Hct-1 system
% BVStart = 226;
% BVEnd = 701;
% RBCStart = 98;
%RBCEnd = 104;
% define the data space for all the summary variables
BV = zeros(FramesPerCycle,1);
RBC = zeros(FramesPerCycle,1);
BVAll = zeros(TotalFrames,1);
RBCAll = zeros(TotalFrames,1);
for n=1:length(Files);
241
CcdID = fopen(Files(n).name, 'r', 'ieee-le');
HemoCycleSize = fread(CcdID, 1, 'uint16');
if HemoCycleSize ~= FramesPerCycle; %
errordlg('Wrong File Size: Please check Hemo Cycle Size','File Error');
else
CcdData = fread(CcdID,[1024,HemoCycleSize],'int32');
for i=1:HemoCycleSize;
BV(i,1) = sum(CcdData(BVStart:BVEnd,i));
RBC(i,1) = sum(CcdData(RBCStart:RBCEnd,i));
k=(n-1)*HemoCycleSize+i;
BVAll(k,1) = BV(i,1);
RBCAll(k, 1) = RBC(i,1);
end
end
fclose(CcdID);
%Title = {'Frame Count' 'BV' 'RBC'};
%FrameCount = transpose(0:FramesPerCycle-1);
%xlswrite([Files(n).name,'.xls'],Title,[Files(n).name],'A1');
%xlswrite([Files(n).name,'.xls'],FrameCount,[Files(n).name],'A2');
%xlswrite([Files(n).name,'.xls'],BV,[Files(n).name],'B2');
%xlswrite([Files(n).name,'.xls'],RBC,[Files(n).name],'C2');
end
xlswrite(['Frame by Frame Summary','.xlsx'],BVAll,['Hct'],'F2');
xlswrite(['Frame by Frame Summary','.xlsx'],RBCAll,['Hct'],'G2');
% Wavelength Calibration using 5th order polynomial
% y0,A1,A2,A3,A4,A5 can be found in .cfg file

242
% UPDATE whenever new calibration is made
% PixelNumber = transpose(0:1023);
% y0 = -392.516970725087;
% A1 = 4.43554354246831;
% A2 = -0.00710683854527714;
% A3 = 1.91473348286739E-5;
% A4 = -2.74128188255463E-8;
% A5 = 1.5003258140181E-11;
% RamanShift =
y0+A1*PixelNumber+A2*PixelNumber.^2+A3*PixelNumber.^3+A4*PixelNumber
.^4+A5*PixelNumber.^5;
% Title = {'Pixel Number' 'Raman Shift' 'Raw CCD Counts'};
% xlswrite([fName,'.xls'],Title,[fName,'_CCD'],'A1');
% xlswrite([fName,'.xls'],PixelNumber,[fName,'_CCD'],'A2');
% xlswrite([fName,'.xls'],RamanShift,[fName,'_CCD'],'B2');
% xlswrite([fName,'.xls'],CcdData,[fName,'_CCD'],'C2');
warning off MATLAB:xlswrite:AddSheet
end
These routines can also be revised in multiple ways to bulk convert the .ccd and .sen
files generated under “Glucose” mode. Since only minimal changes are needed in order
to do so, redundant codes will not be included in this appendix.

243
REFERENCES
1. B. T. Andrews, Intensive care in neurosurgery, Thieme ; Ill. : American
association of neurological surgeons, New York [etc.]; Rolling Meadows (2003).
2. W. Lippincott and Wilkins, Handbook of diseases, Lippincott Williams & Wilkins,
Springhouse, Pa. (2003).
3. C. Cothren, E. Moore, H. Hedegaard and K. Meng, "Epidemiology of Urban
Trauma Deaths: A Comprehensive Reassessment 10 Years Later," World Journal
of Surgery 31(7), 1507-1511 (2007)
4. A. Sauaia, F. A. Moore, E. E. Moore, K. S. Moser, R. Brennan, R. A. Read and P.
T. Pons, "Epidemiology of trauma deaths: a reassessment," The Journal of trauma
38(2), 185-193 (1995)
5. L. C. Cancio, A. I. Batchinsky, J. Salinas, T. Kuusela, V. A. Convertino, C. E.
Wade and J. B. Holcomb, "Heart-Rate Complexity for Prediction of Prehospital
Lifesaving Interventions in Trauma Patients," The Journal of Trauma: Injury,
Infection, and Critical Care The Journal of Trauma: Injury, Infection, and Critical
Care 65(4), 813-819 (2008)
6. M. Martin, J. Oh, H. Currier, N. Tai, A. Beekley, M. Eckert and J. Holcomb, "An
Analysis of In-Hospital Deaths at a Modern Combat Support Hospital," The
Journal of Trauma: Injury, Infection, and Critical Care The Journal of Trauma:
Injury, Infection, and Critical Care 66(Supplement), S51-S61 (2009)
7. V. V. Tuchin, Tissue Optics: Light Scattering Methods and Instruments for
Medical Diagnosis, SPIE PRESS, Bellingham, WA (2000).
8. V. V. Tuchin, Optical clearing of tissues and blood, SPIE PRESS, Bellingham,
WA (2005).
9. V. V. Tuchin, Handbook of optical sensing of glucose in biological fluids and
tissues, CRC PRESS, Taylor & Francis Group, Boca Raton, FL (2008).
10. J. Chaiken and J. Goodisman, "On probing human fingertips in vivo using near-
infrared light: model calculations," J Biomed Opt 15(3), 037007 (2010)
11. M. A. Arnold and G. W. Small, "Noninvasive glucose sensing," Anal Chem
77(17), 5429-5439 (2005)

244
12. O. S. Khalil, "Spectroscopic and clinical aspects of noninvasive glucose
measurements," Clin Chem 45(2), 165-177 (1999)
13. R. R. Anderson and J. A. Parrish, "THE OPTICS OF HUMAN-SKIN," Journal of
Investigative Dermatology 77(1), 13-19 (1981)
14. R. R. Anderson, Optics of the Skin, Marcel Dekker, New York (1993).
15. A. K. Amerov, J. Chen, G. W. Small and M. A. Arnold, "Scattering and absorption
effects in the determination of glucose in whole blood by near-infrared
spectroscopy," Anal Chem 77(14), 4587-4594 (2005)
16. M. A. Arnold and J. T. Olesberg, "Method for generating a net analyte signal
calibration model and uses thereof," U. S. P. Application, Ed., p. 20, United States
(2006).
17. K. Maquelin, C. Kirschner, L. P. Choo-Smith, N. van den Braak, H. P. Endtz, D.
Naumann and G. J. Puppels, "Identification of medically relevant microorganisms
by vibrational spectroscopy," Journal of Microbiological Methods 51(3), 255-271
(2002)
18. L. P. Choo-Smith, H. G. Edwards, H. P. Endtz, J. M. Kros, F. Heule, H. Barr, J. S.
Robinson, H. A. Bruining and G. J. Puppels, "Medical applications of Raman
spectroscopy: from proof of principle to clinical implementation.," Biopolymers
67(1), 1-9 (2002)
19. K. Maquelin, L. P. Choo-Smith, H. P. Endtz, H. A. Bruining and G. J. Puppels,
"Rapid identification of Candida species by confocal Raman microspectroscopy.,"
J Clin Microbiol 40(2), 594-600 (2002)
20. P. J. Caspers, G. W. Lucassen and G. J. Puppels, "Combined in vivo confocal
Raman spectroscopy and confocal microscopy of human skin," Biophysical
journal 85(1), 572-580 (2003)
21. B. R. Wood, P. Caspers, G. J. Puppels, S. Pandiancherri and D. McNaughton,
"Resonance Raman spectroscopy of red blood cells using near-infrared laser
excitation," Anal Bioanal Chem 387(5), 1691-1703 (2007)
22. B. W. de Jong, T. C. Schut, K. Maquelin, T. van der Kwast, C. H. Bangma, D. J.
Kok and G. J. Puppels, "Discrimination between nontumor bladder tissue and
tumor by Raman spectroscopy.," Anal Chem 78(22), 7761-7769 (2006)
23. I. Barman, G. P. Singh, R. R. Dasari and M. S. Feld, "Turbidity-Corrected Raman
Spectroscopy for Blood Analyte Detection," ANALYTICAL CHEMISTRY -
WASHINGTON DC- 81(11), 4233-4240 (2009)
245
24. I. Barman, C. R. Kong, G. P. Singh, R. R. Dasari and M. S. Feld, "Accurate
Spectroscopic Calibration for Noninvasive Glucose Monitoring by Modeling the
Physiological Glucose Dynamics," Analytical Chemistry 82(14), 6104-6114 (2010)
25. I. Barman, C. R. Kong, N. C. Dingari, R. R. Dasari and M. S. Feld, "Development
of Robust Calibration Models Using Support Vector Machines for Spectroscopic
Monitoring of Blood Glucose," Analytical Chemistry 82(23), 9719-9726 (2010)
26. M. V. Schulmerich, K. A. Dooley, M. D. Morris, T. M. Vanasse and S. A.
Goldstein, "Transcutaneous fiber optic Raman spectroscopy of bone using annular
illumination and a circular array of collection fibers.," J Biomed Opt 11(6), 060502
(2006)
27. A. Carden, R. M. Rajachar, M. D. Morris and D. H. Kohn, "Ultrastructural changes
accompanying the mechanical deformation of bone tissue: a Raman imaging
study.," Calcif Tissue Int 72(2), 166-175 (2003)
28. N. J. Crane, V. Popescu, M. D. Morris, P. Steenhuis and M. A. Ignelzi, "Raman
spectroscopic evidence for octacalcium phosphate and other transient mineral
species deposited during intramembranous mineralization.," Bone 39(3), 434-442
(2006)
29. E. M. Kanter, E. Vargis, S. Majumder, M. D. Keller, E. Woeste, G. G. Rao and A.
Mahadevan-Jansen, "Application of Raman spectroscopy for cervical dysplasia
diagnosis,"
30. A. Mahadevan-Jansen, K. Mariapphan and P. Konrad, "Methods and devices for
optical stimulation of neural tissues," p. 16, Vanderbilt University, United States
(2005).
31. C. P. Richter, A. I. Matic, J. D. Wells, E. D. Jansen and J. T. Walsh, "Neural
stimulation with optical radiation," Laser Photonics Reviews 5(1), 12 (2011)
32. R. L. McCreery, Raman spectroscopy for chemical analysis, John Wiley & Sons,
New York (2000).
33. ADA, "Diabetes Statistics," http://www.diabetes.org/diabetes-basics/diabetes-
statistics/?loc=DropDownDB-stats (2011).
34. O. S. Khalil, "Non-invasive glucose measurement technologies: an update from
1999 to the dawn of the new millennium," Diabetes technology & therapeutics
6(5), 660-697 (2004)
246
35. A. Tura, A. Maran and G. Pacini, "Non-invasive glucose monitoring: Assessment
of technologies and devices according to quantitative criteria," Diabetes Research
and Clinical Practice 77(1), 16-40 (2007)
36. K. Rebrin and G. M. Steil, "Can interstitial glucose assessment replace blood
glucose measurements?," Diabetes technology & therapeutics 2(3), 461-472
(2000)
37. H. W. Vesper, P. M. Wang, E. Archibold, M. R. Prausnitz and G. L. Myers,
"Assessment of trueness of a glucose monitor using interstitial fluid and whole
blood as specimen matrix," Diabetes technology & therapeutics 8(1), 76-80 (2006)
38. S. J. Yeh, C. F. Hanna and O. S. Khalil, "Monitoring blood glucose changes in
cutaneous tissue by temperature-modulated localized reflectance measurements,"
Clinical chemistry 49(6), 924-934 (2003)
39. K. Kajiwara, T. Uemura, H. Kishikawa, K. Nishida, Y. Hashiguchi, M. Uehara, M.
Sakakida, K. Ichinose and M. Shichiri, "Noninvasive measurement of blood
glucose concentrations by analysing Fourier transform infra-red absorbance
spectra through oral mucosa," Medical & biological engineering & computing
31(17-22 (1993)
40. S. F. Malin, T. L. Ruchti, T. B. Blank, S. N. Thennadil and S. L. Monfre,
"Noninvasive prediction of glucose by near-infrared diffuse reflectance
spectroscopy," Clinical chemistry 45(9), 1651-1658 (1999)
41. P. Williams, Gray's anatomy, Chuichill Livingston, New York (1999).
42. C. Lentner, Geigy Scientific Tables Vol. 3: Physical Chemistry, Composition of
Blood, Hematology, Somatometric Data, CIBA-GEIGY, West Caldwell, NJ
(1984).
43. W. J. Cliff, Blood vessels, Cambridge University Press, Cambridge, United
Kingdom of Great Britain (1976).
44. D. Van Wynsberghe, C. R. Noback and R. Carola, Human anatomy and
physiology, McGraw-Hill, New York (1995).
45. J. Chaiken, W. F. Finney, K. P. Peterson, C. M. Peterson, P. E. Knudson, R. S.
Weinstock and P. Lein, "Noninvasive in-vivo near-infrared vibrational
spectroscopic study of lipid and aqueous phases of skin and near-surface tissues,"
Proceedings of SPIE 3907), 89-97 (2000)
46. J. Chaiken, W. F. Finney, C. M. Peterson, K. P. Peterson, P. E. Knudson, R. S.
Weinstock and P. Lein, "Noninvasive in-vivo tissue-modulated near-infrared

247
vibrational spectroscopic study of mobile and static tissues: blood chemistry,"
Proceedings of SPIE 3918), 135-145 (2000)
47. J. Chaiken, W. F. Finney, P. E. Knudson, K. P. Peterson, C. M. Peterson, X. Yang
and R. S. Weinstock, "Noninvasive blood analysis by tissue-modulated NIR
Raman spectroscopy," Proceedings of SPIE 4368), 134-145 (2001)
48. J. Chaiken, W. F. Finney, P. E. Knudson, K. P. Peterson, C. M. Peterson, X. Yang
and R. S. Weinstock, "Noninvasive in-vivo tissue-modulated Raman spectroscopy
of human blood: microcirculation and viscosity effects," Proceedings of SPIE
4254), 106-118 (2001)
49. J. Chaiken, W. F. Finney, P. E. Knudson, K. P. Peterson, C. M. Peterson, R. S.
Weinstock and D. Hagrman, "Progress in the noninvasive in-vivo tissue-modulated
Raman spectroscopy of human blood," Proceedings of SPIE 4254), 216-227
(2001)
50. J. Chaiken, W. Finney, P. E. Knudson, R. S. Weinstock, M. Khan, R. J. Bussjager,
D. Hagrman, P. Hagrman, Y. Zhao, C. M. Peterson and K. Peterson, "Effect of
hemoglobin concentration variation on the accuracy and precision of glucose
analysis using tissue modulated, noninvasive, in vivo Raman spectroscopy of
human blood: a small clinical study," J Biomed Opt 10(3), 031111 (2005)
51. J. Chaiken, K. Ellis, P. Eslick, L. Piacente and E. Voss, "Noninvasive in vivo
tissue and pulse modulated Raman spectroscopy of human capillary blood and
plasma," Proceedings of SPIE 6093), 609305 (2006)
52. B. D. Beier and A. J. Berger, "Method for automated background subtraction from
Raman spectra containing known contaminants.," Analyst 134(6), 1198-1202
(2009)
53. C. A. Lieber and A. Mahadevan-Jansen, "Automated method for subtraction of
fluorescence from biological Raman spectra," Appl Spectrosc 57(11), 1363-1367
(2003)
54. W. F. Finney, "Noninvasive in vivo tissue modulated quantitative Raman
spectroscopy of human blood," in ProQuest Dissertations and Theses, p. 311 p.,
Syracuse University, United States -- New York (2002).
55. J. J. Burmeister and M. A. Arnold, "Evaluation of measurement sites for
noninvasive blood glucose sensing with near-infrared transmission spectroscopy,"
Clin Chem 45(9), 1621-1627 (1999)

248
56. S. Prahl, "Tabulated molar extinction coefficient for hemoglobin in water," M. R.
C. L. compiled by Scott Prahl using data from W. B. Gratzer, Holly Hill, London,
and N. Kollias, Wellman Laboratories, Harvard Medical School, Boston, Ed.,
Oregon Medical Laser Center, Portland, Oregon (1998).
57. R. R. Anderson and J. A. Parrish, "The Optics Of Human Skin," Journal of
Investigative Dermatology 77(1), 13-19 (1981)
58. K. A. Pasyk, S. V. Thomas, C. A. Hassett, G. W. Cherry and R. Faller, "Regional
differences in capillary density of the normal human dermis," Plast Reconstr Surg
83(6), 939-945; discussion 946-937 (1989)
59. S. I. Yum and J. Roe, "Capillary blood sampling for self-monitoring of blood
glucose," Diabetes Technol Ther 1(1), 29-37 (1999)
60. G. Von Hagen, "Body Worlds: the original exhibition of real human bodies,"
http://www.plastination-products.com/Blood-vessel-configuration/Human-blood-
vessel-configuration/Art-objects/Blood-vessel-configuration-of-a-human-
hand::1620.html.
61. L. A. Jones and S. J. Lenderman, Human hand function, Oxford University Press,
Inc., New York, New York (2006).
62. V. V. Tuchin, Tissue Optics: Light Scattering Methods and Instruments for
Medical Diagnosis, SPIE PRESS, Bellingham, WA (2007).
63. A. J. Jaap, A. C. Shore, A. J. Stockman and J. E. Tooke, "Skin capillary density in
subjects with impaired glucose tolerance and patients with type 2 diabetes," Diabet
Med 13(2), 160-164 (1996)
64. A. M. Enejder, T. G. Scecina, J. Oh, M. Hunter, W. C. Shih, S. Sasic, G. L.
Horowitz and M. S. Feld, "Raman spectroscopy for noninvasive glucose
measurements," J Biomed Opt 10(3), 031114 (2005)
65. G. C. Holst, CCD Arrays, Cameras, and Displays, JCD Publishing (1998).
66. J. Chaiken, E. Voss, R. J. Bussjager and G. Shaheen, "Towards an improved
assignment of spectral features in tissue modulated non-invasive Raman
spectroscopy of human fingertips," Proceedings of SPIE 6430), 643004 (2007)
67. J. Chaiken and C. M. Peterson, "Method for determining lipid and protein content
of tissue," LighTouch Medical, Inc., United States (2002).
68. H. F. a. E. Society, "Definition of Human Factors and Ergonomics,"
http://www.hfes.org/Web/EducationalResources/HFEdefinitionsmain.html.

249
69. S. J. Barker, ""Motion-resistant" pulse oximetry: a comparison of new and old
models," Anesth Analg 95(4), 967-972, table of contents (2002)
70. Masimo, "Signal extraction technology (SET)," M. Corporation, Ed.,
http://www.masimo.com/pdf/whitepaper/LAB1035R.PDF (2002).
71. U. S. FDA, "General Human Factors Information and Resources,"
http://www.fda.gov/MedicalDevices/DeviceRegulationandGuidance/HumanFactor
s/ucm124829.htm (2012).
72. D. Ashbaugh, "Friction skin anatomy,"
http://ridgesandfurrows.homestead.com/friction_skin.html (2004).
73. P. C. Burridge, "Question of fingerprints," in NZ Security, New Zealand (2002).
74. H. N. Ho and L. A. Jones, "Modeling the thermal responses of the skin surface
during hand-object interactions," J Biomech Eng 130(2), 021005 (2008)
75. O. Jay and G. Havenith, "Differences in finger skin contact cooling response
between an arterial occlusion and a vasodilated condition," J Appl Physiol 100(5),
1596-1601 (2006)
76. S. A. Mascaro and H. H. Asada, "Measurement of finger posture and three-axis
fingertip touch force using fingernail sensors," Robotics and Automation, IEEE
Transactions on 20(1), 26-35 (2004)
77. S. A. Mascaro and H. H. Asada, "The common patterns of blood perfusion in the
fingernail bed subject to fingertip touch force and finger posture," Haptics-e: the
Electronic Journal of Haptics Research 4(3), 1-6 (2006)
78. J. D. Bronzino, Medical devices and systems, CRC Press, Boca Raton, FL (2006).
79. K. Brandis, "Fluid Physiology,"
http://www.anaesthesiamcq.com/FluidBook/index.php.
80. J. Chaiken, B. Deng, J. Goodisman, G. Shaheen and R. J. Bussjager, "Analyzing
near-infrared scattering from human skin to monitor changes in hematocrit," J
Biomed Opt 16(9), 097005 (2011)
81. J. Chaiken, J. Goodisman, B. Deng, R. J. Bussjager and G. Shaheen,
"Simultaneous, noninvasive observation of elastic scattering, fluorescence and
inelastic scattering as a monitor of blood flow and hematocrit in human fingertip
capillary beds," J Biomed Opt 14(5), 050505 (2009)

250
82. I. Barman, G. P. Singh, R. R. Dasari and M. S. Feld, "Turbidity-Corrected Raman
Spectroscopy for Blood Analyte Detection," Analytical Chemistry 81(11), 4233-
4240 (2009)
83. R. Steponavicius and S. N. Thennadil, "Extraction of chemical information of
suspensions using radiative transfer theory to remove multiple scattering effects:
application to a model two-component system," Anal Chem 81(18), 7713-7723
(2009)
84. C. Reble, I. Gersonde, C. A. Lieber and J. Helfmann, "Influence of tissue
absorption and scattering on the depth dependent sensitivity of Raman fiber probes
investigated by Monte Carlo simulations," Biomed Opt Express 2(3), 520-533
(2011)
85. J. R. Lakowicz, Principles of fluorescence spectroscopy, Springer, New York, NY
(2006).
86. E. Salomatina, B. Jiang, J. Novak and A. N. Yaroslavsky, "Optical properties of
normal and cancerous human skin in the visible and near-infrared spectral range,"
J Biomed Opt 11(6), 064026 (2006)
87. M. Meinke, G. Müller, J. Helfmann and M. Friebel, "Optical properties of platelets
and blood plasma and their influence on the optical behavior of whole blood in the
visible to near infrared wavelength range," J Biomed Opt 12(1), 014024 (2007)
88. S. L. Jacques, "Origins of tissue optical properties in the UVA, Visible, and NIR
regions," in OSA TOPS on Advances in Optical Imaging and Photon Migration R.
R. Alfano and J. G. Fujimoto, Eds., pp. 364–369, Optical Society of America,
Washington, D.C. (1996).
89. C. D. Forbes and G. D. O. Lowe, Physics in Medicine and Biology Encyclopedia,
Pergammon Press, New York (1986).
90. J. Chaiken, "Laser chemistry of organometallic species: conceptual framework and
overview," in Laser chemistry of organometallics J. Chaiken, Ed., American
Chemical Society, Washington, DC (1993).
91. H. Zeng, C. MacAulay, D. I. McLean, B. Palcic and H. Lui, "The dynamics of
laser-induced changes in human skin autofluorescence--experimental
measurements and theoretical modeling," Photochem Photobiol 68(2), 227-236
(1998)
251
92. B. Deng, C. Wright, E. Lewis-Clark, G. Shaheen, R. Geier and J. Chaiken, "Direct
noninvasive observation of near-infrared photobleaching of autofluorescence in
human volar side fingertips in vivo," Proceedings of SPIE 7560), 75600P (2010)
93. I. Barman, C. R. Kong, G. P. Singh and R. R. Dasari, "Effect of photobleaching on
calibration model development in biological Raman spectroscopy," J Biomed Opt
16(1), 011004 (2011)
94. S. Gupta, Bhawna, P. Goswami, A. Agarwal and A. Pradhan, "Experimental and
theoretical investigation of fluorescence photobleaching and recovery in human
breast tissue and tissue phantoms," Appl Opt 43(5), 1044-1052 (2004)
95. K. Golcuk, G. S. Mandair, A. F. Callender, N. Sahar, D. H. Kohn and M. D.
Morris, "Is photobleaching necessary for Raman imaging of bone tissue using a
green laser?," Biochimica et Biophysica Acta 1758(868-873 (2006)
96. B. Deng, A. Simental, P. Lutz, G. Shaheen and J. Chaiken, "Singlet oxygen
induced advanced glycation end-product photobleaching of in vivo human
fingertip autofluorescence," in Biomedical Vibrational SpectroscopyV: Advances
in Research and Industry A. Mahadevan-Jansen and W. Petrich, Eds., p. 82190D,
Proceedings of SPIE, San Francisco, CA (2012).
97. T. Schlosser, K. Pagonidis, C. U. Herborn, P. Hunold, K. U. Waltering, T. C.
Lauenstein and J. Barkhausen, "Assessment of left ventricular parameters using
16-MDCT and new software for endocardial and epicardial border delineation,"
AJR Am J Roentgenol 184(3), 765-773 (2005)
98. G. F. Birchard, "Optimal hematocrit: theory, regulation and implications," Amer.
Zool. 37(65-72 (1997)
99. J. K. Leypoldt, A. K. Cheung, R. R. Steuer, D. H. Harris and J. M. Conis,
"Determination of circulating blood volume by continuously monitoring
hematocrit during hemodialysis," J Am Soc Nephrol 6(2), 214-219 (1995)
100. M. Nogawa, S. Tanaka and K. Yamakoshi, "Development of an optical arterial
hematocrit measurement method: pulse hematometry," Conf Proc IEEE Eng Med
Biol Soc 3(2634-2636 (2005)
101. G. Yoon and K. J. Jeon, "Noninvasive hematocrit monitoring based on parameter-
optimization of a LED finger probe," J. Opt. Soc. Korea 9(107-110 (2005)
102. B. Y. Creer, H. A. Smedel and R. C. Wingrove, "Centrifuge study of pilot
tolerance to acceleration and effects of acceleration on pilot performance," NASA
Tech. Note No. D-337, NASA, Washington, DC (1960).

252
103. A. M. Lardi, C. Hirst, A. J. Mortimer and C. N. McCollum, "Evaluation of the
HemoCue for measuring intra-operative haemoglobin concentrations: a
comparison with the Coulter Max-M," Anaesthesia 53(4), 349-352 (1998)
104. H. Gehring, C. Hornberger, L. Dibbelt, A. Rothsigkeit, K. Gerlach, J. Schumacher
and P. Schmucker, "Accuracy of point-of-care-testing (POCT) for determining
hemoglobin concentrations," Acta Anaesthesiol Scand 46(8), 980-986 (2002)
105. Hema Metrics, "Crit-Line hematocrit accuracy," Hema MetricsTM
Tech Note
(2003).
106. J. M. Fritsch-Yelle, V. A. Convertino and T. T. Schlegel, "Acute manipulations of
plasma volume alter arterial pressure responses during Valsalva maneuvers," J
Appl Physiol 86(6), 1852-1857 (1999)
107. M. J. Noordzij, J. D. Lefrandt, R. Graaff and A. J. Smit, "Dermal factors
influencing measurement of skin autofluorescence," Diabetes Technol Ther 13(2),
165-170 (2011)
108. V. V. Tuchin, "Light scattering study of tissues," Physics-Uspekhi 40(5), (1997)
109. S. K. Grandhee and V. M. Monnier, "Mechanism of formation of the Maillard
protein cross-link pentosidine. Glucose, fructose, and ascorbate as pentosidine
precursors," J Biol Chem 266(18), 11649-11653 (1991)
110. E. Gebel, "High blood glucose and diabetes complications: the buildup of
molecules known as AGEs may be the key link," Diabetes Forecast 63(2), (2010)
111. J. Blackwell, K. M. Katika, L. Pilon, K. M. Dipple, S. R. Levin and A. Nouvong,
"In vivo time-resolved autofluorescence measurements to test for glycation of
human skin," J Biomed Opt 13(1), 014004 (2008)
112. B. D. Beier and A. J. Berger, "Method for automated background subtraction from
Raman spectra containing known contaminants," Analyst 134(6), 1198-1202
(2009)
113. T. Saxena, B. Deng, D. Stelzner, J. Hasenwinkel and J. Chaiken, "Raman
spectroscopic investigation of spinal cord injury in a rat model," J Biomed Opt
16(2), 027003 (2011)
114. M. J. Goetz, G. L. Coté, R. Erckens, W. March and M. Motamedi, "Application of
a multivariate technique to Raman spectra for quantification of body chemicals,"
IEEE Trans Biomed Eng 42(7), 728-731 (1995)
253
115. H. Iwata, S. Nishio, M. Yokoyama, A. Matsumoto and M. Takeuchi, "Solubility of
uric acid and supersaturation of monosodium urate: why is uric acid so highly
soluble in urine?," J Urol 142(4), 1095-1098 (1989)
116. I. R. Lewis and H. G. M. Edwards, Handbook of Raman spectroscopy: from the
research laboratory to the process line, Marcel Dekker, Inc., New York (2001).
117. Z. Huang, H. Lui, X. K. Chen, A. Alajlan, D. I. McLean and H. Zeng, "Raman
spectroscopy of in vivo cutaneous melanin," J Biomed Opt 9(6), 1198-1205 (2004)
118. Z. Matuszak and M. Wasilewska-Radwanska, "Optical properties of melanin
solutions, estimation of polymer particles size," in Symposium on Photonics
Technologies for 7th Framework Program A. Popiolek-Masajada, Ed., pp. 533-
537, Oficyna Wydawnicza Politechniki Wroclawskiej, Wroclaw, Poland (2006).
119. B. G. Frushour and J. L. Koenig, "Raman scattering of collagen, gelatin, and
elastin," Biopolymers 14(2), 379-391 (1975)
120. R. Drezek, A. Dunn and R. Richards-Kortum, "Light scattering from cells: finite-
difference time-domain simulations and goniometric measurements," Appl Opt
38(16), 3651-3661 (1999)
121. B. R. Masters, P. T. So and E. Gratton, "Multiphoton excitation fluorescence
microscopy and spectroscopy of in vivo human skin," Biophys J 72(6), 2405-2412
(1997)
122. H. G. Breunig, H. Studier and K. König, "Multiphoton excitation characteristics of
cellular fluorophores of human skin in vivo," Opt Express 18(8), 7857-7871 (2010)
123. P. Kayatz, G. Thumann, T. T. Luther, J. F. Jordan, K. U. Bartz-Schmidt, P. J. Esser
and U. Schraermeyer, "Oxidation causes melanin fluorescence," Invest Ophthalmol
Vis Sci 42(1), 241-246 (2001)
124. J. Riesz, J. Gilmore and P. Meredith, "Quantitative scattering of melanin
solutions," Biophys J 90(11), 4137-4144 (2006)
125. M. Scholz, G. Stankovic, G. Seewald and D. Leupold, "Uncovering of melanin
fluorescence in human skin tissue," Proceedings of SPIE - OSA Biomedical Optics
6633(663321 (2007)
126. A. Slominski, D. J. Tobin, S. Shibahara and J. Wortsman, "Melanin pigmentation
in mammalian skin and its hormonal regulation," Physiol Rev 84(4), 1155-1228
(2004)

254
127. B. R. Wood, L. Hammer, L. Davis and D. McNaughton, "Raman
microspectroscopy and imaging provides insights into heme aggregation and
denaturation within human erythrocytes," J Biomed Opt 10(1), 14005 (2005)
128. S. Franzen, S. E. Wallace-Williams and A. P. Shreve, "Heme charge-transfer band
III is vibronically coupled to the Soret band," J Am Chem Soc 124(24), 7146-7155
(2002)
129. L. Chen, J. Y. Hu and S. Q. Wang, "The role of antioxidants in photoprotection: A
critical review," J Am Acad Dermatol (2012)
130. S. Ramstad, N. Le Anh-Vu and A. Johnsson, "The temperature dependence of
porphyrin production in Propionibacterium acnes after incubation with 5-
aminolevulinic acid (ALA) and its methyl ester (m-ALA)," Photochem Photobiol
Sci 5(1), 66-72 (2006)
131. M. Zandomeneghi, C. Festa, C. Angelletti, G. Menconi, T. Sicuro and I. Cozzani,
"Detection of near-infrared porphyrin fluorescence excited in experimental animal
tumour by the HeNe laser," Lasers in Medical Science 3(1), 3 (1988)
132. H. Ou-Yang, G. Stamatas and N. Kollias, "Spectral responses of melanin to
ultraviolet A irradiation," J Invest Dermatol 122(2), 492-496 (2004)
133. G. Goerz, A. Link-Mannhardt, K. Bolsen, M. Zumdick, C. Fritsch and N. Y.
Schürer, "Porphyrin concentrations in various human tissues," Exp Dermatol 4(4
Pt 1), 218-220 (1995)
134. H. Liu, C. Macaulay, H. Zeng, D. I. Mclean and R. Bissonnette, "Photoacitivation
of endogenous porphyrins for treatment of psoriasis," p. 22, The University of
British Columbia, USA (2001).
135. N. Kollias, B. Choi, H. Zeng, R. S. Malek, B. J. Wong, J. F. R. Ilgner, K. W.
Gregory, G. J. Tearney, L. Marcu, H. Hirschberg and S. J. Madsen, "Fluorescence
spectroscopy for endogenous porphyrins in human facial skin," in Photonic
Therapeutics and Diagnostics V, p. 716105, Proceedings of SPIE, San Jose, CA,
USA (2009).
136. R. Na, I. M. Stender, M. Henriksen and H. C. Wulf, "Autofluorescence of human
skin is age-related after correction for skin pigmentation and redness," J Invest
Dermatol 116(4), 536-540 (2001)
137. R. Singh, A. Barden, T. Mori and L. Beilin, "Advanced glycation end-products: a
review," Diabetologia 44(2), 129-146 (2001)

255
138. J. L. Wautier and P. J. Guillausseau, "Advanced glycation end products, their
receptors and diabetic angiopathy," Diabetes Metab 27(5 Pt 1), 535-542 (2001)
139. R. Meerwaldt, T. Links, C. Zeebregts, R. Tio, J. L. Hillebrands and A. Smit, "The
clinical relevance of assessing advanced glycation endproducts accumulation in
diabetes," Cardiovasc Diabetol 7(29 (2008)
140. S. J. Cho, G. Roman, F. Yeboah and Y. Konishi, "The road to advanced glycation
end products: a mechanistic perspective," Curr Med Chem 14(15), 1653-1671
(2007)
141. H. F. Bunn and P. J. Higgins, "Reaction of monosaccharides with proteins:
possible evolutionary significance," Science 213(4504), 222-224 (1981)
142. J. V. Valencia, S. C. Weldon, D. Quinn, G. H. Kiers, J. DeGroot, J. M. TeKoppele
and T. E. Hughes, "Advanced glycation end product ligands for the receptor for
advanced glycation end products: biochemical characterization and formation
kinetics," Anal Biochem 324(1), 68-78 (2004)
143. D. G. Dyer, J. A. Dunn, S. R. Thorpe, K. E. Bailie, T. J. Lyons, D. R. McCance
and J. W. Baynes, "Accumulation of Maillard reaction products in skin collagen in
diabetes and aging," J Clin Invest 91(6), 2463-2469 (1993)
144. R. D. Semba, E. J. Nicklett and L. Ferrucci, "Does accumulation of advanced
glycation end products contribute to the aging phenotype?," J Gerontol A Biol Sci
Med Sci 65(9), 963-975 (2010)
145. D. G. Dyer, J. A. Blackledge, S. R. Thorpe and J. W. Baynes, "Formation of
pentosidine during nonenzymatic browning of proteins by glucose. Identification
of glucose and other carbohydrates as possible precursors of pentosidine in vivo," J
Biol Chem 266(18), 11654-11660 (1991)
146. J. W. Nin, A. Jorsal, I. Ferreira, C. G. Schalkwijk, M. H. Prins, H. H. Parving, L.
Tarnow, P. Rossing and C. D. Stehouwer, "Higher plasma soluble Receptor for
Advanced Glycation End Products (sRAGE) levels are associated with incident
cardiovascular disease and all-cause mortality in type 1 diabetes: a 12-year follow-
up study," Diabetes 59(8), 2027-2032 (2010)
147. M. W. Turner and B. Hulme, Plasma proteins: an introduction, Pitman Medical
(1971).
148. J. Shaller, S. Gerber, U. Kaempfer, S. Lejon and C. Trachsel, Human blood plasma
proteins: structure and function, Wiley (2008).

256
149. T. J. Peters, All about albumin: biochemistry, genetics, and medical applications,
Academic Press, San Diego, CA (1995).
150. A. D. Association, "Executive summary: standards of medical care in diabetes--
2011," Diabetes Care 34 Suppl 1(S4-10 (2011)
151. M. L. Larsen, M. Hørder and E. F. Mogensen, "Effect of long-term monitoring of
glycosylated hemoglobin levels in insulin-dependent diabetes mellitus," N Engl J
Med 323(15), 1021-1025 (1990)
152. T. Miyata, Y. Ueda, A. Yoshida, S. Sugiyama, Y. Iida, M. Jadoul, K. Maeda, K.
Kurokawa and C. van Ypersele de Strihou, "Clearance of pentosidine, an advanced
glycation end product, by different modalities of renal replacement therapy,"
Kidney Int 51(3), 880-887 (1997)
153. D. R. Sell and V. M. Monnier, "Structure elucidation of a senescence cross-link
from human extracellular matrix. Implication of pentoses in the aging process," J
Biol Chem 264(36), 21597-21602 (1989)
154. M. Sensi, F. Pricci, C. Pugliese, M. G. De Rossi, F. S. Celi, A. Cristina, S.
Morano, D. Andreani and U. Di Mario, "Enhanced nonenzymatic glycation of eye
lens proteins in experimental diabetes mellitus: an approach for the study of
protein alterations as mediators of normal aging phenomena," Arch Gerontol
Geriatr 15 Suppl 1(333-337 (1992)
155. D. R. Sell, E. C. Carlson and V. M. Monnier, "Differential effects of type 2 (non-
insulin-dependent) diabetes mellitus on pentosidine formation in skin and
glomerular basement membrane," Diabetologia 36(10), 936-941 (1993)
156. P. Ulrich and A. Cerami, "Protein glycation, diabetes, and aging," Recent Prog
Horm Res 56(1-21 (2001)
157. N. J. McIntyre, L. J. Chesterton, S. G. John, H. J. Jefferies, J. O. Burton, M. W.
Taal, R. J. Fluck and C. W. McIntyret, "Tissue-Advanced Glycation End Product
Concentration in Dialysis Patients," Clinical Journal of the American Society of
Nephrology 5(1), 51-55 (2010)
158. A. Goldin, J. A. Beckman, A. M. Schmidt and M. A. Creager, "Advanced
glycation end products: sparking the development of diabetic vascular injury,"
Circulation 114(6), 597-605 (2006)
159. A. Prasad, P. Bekker and S. Tsimikas, "Advanced Glycation Endproducts and
Diabetic Cardiovascular Disease," Cardiol Rev (2012)

257
160. D. R. Sell, R. H. Nagaraj, S. K. Grandhee, P. Odetti, A. Lapolla, J. Fogarty and V.
M. Monnier, "Pentosidine: a molecular marker for the cumulative damage to
proteins in diabetes, aging, and uremia," Diabetes Metab Rev 7(4), 239-251 (1991)
161. L. Y. Xu, L. Zhu, L. Zhang, F. Yu, Y. Liu, G. Zhang and L. S. Wu, "Design of
advanced glycation endproducts fluorescence spectrum detecting system," Guang
Pu Xue Yu Guang Pu Fen Xi 29(8), 2298-2301 (2009)
162. E. Hull, M. Ediger, A. Unione, E. Deemer, M. Stroman and J. Baynes,
"Noninvasive, optical detection of diabetes: model studies with porcine skin," Opt
Express 12(19), 4496-4510 (2004)
163. I. Nemet, "AGE database," p. 30, IMARS, http://www.imars.org/ (2008).
164. S. Taneda and V. M. Monnier, "ELISA of pentosidine, an advanced glycation end
product, in biological specimens," Clin Chem 40(9), 1766-1773 (1994)
165. R. H. Nagaraj, T. S. Kern, D. R. Sell, J. Fogarty, R. L. Engerman and V. M.
Monnier, "Evidence of a glycemic threshold for the formation of pentosidine in
diabetic dog lens but not in collagen," Diabetes 45(5), 587-594 (1996)
166. J. R. Requena, D. L. Price, S. R. Thorpe and J. W. Baynes, "Measurement of
pentosidine in biological samples," Methods Mol Med 38(209-217 (2000)
167. J. R. Hoidal, "Reactive oxygen species and cell signaling," Am J Respir Cell Mol
Biol 25(6), 661-663 (2001)
168. R. Tuma, "The two faces of oxygen," Sci Aging Knowledge Environ 2001(1), oa5
(2001)
169. M. Niedre, M. S. Patterson and B. C. Wilson, "Direct near-infrared luminescence
detection of singlet oxygen generated by photodynamic therapy in cells in vitro
and tissues in vivo," Photochem Photobiol 75(4), 382-391 (2002)
170. H. Messmann, E. Endlicher, C. M. Gelbmann and J. Scholmerich, "Fluorescence
endoscopy and photodynamic therapy," Dig Liver Dis 34(10), 754-761 (2002)
171. J. Baier, T. Maisch, M. Maier, E. Engel, M. Landthaler and W. Bäumler, "Singlet
oxygen generation by UVA light exposure of endogenous photosensitizers,"
Biophys J 91(4), 1452-1459 (2006)
172. S. Mathai, T. A. Smith and K. P. Ghiggino, "Singlet oxygen quantum yields of
potential porphyrin-based photosensitisers for photodynamic therapy," Photochem
Photobiol Sci 6(9), 995-1002 (2007)

258
173. S. Jockusch, N. J. Turro, E. K. Thompson, M. Gouterman, J. B. Callis and G. E.
Khalil, "Singlet molecular oxygen by direct excitation," Photochem. Photobiol.
Sci. 7(235-239 (2008)
174. D. A. McQuarrie and J. D. Simon, Physical chemistry: a molecular approach,
University Science Books, Sausalito, CA (1997).
175. L. Guo, C. N. Coretsopoulos and A. B. Scranton, "Measurement of the dissolved
oxygen concentration in acrylate monomers with a novel photochemical method,"
Journal of Polymer Science: Part A: Polymer Chemistry 42(1285-1292 (2004)
176. J. C. Dabrowiak, Metals in Medicine, John Wiley & Sons, Ltd, West Sussex,
United Kingdom (2009).
177. W. Spiller, H. Kliesch, D. Wohrle, S. Hackbarth, B. Roder and G. Schnurpfeil,
"Singlet oxygen quantum yields of different photosensitizers in polar solvents and
micellar solutions," Journal of Porphyrins and Phthalocyanines 2(2), 145-158
(1998)
178. C. Schweitzer and R. Schmidt, "Physical mechanisms of generation and
deactivation of singlet oxygen," Chem Rev 103(5), 1685-1757 (2003)
179. J. Kopecky, Organic photochemistry: a visual approach, Wiley-VCH Verlag
GmbH, Weiheim (1992).
180. M. A. J. Rodgers and P. T. Snowden, "Lifetime of oxygen O2(1δg) in liquid water
as determined by time-resolved infrared luminescence measurements," J. Am.
Chem. Soc. 104(20), 5541-5543 (1982)
181. J. G. Parker and W. D. Stanbro, "Optical determination of the rates of formation
and decay of O2(1Δg) in H2O, D2O and other solvents," Journal of Photochemistry
25(2-4), 545-547 (1984)
182. S. C. Ameta, P. B. Punjabi, C. S. Chobisa, N. Mangal and R. Bhardwaj, "Singlet
molecular oxygen," Asian Journal of Chemistry Reviews 1(2), 106-124 (1990)
183. C. Flors, M. J. Fryer, J. Waring, B. Reeder, U. Bechtold, P. M. Mullineaux, S.
Nonell, M. T. Wilson and N. R. Baker, "Imaging the production of singlet oxygen
in vivo using a new fluorescent sensor, Singlet Oxygen Sensor Green," J Exp Bot
57(8), 1725-1734 (2006)
184. A. Gollmer, J. Arnbjerg, F. H. Blaikie, B. W. Pedersen, T. Breitenbach, K.
Daasbjerg, M. Glasius and P. R. Ogilby, "Singlet Oxygen Sensor Green®:
photochemical behavior in solution and in a mammalian cell," Photochem
Photobiol 87(3), 671-679 (2011)
259
185. X. Ragàs, A. Jiménez-Banzo, D. Sánchez-García, X. Batllori and S. Nonell,
"Singlet oxygen photosensitisation by the fluorescent probe Singlet Oxygen Sensor
Green," Chem Commun (Camb) 20), 2920-2922 (2009)
186. X. Chen, X. Tian, I. Shin and J. Yoon, "Fluorescent and luminescent probes for
detection of reactive oxygen and nitrogen species," Chem Soc Rev 40(9), 4783-
4804 (2011)
187. "Singlet Oxygen Sensor Green Reagent," M. Probes, Ed., pp. 1-2,
http://tools.invitrogen.com/content/sfs/manuals/mp36002.pdf (2004).
188. H. J. Lee, M. H. Lee, S. G. Han, H.-Y. Kim and Y. H. Won, "Photo-oxidation in
the photobleaching process of a non-linear optical polymer," Thin Solid Films
283(1), 247-250 (1996)
189. N. B. Vicente, J. E. Diaz Zamboni, J. F. Adur, E. V. Paravani and V. H. Casco,
"Photobleaching correction in fluorescence microscopy images," Journal of
Physics: Conference Series 90(012068 (2007)
190. L. Song, E. J. Hennink, I. T. Young and H. J. Tanke, "Photobleaching kinetics of
fluorescein in quantitative fluorescence microscopy," Biophys J 68(6), 2588-2600
(1995)
191. Z. Matuszak, M. A. Bilska, K. J. Reszka, C. F. Chignell and P. Bilski, "Interaction
of singlet molecular oxygen with melatonin and related indoles," Photochem
Photobiol 78(5), 449-455 (2003)
192. N. Soh, "Recent advances in fluorescent probes for the detection of reactive
oxygen species," Anal Bioanal Chem 386(3), 532-543 (2006)
193. W. Y. NG and J. Walkley, "Diffusion of gases in liquids: the constant size bubble
method," Canadian Journal of Chemistry 47(1075-1077 (1969)
194. D. B. Nowak, A. J. Lawrence and E. J. Sánchez, "Apertureless near-field/far-field
CW two-photon microscope for biological and material imaging and spectroscopic
applications," Appl Opt 49(35), 6766-6771 (2010)
195. S. W. Hell, M. Booth, S. Wilms, C. M. Schnetter, A. K. Kirsch, D. J. Arndt-Jovin
and T. M. Jovin, "Two-photon near- and far-field fluorescence microscopy with
continuous-wave excitation," Opt Lett 23(15), 1238-1240 (1998)
196. J. D. Ingle and S. R. Crouch, Spectrochemical Analysis, Prentice Hall, Englewood
Cliffs, NJ (1988).
260
197. O. K. Baskurt, O. Yalcin, F. Gungor and H. J. Meiselman, "Hemorheological
parameters as determinants of myocardial tissue hematocrit values," Clin
Hemorheol Microcirc 35(1-2), 45-50 (2006)
198. J. W. McMurdy, G. D. Jay, S. Suner and G. Crawford, "Noninvasive optical,
electrical, and acoustic methods of total hemoglobin determination," Clin Chem
54(2), 264-272 (2008)
199. V. Twersky, "Absorption and multiple scattering by biological suspensions," J Opt
Soc Am 60(8), 1084-1093 (1970)
200. Q. J. Milner and G. R. Mathews, "An assessment of the accuracy of pulse
oximeters," Anaesthesia 67(4), 396-401 (2012)
201. S. J. Barker and K. K. Tremper, "Pulse oximetry: applications and limitations," Int
Anesthesiol Clin 25(3), 155-175 (1987)
202. E. Gayat, A. Bodin, C. Sportiello, M. Boisson, J. F. Dreyfus, E. Mathieu and M.
Fischler, "Performance evaluation of a noninvasive hemoglobin monitoring
device," Ann Emerg Med 57(4), 330-333 (2011)
203. G. Gutierrez, H. D. Reines and M. E. Wulf-Gutierrez, "Clinical review:
hemorrhagic shock," Crit Care 8(5), 373-381 (2004)
204. B. R. Soller, Y. Yang, O. O. Soyemi, K. L. Ryan, C. A. Rickards, J. M. Walz, S.
O. Heard and V. A. Convertino, "Noninvasively determined muscle oxygen
saturation is an early indicator of central hypovolemia in humans," J Appl Physiol
104(2), 475-481 (2008)
205. American National Standards Institute (ANSI), "Safe use of lasers in health care,"
pp. ANSI Z136.133-2011 (2011).
206. A. Rosenberg and D. Clark, "manuscript in preparation," (2012).

261
VITA
NAME OF AUTHOR: Bin Deng
PLACE OF BIRTH: Luoyang, Henan, China
EDUCATION:
Bachelor of Science in Biomedical Engineering, 2004, Tianjin University
Master of Science in Measuring and Testing Technology and Instrument, 2007,
Tianjin University
AWARDS AND HONORS:
1999 Academic Excellence Award, Tianjin University
2004-2006 Merit Student Scholarship, Tianjin University
2009-2011 WiSE Future Professoriate Program Award , Syracuse University
PROFESSIONAL EXPERIENCE:
2007-2008 Teaching Assistant, Department of Biomedical and Chemical
Engineering, Syracuse University
2010 Teaching Assistant, Department of Chemistry, Syracuse University
2010-2012 Vise President, Student Chapter of Society for Biomaterials,
Syracuse University
CONFERENCE ATTENDED:
SPIE Photonics West – BiOS, San Francisco, CA, Jan 23-28, 2010
XXII ICORS, Boston, MA, August 8-13, 2010
SPIE Photonics West – BiOS, San Francisco, CA, Jan 21-26, 2012
PUBLICATIONS:
1. Bin Deng, Anabel Simental , Patrick Lutz, George Shaheen, Joseph Chaiken, Singlet
oxygen induced advanced glycation endproduct photobleaching of in vivo human
fingertip autofluorescence, Proc. of SPIE, Vol. 8219, 82190D, 2012
2. Joseph Chaiken, Bin Deng, Jerry Goodisman, George Shaheen, Rebecca J. Bussjager,
Analyzing near infrared scattering from human skin to monitor changes in hematocrit,

262
Proc. of SPIE, Vol.8219, 821908, 2012
3. Joseph Chaiken, Bin Deng, Jerry Goodisman, G. Shaheen, R. J. Bussjager, Analyzing
near-infrared scattering from human skin to monitor changes in hematocrit, Journal of
Biomedical Optics, 16(9), 097005, 2011
4. Tarun Saxena, Bin Deng, Dennis Stelzner, Julie Hasenwinkel, Joseph Chaiken,
Raman spectroscopic investigation of spinal cord injury in a rat model, Journal of
Biomedical Optics, 16(2), 027003, 2011
5. Tarun Saxena, Bin Deng, Kyle Hoellger, Eric Lewis-Clark, Julie M. Hasenwinkel,
Joseph Chaiken, Near infra-red Raman spectroscopic study of reactive gliosis and the
glial scar in injured rat spinal cords, Proc. of SPIE, Vol.7560, 75600I, 2010
6. Bin Deng, Colin Wright, Eric Lewis-Clark, George Shaheen, Roman Geier, Joseph
Chaiken, Direct noninvasive observation of near infrared photobleaching of
autofluorescence in human volar side fingertips in vivo, Proc. of SPIE, Vol. 7560,
75600P, 2010
7. Joseph Chaiken, Bin Deng, Rebecca J. Bussjager, George Shaheen, David Rice, Dave
Stehlik, John Fayos, Instrument for near infrared emission spectroscopic probing of
human fingertips in vivo, Review of Scientific Instruments, 81, 034301, 2010
8. Joseph Chaiken, Jerry Goodisman, Bin Deng, Rebecca J. Bussjaeger, George
Shaheen, Simultaneous, noninvasive observation of elastic scattering, fluorescence
and inelastic scattering as a monitor of blood glow and hematocrit in human fingertip
capillary beds, Journal of Biomedical Optics, 14(05), 050505, 1st Sep. 2009
9. Wenliang Chen, Bin Deng, Rong Liu, Xiaoyu Gu, Kexin Xu, Methodology of
effective glucose-specific signal extraction in complicated sample, Proc. of SPIE, Vol.
6445, 64450L, 14th
Feb. 2007
10. Xiaoyu Gu, Bin Deng, Lin An, Wenliang Chen, Kexin Xu, The feasibility
investigation of non-invasive blood glucose sensing based on near-infrared
spectroscopy, Proc. of SPIE, Vol. 6094, 60940J, 27th
Feb. 2006
11. Rong Liu, Bin Deng, Wenliang Chen, Kexin Xu, Next step of non-invasive glucose
monitor by NIR technique from the well controlled measuring condition and results,
Optical and Quantum Electronics, 37, 1305-1317, 2005