the role of foreign direct investment in transition
TRANSCRIPT

The Role of Foreign Direct Investment in Transition
After Fifteen Years of Market Reforms in Transition Economies: New Challenges and Perspectives for the Industrial Sector
United Nations Economic Commission for Europe, Geneva, 24-25 May 2005
Kálmán KalotayEconomic Affairs OfficerUnited Nations Conference onTrade and Development

Inward FDI in economies in transition is big…FDI inflows, 1992-2003, US$ billion
0
5
10
15
20
25
30
35
40
1992 1993 1994 1995 1996 1997 1998 1999 2000 2001 2002 2003
CIS
Russian Federation
South-East Europe
New EU members

… but marginal on global scaleWorld inward FDI stock, 2003, %
Developed economies69%
Economies in transition4%
Developing economies27%
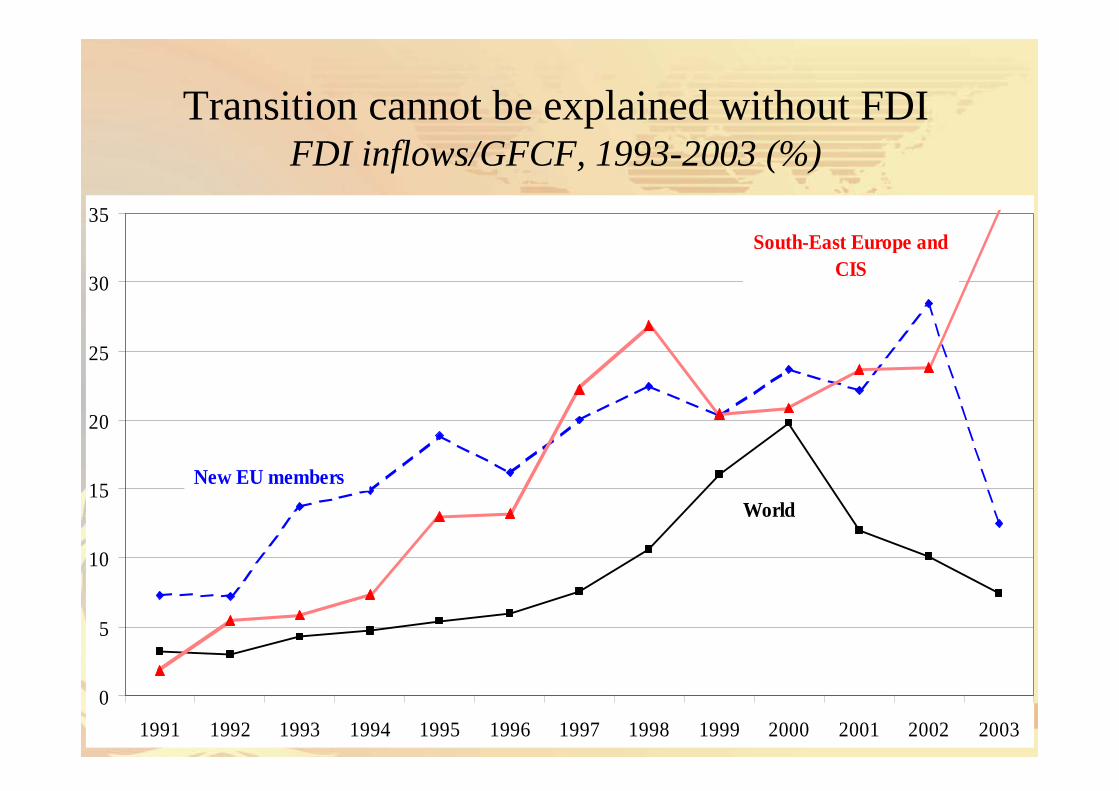
Transition cannot be explained without FDIFDI inflows/GFCF, 1993-2003 (%)
0
5
10
15
20
25
30
35
1991 1992 1993 1994 1995 1996 1997 1998 1999 2000 2001 2002 2003
South-East Europe and CIS
New EU members
World

Types of contribution of FDI to transition
• …to the establishment and rise of a private sector
• …to the quality of the market economy
• …financial resources during capital-intensive transformation
• … to structural change and export competitiveness

Contribution to the rise of a private sector
• Participation in privatization
• Vertical linkages
• (Spillovers)
Subsequent analysis: privatization

Role of FDI in privatizationIncreasingly qualitative, as the quantitative rise of private
sector to internationally comparable levels is complete
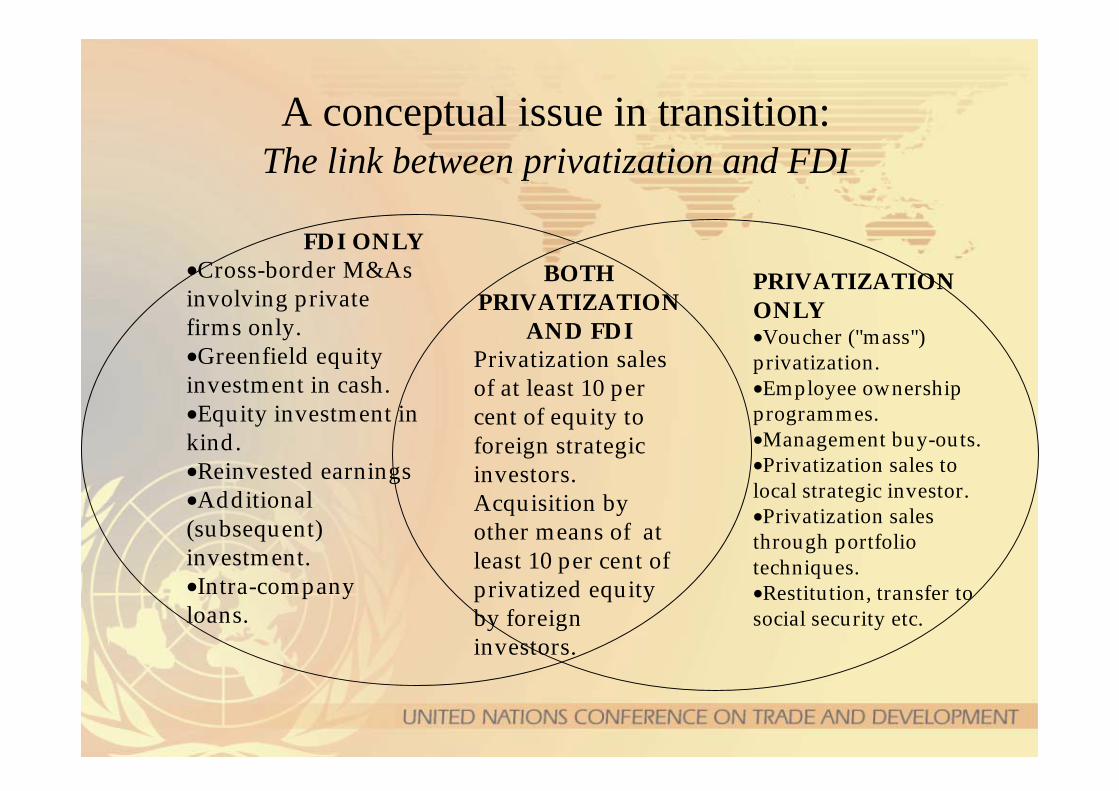
A conceptual issue in transition:The link between privatization and FDI
FDI ONLY•Cross-border M&As involving private firms only.•Greenfield equity investment in cash.•Equity investment in kind.•Reinvested earnings•Additional (subsequent) investment.•Intra-companyloans.
BOTHPRIVATIZATION
AND FDIPrivatization sales of at least 10 per cent of equity to foreign strategic investors.Acquisition by other means of at least 10 per cent of privatized equity by foreign investors.
PRIVATIZATIONONLY•Voucher ("mass") privatization.•Employee ownership programmes.•Management buy-outs.•Privatization sales to local strategic investor.•Privatization sales through portfolio techniques.•Restitution, transfer to social security etc.

Traditional picture: uneven participation of FDIDistribution of enterprise assets between privatization
methods, up to 1998Sales to foreign Sales to domestic Equal access Insider Other Still State
Country investors investors voucher propertyBulgaria 1 ... 39 6 ... 54
Czech Republic 15 15 40 5 5 20Hungary 48 13 - 3 21 15Lithuania 12 2 43 9 - 43
TFYR Macedonia 1 1 - 62 12 24Rep. Moldova 1 .. 16 17 .. 55
Poland 20 .. 6 .. 34 40
Romania 3 2 25 10 - 60Russian Federation 3 .. 15 42 .. 30
Slovakia 7 3 25 30 5 30Slovenia 1 8 18 27 21 25Ukraine 0 .. 12 34 .. 45

New picture:Gradual shift away from “national capitalism building”
Examples:• Slovakia after 1998• Ukraine, 2004• Russian Federation
Common thread: more opening to FDI in “secondary” privatization
Russian Federation: combined with increased participation of State in the control of natural resources

Impact of FDI in privatizationResults of the UNCTAD survey in 1999
Average growthPre- Post-
privatizationTotal paid-in capital 4.4 -0.9Paid-in capital owned by foreign investor -5.1Total assets 6.0 3.3Number of employees -4.6 -3.3Total output 7.1 30.2Capital investment 27.9 36.6Research and development expenses 22.8 13.6Personnel cost 14.1 34.6Revenue from sales 11.1 42.8Domestic market share for lead products -4.3 6.2Total exports 39.5 33.8Total imports 14.2 39.9Total assets at privatization (million $) 5 063Productivity indicators: Sales/Assets 4.9 38.2 Sales/Employee 16.4 47.6 Output/Employee 12.3 34.6 Sales/Personnel cost -2.6 6.1 Sales/Output (capacity utilization) 3.7 9.7Number of companies surveyed 23Number of companies bound by performance requirements 4
Contribution of FDI to the quality of the market economy
• Elimination of inherited distortions (elimination of shortages)
• Rise in productivity• Lifting services such as telecom and banking form
neglect• Contribution to transparency
• Correlation between FDI sales in privatization and transparency: 0.67
Focus: rise in productivity
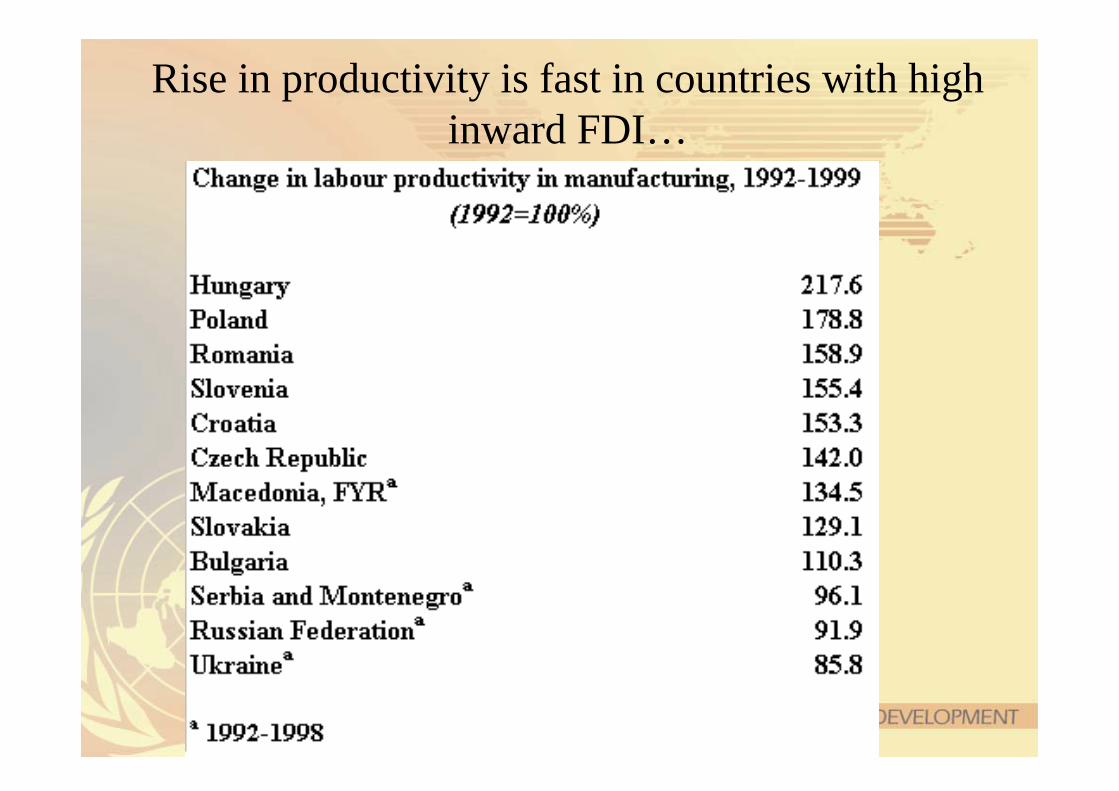
Rise in productivity is fast in countries with high inward FDI…
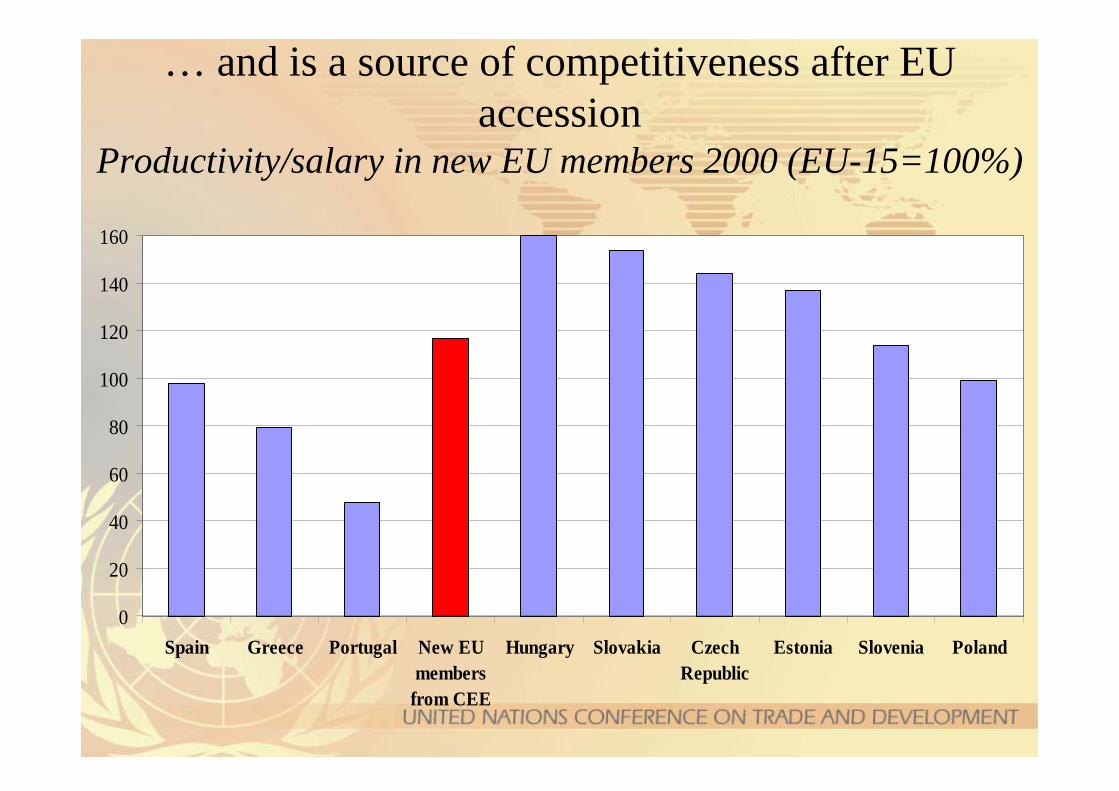
… and is a source of competitiveness after EU accession
Productivity/salary in new EU members 2000 (EU-15=100%)
0
20
40
60
80
100
120
140
160
Spain Greece Portugal New EUmembers
from CEE
Hungary Slovakia CzechRepublic
Estonia Slovenia Poland

Financial resources: source of oxygen during capital-intensive changes?
Top recipients of FDI inflows/per GFCF, average of 2001-3 (%)
25.7
29.0
29.9
31.8
33.7
37.2
37.6
38.5
42.6
43.3
50.2
90.0
0 10 20 30 40 50 60 70 80 90
Croatia
Estonia
Czech Republic
Slovakia
Bulgaria
Georgia
Serbia and Montenegro
TFYR Macedonia
Tajikistan
Kazakhstan
Moldova, Republic of
Azerbaijan

Caveats on financial resources
• Too much inflow in natural resources is difficult to manage (e.g. Azerbaijan, Kazakhstan)
• Ratio may be high when GFCF is far too low (e.g. Rep. of Moldova, TFYR Macedonia)
• One should also consider FDI-related financial outflows (e.g. profit repatriation)– Consider: capital flight under “national capitalism
building” may cause even bigger outflows…

Is profit repatriation too big?

Top 15 exporters of non-resource-based manufactures, 2001 (Percent)
14.5
10.3
10.3
8.0
5.0
4.3
4.2
3.6
3.4
3.2
2.9
2.5
2.3
2.0
1.7
0.0 2.0 4.0 6.0 8.0 10.0 12.0 14.0 16.0
United States
Japan
Germany
China
France
United Kingdom
Italy
Canada
Taiwan POC
Korea, Rep.
Mexico
Netherlands
Belgium/Lux.
Malaysia
Spain
And where is the contribution of FDI to export competitiveness?
There is no country in transition among the top trading nations of the world
Source: Comtrade

…but some of them are among the winners
Top 15 "winners" in exports of non-resource-based manufactures, 1993-2001
(Markets share gain in percentage points )
3.0
1.6
0.7
0.6
0.6
0.6
0.6
0.4
0.4
0.4
0.3
0.2
0.2
0.1
0.1
0.0 0.5 1.0 1.5 2.0 2.5 3.0
China
Mexico
Malaysia
Canada
United States
Korea, Rep.
Philippines
Czech Rep.
Ireland
Hungary
Thailand
Poland
Indonesia
Slovakia
Finland
15 main "losers" in exports of non-resource-based manufactures, 1993-2001
(Markets share loss in percentage points)
-3.8
-1.8
-1.1
-1.1
-0.8
-0.7
-0.5
-0.4
-0.3
-0.2
-0.2
-0.1
-0.1
-0.1
-0.1
-4.0-3.0-2.0-1.00.0
Japan
Germany
Italy
France
Hong Kong, SAR
Belgium/Lux.
Switzerland
United Kingdom
Austria
Netherlands
Denmark
Brazil
Taiwan POC
Portugal
Greece
Source: Comtrade

The share of foreign affiliates in high in “winner” countries
Percentage, 1999 or latest year• Foreign affiliates account for
high and rising shares in the exports of many countries that have increased their participation in world trade.
• The rise is fastest in the electronics and automotive industries
Ireland 90 Hungary 80 Estonia (2000) 60 Poland (2000) 56 China (2001) 50 Malaysia (1995) 49 Czech Republic 47 Canada (1995) 39 Sweden 39 Mexico (2000) 31 Argentina (2000) 29 Austria 26 Rep of Korea 15 Colombia (2000) 14 United States 14 Bolivia 9 Japan 4 India (1991) 3

Example: the car assembly industryKey TNCs and their locations, 2004
• Czech Republic– Mlada
Boleslav:Volkswagen/Skoda– Kolin:Toyota/PSA (2005)
• Hungary– Györ:Audi Hungaria Motor– Esztergom:Suzuki (Swift, Wagon
R+)
• Poland– Gliwice:General Motors/Opel
(Opel Agila)– Poznan:Volkswagen (T4)– Warsaw:Daewoo FSO– Zeran:Daewoo (Lanos)– Bielsko Biala:Fiat
• Romania– Pitesti:Renault Dacia (Logan)
• Russian Federation– Moscow:Renault (X-90) (2005)– Togliatti:GM/AvtoVAZ joint
venture (Niva 4x4)
• Slovakia – Bratislava:Volkswagen (Tuareg,
Polo, Golf 4x4, Variant 4x4, Bora 4x4)
– Trnava:PSA/Peugeot (2005)– Zilina:Hyundai/KIA (2006)
• Slovenia– Novo Mesto:Renault (Clio)

The changing place of economies in transition in the geography of European production networks
1989• CEE is not on the map of
investors.• High-income Europe: EU-15
except Ireland and the Mediterranean (Greece, Portugal and Spain).
• Middle-income Europe: Greece, Ireland, Portugal and Spain.
• Low-income periphery (outside the borders): North Africa and Turkey.
• FDI in natural resources: West Asia
2004• CEE, including South-East Europe
and CIS is on the map of investors• High-income Europe: EU-15 plus
Cyprus, Malta and Slovenia (entry of Ireland and the Mediterranean).
• Middle-income Europe: “Accession-8” from CEE minus Slovenia.
• Low-income periphery (outside the borders): South-Eastern Europe, CIS, (often ahead of) north Africa and Turkey.
• FDI in natural resources: Russian Federation, Azerbaijan, Kazakhstan

Consequences of the changing geography for FDI:A three-level Europe
How to adjust policies/ measures to the status of new frontier, question of business environment
“New frontier” for efficiency-seeking FDI; mostly labour-intensive (e.g. textile, garment, electronics assembly); potentially also some and simple business services
Non-accessionCEE
How to best adjust FDI promotion to EU instruments (regional and cohesion funds etc.) and rules
Upgrading of FDI to medium-technology (e.g. automotive), but also corporate services and some sub-regional coordinating and product development functions
New EU membercountries
Policies facilitating structural change and dealing with social consequences
High-technology FDI and coordinating and R&D business functions
EU-15
Policies and measuresFDI patternsCountries

Conclusions• Europe’s geography is changing; EU enlargement
accelerates that process• If adequately managed, it may result in a win-win situation
for all countries involved• Production can get a major boost from the changing
geography of Europe• Despite perceptions, there has been no massive relocation
(yet?)• The competitiveness of new EU members (and other
economies in transition) is derived from a favourable wage/productivity ratio: the policy challenge is to help preserve that advantage
Thank you very much for your attention…
Contact:Kálmán Kalotay
United Nations Conference on Trade and Development
Palais des Nations, Office E.9100
1211 Geneva 10, Switzerland
Phone: +41 22 907 50 99
Fax: +41 22 907 01 94
E-mail: [email protected]