the role of groundwater in the amazon water cycle: 3. influence on terrestrial water storage...
TRANSCRIPT
The role of groundwater in the Amazon water cycle:3. Influence on terrestrial water storage computationsand comparison with GRACE
Yadu N. Pokhrel,1 Ying Fan,1 Gonzalo Miguez-Macho,2 Pat J.-F. Yeh,3
and Shin-Chan Han4
Received 26 October 2012; revised 11 March 2013; accepted 14 March 2013; published 30 April 2013.
[1] We explore the mechanisms whereby groundwater influences terrestrial water storage(TWS) in the Amazon using GRACE observations and two contrasting versions of theLEAF-Hydro-Flood hydrological model: one with and the other without an interactivegroundwater. We find that, first, where the water table is shallow as in northwesternAmazonia and floodplains elsewhere, subsurface stores (vadose zone and groundwater)are nearly saturated year-round, hence river and flooding dominate TWS variation; wherethe water table is deep as in southeastern Amazonia, the large subsurface storage capacityholds the infiltrated water longer before releasing it to streams, hence the subsurfacestorage dominates TWS variation. Second, over the whole Amazon, the subsurface watercontribution far exceeds surface water contribution to total TWS variations. Based onLEAF-Hydro-Flood simulations, 71% of TWS change is from subsurface water, 24% fromflood water, and 5% from water in river channels. Third, the subsurface store includes twocompeting terms, soil water in the vadose zone and groundwater below the water table. Asthe water table rises, the length of vadose zone is shortened and hence the change ingroundwater store is accompanied by an opposite change in soil water store resulting intheir opposite phase and contributions to total TWS. We conclude that the inclusion of aprognostic groundwater store and its interactions with the vadose zone, rivers, andfloodplains in hydrological simulations enhances seasonal amplitudes and delays seasonalpeaks of TWS anomaly, leading to an improved agreement with GRACE observations.
Citation: Pokhrel, Y. N., Y. Fan, G. Miguez-Macho, P. J.-F. Yeh, and S.-C. Han (2013), The role of groundwater in theAmazon water cycle: 3. Influence on terrestrial water storage computations and comparison with GRACE, J. Geophys.Res. Atmos., 118, 3233–3244, doi:10.1002/jgrd.50335.
1. Introduction
[2] This paper is the third part of a series of three companionpapers on the role of groundwater in the Amazon watercycle. In part 1, Miguez-Macho and Fan [2012a] gave aliterature synthesis on the mechanisms whereby groundwaterregulates seasonal dynamics of surface waters from headwaterstreams to the large floodplains. They also described LEAF-Hydro-Flood (hereafter referred to as LHF), an integrated,continental-scale land hydrology model (details under
section 4). It includes a prognostic groundwater interactingwith soils, rivers, and wetlands within a grid cell, and lateralgroundwater convergence among cells; it solves the fullmomentum equation in routing river and over-bankflooding also allowing backwater effects; it also ties landdrainage with the sea level. This model was applied to theAmazon at 2 km, 4 min resolution for 11 years (2000–2010),forced by European Centre for Medium-Range WeatherForecasts Interim Reanalysis. Results were compared withobserved daily discharge at the 10 largest gauges, seasonalwater table depth at eight sites, and satellite-observedseasonal flooding. The model was used to test four ground-water hypotheses. First, in headwater catchments ofthe Amazon, groundwater is the dominant source ofstreamflow, but the proportion varies due to varying watertable depth; a shallow water table limits infiltration, enhancingsaturation-excess runoff. Second, in the lower floodplains,two-way exchange occurs between the floodwater and thegroundwater; in wet seasons, rain and expanding floodwaterinfiltrate into floodplain sediments, the amount controlledby water table depth; in dry seasons, the flow reverses,and groundwater seeps out to feed floodplain lakes andwetlands. Third, groundwater supports wetlands rarely
1Department of Earth and Planetary Sciences, Rutgers University, NewBrunswick, New Jersey, USA.
2Non-Linear Physics Group, Faculty of Physics, Universidade deSantiago de Compostela, Galicia, Spain.
3International Centre for Water Hazard and Risk Management(ICHARM) under the auspices of UNESCO, Tsukuba, Japan.
4Planetary Geodynamics Laboratory, NASA Goddard Space FlightCenter, Greenbelt, Maryland, USA.
Corresponding author: Y. N. Pokhrel, Department of Earth andPlanetary Sciences, Rutgers University, New Brunswick, NJ 08854,USA. ([email protected])
©2013. American Geophysical Union. All Rights Reserved.2169-897X/13/10.1002/jgrd.50335
3233
JOURNAL OF GEOPHYSICAL RESEARCH: ATMOSPHERES, VOL. 118, 3233–3244, doi:10.1002/jgrd.50335, 2013
flooded but characterized by a persistently shallow watertable, creating water-logged conditions defining wetlands.Fourth, the longer time scales of groundwater delay anddampen river flow and flooding; because of its slow responseto rainfall, groundwater seeps may peak and persist in thedry season. The four mechanisms were observed in isolatedsites across the Amazon, and we provided a modelsynthesis/assessment of their basin-scale significance. Twoparallel simulations, LHF vs. fixed-depth (4 m) soil withoutgroundwater, highlight the difference that groundwatermakes. Our results underscore the damping effect ofgroundwater where it is deep (storing excess rainfall inwet season and releasing in dry season) and the acceleratingeffect where it is shallow (enhancing surface saturation andquick runoff).[3] In part 2, Miguez-Macho and Fan [2012b] evaluated
groundwater’s role in modulating seasonal soil moistureand evapotranspiration (ET). A known model-datadisagreement is the dry-season water stress; while modelssuggest water limitation, observations suggest little differencebetween wet- and dry-season ET. We reviewed field literatureon the possible mechanisms for the lack of water stress, andposted four hypotheses on groundwater influence. First, ashallow water table can be a direct source for plant uptakein the extensive wetlands and flooded forests in centralAmazon. Second, a shallow water table impedes wet-seasondrainage, leading to larger soil water stores at the beginningof the dry season and giving the plants a strong start. Third,a shallow water table can send up capillary rise to the rootzone. Fourth, due to its delayed and dampened response toseasonal rainfall, the timing of groundwater can buffer dryseason stress; across the Amazon, it has been shown thatthe water table reaches its seasonal peak weeks to monthsafter the peak seasonal rainfall, and the surplus or deficitin groundwater stores from one season can carry over tothe next. Furthermore, the temporal delay also manifestsitself as spatial patterns; throughout the dry season, continueddrainage and convergence from high grounds sustains ashallow water table in the valleys, keeping them moist allyear round and forming a structured mosaic of wet-drypatches, supporting dry-season ET at least in the lower partsof the landscape. After comparing our simulation withobserved interception loss at two sites, soil moisture at sevendeep pits, and ET at six flux towers, we tested these hypothesesby contrasting two simulations, LHF vs. fixed-depth (4 m) soilwithout groundwater. The findings support these hypothesessuggesting groundwater contributions to maintaining Amazonecosystems.[4] In this study, part 3 of the series, we investigate how
groundwater may contribute to the variations in terrestrial waterstorage (TWS). Following a similar approach as in parts 1and 2, we explore the mechanisms whereby groundwatermay regulate TWS variations, and contrast the results oftwo parallel simulations, LHF vs. fixed-depth (4 m) soilwithout groundwater.
2. Terrestrial Water Storage and GRACE
[5] Terrestrial water storage, which is composed of waterstored above and underneath the land surface, influences theEarth system through multiple pathways. Near the surface,soil water controls ET and hence water-energy exchange
between the land surface and the atmosphere, directly affectingthe physical climate; by limiting ET, soil water availabilityaffects land ecosystem dynamics and the associated carbonand nutrient fluxes, indirectly affecting the climate; immediatelybelow, the shallow phreatic groundwater feeds streams,lakes, and wetlands, modulating land aquatic ecosystemsand carbon fluxes; further down, groundwater storage inthe aquifers provides vital support for water and food (viairrigation) security in societies on arid and semiarid lands.In high altitudes and polar regions, changes in ice mass havedirect impact on seasonal streamflow and sea level change[e.g., Luthcke et al., 2006; Chen et al., 2009b, 2011]. Lastly,seasonal water loading and the resulting crustal deformationhave been evoked to explain the seasonality in volcanism[e.g., Mason et al., 2004], which, through gas and particleemissions, further feeds back to the climate system. Thus,understanding the changes in TWS and the contributionsto total TWS variations from different hydrologic stores(snow and ice, soil water, groundwater, river, and floodwater) can provide key insights into the hydrologic cycleand its response-feedback to the Earth’s climate system.[6] The GRACE satellite mission [Tapley et al., 2004],
operational since mid-2002, provides a unique opportunityto monitor TWS from space [Rodell and Famiglietti,2002; Wahr et al., 2004]. The monthly gravity fieldsolutions obtained from the twin-satellites can be used toestimate the vertically integrated water storage variationswith a resolution of a few hundred kilometers, and at aprecision of a few centimeters of water depth [Swensonet al., 2003; Rodell et al., 2004; Chambers, 2006]. Becausethe seasonal changes in the hydrologic cycle are among thestrongest GRACE signals, numerous studies have exploitedthe opportunity to study TWS variations over large riverbasins [Hirschi et al., 2006; Yeh et al., 2006; Seo et al.,2006; Klees et al., 2007; Han et al., 2009; Kim et al., 2009;Pokhrel et al., 2012]. Among these studies, there has beena particular interest in the Amazon basin [e.g., Crowleyet al., 2008; Chen et al., 2009a, 2010; Han et al., 2009,2010; Xavier et al., 2010; Becker et al., 2011] because itexhibits the largest annual TWS signal observed by GRACE[Tapley et al., 2004] and the amount of water stored andflowing through its extensive forests and floodplains is stillpoorly constrained [Alsdorf et al., 2010].[7] In addition to direct TWS monitoring, GRACE data
are also used to evaluate TWS simulated by global andcontinental-scale models [e.g., Niu and Yang, 2006; Kimet al., 2009; Han et al., 2009; Syed et al., 2008; Hirschiet al., 2006; Alkama et al., 2010; Ngo-Duc et al., 2007;Lo et al., 2010; Werth and Güntner, 2010; Pokhrel et al.,2012]. In this context, GRACE provides the “ground truth”for the models, and the models provide means to partitionthe vertically integrated TWS observed by GRACE intocontributing components such as atmospheric, canopy,soil, snow-ice, surface, and subsurface water. These studiesdemonstrated a general model-GRACE agreement on TWSchanges, although the models tend to have smaller seasonalamplitudes [e.g., Niu et al., 2007; Ngo-Duc et al., 2007] andearlier responses to rainfall forcing [Pokhrel et al., 2012;Alkama et al., 2010]. Regarding the partition of TWSinto contributing hydrologic stores, there is little agreement;e.g., Kim et al. [2009] suggested that river storage explains~73% of TWS variation in the Amazon, while Alkama et al.
POKHREL ET AL.: AMAZON GROUNDWATER AND TWS VARIATION
3234
[2010] suggested that TWS variation in the Amazon isalmost equally partitioned into soil moisture and riverstorage variations. Han et al. [2010] also found that thesoil moisture storage from Land Surface Model Simulationsdriven by the Global Land Data Assimilation Systemcontributes to TWS over the Amazon by ~50% and the restof it is explained by the storage computed through lateralrunoff routing, which also lumped the movement of shallowgroundwater. Their study showed large spatial variations inseasonal TWS changes. In the Rio Negro, Frappart et al.[2008] suggested that surface and subsurface water equallycontribute to TWS variations, but their recent study[Frappart et al., 2011] shows that groundwater contributesup to ~72% in the downstream reaches of the Negro basin.[8] The disagreement could be partially due to the differences
in approaches that the models treat groundwater. Most landsurface models either do not have a groundwater store—thedrainage from the fixed-depth (typically 2–4 m) soil columnis directly placed into river store—or parameterize a simplegroundwater holding tank as a passive receiver of soil drainagewith a calibrated, delayed release to rivers. In the study ofKim et al. [2009], deep soil drainage is placed into the riverstore which effectively lumps the variation of groundwaterstore resulting in the large contribution of river store (~73%)to total TWS variation. River contribution was reduced inthe studies with a groundwater holding tank [e.g., Alkamaet al., 2010; Ngo-Duc et al., 2007]. Niu et al. [2007] furthershowed that groundwater variation explains most of the TWSsignal in the Amazon when a simple dynamic groundwaterstore is considered.[9] The goal of this study is to shed further lights on
groundwater’s role in modulating TWS in the Amazon.Our fully coupled groundwater-surface model may offernew insights for the following reasons. First, the modelgroundwater is fully prognostic with explicit mass balanceand two-way flux exchange with soils, rivers, and floodplains.Second, it allows not only vertical, within grid-cell, interactionswith soil, river, and floodplain, but also lateral groundwaterconvergence among grid cells from high to low grounds;this lateral convergence has long time scales and can affectthe rainfall residence time in a basin. Third, the simulation isperformed at a high spatial resolution (2 km), resolvinglarge changes in water table depth; across the Amazon, themean water table can vary from the land surface to >50 mdeep, and the seasonal rise and fall at a site can be >15 m;this large spatial-temporal variability in water table depthis well documented in field observations across the Amazon(see review in Miguez-Macho and Fan [2012a]), and itsuggests a large soil and groundwater storage capacitywhere the water table is deep (more room to rise and fall)and small capacity where it is shallow (near saturation). Thisis an advantage over current large-scale modeling studies.Fourth, allowing backwater in river and floodwater movementslows down river discharge and increases residence time.Lastly, allowing floodwater to infiltrate into the sediments un-der the vast floodplains of the Amazon and seeping out atlow water further delays the discharge into the ocean. Intu-itively, these processes are likely to influence the amplitudeand timing of TWS changes; they are explicitly representedin LHF. Furthermore, tests with available observations ofriver discharge, water table depth, flooding, soil moisture,and ET flux [Miguez-Macho and Fan, 2012a, 2012b] have
placed constraints on the physical realism of LHF. We alsonote that no model parameters are calibrated to match theobservations. In these respects, a study using LHF maycontribute new insights into the ongoing investigations ofAmazon TWS.
3. Mechanisms Whereby Groundwater RegulatesTWS Variations
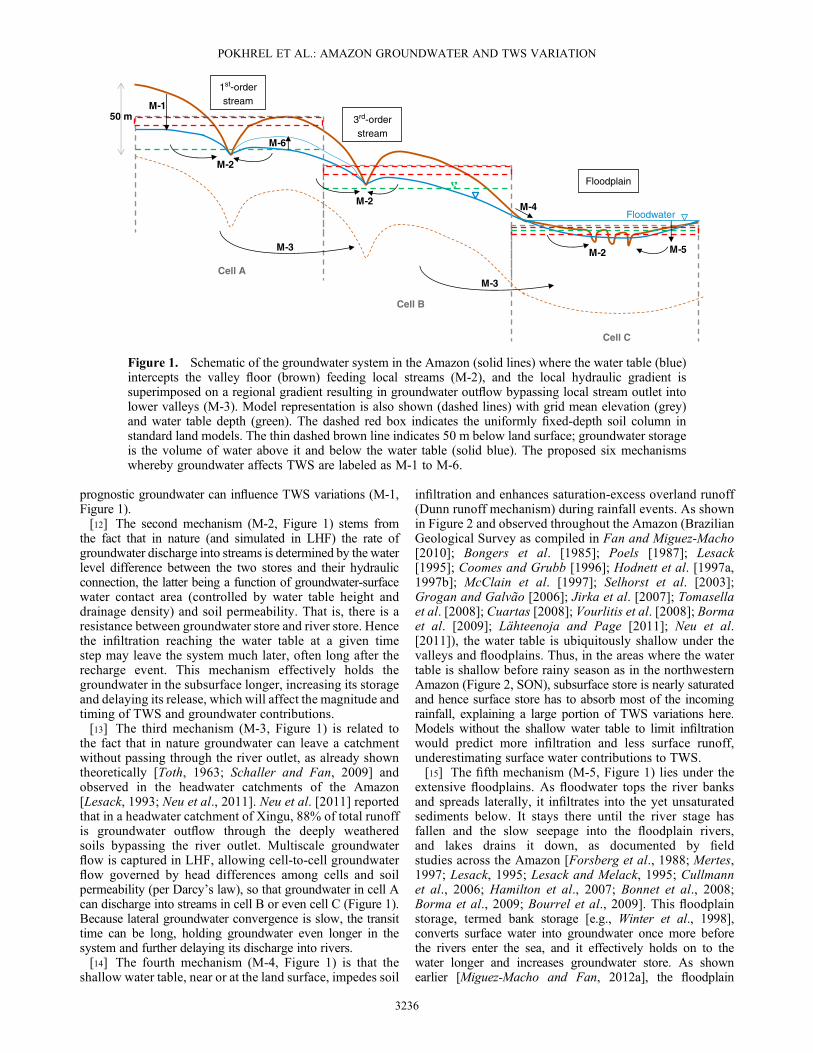
[10] We propose that groundwater regulates seasonalTWS variations through several mechanisms, labeled asM-1 to M-6 in Figure 1. It illustrates a topographic sequencewith nested rivers (low- to high-order streams from left toright) and a multiscale groundwater flow system wherebyrecharge in a given model cell can enter the stream within thecell (M-2) or the stream in the lower neighbor via downslopegroundwater flow (M-3). Where the water table is at the landsurface such as at the base of slopes (M-4), rainfall cannotinfiltrate into the soil and will runoff the land and enter thenearest stream. It also shows a floodplain at the lower endof the multiscale drainage system, where the floodwatercan infiltrate into the floodplain sediments and return to thestreams at the low river stage (M-5). Model representationis also shown (dashed lines) with the mean grid elevation(grey) and water table depth (green). This hydrologicconceptualization is supported by a large number of fieldobservations in the Amazon reviewed by Miguez-Machoand Fan [2012a, 2012b].[11] In nature, the water table depth varies from being
deep under the hills as in cell-A (Figure 1) to near or at theland surface in the lower valleys as in cell C, that is, thevadose zone depth, and storage capacity, can vary from cellto cell. This fact is captured in Figure 2, a 7 year (overlappingwith GRACE data used here) mean seasonal water table depth,simulated by LHF [Miguez-Macho and Fan, 2012a, 2012b]and validated with water table, soil moisture, ET, riverdischarge and flooding observations. In the southern andeastern Amazon, the water table varies between 5–80 munder the hills, but remains shallow in the valleys. It alsoremains perennially shallow in large regions in the northwesternAmazon (<2.5 m). This large variability of vadose zonelength, in both space and time, cannot be captured bymodeling approaches using a uniformly fixed soil columndepth shown in red in Figure 1, which includes only a smallfraction of the vadose zone in cell A, but the water table or partof the groundwater store in cell C. In nature, soil infiltration incell-A must reach the water table before it enters the stream,while in a model with a fixed-depth soil, drainage from thebase is instantly placed in the river. In cell A, the longervadose zone and transit time through this zone increase soilwater store and retain it for longer time than it would be witha short and fixed-depth soil column. This vadose zone delayis well documented; across the Amazon, it has been shownthat under the high grounds, the water table reaches itsseasonal peak weeks to months after the peak seasonalrainfall [Hodnett et al., 1997a, 1997b; Johnson et al.,2006; Grogan and Galvão, 2006; Cuartas, 2008; Vourlitiset al., 2008; Tomasella et al., 2008]. This long vadose zonetransit time effectively delays the discharge of soil water intothe rivers, increases the volume of vadose zone store, andhence affects the timing and amplitude of its contributionsto TWS variations. This is the first mechanism whereby a
POKHREL ET AL.: AMAZON GROUNDWATER AND TWS VARIATION
3235
prognostic groundwater can influence TWS variations (M-1,Figure 1).[12] The second mechanism (M-2, Figure 1) stems from
the fact that in nature (and simulated in LHF) the rate ofgroundwater discharge into streams is determined by the waterlevel difference between the two stores and their hydraulicconnection, the latter being a function of groundwater-surfacewater contact area (controlled by water table height anddrainage density) and soil permeability. That is, there is aresistance between groundwater store and river store. Hencethe infiltration reaching the water table at a given timestep may leave the system much later, often long after therecharge event. This mechanism effectively holds thegroundwater in the subsurface longer, increasing its storageand delaying its release, which will affect the magnitude andtiming of TWS and groundwater contributions.[13] The third mechanism (M-3, Figure 1) is related to
the fact that in nature groundwater can leave a catchmentwithout passing through the river outlet, as already showntheoretically [Toth, 1963; Schaller and Fan, 2009] andobserved in the headwater catchments of the Amazon[Lesack, 1993; Neu et al., 2011]. Neu et al. [2011] reportedthat in a headwater catchment of Xingu, 88% of total runoffis groundwater outflow through the deeply weatheredsoils bypassing the river outlet. Multiscale groundwaterflow is captured in LHF, allowing cell-to-cell groundwaterflow governed by head differences among cells and soilpermeability (per Darcy’s law), so that groundwater in cell Acan discharge into streams in cell B or even cell C (Figure 1).Because lateral groundwater convergence is slow, the transittime can be long, holding groundwater even longer in thesystem and further delaying its discharge into rivers.[14] The fourth mechanism (M-4, Figure 1) is that the
shallow water table, near or at the land surface, impedes soil
infiltration and enhances saturation-excess overland runoff(Dunn runoff mechanism) during rainfall events. As shownin Figure 2 and observed throughout the Amazon (BrazilianGeological Survey as compiled in Fan and Miguez-Macho[2010]; Bongers et al. [1985]; Poels [1987]; Lesack[1995]; Coomes and Grubb [1996]; Hodnett et al. [1997a,1997b]; McClain et al. [1997]; Selhorst et al. [2003];Grogan and Galvão [2006]; Jirka et al. [2007]; Tomasellaet al. [2008]; Cuartas [2008]; Vourlitis et al. [2008]; Bormaet al. [2009]; Lähteenoja and Page [2011]; Neu et al.[2011]), the water table is ubiquitously shallow under thevalleys and floodplains. Thus, in the areas where the watertable is shallow before rainy season as in the northwesternAmazon (Figure 2, SON), subsurface store is nearly saturatedand hence surface store has to absorb most of the incomingrainfall, explaining a large portion of TWS variations here.Models without the shallow water table to limit infiltrationwould predict more infiltration and less surface runoff,underestimating surface water contributions to TWS.[15] The fifth mechanism (M-5, Figure 1) lies under the
extensive floodplains. As floodwater tops the river banksand spreads laterally, it infiltrates into the yet unsaturatedsediments below. It stays there until the river stage hasfallen and the slow seepage into the floodplain rivers,and lakes drains it down, as documented by fieldstudies across the Amazon [Forsberg et al., 1988; Mertes,1997; Lesack, 1995; Lesack and Melack, 1995; Cullmannet al., 2006; Hamilton et al., 2007; Bonnet et al., 2008;Borma et al., 2009; Bourrel et al., 2009]. This floodplainstorage, termed bank storage [e.g., Winter et al., 1998],converts surface water into groundwater once more beforethe rivers enter the sea, and it effectively holds on to thewater longer and increases groundwater store. As shownearlier [Miguez-Macho and Fan, 2012a], the floodplain
1st-orderstream
3rd-orderstream
Floodplain
Cell A
Cell B
Cell C
M-1
M-2
M-2
M-2
M-3
Floodwater
M-6
50 m
M-3
M-5
M-4
Figure 1. Schematic of the groundwater system in the Amazon (solid lines) where the water table (blue)intercepts the valley floor (brown) feeding local streams (M-2), and the local hydraulic gradient issuperimposed on a regional gradient resulting in groundwater outflow bypassing local stream outlet intolower valleys (M-3). Model representation is also shown (dashed lines) with grid mean elevation (grey)and water table depth (green). The dashed red box indicates the uniformly fixed-depth soil column instandard land models. The thin dashed brown line indicates 50 m below land surface; groundwater storageis the volume of water above it and below the water table (solid blue). The proposed six mechanismswhereby groundwater affects TWS are labeled as M-1 to M-6.
POKHREL ET AL.: AMAZON GROUNDWATER AND TWS VARIATION
3236

infiltration loss can be significant at the five largest floodplainsin the Amazon.[16] Lastly (M-6, cell A, Figure 1), as the water table
rises in response to recharge, it invades the vadose zoneand shortens the unsaturated column; hence, an increase ingroundwater store is necessarily accompanied by a decreasein soil water store. The competition between the saturatedand unsaturated stores in the subsurface is known [Duffy,1996], but models without a dynamic water table cannotrepresent this fact. Often TWS studies in the literaturedemonstrate a rise and fall of soil water store synchronousto seasonal rainfall.[17] The combined effect of mechanisms 1, 2, 3, and 5
is to delay the discharge (TWS peak shifted later) andincrease storage (enhanced amplitude of TWS anomaly),while mechanism 4 does the opposite by enhancing surfacerunoff, a quick process of shedding water. Mechanism 6leads to an opposite-phase change between vadose zoneand groundwater stores, challenging current views of soilwater contribution to TWS from large-scale model-GRACEcomparison studies. These mechanisms are accounted for inLHF and we expect to see their influences on the simulatedTWS. We note that our river routing scheme, which slowsand even reverses flow at large river junctions by accounting
for backwater effects of low-gradient rivers, also serves tohold the water longer in the rivers and floodplains, but becauseit is not directly related to groundwater processes, we will notinclude it here as one of the mechanisms. In light of thesemechanisms, in the following we examine the TWS variationsas simulated LHF, referred to as the LHF-experiment, and aparallel simulation with a fixed 4 m deep soil column, free soildrainage at the base, and immediate placement of runoff into theriver store within the cell, referred to as the FD-experiment, tobring out the influence of groundwater. We then compareboth simulations with GRACE observations.
4. Methods
[18] We use the coupled groundwater-surface watermodel LHF. For brevity, only key processes represented inLHF are highlighted here; the readers are referred to thereferences cited herein for more details. Figure 3 illustratesthe model components and their interactions. Thestandard LEAF (Land Ecosystem-Atmosphere Feedback)[Walko et al., 2000] is the land model of the RegionalAtmosphere Modeling System, color-coded orange inFigure 3. LEAF-Hydro [Fan et al., 2007;Miguez-Macho et al.,2007], color-coded blue in Figure 3, added a prognostic
Figure 2. LEAF-Hydro-Flood simulated, 2004–2010 mean, seasonal water table depth (meters belowland surface) (Details in Miguez-Macho and Fan [2012a, 2012b]), where DJF is December to February,MAM is March to May, JJA is June to August, and SON is September to November.
POKHREL ET AL.: AMAZON GROUNDWATER AND TWS VARIATION
3237

groundwater store allowing (1) the water table to rise and fallor the vadose zone to shrink or grow; (2) the water table,recharged by infiltration, to relax through discharge into riverswithin a grid cell, as well as lateral groundwater flow amongadjacent cells, leading to divergence from high grounds andconvergence to low valleys at multiple scales; (3) two-wayexchange between groundwater and rivers depending onhydraulic difference and river-groundwater contact area,representing both loosing (leaking to groundwater) andgaining (receiving groundwater convergence) streams; (4)river discharge routing to the ocean through the channelnetworks as kinematic waves; and (5) setting the sea level asthe groundwater head boundary condition, hence allowingsea level to influence coastal drainage. In our recent Amazonstudy [Miguez-Macho and Fan, 2012a], we introduced ariver-floodplain routing scheme that solves the full momentumequation of open channel flow, taking into account thebackwater effect (the diffusion term) [e.g., Yamazakiet al., 2011] and the inertia of large water mass of deepflow (acceleration terms) [e.g., Bates et al., 2010] that areimportant in the Amazon. This causes the river dischargeto be influenced by river stage downstream or the sea level,slowing down or even reversing flow locally. This lastdevelopment results in the LHF, color-coded green inFigure 3. The model has been extensively tested withobserved water table depth, river discharge, seasonalflooding [Miguez-Macho and Fan, 2012a], soil moisture,and ET [Miguez-Macho and Fan, 2012b], over an 11 year(2000–2010) simulation of the Amazon at 4 min time stepsand 1 arc-min grids (~2 km), forced by European Centre forMedium-Range Weather Forecasts Reanalysis InterimProduct (ERA-Interim). We refer the reader to parts 1 and2 for details in literature review of groundwater processesin the Amazon, model formulations, parameter estimations,forcing data bias assessment, and model comparisons withobservations in both surface and subsurface stores.
[19] We define the following:
Terrestrial Water Storage (TWS) = Surface water + Sub-surface waterSurface water = FW+RWSubsurface water =VW+GW
where,
FW=water on the floodplainsRW=water in the river channelsVW= soil water in the vadose zone (unsaturated store)GW=groundwater (below the water table, saturated store)
[20] The GW store is the amount of water from the watertable down to 50 m below land surface (Figure 1, betweensolid blue line and dashed brown line). Because the focus ison its seasonal change rather than the absolute value, thechoice of the reference depth (50 m) here is inconsequential.[21] Subsurface water is partitioned by the water table
into two components: soil water in the vadose zone (VW)above and groundwater in the saturated zone (GW) below.As infiltration reaches the water table, GW rises into thevadose zone, causing VW to decrease. If the water tablecontinues to rise and reaches the land surface, VW maycompletely vanish resulting in no contribution to TWSvariations. When such a condition prevails for a prolongedperiod of time, such as in lowland swamps, total subsurfacewater store changes little, while large variations occur insurface water stores which have to absorb the continuedrainfall and flooding. Conversely, when there is less or norecharge to groundwater in dry season, or if the capillaryrise, river discharge and lateral divergence exceed recharge,the water table is lowered, which causes the vadose zone toexpand and results in increased VW. This causes variationin both VW and GW, but one component gains water at
Atmosphere
Soil-Vegetation
Local River-Wetland
Regional River-Floodplain
Coastal Ocean
Groundwater
Snow
LEAF-Hydro-Flood
Fluxes in Standard LEAF [Walko et al., 2000]
Fluxes in LEAF-Hydro [Miguez-Macho et al., 2007]
Fluxes in LEAF-Hydro-Flood (backwater, floodwater evaporation, floodwater-groundwater exchange)
Figure 3. Stores and fluxes included in standard LEAF (orange color-coding) and other typical landmodels, LEAF-Hydro (blue color-coding), and LEAF-Hydro-Flood (green color-coding).
POKHREL ET AL.: AMAZON GROUNDWATER AND TWS VARIATION
3238

the expense of the other. Therefore, VW and GW competewith each other for space and evolve over time in oppositephase thus showing a direct but inverse relationshipbetween them [Duffy, 1996]. In this sense, it is moremeaningful to consider VW+GW as a whole, and hencewe define it as the total subsurface storage.[22] We note that VW is not identical to soil moisture in
conventional land models where the soil column is fixedto a certain depth, typically of 2–4 m from the land surface.To avoid confusion and to make our result comparable toprevious studies, we also calculate the water in the top 2m of soil which is generally assumed to include the plantroot zone. We will refer to this storage as the root-zonewater, which is only a fraction of the total vadose zonewhere the water table is deep, and includes groundwaterwhere the water table is shallow. We note that in the FDexperiment, there is no explicit groundwater store, and thefree-drainage from the 4 m deep soil column is placedimmediately into the rivers in the cell. Therefore, the totalsubsurface water store in the FD experiment is only the soilwater in the entire soil column of 4 m depth.[23] The TWS from the GRACE measurements is the
total vertically integrated water stored above and beneaththe Earth’s surface. We use the RL05, the latest, 1� � 1�monthly GRACE products provided by the Center for SpaceResearch at the University of Texas at Austin [available athttp://grace.jpl.nasa.gov/data/gracemonthlymassgridsland/].The monthly products of the equivalent water height werescaled by using the scaling factors provided with the datato restore much of the energy removed by the de-stripingand filtering process [Landerer and Swenson, 2012]. Becausethe GRACE data (RL05) are available for the period of 2004to mid-2012 and our simulations span for 2000–2010, weuse 2004–2010 as our analysis period for which GRACEand the model overlap. To compare with GRACE, weaggregate model outputs from the original 1 arc min (~2 km)grid daily output to 1� � 1� products. Then, the basin-wideaverages of both GRACE and model results are obtainedby using 1� � 1� river basin masks. For analyses without
GRACE, we use model output at the original ~2 km gridsand daily time steps.
5. Results and Discussions
[24] Figure 4 shows the comparison of TWS anomalyaveraged over the entire Amazon basin, as monthly timeseries and mean seasonal cycle, and for both LHF and FDexperiments. In the LHF experiment (Figures 4a and 4b),the total TWS is partitioned into FW, RW, VW, and GW,while in the FD experiment (Figures 4c and 4d) it ispartitioned into FW, RW, and the water in the entire 4 m soilcolumn (VW). GRACE data are shown as circles. We makethe following observations.[25] First, the most prominent feature in the LHF experiment
is that the VW (green) varies in opposite phase with GW(blue) due to the mechanism 6 (M-6, Figure 1). Second,the VW (green) in the LHF run has a very large seasonalamplitude compared to the FD run (green), mainly due tothe long soil columns (M-1) in LHF in eastern Amazon(deep water table). Third, GW (blue) has the largestseasonal swing due to the large vadose zone in the deepwater table regions (M-1), allowing ample rooms for thewater table to rise and fall. Fourth, the net effect of the largebut opposite-phase changes in VW and GW is expressed inthe total subsurface water (red-cross symbol), which is inphase with seasonal rainfall anomalies; the top 2 m root-zonewater in LHF (aqua) is comparable to its counterpart inFD (aqua), giving the familiar seasonal patterns reportedin earlier model studies. However, this same 2 m store isconceptually different between LHF and FD: in LHF it iswetter containing both VW and GW where the water tableis< 2 m deep as in western Amazon, and it is driercontaining only VW where the water table is >2 m deepas in southeastern Amazon, while in FD it is simply the totalwater content in the top 2 m soil. Fifth, there is a smallerriver and floodplain (purple and red) storage change inLHF compared to FD, due to the larger subsurface storagecapacity in LHF (from M-1, M-2, M-3, and M-5).
Figure 4. Time series of TWS anomalies averaged over the Amazon basin from the (a) LHF experimentand (c) FD experiment, and (b and d) their seasonal cycles. There is no groundwater storage in the FD ex-periment. For the GW experiment the net subsurface water (i.e., vadose zone water + groundwater) is alsoshown (red + signs). All values are shown as water depth in mm.
POKHREL ET AL.: AMAZON GROUNDWATER AND TWS VARIATION
3239

[26] The larger subsurface storage capacity and theslow nature of water movement in the subsurface are thekey reasons why LHF gives a seasonal TWS variationcloser to GRACE observations in both timing and theamplitude. This is not only reflected graphically, but alsoquantitatively in root mean square error and R2 values.The root mean square error in LHF (shown in Figure 4b)is less than half of that in FD (Figure 4d), and the R2 value isalso improved. However, the seasonal amplitude of LHF is stillsmaller than GRACE, attributed to the well-recognized bias ofreduced seasonality in rainfall forcing from ERA-Interim[Betts et al., 2009; Miguez-Macho and Fan, 2012a, 2012b].Perhaps direct comparison with GRACE is less informativethan contrasting LHF and FD runs; in the FD run, the samerainfall forcing bias leads to even smaller amplitude.[27] We also give a more detailed analysis of the amplitude
and timing of LHF and FD vs. GRACE, for the entire Amazonand the four quarters of the model domain (Figure 5b). Weexamine the four quarters because of the large variabilityin TWS dynamics across the Amazon, and in particular thenorthern/southern seasonal off set; the Amazon basin-wideTWS lumps together wet season in some places with dryseason in others. Moreover, we selected the four quartersinstead of the sub-basins because some of the basins aretoo small to use GRACE data with the desired accuracy.Table 1 gives the minimum/maximum TWS anomaly
by LHF, FD, and GRACE over the Amazon and the fourquarters. For the models, we used daily climatology overthe 7 years of overlap with GRACE, and for GRACE, onlymonthly values are resolved. Model differences fromGRACE are shown in parentheses. The mean absolute errorover the four quarters (last row) suggests that TWS minimum,maximum and amplitude by LHF are closer to GRACEthan that by FD, consistent with what we see with the wholeAmazon basin (second last row of Table 1 and Figure 4).[28] Table 2 evaluates the timing of modeled TWS. It
shows the days when the seasonal TWS anomaly changesits sign from positive to negative (the falling limb) and viceversa (the rising limb), over the four quarters and the wholeAmazon. For the models the days in the year are identified.For GRACE we assume that its monthly values occur on the15th day, and that the rising and falling limb near the crossingcan be represented as straight lines. Model differences fromGRACE are shown in parentheses. The mean absolute errorof the four quarters (last row) suggests that LHF gives a closertiming to GRACE than FD does, again consistent with whatwe see over the whole Amazon basin (second last row inTable 2 and Figures 4b and 4d).[29] We examine the spatial variability in the mechanisms
of TWS change in different parts of the Amazon by furtherbreaking down the Amazon into eight sub-basins. Figure 5adepicts the relative contributions of RW (purple), FW (red),
Figure 5. (a) Contribution of different terrestrial water storage components to the total TWS variationaveraged over the entire Amazon and the sub-basins, and (b) location of the Amazon and the sub-basinssimulated by LEAF-Hydro-Flood. Dark blue indicates the regions in the Amazon which are not coveredby the sub-basins, and the four boxes (SW, SE, NE, and NW) show the four quarters selected for the analysisin Tables 1 and 2.
Table 1. Minimum, Maximum, and Amplitude of TWS Anomaly Simulated by LHF and FD and Observed by GRACE
Quarter
Minimum TWS Maximum TWS Amplitude (max-min)
LHF FD GRACE LHF FD GRACE LHF FD GRACE
1 SW –174(–38) –154(–17) –137 196(65) 194(63) 131 371(103) 347(80) 2682 SE –221(–14) –181(26) –207 246(28) 203(–14) 217 466(42) 385(–39) 4243 NE –183(40) –164(59) –223 170(–74) 150(–94) 244 353(–114) 314(–153) 4674 NW –70(2) –85(–13) –72 102(6) 134(39) 95 172(4) 219(51) 168Entire Amazon –189(26) –171(44) –215 191(–16) 175(–32) 207 380(–43) 346(–77) 423
Mean abs. error of 4 quarters 23 29 44 52 66 81
Numbers in parentheses show the difference between model and GRACE.
POKHREL ET AL.: AMAZON GROUNDWATER AND TWS VARIATION
3240
and total subsurface water (VW plus GW, green) to TWSvariations in the entire Amazon and the sub-basins (Figure 5b).We show the contribution of total subsurface water storage,rather than separating groundwater from vadose zone water,because the amplitude of either can be larger than total TWSbeing opposite in phase; considering them as a whole is more
meaningful. To calculate the component contributions, firstthe months of maximum and minimum amplitude of totalTWS anomaly, m1 and m2, respectively, are determined, thenthe component contribution (CC) of each storage term S iscalculated for each sub-basin as the ratio of change incomponent amplitude to the change in total TWS amplitude,
Table 2. Timing of the Change in Sign of TWS Anomaly Simulated by LHF and FD and Observed by GRACE
Quarters
Julian Day of Change in TWS from Negative to Positive Julian Day of Change in TWS from Positive to Negative
LHF FD GRACE LHF FD GRACE
1 SW 10(15) 0(5) –5 189(11) 172(–6) 1782 SE –1(–3) –19(–21) 2 181(1) 160(–20) 1803 NE 70(5) 48(–17) 65 253(11) 238(–4) 2424 NW 107(–2) 89(–20) 109 261(7) 244(–10) 254Entire Amazon 20(0) 8(–12) 20 203(-1) 188(–16) 204
Mean abs. error of 4 quarters 6 16 8 10
Numbers in parentheses show the difference between model and GRACE.
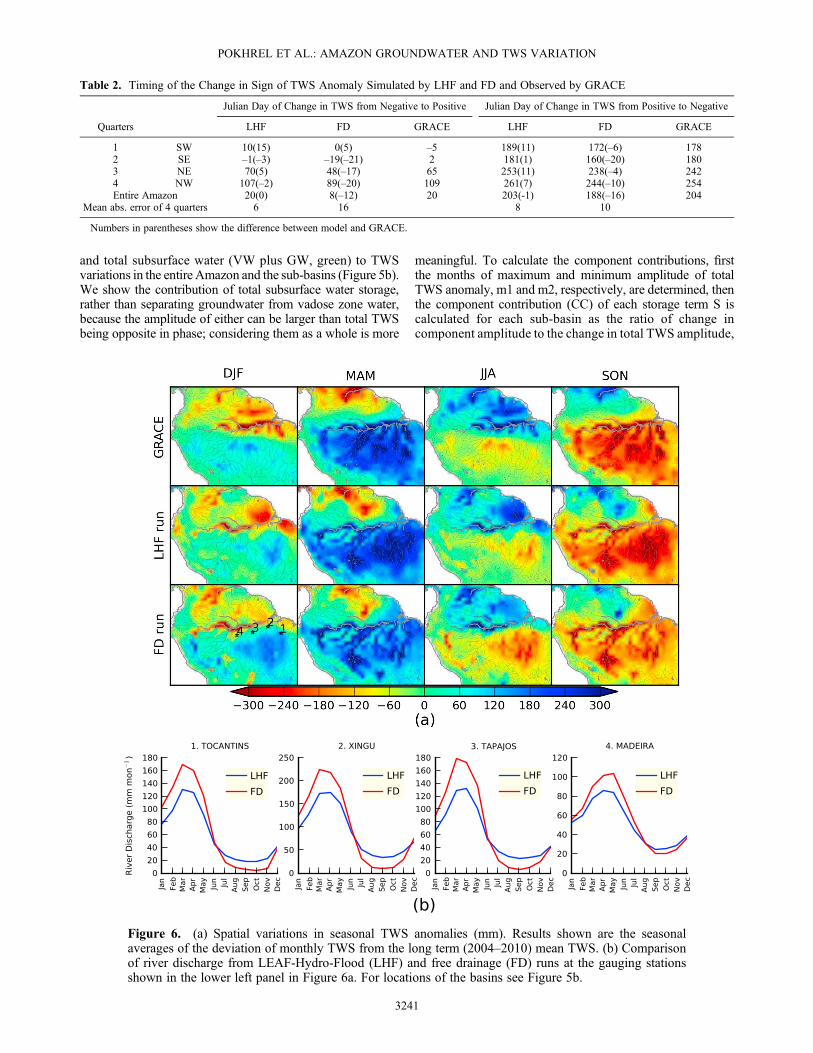
Figure 6. (a) Spatial variations in seasonal TWS anomalies (mm). Results shown are the seasonalaverages of the deviation of monthly TWS from the long term (2004–2010) mean TWS. (b) Comparisonof river discharge from LEAF-Hydro-Flood (LHF) and free drainage (FD) runs at the gauging stationsshown in the lower left panel in Figure 6a. For locations of the basins see Figure 5b.
POKHREL ET AL.: AMAZON GROUNDWATER AND TWS VARIATION
3241

CCs ¼ Sm1 � Sm2ð Þ= TWSm1 � TWSm2ð Þ
[30] Over the western and northern Amazon where the watertable is perennially shallow (5-Purus, 6-Solimoes, 7-Japura, and8-Negro; water table <2.5 m deep; Figure 2) and infiltration isimpeded, saturation-excess runoff widely occurs, explainingthe large floodwater contribution to TWS. Over the southernand eastern Amazon, where the water table is deep particularlybefore the wet season onset (1-Tocantins, 2-Xingu, 3-Tapajos,and 4-Madeira; water table 5–40m deep; Figure 2), subsurfacestores dominate TWS due to the larger subsurface storagecapacity. Over the Amazon as a whole, 71% of TWS changeis due to subsurface water, 24% due to flood water, and 5%due to water confined within river channels.[31] Figure 6a further explores the spatial variations in
TWS from GRACE (top), LHF (middle), and FD (bottom)with more spatial details than sub-basins. Where surfacewater stores are important (shallow water table and nearlysaturated subsurface stores), as along the main channels andover the large floodplains, both LHF and FD reproducedwell the seasonal changes observed by GRACE, but wheresubsurface water stores dominate (deep water table and largevadose zone), as in the southeastern Amazon, LHF is closerto GRACE observations. The large subsurface storage capacityand the slow movement of subsurface water are manifestedas less river runoff in wet season and the subsequent releasein dry season, as shown in the mean seasonal river flow inFigure 6b for the four southeastern sub-basins (gaugelocations shown in the bottom left panel of Figure 6a, andbasin locations in Figure 5b), where LHF produced muchreduced seasonal amplitudes in stream discharge than FD,or greater subsurface storage capacity.[32] At even finer details, we examine the LHF-simulated
TWS and its components at the full resolution of the model
(~2 km), shown in Figure 7. The subsurface water changeclearly dominates (note different color scales for eachrow), and the northern-southern oscillation of highs andlows follow the Intertropical Convergence Zone. So doesthe floodwater and river water, but the changes are farsmaller and more localized along channels and floodplains.[33] Lastly, we remark on the interannual variability in
TWS. As shown in Figure 4a, the severe drought of 2005and the wet period of 2009, captured by GRACE observa-tions and discussed in Chen et al. [2009a, 2010], are wellreproduced by LHF, largely due to its greater subsurfacestorage capacity that is under-filled during the drought yearand over-filled during the pluvial year. Thus, a part of theatmospheric deficit or surplus is absorbed by the subsurfacestorage. Without sufficient storage capacity, the FD runquickly transfers the deficit or surplus into river discharge,underestimating the hydrologic impacts of atmosphericdroughts and pluvial events. Note that the drought of 2010was weak in the ERA-Interim forcing and hence weaklyreflected in the simulated hydrologic response.
6. Summary and Conclusions
[34] In this study, we explored the physical mechanismswhereby groundwater influences terrestrial water storagein the Amazon, using GRACE observations and twomodel simulations with contrasting versions of the LEAF-Hydro-Flood hydrological model: one with and the otherwithout an interactive groundwater store. Our findings aresummarized as below.[35] First, where the water table is shallow, as found in
the northwestern Amazon and the valleys-floodplainselsewhere, subsurface stores are nearly saturated, andsurface runoff and flooding dominate the TWS signal.Where the water table is deep and the unsaturated soil
Figure 7. LEAF-Hydro-Flood simulated long-term seasonal anomalies of different TWS components(mm) at the original ~2 km model grids. Note that the ranges of color bars differ among the plots.
POKHREL ET AL.: AMAZON GROUNDWATER AND TWS VARIATION
3242
column is substantial, as found in the southeastern Amazonparticularly before the wet season, the subsurface storagecapacity is large which stores the infiltration and slowlyreleases it to the streams, and hence the subsurface storagedominates the TWS signal.[36] Second, over the Amazon as a whole, the enhanced
subsurface storage in the southwestern Amazon largelyoutweighs the reduced subsurface storage in the northwesternAmazon and major floodplains, and as a result, subsurfacestorage contribution is far greater than surface watercontribution to TWS changes. Based on LEAF-Hydro-Floodsimulations, 71% of TWS change is due to subsurfacewater, 24% due to flood water, and 5% due to water confinedwithin river channels.[37] Third, the subsurface storage has two competing
terms, soil water in the vadose zone and groundwater belowthe water table. As the water table rises and groundwaterstore grows, it is at the expense of the vadose zone store.Thus, the seasonal response of vadose zone store is directlyrelated to, but in opposite phase with groundwater store.[38] Our estimates of TWS contributions from different
hydrologic stores differ from the earlier estimates withoutan interactive groundwater, but agree with the findings ofNiu et al. [2007] that groundwater storage variation explainsmost of the TWS signal in the Amazon, and of Frappartet al. [2011] that subsurface water contributes to ~72% ofthe TWS change in the downstream reaches of the RioNegro basin (our estimate: 74%).[39] In conclusion, we found that both the amplitude and
phase of TWS variations in the Amazon are changed whenthe groundwater dynamics is accounted for in the model,resulting in improved agreement with GRACEmeasurements,in both amplitude and timing of TWS seasonal variations. Theamplitude is increased when groundwater is represented in themodel because more water is held during wet seasons andsubsequently released during dry seasons. This also resultsin a considerable time lag in the TWS signal becausegroundwater acts as a buffer in delaying the response toclimate conditions. We found that the variation of subsurfacewater dominates the variation of TWS when averaged overthe entire Amazon basin. However, surface water storages(water in river channels and floodplains) also play a significantrole in modulating the variation of TWS in regions wherethe water table is shallow and seasonal to permanentflooding often occurs.
[40] Acknowledgments. Funding comes from NSF-AGS-1045110and EPA-STAR-RD834190. Computation support comes from CESGA(Centro de Supercomputación de Galicia) Supercomputer Center at theUniversidade de Santiago de Compostela, Galicia, Spain, and the ClimateSimulation Laboratory at NCAR’s Computational and Information SystemsLaboratory, sponsored by the National Science Foundation and otheragencies. SCH is supported by NASA’s Earth Surface and Interior programand GRACE projects.
ReferencesAlkama, R., B. R. Decharme, H. Douville, M. Becker, A. Cazenave,J. Sheffield, A. Voldoire, S. Tyteca, and P. Le Moigne (2010), Globalevaluation of the ISBA-TRIP continental hydrological system. Part I:Comparison with GRACE terrestrial water storage estimates and in situriver discharges, J. Hydrometeorol., 11, 583–600, doi:10.1175/2010JHM1211.1.
Alsdorf, D., S.-C. Han, P. Bates, and J. Melack (2010), Seasonal waterstorage on the Amazon floodplain measured from satellites, RemoteSens. Environ., 114, 2448–2456, doi:10.1016/j.rse.2010.05.020.
Bates, P. D., M. S. Horritt, and T. J. Fewtrell (2010), A simple inertial formu-lation of the shallow water equations for efficient two-dimensional flood in-undationmodeling, J. Hydrol., 387, 33–45, doi:10.1016/j.jhydrol.2010.03.027.
Becker, M., B. Meyssignac, L. Xavier, A. Cazenave, R. Alkama, andB. Decharme (2011), Past terrestrial water storage (1980–2008) in theAmazon Basin reconstructed from GRACE and in situ river gauging data,Hydrol. Earth Syst. Sci., 15, 533–546, doi:10.5194/hess-15-533-2011.
Betts, A. K., M. Kohler, and Y. Zhang (2009), Comparison of river basinhydrometeorology in ERA-Interim and ERA-40 reanalyses with observations,J. Geophys. Res., 114, D02101, doi:10.1029/2008JD010761.
Bongers, F., D. Engelen, and H. Klinge (1985), Phytomass structure ofnatural plant communities on spodosols in southern Venezuela: The Banawoodland, Vegetatio, 63, 13–34, doi:10.1007/BF00032183.
Bonnet, M. P., et al. (2008), Floodplain hydrology in an Amazon floodplainlake (Lago Grande de Curuaı), J. Hydrol., 349, 18–30, doi:10.1016/j.jhydrol.2007.10.055.
Borma, L. S., et al. (2009), Atmosphere and hydrologic controls of theevapotranspiration over a floodplain forest in the Bananal Island region,Amazonia, J. Geophys. Res., 114, G01003, doi:10.1029/2007JG000641.
Bourrel, L., L. Phillips, and S. Moreau (2009), The dynamics of floods inthe Bolivian Amazon Basin, Hydrol. Processes, 23, 3161–3167,doi:10.1002/hyp.7384.
Chambers, D. P. (2006), Evaluation of new GRACE time-variable gravitydata over the ocean, Geophys. Res. Lett., 33, L17603, doi:10.1029/2006GL027296.
Chen, J. L., C. R. Wilson, and B. D. Tapley (2010), The 2009 exceptionalAmazon flood and interannual terrestrial water storage change observed byGRACE,Water Resour. Res., 46, W12526, doi:10.1029/2010WR009383.
Chen, J. L., C. R. Wilson, and B. D. Tapley (2011), Interannual variabilityof Greenland ice losses from satellite gravimetry, J. Geophys. Res., 116,B07406, doi:10.1029/2010JB007789.
Chen, J. L., C. R. Wilson, B. D. Tapley, Z. L. Yang, and G. Y. Niu (2009a),2005 drought event in the Amazon River basin as measured by GRACEand estimated by climate models, J. Geophys. Res., 114, B05404,doi:10.1029/2008JB006056.
Chen, J. L., C. R. Wilson, D. Blankenship, and B. D. Tapley (2009b), Accel-erated Antarctic ice loss from satellite gravity measurements, Nat.Geosci., 2, 859–862, doi:10.1038/ngeo694.
Coomes, D. A., and P. J. Grubb (1996), Amazonian caatinga and relatedcommunities at La Esmeralda, Venezuela: Forest structure, physiognomyand floristics, and control by soil factors, Vegetatio, 122, 167–191,doi:10.1007/BF00044699.
Crowley, J. W., J. X. Mitrovica, R. C. Bailey, M. E. Tamisiea, and J. L. Davis(2008), Annual variations in water storage and precipitation in the AmazonBasin, J. Geodesy, 82, 9–13, doi:10.1007/s00190-007-0153-1.
Cuartas, L. A. (2008), Estudo Observacional E De Modelagem HidrologicaDe Uma Micro-Bacia Em Floresta Nao Perturbada Na Amazonia Central,PhD thesis, Inst. Nac. de Pesqui. Espaciais, Sao Jose dos Campos, Brazil.
Cullmann, J., W. J. Junk, G. Weber, and G. H. Schmitz (2006), The impactof seepage influx on cation content of a Central Amazonian floodplainlake, J. Hydrol., 328, 297–305, doi:10.1016/j.jhydrol.2005.12.027.
Duffy, C. J. (1996), A Two-State Integral-Balance Model for Soil Moistureand Groundwater Dynamics in Complex Terrain, Water Resour. Res., 32,2421–2434, doi:10.1029/96WR01049.
Fan, Y., and G. Miguez-Macho (2010), Potential groundwater contributionto Amazon dry-season evapotranspiration, Hydrol. Earth Syst. Sci., 14,2039–2056, doi:10.5194/hess-14-2039-2010.
Fan, Y., G. Miguez-Macho, C. P. Weaver, R. Walko, and A. Robock(2007). Incorporating water table dynamics in climate modeling: 1. Watertable observations and the equilibrium water table simulations, J. Geophys.Res., 112(D10125), doi:10.1029/2006JD008111.
Forsberg, B. R., A. H. Devol, J. E. Richey, L. A.Martinelli, and H. dos Sandos(1988), Factors controlling nutrient concentrations in Amazon floodplainlakes, Limnol. Oceanogr., 33, 41–56, doi:10.4319/lo.1988.33.1.0041.
Frappart, F., et al. (2011), Satellite-based estimates of groundwater storagevariations in large drainage basins with extensive floodplains, RemoteSens. Environ., 115, 1588–1594, doi:10.1016/j.rse.2011.02.003.
Frappart, F., F. Papa, J. S. Famiglietti, C. Prigent, W. B. Rossow, andF. Seyler (2008), Interannual variations of river water storage from amultiple satellite approach: A case study for the Rio Negro River basin,J. Geophys. Res., 113, D21104, doi:10.1029/2007JD009438.
Grogan, J., and J. Galvão (2006), Physiographic and floristic gradientsacross topography in transitional seasonally dry evergreen forests ofsoutheast Para, Brazil, Acta Amazon., 36, 483–496, doi:10.1590/S0044-59672006000400009.
Hamilton, S. K., J. Kellndorfer, B. Lehner, and M. Tobler (2007), Remotesensing of floodplain geomorphology as a surrogate for biodiversity ina tropical river system (Madre de Dios, Peru), Geomorphology, 89,23–38, doi:10.1016/j.geomorph.2006.07.024.
POKHREL ET AL.: AMAZON GROUNDWATER AND TWS VARIATION
3243

Han, S.-C., H. Kim, I.-Y. Yeo, P. Yeh, T. Oki, K.-W. Seo, D. Alsdorf, andS. B. Luthcke (2009), Dynamics of surface water storage in the Amazoninferred from measurements of inter-satellite distance change, Geophys.Res. Lett., 36, L09403, doi:10.1029/2009GL037910.
Han, S.-C., I.-Y. Yeo, D. Alsdorf, P. Bates, J.-P. Boy, H. Kim, T. Oki, andM. Rodell (2010), Movement of Amazon surface water from time-variablesatellite gravity measurements and implications for water cycle parametersin land surface models, Geochem. Geophys. Geosyst., 11, Q09007,doi:10.1029/2010GC003214.
Hirschi, M., P. Viterbo, and S. I. Seneviratne (2006), Basin-scale water-balance estimates of terrestrial water storage variations from ECMWFoperational forecast analysis, Geophys. Res. Lett., 33, L21401,doi:10.1029/2006GL027659.
Hodnett, M. G., I. Vendrame, O. De, A. Marques Filho, M. D. Oyama,and J. Tomasella (1997a), Soil water storage and groundwater behaviourin a catenary sequence beneath forest in central Amazonia: I. Comparisonsbetween plateau, slope and valley floor, Hydrol. Earth Syst. Sci., 1,265–277, doi:10.5194/hess-1-265-1997.
Hodnett, M. G., I. Vendrame, O. De, A. Marques Filho, M. D. Oyama, andJ. Tomasella (1997b), Soil water storage and groundwater behaviour in acatenary sequence beneath forest in central Amazonia. II. Floodplainwater table behaviour and implications for streamflow generation, Hydrol.Earth Syst. Sci., 1, 279–290, doi:10.5194/hess-1-279-1997.
Jirka, S., A. J. McDonald, M. S. Johnson, T. R. Feldpausch, E. G. Couto,and S. J. Riha (2007), Relationships between soil hydrology and foreststructure and composition in the southern Brazilian Amazon, J. Veg.Sci., 18, 183–194, doi:10.1111/j.1654-1103.2007.tb02529.x.
Johnson, M. S., J. Lehmann, E. C. Selva, M. Abdo, S. Piha, and E. G. Couto(2006), Organic carbon fluxes within and streamwater exports fromheadwater catchments in the southern Amazon, Hydrol. Processes, 20,2599–2614, doi:10.1002/hyp.6218.
Kim, H., P. J.-F. Yeh, T. Oki, and S. Kanae (2009), Role of rivers in theseasonal variations of terrestrial water storage over global basins,Geophys. Res. Lett., 36, L17402, doi:10.1029/2009GL039006.
Klees, R., E. A. Zapreeva, H. C. Winsemius, and H. H. G. Savenije (2007),The bias in GRACE estimates of continental water storage variations,Hydrol. Earth Syst. Sci., 11, 1227–1241, doi:10.5194/hess-11-1227-2007.
Lähteenoja, O., and S. Page (2011), High diversity of tropical peatlandecosystem types in the Pastaza-Marañón basin, Peruvian Amazonia,J. Geophys. Res., 116, G02025, doi:10.1029/2010JG001508.
Landerer, F. W., and S. C. Swenson (2012), Accuracy of scaled GRACEterrestrial water storage estimates, Water Resour. Res., 48, W04531,doi:10.1029/2011WR011453.
Lesack, L. F. W. (1993), Water balance and hydrologic characteristics of arain forest catchment in the central Amazon Basin, Water Resour. Res.,29, 759–773, doi:10.1029/92WR02371.
Lesack, L. F. W. (1995), Seepage exchange in an Amazon floodplain lake,Limnol. Oceanogr., 40, 598–609, doi:10.4319/lo.1995.40.3.0598.
Lesack, L. F. W., and J. M. Melack (1995), Flooding hydrology and mixturedynamics of lake water derived from multiple sources in an Amazon flood-plain lake, Water Resour. Res., 31, 329–345, doi:10.1029/94WR02271.
Lo, M.-H., J. S. Famiglietti, P. J.-F. Yeh, and T. H. Syed (2010), Improvingparameter estimation and water table depth simulation, in a land surfacemodel using GRACE water storage and estimated baseflow data, WaterResour. Res., 46, W05517, doi:10.1029/2009WR007855.
Luthcke, S. B., D. D. Rowlands, F. G. Lemoine, S. M. Klosko, D. Chinn,and J. J. McCarthy (2006), Monthly spherical harmonic gravity fieldsolutions determined from GRACE inter-satellite range-rate data alone,Geophys. Res. Lett., 33, L02402, doi:10.1029/2005GL024846.
Mason, B. G., D. M. Pyle, W. B. Dade, and T. Jupp (2004), Seasonality of vol-canic eruptions, J. Geophys. Res., 109, B04206, doi:10.1029/2002JB002293.
McClain, M. E., J. E. Richey, and J. A. Brandes (1997), Dissolved organicmatter and terrestrial-lotic linkages in the central Amazon basin of Brazil.Global Biogeochem. Cycles, 11, 295–311, doi:10.1029/97GB01056.
Mertes, L. A. K. (1997), Documentation and significance of the perirheiczone on inundated floodplains, Water Resour. Res., 33, 1749–1762,doi:10.1029/97WR00658.
Miguez-Macho, G., and Y. Fan (2012a), The role of groundwater in theAmazon water cycle: 1. Influence on seasonal streamflow, flooding andwetlands, J. Geophys. Res., 117, D15113, doi: 10.1029/2012JD017539.
Miguez-Macho, G., and Y. Fan (2012b), The role of groundwater in theAmazon water cycle: 2. Influence on seasonal soil moisture and evapotrans-piration, J. Geophys. Res., 117, D15114, doi: 10.1029/2012JD017540.
Miguez-Macho, G., Y. Fan, C. P. Weaver, R. Walko, and A. Robock(2007), Incorporating water table dynamics in climate modeling: 2.Formulation, validation, and simulations of soil moisture fields,J. Geophys. Res., 112(D13108), doi:10.1029/2006JD008112.
Neu, V., C. Neill, and A. V. Krusche (2011), Gaseous and fluvial carbonexport from an Amazon forest watershed, Biogeochemistry, 105, 133–147,doi:10.1007/s10533-011-9581-3.
Ngo-Duc, T., K. Laval, G. Ramillien, J. Polcher, and A. Cazenave, Validationof the land water storage simulated by organising carbon and hydrologyin dynamic ecosystems (orchidee) with gravity recovery and climateexperiment (GRACE) data (2007), Water Resour. Res., 43, W04,427,doi:10.1029/2006WR004941.
Niu, G.-Y., and Z.-L. Yang (2006), Assessing a land surface model’simprovements with GRACE estimates, Geophys. Res. Lett., 33, L07401,doi:10.1029/2005GL025555.
Niu, G.-Y., Z.-L. Yang, R. E. Dickinson, L. E. Gulden, and H. Su (2007),Development of a simple groundwater model for use in climate modelsand evaluation with Gravity Recovery and Climate Experiment data,J. Geophys. Res., 112, D07103, doi:10.1029/2006JD007522.
Poels, R. L. H. (1987), Soils, Water and Nutrients in a Forest Ecosystem inSuriname, Agric. Univ. at Wageningen, Wageningen, Netherlands.
Pokhrel, Y., N. Hanasaki, S. Koirala, J. Cho, H. Kim, P. J.-F. Yeh, S. Kanae,and T. Oki (2012), Incorporating anthropogenic water regulation modulesinto a land surface model, J. Hydrometeor., 13, 255–269, doi:10.1175/JHM-D-11-013.1.
Rodell, M., and J. S. Famiglietti (2002), The potential for satellite-basedmonitoring of groundwater storage changes using GRACE: The HighPlains aquifer, central, U.S., J. Hydrol., 263(1–4), 245–256.
Rodell, M., J. S. Famiglietti, J. Chen, S. I. Seneviratne, P. Viterbo, S. Holl,and C. R. Wilson (2004), Basin scale estimates of evapotranspirationusing GRACE and other observations, Geophys. Res. Lett., 31, L20504,doi:10.1029/2004GL020873.
Schaller, M. F., and Y. Fan (2009), River basins as groundwater exportersand importers: Implications for water cycle and climate modeling,J. Geophys. Res., 114, D04103, doi:10.1029/2008JD010636.
Selhorst, D., S. A. Vieira, and I. F. Brown (2003), Agua e crescimento deuma floresta na Amazonia Sul-Ocidental, Acre, Brasil: Chuva afetacrescimento, mas nıvel do lencol freatico nao, poster report, Univ. Fed.do Acre, Rio Branco, Brazil. [ftp://lba.cptec.inpe.br/lba_archives/LC/LC-02/Posters/SelhorstDiogo_Poster_VI_CEB_02nov03.pdf.]
Seo, K.-W., C. R. Wilson, J. S. Famiglietti, J. L. Chen, and M. Rodell(2006), Terrestrial water mass load changes from Gravity Recovery andClimate Experiment (GRACE), Water Resour. Res., 42, W05417,doi:10.1029/2005WR004255.
Swenson, S., J. Wahr, and P. C. D. Milly (2003), Estimated accuracies ofregional water storage variations inferred from the Gravity Recovery andClimate Experiment (GRACE), Water Resour. Res., 39(8), 1223,doi:10.1029/2002WR001808.
Syed, T. H., J. S. Famiglietti, M. Rodell, J. Chen, and C. R. Wilson (2008),Analysis of terrestrial water storage changes from GRACE and GLDAS,Water Resour. Res., 44, W02433, doi:10.1029/2006WR005779.
Tapley, B. D., S. Bettadpur, J. C. Ries, P. F. Thompson, and M. M. Watkins(2004). GRACE measurements of mass variability in the Earth system,Science, 305, 503–505, doi:10.1126/science.1099192.
Tomasella, J., M. G. Hodnett, L. A. Cuartas, A. D. Nobre, M. J. Waterloo,and S. M. Oliveira (2008), The water balance of an Amazonianmicrocatchment: The effect of interannual variability of rainfall on hydro-logical behavior,Hydrol. Processes, 22, 2133–2147, doi:10.1002/hyp.6813.
Toth, J. (1963), A theoretical analysis of groundwater flow in small drainagebasins, J. Geophys. Res., 68, 4795–4812.
Vourlitis, G.L., J.D.Nogueira, F.D. Lobo,K.M.Sendall, S.R. dePaulo,C.A.A. Dias, O. B. Pinto Jr., and N. L. R. deAndrade (2008), Energy balance andcanopy conductance of a tropical semi-deciduous forest of the southern Am-azonBasin,WaterResour. Res., 44,W03412, doi:10.1029/2006WR005526.
Wahr, J., S. Swenson, V. Zlotnicki, and I. Velicogna (2004), Timevariablegravity from GRACE: First results, Geophys. Res. Lett., 31, L11501,doi:10.1029/2004GL019779.
Walko, R. L., et al. (2000), Coupled atmosphere-biophysics-hydrologymodels for environmental modeling, J. Appl. Meteorol., 39, 931–944,doi:10.1175/1520-0450(2000)039< 0931:CABHMF> 2.0.CO;2.
Werth, S. and A. Güntner (2010), Calibration analysis for water storagevariability of the global hydrological model WGHM, Hydrol. Earth Syst.Sci., 14, 59–78, doi:10.5194/hess-14-59-2010.
Winter, T. C., J. W. Harvey, O. L. Franke, and W. A. Alley (1998), Groundwater and surface water: A single resource,U.S. Geol. Surv. Circ., 1139, 79.
Xavier, L., M. Becker, A. Cazenave, L. Longuevergne, W. Llovel, andO. C. Rotunno Filho (2010), Interannual variability in water storageover 2003–2008 in the Amazon basin from GRACE space gravimetry,in situ river level and precipitation data, Remote Sens. Environ., 114,1629–1637, doi:10.1016/j.rse.2010.02.005.
Yamazaki, D., S. Kanae, H. Kim, and T. Oki (2011), A physically baseddescription of floodplain inundation dynamics in a global river routingmodel, Water Resour. Res., 47, W04501, doi:10.1029/2010WR009726.
Yeh, P., S. Swenson, J. Famiglietti, and M. Rodell (2006). Remote sensingof groundwater storage changes in illinois using the gravity recoveryand climate experiment (GRACE), Water Resour. Res., 42, W12203,doi:10.1029/2006WR005374.
POKHREL ET AL.: AMAZON GROUNDWATER AND TWS VARIATION
3244