the role of industry classification in the · pdf file1 the role of industry classification in...
TRANSCRIPT

1
THEROLEOFINDUSTRYCLASSIFICATIONINTHEESTIMATIONOFRESEARCHANDDEVELOPMENTEXPENDITURES
ChristianAwuku‐Budu1andCarolA.RobbinsAnalysisandSpecialStudiesBranch,RegionalProductDivision,BEA
August26,2014
Disclaimer: Any opinions and conclusions expressed herein are those of the author(s) and do not necessarily represent the views of the Bureau of Economic Analysis or the U.S. Census Bureau. All results have been reviewed to ensure that no confidential information is disclosed.
Abstract
This paper uses data from the National Science Foundation’s surveys on business research and
development (R&D) expenditures that have been linked with data from the Census Bureau’s
Longitudinal Business Database to produce consistent NAICS‐based R&D time‐series data based on the
main product produced by the firm for 1976 to 2008. The results show that R&D spending has shifted
away from domestic manufacturing industries in recent years. This is due in part to a shift in U.S.
payrolls away from manufacturing establishments for R&D‐performing firms. These findings support the
notion of an increasingly fragmented production system for R&D‐intensive manufacturing firms,
whereby U.S. firms control output and provide intellectual property inputs in the form of R&D, but
production takes place outside of the firms' U.S. establishments.
Keywords: Business R&D, industry classification, factoryless goods producers, U.S. manufacturing
firms, establishments
1 The authors wish to thank David Byrne, Ian Mead, Guci Ledia, and John Jankowski for valuable comments. We also wish to thank Cheryl Grim for sharing the codes that were used to match firms to establishments. Corresponding author: Christian.awuku‐[email protected].
2
THEROLEOFINDUSTRYCLASSIFICATIONINTHEESTIMATIONOFRESEARCHANDDEVELOPMENTEXPENDITURES
ChristianAwuku‐BuduandCarolA.RobbinsAnalysisandSpecialStudiesBranch,RegionalProductDivision,BEA
August26,2014
The National Science Foundation (NSF)’s annual surveys on business research and development (R&D)
expenditures are the primary federal sources for industry R&D expenditures in the United States. The
business R&D data sets provide an important window into the growth dynamics of industries that fund
and perform R&D. In addition, the information in the NSF‐tabulated data sets is used extensively by
government agencies and private enterprises to evaluate the impacts of R&D expenditures on economic
activity.2 Despite the relevance and usefulness of these annual R&D expenditure data sets, these data as
collected have been affected by changes in how firms have been classified into industries over the
years.3
This paper uses data from the NSF’s surveys on business R&D expenditures that have been
linked with data from the Census Bureau’s Longitudinal Business Database to produce data series with a
consistent set of industry classification standards based on the main product produced by the firm for
1976 to 2008. The adjustment to industry classifications is done on both a broad and more targeted
basis to analyze how much focus needs to be placed on adjustments to firms initially classified into the
management of companies, scientific R&D services, and wholesale trade industries.
We then evaluate our estimates by comparing them to estimates of R&D expenditures obtained
using the line of business information reported in the 2008 Business Research and Development and
Innovation Survey (BRDIS) data. Our estimates are comparable to the BRDIS tabulation for computer and
electronic product manufacturing. Relative to BRDIS for 2008, we somewhat underestimate R&D
expenditures for chemical manufacturing and overestimate R&D expenditures for other manufacturing
industries. Our main contributions to the literature are a consistent methodology and NAICS‐based
business‐performed R&D data for 1976 to 2008.
Our results support earlier work done at BEA during the development of its R&D satellite
accounts to address changes in how firms have been classified into industries in the NSF data. This paper
differs from this previous work by using micro data and the same classification technique over the entire
period rather than adjusting more aggregate data with special tabulations from the NSF and the U.S.
Census Bureau.
2 For example, the Bureau of Economic Analysis (BEA) incorporated R&D expenditures as investment in the National Income and Products Accounts (NIPAs) in July of 2013, which increased the measured level of GDP back to 1929. The NSF R&D expenditures are the main source of data for the change in BEA’s measures of industry R&D investment. 3 These adjustments to the classification methodology rose from efforts to meet the needs of data users as the structure of U.S. economic activity shifted and the Federal Statistical System switched from the Standard Industrial Classification (SIC) to the North American Industrial Classification (NAICS).

3
The results of our paper show that R&D spending has more recently shifted away from domestic
manufacturing industries. This is due in part to a shift in U.S. payrolls away from manufacturing
establishments for R&D‐performing firms, and also a shift upward in the proportion of firm‐level payrolls
for R&D‐performing firms that are engaged in trade and other services activities. These findings support
the notion of an increasingly fragmented production system for R&D‐intensive manufacturing firms,
whereby U.S. firms control output and provide intellectual property inputs in the form of R&D, but
production takes place outside of the firms' U.S. establishments.
Background
This section provides background on industry classification methods, those historically used by the NSF,
and their effect on resulting tabulations of data.
IndustryClassification
Industry classification systems group economic data in order to enable cross‐sectional and, frequently,
time‐series analysis. These systems can be divided into two basic categories, a demand‐oriented system
that groups similarly purposed commodities and services, and a production‐oriented industry
classification system that groups producing units with similar production technologies.4 When the
classification is done consistently across federal statistical agencies, different data sources can be linked
together. This linking provides insights into the structure of the economy that would otherwise not be
discernable.
The North American Industry Classification System (NAICS) was introduced into the Federal
Statistical System in 1997 to replace the Standard Industrial Classification (SIC) system, which was based
on the principal product produced.5 NAICS is based on the economic concept of similarity of production
activities at the level of establishments. The NAICS Manual notes that primary activity should be
determined for each establishment based on the “relative share of current production costs and capital
investment” (2002 NAICS Manual, page 22).6 Additionally, given its expanded coverage of emerging
industries, NAICS captures the growing importance of service‐ and technology‐producing industries.
For multi‐unit firms with diverse production activities, a NAICS framework can be implemented
in ways that lead to different results. To our knowledge, there is no consensus on a single method to
classify multi‐unit firms into a primary industry based on production activity. A 2012 report prepared for
the U.S. Census Bureau by Robert Parker reviews five alternative methods that are used within the
Federal Statistical System to classify enterprises, and concludes that the methods differ in how
4 Economic Classification Policy Committee (ECPC), 1993.
5 The SIC assigned operating establishments to industries on the basis of primary activity, which was defined as “determined by its principal product or group of products produced or distributed, or services rendered” (1987 Standard Industrial Classification Handbook, pg. 15). 6 In practice, this grouping is done at the Census Bureau based on the producing units’ revenue or value of shipments to identify primary business activity (http://www.census.gov/eos/www/naics/faqs/faqs.html#q4).
4
industries are identified, where overseas operations are included, level of detail, and whether company
or establishment information is used to identify industry classification (Parker, 2012).
One general solution to the industry classification issue for multi‐unit firms is a multiple stage
“hierarchical” approach. In the first stage, the firm is assigned to a major sector based on highest share
of payroll, receipts, or some other measure. Within that major sector, the firm is then assigned to a sub‐
sector, based on the highest share across the sub‐sectors within the major sector. In a third stage of the
process, the firm is then assigned to a detailed industry within the sub‐sector, based on the highest
share across the detailed industries with the sub‐sector. A feature of this approach is that the firm is
assigned first to the most appropriate major group, even if the firm is involved in diverse activities. This
method is used for multinational corporation data, assigning firms to one industry by a three stage
process. In this case, sales receipts are used (BEA, 2013).
For other statistical data, payroll information is often the data item that is defined and reported
the same way across economic sectors. The cycle of the 2012 Economic Census includes a revived set of
enterprise statistics informed by Parker’s work. The classification of enterprises for these statistics is
based on an aggregation of domestic establishment payroll data. The method is described as follows
(Parker, 2012):
For each enterprise, the classification methodology starts by excluding nonoperating
establishments ‐ establishments classified as manufacturers' sales branches and offices, central
administrative offices (NAICS 551114), and "auxiliaries." From the remaining establishments, a
primary NAICS sector is selected. If the primary sector is outside the scope of the 2007 Economic
Census, the records of the establishments in these sectors are deleted and a primary in‐scope
sector is selected based on payroll. The primary Enterprise Classification System category is the
category in that sector with the largest aggregate payroll.
This hierarchical approach can treat establishments within firms consistently, but can also
obscure valuable information about the firm. While NAICS is focused on the production process at the
establishment level, a key distinction for enterprises is an understanding of ownership characteristics
and control of shared inputs, including intangible ones. Survey data collected at the firm level provide
ownership and control information not generally available at the establishment level. Additionally,
focusing on the domestic establishments of the firm can be unrepresentative of globally‐active firms.
ClassificationofR&DExpenditures
For R&D expenditures, the Survey of Industrial Research and Development (SIRD) used the SIC system
from 1953 until 1999, when NAICS was adopted. Firms were classified to industries based on the
industry code within the company that had the greatest number of employees. The end result was
understood by data users to be based on the market‐based product or service sold by the R&D‐
performing firm (Shackelford, 2008). The paragraphs below describe the four major changes in NSF’s
classification procedure.
Freezingoffirms. In the early 1980s, hand‐editing of firms was developed in response to the
observation that some large consolidated firms with manufacturing establishments shifted over time
from manufacturing to wholesale trade without any change in the product produced by the firm. NSF

5
staff developed a procedure to maintain the classification of the primary product that the firms sold in
the market by continuing to classify these R&D expenditures in the manufacturing industry. This
procedure was known as “freezing” of firms.
This “freezing” of firms based on analyst’s knowledge about the R&D performers continued until
1992. In this year, according to Shackelford (2008), NSF stopped freezing many firms’ industry codes. As
a result, firms that were formerly classified in manufacturing were increasingly assigned to the
wholesale trade sector and other private services‐producing industries.
NAICS. With the introduction of NAICS in 1999 to NSF’s industry tabulations, firms continued to be
assigned to industries based on the highest payroll shares.7 However, NAICS changed the way that
auxiliary units were treated within firms, assigning them to separate service industries. R&D is
performed in at least two types of auxiliary units, R&D support establishments and company
headquarters, which would not align with the market‐based product or service sold by the firm.
Classifying R&D here would have changed the way that users understood the R&D statistics from the
survey. NSF’s response was to exclude auxiliary units from the process of determining industry
classification for multi‐unit firms.
Following the introduction of NAICS, the industry group “Trade” emerged as one of the largest
performers of domestic R&D activity in the early 2000s. For NSF, this development “ran counter to
analyst understanding of corporate R&D and did not accurately reflect the industry‐structure of R&D in
the U.S. economy” (Shackelford, 2008).8 What followed at NSF was a more extensive investigation of
firm‐level data from the 2004 survey. This revealed that some large R&D‐performing firms had their
largest domestic payroll shares in trade or other auxiliary activities, rather than in manufacturing of the
final market‐based product.
Wholesaletradeandserviceadjustment. NSF analysts responded by setting up a system of rule‐
based adjustments that reclassified R&D activity back to the final product industry. In practice, the most
significant effect was to reclassify R&D expenditures out of wholesale trade and into three
manufacturing industries: pharmaceutical and medicine (NAICS 3254), semiconductor and other
electronic component (NAICS 3344), and communications equipment (NAICS 3342). This practice
continued from 2004 until 2007, the last survey year for the SIRD.
BusinessR&DandInnovationSurvey(BRDIS). The redesigned BRDIS in 2008 was a major
expansion of the NSF business R&D survey. It now includes greater detail on the nature of the R&D
activity within the firm, the firm’s geographic location, and its financing. In addition to the variables in
the SIRD data sets, BRDIS collects information on firms’ domestic R&D performance by business lines,
allowing firms to report R&D related to multiple lines of business. By collecting data by line of business,
the BRDIS effectively provides R&D expenditures based on the kinds of products that the R&D activity is
7 Shackelford (2008) notes various exclusions and exceptions, along with the hand‐editing. 8 One reason why this development was hard to understand was that wholesale and retail trade industries under NAICS are defined as engaged in activities that are not transformative. Any services performed are “incidental to the sale of merchandise” (2002 NAICS Manual pages 507 and 551). Classifying R&D into the Trade category appears to explain little about the economic activity of the firm.
6
used to create. This change allowed firms to report multiple lines of business, account for both domestic
and international R&D activity, resulting in an industry classification that returned conceptually to the
final product classification.
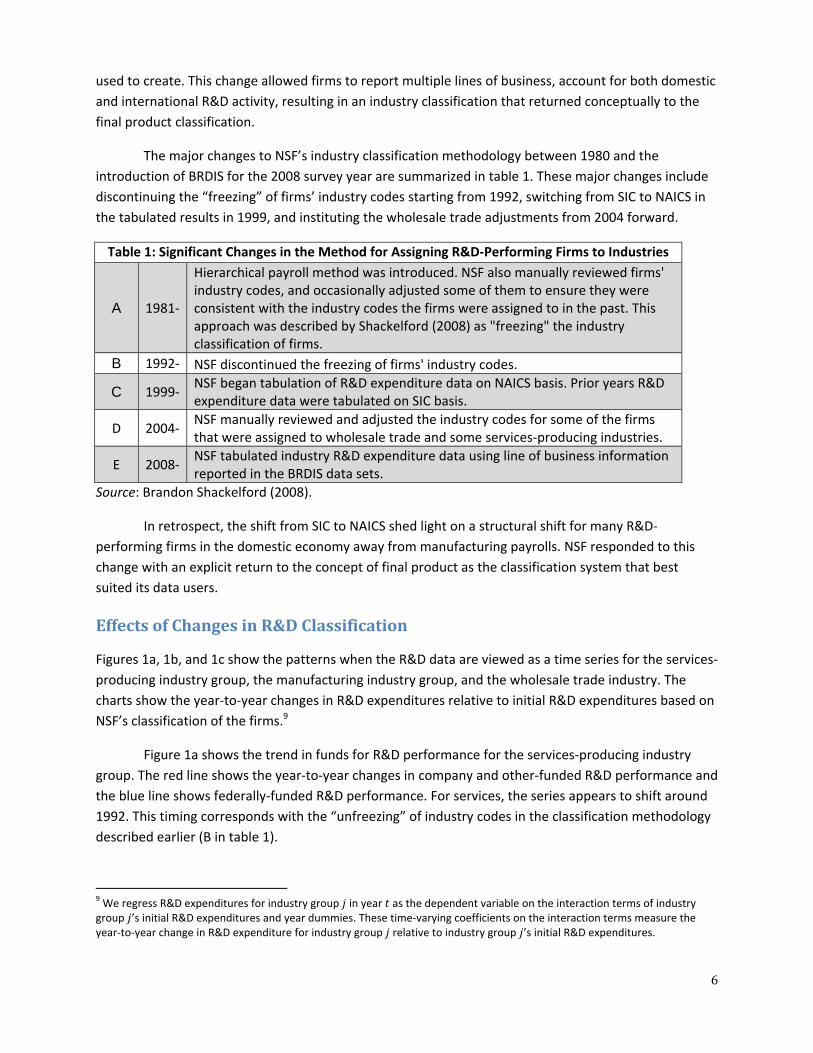
The major changes to NSF’s industry classification methodology between 1980 and the
introduction of BRDIS for the 2008 survey year are summarized in table 1. These major changes include
discontinuing the “freezing” of firms’ industry codes starting from 1992, switching from SIC to NAICS in
the tabulated results in 1999, and instituting the wholesale trade adjustments from 2004 forward.
Table 1: Significant Changes in the Method for Assigning R&D‐Performing Firms to Industries
A 1981‐
Hierarchical payroll method was introduced. NSF also manually reviewed firms' industry codes, and occasionally adjusted some of them to ensure they were consistent with the industry codes the firms were assigned to in the past. This approach was described by Shackelford (2008) as "freezing" the industry classification of firms.
B 1992‐ NSF discontinued the freezing of firms' industry codes.
C 1999‐ NSF began tabulation of R&D expenditure data on NAICS basis. Prior years R&D expenditure data were tabulated on SIC basis.
D 2004‐ NSF manually reviewed and adjusted the industry codes for some of the firms that were assigned to wholesale trade and some services‐producing industries.
E 2008‐ NSF tabulated industry R&D expenditure data using line of business information reported in the BRDIS data sets.
Source: Brandon Shackelford (2008).
In retrospect, the shift from SIC to NAICS shed light on a structural shift for many R&D‐
performing firms in the domestic economy away from manufacturing payrolls. NSF responded to this
change with an explicit return to the concept of final product as the classification system that best
suited its data users.
EffectsofChangesinR&DClassification
Figures 1a, 1b, and 1c show the patterns when the R&D data are viewed as a time series for the services‐
producing industry group, the manufacturing industry group, and the wholesale trade industry. The
charts show the year‐to‐year changes in R&D expenditures relative to initial R&D expenditures based on
NSF’s classification of the firms.9
Figure 1a shows the trend in funds for R&D performance for the services‐producing industry
group. The red line shows the year‐to‐year changes in company and other‐funded R&D performance and
the blue line shows federally‐funded R&D performance. For services, the series appears to shift around
1992. This timing corresponds with the “unfreezing” of industry codes in the classification methodology
described earlier (B in table 1).
9 We regress R&D expenditures for industry group in year as the dependent variable on the interaction terms of industry group ’s initial R&D expenditures and year dummies. These time‐varying coefficients on the interaction terms measure the year‐to‐year change in R&D expenditure for industry group relative to industry group ’s initial R&D expenditures.

7
Figure 1b shows the year‐to‐year change in R&D expenditures relative to 1972 R&D
expenditures for the manufacturing industry group. The red and the blue lines break down the total
R&D performance of manufacturing firms into company‐funded (solid red) R&D performance and
federally‐funded (blue) R&D performance, respectively. For the company‐funded R&D performance,
there was an overall gradual increase from early 1970s to 2002 with small intermittent declines.
However, the chart also shows what appears to be a change in the time series after 2003, with timing
that corresponds to the wholesale trade and service industry adjustment described above (D in table 1).
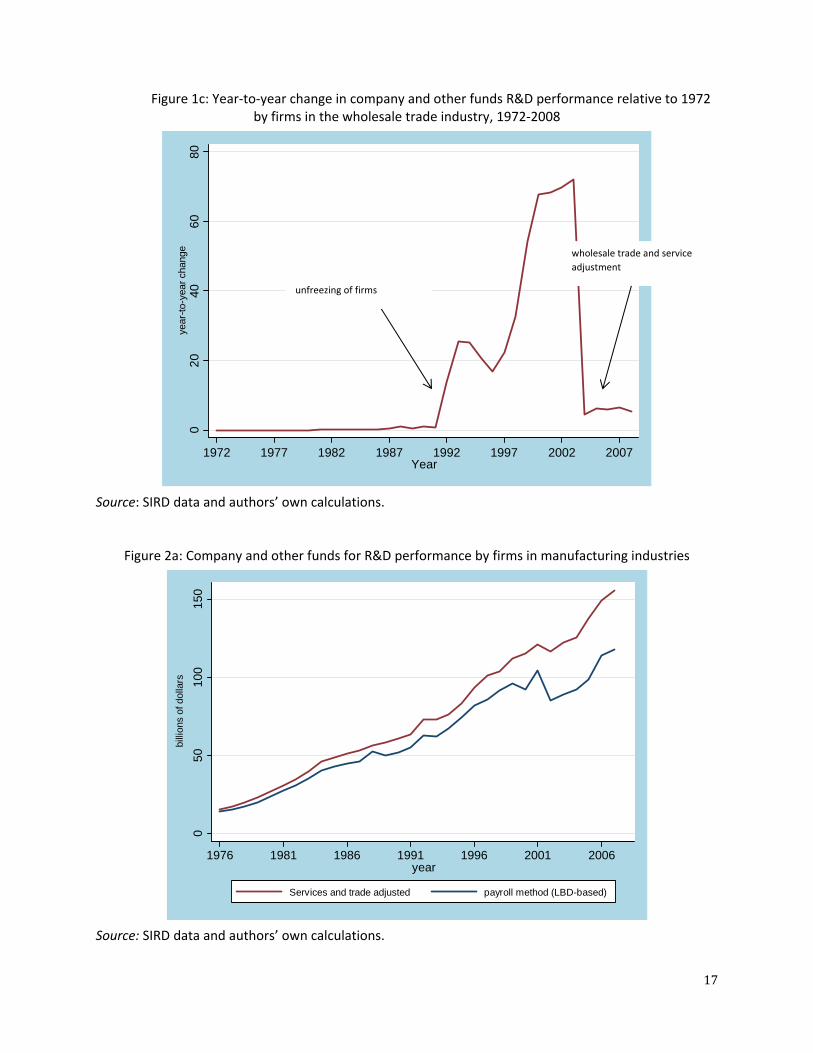
The next figure, 1c, shows the year‐to‐year change in the company‐funded R&D performance for
the wholesale trade industry from 1972 to 2008. From 1972 to 1992, during the time when firms that
were originally in manufacturing were frozen there, we observe almost no change in the company‐
funded R&D performance for firms classified in wholesale trade. In the early 1990s, concurrent with the
“unfreezing” of the classification of firms with manufacturing establishments (B in table 1), we see a
sharp increase in the company‐funded R&D performance. Figure 1c also shows the sharp decline in
2004, corresponding to the adoption of the adjustments for wholesale trade and service industries (D in
table 1).
Methodology
This section discusses the three main micro‐data sets and the methodology to create a consistent set of
R&D time‐series data by industry for 1976 to 2008.
Data. The primary data sets that we use are firm‐level SIRD and BRDIS R&D micro‐data sets and
establishment‐level data from the Longitudinal Business database (LBD).10 We use R&D data sets from
the SIRD from 1976 to 2007 and from BRDIS for 2008. The variables we use from these data sets are a
unique firm identifier, the firm’s industry classification, domestic R&D performance funded by federal
government agencies, and domestic R&D performance funded by industry and others.11 The R&D data
from SIRD and BRDIS are linked to establishment‐level data through the LBD. The LBD contains annual
information on establishments’ annual payroll, employment, operational status, industry classification,
state, zip code where the establishments are located, and a unique establishment identifier. There are
over 5 million domestic non‐farm private business establishments in the LBD in any given year.12 We also
use data from the quinquennial economic censuses to recode some establishments in the LBD from SIC
basis to NAICS basis.
Methodology. Our methodology creates R&D expenditures by year and industry in two different ways.
10 These data were accessed at the secure Census Bureau Headquarters Research Data Center under confidentiality agreements with respect to the scope of results that can be removed from the Research Data Center and reported. 11 Others include state and local government, nonprofit institutions, and universities and colleges. Others also include foreign entities that purchased R&D from the domestic R&D‐producing firms. However, the total amount of this R&D is relatively small. 12 The LBD was constructed using establishment and firm information from the Business Register. The establishments industry classification for SIC industry codes are available for all establishments prior to 1999 and are only available for some establishments after 1999. The NAICS industry codes are available for all firms after 2002, and are only available for some firms prior to 2002. The NAICS codes before 1997 have been assigned by researchers at the Census Bureau’s Center for Economic Studies.
8
The first way is based on a hierarchical method using payroll shares and the second is based on the
primary product, using the manufacturing establishments in the firm’s U.S. operations. In practice, the
difference between our method and what was done in the SIRD series is that we use the same
procedure for each year.
There are four steps in the creation of a set of industry time series for firms: 1) match firms in
the SIRD to their constituent establishments in the LBD; 2) recode establishments in the LBD from SIC
basis to NAICS basis; 3) use the hierarchical payroll method to assign firms to industries for a consistent
NAICS assignment; and 4) reassign selected firms to manufacturing that were assigned to wholesale
trade and other services industries.
Mergingthefirms. Our approach is similar to the approaches used by previous studies that have
merged firms in the SIRD data sets to establishment‐level datasets (Lichtenberg and Seigel, 1991; Adams
and Peck, 1994; Adams and Jaffe, 1996; and Foster and Grim, 2010). We start by merging the firms in
the SIRD data sets to the establishments in LBD using a unique census firm identifier in the SIRD and in
the LBD data sets.13
Following the method of Foster and Grim (2010), we use the 5‐year window of the LBD in our
matching of firms to establishments, which, on average, led to about a 99 percent matching rate for
multi‐unit firms and about a 95 percent matching rate for single‐unit firms.
SICtoNAICS. The next step is to develop a NAICS‐based time series at the firm level for years prior to
1999, when the data were collected on a SIC basis. Some of the establishments in the LBD have already
been assigned NAICS industry codes by researchers at CES as part of an ongoing project. Our method for
assigning the remainder to NAICS codes follows Bayard and Klimek (2003) and Klimek and Merrell
(2003).
We use exact matching where possible, and probabilistic matching for the remainder.
Specifically, for establishments that have no NAICS codes assigned in the LBD, we assign these
establishments to NAICS codes of the establishment in the closest year for which a NAICS code is not
missing. For the rest, we use the 1997 SIC‐to‐NAICS bridge table to assign each establishment to a NAICS
industry when there is an exact match between the establishment’s SIC code and a NAICS code in the
bridge table. We also match establishments’ ID in LBD to their ID in the Census of Manufactures or
Census of Service industries and assign the NAICS code found in the censuses. The rest are assigned
using a statistical matching procedure based on establishment payroll and other characteristics.
Payrollmethod. Next, we assign firms to 4‐digit industry codes using the hierarchical payroll method
for each year of data. We first assign the firm to one of the major economic sectors, then to the 2‐digit
industry within the largest economic sector. We then assign the firm to 3‐digit industry within the two‐
digit and so on. When this step is concluded we have our consistent payroll‐based series.
13 For more information on firm identifiers in the SIRD and establishment identifiers in the LBD, see Adams and Peck (1994) and Jarmin and Miranda (2002).
9
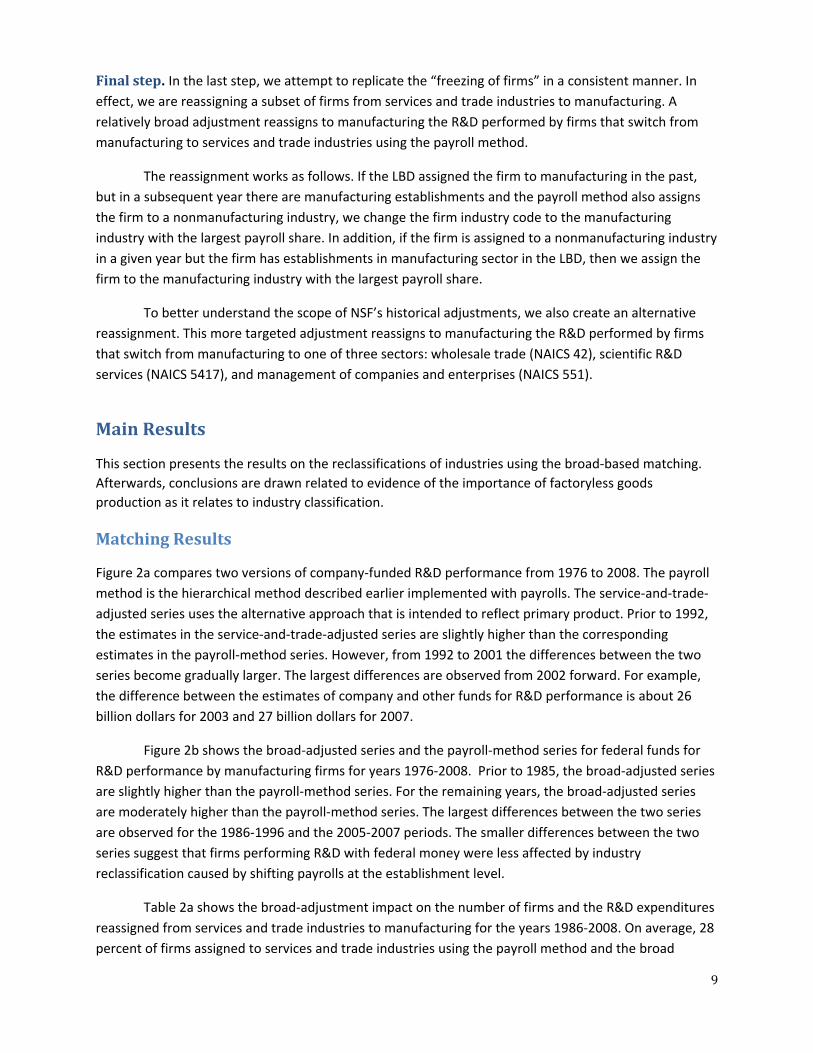
Finalstep. In the last step, we attempt to replicate the “freezing of firms” in a consistent manner. In
effect, we are reassigning a subset of firms from services and trade industries to manufacturing. A
relatively broad adjustment reassigns to manufacturing the R&D performed by firms that switch from
manufacturing to services and trade industries using the payroll method.
The reassignment works as follows. If the LBD assigned the firm to manufacturing in the past,
but in a subsequent year there are manufacturing establishments and the payroll method also assigns
the firm to a nonmanufacturing industry, we change the firm industry code to the manufacturing
industry with the largest payroll share. In addition, if the firm is assigned to a nonmanufacturing industry
in a given year but the firm has establishments in manufacturing sector in the LBD, then we assign the
firm to the manufacturing industry with the largest payroll share.
To better understand the scope of NSF’s historical adjustments, we also create an alternative
reassignment. This more targeted adjustment reassigns to manufacturing the R&D performed by firms
that switch from manufacturing to one of three sectors: wholesale trade (NAICS 42), scientific R&D
services (NAICS 5417), and management of companies and enterprises (NAICS 551).
MainResults
This section presents the results on the reclassifications of industries using the broad‐based matching.
Afterwards, conclusions are drawn related to evidence of the importance of factoryless goods
production as it relates to industry classification.
MatchingResults
Figure 2a compares two versions of company‐funded R&D performance from 1976 to 2008. The payroll
method is the hierarchical method described earlier implemented with payrolls. The service‐and‐trade‐
adjusted series uses the alternative approach that is intended to reflect primary product. Prior to 1992,
the estimates in the service‐and‐trade‐adjusted series are slightly higher than the corresponding
estimates in the payroll‐method series. However, from 1992 to 2001 the differences between the two
series become gradually larger. The largest differences are observed from 2002 forward. For example,
the difference between the estimates of company and other funds for R&D performance is about 26
billion dollars for 2003 and 27 billion dollars for 2007.
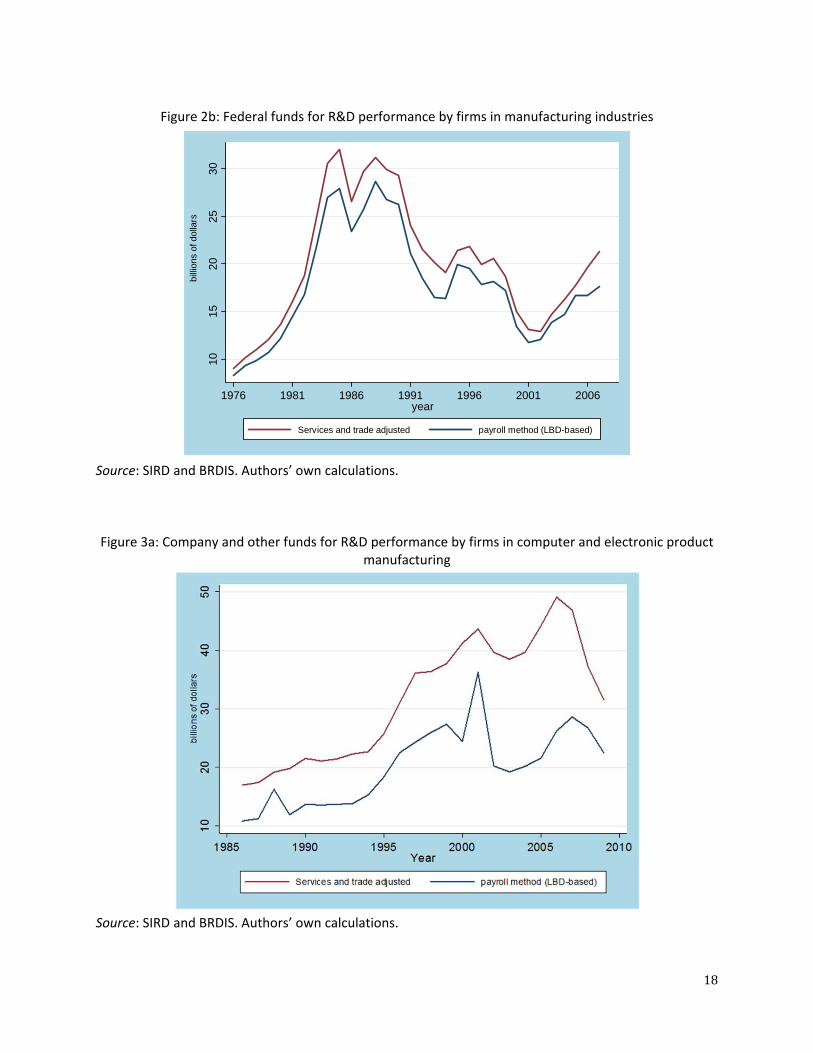
Figure 2b shows the broad‐adjusted series and the payroll‐method series for federal funds for
R&D performance by manufacturing firms for years 1976‐2008. Prior to 1985, the broad‐adjusted series
are slightly higher than the payroll‐method series. For the remaining years, the broad‐adjusted series
are moderately higher than the payroll‐method series. The largest differences between the two series
are observed for the 1986‐1996 and the 2005‐2007 periods. The smaller differences between the two
series suggest that firms performing R&D with federal money were less affected by industry
reclassification caused by shifting payrolls at the establishment level.
Table 2a shows the broad‐adjustment impact on the number of firms and the R&D expenditures
reassigned from services and trade industries to manufacturing for the years 1986‐2008. On average, 28
percent of firms assigned to services and trade industries using the payroll method and the broad

10
adjustment were reassigned to industries in manufacturing. Table 2a also shows that, on average, two‐
thirds (67 percent) of company and other funds for R&D that would be considered to be services and
trade R&D using the payroll method are classified as manufacturing R&D when we attempt to classify
the R&D based on the primary product.
Table 2a further shows that R&D grew substantially in firms that did not have manufacturing
establishments. Although the number of firms that were assigned to services and trade using the payroll
method increased from 196 in 1986 to 1,337 in 2008, the share of firms that were reassigned decreased
from 51 percent in 1986 to 15 percent in 2008. Similarly, while the level of company and other R&D
funds assigned to the services and trade industries using the payroll method increased from 7.6 billion
dollars in 1986 to 53.3 billion dollars in 2008, the share of funds reassigned to manufacturing decreased
from 89 percent in 1986 to 56 percent in 2008.
However, a relatively small number of firms account for a large proportion of the service‐and‐
trade adjustment in recent years. For example, in 2008 about 15 percent of the firms reassigned from
services and trade to manufacturing industries accounted for more than 56 percent of the R&D
originally assigned to services and trade. These are large R&D‐intensive firms with increasing payroll
share in the services and trade industries.
Table 2b presents data that take a closer look at the industries within manufacturing that are
most affected. Across all years, half of the firms are in only two industries, computer and electronic
product manufacturing and chemical manufacturing. On average, 133 firms were moved to
manufacturing industries from services and trade industries, of which 29 percent were reassigned to
computer and electronic product manufacturing, 22 percent to chemical manufacturing, and 49 percent
to other manufacturing industries. In addition, about 18 billion dollars of company and other R&D were
moved to manufacturing industries, of which, 72 percent of the R&D expenditures were moved to
computer and electronic product manufacturing, 21 percent to chemical manufacturing, and 6 percent
to other manufacturing industries.
Over time, the R&D expenditures that were reassigned for firms with chemical manufacturing
establishments increased relative to firms with computer and electronic product manufacturing
establishments. The share of company and other R&D moved to manufacturing for computer and
electronic product manufacturing decreased from 90 percent in 1986 to 35 percent in 2008. In contrast,
the share of R&D moved to manufacturing that was allocated to chemical manufacturing increased from
5 percent in 1986 to 54 percent in 2008. The share that goes to other manufacturing industries
increased marginally from 5 percent in 1986 to 11 percent in 2008.
Figure 3a shows the service‐and‐trade‐adjusted series and the payroll‐method series of
company and other funds for R&D performance by computer and electronic product manufacturing
firms. This industry includes the semiconductor and other electronic component manufacturing. As
shown, the differences between the service‐and‐trade‐adjusted series and payroll‐method series for the
years prior to 2001 are large. Between 2001 and 2007, the service‐and‐trade‐adjusted series become
significantly higher than the payroll‐method series. For instance, in 2002, the estimate in the service‐
and‐trade‐adjusted series is about 7 billion dollars higher than the estimate in the payroll‐method series,
whereas in 2007 it is about 13 billion dollars higher. From 2003 to 2006, the service‐and‐trade‐adjusted

11
estimates again become moderately higher than the payroll‐method series. The service‐and‐trade‐
adjusted series are generally higher than the payroll‐method series because large R&D‐intensive firms
were moved from the services‐producing industries, particularly from scientific R&D and related
services, to computer and electronic product manufacturing industries. Semiconductor R&D is a large
part of computer manufacturing R&D and our results are consistent with the results for semi‐conductors
manufacturing obtained by Bayard, Byrne, and Smith (2013).
Figure 3b shows the service‐and‐trade‐adjusted series and payroll‐method series for company
and other funds for R&D performance for chemical manufacturing firms, the category that includes
pharmaceutical and medicine manufacturing. As shown, the estimates in the service‐and‐trade‐adjusted
series are nearly identical to the estimates in the payroll‐method series prior to 1992. However, from
1992 to 1996 the service‐and‐trade‐adjusted series becomes slightly higher than the payroll‐method
series. There are large differences between the adjusted series and the payroll‐method series for the
years 1996 to 2008. For instance, in 1999, the adjusted estimate was 20 billion dollars higher than the
payroll‐method estimate; in 2003, the adjusted series was 11 billion dollars higher than the payroll‐
method series. The results demonstrate that the domestic composition of R&D‐performing firms in the
chemical industry is undergoing a fundamental change during this period: the economic activity in the
U.S. is shifting away from chemical manufacturing for R&D‐performing firms. This takes place even as
their R&D performance increases steadily. Within services and trade, wholesale trade is the industry
that is most affected by this shifting to chemical manufacturing.
Figure 3c is included to show that the two categories we have described, computer and
electronic product manufacturing and chemical manufacturing, make up most of the impact of the
adjustment for manufacturing R&D. Figure 3c shows the service‐and‐trade‐adjusted series and the
payroll method for company and other funds for R&D performance for the all other manufacturing
industries. As shown, the two series are almost identical before 1998 and from 1998 forward the
adjusted series is slightly higher than the unadjusted series. The firms in the other manufacturing
industries are less R&D intensive compared to firms in chemical product manufacturing and computer
and electronic product manufacturing.
EvidenceofFactorylessGoodsProduction
The trends from manufacturing to services are apparent for all firms in the LBD, not just for R&D‐
performing firms. Tables 4a and 4b provide evidence of the shifting of firms from manufacturing to
services industries. Table 4a shows that, out of the all firms that were assigned to the computer and
electronic product manufacturing industry in 2002 by the payroll method, 7606 firms were still classified
in the same industry in 2007. By 2007, 159 of these firms had shifted to a different industry (the sum of
the four right most columns for computer and electronic products). Most of these firms shifted to trade,
services, and management, rather than to a different goods‐producing industry. This is consistent with
firms shifting their manufacturing activities abroad or increasing their purchasing of contract
manufacturing services from other firms within the U.S. or from abroad.
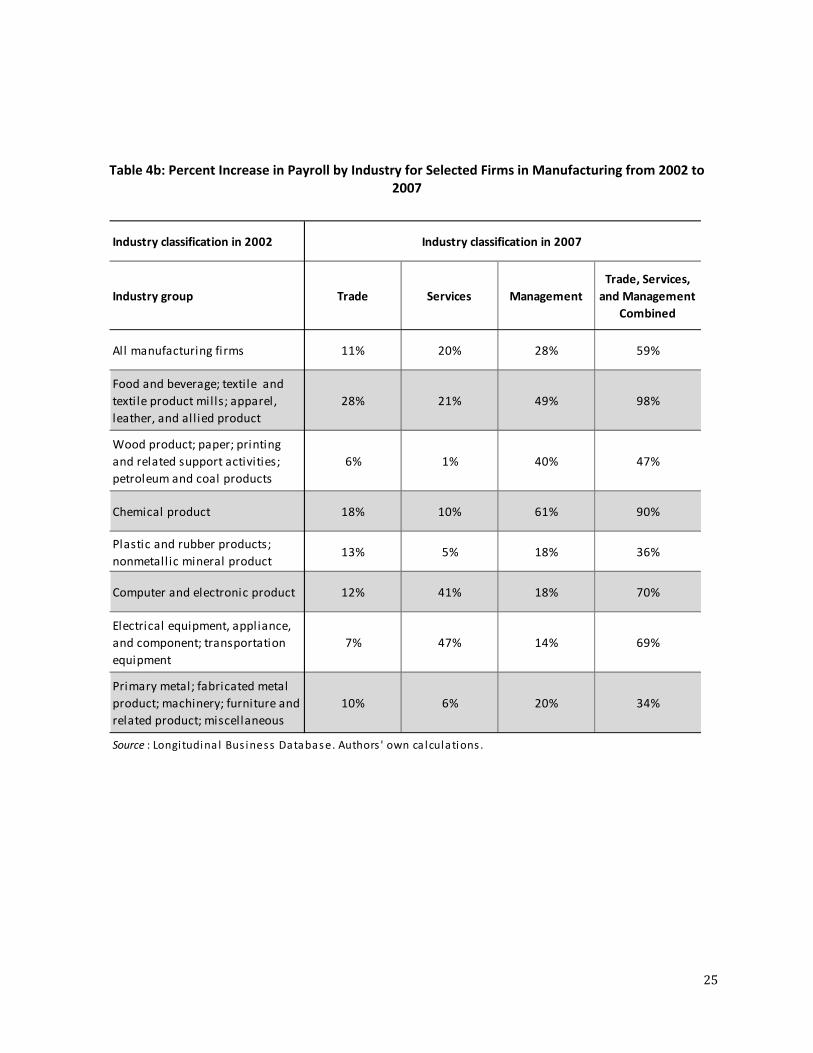
Table 4b shows that the payroll in services, trade, and management of companies and
enterprises industries for firms that were classified in computer and electronic product manufacturing in

12
2002 increased by 70 percent from 2002 to 2007. Similarly, for firms that were classified in chemical
manufacturing in 2002, payroll in trade, services, and management industries increased by 90 percent
from 2002 to 2007. For computer and electronic product manufacturing the services industries
experienced the largest increase in payroll, however, for chemical manufacturing, management of
companies and enterprises industry experienced the largest payroll increase. Within other services, the
scientific R&D and related services and information services absorb a large share of the shift.
RobustnessofResults
We have described the methodology and results for alternative ways to classify R&D performance by
industry. One is based on payroll shares and the other ways make adjustments to the payroll method to
attempt to show the industry of the product produced by the firm. We create our series for years from
1986 to 2008.
Comparisonto2008BRDIS
For this final year, 2008, we have an independent source of information on the product produced with
the firm’s R&D. We compare our estimates to the estimates produced from the lines of business
information reported in the 2008 BRDIS. The firm‐reported line of business information was used by NSF
to assign firms to NAICS industries for the 2008 R&D expenditures. For the firms that reported
performing R&D in only one line of business, they were assigned to the NAICS industry corresponding to
the line of business reported. However, for the few firms that reported performing R&D in more than
one line of business, they were assigned to the NAICS industry corresponding to the line of business with
the largest share of R&D expenditures.14
For each firm, we compare the 4‐digit NAICS industry code that was reported in the BRDIS to the
4‐digit NAICS industry code from the LBD data sets. We then sum across firms to obtain the number of
firms and the estimates of industry R&D expenditures.15 In table 3 the company‐funded R&D
performance is presented for six major economic groups for 2008. Table 3 shows a comparison of the
estimates of company‐funded R&D performance based on the broad adjustment, more targeted
adjustment, and the line of business information reported in the 2008 BRDIS.
For chemical manufacturing, our targeted adjustment and our trade‐and‐services adjustment
result in similar shares of R&D for chemical product manufacturing, 19.1% and 19.5% respectively.
However, based on the line of business reported in the 2008 BRDIS, chemical product manufacturing
accounted for 25.8% of company‐funded R&D. These differences translate to company‐funded R&D
performance estimate based on the trade‐and‐services series that is about 8 billion dollars lower than
14 For instance, a firm may have two or three business lines in manufacturing, but they reported R&D in only one business line. Usually, this business line is the industry with the largest payroll share among all the firm’s business lines. This approach is parallel to the payroll method, where firms are assigned to NAICS industries with the largest payroll shares. 15 There is a mapping between the business lines and NAICS industry codes. The data have already been assigned to NAICS industry codes based on the reported business lines.

13
the company‐funded R&D performance estimate based on the line of business information for chemical
manufacturing.
Our adjustment method depends on the existence of manufacturing establishments within the
firm at some point in the period from 1986 to 2008 in the LBD. While their domestic payroll is in the
trade and services industries, we expect that many of these are performing manufacturing activities
outside the U.S. or contracting manufacturing activities to other firms in the U.S. and abroad. This is
consistent with “factoryless” goods‐producing firms. Another reason for the difference may be because
of the timing issues related to the LBD. Sometimes not all the establishments of the firms are reported
in the LBD in the current year because of mergers and acquisitions, leverage buyout and divestitures.16
For computer and electronic product manufacturing there is a larger gap between the two
adjustment methods. The targeted adjustment results in a R&D share of 16.9 percent, compared to 22.3
percent for the trade‐and‐services‐adjusted series. The trade‐and‐services‐adjusted expenditures for
2008 are very close to the expenditures classified in computer and electronic product manufacturing
based on line of business, 22.3 percent versus 22.9 percent. This suggests a greater U.S. presence for
manufacturing establishments in this industry, at least historically.
ComparisontoCompany‐fundedR&DExpenditures
Figure 4 shows the comparison of NSF‐published data for the manufacturing share of company and
other funds for R&D to our adjusted company and other funds. Our service‐and‐trade‐adjusted
estimates are higher than the NSF‐published estimates. However, for years 2004‐2007, the differences
are very small. This is because the NSF adjusted the estimates by moving firms that were classified in
wholesale trade, management of companies and enterprises, and the scientific R&D and related services
industries to manufacturing industries.
Conclusion
This paper develops a method for producing a consistent time series of R&D expenditure data for R&D‐
performing industries. Using SIRD, BRDIS, and LBD micro‐data sets, we merge the firm‐level SIRD and
BRDIS data sets to establishments in the LBD, recode establishments in the LBD from SIC to NAICS,
adjust firms industry codes in the SIRD, and allocate the firms’ R&D expenditures to establishments that
are more likely to perform R&D.
Compared to the hierarchical payroll method, which uses information about the domestic
component of firm activity, our trade‐and‐services‐adjusted series reduces the amount of R&D
expenditures allocated to wholesale trade by more than 30 percent. In addition, it increases the amount
of R&D expenditures allocated to manufacturing industries by 5 percent. The manufacturing industries
with the largest increases are computer and electronic product manufacturing (60 percent) and
chemical manufacturing (25 percent).
16 Foster and Grim (2010).

14
In addition to the development of a more consistent time series for key U.S. R&D‐performing
industries, our results also show the outlines of a structural shift within firms that sell manufactured
goods with R&D content. Increasingly, the U.S. economic activity of these firms is moving away from
manufacturing and toward services. For R&D‐performing firms, the transition of the Federal Statistical
System from SIC to NAICS played a substantial role in revealing this shift.
Our results have significance for the analysis of the impact of R&D on firm productivity and
industry productivity. This is because previous studies have used R&D expenditures data that had R&D
allocated to the wholesale trade and the services industries, when the expenditures were instead
directed towards goods production. The consistent time series based on the products produced provide
a better understanding of the relationship of R&D activity as an input in the production of goods and
services within firms.
References
Acemoglu, Daron, Ufuk Akcigit, Nicholas Bloom, and William Kerr, "Innovation, Reallocation, and
Growth", Working Paper (2010).
Adams, James D and Suzanne Peck, “A Guide to R&D Data at the Center for Economic Studies U.S.
Bureau of the Census, "Working Papers 94‐9, Center for Economic Studies, U.S. Census Bureau (1994).
Adams, James D and Adam B. Jaffe, The Span of the Effect of R&D in the Firm and Industry”, “Working
94‐7, Center for Economic Studies, U.S. Census Bureau (1994).
Adams, James D & Adam B. Jaffe, "Bounding the Effects of R&D: An Investigation Using Matched
Establishment‐Firm Data, "NBER Working Papers 5544, National Bureau of Economic Research, Inc.
(1996).
Akcigit, Ufuk and William R. Kerr,”Growth through Heterogeneous Innovations” (October 27, 2010). PIER
Working Paper No. 10‐035.
Bayard, Kimberly N. and Shawn D, Klimek, “Creating a Historical Bridge for Manufacturing Between the
Standard Industrial Classification System and the North American Classification System,” presented at
the Joint Statistical Meetings in San Francisco, August 2003.
Bayard, Kimberly N. and David Byrne and Dominic Smith. “The Scope of U.S. Factoryless Manufacturing,
Paper prepared for Upjohn conference on Measuring the Effects of Globalization, February 28, 2013.
15
Bureau of Economic Analysis, “Preview of the 2013 Comprehensive Revision of the National Income and
Product Accounts: Changes in Definitions and Presentations,” Survey of Current Business, March 2013,
13‐39.
Economic Classification Policy Committee, “Issue Paper No. 1. Conceptual Issues,” Federal Register,
March 31, 1993.
Foster, Lucia S. and Cheryl Grim, “Characteristics of the Top R&D Performing Firms in the U.S.: Evidence
from the Survey Of Industrial R&D,” Center for Economic Studies Working Paper 10‐33, September 2010.
Jarmin, Ron S. and Javier Miranda. "The Longitudinal Business Database." Center for Economic Studies
Discussion Paper CES‐WP‐02‐17., 2002,
Klimek, Shawn and David Merrell, “On Reclassifying Industries from Standard Industrial Classification
System to the North American Industrial Classification System”, The Second International Conference on
Establishment Surveys Proceedings, June 2000.
Lichtenberg, F. and D. Siegel, “The Impact of R&D Investment on Productivity – New
Evidence Using R&D – LRD Data,” Economic Inquiry 29 (2), 1991, 203‐228.
Parker, Robert. “Restoring the Enterprise Statistics Program for the 2012 Economic Census.” 2012.
Office of Personnel Management, 2002 North American Industry Classification System (NAICS).
Ribarsky, Jennifer “Factoryless” Manufacturers: Classification and Implementation Challenges”, Paper
Prepared for the 32nd Conference on Income and Wealth, August, 2012, Boston, Massachusetts.
Shackelford, Brandon "Industry Classification of Companies in NSF R&D Surveys: Guiding Principles and
History." Unpublished paper to the National Science Foundation, Division of Science Resources Statistics.
Arlington, VA. May 28, 2008.
United Nations, Economic Commission for Europe, and Conference of European Statisticians, “Guide to
measuring global production,” Prepared by the Task Force on Global Production, 8 January, 2014.
U.S. Bureau of Economic Analysis (BEA), U.S. Direct Investment Abroad: 2009 Revised Benchmark Data
(Washington, DC: BEA, April 2013): M‐12‐M‐16.

16
Figure 1a: Year‐to‐year change in funds for R&D performance relative to 1972 by firms in
services‐producing industries, 1972‐2008
Source: SIRD data and authors’ own calculations. Arrow shows end of “freezing” of firms in manufacturing.
Figure 1b: Year‐to‐year change in funds for R&D performance relative to 1972 for firms in manufacturing industry group, 1972‐2008
Source: SIRD data and authors’ own calculations . Arrow shows wholesale trade adjustment.
05
10ye
ar-t
o-ye
ar c
hang
e
1972 1977 1982 1987 1992 1997 2002 2007Year
source: company & other funds source: federal funds
0.5
11.
52
2.5
year
-to-
year
cha
nge
1972 1977 1982 1987 1992 1997 2002 2007Year
source: company & other funds source: federal funds
17
Figure 1c: Year‐to‐year change in company and other funds R&D performance relative to 1972
by firms in the wholesale trade industry, 1972‐2008
Source: SIRD data and authors’ own calculations.
Figure 2a: Company and other funds for R&D performance by firms in manufacturing industries
Source: SIRD data and authors’ own calculations.
02
040
60
80ye
ar-t
o-ye
ar c
hang
e
1972 1977 1982 1987 1992 1997 2002 2007Year
050
100
150
billi
ons
of d
olla
rs
1976 1981 1986 1991 1996 2001 2006year
Services and trade adjusted payroll method (LBD-based)
unfreezing of firms
wholesale trade and service
adjustment
18
Figure 2b: Federal funds for R&D performance by firms in manufacturing industries
Source: SIRD and BRDIS. Authors’ own calculations.
Figure 3a: Company and other funds for R&D performance by firms in computer and electronic product manufacturing
Source: SIRD and BRDIS. Authors’ own calculations.
1015
2025
30
billi
ons
of d
olla
rs
1976 1981 1986 1991 1996 2001 2006year
Services and trade adjusted payroll method (LBD-based)

19
Figure 3b: Company and other funds for R&D performance by firms in chemical manufacturing
Source: SIRD and BRDIS. Authors’ own calculations.
Figure 3c: Company and other funds for R&D performance by firms in manufacturing industries except
computer and electronic product manufacturing and chemical manufacturing
Source: SIRD and BRDIS. Authors’ own calculations.
1020
3040
50bi
llio
ns o
f dol
lars
1985 1990 1995 2000 2005 2010Year
Services and trade adjusted payroll method (LBD-based)
2030
4050
60bi
llio
ns o
f dol
lars
1985 1990 1995 2000 2005 2010Year
Services and trade adjusted payroll method (LBD-based)

20
Figure 4: Manufacturing industries’ share of R&D expenditures, 1985‐2007
Source: SIRD and BRDIS. Authors’ own calculations. Note: LBD‐based payroll is the “payroll method (LBD‐based)” in the other figures.
5060
7080
9010
0
1985 1990 1995 2000 2005Year
services and trade adjusted NSF published
NAICS 5417,55,42 industry group adjusted LBD-based payroll

21
Table 2a: The Impact of Service and Trade Adjustment on Firms in Services and Trade Industries
Number of firmsNonfederal R&D expenditures
(billions of dollars)Number of firms Nonfederal R&D expenditures
1986 196 7.6 51% 89%
1987 202 8.0 48% 88%
1988 197 4.5 50% 81%
1989 181 9.4 47% 89%
1990 182 10.0 46% 88%
1991 185 9.9 39% 85%
1992 371 19.8 35% 51%
1993 482 17.3 35% 61%
1994 372 12.9 37% 67%
1995 428 14.2 27% 62%
1996 489 17.9 18% 62%
1997 498 24.9 16% 63%
1998 386 26.3 16% 47%
1999 488 26.5 13% 60%
2000 528 41.9 17% 56%
2001 548 30.4 16% 54%
2002 734 44.5 22% 70%
2003 989 50.0 18% 68%
2004 1154 53.1 19% 64%
2005 1501 59.8 16% 64%
2006 1510 57.1 15% 62%
2007 1461 66.9 16% 56%
2008 1337 53.3 15% 56%
Average
1985‐2008627 29.0 28% 67%
Payroll method (LBD‐based) Percent moved to manufacturing industries
Source: Survey of Industry R&D and Bus iness R&D and Innovation Survey. Authors ' own ca lculations .
Year

22
Table 2b: Reassignment of Firms and Nonfederal R&D Expenditures for Services and Trade Industries to Manufacturing Industries
Number
of firms
R&D expenditures
(billions of dollars)
Share of
firms
Share of R&D
expenditures
Share of
firms
Share of R&D
expenditures
Share of
firms
Share of R&D
expenditures
1986 99 6.8 29% 90% 14% 5% 57% 5%
1987 97 7.0 24% 89% 12% 5% 64% 6%
1988 99 3.6 26% 81% 14% 11% 60% 8%
1989 85 8.4 29% 94% 14% 2% 56% 4%
1990 83 8.8 25% 90% 14% 6% 60% 4%
1991 72 8.4 24% 90% 15% 7% 61% 4%
1992 131 10.0 28% 78% 17% 9% 55% 13%
1993 171 10.6 25% 80% 20% 17% 56% 3%
1994 137 8.7 30% 85% 18% 9% 52% 6%
1995 117 8.8 30% 84% 16% 8% 54% 8%
1996 89 11.1 34% 77% 24% 17% 43% 6%
1997 82 15.7 33% 75% 32% 22% 35% 3%
1998 63 12.5 37% 84% 27% 13% 37% 3%
1999 63 15.8 35% 66% 30% 20% 35% 14%
2000 90 23.3 39% 72% 30% 24% 31% 4%
2001 88 16.4 32% 45% 33% 46% 35% 8%
2002 164 31.4 29% 62% 25% 29% 46% 9%
2003 181 33.8 28% 57% 26% 36% 46% 7%
2004 220 34.0 28% 57% 25% 39% 47% 4%
2005 244 38.5 26% 59% 26% 37% 48% 4%
2006 230 35.2 24% 65% 27% 30% 49% 5%
2007 240 37.7 22% 48% 29% 43% 49% 8%
2008 207 29.8 19% 35% 28% 54% 54% 11%
Average
1986‐2008133 18.1 29% 72% 22% 21% 49% 6%
Year
Source : Survey of Industry R&D and Bus iness R&D and Innovation Survey. Authors ' own ca lculations .
Computer and electronic
product manufacturing Chemical manufacturing Other manufacturingAll manufacturing industries

23
Table 3: Number of Firms and R&D Expenditures by Alternative Methodologies, 2008
Note: The more‐targeted adjustment was made to firms assigned to wholesale trade, scientific research and development and related services, and management of companies and enterprises. The broad‐based adjustment is the same as our services‐and‐trade adjustment. The line of business‐based is based on the line of business information reported by firms in the BRDIS.
Firms R&D share Firms R&D share Firms R&D share
All industries 8830 100.0% 8830 100.0% 8830 100.0%
Food and beverage; textile and
textile product mills; apparel,
leather, and all ied product ; Wood
product; paper; printing and related
support activities; petroleum and
coal products
822 3.4% 860 4.1% 785 3.0%
Chemical product 729 19.1% 750 19.5% 934 24.8%
Plastic and rubber products;
nonmetall ic mineral product;
Primary metal; fabricated metal
product
1852 7.0% 1915 7.8% 1926 7.2%
Computer and electronic product 966 16.9% 1001 22.3% 1130 22.9%
Electrical equipment, appliance, and
component; transportation
equipment; Machinery; furniture and
related product; miscellaneous
1360 12.9% 1384 13.3% 1599 11.6%
Nonmanufacturing 3101 40.7% 2920 33.0% 2456 30.5%
Targeted AdjustmentBroad‐based
Adjustment Line of Business‐Based
Source : Survey of Industry R&D. Authors ' own ca lculations .
Industry group

24
Table 4a: Selected Firms Industry Classification in 2002 and in 2007
Industry classification in 2002
Industry groupSame industry
as in 2002Trade Services Management
Other goods‐
producing
industries
All manufacturing firms 180882 442 242 293 599
Food and beverage; textile and
textile product mills; apparel,
leather, and all ied product
24282 100 40 54 49
Wood product; paper; printing
and related support activities;
petroleum and coal products
33079 48 35 29 47
Chemical product 5337 38 18 46 46
Plastic and rubber products;
nonmetall ic mineral product14016 54 20 26 82
Computer and electronic product 7606 46 35 28 50
Electrical equipment, appliance,
and component; transportation
equipment
9205 24 27 21 68
Primary metal; fabricated metal
product; machinery; furniture and
related product; miscellaneous
87357 132 132 89 257
Industry classification in 2007
Source : Longi tudina l Bus iness Database. Authors ' own ca lculations .
25
Table 4b: Percent Increase in Payroll by Industry for Selected Firms in Manufacturing from 2002 to
2007
Industry classification in 2002
Industry group Trade Services Management
Trade, Services,
and Management
Combined
All manufacturing firms 11% 20% 28% 59%
Food and beverage; textile and
texti le product mills; apparel,
leather, and allied product
28% 21% 49% 98%
Wood product; paper; printing
and related support activities;
petroleum and coal products
6% 1% 40% 47%
Chemical product 18% 10% 61% 90%
Plastic and rubber products;
nonmetall ic mineral product13% 5% 18% 36%
Computer and electronic product 12% 41% 18% 70%
Electrical equipment, appliance,
and component; transportation
equipment
7% 47% 14% 69%
Primary metal; fabricated metal
product; machinery; furniture and
related product; miscellaneous
10% 6% 20% 34%
Industry classification in 2007
Source : Longitudina l Bus iness Database. Authors ' own ca lculations .