the role of inferential accuracy in performance rating
TRANSCRIPT

Old Dominion UniversityODU Digital CommonsTheses and Dissertations in Urban Services - UrbanManagement College of Business (Strome)
Spring 2005
The Role of Inferential Accuracy in PerformanceRating Accuracy: A Field Study of TeacherPerformance AppraisalCynthia L. CooperOld Dominion University
Follow this and additional works at: https://digitalcommons.odu.edu/urbanservices_management_etds
Part of the Business Administration, Management, and Operations Commons, EducationalAssessment, Evaluation, and Research Commons, and the Industrial and Organizational PsychologyCommons
This Dissertation is brought to you for free and open access by the College of Business (Strome) at ODU Digital Commons. It has been accepted forinclusion in Theses and Dissertations in Urban Services - Urban Management by an authorized administrator of ODU Digital Commons. For moreinformation, please contact [email protected].
Recommended CitationCooper, Cynthia L.. "The Role of Inferential Accuracy in Performance Rating Accuracy: A Field Study of Teacher PerformanceAppraisal" (2005). Doctor of Philosophy (PhD), dissertation, , Old Dominion University, DOI: 10.25777/fzav-9v89https://digitalcommons.odu.edu/urbanservices_management_etds/11
THE ROLE OF INFERENTIAL ACCURACY
IN PERFORMANCE RATING ACCURACY:
A FIELD STUDY OF TEACHER PERFORMANCE APPRAISAL
by
Cynthia L. Cooper B.A. May 1989, University of Virginia
M. Ed. December 1994, College of William and Mary
Dissertation submitted to the Faculty of Old Dominion University in Partial Fulfillment of the
Requirements for the Degree of
DOCTOR OF PHILOSOPHY
URBAN SERVICES/ MANAGEMENT
OLD DOMINION UNIVERSITY May 2005
Approved by:
ABSTRACT
THE ROLE OF INFERENTIAL ACCURACY IN PERFORMANCE RATING ACCURACY:
A HELD STUDY OF TEACHER PERFORMANCE APPRAISAL
Cynthia L. Cooper Old Dominion University, 2005 Director: Dr. William Leavitt
This study first assessed the accuracy of performance appraisal ratings of high
school teachers in comparison to the achievement of their students as measured by
Virginia's Standard of Learning (SOL) tests. The overall performance rating scores of
145 teachers were compared to the pass rates of their students on SOL end-of-course
tests. The rating sub-scores in each of four domains of performance were also compared
to the SOL pass rates.
The study then tested the influence of Inferential Accuracy, a model proposed by
Jackson (1972), on rating accuracy overall and of individual raters in the study.
Inferential Accuracy is comprised of both sensitivity to rating norms and standards and
threshold to infer consistent patterns of behavior from limited samples of that behavior.
The findings of the study indicated a statistically significant, though weak,
correlation between performance appraisal ratings and student achievement as measured
by SOL pass rates. The study found little support for the application of the Inferential
Accuracy model to performance appraisal accuracy as it was posited originally. There
was some empirical support for the influence of one component of the model, threshold,
on rating accuracy when the researcher controlled for other factors such as rater
motivation, time constraints, et al.
iii
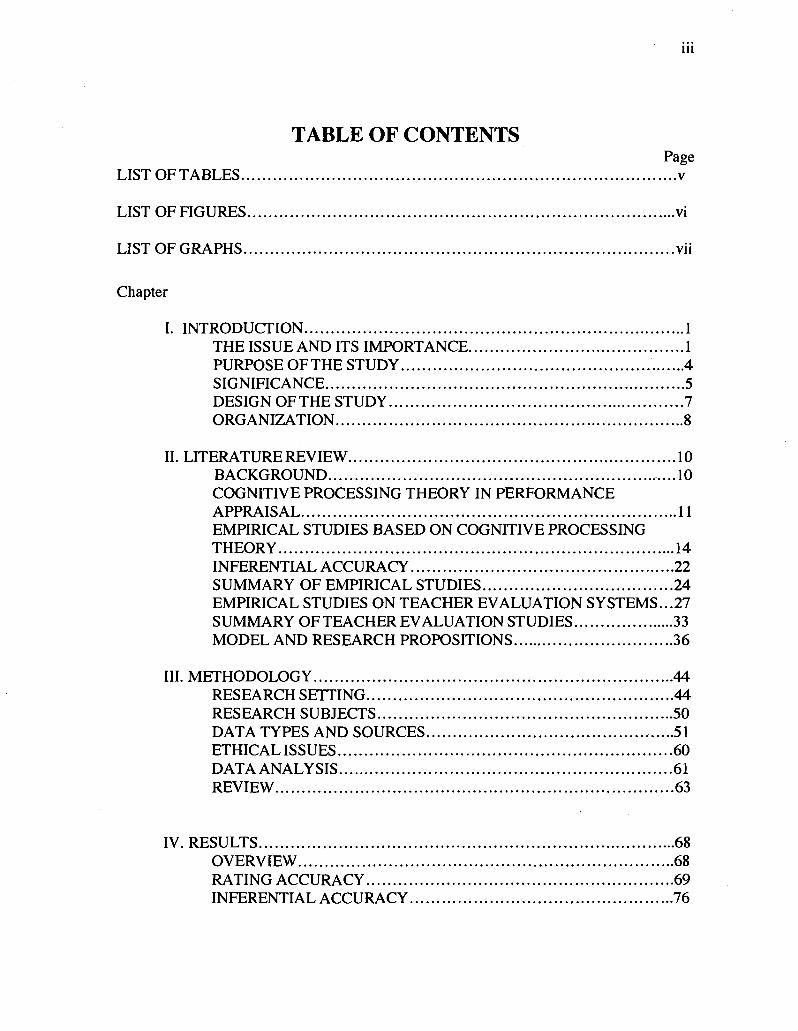
TABLE OF CONTENTS Page
LISTOFTABLES v
LIST OF FIGURES vi
LIST OF GRAPHS vii
Chapter
I. INTRODUCTION 1 THE ISSUE AND ITS IMPORTANCE 1 PURPOSE OF THE STUDY 4 SIGNIFICANCE . 5 DESIGN OF THE STUDY 7 ORGANIZATION 8
II. LITERATURE REVIEW 10 BACKGROUND 10 COGNITIVE PROCESSING THEORY IN PERFORMANCE APPRAISAL 11 EMPIRICAL STUDIES BASED ON COGNITIVE PROCESSING THEORY 14 INFERENTIAL ACCURACY 22 SUMMARY OF EMPIRICAL STUDIES 24 EMPIRICAL STUDIES ON TEACHER EVALUATION SYSTEMS...27 SUMMARY OF TEACHER EVALUATION STUDIES 33 MODEL AND RESEARCH PROPOSITIONS 36
III. METHODOLOGY 44 RESEARCH SETTING 44 RESEARCH SUBJECTS 50 DATA TYPES AND SOURCES 51 ETHICAL ISSUES 60 DATA ANALYSIS 61 REVIEW 63
IV. RESULTS 68 OVERVIEW 68 RATING ACCURACY 69 INFERENTIAL ACCURACY 76

iv
V. CONCLUSIONS AND RECOMMMENDATIONS 84 OVERVIEW 84 RELATION OF FINDINGS TO OTHER STUDIES 85 STATISTICAL VERSUS PRACTICAL SIGNIFICANCE 86 LIMITATIONS OF STUDY 92 STRENGTH OF THE INFERENTIAL ACCURACY MODEL 95 OTHER FACTORS INFLUENCING RATING ACCURACY 97 RECOMMENDATIONS FOR FUTURE RESEARCH 103
BIBLIOGRAPHY 107
APPENDICES A. HCS PERFORMANCE EVALUATION DOCUMENT 111 B. RATER INTERVIEW AND DATA COLLECTION INSTRUMENT 123 C. LIST OF AGGREGATE MEASURES 136
VITA 137
V
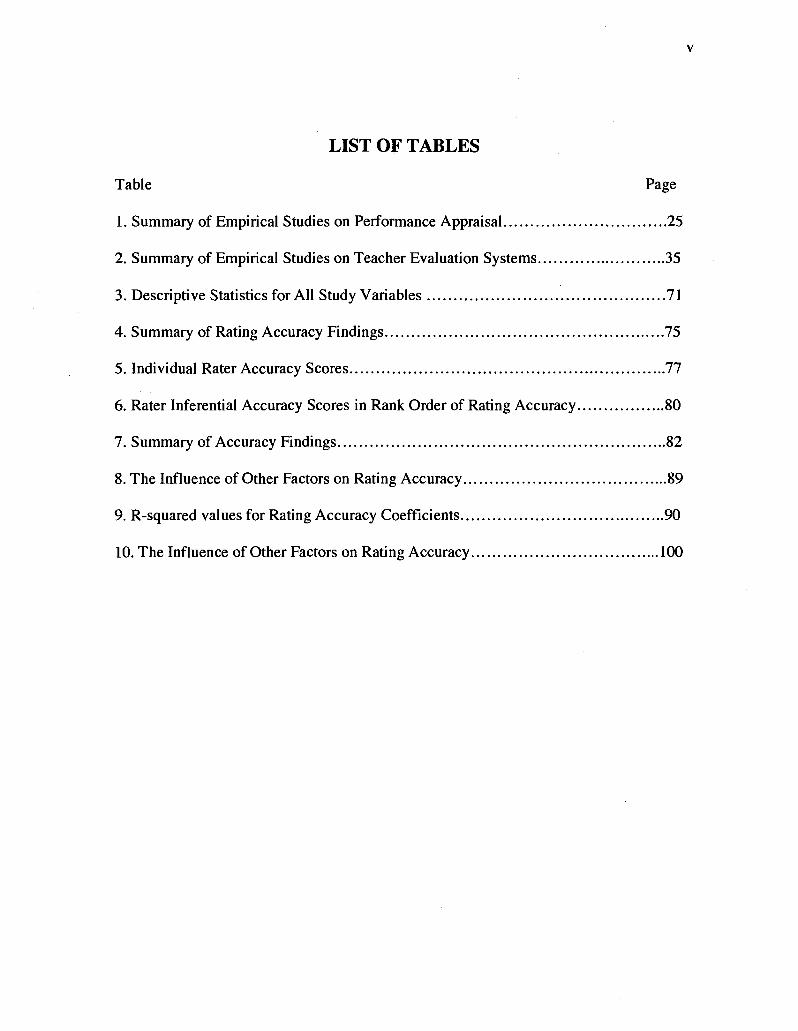
LIST OF TABLES
Table Page
1. Summary of Empirical Studies on Performance Appraisal 25
2. Summary of Empirical Studies on Teacher Evaluation Systems 35
3. Descriptive Statistics for All Study Variables 71
4. Summary of Rating Accuracy Findings 75
5. Individual Rater Accuracy Scores 77
6. Rater Inferential Accuracy Scores in Rank Order of Rating Accuracy 80
7. Summary of Accuracy Findings 82
8. The Influence of Other Factors on Rating Accuracy 89
9. R-squared values for Rating Accuracy Coefficients 90
10. The Influence of Other Factors on Rating Accuracy 100

vi
LIST OF FIGURES
Figure Page
1: Synthesis of Cognitive Processing Theories 14
2: Summary of Actions to Improve Performance Appraisal Accuracy 39
3: Relationship between Inferential Accuracy and Rating Accuracy 41
4: Revised Model of Influences on Rating Accuracy 106

vii
LIST OF GRAPHS
Graph Page
1: Frequency of Rating Total Scores 70
2: Percentage of Teachers in Each Pass Rate Category 74
3: Scatter-plot of Overall Ratings x SOL Pass Rates 88

1
CHAPTER I
INTRODUCTION
THE ISSUE AND ITS IMPORTANCE
Since the 1983 publication of "A Nation at Risk" public schools and public
educators have been under the gun. There is a significant concern that American students
are falling short of the mark in comparison with students from other countries. James V.
Koch, in a recent article, states "Since 1960, the scores of 17-year-old students on the
National Assessment of Educational Progress have increased only slightly in mathematics
and reading and have declined substantially in science. The achievement of U.S. students
in mathematics ranked 19th among 21 countries in the 12th grade" (Koch, 2003). In the
competition of a global economy, it is crucial that American students achieve so the
country remains economically viable. Both the public and the legislature have begun
holding schools accountable for the amount and quality of learning that takes place
within their classrooms.
Accountability in public education both at the state and national levels has come
to rest on student pass rates on standardized tests. Forty-eight states now administer a
statewide testing program of public school students and are using the scores in
accountability systems for schools (Littleton, 2000). In the state of Virginia, the tests
used are criterion-referenced standards of learning (SOL) tests. Using these measures,
the state Board of Education gives accreditation ratings to schools and school divisions.
Schools failing to meet accreditation standards must submit a corrective action plan to the

2
Virginia Department of Education (VDOE) and be subject to ongoing academic review
by visiting VDOE review teams. Repeated failures to meet state standards could mean a
forfeiture of school management to the VDOE entirely.
The United States Board of Education also uses SOL test results to rate schools
and divisions on their progress toward meeting the requirements of the "No Child Left
Behind" act (NCLB). Schools failing to make adequate yearly progress toward meeting
standards face sanctions. In the first year, there is simply a warning. In subsequent
years, however, parents of youngsters in the schools with inadequate progress must be
offered the choice of moving their children to other, better performing schools in the
division with transportation provided. The school division may also be required to pay
for compensatory services such as after school tutoring at a learning institution of the
parents' choice. The performance of students on the SOL tests, then, has become a "high
stakes" issue for schools and school divisions as a whole. In essence, this has become the
measure of educational effectiveness.
When educational researchers control for factors such as socio-economic status
and education level of students' parents, the influence of the classroom teacher is the
most significant variable which affects student achievement. (Brophy and Good, 1986;
Marzano, Pickering and Pollock, 2001; Rivkin cited in Rice, 2003, Hanushek and Kain,
1998 cited in Rice, 2003; Sanders and Rivers, 1996 cited in Rice, 2003; Sanders 1998
cited in Rice, 2003). Since school districts cannot control the demographic influences,
which may dampen student achievement, it is critical that they be able to assess the
effectiveness of their teachers who are ultimately accountable for student performance on
the SOL tests.

3
Accountability in any work setting, including public education, is commonly
measured by performance-appraisal systems. These systems are designed to measure
employee effectiveness at tasks required by the job. There is much research on possible
bias introduced to the process by both the performance appraisal system and/or the raters
doing the appraisal (DeNisi, Cafferty and Meglino, 1984; Motowidlo, 1986; Murphy and
Cleveland, 1991; Sulsky and Day, 1992). With this in mind, systems are built carefully
to eliminate or at least reduce possible biases and subjective ratings yielded by the system
are tested for accuracy whenever possible using objective data as independent measures
of effectiveness.
Like systems in other work settings, performance appraisal systems in many
public school divisions are also being changed in an attempt to eliminate bias and yield
accurate ratings of teacher effectiveness (Stronge and Tucker, 2002). Unfortunately,
teacher performance appraisal systems have rarely been tested for accuracy using any
objective data on outputs. The scant literature assessing the accuracy of teacher
performance appraisal systems suggests that ratings produced by current practice are not
correlated with student achievement, the output required in educational accountability
measures (Cook and Richards, 1992; Peterson, 2000; Purser et al., 1990). In addition, in
those few studies that do note a lack of accuracy in ratings, there is no investigation of the
causes for the lack of accuracy and, hence, no model developed to improve teacher
performance appraisal systems.
The absence of standardized measures of student performance used in every
classroom in every school has led to a lack of investigation into the relationship between
subjective and objective measures. As stated in a recent commentary in the Virginian-
4
Pilot, "Now, thanks to the wealth of student achievement data created by the federal No
Child Left Behind law and state tests such as Virginia's SOLs... teachers can finally be
evaluated... on whether their students learn" (February 29, 2004, J4). Given that SOL
Pass Rates are being used as an objective measure of teaching effectiveness, the critical
and untested issue is whether the subjective measures produced by teacher performance
appraisal systems reflect reality.
PURPOSE OF THE STUDY
The purpose of this study is twofold. The first purpose is to examine directly the
relationship between subjective teacher performance appraisal ratings and an objective
measure of effectiveness, i.e., the "accuracy" of the ratings in terms of student
achievement on SOL tests. The definition of accuracy here is drawn from Sulsky and
Balzer (1988) who state that "Accuracy of measurement is a term used to describe both
the strength and kind of relation between one set of measures and a corresponding set of
measures (e.g. true scores) considered to be an accepted standard for comparison"
(p.497). Rather than using a set of "true scores" derived from the use of expert ratings as
the corresponding set of measures, this study uses the objective performance measure of
student pass rates on SOL tests. Sulsky and Balzar note that, despite the many
procedures for obtaining "true scores", any and/or all of them may produce inadequate
measures of performance for comparison to the initial set of measures, thus building a
case for the use of objective data as the comparison measure (1988).
The second purpose of the study is to examine the inferential accuracy of the
performance appraisal raters. Inferential accuracy refers to the raters' ability and/or

willingness to make evaluative judgements about performance based on limited
information about or observation of behavior (Nathan and Alexander, 1985). The model
for inferential accuracy was developed by Jackson (1972) and applied to performance
appraisal by Nathan and Alexander (1985). This study will examine the extent to which
the inferential accuracy of raters is influenced by factors present within the organizational
context of the evaluation process and how the subjective ratings of teachers are affected.
The model developed in this study is based primarily on the cognitive processing
theory proposed by DeNisi, Cafferty and Meglino (1984) and enhanced by Motowidlo's
information processing theory (1986). These theories delineate the stages of processing
used by raters in the course of making subjective performance appraisal ratings and the
sources of bias, which can be introduced to the process at each stage. As a result of this
research and the empirical studies done subsequently, performance appraisal systems
have been modified over the years in an attempt to reduce the opportunities for bias in
subjective ratings (Murphy and Cleveland, 1991). Teacher evaluation systems are no
exception. What is lacking in the research and attempts at bias reduction, however, is a
specific focus on the inferential accuracy of the rater in the process.
SIGNIFICANCE
This research has significance on both an academic and a pragmatic level. On the
academic level, it is important to extend our examination of the relationships between
subjective and objective measures of teacher performance, particularly standardized
measures. While there is much research establishing the inadequacies of current
measures of teacher performance (Peterson, 2000), there is limited research which

examines the accuracy of such measures using any form of student achievement data as a
corresponding measure. (Purser et al., 1990; Wilkerson, Manatt, Rogers and Maughan,
2000). Furthermore there is virtually no research which uses standardized student
achievement data that measures specific course content such as the SOL tests used in the
state of Virginia as a corresponding measure. Because SOL tests given at the end of
courses in Virginia's high schools measure the mastery of only the content of that course,
one can more easily associate the achievement of the students with the performance of a
particular teacher. The availability of this type of data provides a rich opportunity for an
examination of teacher performance appraisal systems to evaluate to what extent they
document the behaviors that actually lead to student achievement.
On a pragmatic level, there is a critical need for this research. School divisions
are being held accountable for student achievement and research indicates that teachers
have the most significant effect on that achievement (Brophy and Good, 1986; Marzano,
Pickering and Pollock, 2001; Rivkin, Hanushek and Kain, 1998 cited in Rice 2003;
Sanders 1998 cited in Rice 2003; Sanders and Rivers, 1996 cited in Rice 2003). While
the Virginian-Pilot commentary cited above suggests that SOL scores be used as a direct
measure of teacher effectiveness (2004), there are legal and ethical reasons why student
achievement data cannot take the place of other performance appraisal methods
(Furtwengler, 1987; Peterson, 2000; Redfield, 1987). Such being the case, it is
imperative that we measure the accuracy of the teacher performance appraisal ratings
yielded by current systems against the objective measures by which the state and national
boards of education are holding schools accountable for results. If the ratings yielded by
these current appraisal systems are not an accurate measure of teaching effectiveness,

7
school divisions need to know why so that they can improve evaluation methods
accordingly.
Given that rater inferential accuracy has a potential influence in any setting where
organizational constraints such as limited time, concern for morale, or a shortage of
employees may affect a rater's willingness or ability to render accurate evaluative
judgements about employees, this research may have broader applications to settings
other than public education. These constraints, present in public educational settings, may
be present in other organizations in the public sector and, thus, the research may be of
interest to human resource departments throughout the realm of public administration.
DESIGN OF THE STUDY
The examination of both the accuracy of ratings as measured by SOL Pass Rates
and the inferential accuracy of raters will be accomplished based on data from the
Hampton City Schools. Hampton City Schools is a moderately sized school division with
approximately 22,000 students located in the Tidewater region of Virginia. The city is
not faring well economically and the performance of its students is below the state
average in many areas. It has several schools under academic warning and several which
face sanctions under NCLB. The division has accomplished solid curricular alignment
with the SOL tests, has researched instructional strategies effective with its population
and is focused on instructional improvement.
Hampton City Schools is an excellent focus for this research for three primary
reasons. First, its teacher evaluation system is built with performance appraisal research
in mind. The performance appraisal training, instrument, data base, and process in use in
8
Hampton City Schools, by its structure, reduces greatly the opportunities for bias in
sampling, encoding and retrieval of performance information on teachers. Second, the
student scheduling software used in Hampton City Schools also makes it an excellent
research site. All students requesting a particular course in high schools are randomly
assigned to the available sections of the course without regard to race, gender, previous
learning, motivation or other factors, which could affect achievement. Finally, the
division disaggregates SOL performance data on many levels, making possible the
comparison of performance evaluation ratings of particular teachers and the SOL
performance of those teachers' students.
ORGANIZATION
This chapter has introduced the issue of accountability in public education and the
critical link between teacher performance appraisal measures and student achievement
data that it necessitates. The chapter has outlined the dual purposes of the study and the
significance of the research on both academic and pragmatic levels.
Chapter II provides a review of the literature relevant to the research, beginning
with the theoretical framework of cognitive processing in performance appraisal. The
review is extended to include empirical studies which explain the development of current
appraisal systems with the aim of improving accuracy of subjective ratings. The final area
of literature review focuses more narrowly on studies of teacher performance appraisal
systems. Of specific interest will be those studies, which examine the relationship
between performance appraisal ratings and measures of student achievement. Of
particular note is the scarcity of such studies. Based on the collective review of this

9
literature, a conceptual model for the study is developed and research propositions are
presented.
Chapter III presents the methodology used for the study. In this chapter is found
the design for the study, the research setting, the research subjects, data sources, and data
collection and analysis procedures.
Chapter IV contains the research findings of the study. The first section presents
the quantitative data and analysis of the rating accuracy of the subjective performance
appraisal ratings compared with objective measures of student performance. The second
section presents the qualitative analysis of rater inferential accuracy and its sources, along
with an analysis of its influence on the subjective ratings of teacher performance.
Chapter V offers a discussion of the research findings with recommendations for
application as well as future research.
10
CHAPTER II
LITERATURE REVIEW
BACKGROUND
The quality of the decisions made on the basis of performance appraisal ratings, to
hire, retain, promote, or terminate a given employee, relies on the accuracy of the ratings
generated by the appraisal process. Accuracy, then is the key issue. Virtually all
performance appraisal research has been conducted for the purpose of improving
accuracy. Early research focused primarily on instrumentation and its effects. The push
to improve the accuracy of ratings was undertaken through the creation and testing of
different data collection forms and rating scales. In addition to the "voluminous area of
research on the format of appraisal scales," (Murphy and Cleveland, 1991, p.6), another
research focus has been rater training, centered on observation and recording skills as
well as the interpretation of information for later evaluative judgements (Murphy and
Cleveland, 1991).
Underneath all facets of performance evaluation sits, perhaps, the most influential
factor of all—the cognitive processes of the person who is doing the appraisal. Cognitive
processing (also called information processing) refers to the intellectual steps that an
individual takes when dealing with any sort of information: gathering, encoding for
memory, and recall, both short and long-term. Accurate evaluation systems are designed
around these cognitive processes to minimize the possibility of bias, which can be
introduced at almost any step of the way.

11
COGNITIVE PROCESSING THEORY IN PERFORMANCE APPRAISAL
There are four major contributions to the theory of cognitive (or information)
processing as related to accurate performance appraisals. The first is offered by DeNisi,
Williams, and Meglino (1984). They maintain that there are four basic stages to the
cognitive process in performance evaluation. These are: the acquisition of information,
the encoding and storage of information, the retrieval of information, and the integration
of the information for evaluative purposes. There is the potential for error or bias to be
introduced at any or all of the four stages.
Motowidlo (1986) offers a second, and very similar model. His model is called
the information sampling approach. He posits the existence of a true domain of
behaviors for every employee. This is the sum of all the employee does, and all the
manners in which he works. Motowidlo calls the first stage of processing the sampling
process. Like DeNisi et al., he views this as the process of gathering information—either
by direct observation (formal or informal) or other data sources (production reports,
absentee records, etc.). After sampling, comes encoding for memory, then retrieval and
evaluative judgements. These three stages are virtually synonymous with the first model.
The most important contribution of Motowidlo's theory is the understanding that the rater
does not ever have the whole picture of behavior, only a sample, which she hopes to be
representative of the true domain.
Motowidlo also posits, as in the DiNisi model, that there is the possibility for
inaccuracy or bias at each stage. Furthermore, the effects can be cumulative from one
stage to the next. For example, if the rater selectively attends to more negative behaviors
at the sampling stage, the process is already skewed because the sample is not reflective

12
of the true domain. In encoding the information, he might only store the most vivid of
the images (which are often the most negative) and a single positive behavior. After
some delay, when he retrieves the information, the pool of information recalled is even
smaller and, perhaps, there are no positive images remembered. This would certainly
lead to a purely negative evaluation rating. The basic principle is that the final evaluative
judgement will only be accurate to the extent that each pool of information from sample,
through encoding to retrieval, resembles the true domain of the employee's behavior.
Two other authors in the field make major contributions to the total picture of
cognitive theory by adding information processing. The first is Feldman (1986) who
posited the influence of different processing modes in employee appraisal. Feldman
keeps the four basic components described in the model above, but adds the notion that
we process information in one of two ways— automatic or controlled as we go through
the appraisal procedure. Automatic processing occurs rapidly and without conscious
thought. Controlled processing, in contrast, is a mindful, step by step method of
evaluating information. It takes longer and requires effort. Feldman maintains that we
engage in these two types of processing as the result of the interaction between
information observed and the internal schema to which we link it. Schemata are
prototypes or frameworks of information we already have stored in our brains. When
new information is encountered, we simply encode it for memory based on the schema
into which it fits. If there is an easy fit, we process automatically. If the information
does not readily fit into a schema, however, we switch to controlled processing, doing a
methodical search of the schemata we possess or creating a new schema into which the
information must be placed.

13
The fourth theorist contributing to the total is Hammond. In a 1981 article, he
asserts that there is a cognitive continuum of tasks. At one end are analytic tasks. These
are more routine, with limited numbers of steps to go through, and a well-known
sequence to follow. Examples would be module assembly or bookkeeping. At the other
end of the spectrum are intuitive tasks. These are non-routine jobs, which present much
information simultaneously— all contributing to decision processes. Often, the tasks are
novel and there is no set sequential step by step method for their completion. Examples
of intuitive tasks are customer service management, or dispute arbitration. In the middle
of the continuum sit quasi-rational tasks. They involve both intuitive and analytic
functions and require both methods for completion. Feldman asserts that the type of task
as described by Hammond (analytic or intuitive) generally dictates the mode of
processing used in performance appraisals. Analytic tasks involve automatic processes
while intuitive tasks require more controlled processing.
The contributions of these four different theorists are combined to form a single
model. Figure 1 illustrates the relationship between the theories. (See Figure 1)
Hammond's theory (1981) introducing the cognitive continuum of tasks links with
Feldman's theory (1984) of processing method in that the type of task on the continuum
dictates the type of processing used. Motowidlo's theory of information processing
(1986) is linked with both Hammond and Feldman in that the true domain of employee
behaviors is dictated by job type—which then falls somewhere on the continuum which
then triggers the type of processing. The type of processing used affects the sample of
behaviors collected by raters, and raters' encoding of the behavior for memory. These
steps in the process come not only from Motowidlo (1986) but also DeNisi, Cafferty and

14
Meglino (1984). They suggest that a bias introduced in the sample may be compounded
at each subsequent step of processing all the way through evaluative judgement.
Figure 1: Synthesis of Cognitive Processing Theories
TASK ON COGNITIVE CONTINUUM Intuitive ^ a — M ^ . Quasi Analytic ^ , , - ^ Analytic
(Hammond, 1981)
PROCESSING Automatic or Controlled
I (Feldman, 1984) I (Motowidlo, 1986)
True Domain
of Employee Behaviors
- •
Input sample of behaviors
Sensory capture of behavior
Encoding for
memory
Storage
- •
Information retrieval for
use
Evaluative judgment
made
(DeNisi, Cafferty & Meglino, 1984)
EMPIRICAL STUDIES BASED ON COGNITIVE PROCESSING THEORY
Because the comprehensive model (Figure 1) suggests that bias to ratings can be
introduced at virtually any and all stages of the process and that the effects could be
cumulative, there have been numerous empirical studies to test for the presence, source
and effects of rater bias. These studies are reviewed here in an order that reflects their
point of reference on the model above or the concern for bias which they address.

15
Rating Task
The model suggests that the appraisal of intuitive tasks requires greater amounts
of controlled processing, so it is beneficial in performance appraisal systems to provide a
clear picture of job responsibilities and desired behaviors, referred to as prototypes, to
raters in advance. By doing so, raters can easily match observed behavior to an existing
schema of job performance, making jobs on the intuitive end of the cognitive continuum
more easily processed. Sulsky and Day (1992) referred to the prototypes us frames of
reference. In their study, one group of undergraduate student raters was introduced to
the proper prototypes for the job to be observed, while another received no "frame of
reference" training. The training of the experimental group allowed them to make quick
judgements using automatic processing and increased the accuracy of their evaluative
ratings. Of note, however, was their diminished capacity to recall the specific behaviors
that led to the rating (Sulsky and Day, 1992).
As Feldman suggests, the images of these prototypical behaviors fit easily into an
existing schema. The raters automatically processed an evaluative judgement accurately
and discarded the information about specific behaviors. The opposite is also true; where
raters observed behaviors atypical for the prototype, they had much greater recall of those
specific behaviors. The introduction of discrepant behaviors forced raters to switch to
controlled processing to make decisions about what the observed behaviors inferred
about performance (Ilgen, Barnes- Farrell, and McKellin, 1993).
Other factors also influence whether raters use automatic or controlled processing.
A 1990 study by Williams, Cafferty and DeNisi showed that the salience of the rating
task at the time of the observation affected processing. Raters who observed behavior

16
with the specific task of making an evaluation made automatic judgements about the
ratees rather than recalling specific behaviors.
Rater Observation and Recall
Motowidlo (1986) maintains that there is a true domain of employee behaviors
and the first step in making accurate appraisals of performance requires the observation
of a sample of behavior representative of the true domain and the encoding of those
behaviors for later recall and use. As sampling and encoding are the first steps in the
performance appraisal process, much research has been done to examine the possible
biases at these stages. Williams, Cafferty and DeNisi (1990) examined the effect of
organizational strategies for observing behavior. In an experimental design they trained
three groups of undergraduate students: one group was trained to organize observed
behavior according to task, one according to employee prototype, and the third group was
given no strategy at all. Although both the groups given an organizational strategy
performed better on rating and recall than the third group, the group given the task
orientation was more attendant to more of the actual behaviors present. Their research
suggests that observers trained in prototypes make an automatic evaluative judgement
then quit observing behaviors or quickly discard behaviors observed.
Williams, Cafferty and DeNisi (1990) also looked at the effects of salience of the
rating task on behavior recall. When observers were involved in other tasks rather than
being primed for the specific task of making an evaluative judgement, their recall of
specific behaviors was higher. They could then use these recalled behaviors later to
make accurate evaluative ratings. Kulik and Ambrose (1993) expanded this inquiry by

17
examining the effect of two different sources of data for raters to observe. One source
was objective data on computer printouts; the other was visually observed employee
behavior. They used an experimental design with four groups of business students. Each
of the four groups had different sets (positive or negative) of both the objective and the
visual data. The researchers wanted to see if the subjects attended to one type of data
more than the other type. They also looked at the processing methods of each of the four
groups. Their findings were interesting and combined the earlier thoughts about
processing with new findings about sampling. The subjects who observed positive visual
data first processed the rating faster, but were less accurate in recalling behaviors and
tended to ignore or fail to recall information discrepant from the first positive impression.
The introduction of negative visual data triggered slower processing with careful recall of
specific behaviors. The introduction of positive objective data did not trigger automatic
processing; objective data was weighted less in importance than visually observed
behavior, positive or negative.
The weighting of information received first in observation is called a primacy
effect. Its opposite, the weighting of information received last in observation is called a
recency effect. Hogarth and Einhorn (1992) examined the length and complexity of tasks
observed and the method of recording information from the observations. They found a
primacy effect for relatively short and simple task observations where recording of
information was done at the end of the observation; for short, but complex tasks, there
was a recency effect. When tasks were long and complicated, the effect was toward the
primacy of information.
18
Highhouse and Gallo (1997) expanded this study to examine the effects of
positive and negative information, and the order of its introduction on primacy and
recency effects. They found that the contrast of information (since all subjects saw a tape
of both a positive task performance and a negative task performance) had an effect
toward recency of information. That is, in a multi-observation task appraisal, raters
weighted the information they saw last (positive or negative) more heavily than what they
saw first, no matter what system of information recording was used. A contrary finding
is offered by Spychalski (1997) whose study showed a primacy effect for both positive
and negative information. Clearly, there is no definitive answer to the order of
information question, but there is overwhelming evidence that the order of information
does have an influence on accuracy.
Affect has been noted to have an influence on accuracy. Research has found that
elevated moods often lead to inflated ratings, while depression actually increases
accuracy. Similarly, rater confidence is inversely correlated to accuracy (Ilgen, Barnes-
Farrell, and Mckellin, 1993). A positive personal relationship between rater and
employee may also produce inflated results. Robbins and DeNisi (1994) posit that this
may not be an intentional action on the part of the rater to maintain a positive
relationship, but rather may be the result of the elevated affect of the rater when in the
company of the subject. They suggest that the rater may attend only to positive behaviors
and may ignore negative information, attributing poor performance to external influences.
Their hypotheses were supported in an experiment with business students shown taped
performances of their own professors taken the previous semester. A month prior to the
experiment, the quality of relationship between student and professors had been

19
measured. The researchers noted that the least information was gathered on the
professors the raters liked. The raters also weighted information that was affect-
consistent (i.e., more congruent with the nature of the relationship) more heavily
(Robbins and DeNisi, 1994).
As a result of these empirical studies there is strong evidence that automatic
processing without a capture of relevant behaviors could be a source of rating inaccuracy.
Once raters moved into a mode of evaluative judgement without stopping to record actual
behaviors, the recall of behavior was diminished or lost. The ratings produced could be
influenced by a host of factors: prototype, salience of the rating task, organizational
strategies, primacy of information, recency of information, personal relationships, and
even affect. One response was to move the focus of the appraisal process from the end
stage of evaluative judgement to the more accurate observation, memory and recall of
actual behavior. With more accurate attendance to and recording of actual behavior, the
evaluative decision-making process would be thus improved.
Recording Information for Encoding and Recall
DeNisi and Peters (1996) conducted a field study with managers in an actual work
setting to investigate the effects of different forms of information recording on accuracy
of recall of performance information. They trained supervisors in the use of structured
journal entry in several formats, one not organized, one organized by person, one
organized by task. They also had a control group, which did not keep any diary of
observations. They found that diary keeping decreased inflated ratings, increased recall,

and increased descriptive incidents. Organization of the diary had little main effect on
outcome (DeNisi and Peters, 1996).
Balzer (1986) tested the effect of initial impression on the accuracy of recorded
information in an experiment with university students. His study found that subjects
were more likely to record behavior that was in contrast to their initial impressions.
Other research studies he cited, however, confirmed both a contrast and confirmatory
effect for prior information, so that Balzer concluded, "initial impression is expected to
lead to a bias in recording behavioral incidents although the direction of the bias cannot
be specified a priori" (Balzer, 1986, p. 333). These studies point out that it is not only
the evaluative judgement stage of performance appraisal that is subject to bias, but also
sampling and accurate recording of observed behavior. Balzer notes that the use of
behavior diaries and other behavior scales has been helpful in reducing bias, but they
have neither eliminated nor controlled it. He notes that effects seen in experimental
studies may be even more pronounced in the field because of time delays in recording
behavior in an actual work setting.
Murphy, Philbin, and Adams (1989) tested the effects of rater purpose and time
delays in the accurate recording of behavioral information. They used undergraduate
students viewing tapes of behavior in an experimental design. As would be expected,
when raters had a sole purpose of observing behavior for performance appraisal, they
recognized and recorded critical behavior more accurately than raters who were
observing the behavior for other reasons. In addition, the researchers found that the
accuracy of the behavior recording deteriorated as time delays between observation and

21
recording increased. They noted that these effects were likely to be much more dramatic
in a field setting where time delays would be much greater.
Salvemini, Reilly and Smither (1993) conducted experimental studies on rater
motivation and its effect on accuracy with undergraduate students viewing tapes of work
performance. They found that the raters in their study who had incentives to produce
highly accurate ratings (in comparison to true scores already identified) were less apt to
assimilate knowledge of prior performance into current ratings. They were more likely to
attend to and accurately judge observed behavior according to scales provided. Those
raters who were not highly motivated to produce accurate ratings were, in fact, less
accurate in judging observed behavior. The researchers noted that results in the field
would be much harder to quantify and would likely be affected by the organizational
constraints of each setting.
Mero, Motowidlo, and Anna (2003) found that all stages of the rating process
were affected by motivation, specifically by the introduction of accountability to the
process. Having to justify performance ratings not only improved the accuracy of the
final evaluative judgements, but also the accuracy at each step of the process. The
researchers used university students who watched video-tapes of work performance. The
researchers not only compared the students' ratings with true scores rendered by expert
raters, but also judged the accuracy of attending to and recording behavior accurately.
They found that the accountability of having to justify their decisions made raters pay
closer attention to behavior and record more detailed account of that behavior. This, in
turn, positively affected the accuracy of ratings. Although the researchers contend that
their study should be generalizable to organizations, other literature suggests that there

are other constraints that may counteract the pressure for accountability, such things as a
desire to maintain employee morale, preserve relationships and avoid conflicts
(Hauenstein, 1992).
INFERENTIAL ACCURACY
Although many empirical studies gave recommendations on the improvement of
performance appraisal ratings, the ratings continue to be subject to bias at so many stages.
In the hopes of enhancing accuracy, many organizations began the use of Behaviorally
Anchored Rating Scales (BARS) in their performance appraisal systems. These scales
replaced numerical ratings or adjective descriptors with written examples of actual work
behaviors. Raters read a number of behavioral statements and then choose the one which
best describes the observed employee behavior (Murphy and Cleveland, 1991).
The idea of removing judgement from the process seems to follow logically from
the evidence of bias in judgements. When the rater must simply record information with
out making any evaluative judgement, the studies suggested that the behavior would be
more accurately recorded. Unfortunately, the introduction of processes to focus solely on
behavior, whether it is recorded in diary form or described in BARS, did not necessarily
improve accuracy accordingly.
Nathan and Alexander (1985) contend that the introduction of BARS and other
methods of focusing raters on behavior have been ineffective because, "how raters
process behavioral information may have far greater impact on the ratings made than do
the behaviors themselves" (p. 109). The authors contend that raters do not need to
observe or record behavior more clearly, they need to judge performance, based on that

23
behavior, more accurately. They assert that the inferential accuracy of raters dictates the
quality of their ratings. Inferential accuracy is a term developed by Jackson (1972) for
use in clinical psychology settings (Reed and Jackson, 1975) and is applied to
performance appraisal by Nathan and Alexander. It is defined as "the ability, given
limited information about a target person, to judge other pertinent characteristics about
that person correctly and to identify behavioral exemplars as part of behavioral
consistencies (Nathan and Alexander 1985, p. 110).
Put simply, inferential accuracy exists when the rater can look at a small sample
of employee behaviors and correctly infer the whole domain of employee behaviors in
the context of performance, and the rater judges that performance correctly according to
an appropriate standard. These two components are referred to as Sensitivity (regarding
rating norms and levels of performance), and Threshold, which is the willingness to infer
a judgement about behavior overall based on a small sample of behavior.
Inferential accuracy is especially helpful for understanding the failure of BARS to
produce more accurate ratings. Nathan and Alexander note that raters must not only be
sensitive to particular levels of performance but also must have a low enough Threshold
to infer higher or lower levels of performance. This is not common as most ratings show
a central tendency error. In addition, the Threshold to infer higher or lower levels of
performance can be affected by organizational constraints such as employee shortages or
shortage of funding for merit raises. Rater Threshold can also be affected by rater
disposition or other concerns such as employee morale or the rater's relationship with the
employee (Nathan and Alexander, 1985).

24
SUMMARY OF EMPIRICAL STUDIES
See Table 1 for a summary of empirical studies reported above. All but one of the
empirical studies reviewed thus far (DeNisi and Peters, 1996) examined rating accuracy
by comparing subject rater's scores to a set of true scores derived by expert raters.
Sulsky and Balzer, in a 1988 article, cite concerns about the practice of establishing "true
scores" as measures of accuracy. They maintain that "expert raters" cannot be classified
as such unless they are trained in a comprehensive manner in all aspects of rating from
organizational goals, job responsibilities and prototype, BARS, proper data collection,
etc. Most of these "expert raters" are the very individuals from actual work settings
whose ratings have been criticized for years as inaccurate! In addition, the true scores are
derived by taking the average of all the experts' scores, which masks any dissenting
opinions. Sulsky and Balzer (1988) maintain that, despite the method used, "each
procedure may produce inadequate measures of performance true scores" (p. 503) and
thus the use of objective measures as comparison data is an important issue to pursue.
Also lacking in these empirical studies are studies about the accuracy of ratings
made by working supervisors in field settings. DeNisi and Peters noted the difficulties of
conducting such studies in remarking on the limitations of their own. Because there
aren't any "true scores" in a field setting, no readily available second set of measures for
comparison, they had to limit their study to examining the levels of performance
information recall and the level of rating elevation (1996). The identification of objective
measures of employee effectiveness for use in testing the accuracy of performance
appraisal ratings in the field is a critical next step.

25
Field studies themselves are particularly crucial in light of the inferential accuracy
model presented by Nathan and Alexander (1985). Because rater Threshold (to infer
particular levels of performance) is affected by organizational constraints and concerns
about employee relationships or morale, it is unlikely to be a factor in clinical
experiments lacking such constraints or relationships. The only effective way to
document the influence of Threshold, then, is to conduct studies of performance appraisal
rating accuracy in actual work settings where these concerns are relevant.
Table 1: Summary of Empirical Studies on Performance Appraisal
Author(s) Sulsky and Day
Ilgen, Baraes-Farrell and McKellin Williams, Cafferty and DeNisi Williams, Cafferty and DeNisi
Kulik and Ambrose
Hogarth and Einhorn
Year 1992
1993
1990
1990
1993
1992
Topic of study Effect of frame of reference or prototype training for raters on rating accuracy
Effect of discrepant behaviors on processing
Effect of salience of rating task on processing
Effect of strategies of information organization on rating accuracy
Effects of different types of information (positive/ negative and visual or printed computer data) on ratings
Effects of primacy and recency based on task type and length
Findings Prototype training produced automatic processing and increased rating accuracy but decreased recall of behaviors Discrepant behaviors forced raters to switch to controlled processing to make ratings
Those who were assigned rating task as primary used automatic processing Those who organized information according to task recalled specific behaviors while those who organized it by prototype had accuracy ratings but decreased recall of behaviors Positive information led to automatic processing with raters ignoring discrepant information while negative information led to controlled processing with attendance to behavior Found both primacy and recency effects dependent on type of task and system for recording information

26
Highouse and Gallo
Spychalski
Ilgen, Barnes-Farrell and McKellin Robbins and DeNisi
DeNisi and Peters
Balzer
Murphy, Philbin and Adams
Salvemini, Reilly and Smither
Mero, Motowidlo and Anna
1997
1997
1993
1994
1996
1996
1989
1993
2003
Effects of primacy and recency based on type of information (positive or negative) Effects of primacy and recency based on type of information (positive or negative) Effect of affect on rating accuracy
Effect of positive relationship between rater and ratee in rating accuracy
Effect of organization of recorded information in diaries on behavior recall (Only field study reported) Effect of initial impressions on attending to and recording subsequent behavior Effects of stated purpose of observation and time delays in recording observed behavior
Effect of motivation on rating accuracy
Effects of accountability and motivation on rating accuracy
Found a recency effect for both positive and negative information
Found a primacy effect for both positive and negative information (contradicted Highouse and Gallo) Reported that positive affect led to inflated ratings while depression actually improved rating accuracy Found positive relationship produced inflated ratings, possibly related to improved affect. Found use of diaries increased recall of behaviors. No difference in recall based on the organization of the information No clear results; both confirmatory information and contrasting information was recorded Found if rating was the stated purpose of observation, recording of behaviors was more accurate. Time delays between observation and recording decreased the accuracy of recorded behavior Found that subjects motivated by monetary incentives produced more accurate ratings than those without incentives Found that subjects motivated by incentives produced more accurate ratings than those without incentives. Also found that subjects accountable to expert raters for accuracy produced more accurate results
27
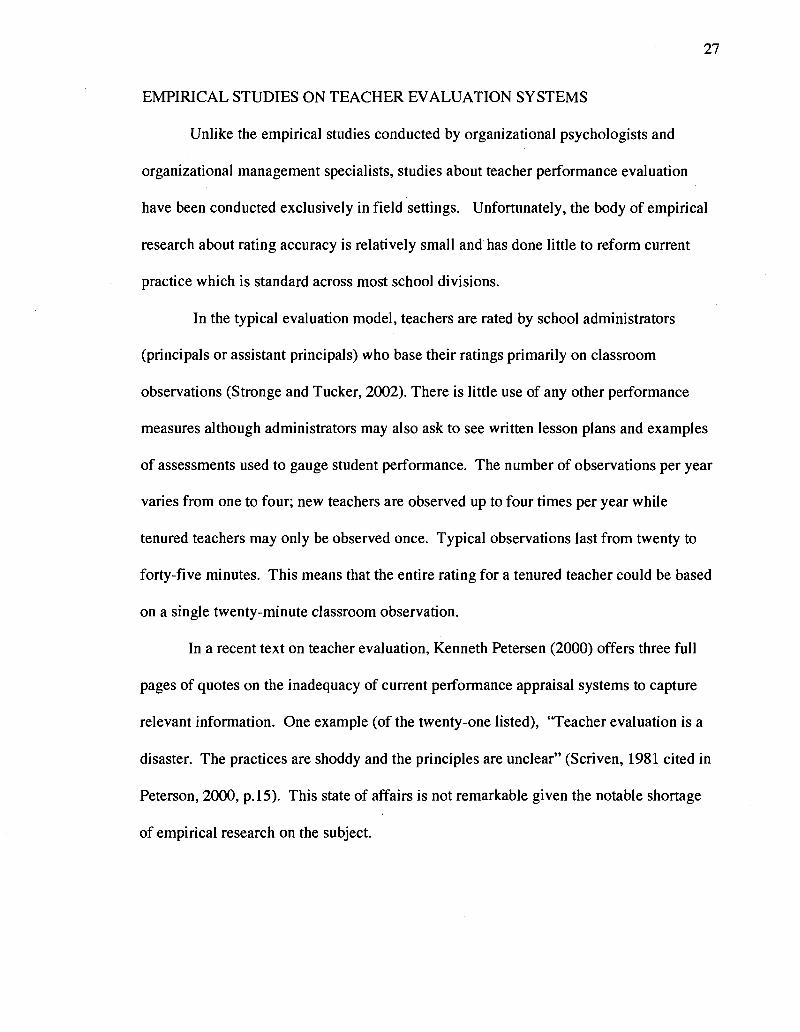
EMPIRICAL STUDIES ON TEACHER EVALUATION SYSTEMS
Unlike the empirical studies conducted by organizational psychologists and
organizational management specialists, studies about teacher performance evaluation
have been conducted exclusively in field settings. Unfortunately, the body of empirical
research about rating accuracy is relatively small and has done little to reform current
practice which is standard across most school divisions.
In the typical evaluation model, teachers are rated by school administrators
(principals or assistant principals) who base their ratings primarily on classroom
observations (Stronge and Tucker, 2002). There is little use of any other performance
measures although administrators may also ask to see written lesson plans and examples
of assessments used to gauge student performance. The number of observations per year
varies from one to four; new teachers are observed up to four times per year while
tenured teachers may only be observed once. Typical observations last from twenty to
forty-five minutes. This means that the entire rating for a tenured teacher could be based
on a single twenty-minute classroom observation.
In a recent text on teacher evaluation, Kenneth Petersen (2000) offers three full
pages of quotes on the inadequacy of current performance appraisal systems to capture
relevant information. One example (of the twenty-one listed), "Teacher evaluation is a
disaster. The practices are shoddy and the principles are unclear" (Scriven, 1981 cited in
Peterson, 2000, p. 15). This state of affairs is not remarkable given the notable shortage
of empirical research on the subject.

Principals' Appraisal Ratings compared with Students' and Parents Ratings
There are a very few studies, which investigate the correlation between principals'
ratings and other measures of effectiveness. A study by Cook and Richards (1972)
investigated the relationship between principals' ratings of teachers and ratings of
students and parents about the effectiveness of those teachers. They found that there was
virtually no correlation between administrator ratings of teachers and these other
measures of teacher effectiveness. Peterson reports similar findings from a study in
which administrator ratings were compared with teacher's self-ratings, student ratings,
and other data on teacher qualifications. The principals' ratings had virtually no
correlation with student or teacher ratings and actually had an inverse correlation with
teacher scores on knowledge tests and their professional development activities
(Peterson, 2000).
Principals' Appraisal Ratings compared with Measures of Student Growth
In the introduction to his study, Coker (1985) notes that, "relatively few attempts
have been made in the past to validate principals' judgement or ratings against measures
of teacher effectiveness based on achievement... of their students" (p.l). He summarized
the empirical studies up to that point (1985), which were nine total, the earliest dated
1935 and the latest dated 1959. In each of the nine studies, there was found to be no
significant positive correlation between principal ratings of teachers and measures of
educational growth in students. Citing a need for an investigation of current practice,
Coker's own study measured principal ratings against student academic gain.
29
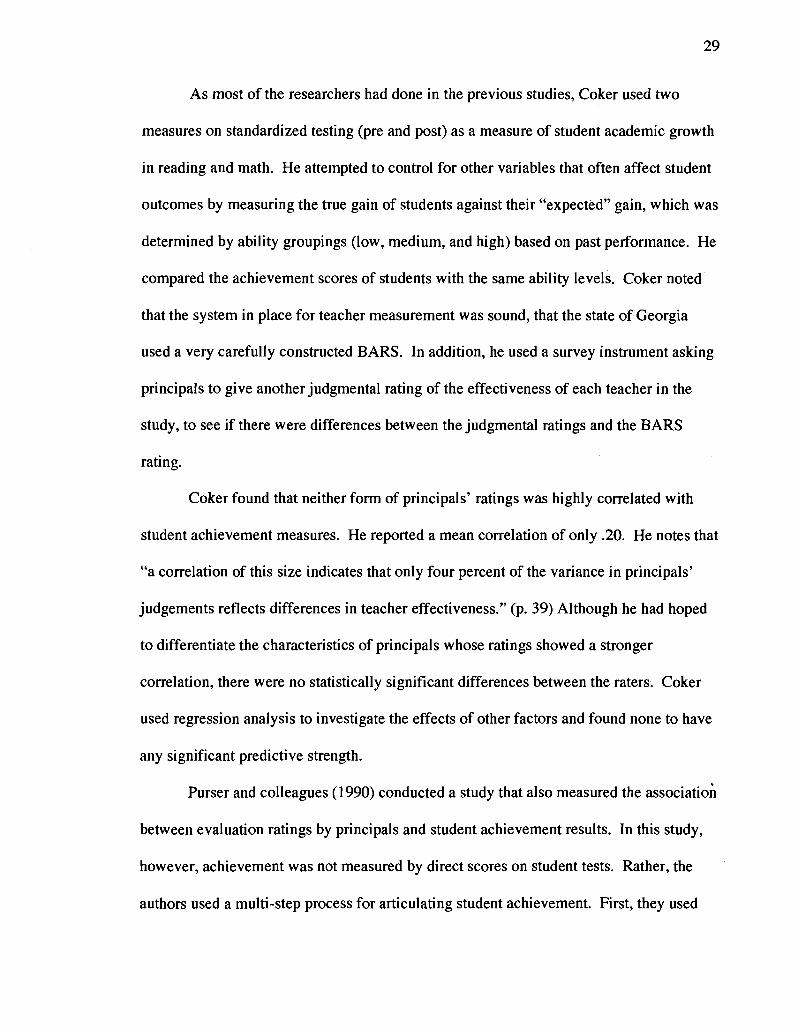
As most of the researchers had done in the previous studies, Coker used two
measures on standardized testing (pre and post) as a measure of student academic growth
in reading and math. He attempted to control for other variables that often affect student
outcomes by measuring the true gain of students against their "expected" gain, which was
determined by ability groupings (low, medium, and high) based on past performance. He
compared the achievement scores of students with the same ability levels. Coker noted
that the system in place for teacher measurement was sound, that the state of Georgia
used a very carefully constructed BARS. In addition, he used a survey instrument asking
principals to give another judgmental rating of the effectiveness of each teacher in the
study, to see if there were differences between the judgmental ratings and the BARS
rating.
Coker found that neither form of principals' ratings was highly correlated with
student achievement measures. He reported a mean correlation of only .20. He notes that
"a correlation of this size indicates that only four percent of the variance in principals'
judgements reflects differences in teacher effectiveness." (p. 39) Although he had hoped
to differentiate the characteristics of principals whose ratings showed a stronger
correlation, there were no statistically significant differences between the raters. Coker
used regression analysis to investigate the effects of other factors and found none to have
any significant predictive strength.
Purser and colleagues (1990) conducted a study that also measured the association
between evaluation ratings by principals and student achievement results. In this study,
however, achievement was not measured by direct scores on student tests. Rather, the
authors used a multi-step process for articulating student achievement. First, they used
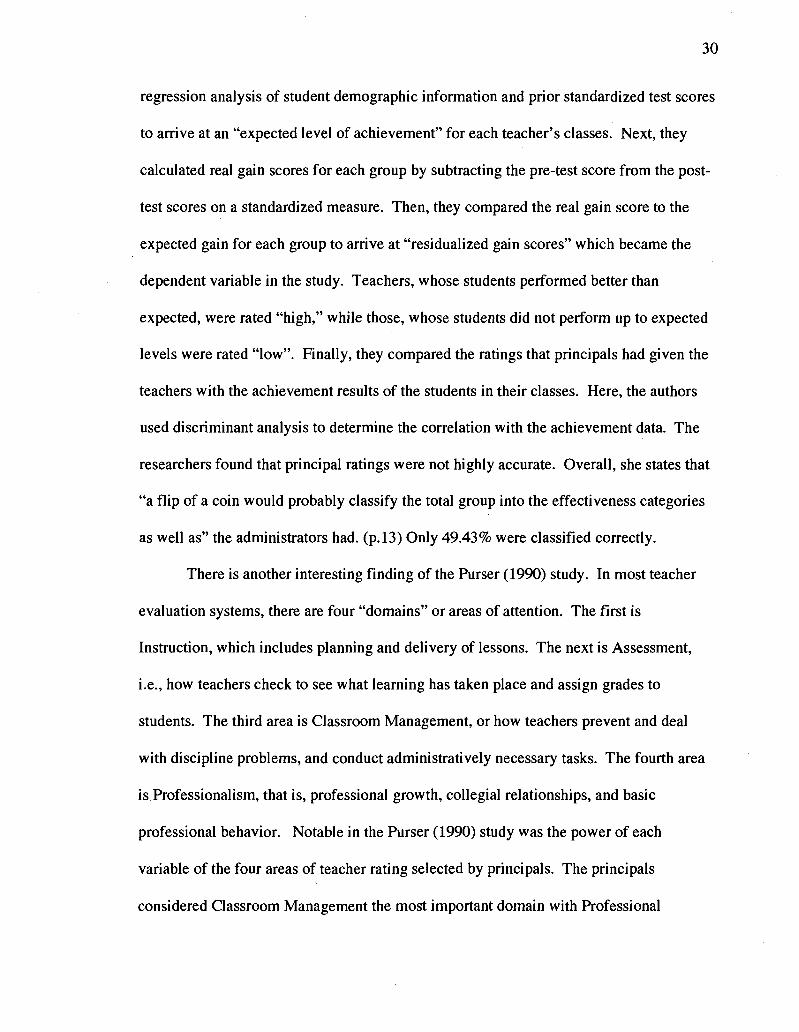
regression analysis of student demographic information and prior standardized test scores
to arrive at an "expected level of achievement" for each teacher's classes. Next, they
calculated real gain scores for each group by subtracting the pre-test score from the post-
test scores on a standardized measure. Then, they compared the real gain score to the
expected gain for each group to arrive at "residualized gain scores" which became the
dependent variable in the study. Teachers, whose students performed better than
expected, were rated "high," while those, whose students did not perform up to expected
levels were rated "low". Finally, they compared the ratings that principals had given the
teachers with the achievement results of the students in their classes. Here, the authors
used discriminant analysis to determine the correlation with the achievement data. The
researchers found that principal ratings were not highly accurate. Overall, she states that
"a flip of a coin would probably classify the total group into the effectiveness categories
as well as" the administrators had. (p. 13) Only 49.43% were classified correctly.
There is another interesting finding of the Purser (1990) study. In most teacher
evaluation systems, there are four "domains" or areas of attention. The first is
Instruction, which includes planning and delivery of lessons. The next is Assessment,
i.e., how teachers check to see what learning has taken place and assign grades to
students. The third area is Classroom Management, or how teachers prevent and deal
with discipline problems, and conduct administratively necessary tasks. The fourth area
is Professionalism, that is, professional growth, collegial relationships, and basic
professional behavior. Notable in the Purser (1990) study was the power of each
variable of the four areas of teacher rating selected by principals. The principals
considered Classroom Management the most important domain with Professional
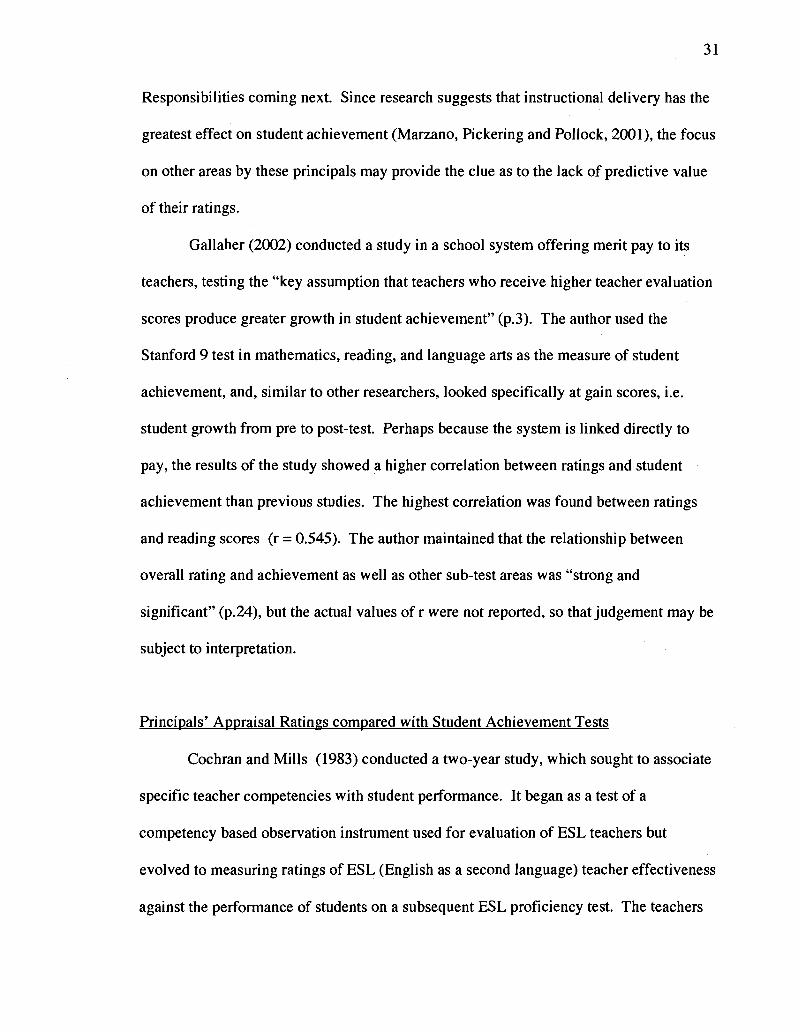
31
Responsibilities coming next. Since research suggests that instructional delivery has the
greatest effect on student achievement (Marzano, Pickering and Pollock, 2001), the focus
on other areas by these principals may provide the clue as to the lack of predictive value
of their ratings.
Gallaher (2002) conducted a study in a school system offering merit pay to its
teachers, testing the "key assumption that teachers who receive higher teacher evaluation
scores produce greater growth in student achievement" (p.3). The author used the
Stanford 9 test in mathematics, reading, and language arts as the measure of student
achievement, and, similar to other researchers, looked specifically at gain scores, i.e.
student growth from pre to post-test. Perhaps because the system is linked directly to
pay, the results of the study showed a higher correlation between ratings and student
achievement than previous studies. The highest correlation was found between ratings
and reading scores (r = 0.545). The author maintained that the relationship between
overall rating and achievement as well as other sub-test areas was "strong and
significant" (p.24), but the actual values of r were not reported, so that judgement may be
subject to interpretation.
Principals' Appraisal Ratings compared with Student Achievement Tests
Cochran and Mills (1983) conducted a two-year study, which sought to associate
specific teacher competencies with student performance. It began as a test of a
competency based observation instrument used for evaluation of ESL teachers but
evolved to measuring ratings of ESL (English as a second language) teacher effectiveness
against the performance of students on a subsequent ESL proficiency test. The teachers

in this study were rated on nine proficiencies: variety of teaching activities, dealing with
learning difficulties, classroom control, use of materials for instruction, opportunity for
student participation, teacher response to student opinions, development of student
initiative, social climate, and subject matter preparation. The researchers found that there
was no significant correlation between student scores and administrator ratings on any of
the competencies.
Wilkerson et al. (2000) report that student ratings of teachers and teachers' self
ratings show a much higher level of correlation with student achievement as measured by
standardized test scores than the ratings of principals. The authors noted that traditional
evaluations are, "ritualistic and largely a waste of time" (Wilkerson, Manatt, Rogers and
Maughan, 2000, p. 180). The surveys given to participants reportedly described teacher
behaviors which were shown by prior research to correspond to student achievement.
The areas addressed are similar to most rating systems: preparation for instruction,
instructional delivery, classroom environment (management) and post-instruction
responsibilities (assessment). To measure student achievement, they used standardized
district tests in reading, language, and math as well as the Stanford tests of the same
subjects. Student ratings showed a strong correlation with achievement measures in
reading and math (r = 0.75 and 0.67 respectively). Teachers' self-ratings also showed a
strong correlation with achievement in math (r = 0.67), but only slight in reading (r =
0.21). The principals' survey ratings showed the lowest levels of correlation: r = 0.17 in
math and r = 0.09 in reading.
33
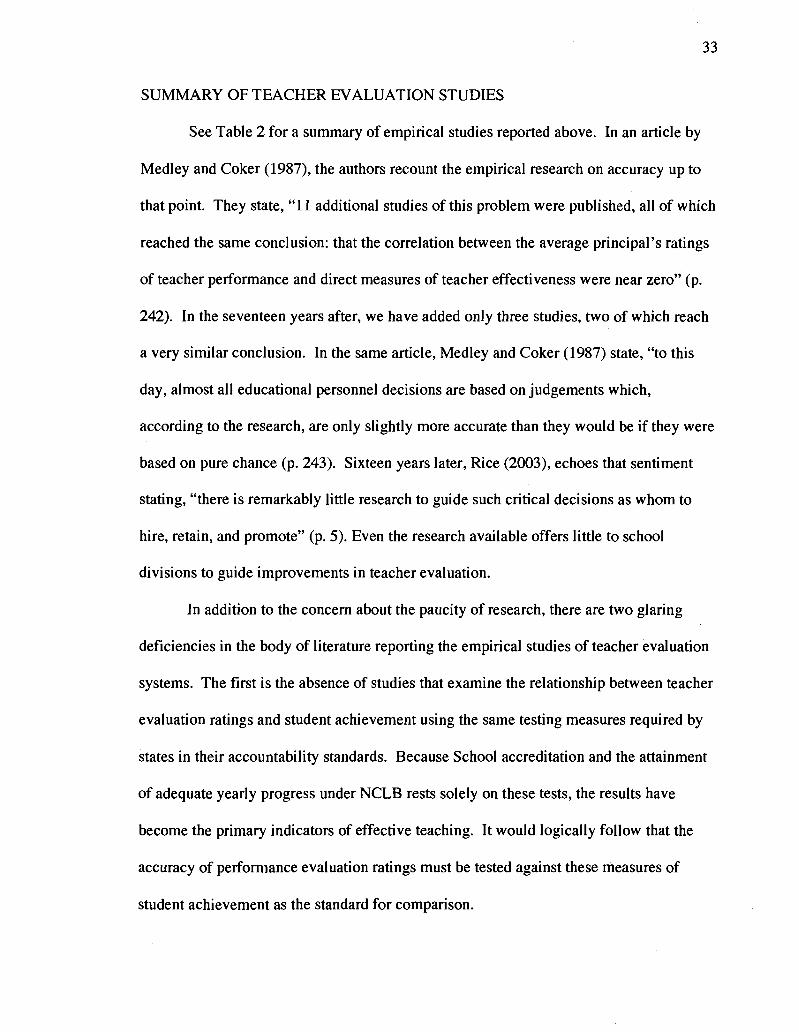
SUMMARY OF TEACHER EVALUATION STUDIES
See Table 2 for a summary of empirical studies reported above. In an article by
Medley and Coker (1987), the authors recount the empirical research on accuracy up to
that point. They state, "11 additional studies of this problem were published, all of which
reached the same conclusion: that the correlation between the average principal's ratings
of teacher performance and direct measures of teacher effectiveness were near zero" (p.
242). In the seventeen years after, we have added only three studies, two of which reach
a very similar conclusion. In the same article, Medley and Coker (1987) state, "to this
day, almost all educational personnel decisions are based on judgements which,
according to the research, are only slightly more accurate than they would be if they were
based on pure chance (p. 243). Sixteen years later, Rice (2003), echoes that sentiment
stating, "there is remarkably little research to guide such critical decisions as whom to
hire, retain, and promote" (p. 5). Even the research available offers little to school
divisions to guide improvements in teacher evaluation.
In addition to the concern about the paucity of research, there are two glaring
deficiencies in the body of literature reporting the empirical studies of teacher evaluation
systems. The first is the absence of studies that examine the relationship between teacher
evaluation ratings and student achievement using the same testing measures required by
states in their accountability standards. Because School accreditation and the attainment
of adequate yearly progress under NCLB rests solely on these tests, the results have
become the primary indicators of effective teaching. It would logically follow that the
accuracy of performance evaluation ratings must be tested against these measures of
student achievement as the standard for comparison.
34
Every study, with the exception of the Cochran and Mills (1983) study, used
student growth as the measure of student achievement. In all but one study by Wilkerson
et al. (2000), the researchers tested for growth using norm-referenced tests, such as the
Stanford 9. These tests indicate general levels of achievement by comparing a student's
score with scores of other test-takers, nationally. There are no "passing" or "failing"
scores for norm referenced tests and, consequently, they are not acceptable accountability
measures in most states. Thus, school divisions need research that measures the accuracy
of ratings against the performance outcomes for which they are accountable, to see if the
rating process is capturing the teaching behaviors that produce those performance
outcomes for students.
The second, and perhaps larger, deficiency in the teacher evaluation research is
the absence of any inquiry or investigation about the causes of the documented
inaccuracy of evaluation ratings. Although study after study, (14 in all) concludes that
current ratings are inaccurate, there is absolutely no subsequent attempt to document the
sources of inaccuracy.

35
Table 2: Summary of Empirical Studies on Teacher Evaluation Systems
Author(s) Coker
Purser et al.
Gallaher
Cochran and Mills
Wilkerson etal.
Year 1985
1990
2002
1983
2000
Topic of study Correlation between principal ratings of teacher effectiveness and pupil growth measured by expected student gain on norm-referenced tests of mathematics and reading. Gain measured by pre and post testing. Correlation between principal ratings of teacher effectiveness and pupil growth measured by expected student gain versus real gain on norm referenced on tests. Gain measured by pre and post testing. Correlation between principal ratings of teacher effectiveness and pupil growth measured by student gain on standardized norm-referenced tests of reading, language arts and mathematics. Gain measured by pre and post testing. Correlation between administrator ratings of ESL teacher effectiveness on 9 separate competencies and student performance on a criterion referenced test of ESL proficiency. Correlation of teachers' self-ratings, student ratings, and principal ratings of teacher effectiveness with student achievement as measured by standardized and district tests scores on norm referenced tests of reading, language and math. Gain measured by pre and post testing.
Findings Recap of 9 previous studies showed no significant correlation between ratings and measures of student achievement. Coker's study found a mean correlation of only .20. No strong correlation between ratings and achievement data. 49.43% of teachers classified correctly (according to student scores) by principals.
A positive correlation did exist with the highest r = 0.545. Other-values not reported. This study was different in that the school studied gave merit pay to teachers based on student achievement. No significant correlation between student scores and administrator ratings on any of the 9 competencies. This study is the only study to use a criterion-referenced test of course content. Student ratings (r = 0.75 math and r = 0.67 reading) and teacher self-ratings (r = 0.67 and r = 0.21) had a much higher level of correlation with measures of student achievement than principal ratings (r = 0.17 and r = 0.09)
MODEL AND RESEARCH PROPOSITIONS
This study makes a contribution to the literature by examining two critical but
neglected areas of research in teacher performance evaluation. Both have to do with
accuracy. The first applies to the inferential accuracy of raters, the second to the
accuracy of the ratings themselves.
The cognitive processing model (Figure 1) suggests that performance evaluation
ratings are subject to bias at each stage of the appraisal process. Empirical studies have
documented these biases and suggested causes and remedies where possible. What
human resource departments have sought to do as a result, is to create evaluation systems
that reduce the possibilities for the introduction of bias at all stages of the process. When
we examine the model and the industry response, in terms of systems designed to reduce
or eliminate bias, we should see an improvement in the accuracy in performance ratings.
According to Hammond (1981) and Feldman (1984), tasks on the intuitive end of
the cognitive continuum require more controlled processing rather than automatic. Sulsky
and Day (1992) found that training raters in advance to recognize the prototype of
expected employee behavior allowed more automatic processing and increased the
accuracy of ratings. In response, human resource departments have written detailed job
descriptions and given indicators of expected employee behaviors to assist raters in
making accurate judgements of employee performance.
According to Motowidlo (1986), there is a true domain of employee behaviors of
which raters only take a sample. The accuracy of this sampling process, he maintained,
could skew the accuracy of the evaluative judgement made later. In response, teacher
evaluation systems are designed to include multiple observations of teacher behavior in a

37
variety of circumstances. There are minimum periods of duration for observations
specified by law. In addition, many systems include multiple sources of data for
evaluation, such as client surveys and portfolios demonstrating employee competencies.
According to DeNisi, Cafferty and Meglino (1984), when information is encoded
for memory, and later recalled, the sample could be further skewed. Researchers have
documented the effects on encoding and recall of a variety of variables such as type of
information, time delays, rater affect, the organization of information and the recording
system in use (DeNisi and Peters, 1996; Highhouse and Gallo, 1997; Ilgen, Barnes-
Farrell and McKellin, 1993; and Ambrose, 1994; Williams, Cafferty, and DeNisi, 1990).
In response, the industry introduced BARS to focus raters on attending to and recording
behaviors accurately. Many performance appraisal systems have prescriptive methods
for recording information including electronic databases which recall information
automatically. Evaluative judgements are then made according to Behavior Summary
Scales (BSS) which clearly identify different levels of task performance so that raters can
make accurate ratings.
In effect, when research has illuminated a need for improvement, the performance
appraisal industry, which includes teacher performance evaluation systems, has
responded. (For a summary of responses, see Figure 2.) Theoretically, the ratings that
are produced as a result of these systems should be accurate in comparison with objective
performance measures, such as student achievement measures. But, clearly they are not.
This is especially true of teacher performance appraisal ratings. Every empirical study on
the topic found principals' ratings to be highly inaccurate when compared with any
measure of student achievement. Given that teacher effectiveness ratings should be

38
related to student achievement, the question is why the ratings remain inaccurate despite
improvements in performance appraisal systems.
Nathan and Alexander (1985), introduced the concept that a rater's inferential
accuracy could be at the base of ratings which are still persistently inaccurate despite all
the system designs in place to reduce bias and improve accuracy. That proposition has
never been tested empirically. This study then, is the first empirical test of the influence
of inferential accuracy of raters in an organizational setting. The model proposed here,
based on Jackson (1972) and applied to performance appraisal by Nathan and Alexander
(1985) suggests that, if there is a high level of inferential accuracy on the part of raters,
the current systems in use in teacher performance appraisal should, theoretically, produce
accurate ratings of teacher effectiveness.
The second issue at hand is the measurement of rating accuracy. Sulsky and
Balzer (1988) stated that accuracy in performance evaluation ratings is a term used to
describe both the strength and kind of relation between the evaluative rating and another
measure which is an accepted standard for comparison. The body of empirical literature
on performance appraisal accuracy describes a host of studies in which raters' scores are
compared to true scores, that is measures derived from the consensus views of expert
raters. Sulsky and Balzer (1988) note that the methods for calculating true scores are all
problematic in one way or another and thus, there are no true scores, only estimates.
DeNisi and Peters (1996), the sole researchers to conducted a study in an actual work
setting, found the issue of true scores to be highly problematic because there are no such
measures available in a field setting. They were forced, as a result, to examine
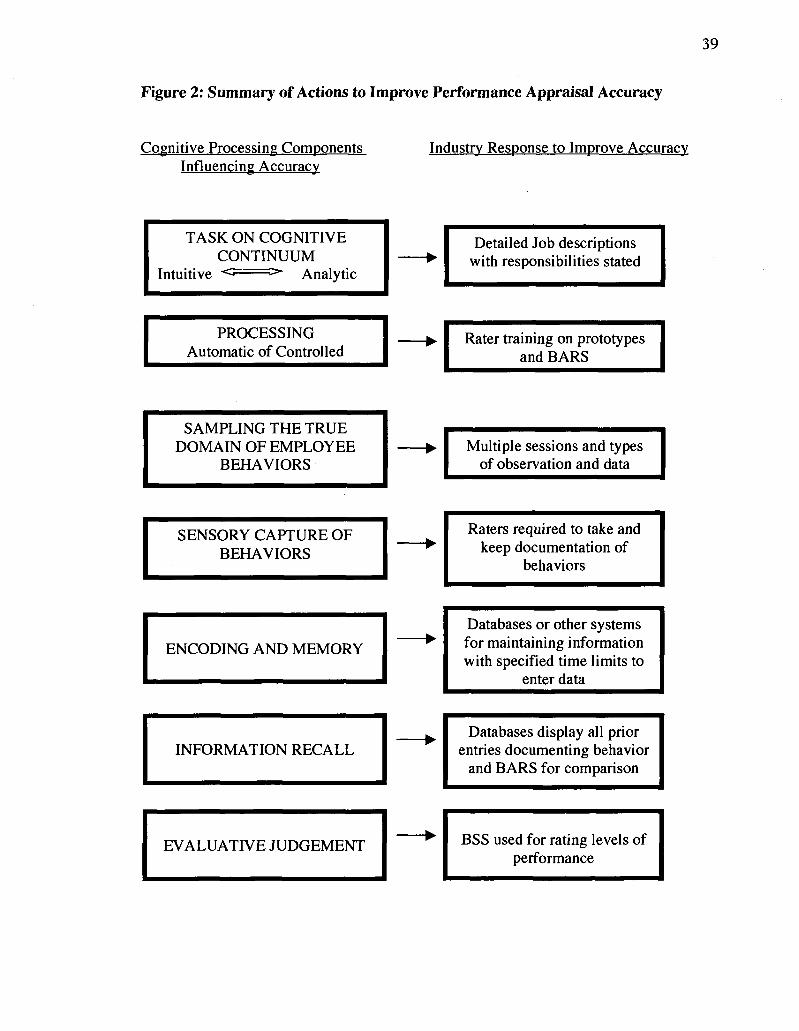
Figure 2: Summary of Actions to Improve Performance Appraisal Accuracy
Cognitive Processing Components Influencing Accuracy
Industry Response to Improve Accuracy
TASK ON COGNITIVE CONTINUUM
Intuitive <• >* Analytic
Detailed Job descriptions with responsibilities stated
PROCESSING Automatic of Controlled
Rater training on prototypes and BARS
SAMPLING THE TRUE DOMAIN OF EMPLOYEE
BEHAVIORS Multiple sessions and types
of observation and data
SENSORY CAPTURE OF BEHAVIORS
Raters required to take and keep documentation of
behaviors
ENCODING AND MEMORY
Databases or other systems for maintaining information with specified time limits to
enter data
INFORMATION RECALL Databases display all prior
entries documenting behavior and BARS for comparison
EVALUATIVE JUDGEMENT BSS used for rating levels of performance

supervisors' recall and levels of rating elevation. Lacking the requisite second measure
as a standard of comparison, they could do no test of overall accuracy.
The empirical research in teacher performance evaluation expands the literature
base to include field studies. While limited in scope, the body of research does include a
number of studies which measure the accuracy of teacher performance ratings according
to the model cited in Sulsky and Balzer (1988), that is by comparing the ratings with a
second set of measures. The problematic issue remaining is the lack of any studies that
used, as a measure of comparison, the same testing measures required by states in their
accountability standards. This study addresses that issue by measuring rating accuracy
against Virginia's accountability measure: student pass rates on SOL tests.
The model tested here is very straightforward (See Figure 3). The performance
appraisal system (comprised of instruments, processes and protocols) used in this study
was built to reduce the sources of bias that are suggested by the cognitive processing
model. The inferential accuracy of the rater is posited to have a direct influence on the
accuracy of the ratings as measured by comparison with a second set of accepted
measures of performance. The second set of measures to be used here is SOL Pass Rates.
Inferential accuracy is comprised of both Threshold and Sensitivity. Threshold and
Sensitivity have opposite effects on the overall level of inferential accuracy and, hence,
rating accuracy. As Threshold increases, rating accuracy declines; in contrast, as
Sensitivity increases, rating accuracy also increases.
Testing this model addresses the deficiencies in the literature in three ways. First,
this study measures the accuracy of teacher ratings using a measure which is the dictated
standard of accountability in the state, namely, student performance rates on SOL tests.
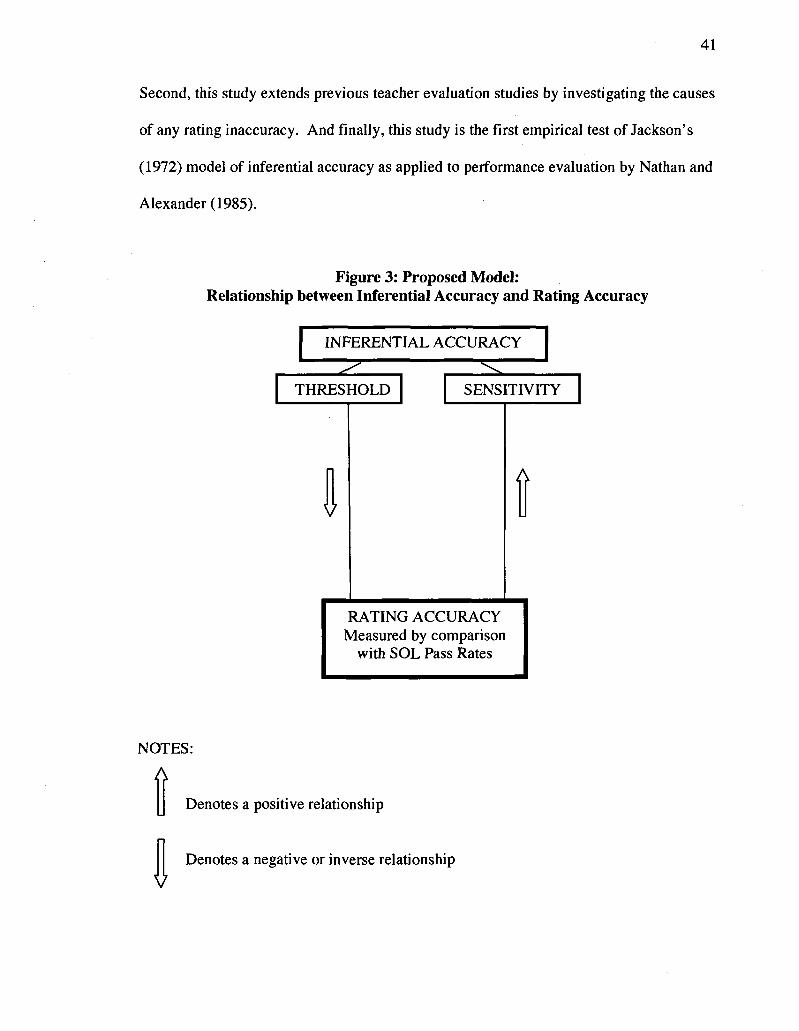
41
Second, this study extends previous teacher evaluation studies by investigating the causes
of any rating inaccuracy. And finally, this study is the first empirical test of Jackson's
(1972) model of inferential accuracy as applied to performance evaluation by Nathan and
Alexander (1985).
Figure 3: Proposed Model: Relationship between Inferential Accuracy and Rating Accuracy
INFERENTIAL ACCURACY
THRESHOLD
V
SENSITIVITY
A
RATING ACCURACY Measured by comparison
with SOL Pass Rates
NOTES:
A Denotes a positive relationship
Denotes a negative or inverse relationship
V

The Research Propositions:
The following research propositions are drawn from the Model shown in Figure 3.
PI: There will no significant relationship between performance appraisal ratings and SOL
Pass Rates.
Although the performance evaluation system for teachers has been built to reduce
error and improve the accuracy of ratings, prior research testing the relationship between
performance appraisal ratings and measures of student achievement suggest that rating
accuracy will be low.
P2: There will be no significant relationship between performance appraisal ratings in
separate domains of performance and SOL Pass Rates.
P2a: There will be no significant relationship between performance appraisal
ratings in the Instructional Domain of performance and SOL Pass Rates.
P2b: There will be no significant relationship between performance appraisal
ratings in the Management Domain of performance and SOL Pass Rates.
P2c: There will be no significant relationship between performance appraisal
ratings in the Assessment Domain of performance and SOL Pass Rates.
P2d: There will be no significant relationship between performance appraisal
ratings in the Professional Domain of performance and SOL Pass Rates.
Conceptually, all domains of performance contribute to student achievement and,
therefore, sub-scores on rating domains should be equally accurate. Raters' inferential
accuracy is posited to affect evaluative judgement in a broad sense; the model suggests

43
that raters' inferential rating accuracy does not fluctuate within domains of the same
evaluative judgement.
P3: There will be a significant inverse relationship between Threshold and rating
accuracy.
P4: There will be a significant positive relationship between Sensitivity and rating
accuracy.
P5: Raters with high levels of inferential accuracy will produce more accurate evaluative
ratings.
Nathan and Alexander's (1985) application of Jackson's (1972) model of
inferential accuracy suggests that inferential accuracy is the intervening variable that
influences the accuracy of rater evaluative judgments despite performance appraisal
system components to reduce error and improve accuracy.

CHAPTER III
METHODOLOGY
RESEARCH SETTING
In Chapter II, the conceptual model for the influence of inferential accuracy on
teacher performance evaluation ratings was presented. This conceptual model was tested
in a field study using data collected from Hampton City Schools (HCS). Hampton City
Schools is a moderately sized school division with approximately 22,000 students located
in the Tidewater region of Virginia. The city is not faring well economically and the
performance of its students is below the state average in many areas. It has several
schools under academic warning and several which face sanctions under NCLB. The
division has accomplished solid curricular alignment with the SOL tests, has researched
instructional strategies effective with its population and is focused on instructional
improvement.
Hampton City Schools provided an excellent setting for this field study for several
reasons. The teacher evaluation system was built with performance appraisal research in
mind. Therefore, the performance appraisal training, instrument, data base, and process in
use in Hampton City Schools, by its structure, reduces greatly the opportunities for bias
in sampling, encoding and retrieval of performance information on teachers. In addition,
the division's student scheduling system provides random assignment of students to high
school classes, which allows the comparison of student achievement results between
teachers. Finally, the division provides software to disaggregate SOL performance data

45
on many levels, which made possible the comparison of performance evaluation ratings
of particular teachers and the SOL performance of those teachers' students.
HCS Teacher Evaluation System
According to cognitive processing research, training raters in prototype increases
rating accuracy (Sulsky and Day, 1992). The HCS teacher performance appraisal system
provides raters with training and written performance indicators so they can easily
recognize and attend to behaviors expected for effective teachers. Raters have a clear
prototype of effective teaching behaviors prior to beginning teacher observations.
Motowidlo (1986) suggests that raters only observe a sample of an employee's
true domain of behaviors and that inaccurate sampling will produce an inaccurate
evaluative rating. Concern about sampling is particularly at issue in teacher performance
appraisal. First, a concern arises from the practice of making ratings based on a single
classroom observation. Second, comes a concern about the scheduling of observations
in advance. In school divisions where evaluators must pre-schedule their observation
visits, a teacher can easily fabricate a lesson which meets criteria for a positive evaluation
for that single day and never engage in those positive teaching behaviors for the
remainder of the year. The HCS evaluation system is designed to lessen the possibility of
both of these sources of inaccuracy by demanding a minimum of three observations and
encouraging more. Observation periods must be a minimum of 35 minutes and
evaluators are encouraged to remain for entire class periods. The system also specifies
that only one observation may be pre-scheduled; others are unannounced and, thus, more
likely to capture the true teaching behaviors used on a daily basis.

To increase the sample of data used to make evaluative decisions beyond
classroom observations, the HCS evaluation system requires raters to examine
documentation of planning, not only about the lesson observed, but ongoing plans which
show that the teacher is following the prescribed scope and sequence of the course
curriculum. Raters also examine documentation of student work and assessment making
sure that the assessments are designed to allow students practice in taking SOL formatted
tests and that the teacher uses questions which mirror the required level of skill on the
tests. Teacher portfolios offer documentation of current professional development
activities. The portfolios also contain a summary of information gathered through
surveys given to students, so they can provide anonymous feedback to the teacher about
classroom climate and the effectiveness of the teacher's instructional strategies.
Much research is dedicated to the effects of time delays in recording information
from observation as well as the effect of different types of recording on recall (DeNisi
and Peters, 1996; Murphy, Philbin, and Adams, 1989). The HCS evaluation system is
built to reduce bias at this stage of the process in two ways. First, raters are required to
make written records of classroom observations and document examination at the time of
the observation or examination. Then, they are required to enter data electronically into
the evaluation database which is housed on a server maintained by the human resource
department. The data entry must be made and an evaluation conference with the teacher
held within five days of the observation. In training, raters are encouraged to make the
data entry immediately after the observation or document review. Because the database
is accessible by server and administrators are equipped with laptops that have wireless
internet capability, some enter the data during the observation period.
47
Not only do data entry requirements lessen time delays, the database itself aids
raters in making evaluative decisions. The database is a sophisticated Filemaker Pro
system that gives raters information with which to work as they enter data. As the rater
clicks on the domain in which he or she plans to make an entry, the behavior indicators
come on screen to guide the rater. There is a section for comments in which the rater
must enter a comment, designed to be an example of behavior, which substantiates the
rating chosen. At the time of the summative evaluation, when the rater clicks on the
particular domain and competency, not only do the behavior indicators come up, but also
the raters own comments for all observations throughout the evaluation period. In
addition, the screen displays the behavior summary scales which help the rater choose the
correct level of performance based on all the comments entered. The visual display of all
the accrued data for the one or three year total evaluation period, allows the rater to make
an accurate rating without a concern about diminished recall; the specific behaviors have
been noted and recalled by the system.
HCS Student Scheduling System
The student scheduling software used in Hampton City Schools also makes it an
excellent research site. The division uses MacSchool relational data base to handle all
student data at the building level. The scheduling module in this software provides for
random assignment of students to particular sections of classes. All students needing to
take a particular class, such as Algebra I are given a course request for Algebra I. The
typical number of students requesting this common course in any of the four high schools
ranges from 350 to 450 students. Based on a class size of 25 students, the software then

48
builds a master schedule containing the appropriate number of sections. In our example,
350 requests would generate 14 sections of the class, 450 would generate 18 sections of
the class.
Next, the software distributes the sections across the available periods in the
master schedule. High schools run on block schedules, with four blocks in each of a two
day rotating schedule. Therefore, there are 8 "slots" into which the sections can be
allocated. The scheduling software builds a sophisticated conflict matrix, reading all
student requests and placing classes into available blocks to avoid conflicts in scheduling.
The final step is to assign students to the sections that have been built in the master
schedule. The division uses a random assignment practice of having the computer take
all students requesting a particular course, placing them in a random ordered list, then
assigning them one by one to the available sections. The program is built to assign one
student to each of the sections available, such as our 14 or 18 sections of Algebra I, then
go back and assign a second student to each section, and so on until all are filled. This
means that students are assigned to the available sections of the course without regard to
race, gender, previous learning, motivation or other factors, which could affect
achievement.
HCS Student SOL Data System
Prior empirical tests for teacher evaluation rating accuracy used norm-referenced
tests such as the Stanford 9 as a comparison measure (Coker, 1985; Gallaher, 2002;
Purser et al., 1990; Wilkerson et al., 2000). Norm referenced tests are not the best
comparison measure for the purpose because they measure aggregate levels of skill in

general subjects such as reading and math. The general skills are acquired by students
over the course of several years and with the assistance of many different teachers. In
contrast, the SOL tests used as the comparison measure to establish the accuracy of
performance ratings in this study are not only important because they are the sole
accountability measure for state accreditation, but also are much better suited to the
purpose.
Berk (1984) suggests that, if tests are used as part of an evaluation process, they
should be criterion referenced and should be closely aligned with the curriculum. SOL
tests satisfy this requirement. In addition, the SOL "end-of-course" tests required in
Virginia's high schools measure only the content delivered by an individual teacher in a
specific course, thus the student outcomes on the test are directly attributable to a
particular teacher.
Hampton City Schools was also an excellent research site for this study because
of the availability and format of student SOL test results. The testing company,
Harcourt-Brace, makes testing data available for individual students and provides an
electronic version of the results. It then becomes the responsibility of school divisions to
analyze the data. HCS uses a specially designed Excel software package to
disaggregates SOL performance data on many levels making possible the analysis of
SOL performance of particular teachers' students. In addition, the software provides a
statistical picture of the makeup of each teacher's students with respect to race, gender,
economic disadvantage, disability and limited English proficiency. The information is
reported in percentages of the total group in question and thereby does not reveal
confidential information about any particular student.

50
RESEARCH SUBJECTS
This study tested the influence of the inferential accuracy of raters in the HCS
teacher evaluation study on the accuracy of the ratings. There were two distinct groups
of individuals considered subjects of the study: evaluation raters and teachers whose
ratings were studied.
The study did not use a representative sample, but rather data from the entire
population of both HCS teachers who taught high school courses followed by SOL
testing and their evaluation raters. The teachers include those who taught Algebra I,
Algebra II, Geometry, Earth Science, Biology, Chemistry, Geography, World History and
U.S. History in the three year period prior to the study. Although English 11 also has
end-of-course tests in Reading, Writing, Literature and Use of Resources, according to
the Accountability and Assessment Department of the VDOE, these tests were designed
to measure cumulative skills gathered from multiple years of education in English (9th,
10th, and 11th grade) and therefore were not suitable for use in this study.
The teachers in the study did not include special education teachers, but instead
those who taught student groups primarily comprised of students without disabilities.
The total number of teachers involved, 145, made possible the collection of data for all.
Raters in the study are or were principals or assistant principals at one of the four high
schools in the HCS system. The total number of raters involved in the evaluation of the
subject teachers was 17.
Because no individual student data was collected, students were not considered
subjects in the study.

51
DATA TYPES AND SOURCES
There were three distinct types and sources of data in the study: teacher
evaluation ratings, student SOL Pass Rates, and inferential accuracy measures for raters.
Data from the three-year period (2001-2004) in which the HCS teacher evaluation system
had been in use was collected for analysis. Detailed descriptions of the data, the sources,
and the collection procedures are delineated here.
Teacher Evaluation Ratings
The first source of data was the ratings on summative evaluations of teachers in
the study. HCS teachers on continuing contract (also referred to as tenured) receive a
summative evaluation once every three years. The summative evaluation combines data
gathered in observations and document reviews conducted over the three-year period to
yield one final evaluation. Beginning teachers, in their first three years of service,
receive a summative evaluation each year. It is based on the same number of evaluations
and document reviews as are present for tenured teachers; the information is simply
accrued each year with observations and document examination occurring more
frequently. The summative evaluation is submitted to the Human Resource Department
in electronic format and is the basis for personnel decisions about contract renewal,
renewal with an improvement plan in place, or non-renewal.
Teachers were rated in 18 separate competencies in 4 domains of skill:
Instructional, Assessment, Management, and Professional. The Instructional domain lists
7 competencies which focus on current and accurate knowledge of the curriculum,
effective planning, effective use of materials and resources, effective communication and

use of effective instructional strategies. The Assessment domain lists 3 competencies
that focus on the range and type of assessments used, as well as the use of information
generated from them. The Management domain lists 4 competencies which focus on the
use of instructional time, the classroom climate and behavior management. Finally, the
Professional domain lists 4 competencies that focus on ethical behavior, professional
development, supporting school goals and maintaining effective communication. A
complete list of domains and competencies is contained in Appendix A.
Teachers received a point rating on each of the 18 competencies. In the HCS data
base the scores range from 1 to 4 points with the lower score indicating better
performance. The data from summative evaluations for teachers in the study was
exported by the Information Technology staff to an Excel spreadsheet listing the 18
competencies and the point rating for each. To avoid confusion likely to result from the
reverse direction of the scale of teacher ratings, i.e. lower scores indicating better
performance, once the data was exported, the researcher reversed the scores so that
higher scores indicated better performance. The four-point scale values for the ratings
were transformed thus: Exemplary (4 points), Professional (3 points), Needs
Improvement (2 points) and Unsatisfactory (1 point). There were no overall scores
generated by the evaluation system, nor any sub scores totaling the points for each
domain. The researcher performed these operations for the purposes of this study. The
database lists the domain sub-scores for each in the ranges specified below.
• Instructional - 7 items, which then yield a minimum domain score of 7 and a
maximum domain score of 28. 7 would indicate a teacher rated Unsatisfactory in
53
each skill while 28 would indicate that a teacher's performance was Exemplary in
all skills.
• Assessment - 3 items, which then yield a minimum domain score of 3 and a
maximum domain score of 12.
• Management - 4 items, which then yield a minimum domain score of 4 and a
maximum domain score of 16.
• Professionalism - 4 items, which then yield a minimum domain score of 4 and a
maximum domain score of 16.
The total score for each teacher was tallied with a range from 18 points to 72 points. A
total score of 18 would indicate the teacher was rated Unsatisfactory on all 18
competencies, while the rating of 72 would indicate the teacher was rated Exemplary on
all skills.
Total ratings at the high or low end of the spectrum were not anticipated. A
teacher rated as Professional (3 points) in all skill areas would have a total rating of 54
points. Raters are trained that the rating for a qualified teacher who is meeting
expectations in a skill should be Professional (3 points). Teachers whose skill level
clearly and consistently exceeds expectations should be rated Exemplary (4 points) with
an accompanying commentary documenting the behavior observed which led to the
rating choice. Teachers who need to work on a skill are to be given a rating of Needs
Improvement (2 points) with a commentary justifying the rating required.
Teachers who consistently receive ratings of Needs Improvement on three or
more skills and do not exhibit the requisite improvements during the next rating period
should expect to be put on an improvement plan. Only teachers whose behavior is

grossly below expected professional and ethical standards would receive a rating of
Unsatisfactory (1 point). More than one Unsatisfactory rating could be grounds for
dismissal.
Student SOL Pass Rates
Division-wide data on SOL test results is provided to HCS in electronic format.
HCS then loads that data into custom designed SOL Disaggregator software that operates
on an Excel platform. The data can be sorted, by test subject, by school, and by teacher.
The software collates the data and provides analyses of results which indicate the number
of students who took the test, and the number and percentage of students who passed.
Data was sorted by teacher to yield a pass rate of all of that teacher's students (across
multiple class sections). It was this pass rate that was recorded for each teacher in the
study.
The Disaggregator software also allows detailed analysis of results in many areas,
ranging from student subgroup performance to performance on different reporting
categories of the same test. Some subgroup information was also recorded: percentage of
students in the testing group who were economically disadvantaged and percentage in the
testing group who had a learning disability. The presence of this information in the
database allowed for the control of factors associated with student performance over
which teachers had no influence. Because of the random distribution of students by the
Macschool Scheduling software explained earlier in the chapter, there were no
discernable patterns in the concentration of either subgroup in any particular class.

The SOL data files, located on HCS owned servers, were accessed by the
researcher who disaggregated the data by teacher and recorded the information in the
Excel file already containing the Teacher Evaluation data. In this way, the SOL Pass
Rates of a specific teacher (along with subgroup information) was matched with the
evaluation rating of that teacher. Once this was accomplished, the teacher name was
removed from the research data and replaced with a randomly assigned numerical case
number.
The SOL Pass Rate has a theoretical range of 0 to 100 percent. A 70 percent pass
rate in each tested subject is considered the minimum for school accreditation. The 70
percent rate applies to all schools regardless of socio economic or other factors which
could affect student achievement. The SOL Pass Rates for the 145 teachers were
collapsed into five categories to enable and easier interpretation. The categories are:
• Category 5 - 90-100% pass rate; Exemplary Performance
• Category 4 - 80-89% pass rate; Very Good Performance
• Category 3 - 70-79% pass rate; Acceptable Performance (meets state standards)
• Category 2 - 60-69% pass rate, Performance Needs Improvement
• Category 1 - 59% or below pass rate, Unacceptable Performance
Rater Inferential Accuracy Measures
The primary study measuring the Inferential Accuracy of raters (Jackson, 1992)
was conducted in a clinical setting using psychology students and measuring their
judgements about the presence of a mental disorder in fictitious patients against the
Diagnostic and Statistical Manual of Mental Disorders - Third Edition (DSM III)
56
definition of that disorder. Based on a detailed literature review, inferential accuracy has
never been measured in a performance appraisal context or in a field setting and so there
is no empirical precedent to follow in measurement.
In the absence of any quantitative measures in the existing data that would
constitute evidence of inferential accuracy or the lack thereof, this data was collected in
structured interview with the 17 subject raters in the study. The interview format was
chosen for several reasons. First, the nature of the questions necessary to measure
inferential accuracy were best delivered in the process of a discussion about the
evaluation process overall. Without this thought provoking discussion, it was unlikely
that the respondents would have processed the questions fully prior to answering,
possibly limiting the accuracy of the response. Second, some questions asked the
respondents to express opinions about the effectiveness of the evaluation instrument,
system and processes developed by the HCS Human Resources Department. It was
thought that the respondents would be unlikely to share negative opinions in a written
survey document on which they would have to be identified for the purpose of accurate
data entry. Finally, an honest response to some questions involved the possibility of
admissions about inaccurate rating behavior which would, again, be unlikely in a written
format with no opportunity to develop rapport or put the respondent at ease about the
purpose of the questions and the confidentiality of response.
A structured interview, in which all respondents are asked the same questions and
in which all responses are entered on a standard data collection instrument (DO) was
chosen to assure the collection of uniform data. The researcher developed the interview
questions and scalable responses according to the protocols established by the
57
Government Accounting Office. (1991) The instrument was developed in two stages. In
the first stage, the researcher generated questions designed to measure influences on
rating accuracy suggested by the model and other studies cited in the literature review. In
the next stage, the researcher conducted a limited focus group discussion with three
experienced raters not involved with the study to generate questions to assess the effects
of other possible influences on rating accuracy.
The interview questions and scalable responses were ordered according to GAO
protocols and procedures cited by Foddy (1993) to reduce response bias. Interview
questions and scalable responses on the DCI were submitted to an expert panel for
review. The lead reviewer holds a doctorate in psychometric measurement and
constructs research instruments for HCS for performance measurement. The secondary
reviewer directs performance evaluation and professional development for HCS. Neither
recommended significant changes to the questions or scalable responses, although some
questions were added at the request of the HCS professional development director to
assist in program evaluation internally.
At the direction of the primary expert reviewer, each section of the interview
began with an open-ended question to generate a discussion of the topic. Foddy also
suggests that open discussion and personalized responses increase accuracy of answers
(1983). From the discussion, the researcher gathered responses to individual questions
and entered them on the DCI. At the conclusion of each interview section, the researcher
verified the accuracy of the information recorded by reviewing the answers entered and
asking the respondent to offer corrections as necessary. When the response to any

question did not surface in the course of the discussion, the researcher asked the question
directly and gave the scalable responses available for choice.
Three pilot interviews were conducted using experienced raters who were not part
of the study. After each pilot interview, the researcher conducted a debriefing session
where the respondent was asked to provide feedback on the interview format, content,
and process. Changes were made to the format of several questions and a question was
added as a result of the first session. No changes were generated by the second or third
pilot interviews. Please refer to Appendix B for the Interview Questions and DCI.
All interviews were conducted by the researcher, a protocol which increased the
reliability of the measures since most reliability concerns focus on inter-rater reliability.
In addition, the researcher has been a colleague of the raters in the study, which is
advantageous as long as the relationship is not supervisory. According to Struening and
Guttentag, "similarity between the interviewer and respondents in social class, education,
and profession increases the accuracy of response" (1975).
Specific areas of focus in the interview were indicators of the two components of
inferential accuracy: Sensitivity and Threshold (Jackson, 1972). Nathan and Alexander
(1985) applied the Jackson model of inferential accuracy in psychological diagnostics to
accuracy in performance evaluation ratings. The model suggests that Sensitivity is
present when raters have knowledge of the consensus rating norms and make judgements
accordingly. According to Jackson, a high degree of Sensitivity is necessary for
inferential accuracy.
There were two specific areas of Sensitivity measured in the study. The first was
Sensitivity to the domains and competencies on which teachers are rated in HCS. In this
single item, the measure on the DCI was entered by the researcher without review by the
respondent. (All other measures were based on direct responses and reviewed by the
respondent.) At the suggestion of the primary expert panelist, the researcher measured
the respondents' knowledge of the HCS domains and competencies in the course of a
series of questions which required them to use that knowledge to answer. The
respondents' Sensitivity measure was entered according to a criterion-referenced rating
scale developed in advance. The scale range was 0 - 3. The second measure was
Sensitivity to the performance levels used in the rating process and the ease of choosing
performance levels. This measure was based on a direct response. Again, the scale range
was 0 - 3 so that the Sensitivity measure combining the two items had a scale of 0 - 6.
The second component of inferential accuracy is the Threshold to infer a
consistent pattern of behavior based on a limited sample of behavior. The Jackson model
maintains that Threshold must be low for inferential accuracy to exist (1972). In this
study, Threshold was measured by behaviorally-based questions in which respondents
were asked to report the number of observations of particular types of behavior required
for them to choose particular levels of performance on evaluations. Foddy suggests that
asking respondents to report specific instances of behavior increase the accuracy of the
information gathered (1993). There were two items combined for this measure with a
total scale of 2 - 8. Although items were included in the interview to assist the HCS
professional development department in evaluating processes and programs, these were
unrelated to the dissertation. Please refer to Appendix B for the criterion-referenced
rating scale for the Sensitivity measure, and coding scheme and Appendix C for the list
of aggregate measures entered.

Based on measures of the two components of inferential accuracy, raters were
numerically classified on a Low to High scale of Sensitivity and a Low to High scale of
Threshold. High Sensitivity with Low Threshold gave the rater an overall classification
as High in Inferential Accuracy. The opposite, Low Sensitivity with High Threshold
gave the rater an overall classification as Low in Inferential Accuracy. Any other
combinations of the two factors, for example High Sensitivity with High Threshold,
suggests an undetermined level of inferential accuracy in that there is no research to
suggest which component will prevail in the process of evaluative judgments. These
raters were given the classification of Undetermined in Inferential Accuracy overall with
a notation of which factor (Sensitivity or Threshold) was dominant so the analysis could
focus on the influence of each of the components.
ETHICAL ISSUES
Teacher evaluation ratings are considered confidential information and are not
made available at all levels of the HCS organization. Building administrators are given
access to the ratings for all employees within their span of control. Department Directors
have access to the ratings for all employees within their departments and Human
Resource Directors have access to the entire database.
The SOL Pass Rates sorted by individual teacher are likewise not available at all
levels of the HCS organization. They are available to the building administrators to
whom the teacher reports. The data are also available to Instructional Leaders at the
building level, Curriculum Leaders at the division level, Department Directors and the
Instructional Leadership team. Because teachers disaggregate results in groups of

61
colleagues at the building level, so that they share pass rates among department measures,
there is less a concern about confidentiality with this information. There are no written
policies protecting teachers from the publication of this data, but it is considered a
professional courtesy to avoid the reporting of data by teacher because the possibilities
for misinterpretation are many.
Temporary access to confidential teacher rating scores and SOL data was made
available to the researcher as a Department Director for HCS with the understanding that,
as soon as teacher evaluation data was matched with student performance data, the name
and any other information by which a teacher could be identified, would be removed
from the database to be replaced with a randomly assigned case number. At no time was
any teacher identified in the data tables or the narrative text of the study.
Rater participation in the structured interview process was voluntary and consent
to participate was established prior to the interviews. Despite employment in the same
school division, the researcher was not in a supervisory position with respect to any of the
raters. The rater responses are considered confidential. Once the survey measures were
entered into the research database, the rater name and any other identifying information
was removed from the database and replaced by a randomly assigned numerical rater
code. At no time does any rater name or identifying information appear in the data or
narrative text or data tables of the study.
DATA ANALYSIS
Because accuracy is defined as the strength and direction of association between
one set of measures and a second set of measures used as a standard of comparison, the

primary statistical analysis used in the study was a measure of correlation appropriate to
the type of data entered. Pearson's r (Product Moment) or Kendall's Tau were used, as
well as partial correlation measures when the researcher was controlling for other factors.
All statistical analyses were conducted using SPSS software (Statistical Package for the
Social Sciences version 11 for Mac OS X). The first test for rating accuracy was
accomplished by establishing the level of correlation between the ratings on the
summative teacher evaluation and the SOL Pass Rates for that teacher. As the evaluation
ratings of teachers is interval data and the SOL Pass Rates are ratio data, the appropriate
statistical measure of association was Pearson's r.
The data was analyzed first as a whole to measure the level of association
between all ratings and SOL Pass Rates. This portion of the study duplicated the efforts
of the previous 14 studies, which measured such association, but expanded the
knowledge base by using a measure of student achievement that is the dictated
accountability measure for accreditation in state law.
The second analysis involved the measurement of association of domain sub-
score ratings with SOL Pass Rates. The Purser (1990) study suggested that principals
considered the domain of management more important than the instructional domain and
weighted their ratings of teachers accordingly. If domains were not weighted equally as
they are intended in HCS this would indicate a lack of Sensitivity to rating consensus
norms and thereby suggest a lower level of inferential accuracy for raters. An opposing
possibility is that some domains capture behavior more influential toward student
achievement and therefore those domain sub-scores would show a higher level of

63
association with the SOL Pass Rates. While not suggested by the model, the practical
implications of such a finding support the investigation of the relationship.
The third analysis involved the measurement of association between particular
raters' evaluation ratings and SOL Pass Rates, both for overall ratings and domain sub-
score ratings. Coker (1985) reported a plan to assess the differences in rating methods for
individual raters whose results were more accurate than other raters in the study.
Unfortunately, his study did not find any particular rater to be significantly different in
accuracy. This study is more fruitful because there were varying degrees of accuracy
among the raters in this study. The measure of association between each particular
rater's evaluation ratings and the SOL Pass Rates of those teachers evaluated constituted
the measure of Rating Accuracy used in the subsequent analysis of inferential accuracy.
This final analysis measured the strength and direction of the association between
the Inferential Accuracy measures of the raters (Sensitivity and Threshold) and their
Rating Accuracy expressed in standard scores. Since inferential accuracy measurements
were rendered in ordinal data while rating accuracy is measured in interval data,
Kendall's Tau was the appropriate statistical measure.
REVIEW
It is helpful here to review briefly the purpose of the study, the research
propositions tested, and the data and analyses used.
Purpose:
The purpose of this exploratory study was twofold. The first purpose was to
examine rating accuracy, i.e., the relationship between subjective teacher performance

appraisal ratings and an objective measure of effectiveness. The second was to examine
the influence of the inferential accuracy of the performance appraisal raters in the study
on their Rating Accuracy.
Measures:
1. Performance Appraisal Ratings (performance evaluation database)
• Overall Rating Score - 18 items, Scale: 18-72
• Instructional Domain Rating - 7 items, Scale: 7 -28
• Assessment Domain Rating - 3 items, Scale: 3 -12
• Management Domain Rating - 4 items, Scale: 4 - 1 6
• Professional Domain Rating - 4 items, Scale: 4 - 1 6
2. SOL Pass Rates (HCS/ SOL Dissagregator database)
• Category 5 - 90-100% pass rate; Exemplary Performance
• Category 4 - 80-89% pass rate; Very Good Performance
• Category 3 - 70-79% pass rate; Acceptable Performance (meets state standards)
• Category 2 - 60-69% pass rate, Performance Needs Improvement
• Category 1 - 59% or below pass rate, Unacceptable Performance
3. Inferential Accuracy (Structured Interviews)
• Sensitivity Aggregate - 2 items, Scale 0 - 6
• Threshold Aggregate - 2 items, Scale 2 - 8
• Inferential Accuracy Classification - Combined Threshold
and Sensitivity Measure
o High - Threshold Scale 2 - 5 + Sensitivity Scale 5 - 6
65
o Low - Threshold Scale 6 - 8 + Sensitivity Scale 0 - 4
o Undetermined/Threshold dominant - Threshold Scale 2 - 5 +
Sensitivity Scale 0 - 4
o Undetermined/Sensitivity dominant - Threshold Scale 6 - 8 +
Sensitivity Scale 5 - 6
4. Rating Accuracy (Performance Evaluation database and SOL database)
• Overall Rating Accuracy - correlation coefficient between overall rating scores
and SOL Pass Rates
• Domain Rating Accuracy - correlation coefficient between domain sub-scores
and SOL Pass Rates
• Individual Rater Accuracy - correlation coefficient between overall rating scores
and SOL Pass Rates for cases selected by individual rater
Research Propositions
PI: There will no significant relationship between performance appraisal ratings and SOL
Pass Rates.
Data Analysis 1: Correlation (Pearson's r) between ratings and SOL Pass Rates.
P2: There will be no significant relationship between performance appraisal ratings in
separate domains of performance and SOL Pass Rates.
P2a: There will be no significant relationship between performance appraisal
ratings in the Instructional Domain of performance and SOL Pass Rates.

66
P2b: There will be no significant relationship between performance appraisal
ratings in the Management Domain of performance and SOL Pass Rates.
P2c: There will be no significant relationship between performance appraisal
ratings in the Assessment Domain of performance and SOL Pass Rates.
P2d: There will be no significant relationship between performance appraisal
ratings in the Professional Domain of performance and SOL Pass Rates.
Data Analysis 2: Correlation (Pearson's r) between domain ratings and SOL Pass Rates.
P3: There will be a significant inverse relationship between Threshold and rating
accuracy; as Threshold decreases, rating accuracy will increase.
P4: There will be a significant positive relationship between Sensitivity and rating
accuracy; as Sensitivity increases, rating accuracy will increase.
Data Analysis 3 and 4: Correlation (Pearson's r) between measure of Rating Accuracy for
each rater and the scale ratings on both Threshold and Sensitivity.
P5: Raters with high levels of inferential accuracy will produce more accurate evaluative
ratings.
Data Analysis 5: Correlation (Pearson's r) between individual raters' evaluation ratings
and SOL Pass Rates for the teachers evaluated; correlation between individuals raters'
evaluation domain ratings and SOL Pass Rates for the teachers evaluated. The value of

67
these correlation coefficients constitutes the measures of Rating Accuracy for each rater,
standardized for further analysis.
Data Analysis 5a: Correlation (Kendall's Tau) between standardized measure of Rating
Accuracy for each rater and the Inferential Accuracy classification for that rater.

CHAPTER IV
RESULTS
OVERVIEW
The methodology for the study, described in Chapter III, delineated three distinct
data sources and types as well as procedures to be used in their analyses. This chapter
contains the results of the data collection and analysis for each of the three types of data
as well as the results of the test of each of the propositions found at the conclusion of
Chapter III.
The chapter is divided into two sections according to the two purposes of the
study. The first section examines the relationship between the performance ratings of
teachers and the SOL Pass Rates of those teachers' students. The strength and direction
of this relationship constitutes the measure of Rating Accuracy. The section contains
descriptive statistics about each pool of data and bivariate correlation analysis between
the two, not only for the entire set of cases but also for each individual rater in the study.
This section contains the findings relative to research Propositions PI and P2.
The second section of the chapter examines the Inferential Accuracy of the raters
and its relationship to Rating Accuracy. The section contains descriptive statistics about
the interview data as well as bivariate correlation analysis between the inferential
accuracy measures and rating accuracy measures. This section contains the findings
relative to research Propositions P3, P4 and P5.

69
RATING ACCURACY
Sulsky and Balzar (1988) defined rating accuracy as the strength and direction of
the relationship between a performance appraisal rating and an external measure of
effectiveness. The exploration of that relationship in this study compares teacher
performance appraisal ratings with the SOL Pass Rates of their students. The first pool of
data, then, is the performance appraisal ratings for the teachers in the study.
Descriptive Statistics
Of 174 performance appraisals exported by the HCS information technology
division, 145 were useful for the study. (Those discarded were ratings for teachers who
did not teach courses with SOL end-of-course tests included in the study.) There are 18
competencies or skills on which teachers are rated, with a point value of 1 to 4 for each.
A rating of 1 indicates an "Unacceptable" level of performance, a 2 indicates that the
teacher "Needs Improvement" in that skill. A 3 is a "Professional" rating, while a 4
indicates an "Exemplary" level of performance.
Overall Performance Ratings:
Although the possible score range for the Overall Rating is 18-72, the actual range
of scores in the study was 39 - 70 (See Graph 1 and Table 3). There is no "default"
rating, but only the "Professional" rating can be given without documentation included; it
is the expected level of performance for teachers in HCS. If the "Professional" rating is
given in all 18 competencies, the total rating is 54, which is, in fact the mean rating (See
Table 3). The lowest score, 39, indicates that a teacher was cited as needing
improvement in 15 of the 18 competencies. The highest score, 70, indicates that the
teacher in question was rated exemplary in 16 of the 18 competencies. These two scores
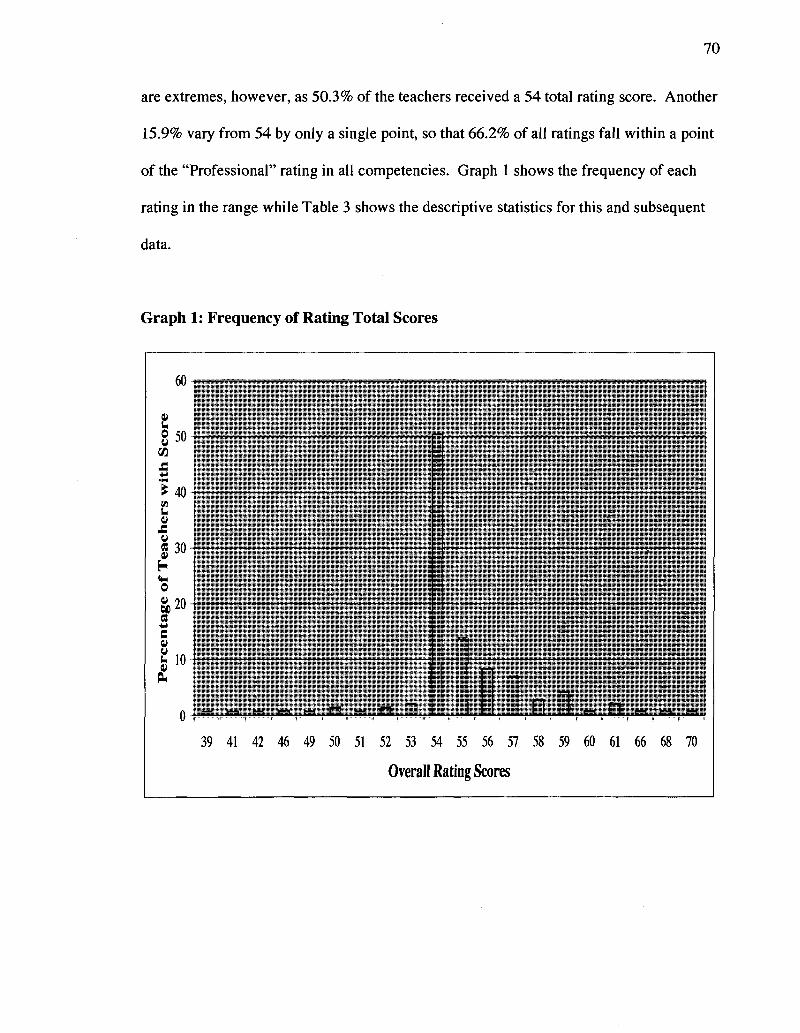
70
are extremes, however, as 50.3% of the teachers received a 54 total rating score. Another
15.9% vary from 54 by only a single point, so that 66.2% of all ratings fall within a point
of the "Professional" rating in all competencies. Graph 1 shows the frequency of each
rating in the range while Table 3 shows the descriptive statistics for this and subsequent
data.
Graph 1: Frequency of Rating Total Scores
60
o u o u 50
* 40 s .
y
H 0 ti
§? c u u V
30
20
10
i — i i — l i — i i — i !-» n i—i n P i 1 1 1 1 1 1 1 1 ! 1 1 1
i
n n 1-1 1. I f - 1 1 1 I—1 i
1 1 1 1 1 1 I I
39 41 42 46 49 50 51 52 53 54 55 56 57 58 59 60 61 66 68 70
Overall Rating Scores
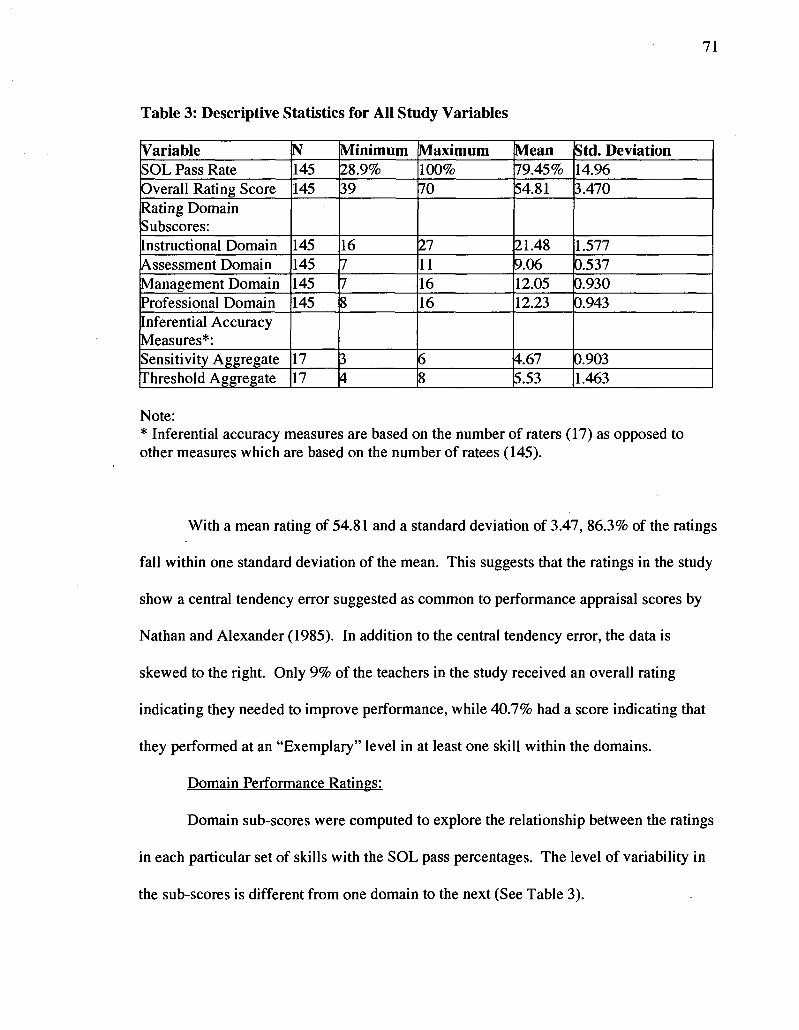
71
Table 3: Descriptive Statistics for All Study Variables
Variable SOL Pass Rate Overall Rating Score Rating Domain Subscores: Instructional Domain Assessment Domain Management Domain Professional Domain Inferential Accuracy Measures*: Sensitivity Aggregate Threshold Aggregate
N 145 145
145 145 145 145
17 17
Minimum 28.9% 39
16 7 7 8
3 4
Maximum 100% 70
27 11 16 16
6 8
Mean 79.45% 54.81
21.48 9.06 12.05 12.23
4.67 5.53
Std. Deviation 14.96 3.470
1.577 0.537 0.930 0.943
0.903 1.463
Note: * Inferential accuracy measures are based on the number of raters (17) as opposed to other measures which are based on the number of ratees (145).
With a mean rating of 54.81 and a standard deviation of 3.47, 86.3% of the ratings
fall within one standard deviation of the mean. This suggests that the ratings in the study
show a central tendency error suggested as common to performance appraisal scores by
Nathan and Alexander (1985). In addition to the central tendency error, the data is
skewed to the right. Only 9% of the teachers in the study received an overall rating
indicating they needed to improve performance, while 40.7% had a score indicating that
they performed at an "Exemplary" level in at least one skill within the domains.
Domain Performance Ratings:
Domain sub-scores were computed to explore the relationship between the ratings
in each particular set of skills with the SOL pass percentages. The level of variability in
the sub-scores is different from one domain to the next (See Table 3).

The Instructional domain revealed a range of actual scores from 16 - 27 and a
mean score of 21.48. If a teacher received a "Professional" rating in all Instructional
competencies, the domain sub-score would be 21, a rating that 60% of the teachers in the
study received. Only 8.3% received a score indicating a need to improve performance.
The Assessment domain had a range of actual scores from 7 - 1 1 and a mean
score of 9.06. 85.5% of teachers were rated at the "Professional" level in all
competencies for this domain with a mere 4.9% receiving an indication of a need for
improvement.
The Management domain showed a range of actual scores from 7-16 with a mean
score of 12.05. 76.6% of teachers were rated at the "Professional" level across the
domain with only 8.3% given a rating indicating a need to improve in this area.
The Professional domain, similar the Management domain, had a range of actual
scores from 8 -16 and a mean score of 12.23. 75.2% of teachers received a
"Professional" rating across the domain while only 3.5% were noted as needing to
improve.
Like the overall rating scores, each of the domain sub-scores shows a strong
central tendency error suggested as common by Nathan and Alexander (1985). The data
are skewed to the right in all four domains with anywhere from two to five times as many
teachers cited for exemplary performance as cited for needing improvement.
SOL Pass Rates
The pass rate of each teacher's students is expressed in percentage and the range
of actual values in the study goes from 28.9% to 100% (See Table 3). The mean pass rate

is 79.45 with a standard deviation of 14.96. There is a great deal of variability in the data
with the largest aggregation of like scores at 4.8% of teachers at the 100% pass rate.
Because there is such wide variability in this data, some points of reference are
helpful in its interpretation. The State of Virginia's expectation for performance is at the
70% mark across the board. This is the minimum standard for successful school
accreditation at present. 73.8% of the teachers in the study produced SOL Pass Rates
above this minimum standard, while 26.2% fell below the minimum.
In contrast to the 26.2% of teachers who fell below the state's minimum pass rate
for accreditation, many performed well above the minimum standard. To render the pass
rate data in a more meaningful format, the researcher collapsed the scores into five
separate performance categories listed below:
• Category 5 - 90-100% pass rate; Exemplary Performance
• Category 4 - 80-89% pass rate; Very Good Performance
• Category 3 - 70-79% pass rate; Acceptable Performance (meets state standards)
• Category 2 - 60-69% pass rate, Performance Needs Improvement
• Category 1 - 59% or below pass rate, Unacceptable Performance
Only 11% of teachers performed at an unacceptable level, while an additional 14%
showed performance that needs improvement to meet state standards. 20% met the
standards with acceptable performance. The most encouraging results are the high
percentages of teachers whose performance was very good to excellent. See Graph 2,
which lists the percentages of teachers in each performance category.

Graph 2: Percentage of Teachers in Each Pass Rate Category
.a w SB W
a s
<u ©
e w u V
0H
35%
30%
25%
20%
15%
10%
5%
0%
11%
26%
2(K*
__14%
2 3 4
SOL Pass Categories
Bivariate Correlations
The first purpose of this study was to measure Rating Accuracy; that is, to
measure the strength and direction of the relationship between the performance appraisal
ratings given to teachers and the pass rates of their students on the SOL end-of-course
tests. The correlation between the Overall Rating and SOL Pass Rate was r = .339 which
was statistically significant at the .01 level (See Table 4). The correlation between the
four domain sub-scores were all statistically significant at the .01 level.

Table 4: Summary of Rating Accuracy Findings
Rating Measure Overall Rating Score Instructional Rating Sub-score Assessment Rating Sub-score Management Rating Sub-score Professional Rating Sub-score
Correlation with SOL Pass Rate r = .339 r = .310 r = .224 r = .357 r = .251
Notes: N=145 For all r-values, p < .01
The correlations in Table 4 reveal a positive and statistically significant
relationship between performance appraisal ratings and SOL Pass Rates in both the
overall rating and in each domain sub-score. Because the Instructional and Management
domains measure skills directly related to classroom performance, it is not surprising that
the correlation levels for the two domain sub-scores are the strongest of the four. It is
interesting to note that the sub-score for the Management domain has the strongest
correlation with achievement. This finding, perhaps, gives credence to the principals
surveyed in the Purser study who stated that management skills were the most important
area of focus in their performance reviews (1990).
The research propositions PI and P2 are related to this section of the study and
are now evaluated according to the findings here.
PI is Not Supported. Although previous studies suggested that there would be no
significant relationship between Overall performance appraisal ratings and SOL Pass
Rates, there is a statistically significant positive correlation between the two measures.

76
P2a-2d are Not Supported. There is a statistically significant relationship between
performance appraisal ratings in each Domain of performance and SOL Pass Rates.
INFERENTIAL ACCURACY
In order to accomplish the second purpose of the study, an examination of the
relationship between each rater's level of Rating Accuracy and that rater's level of
Inferential Accuracy, it was first necessary to calculate the level of Rating Accuracy for
each rater in the study.
Rater Accuracy:
There were 17 raters who completed the 145 total summative evaluations used in
the study. Of the 17 raters, 58.8% were male and 52.9% were Caucasian. They held
from 10 to 37 years of experience in education and from 2 to 28 years of experience in
evaluating teacher performance. Another notable difference among them was the number
of evaluations each was responsible for completing, which ranged from a low of 2 to a
high of 20.
For each rater in the study, the researcher analyzed the correlation between the
rating scores given to teachers evaluated by that rater and the SOL Pass Rates for those
teachers. That correlation was measured using Pearson's correlation coefficient as it was
for the data as a whole. The r-value for each rater was then standardized to a z-score to
allow comparison of rating accuracy to inferential accuracy. The r-values ranged from
-.669, indicating an actual inverse correlation between the rater's evaluation rating and
the SOL Pass Rates, to a 1.0 indicating a perfect positive correlation between ratings and

77
SOL Pass Rates. Because the sample sizes of data were much smaller for individual
raters, however, the statistical significance of the findings was minimized and the
researcher offers a cautionary note to the reader about the interpretation of the values, a
subject which will be explored in detail in Chapter V.
Table 5, shows the rating accuracy of 15 raters, listed from low to high. The
number of evaluations each rater completed is listed as caseload. Two raters are omitted
from the table, Rater #14 and Rater #9. Both had no variability in their rating score data,
i.e., despite rating 4 and 8 different teachers, respectively, they gave each of the teachers
the exact same rating in all 18 competencies. As a result, lacking variability in the
independent variable data, no correlation between rating and SOL Pass Rates can be
calculated.
Table 5: Individual Rater Accuracy Scores
Rater # 3 13 4 6 17 10 2 8 11 16 5 12 1 7 15
Caseload (N) 4 20 15 6 8 19 6 18 11 4 10 4 3 3 2
Pearson's r -.669 .033 .047 .191 .227 .295 .326 .329 .448 .508 .595 .859 .990 .998 1.000

Rater Inferential Accuracy:
Nathan and Alexander (1985) suggested that evaluative judgments, and, hence,
Rating Accuracy of individuals doing performance evaluation could be affected by their
level of Inferential Accuracy, comprised of their Sensitivity to rating norms and their
Threshold to infer consistent patterns of behavior from limited samples of that behavior.
As described in the methodology section of Chapter III, each rater participated in a
structured interview, which lasted approximately one hour. Through this process, the
researcher gained information about his or her level of Sensitivity and Threshold to
measure overall Inferential Accuracy.
Based on their responses (see Appendix B for full structured interview, DCI and
coding protocols), raters were first classified on measures of Sensitivity. There were two
items that were combined to yield the total Sensitivity score. The range of possible
scores on this indicator was 0 - 6 , and the range of actual scores was 3 - 6 . The mean
Sensitivity total was 4.76 with a standard deviation of .903. Based on the descriptive
criteria which generated the Sensitivity scores, raters with Sensitivity scores of 3 or 4
were considered low in Sensitivity and those with a score of 5 or 6 were considered high
in Sensitivity. As a result, 41.2 % of the raters were classified as having low Sensitivity
while 58.8% were classified with a high level of Sensitivity.
Next, raters were classified on measures of Threshold. There were two items that
were combined to yield a total Threshold score. The range of possible scores on this
indicator was 2 - 8 , and the range of actual scores was 4 - 8 . These scores essentially
indicate what percentage of observations a behavior needed to be seen for a rater to infer
a particular behavior consistency. Those with Threshold scores of 4 or 5 are considered

to have a low Threshold for inferring patterns of behavior because they made decisions
based on fewer than 63% of their observations. Those with a score of 6, 7 and 8 are
considered to have a high Threshold for inferring patterns of behavior because they only
made inferences after observing a behavior in at least 75% of their observations. As a
result 47.1% of the raters were classified as having low Threshold while 52.9% were
classified with a high level of Threshold. The mean Threshold total was 5.53 with a
standard deviation of 1.463.
Table 6 shows each rater's Inferential Accuracy (Sensitivity and Threshold)
scores. The table lists the raters in rank order of their Rating Accuracy as drawn from the
standard score. The rank order runs from 1 through 17 with 1 indicating the most
accurate rater, 2 indicating the second most accurate and so forth. The two raters who
had no variability in their ratings, and so had no correlation value or standard score
available, are ranked #15 and #16 in accuracy. This decision is based on the logic that
no calculable correlation is still less inaccurate than an inverse correlation. The rank of
#15 falls to the rater with 4 cases and #16 to the rater with 8 cases based on the logic that
8 cases were more likely to produce performance which should have been differentiable
and noted as such with some variability in the ratings.
The combination of these indicators is helpful because it allows a visual
inspection of the Rating Accuracy in light of the Inferential Accuracy indicators. Based
on the Jackson model (1972), we should see the best Accuracy Ranks for raters with a
combination of high Sensitivity and low Threshold.

80
Table 6: Rater Inferential Accuracy Scores in Rank Order of Rating Accuracy
Rater # 15 7 1 12 5 16 11 8 2 10 17 6 4 13 14 9 3
Caseload (N) 2 3 3 4 10 4 11 18 6 19 8 6 15 20 4 8 4
Accuracy Rank 1 2 3 4 5 6 7 8 9 10 11 12 13 14 15 16 17
Sensitivity 4 4 6 6 3 5 5 6 5 6 5 4 5 4 5 4 4
Threshold 4 5 6 8 4 6 8 4 6
4 5 6 4 8 6 4 6
Bivariate Correlations:
The influence of both Sensitivity and Threshold on Rating Accuracy was
measured in terms of the co-variation between each of the measures and the rating
accuracy as expressed in standard score. Correlation coefficients were calculated using
Kendall's Tau in that the measures for Sensitivity and Threshold are ordinal. The
relationship between Sensitivity measures and Rating Accuracy was positive, as it should
be, but was not particularly strong (r = 0.121). The relationship between Threshold
measures and Rating Accuracy was inverse, which is expected according to the model.
81
Again, however, the relationship was weak (r = - 0.119). The correlation coefficients are
not statistically significant, which is not surprising in that the sample size was only 15.
The model for the influence of Inferential Accuracy requires that the combination
of high Sensitivity with low Threshold be present to constitute high Inferential Accuracy.
The model suggests that raters with high levels of inferential accuracy would have higher
levels of Rating Accuracy than other raters. According to the criteria listed above on the
separate measures of Sensitivity and Threshold, raters were classified as having:
• High Inferential Accuracy = high Sensitivity (5 or 6) + low Threshold (4 or 5),
• Low Inferential Accuracy = low Sensitivity (3 or 4) + high Threshold (6,7 or 8),
• Undetermined Inferential Accuracy / Threshold Dominant = low Sensitivity with
low Threshold, or
• Undetermined Inferential Accuracy / Sensitivity Dominant = high Sensitivity with
high Threshold.
Table 7 shows the Inferential Accuracy classification of each rater in the study. The
raters are ordered from High Inferential Accuracy to Undetermined to Low. The
Undetermined raters are further categorized as Threshold Dominant or Sensitivity
Dominant based on which of the criteria met the standards for Inferential Accuracy
according to the Jackson model. The accuracy rank for each rater is also included on the
table as well as the mean rank for each classification group. Based on the Jackson model,
we would expect to find the best Accuracy Ranks for raters whose Inferential Accuracy
classification is High and the highest mean accuracy rank for that group.

Table 7: Summary of Accuracy Findings
Rater # 8 10 17 4
15 7 5 9
1 12 16 11 2 14
6 13 3
Accuracy Rank 8 10 11 13 10.5 1 2 5 16 6 3 4 6 7 9 15 7.3 12 14 17 14.3
Inferential Accuracy Classification
Mean Accuracy Rank for 1 2T 2T 2T 2T Mean Accuracy Rank for 2T 2S 2S 2S 2S 2S 2S Mean Accuracy Rank for 2S 1 1 1 Mean Accuracy Rank for 1
Note: Inferential Accuracy Rank Indicators: 1 = High 2T = Undetermined/Threshold Dominant 2S = Undetermined/Sensitivity Dominant 3 = Low
The research propositions P3, P4 and P5 are related to this section of the study
and are now evaluated according to the findings here.
P3 is not Supported. While there is an inverse relationship between Threshold and
Rating Accuracy, the strength of that relationship is weak (r = - 0.119), which is not
statistically significant. As Threshold decreases, rating accuracy does not increase.

83
Although Table 6 shows that the 1st and 2nd most accurate raters have low Threshold
scores, raters ranked 13th and 16th in accuracy also have a low Threshold score. The table
also shows that the 3rd and 4th most accurate raters have high Threshold scores rather than
low scores suggested as necessary for accuracy by the Jackson model.
P4 is Not Supported. While there is a positive relationship between Sensitivity and Rating
Accuracy, again, the relationship is weak (r = 0.121), which is not statistically significant.
As Sensitivity increases, rating accuracy does not increase. The data in Table 6 show that
the two most accurate raters have two of the lowest Sensitivity scores, while several
raters classified as having high degrees of Sensitivity have a much lower accuracy
ranking.
P5 is not Supported. Raters classified as high in inferential accuracy did not produce the
most accurate evaluative ratings. The data in Table 7 show the mean Accuracy Rank for
this group of raters was 10.5. As lower ranks indicate better accuracy, the mean score for
this group should be lower than all other groups.

84
CHAPTER V
CONCLUSIONS AND RECOMMENDATIONS
OVERVIEW
The previous chapter presented the findings of the data analyses with respect to
Rating Accuracy and its relationship to Inferential Accuracy. A summary of these
findings is useful here:
1. There is a statistically significant positive relationship between the overall
performance appraisal ratings and student achievement as measured by pass rates
on SOL end-of-course tests. (This finding did NOT support the research
proposition, PI.)
2. There is a statistically significant positive relationship between the domain sub-
scores within the performance appraisal ratings and student achievement as
measured by pass rates on SOL end-of-course tests. (This finding did NOT
support the research proposition, P2.)
3. There is no statistically significant inverse relationship between Threshold and
Rating Accuracy. The relationship is inverse, but not statistically significant.
(This finding did NOT support the research proposition, P3.)
4. There is no statistically significant positive relationship between Sensitivity and
Rating Accuracy. The relationship is positive, but not statistically significant.
(This finding did NOT support the research propositions, P4.)

85
5. There is no statistically significant positive relationship between measures of
Inferential Accuracy and measures of Rating Accuracy. (This finding did NOT
support the research proposition, P5.)
This chapter will first relate the findings of this study to the findings of other
empirical studies on the accuracy of teacher evaluation ratings. Next it will expand the
discussion of these findings from a strict statistical interpretation of the data to the
practical interpretation of the data to present implications and conclusions based on the
findings. A third section presents the limitations of the study. In the subsequent section
is found a discussion the proposed model for the influence of inferential accuracy on
rating accuracy and research evaluating the effect of other influences on rating accuracy.
Finally, a revision of the model is offered for subsequent research.
RELATION OF FINDINGS TO OTHER STUDIES
The nine studies summarized by Coker (1985) which evaluated the accuracy of
principals' ratings of teachers compared with achievement measures for their students
found no significant positive correlation between the two measures. In contrast, this
study did find a statistically significant relationship between Overall Ratings and SOL
Pass Rates.
Coker's own study (1985) reported a very low correlation of principals' ratings
with student achievement measures (r = .20). This study found a stronger and
statistically significant relationship (r = .339), but is quite similar to the Coker study in

86
that the R-squared value (.114) suggests that the correlation explains little of the variance
in the measure of student achievement.
Purser and colleagues (1990) did not measure directly the relationship between
ratings and student outcome measures, but rather reported the accuracy of principals'
classification of teachers as effective or not in contrast to the measures of student
achievement. This study noted that "a flip of a coin would probably classify" teachers as
well as the administrators had (p. 13). Due to the different structure of that study, a direct
comparison to the findings here is difficult, but with the low R-squared value of the
correlation coefficient, the findings are similar, in that little of the student achievement
variance can be explained by the ratings.
Cochran and Mills (1983) found no significant correlation between student scores
and administrator ratings as did Wilkerson et al. (2000) which reported the highest
correlation between principal ratings and student achievement measures as r = .17. The
Gallaher study (2002) found the strongest correlation of all the studies reported (r = .545)
which is much stronger than the correlation found here. The difference between all these
previous studies and this study is the finding of statistically significant correlations.
STATISTICAL VERSUS PRACTICAL SIGNIFICANCE
Based on the conclusions of 14 previous studies, the first research proposition in
this study maintained that there would be no significant relationship between overall
performance appraisal ratings and SOL Pass Rates, in essence, that there would be no
accuracy in the ratings when compared to student achievement measures. Because the
relationship between those measures was found to be statistically significant, the research

87
propositions were not supported. In a practical sense, however, the ratings in this study
cannot be interpreted as accurate based on the data.
There are numerous reasons for this conclusion. The first is the lack of a linear
relationship between the variables. The scatter-plot graph which follows allows a clear
conclusion that, despite the findings of statistical significance, there is no relationship of
practical significance between Overall Rating Scores and SOL Pass Rates. It is clear that
the most common rating, a 54, which indicates that the teacher performed at a
professional level in all 18 competencies was given to teachers with a wide range of SOL
Pass Rates.
A teacher with an SOL Pass Rate of 44.8% received the same professional rating
as a teacher with a 100% pass rate! The nearly solid line of SOL Pass Rate values along
the 54 rating mark make clear that the expected co-variation of rating score and pass rate
does not exist. A similar vertical array of ratings is seen in the subsequent values as one
goes up the rating scale. No discernable linear measure between the two ratings is
visible.
The finding of a statistically significant positive relationship between the two
measures is not in error, however. The examination of the mean rating data in each SOL
pass category allows one to conclude that there is some co-variation in the data (See
Table 8). The mean rating does increase as the SOL Pass Rate Category increases. The
mean increase is so slight, however, as to have no practical significance when one
interprets the data. The range of ratings show that many teachers whose performance
falls well below state accountability standards (Categories 4 and 5) still receive
professional and, sometimes, exemplary ratings in their performance appraisals.

88
Graph 3: Scatter-plot of Overall Ratings x SOL Pass Rates
100 ,
90 J
80
70
| 60 s u
P< 50 VI
« CM
O 40 03
30
20
10 J
0
• A *
V*
36 38 40 42 44 46 48 50 52 54 56 58 60 62 64 66 68 70
Overall Rating Score
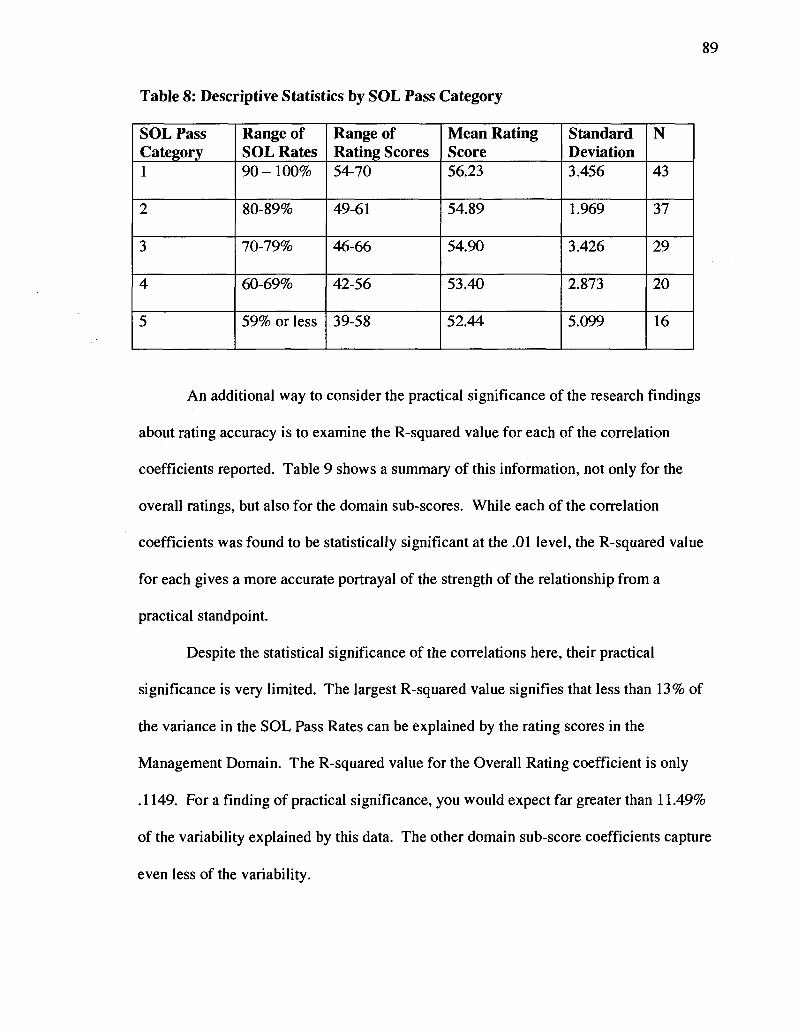
89
Table 8: Descriptive Statistics by SOL Pass Category
SOL Pass Category 1
2
3
4
5
Range of SOL Rates 90-100%
80-89%
70-79%
60-69%
59% or less
Range of Rating Scores 54-70
49-61
46-66
42-56
39-58
Mean Rating Score 56.23
54.89
54.90
53.40
52.44
Standard Deviation 3.456
1.969
3.426
2.873
5.099
N
43
37
29
20
16
An additional way to consider the practical significance of the research findings
about rating accuracy is to examine the R-squared value for each of the correlation
coefficients reported. Table 9 shows a summary of this information, not only for the
overall ratings, but also for the domain sub-scores. While each of the correlation
coefficients was found to be statistically significant at the .01 level, the R-squared value
for each gives a more accurate portrayal of the strength of the relationship from a
practical standpoint.
Despite the statistical significance of the correlations here, their practical
significance is very limited. The largest R-squared value signifies that less than 13% of
the variance in the SOL Pass Rates can be explained by the rating scores in the
Management Domain. The R-squared value for the Overall Rating coefficient is only
. 1149. For a finding of practical significance, you would expect far greater than 11.49%
of the variability explained by this data. The other domain sub-score coefficients capture
even less of the variability.

Table 9: R-squared values for Rating Accuracy Coefficients
Rating Measure
Overall Rating Instructional Rating Sub-score Assessment Rating Sub-score Management Rating Sub-score Professional Rating Sub-score
Correlation with SOL Pass Rate r=.339
r = .310
r = .224
r = .357
r = .251
R-squared value
.1149
.0961
.0501
.1274
.0630
Notes: N = 145 p = .01
Previous studies stressed the practical significance of the data rather than the
statistical significance. The rating accuracy measures reported above fall in line with
those reported in previous studies, which ranged from a low of r =. 09 (Wilkerson, et al.,
2000) to a high of r = .545 (Gallaher, 2002). These r -values are regarded as reflecting a
very low level of rating accuracy in the conclusions reported by the authors. Reporting a
49.34% accuracy level for Principals' classifications of teacher performance, Purser
stated that "a flip of a coin" would be a better method for making conclusions about
effectiveness. The practical conclusion here, then, is that, as predicted by the previous
studies, there is no meaningful relationship between either the overall rating scores and
the SOL Pass Rates or the domain sub-scores and the SOL Pass Rates.
The Rating Accuracy data on individual raters also allow for misleading
conclusions, not only with respect to statistical significance, but practical significance as
well. It is encouraging that, unlike the Coker study (1985), when the researcher could

91
find no raters whose accuracy was greater than others in order to study the differences
between them, raters in this study had great differences in their levels of rating accuracy.
Unfortunately, like the overall data on rating accuracy, the data on individual raters is
very misleading in a few instances. Rater 15 is the most prime example. The data from
Table 5 is repeated here to allow easy reference.
Table 5: Individual Rater Accuracy Scores (repeated)
Rater # 3 13 4 6 17 10 2 8 11 16 5 12 1 7 15
Caseload (N) 4 20 15 6 8 19 6 18 11 4 10 4 3 3 2
Pearson's r -.669 .033 .047 .191 .227 .295 .326 .329 .448 .508 .595 .859 .990 .998 1.000
For Rater 15, the perfect correlation between ratings and SOL Pass Rates is
judged by statistical examination to be significant at the .01 level. This may be true.
There is, in fact, a perfect positive co-variation between the two measures for this rater.
The rater had two teachers to evaluate and the teacher with the higher SOL Pass Rate did

92
receive a higher performance rating. An examination of the actual values of those data,
however, call into question the conclusion that there is any rating accuracy at all.
Teacher number one was given a rating of 54 (professional in all competencies)
with an SOL Pass Rate of 60%. Teacher number two was given a rating of 56
(exemplary in 2 of 18 competencies) with an SOL Pass Rate of 96.1%. Obviously, the
performance of the teachers is vastly different in terms of student achievement, but their
ratings only differed by two points. In addition, a teacher with an unacceptable SOL Pass
Rate was given "professional" marks across the board. The same scenario is present in
the individual ratings of many of the raters in the study who gave teachers with sub
standard performance a rating which indicated "professional" or even "exemplary" levels
of performance. Of the 36 teachers whose SOL Pass Rates were below the state
minimum of 70%, only 6 had ratings which indicated a need to improve performance. 21
had a rating indicating "professional" performance in all areas, while 8 were cited with
"exemplary" performance in at least one competency.
While the requisite co-variation in measures may be present in many cases, the
mismatch of "professional" or even "exemplary" ratings with student achievement rates
that fall below state standards calls into question the practical significance of the findings
here. In addition, the low R-squared value of the correlation measures calls into question
the practical significance of the findings despite their statistical significance.
LIMITATIONS OF STUDY
The limitations of this study fall into two areas, the number of rater participants
and the measurement procedures for inferential accuracy components.

93
Number of Rater Participants
Although the group of raters in the study comprised the entire population of raters
of teachers who met the criteria for inclusion in the study, the limited size of the group,
17 total, limited the power of the statistical analysis of the data they generated. With
respect to generalizing the results of the study, the makeup of the group was good. The
number of males and females was comparable as was the number of African-American
raters to white raters. There was a wide range in years of experience, both in teaching
prior to becoming an administrator and in years of rating experience as an administrator.
There was also a wide range in subject disciplines taught by the raters prior to becoming
administrators. Some raters had experiences only in Hampton City Schools, but many
had experience in at least one other school division. The make-up of the rater group,
then, is not the limitation of the study but rather the number in the group. Unfortunately,
all eligible raters were part of the study so the number could not be increased.
Measurement Procedures
The next limitation of the study was the measurement of Inferential Accuracy
components. The Structured Interview Questions and DCI were carefully formulated
according to GAO protocols, were reviewed by experts, were piloted and revised as
necessary prior to data collection, but there are two prevailing concerns with respect to
this data.
The first concern is the accuracy of the rater responses, despite procedural
safeguards to increase and gauge the accuracy of responses. The first safeguard was in
question construction. The questions were behaviorally based, asking raters to recall
94
specific behaviors rather than tendering hypothetical situations to which they would offer
an answer about how they would likely respond in a situation. The use of behaviorally
based questions is now common practice in interviews and thought to produce a more
accurate picture of performance than hypothetical questioning. The second safeguard
was in gauging the accuracy of response. In this judgment, a legal standard used to judge
truthfulness was applied to rater responses: the presence of statements against self-
interest. Individuals who make admissions about behavior against self-interest are judged
as reliable in legal settings Aguilar v. Texas. (1964). In this study, many raters admitted
making inaccurate ratings in a variety of circumstances. By the legal standard, then, their
responses would be judged as reliable.
Reliability, however, does not ensure accuracy. There seemed to be no relation
between some responses given by raters and their behavior as evidenced by the data.
They were thoughtful in generating responses, made statements against self-interest, and
seemed earnest in their belief in the truthfulness of responses offered, but the data did not
support some of their statements. For example, one rater reported no difficulty in having
the discussions about negative performance with individuals following low ratings on
evaluations. He acknowledged that they were not pleasant, but were a necessary part of
the job. Inspection of the rating data for this rater revealed that no teacher he had rated
had ever been given a low rating, not even in a single competency. Therefore, the
difficult discussions cited in the response to the question, had never occurred as reported.
There were other similar examples, where raters stated they often gave an "exemplary"
rating in a skill to balance a negative mark elsewhere on the evaluation in the hope of
preserving teacher morale. An inspection of the data revealed no negative ratings in one

95
case, and no balancing "exemplary" ratings in another case. While these few findings do
not render the data unusable, they do suggest that raters' perception of their own
behaviors may not always be accurate.
The second concern with respect to the data is the sensitivity of the scales for
measures of Inferential Accuracy. Measures of both components of Inferential Accuracy,
Sensitivity and Threshold, were gathered with questions limited to four responses.
Although the number of response choices is in the midrange of the suggested number of
responses according to GAO protocol, an increase of choices may have enriched the
variability of the data for analysis.
STRENGTH OF THE INFERENTIAL ACCURACY MODEL
Because there were only 17 raters in the study, it is not surprising that the
correlation values between Inferential Accuracy and Rating Accuracy were not
statistically significant. The strength of the relationship was so weak, however, that the
values suggest no practical significance either. The correlation coefficient measuring the
relationship between Inferential Accuracy (the combination of both Sensitivity and
Threshold) and Rating Accuracy was only .047; very near a finding of no relationship at
all. The correlation values for Sensitivity and Threshold are stronger (r = .121 and
r = -.119) respectively, but these are still so weak as to explain only 1% of the variance in
Rating Accuracy for the raters.
Based on the results of this study, Nathan and Alexander's (1985) application of
Jackson's model of Inferential Accuracy (1972) to performance appraisal is not a good
fit. In some ways, this result could have been anticipated. First, Jackson never suggested

that Inferential Accuracy be applied to performance appraisal ratings. His model and
subsequent studies testing the model were an attempt to explain the success (or lack
thereof) of psychiatrists and psychologists in making correct diagnoses of mental
disorders. This diagnostic process is simpler than performance appraisal in that the
psychiatrist or psychologist must detect the presence or absence of a condition rather than
rating it by degrees as in performance evaluation.
In addition, diagnostic criteria for major mental disorders, which were the focus
of the Jackson studies, are well established, documented and taught to practitioners
making diagnoses. There is much less agreement or established evidence about what
constitutes good job performance, especially in the teaching profession where research
suggests that teaching strategies must be changed dependent on the characteristics of the
learners addressed (Marzano, Pickering and Pollock, 2001). Hence, performance
appraisal here is far more complicated in that the rater must first discern what skill set is
applicable, then must rate the teacher on those requisite skills.
Finally, the Jackson model did not address the effects of other factors on
Inferential Accuracy. In a clinical setting, where the sole focus is accurate diagnosis of
mental illness, the clinician has no relationship with the patients to preserve, no concern
about the patients' morale with respect to the diagnosis, and no competing task demands
other than diagnosis. As diagnosis is the primary task, there is an assumption that
motivation for accurate diagnosis is present. These and other factors do have an effect on
performance appraisal in an organizational setting as was suggested by Nathan and
Alexander (1985).
97
OTHER FACTORS INFLUENCING RATING ACCURACY
Given the suggestion by Nathan and Alexander (1985) that influences found in
an organizational setting might have an effect on rating accuracy as well as the findings
of numerous empirical studies exploring the influence of other factors (see Table 1), an
investigation of those effects was included in the research for this study. In addition to
Sensitivity and Threshold, the data collected in the structured interview rendered
measures for four potential influences on rating accuracy: Motivation, Constraints,
Morale, and Emotional Concerns. Individual measures were taken for each of the four
areas and then an aggregate score for each was entered. Although the relationship
between each item and Rating Accuracy was analyzed, the aggregate score for each of
the four factors showed the strongest relationship to Rating Accuracy and so is reported
here.
Factor Measurement
The Motivation Aggregate score measured the influence of four different factors
affecting raters' motivation to be accurate when making ratings. These factors, related to
motivation, were suggested by previous research as having a possible impact on rating
accuracy. (Mero, Motowidlo, and Anna, 2003; Salvemini, Reilly and Smither,1993) The
four factors were:
• The raters' perception of the relation of the competencies measured by the
summative evaluation to student achievement
• The raters' perception of the relation of the evaluation process to teacher
performance improvement
• The raters' perception of their accountability to superiors for making accurate
ratings
• The raters' perception of the necessity for accurate ratings on the summative
evaluation to facilitate teacher dismissal
The Constraint Aggregate score measured the influence of processes and
organizational factors on rating accuracy. The instrument captured data on the influence
of constraints suggested by prior research (Murphy, Philbin, and Adams, 1989; Nathan
and Alexander, 1985) as well as focus group responses in the development of the
Structured Interview questions. The constraints measured were:
• The requirement for additional documentation for high or low performance
ratings and teacher improvement plans
• The constraint of limited time to complete teacher observations and evaluations
• The constraint of negative performance ratings on teacher motivation to improve;
the effectiveness of documenting behavior on the summative
• The concern about teacher shortages
• The concern about differences in class makeup
The Morale Aggregate score measured the influence of concerns about individual
teacher morale and building climate on rating choices. Several studies suggested these
factors as having an impact on the accuracy of ratings (Hauenstein, 1992; Nathan and

Alexander, 1985; Robbins and DeNisi,1994). There were three different indicators of the
concern for morale:
• Balancing a negative rating in one competency with an exemplary rating in
another to preserve morale
• Using the summative evaluation as a means of rewarding teachers for effort
• Avoiding negative ratings to preserve teacher morale
The Emotional Aggregate score measured the influence of emotional barriers to
accuracy such as concern for hardship in a teacher's life or difficulty in delivering
negative performance information. Prior research discussed the possible influences of
emotional considerations (Hauenstein,1992; Nathan and Alexander, 1985) and these
factors were also discussed in the focus group as having a possible influence. The three
factors relating to emotional concerns were:
• The concern for affecting the livelihood of a colleague with a negative evaluation
• The avoidance of having to discuss a negative performance rating
• The concern for hardship in a teacher's life, such as the death of a loved one,
serious illness or divorce
Findings: Descriptive and Bivariate Statistics
As shown in Table 10, the range of possible scores on the motivation aggregate
measure was 0 -17. The range of actual scores was 5 - 16. The mean score was 10.55
with a standard deviation of 3.176. The relationship of the motivation aggregate value to
the Rating Accuracy measure, was .077, a weak relationship with no statistical
significance.

100
Table 10: The Influence of Other Factors on Rating Accuracy
Factor Aggregate Motivation Constraints Morale Emotional
Minimum 5 1 0 0
Maximum 16 7 8 3
Mean 10.55 3.79 2.24 0.88
Correlation with Rating Accuracy
0.077 -0.104
0.323 0.113
Notes: N=17
The range of possible scores on the constraint aggregate measure was 0 - 1 6 . The
range of actual scores was much more limited at 1 - 7. Very few raters reported being
constrained from making accurate performance appraisals by the requirement for
documentation, the concern about teacher shortages or the differences in the makeup of
classes from teacher to teacher. The two primary factors reported as constraining by
raters were limited time and the perception that accurate performance ratings were not the
most effective means to improve teacher performance. The mean score in this aggregate
was 3.794 with a standard deviation of 2.008.
The relationship of the constraint aggregate value to the Rating Accuracy
measure, was again weak with r = - 0.104, a value with no statistical significance. The
inverse relationship is the logically expected direction of association in that rating
accuracy should go down as constraints rise.
Few raters expressed the possibility that their ratings were affected by concerns
about teacher morale. The highest percentage of positive responses to any question was
41%. The range of possible scores was 0 - 9 while the range of actual scores was 0 - 8 .
Nearly half the raters (47.1%) had a score of 0 while the rest were spread fairly evenly

101
along the scale. The mean morale aggregate score was 2.24 with a standard deviation of
2.682. The direction of the relationship between the morale aggregate and Rating
Accuracy was opposite to expectations. As concern for morale increases, one expects
rating accuracy to decrease, but there was a positive, though somewhat weak correlation
between the two with r = .323 with no statistical significance.
Very few raters expressed being influenced by the emotional factors mentioned in
the interview. No rater expressed a concern about having to dismiss a teacher and only
two expressed the possibility of being influenced by a desire to avoid conflict. Just over
a third (35.2%), however, did report having ratings influenced by a concern over hardship
in a teacher's life. The range of possible scores on the emotional aggregate was 0-9. The
range of actual scores was very low at 0 - 3. 58.8% of raters had a score of 0 in this area.
The mean score was 0.88 and the standard deviation was 1.219. The relationship
between the Emotional aggregate and Rating Accuracy was very weak with an r-value of
0.113, which has no statistical significance.
The primary reason for the measurement of the influence of other factors on
rating accuracy was the suggestion by Nathan and Alexander (1985) that other influences
could counter the effects of inferential accuracy on ratings, a sentiment echoed by
Hauenstein with respect to organizational constraints having the power to counter the
effects of motivation (1992). Thus, the test of the model of inferential accuracy would
not be complete without the exploration of the influence of these other factors on rating
accuracy and the test to see if they could have counteracted the effect of Inferential
Accuracy on Rating Accuracy.

102
This final test was accomplished by measuring the correlation between the
Inferential Accuracy measures and Rating Accuracy measures while controlling for the
other factors. While the partial correlation values yielded by controlling for the four
other factors were not statistically significant, they are noteworthy. With controls, the
strength of the relationship between Rating Accuracy and Sensitivity increased from
0.121 to 0.335. The strength of the relationship between Rating Accuracy and Threshold
was increased from - 0.119 to - 0.624 (the inverse direction is predicted by the model).
Finally, the relationship between the Inferential Accuracy Rank and Rating Accuracy was
strengthened by the controls from .047 to 0.267.
Interpretation of Findings
With controls, the correlation coefficient measuring the relationship between
Inferential Accuracy (the combination of both Sensitivity and Threshold) and Rating
Accuracy was increased from .047 to .267, a value with neither statistical nor practical
significance. Even with the increased strength provided by the control factors, the
Inferential Accuracy Rank only explains 7.1% of the variance in Rating Accuracy among
raters (R-squared = .071). Thus, even controlling for other factors, there is no evidence
from this study to support the application of Jackson's Inferential Accuracy model to the
explanation of rating accuracy in performance appraisal without modifications.
With controls for other factors, the correlation coefficient between Sensitivity and
Rating Accuracy increased from .121 to only .335. While the increase is notable, the R-
Squared value, again, suggests that Sensitivity levels offer little explanation of Rating
Accuracy. In contrast, with controls for other factors, the correlation coefficient between

Threshold and Rating Accuracy was strengthened substantially from -.119 to -.624. The
R-squared value is .389, indicating that, with controls for other factors, this Threshold
measure explains nearly 40% of the variance in the Rating Accuracy measures. While
this figure has no statistical significance, it suggests there is practical significance to that
portion of Jackson's model when other factors are controlled.
In light of the research on the effect of automatic versus controlled processing in
rating accuracy, the substantial relationship between Threshold and rating accuracy
makes sense. Raters with low Thresholds, that is, the willingness to infer behavior
consistencies from limited observations of behavior are forming evaluative judgments
automatically, while raters with higher Thresholds focus on documenting the consistent
patterns of behavior necessary to make their evaluative judgments. Raters using
automatic rather than controlled processing have been found to make more accurate
ratings (Sulsky and Day, 1992, Williams, Cafferty, and DeNisi, 1990a). In applying
Jackson's concept of Threshold to which type of processing is being used in the manner
described above, this portion of the study seems to support previous findings.
RECOMMENDATIONS FOR FUTURE RESEARCH
While the analysis of this data does not support the application of the full Jackson
model of Inferential Accuracy to performance appraisal, the results indicate that a portion
of the model may be helpful in explaining differences in Rating Accuracy. The primary
recommendation for further research is a call for the replication of portions of this study,
eliminating or reducing as many of the limitations as possible and testing a new model

which combines the influence of Jackson's concept of Threshold with controls for the
influence of other factors present in an organizational setting.
Future studies should first seek to eliminate a primary limitation found here by
targeting a larger group of raters than was available in this field study. Researchers
would likely need to conduct a field study in a school division with a much larger student
population, ideally one with 15 - 20 high schools which should, dependent on the
structure of responsibilities for administrators, yield a rater pool 4 to 5 times larger than
the pool in this study. An additional suggested requirement for a future study would be
the exclusion of raters who evaluated less than 4 teachers. The data in this study showed
that data from raters who evaluated only 2 or 3 teachers can yield correlation coefficients
that are highly misleading.
A replication study should also enhance the measures for inferential accuracy to
make them more sensitive. The number of scalable responses on this instrument, four,
was at the midpoint of the range suggested by the GAO manual. While that document
issues a caveat for the use of the maximum number of responses, seven, it is suggested
here that the maximum be used to increase the variability in the response data. Some
respondents in this interview process spent significant amounts of time pondering the
choices, suggesting they might have been having difficulty "fitting" themselves to a
particular scaled response. An increase in choice of responses may have alleviated this
difficulty and increase the accuracy of response while also increasing the variability of
the data.
A further recommendation for the modification of a replication study is to initiate
a review of ratings with each rater prior to the structured interview. One limitation cited

105
in the section above is the questionable accuracy of the information given by raters about
their rating behaviors. In more than one instance, raters commented about rating
behavior that, according to the data, did not occur in the past three years of their rating
practice. It is not the opinion of this researcher that the respondents were being
deceptive, but rather that they did not have an accurate recollection of their own rating
behavior. It may be helpful, therefore, to have raters examine the data on ratings they
have completed during the time period under study. This would allow them to see how
many "Exemplary" or "Needs Improvement" ratings they had actually given and would
allow them to contemplate the influences on their rating behavior more thoroughly. The
data should not include the SOL outcomes for the teachers in question because that data
could easily generate discussions about rating accuracy, which should not be included in
the interview.
The most important of the changes suggested for a subsequent study is the
revision of the model for testing (see Figure 4). The first significant change is the shift
from the two-component Inferential Accuracy model posited by Jackson (1972) to a
model which focuses on the single component of Threshold as the intervening variable in
Rating Accuracy. This revision is suggested first because sensitivity was not strongly
related to Rating Accuracy even with controls for other influences. It is also suggested
because current practices in performance evaluation may remove the need for sensitivity
because performance indicators, behaviorally anchored rating scales, and behavior
summary scales all readily available to the rater remove the need for a ready command of
this information to make evaluative judgments.

Figure 4: Revised Model of Influences on Rating Accuracy
THRESHOLD
Influence of
Constraints
Influence of
Motivation
^
w
4 ^
M
^
Influence of Concern for Morale
Influence of Emotional Concerns
RATING ACCURACY Measured by comparison
with SOL Pass Rates
The other significant change in the model is the addition of controls for other
factors which have an influence on Rating Accuracy in an organizational setting.
Reference to the potential effects of these other factors is made in a variety of empirical
studies cited in Chapter II and their influences are substantiated by the results of this
study. The model thus calls for controls for all four factors measured in this study.
Although the influence of each of the factors (Motivation, Constraints, Morale and
Emotional) on the effect of Threshold was relatively small in isolation, the control for all
four in combination generated a substantial increase in the correlation between Threshold
and Rating Accuracy. The results of this study suggest the importance of testing the new
model as well as the value of conducting performance appraisal research in a field
setting, where the influence of factors present in an organization can be assessed and the
results applied to improvements in the process.

BIBLIOGRAPHY
Aguilar v. Texas, 378 US 108 (1964)
Balzer, W. K. (1986). Biases in recording of performance-related information: The effects of initial impression and centrality of the appraisal task. Organizational Behavior and Human Decision Processes, 37, 329-347.
Berk, R. (1984) "The Use of Student Achievement Test Scores as Criteria for Allocation of Teacher Merit Pay" ED# 251480
Brophy, J. and Good, T. (1986) Teacher behavior and student achievement. In M. Whittrock (Ed.), Handbook of research on Teaching (p.p. 328-375). New York: Macmillan
Cochran, J., and Mills, C. (1983) "Teacher Effectiveness as Measured by Student Performance on the English Language Proficiency Test." ED# 246664
Coker, H. (1985) "A Study of the Correlation between Principals' Ratings of Teacher Effectiveness and Pupil Growth" ED# 259460
Cook, M. and Richards, H. (1972) "Dimensions of principal and supervisor ratings of teacher behavior." Journal of Experimental Education, v. 41 (2), 11 - 14.
DeNisi, A., Cafferty, T. and Meglino, B. (1984) "A Cognitive View of the Performance Appraisal Process: A Model and Research Propositions" Organizational Behavior and Human Performance, v. 33, 360-396.
DeNisi, A. and Peters, L. (1996), "Organizations of information in memory and the performance appraisal process" Journal of Applied Psychology, v. 81 (n 6), 717-737.
Feldman, J. (1986) "Instrumentation and Training for Performance Appraisal: A perceptual-Cognitive Viewpoint" Research in Personnel and Human Resources Management, v. 4,45-99.
Foddy, W. (1993) Constructing Questions for Interviews and Questionnaires NY, NY: Cambridge University Press
Furtwengler, C. (1987) "Use of Student Achievement Information in the Performance Evaluation of Teachers in the Tennessee Career Ladder Program. ED# 311053
Gallaher, H. (2002) "The Relationship between Measures of Teacher Quality and Student Achievement: The case of Vaughn Elementary." ED# 468254

Government Accounting Office (June 1991) Using Structured Interview Techniques GAO Publication PEMD-10.1.5
Hammond, K. (1981) Principals of organization in intuitive and analytical cognition. (Report No. 231, Center for Research on Judgment and Policy). Boulder, CO: Institute for Behavioral Science, University of Colorado.
Hauenstein, N. (1992) "An information processing approach to leniency in performance Judgments." Journal of Applied Psychology, v. 77, 485 - 493.
Highhouse, S. and Gallo, A. (1997) "Order Effects in Personnel Decision Making" Human Performance, v. 10 (1), 31-46.
Hogarth, R. and Einhorn, H. (1992) "Order effects in belief updating: The belief-adjustment model." Cognitive Psychology, v. 24,1-55.
Ilgen, D., Barnes-Farrell, J., and McKellin, D. (1993) "Performance appraisal process research in the 1980's: What has it contributed to the appraisals in use?" Organizational Behavior and Human Decision Processes, v. 54, 321-368.
Jackson, D. (1972) "A model for inferential accuracy" Canadian Psychologist, v. 13 (3), July 1972,185 - 195.
Koch, James V. (2003) "A 4-point plan for improving public schools" in Daily Press. November 16, 2003, section K.
Kulik, C. and Ambrose, M. (1993) "Category-based and feature-based processes in performance appraisal: Integrating visual and computerized sources of performance data." Journal of Applied Psychology, v. 78 (5), October 1993, 821-830.
Littleton, M. (2000) Accountability in Teacher Education: Systems and Trends. ED #441 021
Marzano, R., Pickering, D. and Pollock (2001) Classroom Instruction that Works. Alexandria, VA: Association for Supervision and Curriculum Development
Medley, D. and Coker, H. (1987) "The accuracy of principals' judgments of teacher Performance." Journal of Educational Research, v. 80 (n 4), 242 - 247.
Mero, N. Motowidlo, S. and Anna, L. (2003) "Effects of accountability on rating behavior and rater accuracy." Journal of Applied Social Psychology, v. 33(12) Dec, 2493-2514.
Motowidlo, S. J. (1986) "Information Processing in Personnel Decisions" Research in Personnel and Human Resources Management, v. 4, 1-44.
Murphy, K. and Cleveland, J. (1991) Performance Appraisal: An Organizational Perspective. Needham Heights, MA: Allyn and Bacon Publishers
Murphy, K., Philbin, T., and Adams, S. (1989). Effect of purpose of observation on accuracy of immediate and delayed performance ratings Organizational Behavior and Human Decision Processes, 43, 336-354
Nathan, B and Alexander, R. (1985) "The role of inferential accuracy in performance rating" Organizational Behavior and Human Decision Processes, v. 50 (2), Dec 1991, 300- 323.
Peterson, K. D. (2000) Teacher Evaluation: A Comprehensive Guide to New Directions and Practices. Thousand Oaks, CA: Sage Publications
Purser, S. et al. (1990) "The Relationship Between Secondary Principals' Evaluation Of Teachers and Pupil Achievement". ED #322630
Redfield, D. (1987) "A Comparison the Perspectives of Teachers, Students, Parents, and Principals Concerning the Influences of Teaching on Students and the Use of Student Outcomes to Evaluate Teaching." ED# 290765
Reed, P. and Jackson, D. "Clinical judgement of psychopathology: A model for inferential accuracy." Journal of Abnormal Psychology, v. 84 (5), October 1975, 475-482.
Rice, J. K. (2003) Teacher Quality Washington, D.C.: Economic Policy Institute
Robbins, T. and DeNisi, A. (1994) "A closer look at interpersonal affect as a distinct influence on cognitive processing in performance evaluations." Journal of Applied Psychology, v. 79, 341-353.
Salvemini, Nat J; Reilly, Richard R; Smither, James W. "The influence of rater Motivation on assimilation effects and accuracy in performance ratings." Organizational Behavior and Human Decision Processes. Vol 55(1) Jun 1993, 41-60.
Spychalski, A. (1997) "Effects of processing method, performance pattern and time pressure on performance ratings." Dissertation Abstracts International, 58, no. 03B: 1580
Stronge, J. and Tucker, P. (2002) Teacher Evaluation and Student Achievement. ED# 460 075.
Struening, E. and Guttentag, M. (1975) Handbook of Evaluation Research Beverly Hills, CA: Sage Publications

110
Sulsky, L. and Balzer, W. (1988) "Meaning and measurement of performance appraisal Accuracy." Journal of Applied Psychology, v. 73,497 - 506.
Sulsky, L. and Day, D. (1992) "Frame of Reference Training and Cognitive Categorization: An empirical investigation of rater memory issues" Journal of Applied Psychology, v.77 (4), 501-510.
Virginian-Pilot Staff. (2004, Feb) "Pinpointing best teachers could pay dividends." Virginian-Pilot, p. J4
Wilkerson, D., Manatt, R., Rogers, M. and Maughan, R. (2000) "Validation of Student, Principal, and Self-Ratings in 360 Degree Feedback for Teacher Evaluation" Journal of Personnel Evaluation in Education; v. 14 (n.2), 179-192.
Williams, K., Cafferty, T. and DeNisi, A. (1990) "The effect of performance appraisal salience on recall and ratings." Organizational Behavior and Human Decision Processes. V. 46 (2), Aug 1990, 217 - 239.

I l l
APPENDIX A
HAMPTON CITY SCHOOLS PERFORMANCE EVALUATION DOCUMENT
INSTRUCTIONAL DOMAIN
1-1 The teacher demonstrates current and accurate knowledge of subject matter covered in the curriculum.
Performance Indicators for 1-1
a) The teacher exhibits an understanding of the subject areas taught.
b) The teacher demonstrates skills relevant to the subject area.
c) The teacher utilizes a variety of resources in the subject area.
d) The teacher demonstrates an ability to make topics and activities meaningful and relevant to each student.
e) The teacher exhibits/demonstrates an understanding of technology skills appropriate for grade level/subject matter.
Behavior Summary Scale 1-1 Exemplary The teacher seeks and exhibits high level of knowledge of subjects) taught and continually updates curriculum.
Professional The teacher demonstrates current and accurate knowledge in subject matter covered in the curriculum.
Needs Improvement The teacher lacks comprehensive knowledge of subject (s) taught or does not stay current with curriculum.
Unsatisfactory The teacher demonstrates severe deficiencies and knowledge of subject(s) taught and does not stay current or follow the curriculum.
1-2 The teacher plans instruction to achieve desired student learning objectives that reflect current division curriculum.
Performance Indicators for 1-2 a) The teacher selects student objectives for lessons consistent with division guidelines and curriculum.

112
b) The teacher selects learning activities for lessons consistent with division curriculum and student needs.
c) The teacher develops lesson plans that are clear, logical, and sequential.
d) The teacher plans purposeful assignments for teacher assistants, substitute teachers, student teachers, and others.
Behavior Summary Scale 1-2 Exemplary The teacher uses variety of resources in planning and does extensive planning so that appropriate curriculum objectives, learning activities and lesson plans ensure active learning of all students.
Professional The_teacher plans instruction to achieve desired student learning objectives which reflect current division curriculum.
Needs Improvement The teacher frequently plans instruction which does not focus on student learning and/or does not follow the division curriculum.
Unsatisfactory The teacher lacks knowledge of lesson planning strategies and /or almost never plans adequate lessons.
1-3 The teacher uses materials and resources compatible with students' needs and abilities that support the current division curriculum.
Performance Indicators for 1-3 a) The teacher selects a variety of materials and media that support the curriculum.
b) The teacher integrates available technology into the curriculum.
c) The teacher selects materials and media which match learning styles of individual students.
d) The teacher ensures that materials and media are appropriate and challenging for instructional levels.
e) The teacher uses materials, media, and equipment that motivate students to learn.
Behavior Summary Scale 1-3 Exemplary The teacher selects, creates, and uses a wide variety of materials and resources and creatively applies these resources to meet student needs, increase student involvement, and extend the current division curriculum.
Professional The teacher uses materials and resources compatible with students' needs/abilities and which support the current division curriculum.

113
Needs Improvement The teacher sometimes uses materials and resources that are incompatible with student needs/abilities and/or which do not support the current division curriculum.
Unsatisfactory The teacher frequently uses materials and resources incompatible with student needs/abilities and which do not support the current division curriculum.
1-4 The teacher links present content/skills with past and future learning experiences, other subject areas, and real world experiences/applications.
Performance Indicators for 1-4 a) The teacher links current objectives of learning to prior student learning.
b) The teacher solicits comments, questions, examples, demonstrations, or other contributions from students throughout the lesson.
c) The teacher matches the content/skills taught with the overall scope and sequence of the curriculum.
Behavior Summary Scale 1-4 Exemplary The teacher uses a variety of strategies to link and extend instruction with past and future student learning experiences , employs interdisciplinary instruction and real world experiences/applications.
Professional The teacher links present content/skills with past and future learning experiences, other subject areas, and real world experiences/applications.
Needs Improvement The teacher does not consistently link instruction with past and future learning experiences, other subject areas, or real world experiences/applications.
Unsatisfactory The teacher rarely links instruction with past and future learning experiences, other subject areas, or real world experiences/applications.
1-5 The teacher communicates effectively with students.
Performance Indicators for 1-5 a) The teacher uses standard English grammar when communicating with students.
b) The teacher uses precise language, acceptable oral expression, and written communication.

114
c) The teacher explains concepts and lesson content to students in a logical and sequential manner.
d) The teacher emphasizes major points of concerns by using techniques such as repetition and verbal or non-verbal clues.
e) The teacher actively listens and responds in a constructive manner.
f) The teacher uses technology to communicate with students (and parents).
Behavior Summary Scale 1-5 Exemplary The teacher uses multiple strategies for communicating effectively with individual students and classroom groups.
Professional The teacher communicates effectively with students.
Needs Improvement The teacher does not consistently communicate effectively with students and/or does not model standard English.
Unsatisfactory The teacher does not communicate effectively with students and/or does not model standard English.
1-6 The teacher uses instructional strategies that promote student learning.
Performance Indicators for 1-6 a) The teacher monitors student understanding and paces the lesson based on achievement.
b) The teacher uses a variety of instructional strategies to encourage student achievement.
c) The teacher uses questioning strategies to engage students and promote learning.
d) The teacher effectively implements a variety of learning activities and experiences consistent with instructional objectives.
e) The teacher maximizes student learning by providing opportunities to participate actively and successfully.
Behavior Summary Scale 1-6 Exemplary The teacher develops and creatively applies a wide variety of instructional strategies to promote the learning of all students.
Professional The teacher uses instructional strategies that promote student learning.
115
Needs Improvement The teacher uses a limited variety of instructional strategies that only sometimes promote student learning.
Unsatisfactory The teacher typically uses only one or two instructional strategies that may or may not promote student learning.
1-7 The teacher provides learning opportunities for individual differences.
Performance Indicators for 1-7 a) The teacher identifies and plans for the instructional needs for all students and provides remedial and enrichment activities as necessary.
b) The teacher explains content and demonstrates skills in a variety of ways to meet the needs of each student.
c) The teacher gives each student an equal opportunity for involvement in learning.
d) The teacher holds each student individually responsible for learning.
e) The teacher employs technology as option for meeting the individual needs of students.
Behavior Summary Scale 1-7 Exemplary The teacher recognizes and provides a variety of challenging and differentiated learning opportunities based on careful assessment of individual differences.
Professional The teacher provides learning opportunities for individual differences.
Needs Improvement The teacher does not consistently provide for individual differences.
Unsatisfactory The teacher does not provide for individual differences.
ASSESSMENT DOMAIN
A-l The teacher provides a variety of ongoing and culminating assessments to measure student performance.
Performance Indicators for A-l a) The teacher effectively uses both teacher-made and standardized tests to measure student performance.
b) The teacher uses oral, non-verbal, and written forms of assessment to measure student performance.

116
c) The teacher uses authentic assessment to measure student performance.
d) The teacher uses available data sources to examine and document student progress.
e) The teacher uses pre-assessment as a routine instructional strategy.
Behavior Summary Scale A-l Exemplary The teacher creates, selects, and effectively uses a variety of on-going and culminating assessments that accurately measure student performance.
Professional The teacher provides a variety of on-going and culminating assessments to measure student performance.
Needs Improvement The teacher uses a limited variety of on-going and/or culminating assessments and infrequently assesses student performance.
Unsatisfactory The teacher fails to assess student performance appropriately.
A-2 The teacher provides on going and timely feedback to encourage student progress.
Performance Indicators for A-2 a) The teacher monitors student progress before, during, and after instruction.
b) The teacher provides feedback to students and parents about Performance and progress within a reasonable time frame.
c) The teacher uses acceptable grading/ranking/scoring practices in recording and reporting student achievements.
Behavior Summary Scale A-2 Exemplary The teacher provides timely feedback and clearly communicates assessment results to encourage student progress.
Professional The teacher provides on-going and timely feedback to encourage student progress.
Needs Improvement The teacher provides limited feedback to encourage student progress.
Unsatisfactory The teacher rarely provides on-going feedback to encourage student progress.
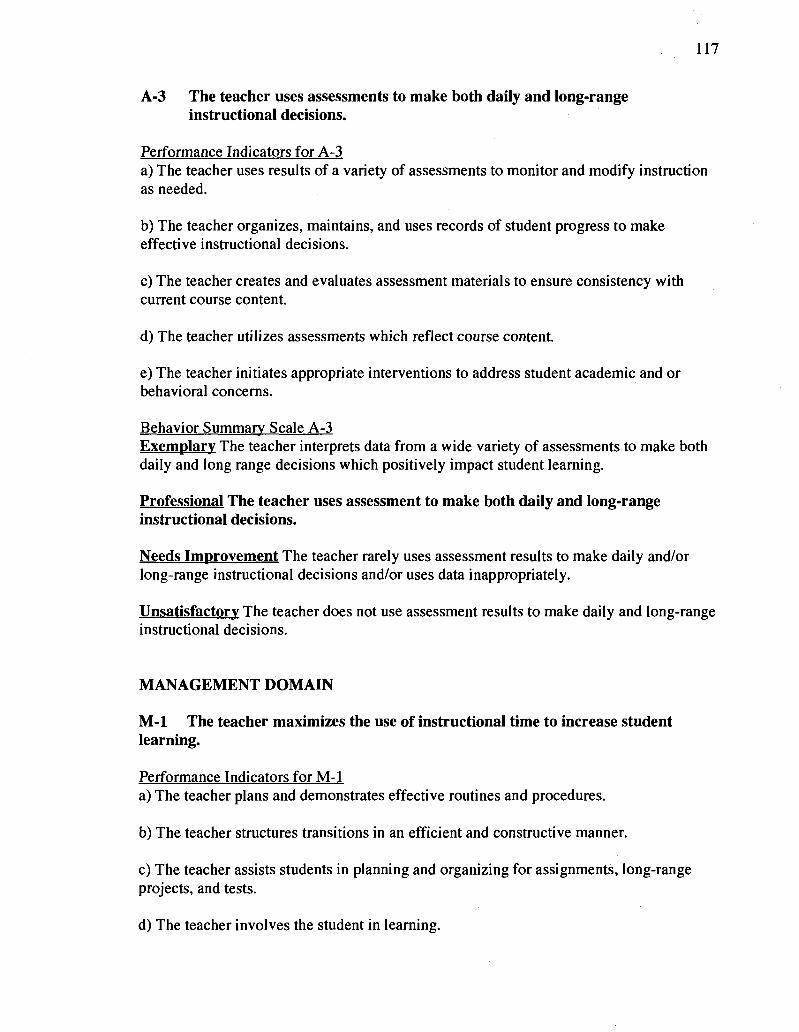
117
A-3 The teacher uses assessments to make both daily and long-range instructional decisions.
Performance Indicators for A-3 a) The teacher uses results of a variety of assessments to monitor and modify instruction as needed.
b) The teacher organizes, maintains, and uses records of student progress to make effective instructional decisions.
c) The teacher creates and evaluates assessment materials to ensure consistency with current course content.
d) The teacher utilizes assessments which reflect course content.
e) The teacher initiates appropriate interventions to address student academic and or behavioral concerns.
Behavior Summary Scale A-3 Exemplary The teacher interprets data from a wide variety of assessments to make both daily and long range decisions which positively impact student learning.
Professional The teacher uses assessment to make both daily and long-range instructional decisions.
Needs Improvement The teacher rarely uses assessment results to make daily and/or long-range instructional decisions and/or uses data inappropriately.
Unsatisfactory The teacher does not use assessment results to make daily and long-range instructional decisions.
MANAGEMENT DOMAIN
M-l The teacher maximizes the use of instructional time to increase student learning.
Performance Indicators for M-l a) The teacher plans and demonstrates effective routines and procedures.
b) The teacher structures transitions in an efficient and constructive manner.
c) The teacher assists students in planning and organizing for assignments, long-range projects, and tests.
d) The teacher involves the student in learning.

118
e) The teacher uses technology to maximize classroom time.
Behavior Summary Scale M-l Exemplary The teacher uses creative organizational strategies including technology to maximize instructional time and increase student learning and involvement.
Professional The teacher maximizes the use of instructional time to increase student learning.
Needs Improvement The teacher does not consistently manage instructional time effectively to increase student learning.
Unsatisfactory The teacher wastes significant instructional time, limiting student learning.
M-2 The teacher demonstrates and models respect towards students and others.
Performance Indicators for M-2
a) The teacher models caring, fairness, humor, courtesy, respect, and active listening.
b) The teacher models concern for student emotional and physical well being.
c) The teacher seeks and maintains positive interactions with students.
Behavior Summary Scale M-2 Exemplary The teacher consistently demonstrates and actively promotes respect toward students and others. Professional The teacher demonstrates and models respect toward students and others.
Needs Improvement The teacher inconsistently demonstrates respect toward some students or others.
Unsatisfactory The teacher shows disrespect for students and others.
M-3 The teacher organizes the classroom to ensure a safe academic and physical learning environment.
Performance Indicators for M-3 a) The teacher creates a physical setting that promotes learning and minimizes disruption.

119
b) The teacher complies with local, state, and federal safety regulations.
c) The teacher organizes the classroom to facilitate the monitoring of students' work and to provide assistance.
d) The teacher manages emergency situations, as they occur, in the school setting.
e) The teacher creates a learning setting in which the student feels free to take risks.
Behavior Summary Scale M-3 Exemplary The teacher consistently involves students in creating and ensuring a safe and positive academic and physical learning environment.
Professional The teacher organizes the classroom to ensure a safe academic and physical learning environment.
Needs Improvement The teacher maintains a safe physical environment but does not always provide a positive learning environment.
Unsatisfactory The teacher does not organize or maintain a safe physical or positive academic environment.
M-4 The teacher communicates clear expectations about behavior to students and parents.
Performance Indicators for M-4 a) The teacher monitors student behavior and provides feedback in a constructive manner to students and parents.
b) The teacher redirects students who are off-task.
c) The teacher enforces classroom/school rules.
d) The teacher minimizes the effects of disruptive behavior.
Behavior Summary Scale M-4
Exemplary The teacher creates a classroom culture that clearly communicates expectations about behavior to students and parents and helps students meet those expectations.
Professional The teacher communicates clear expectations about behavior to students and parents.
Needs Improvement The teacher inconsistently communicates expectations for behavior to students and parents.

120
Unsatisfactory The teacher does not communicate clear expectations for behavior to students and parents.
PROFESSIONAL DOMAIN
P-l The teacher demonstrates ethical and professional behavior.
Performance Indicators for P-l a) The teacher demonstrates adherence to ethical and professional standards.
b) The teacher selects appropriate channels for resolving concerns and problems while maintaining confidentiality.
c) The teacher maintains professional relations with colleagues and others in the school community.
d) The teacher provides for student confidentiality.
e) The teacher maintains professional dress and demeanor.
Behavior Summary Scale P-l Exemplary The teacher demonstrates and promotes ethical and professional behavior in himself/herself and others.
Professional The teacher demonstrates ethical and professional behavior.
Needs Improvement The teacher inconsistently demonstrates ethical or professional behavior.
Unsatisfactory The teacher demonstrates unethical or unprofessional behavior.
P-2 The teacher participates in an ongoing process of professional development.
Performance Indicators for P-2 a) The teacher participates in professional growth activities including conferences, workshops, course work and committees, or membership in professional organizations.
b) The teacher explores, disseminates, and applies knowledge and information about new or improved methods of instruction and related issues.
c) The teacher evaluates and identifies areas of personal strength(s) and weakness(es) and seeks improvement of skills and professional performance.
d) The teacher participates in technology training that is relevant to instruction.

121
Behavior Summary Scale P-2 Exemplary The teacher participates in, seeks out, and shares professional development activities and serves as a role model to others.
Professional The teacher participates in an ongoing process of professional development.
Needs Improvement The teacher makes limited use of opportunities for professional development.
Unsatisfactory The teacher shows little or no interest in professional development.
P-3 The teacher contributes to the overall school climate by supporting school goals.
Performance Indicators for P-3 a) The teacher shares teaching insights and coordinates learning activities for students.
b) The teacher serves on school committees and supports school activities.
c) The teacher contributes to the development of the profession by serving as a mentor, peer coach, or supervisor of student teachers.
d) The teacher completes all class and school responsibilities in a timely and effective manner.
e) The teacher carries out duties in accordance with established policies, practices, and regulations.
Behavior Summary Scale P-3 Exemplary The teacher takes a leadership role in promoting a positive school climate by initiating and supporting school goals.
Professional The teacher contributes to the overall school climate by supporting school goals.
Needs Improvement The teacher inconsistently demonstrates support for school goals.
Unsatisfactory The teacher does not support school goals.
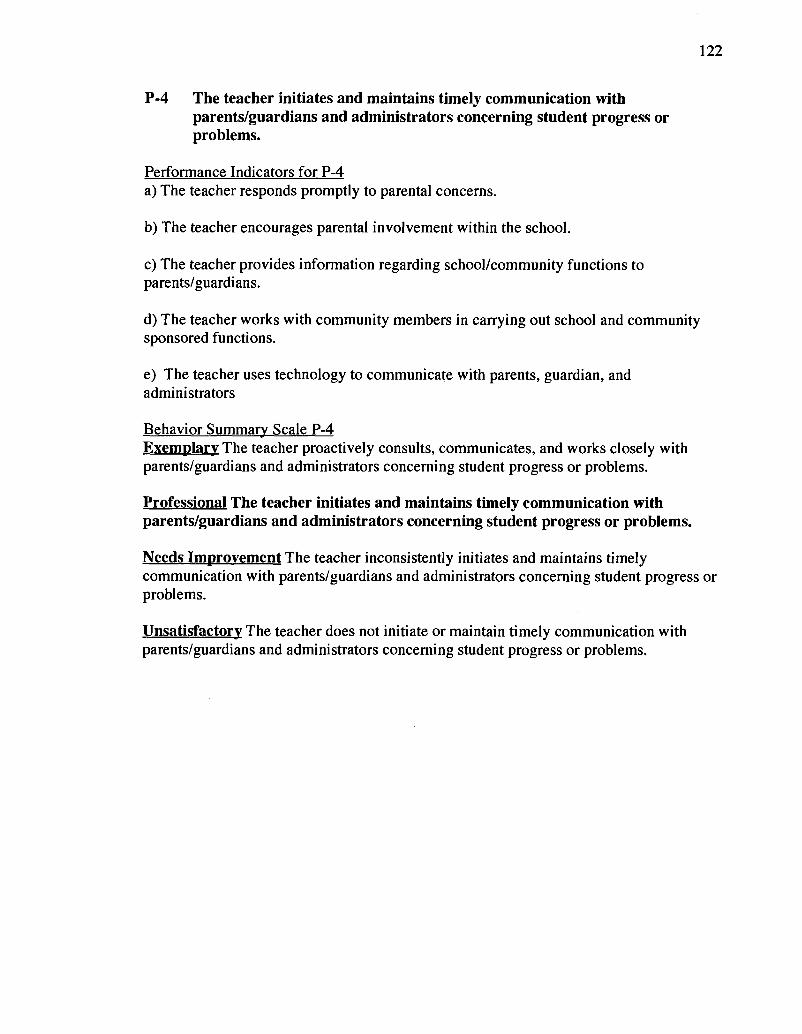
122
P-4 The teacher initiates and maintains timely communication with parents/guardians and administrators concerning student progress or problems.
Performance Indicators for P-4 a) The teacher responds promptly to parental concerns.
b) The teacher encourages parental involvement within the school.
c) The teacher provides information regarding school/community functions to parents/guardians.
d) The teacher works with community members in carrying out school and community sponsored functions.
e) The teacher uses technology to communicate with parents, guardian, and administrators
Behavior Summary Scale P-4 Exemplary The teacher proactively consults, communicates, and works closely with parents/guardians and administrators concerning student progress or problems.
Professional The teacher initiates and maintains timely communication with parents/guardians and administrators concerning student progress or problems.
Needs Improvement The teacher inconsistently initiates and maintains timely communication with parents/guardians and administrators concerning student progress or problems.
Unsatisfactory The teacher does not initiate or maintain timely communication with parents/guardians and administrators concerning student progress or problems.
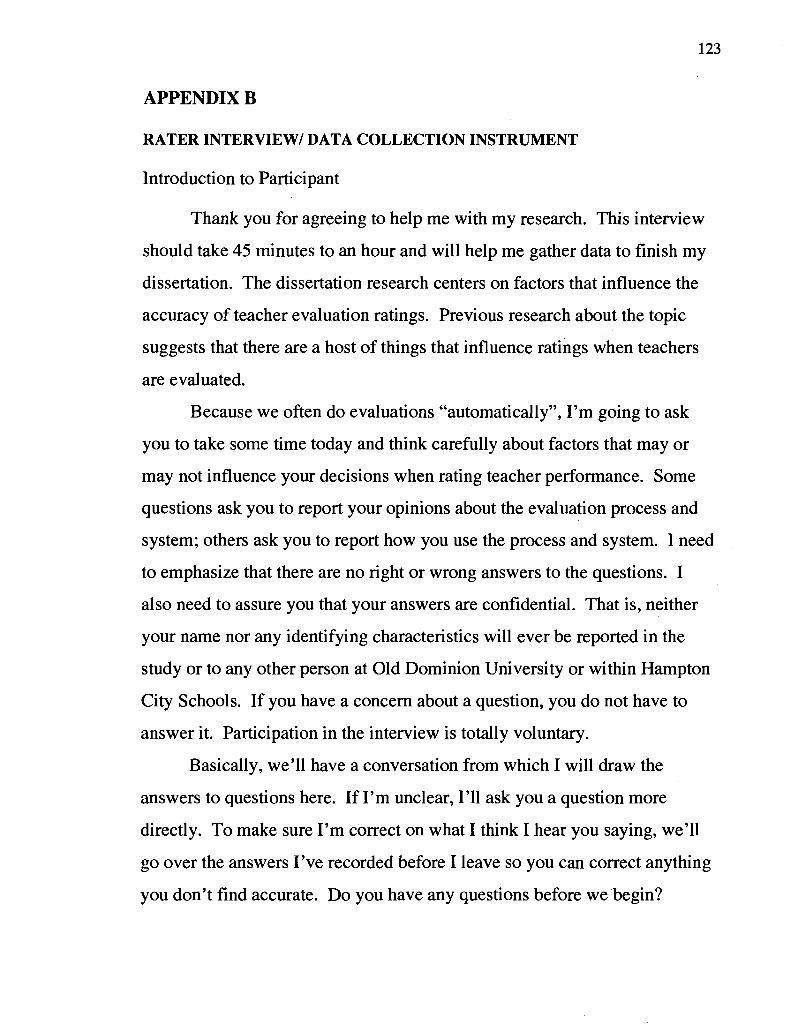
123
APPENDIX B
RATER INTERVIEW/ DATA COLLECTION INSTRUMENT
Introduction to Participant
Thank you for agreeing to help me with my research. This interview
should take 45 minutes to an hour and will help me gather data to finish my
dissertation. The dissertation research centers on factors that influence the
accuracy of teacher evaluation ratings. Previous research about the topic
suggests that there are a host of things that influence ratings when teachers
are evaluated.
Because we often do evaluations "automatically", I'm going to ask
you to take some time today and think carefully about factors that may or
may not influence your decisions when rating teacher performance. Some
questions ask you to report your opinions about the evaluation process and
system; others ask you to report how you use the process and system. I need
to emphasize that there are no right or wrong answers to the questions. I
also need to assure you that your answers are confidential. That is, neither
your name nor any identifying characteristics will ever be reported in the
study or to any other person at Old Dominion University or within Hampton
City Schools. If you have a concern about a question, you do not have to
answer it. Participation in the interview is totally voluntary.
Basically, we'll have a conversation from which I will draw the
answers to questions here. If I'm unclear, I'll ask you a question more
directly. To make sure I'm correct on what I think I hear you saying, we'll
go over the answers I've recorded before I leave so you can correct anything
you don't find accurate. Do you have any questions before we begin?

124
Case # OK? Here's the easy stuff to get you warmed up:
1. How long have you been doing teacher evaluations?.
2. Before becoming an administrator, how many years did you teach?
3. What subject did you teach?
4. How comfortable are you rating teachers outside your discipline? I'm completely comfortable rating teachers outside my discipline. I'm somewhat comfortable rating teachers outside my discipline. I'm somewhat uncomfortable rating teachers outside my discipline. I'm very uncomfortable rating teachers outside my discipline.
I'd like to talk about the preparation you've had for doing teacher evaluation, in your admin degree program or here at HCS or things you've done on your own to prepare. Let the participant describe his/her experiences and log answers to the questions below during the conversation. If the answer does not surface, use probes or ask the questions directly.
5. Could you tell me about the training you had in your administrative degree program? 3 or more courses 2 courses 1 course Part of a course
Was the coursework helpful in preparing you to evaluate teachers? It was extremely helpful It was somewhat helpful It was only slightly helpful It was not helpful
Were the skills you were taught to evaluate in your coursework similar to the skills on which teachers are rated in Hampton City Schools? They were very similar They were somewhat similar They were only slightly similar They were not similar at all N/A (no formal coursework in prep program)
Tell me about the training you've had since you came to Hampton City Schools.
8. How many workshops have you had in Hampton City Schools? 3 or more workshops 2 workshops 1 workshop

Part of a workshop No workshops
9. Did you have workshops about the domains and competencies?
10. Did you have workshops about using the Filemaker database?
11. Do you feel that the workshops prepared you for the task? They were an extremely important part of my preparation They were a somewhat important part of my preparation They were not really an important part of my preparation They were not at all an important part of preparation
OK, let's talk about the rating system itself. First, I'd your thoughts about the different domains - specifically how much impact you think each of them has on whether students learn? Let's go through them one at a time, beginning with Instruction.
12. Instructional Domain These competencies are essential for student achievement These competencies are helpful for student achievement These competencies are not related to student achievement.
13. Assessment Domain These competencies are essential for student achievement _ These competencies are helpful for student achievement These competencies are not related to student achievement.
14. Management Domain These competencies are essential for student achievement _ These competencies are helpful for student achievement These competencies are not related to student achievement.
15. Professional Domain These competencies are essential for student achievement _ These competencies are helpful for student achievement These competencies are not related to student achievement.
16. Domain/Competency Rating: Does not know the domains and competencies at all Know the domains, but not the competencies Knows both the domains and competencies to some extent Knows all the domains and competencies well
17. Have you been provided with the HCS teacher evaluation manuals? If so, are they helpful? Yes Yes No No

18. Tell me about dealing with the different levels of performance. Is it difficult to pick a teachers' level of performance? I can easily pick the level of a teacher's performance I can pick the level of performance, but it takes time and thought I am sometimes unclear about which level I should pick based on the indicators
I am usually unclear about which level I should pick based on the indicators
19. What does it take for you to want to give someone an exemplary performance rating? Do you have to see more than one instance? One example of truly exemplary teaching does it for me I need at least two instances before I give an exemplary rating I need to have three instances before I give an exemplary rating. I need four or more instances before I give an exemplary rating.
20. Is it the same or different (as the exemplary) for you to give a "needs improvement" rating on the summative? One example of poor performance qualifies for a "needs improvement" I need at least two instances before I give a "needs improvement" I need to have three instances before I give a "needs improvement" I need four or more instances before I give a "needs improvement"
21. When you chose to give a Needs Improvement on the summative, did you look for an opportunity to give an Exemplary somewhere else to make the negative rating more palatable?
Yes, often Yes, occasionally Yes, but only rarely No
I'd like to shift gears and talk about teacher evaluation overall. Research has shown that administrators sometimes use the evaluation process for a number of different purposes in addition to the ratings expected by HR. Sometimes, they're influenced by factors outside the actual rating process. You may not have considered some of these issues before, so take your time in answering and give me your best thoughts.
22. First, do you think summative evaluations have an impact on improving teacher performance? Follow: If so, can you tell me the level of impact it has? Read scalable responses as necessary. I think the evaluation process has great impact on improving teacher performance I think the evaluation process has some impact on improving teacher performance I think the evaluation process has little impact on improving teacher performance I think the evaluation process has no impact on improving teacher performance

127
23. Do you use summative evaluations as a way of rewarding good teachers? I do not use the summative evaluation as a way of rewarding teachers I rarely use summative evaluation as a way of rewarding teachers ^____ I occasionally use the summative evaluation as a way of rewarding teachers I often use the summative evaluation as a way of rewarding teachers
24. Some administrators have a real reluctance to make ratings that could eventually lead to dismissal, not wanting to initiate a procedure that could affect a colleague's livelihood. Do you think such a concern has affected your choice of ratings?
I have frequently chosen a higher rating for teachers than their performance merits I have sometimes chosen a higher rating than the performance merits I have rarely chosen a higher rating than the performance merits I have not chosen a higher rating than the performance merits
25. How do you feel about the process for dismissing teachers? Are summative evaluations an important part of that process?
I think the summative evaluation is not a part of dismissing teachers I think the summative evaluation is a small part of dismissing teachers I think the summative evaluation is a large part of dismissing teachers I think the summative evaluation is critical for dismissing teachers
26. Have you ever undertaken the process of dismissing a teacher? If so, did you receive adequate support in the process? From whom did you receive support?
27. How did you feel about your accountability for making accurate ratings? Did you think rating teachers has been an important part of your job performance that was monitored for accuracy? I felt that I was absolutely accountable for the accuracy of ratings I give and that accuracy is carefully monitored I felt that I was somewhat accountable for the ratings I give; that is, if they are inaccurate, someone will notice and contact me about it I felt that I was somewhat unaccountable for the ratings I give, that only if they are grossly inaccurate will anyone notice and contact me about it I felt that I was not accountable for the ratings I give, that no one ever reviews them
28. Do you feel you are given adequate time doing teacher evaluations? I frequently block out periods to observe teachers and have adequate time to observe teachers and write their evaluations
I block out periods to observe teachers but get interrupted and sometimes wish I had more time to observe and write evaluations
I block out periods to observe teachers but get interrupted and frequently find myself feeling rushed to get the observations and evaluations completed I rarely have time to plan observations and usually find myself pressed to meet deadlines in doing observations and writing evaluations

128
For this set of questions, maintain a casual tone and first ask if the participant has experienced the particular concern. If the answer is yes, then pursue the question to see the frequency of rating changes due to the stated concern.
29. Our system "defaults" to a Professional rating. For others, you have to provide documentation. Has having to substantiate a low or high mark come into play when choosing a rating?
I have frequently chosen a different rating for teachers than their performance merited I have sometimes chosen a different rating than the performance merited 1 have rarely chosen a different rating than the performance merited I have not chosen a different rating than the performance merited
30. Have you been concerned about teacher morale when choosing a rating? Might you have given a higher rating than a teacher's performance merited because of a concern about morale?
I have frequently chosen a higher rating for teachers than their performance merits I have sometimes chosen a higher rating than the performance merits I have rarely chosen a higher rating than the performance merits I have not chosen a higher rating than the performance merits
31. Some administrators avoid giving "needs improvement" on a summative because they feel there are other more effective ways to bring about the needed improvement. Might you have chosen a higher rating for this reason?
I have frequently chosen a higher rating for teachers than their performance merits I have sometimes chosen a higher rating than the performance merits I have rarely chosen a higher rating than the performance merits I have not chosen a higher rating than the performance merits
32. Have you been concerned about the teacher shortage when you chose ratings? Might you have given a higher rating than a teacher's performance merited because you were concerned about retaining teachers?
I have frequently chosen a higher rating for teachers than their performance merits I have sometimes chosen a higher rating than the performance merits I have rarely chosen a higher rating than the performance merits I have not chosen a higher rating than the performance merits
33. Some people find negative encounters with others to be very difficult. Has the prospect of having to discuss low ratings with a teacher ever come into play when you chose ratings?
I have frequently chosen a higher rating for teachers than their performance merits I have sometimes chosen a higher rating than the performance merits I have rarely chosen a higher rating than the performance merits I have not chosen a higher rating than the performance merits

129
34. Since low ratings in several areas necessitate a teacher improvement plan, has the responsibility of initiating that plan come into play when choosing a rating?
I have frequently chosen a higher rating for teachers than their performance merits I have sometimes chosen a higher rating than the performance merits I have rarely chosen a higher rating than the performance merits_ I have not chosen a higher rating than the performance merits
35. Have you been involved in having to put a teacher on an improvement plan? If so, did you receive adequate support in the process? From whom?
36. When you have known of hardship in a teacher's life, such as health problems, divorce, or another personal issue, might that have affected your ratings for that teacher? Has this been a factor with more than one teacher you've rated?
37. Do you have different standards depending on the class make-up, for instance a more lenient standard for a class with a higher number of disadvantaged students?
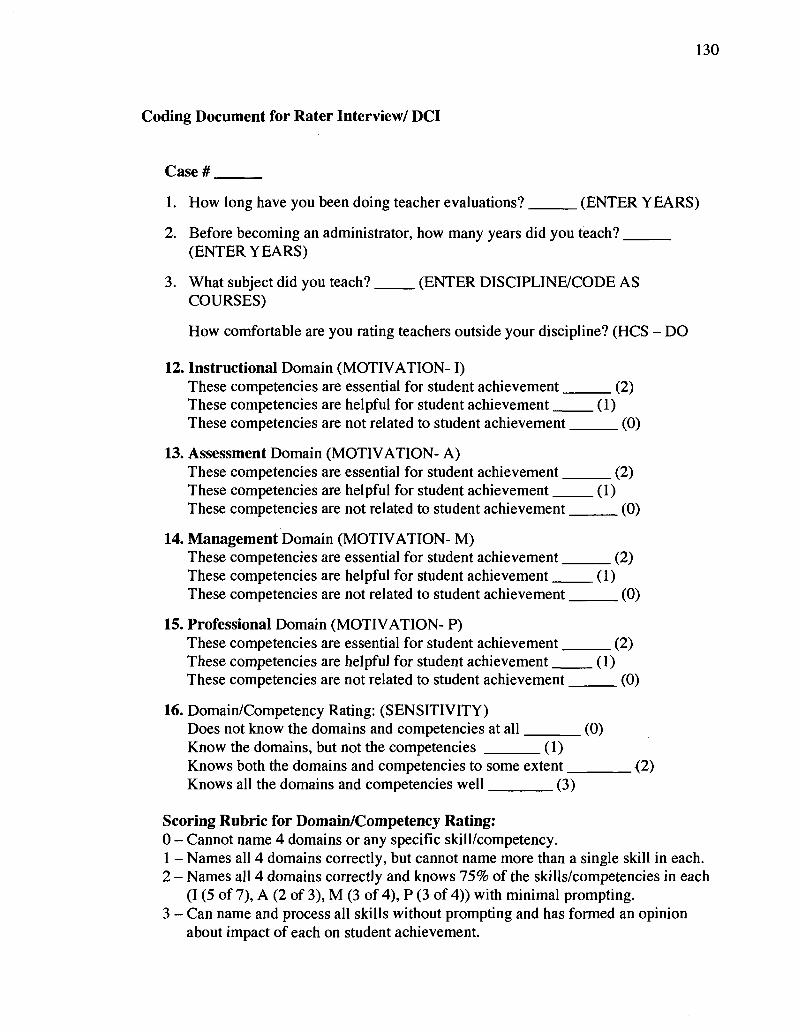
Coding Document for Rater Interview/ DCI
Case#
1. How long have you been doing teacher evaluations? (ENTER YEARS)
2. Before becoming an administrator, how many years did you teach? (ENTER YEARS)
3. What subject did you teach? (ENTER DISCIPLINE/CODE AS COURSES)
How comfortable are you rating teachers outside your discipline? (HCS - DO
12. Instructional Domain (MOTIVATION-1) These competencies are essential for student achievement (2) These competencies are helpful for student achievement (1) These competencies are not related to student achievement (0)
13. Assessment Domain (MOTIVATION- A) These competencies are essential for student achievement (2) These competencies are helpful for student achievement (1) These competencies are not related to student achievement (0)
14. Management Domain (MOTIVATION- M) These competencies are essential for student achievement (2) These competencies are helpful for student achievement (1) These competencies are not related to student achievement (0)
15. Professional Domain (MOTIVATION- P) These competencies are essential for student achievement (2) These competencies are helpful for student achievement (1) These competencies are not related to student achievement (0)
16. Domain/Competency Rating: (SENSITIVITY) Does not know the domains and competencies at all (0) Know the domains, but not the competencies (1) Knows both the domains and competencies to some extent <2) Knows all the domains and competencies well (3)
Scoring Rubric for Domain/Competency Rating: 0 - Cannot name 4 domains or any specific skill/competency. 1 - Names all 4 domains correctly, but cannot name more than a single skill in each. 2 - Names all 4 domains correctly and knows 75% of the skills/competencies in each
(I (5 of 7), A (2 of 3), M (3 of 4), P (3 of 4)) with minimal prompting. 3 - Can name and process all skills without prompting and has formed an opinion
about impact of each on student achievement.

131
18. Tell me about dealing with the different levels of performance. Is it difficult to pick a teachers' level of performance? (SENSITIVITY) I can easily pick the level of a teacher's performance (3) I can pick the level of performance, but it takes time and thought (2) I am sometimes unclear about which level I should pick (1) I am usually unclear about which level I should pick based on the indicators (0)
19. What does it take for you to want to give someone an exemplary performance rating? Do you have to see more than one instance? (THRESHOLD -P) One example of truly exemplary teaching does it for me (1) I need at least two instances before I give an exemplary rating (2) I need to have three instances before I give an exemplary rating (3) I need four or more instances before I give an exemplary rating (4)
20. Is it the same or different (as the exemplary) for you to give a "needs improvement" rating on the summative? (THRESHOLD -N) One example of poor performance qualifies for a "needs improvement" (1) I need at least two instances before I give a "needs improvement" (2) I need to have three instances before I give a "needs improvement" (3) I need four or more instances before I give a "needs improvement" (4)
21. When you chose to give a Needs Improvement on the summative, did you look for an opportunity to give an Exemplary somewhere else to make the negative rating more palatable? (MORALE)
Yes, often (3) Yes, occasionally (2) Yes, but only rarely (1) No (0)
22. First, do you think summative evaluations have an impact on improving teacher performance? (MOTIVATION) I think the summative evaluation has great impact (3) I think the summative evaluation has some impact (2) I think the summative evaluation has little impact (1) I think the summative evaluation has no impact (0)
23. Do you use summative evaluations as a way of rewarding good teachers? (MORALE) I do not use the summative evaluation as a way of rewarding teachers (0) I rarely use summative evaluation as a way of rewarding teachers (1) I occasionally use the summative evaluation as a way of rewarding teachers (2) I often use the summative evaluation as a way of rewarding teachers (3)

132
24. Some administrators have a real reluctance to make ratings that could eventually lead to dismissal, not wanting to initiate a procedure that could affect a colleague's livelihood. Do you think such a concern has affected your choice of ratings? (EMOTIONAL) I have frequently chosen a higher rating for teachers than their performance merits (3) I have sometimes chosen a higher rating than the performance merits (2) I have rarely chosen a higher rating than the performance merits (1) I have not chosen a higher rating than the performance merits (0)
25. How do you feel about the process for dismissing teachers? Are summative evaluations an important part of that process? (MOTIVATION) I think the summative evaluation is not a part of dismissing teachers (0) I think the summative evaluation is a small part of dismissing teachers (1) I think the summative evaluation is a large part of dismissing teachers (2) I think the summative evaluation is critical for dismissing teachers (3)
27. How did you feel about your accountability for making accurate ratings? Did you think rating teachers has been an important part of your job performance that was monitored for accuracy? (MOTIVATION) I felt that I was absolutely accountable for the accuracy of ratings I give and that accuracy is carefully monitored (3) I felt that I was somewhat accountable for the ratings I give; that is, if they are inaccurate, someone will notice and contact me about it (2) I felt that I was somewhat unaccountable for the ratings I give, that only if they are grossly inaccurate will anyone notice and contact me about it (1) I felt that I was not accountable for the ratings, that no one ever reviews them (0)
28. Do you feel you are given adequate time doing teacher evaluations? (CONSTRAINTS)
I frequently block out periods to observe teachers and have adequate time to observe teachers and write their evaluations (0) I block out periods to observe teachers but get interrupted and sometimes wish I had more time to observe and write evaluations (1) I block out periods to observe teachers but get interrupted and frequently find myself feeling rushed to get the observations and evaluations completed (2)
I rarely have time to plan observations and usually find myself pressed to meet deadlines in doing observations and writing evaluations (3)

133
29. Our system "defaults" to a Professional rating. For others, you have to provide documentation. Has having to substantiate a low or high mark come into play when choosing a rating? (CONSTRAINTS)
I have frequently chosen a different rating than the performance merited (3) I have sometimes chosen a different rating than the performance merited (2) I have rarely chosen a different rating than the performance merited (1) I have not chosen a different rating than the performance merited (0)
30. Have you been concerned about teacher morale when choosing a rating? Might you have given a higher rating than a teacher's performance merited because of a concern about morale? (MORALE)
I have frequently chosen a higher rating than the performance merits (3) I have sometimes chosen a higher rating than the performance merits (2) I have rarely chosen a higher rating than the performance merits (1) I have not chosen a higher rating than the performance merits (0)
31. Some administrators avoid giving "needs improvement" on a summative because they feel there are other more effective ways to bring about the needed improvement. Might you have chosen a higher rating for this reason? (CONSTRAINTS)
I have frequently chosen a higher rating than the performance merits (3) I have sometimes chosen a higher rating than the performance merits (2) I have rarely chosen a higher rating than the performance merits (1) I have not chosen a higher rating than the performance merits (0)
32. Have you been concerned about the teacher shortage when you chose ratings? Might you have given a higher rating than a teacher's performance merited because you were concerned about retaining teachers? (CONSTRAINTS)
I have frequently chosen a higher rating than the performance merits (3) I have sometimes chosen a higher rating than the performance merits (2) I have rarely chosen a higher rating than the performance merits (1) I have not chosen a higher rating than the performance merits (0)
33. Some people find negative encounters with others to be very difficult. Has the prospect of having to discuss low ratings with a teacher ever come into play when you chose ratings? (EMOTIONAL)
I have frequently chosen a higher rating than the performance merits (3) I have sometimes chosen a higher rating than the performance merits (2) I have rarely chosen a higher rating than the performance merits (1) I have not chosen a higher rating than the performance merits (0)

134
34. Since low ratings in several areas necessitate a teacher improvement plan, has the responsibility of initiating that plan come into play when choosing a rating? (CONSTRAINTS)
I have frequently chosen a higher rating than the performance merits (3) I have sometimes chosen a higher rating than the performance merits (2) I have rarely chosen a higher rating than the performance merits (1) I have not chosen a higher rating than the performance merits (0)
36. When you have known of hardship in a teacher's life, such as health problems, divorce, or another personal issue, might that have affected your ratings for that teacher? Has this been a factor with more than one teacher you've rated? (EMOTIONAL-0,1,2)
37. Do you have different standards depending on the class make-up, for instance a more lenient standard for a class with a higher number of disadvantaged students? (CONSTRAINTS-0,1)
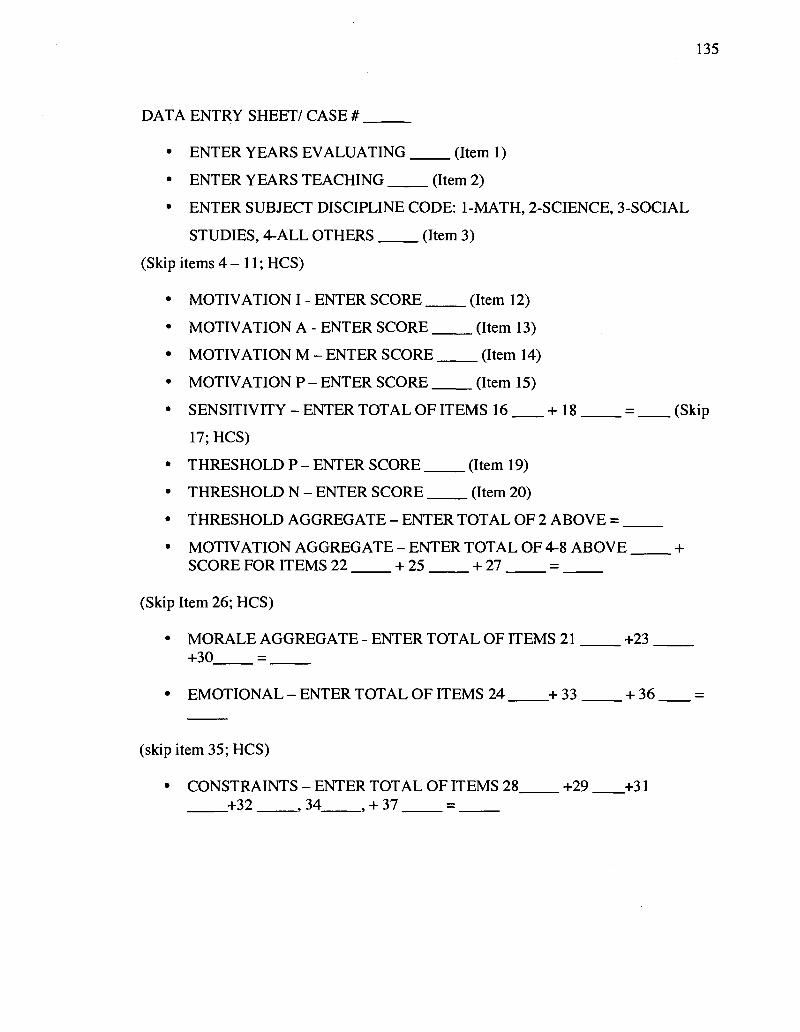
135
DATA ENTRY SHEET/ CASE #
• ENTER YEARS EVALUATING (Item 1)
• ENTER YEARS TEACHING (Item 2)
• ENTER SUBJECT DISCIPLINE CODE: 1-MATH, 2-SCIENCE, 3-SOCIAL
STUDIES, 4-ALL OTHERS (Item 3)
(Skip items 4 - 11; HCS)
• MOTIVATION I - ENTER SCORE (Item 12)
• MOTIVATION A - ENTER SCORE (Item 13)
• MOTIVATION M - ENTER SCORE (Item 14)
• MOTIVATION P - ENTER SCORE (Item 15)
• SENSITIVITY - ENTER TOTAL OF ITEMS 16 + 18 = (Skip
17; HCS)
• THRESHOLD P - ENTER SCORE (Item 19)
• THRESHOLD N - ENTER SCORE (Item 20)
• THRESHOLD AGGREGATE - ENTER TOTAL OF 2 ABOVE =
• MOTIVATION AGGREGATE - ENTER TOTAL OF 4-8 ABOVE +
SCORE FOR ITEMS 22 + 25 + 27 =
(Skip Item 26; HCS)
• MORALE AGGREGATE - ENTER TOTAL OF ITEMS 21 +23 +30 =
• EMOTIONAL - ENTER TOTAL OF ITEMS 24 + 33 + 36
(skip item 35; HCS)
• CONSTRAINTS - ENTER TOTAL OF ITEMS 28 +29 +31 +32 , 34 , + 37 =

136
APPENDIX C
List of Aggregate Measures
There were six aggregate scores entered in the database:
• Sensitivity - combined 2 items measuring the Sensitivity to rating domains and
competencies and the Sensitivity to performance levels (Scale 0 - 6 )
• Threshold - combined 2 items measuring the Threshold to infer a pattern of
behavior needing improvement and to infer a pattern of exemplary behavior
(Scale 2 - 8 )
• Motivation - combined 7 items measuring the influences of the following sources
of motivation: relation of the process to student achievement, relation of the
process to teacher performance improvement, accountability for accuracy, and
necessity for accuracy in the dismissal process (Scale 0 - 17)
• Constraints - combined 6 items measuring the influence of the following
constraints: need for additional documentation for high or low performance
ratings and teacher improvement plans, time demands, teacher shortages, and
differences in class makeup (Scale 0 - 1 6 )
• Morale - combined 3 items measuring the influence of concerns about individual
teacher morale and building climate (Scale 0 - 9 )
• Emotional - combined 3 items measuring the influence of emotional barriers to
accuracy such as concern for hardship in a teacher's life or difficulty in delivering
negative performance information (Scale 0 - 8 )

137
VITA
Cynthia L. Cooper was awarded a Bachelor of Arts Degree in Classics from the
University of Virginia in May of 1989. She attained a Master of Education Degree in
Educational Administration from the College of William and Mary in December of
1994. She earned her Doctoral Degree in Urban Services/ Management from the
College of Business and Public Administration at Old Dominion University in May of
2005.
Ms. Cooper has worked in the public sector since 1980, first in law enforcement
then in public education. She began her career in public education as a teacher, and
then became a secondary school administrator. Her current post is Director of
Alternative and Adult Education for Hampton City Schools in Hampton, Virginia,