the role of lipophilicity in transmembrane anion · pdf files1 supporting information the role...
TRANSCRIPT

S1
Supporting Information
The role of lipophilicity in transmembrane anion transport
Vittorio Saggiomo,a Sijbren Otto,
a Igor Marques,
b Vitor Félix,
b Tomás Torroba,
c and
Roberto Quesada*c
a Centre for Systems Chemistry, Stratingh Institute, University of Groningen, 9747 AG Groningen,The Netherlands b Departamento de Química, CICECO and Secção Autónoma de Ciências da Saúde, Universidade de Aveiro, 3810-193 Aveiro,
Portugal c Departamento de Química, Facultad de Ciencias, Universidad de Burgos,09001 Burgos, Spain. E-mail: [email protected]
Table of Contents
General Procedures ..................................................................................................... S2
Synthesis of Tambjamine derivatives ........................................................................ S2
Anion binding titrations ............................................................................................. S5
Lipophilicity calculations ............................................................................................ S9
Membrane transport assays .................................................................................. S11
ISE Transport Assays. .................................................................................................. S11
13C NMR liposome Assays .......................................................................................... S15
Hill Plot Analyses ....................................................................................................... S16
Computational Details ............................................................................................. S18
Multi-conformational RESP charge fitting of the transporters .................................... S18
Simulations in Water and Surface Area calculations ................................................... S19
Estimation of the relative binding free energies for the chloride protonated tambjamine
complexes ................................................................................................................... S20
NMR Spectra of compounds 1-16 .......................................................................... S23
Electronic Supplementary Material (ESI) for Chemical CommunicationsThis journal is © The Royal Society of Chemistry 2012
S2
General Procedures and Methods
Commercial reagents were used without any further purification. NMR spectra were recorded in Varian
Mercury-300 MHz and Varian Unity Inova-400 MHz spectrometers. Chemical shifts are reported in ppm
with using residual solvent peak as reference, coupling constants are reported in Hz. High resolution mass
spectra (HRMS) were recorded on a Micromass Autospec S-2 spectrometer using EI at 70eV. 4-Methoxy-
2,2'-bipyrrole-5-carboxaldehyde was prepared as described.1
Synthesis of Tambjamine derivatives
Compounds 1-16 were synthesised using modifications of the previously reported method.2 In a typical
procedure, 4-Methoxy-2,2'-bipyrrole-5-carboxaldehyde (190 mg, 1 mmol,)1 was mixed with the
corresponding amine (1.3 mmol, 1.3 equivalents) in 10 mL of chloroform. 40 uL of acetic acid were
added and the mixture stirred at 60 ºC until TLC showed disappearance of the staring material. The
reaction mixture was diluted with 40 mL of dichloromethane and washed with HCl 1M (3 25 mL). The
organic fraction was dried over Na2SO4 and the solvent evaporated to yield 1-16 as yellow solids/oils in
excellent yields.
(1) (Z)-1-(3-methoxy-5-(1H-pyrrol-2-yl)-2H-pyrrol-2-ylidene)-N-methylmethanamine hydrochloride
Yield (85%). 1H NMR (300 MHz, CDCl3): δ = 13.59 (br s, 1H), 10.57 (br s, 1H), 9.24 (br s, 1H), 7.28 (d, J = 14.7 Hz,
1H), 7.06 (m, 1H), 6.74 (m, 1H), 6.28 (m, 1H), 5.93 (m, 1H), 3.92 (s, 3H), 3.26 (d, J = 4.7 Hz, 3H). 13
C NMR (75 MHz, CDCl3): = 164.02, 142.56, 141.75 (CH), 124.28 (CH), 122.85, 113.43 (CH), 111.11
(CH), 111.00, 91.36 (CH), 58.72 (CH3), 37.02 (CH3).
HRMS (EI) m/z [M]+ calcd for [C11H13N3O] 203.1053; found: 203.1058
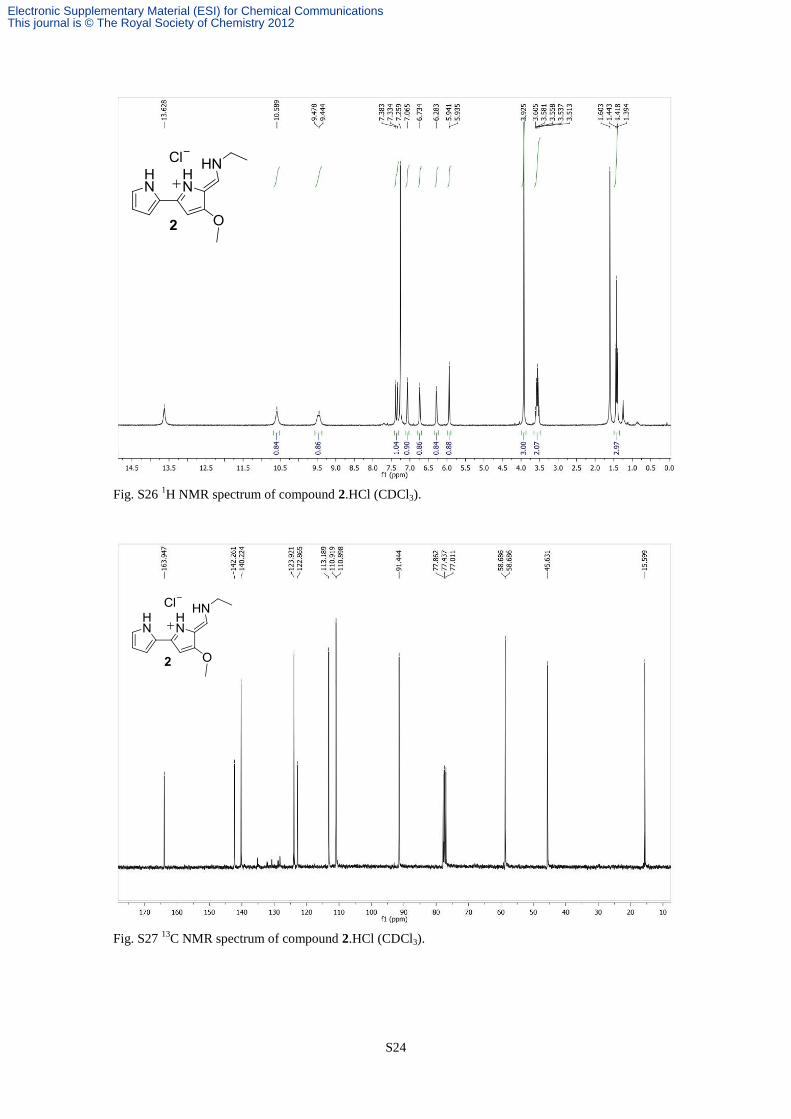
(2) (Z)-N-((3-methoxy-5-(1H-pyrrol-2-yl)-2H-pyrrol-2-ylidene)methyl)ethanamine, Tambjamine D
Yield (86%). UV-Vis (CHCl3): λmax 415nm (ε = 41356 M-1
cm-1
) 1H-NMR (CDCl3, 300MHz): = 13.63 (s, br, 1H) , 10.59 (s, br, 1H), 9.46 (d, br, 1H), 7.36 (d, J = 15.0
Hz, 1H), 7.06 (m, 1H), 6.73 (m, 1H), 6.28 (m, 1H), 5.94 (m, 1H), 3.93 (s, 3H), 3.56 (m, 2H), 1.42 7.36 (t,
J = 7.3 Hz, 3H). 13
C-NMR (CDCl3, 75 MHz): = 163.95, 142.26, 140.22(CH), 123.92 (CH), 122.87,
113.19, 110.92 (CH), 110.90, 91.44 (CH), 58.69 (CH3), 45.56 (CH2), 15.60 (CH3).
HRMS (EI) m/z calcd for [C12H15N3O] 217.12096; found: 217.1211
(3) (Z)-N-((3-methoxy-5-(1H-pyrrol-2-yl)-2H-pyrrol-2-ylidene)methyl)propan-1-amine hydrochloride
Yield (90%). 1H NMR (300 MHz, CDCl3): δ = 13.43 (br s, 1H), 10.58 (br s, 1H), 9.38 (d, J = 13.9 Hz, 1H), 7.28 (d, J
= 14.9 Hz, 1H), 6.97 (m, 1H), 6.72 (m, 1H), 6.21 (m, 1H), 5.93 (m, 1H), 3.83 (s, 3H), 3.38 (m, 2H), 1.72
(m, 2H), 0.96 (t, J = 7.4 Hz, 3H). 13
C NMR (75 MHz, CDCl3): = 163.98, 142.33, 140.65 (CH), 124.05 (CH), 122.88, 113.27 (CH), 110.93
(CH), 110.89, 91.40 (CH), 58.70 (CH3), 52.76 (CH2), 23.83 (CH2), 11.31 (CH3).
HRMS (EI) m/z [M]+ calcd for [C13H17N3O] 231.1366; found:231.1370
1 K. Dairi, S. Tripathy, G. Attardo, J.-F. Lavallee, Tetrahedron Lett. 2006, 47, 2605. 2 D. M. Pinkerton, M. G. Banwell, A. C. Willis, Org. Lett. 2007, 9, 5127.
Electronic Supplementary Material (ESI) for Chemical CommunicationsThis journal is © The Royal Society of Chemistry 2012
S3
(4) (Z)-N-((3-methoxy-5-(1H-pyrrol-2-yl)-2H-pyrrol-2-ylidene)methyl)butan-1-amine hydrochloride
Yield (91%). 1H NMR (300 MHz, CDCl3): δ = 13.37 (br s, 1H), 10.58 (br s, 1H), 9.38 (d, J = 14.4 Hz, 1H), 7.26 (d, J
= 14.9 Hz, 1H), 6.95 (m, 1H), 6.71 (m, 1H), 6.20 (m, 1H), 5.94 (m, 1H), 3.81 (s, 3H), 3.40 (m, 2H), 1.65
(m, 2H), 1.36 (m, 2H),0.88 (t, J = 7.3 Hz, 3H). 13
C NMR (75 MHz, CDCl3): = 163.94, 142.28, 140.60 (CH), 123.99 (CH), 122.87, 113.23 (CH), 110.92
(CH), 110.86, 91.42 (CH), 58.69 (CH3), 50.86 (CH2), 32.42 (CH2), 19.90 (CH2), 13.79 (CH3).
HRMS (EI) m/z [M]+ calcd for [C14H19N3O] 245.15226; found: 245.1523
(5) (Z)-N-((3-methoxy-5-(1H-pyrrol-2-yl)-2H-pyrrol-2-ylidene)methyl)pentan-1-amine hydrochloride
Yield (86%). 1H NMR (300 MHz, CDCl3): δ = 13.44 (br s, 1H), 10.58 (br s, 1H), 9.38 (br s, 1H), 7.26 (d, J = 14.9 Hz,
1H), 6.95 (m, 1H), 6.71 (m, 1H), 6.19 (m, 1H), 5.93 (m, 1H), 3.82 (s, 3H), 3.38 (m, 2H), 1.68 (m, 2H),
1.30 (m, 4H),0.84 (t, J = 4.8 Hz, 3H). 13
C NMR (75 MHz, CDCl3): = 163.94, 142.31, 140.56 (CH), 123.98 (CH), 122.89, 113.23 (CH),
110.91, 91.38 (CH), 58.67 (CH3), 51.10 (CH2), 30.12 (CH2), 28.75 (CH2), 22.35 (CH2), 14.06 (CH3).
HRMS (EI) m/z [M]+ calcd for [C15H21N3O] 259.1679; found: 259.1679
(6) (Z)-N-((3-methoxy-5-(1H-pyrrol-2-yl)-2H-pyrrol-2-ylidene)methyl)hexan-1-amine hydrochloride
Yield (92%). 1H NMR (300 MHz, CDCl3): δ = 13.50 (br s, 1H), 10.58 (br s, 1H), 9.37 (br s, 1H), 7.29 (d, J = 14.9 Hz,
1H), 7.00 (m, 1H), 6.72 (m, 1H), 6.23 (m, 1H), 5.93 (m, 1H), 3.86 (s, 3H), 3.43 (m, 2H), 1.71 (m, 2H),
1.31 (m, 6H),0.85 (t, J = 6.5 Hz, 3H). 13
C NMR (75 MHz, CDCl3): = 163.92, 142.33, 140.54 (CH), 124.14 (CH), 122.89, 113.28 (CH),
110.92, 110.86, 91.35 (CH), 58.69 (CH3), 51.21 (CH2), 31.46 (CH2), 30.45 (CH2), 26.37 (CH2), 22.68
(CH2), 14.23 (CH3).
HRMS (EI) m/z [M]+ calcd for [C16H23N3O] 273.1836; found: 273.1846
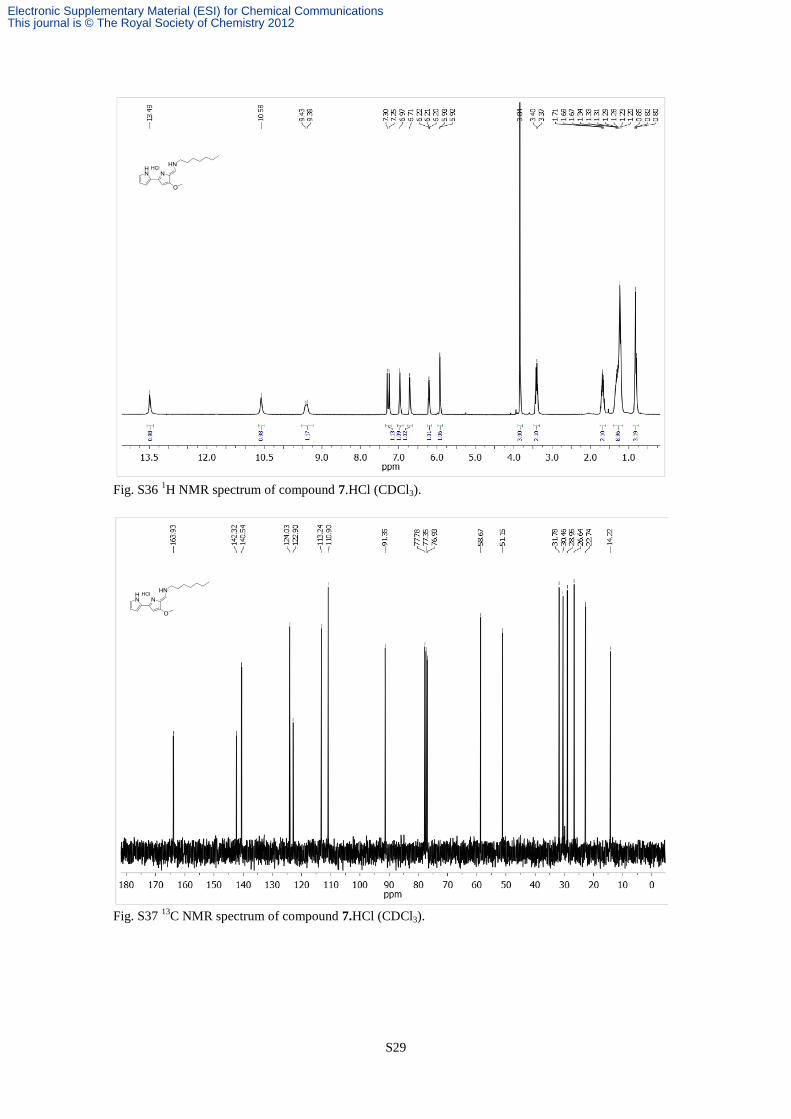
(7) (Z)-N-((3-methoxy-5-(1H-pyrrol-2-yl)-2H-pyrrol-2-ylidene)methyl)heptan-1-amine hydrochloride
Yield (90%). 1H NMR (300 MHz, CDCl3): δ = 13.49 (br s, 1H), 10.58 (br s, 1H), 9.41 (d, J = 14.3 Hz, 1H), 7.27 (d, J
= 14.9 Hz, 1H), 6.97 (m, 1H), 6.71 (m, 1H), 6.21 (m, 1H), 5.93 (m, 1H), 3.84 (s, 3H), 3.38 (m, 2H), 1.69
(m, 2H), 1.28 (m, 8H),0.82 (t, J = 6.6 Hz, 3H).
13C NMR (75 MHz, CDCl3): = 163.93, 142.32, 140.54 (CH), 124.03 (CH), 122.90, 113.24 (CH),
110.90, 91.35 (CH), 58.67 (CH3), 51.15 (CH2), 31.78 (CH2), 30.46 (CH2), 28.95 (CH2), 26.64 (CH2),
22.74 (CH2), 14.22 (CH3).
HRMS (EI) m/z [M]+ calcd for [C17H25N3O] 287.1992; found: 287.2001
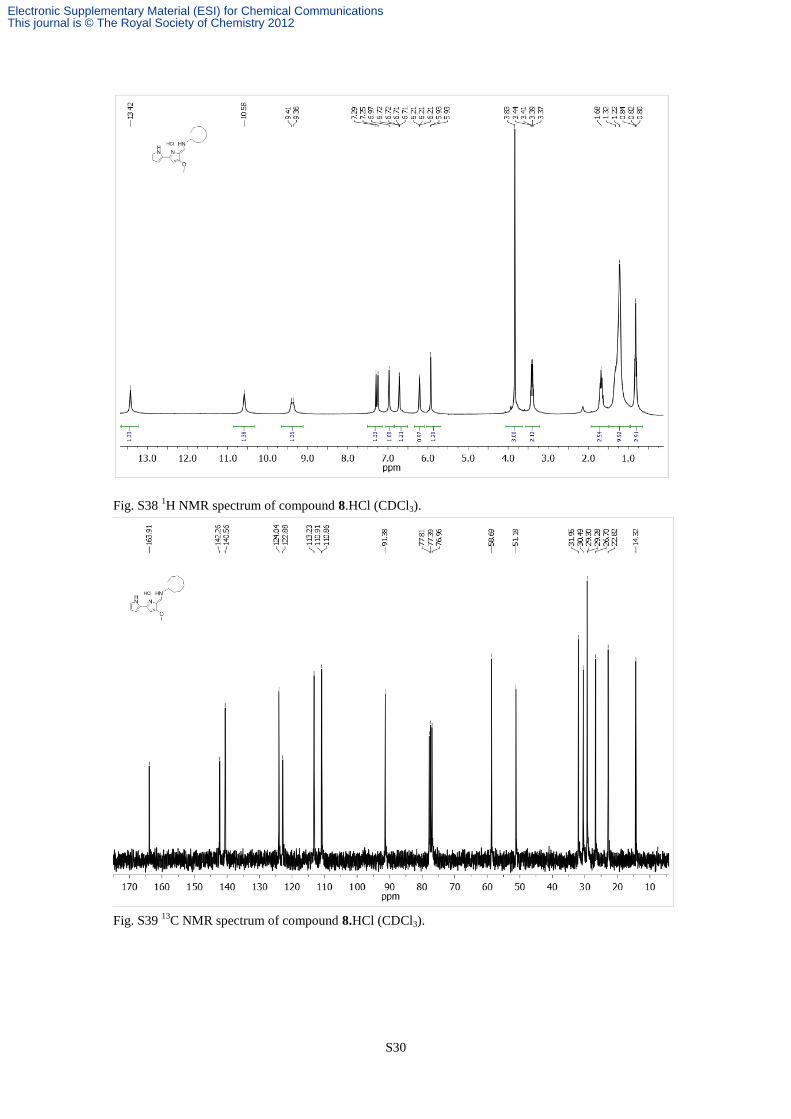
(8) (Z)-N-((3-methoxy-5-(1H-pyrrol-2-yl)-2H-pyrrol-2-ylidene)methyl)octan-1-amine hydrochloride
Yield (92%). 1H NMR (300 MHz, CDCl3): δ = 13.42 (br s, 1H), 10.58 (br s, 1H), 9.38 (d, J = 14.3 Hz, 1H), 7.27 (d, J
= 14.9 Hz, 1H), 6.97 (m, 1H), 6.71 (m, 1H), 6.21 (m, 1H), 5.93 (m, 1H), 3.83 (s, 3H), 3.40 (m, 2H), 1.68
(m, 2H), 1.27 (m, 10H),0.82 (t, J = 6.4 Hz, 3H). 13
C NMR (75 MHz, CDCl3): = 163.91, 142.26, 140.56 (CH), 124.04 (CH), 122.88, 113.23 (CH),
110.91, 110.86, 91.38 (CH), 58.69 (CH3), 51.18 (CH2), 31.95 (CH2), 29.30 (2 C) (CH2), 29.28 (CH2),
26.70 (CH2), 22.82 (CH2), 14.23 (CH3).
HRMS (EI) m/z [M]+ calcd for [C18H27N3O] 301.2149; found: 301.2150
Electronic Supplementary Material (ESI) for Chemical CommunicationsThis journal is © The Royal Society of Chemistry 2012
S4
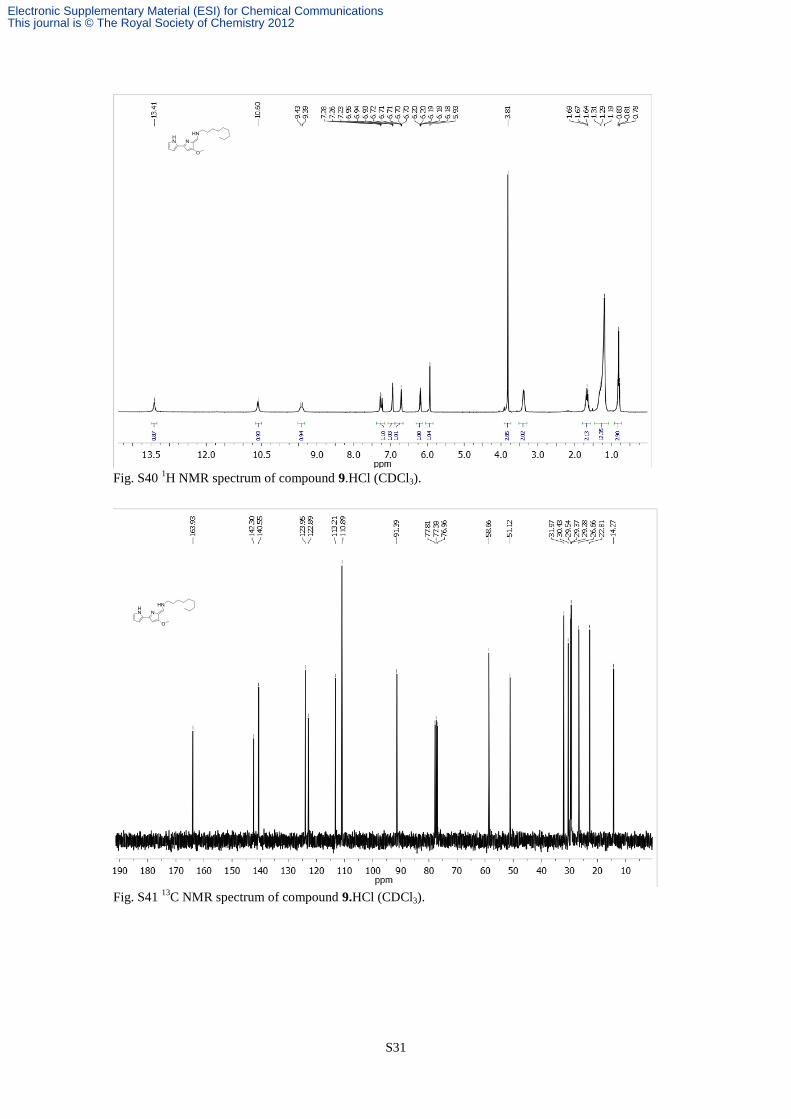
(9) (Z)-N-((3-methoxy-5-(1H-pyrrol-2-yl)-2H-pyrrol-2-ylidene)methyl)nonan-1-amine hydrochloride
Yield (93%). 1H NMR (300 MHz, CDCl3): δ = 13.41 (br s, 1H), 10.60 (br s, 1H), 9.41 (d, J = 11.9 Hz, 1H), 7.26 (d, J
= 14.7 Hz, 1H), 6.94 (m, 1H), 6.71 (m, 1H), 6.19 (m, 1H), 5.93 (m, 1H), 3.81 (s, 3H), 3.39 (m, 2H), 1.67
(m, 2H), 1.26 (m, 10H), 0.81 (t, J = 6.7 Hz, 3H).
13C NMR (75 MHz, CDCl3): = 163.93, 142.30, 140.55 (CH), 124.95 (CH), 122.89, 113.21 (CH),
110.89, 91.39 (CH), 58.66 (CH3), 51.12 (CH2), 31.97 (CH2), 30.43 (CH2), 29.54 (CH2), 29.37 (CH2),
29.28 (CH2), 26.66 (CH2), 22.81 (CH2), 14.27 (CH3).
MS (EI) m/z [M]+ calcd for [C19H29N3O] 315.2305; found: 315.23
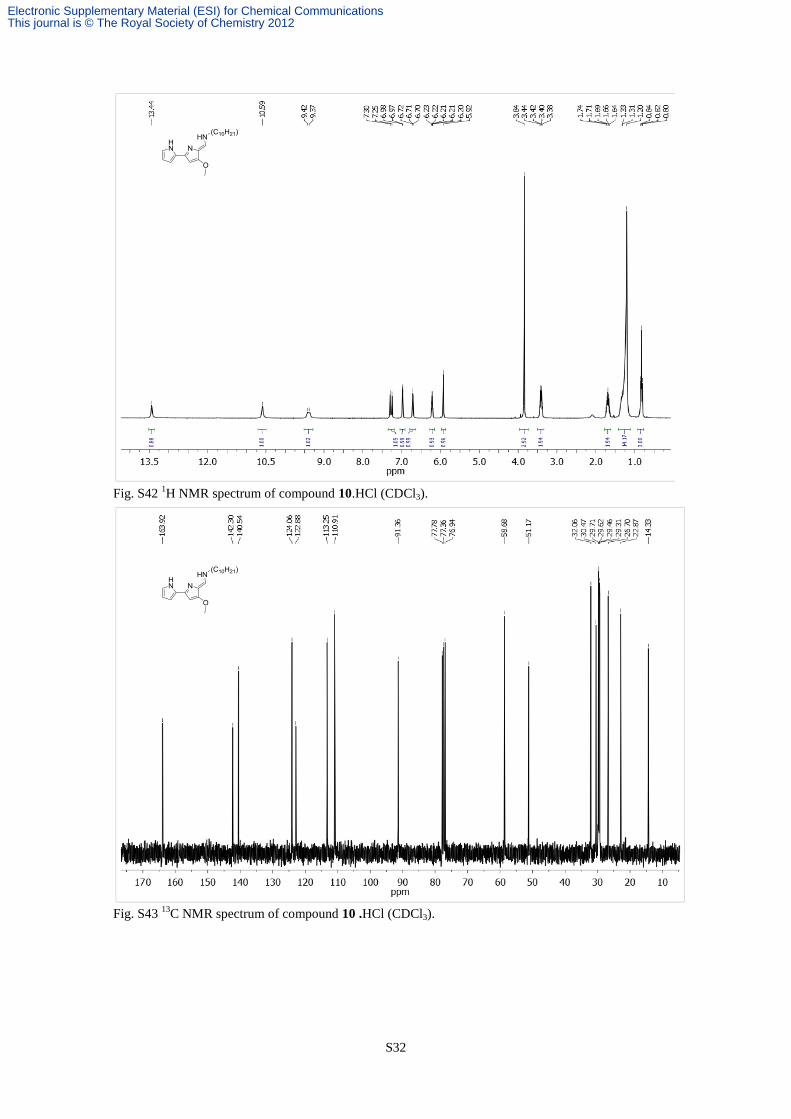
(10) (Z)-N-((3-methoxy-5-(1H-pyrrol-2-yl)-2H-pyrrol-2-ylidene)methyl)decan-1-amine hydrochloride
Yield (89%). 1H NMR (300 MHz, CDCl3): δ = 13.44 (br s, 1H), 10.59 (br s, 1H), 9.40 (d, J = 14.1 Hz, 1H), 7.27 (d, J
= 14.8 Hz, 1H), 6.98 (m, 1H), 6.71 (m, 1H), 6.21 (m, 1H), 5.92 (m, 1H), 3.84 (s, 3H), 3.41 (m, 2H), 1.69
(m, 2H), 1.28 (m, 14H),0.82 (t, J = 6.5 Hz, 3H). 13
C NMR (75 MHz, CDCl3): = 163.92, 142.30, 140.54 (CH), 124.06 (CH), 122.88, 113.25 (CH),
110.91, 91.36 (CH), 58.68 (CH3), 51.17 (CH2), 32.06 (CH2), 30.47 (CH2), 29.71 (CH2), 29.62 (CH2),
29.46 (CH2), 29.31 (CH2), 26.70 (CH2), 22.87 (CH2), 14.33 (CH3).
HRMS (EI) m/z [M]+ calcd for [C20H31N3O] 329.24616; found: 329.2466
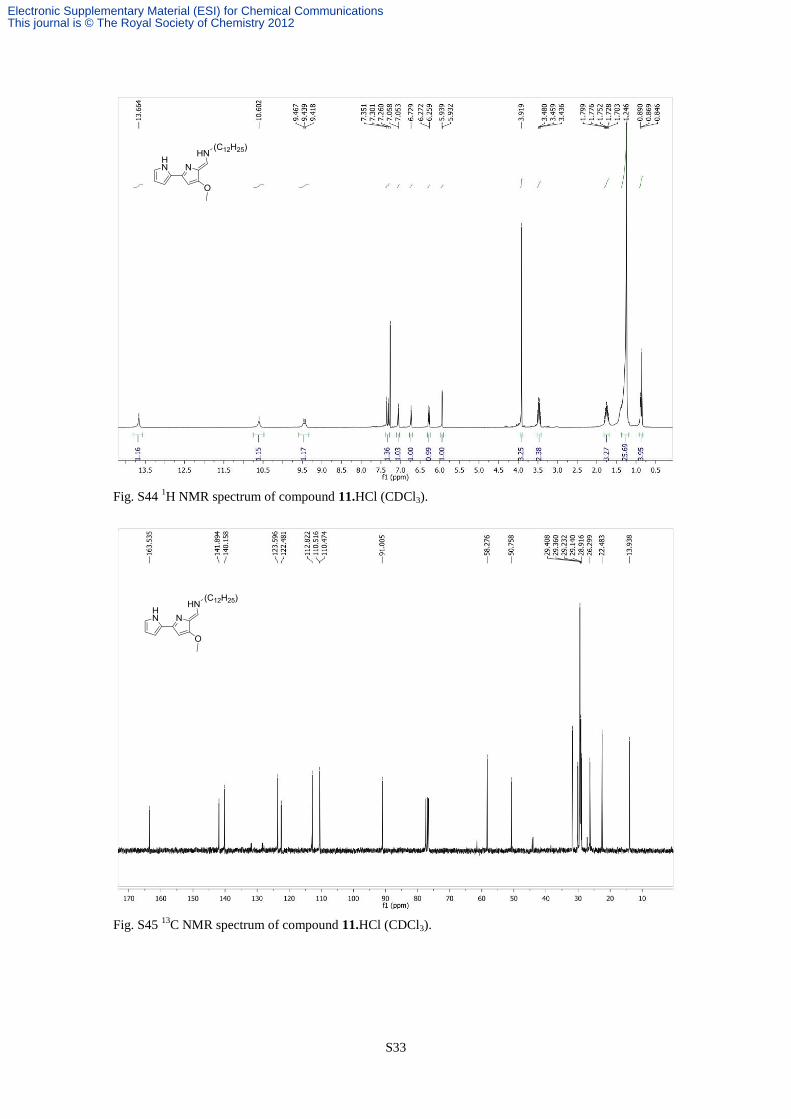
(11) (Z)-N-((3-methoxy-5-(1H-pyrrol-2-yl)-2H-pyrrol-2-ylidene)methyl)dodecan-1-amine hydrochloride,
BE-18591
Yield (86%). UV-Vis (CHCl3): λmax 415 nm (ε = 48386 M-1
cm-1
) 1H-NMR (CDCl3, 300MHz): = 13.66 (s, br, 1H) , 10.60 (s, br, 1H), 9.44 (m, 1H), 7.33 (d, J = 15.0 Hz,
1H), 7.06 (m, 1H), 6.73 (m, 1H), 6.27 (m, 1H), 5.94 (m, 1H), 3.92 (s, 3H), 3.47 (m, 2H), 1.75 (m, 2H),
1.24 (br, 15H), 0.87 (t, J = 6.6 Hz, 3H). 13
C-NMR (CDCl3, 75 MHz): = 163.53, 141.89, 140.16(CH), 123.60 (CH), 122.48, 112.82(CH), 110.52
(CH), 110.47, 91.00 (CH), 58.28 (CH3), 50.76 (CH2), 31.70 (CH2), 30.08 (CH2), 29.41 (CH2), 29.36
(CH2), 29.23 (CH2), 19.14 (CH2), 28.92 (CH2), 26.30 (CH2), 22.48 (CH2), 13.94 (CH3).
MS (EI) m/z calcd for [C22H35N3O] 357.2775; found: 357.27
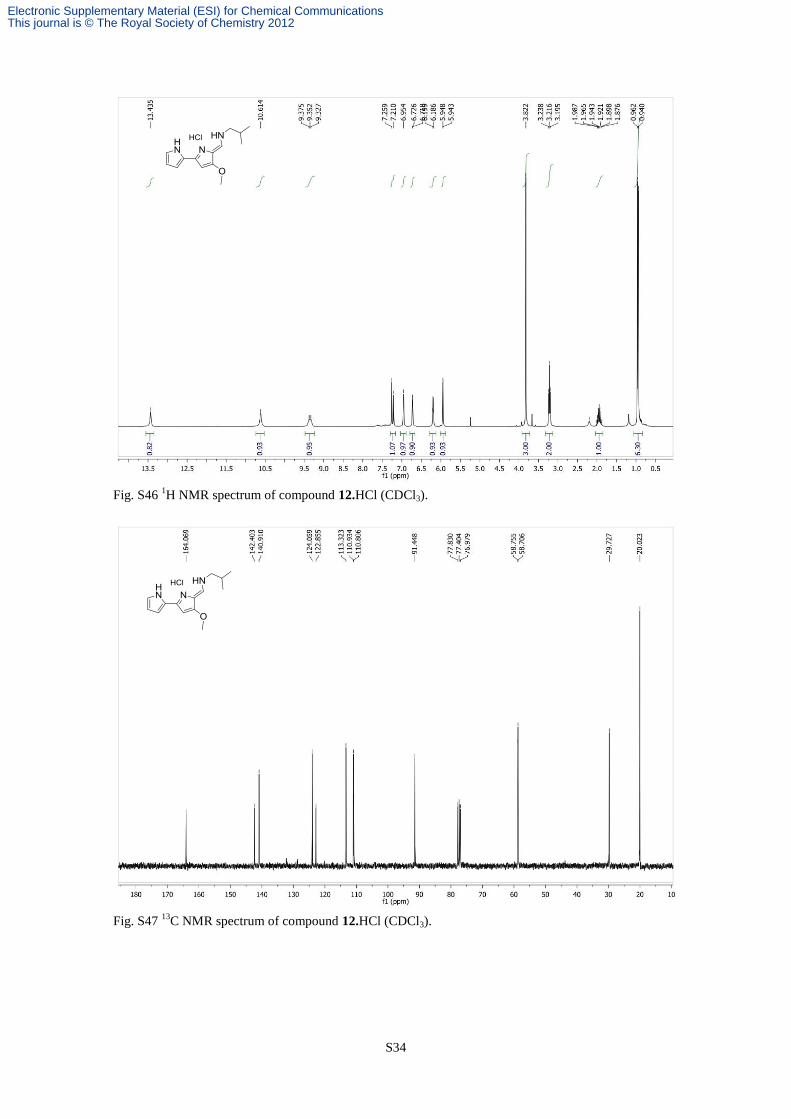
(12) (Z)-N-((3-methoxy-5-(1H-pyrrol-2-yl)-2H-pyrrol-2-ylidene)methyl)-2-methylpropan-1-amine
hydrochloride, Tambjamine C
Yield (88%). UV-Vis (CHCl3): λmax 415nm (ε = 60087 M-1
cm-1
) 1H-NMR (CDCl3, 300MHz): = 13.43 (s, br, 1H) , 10.61 (s, br, 1H), 9.35 (m, 1H), 7.23 (d, J = 14.8 Hz,
1H), 6.95 (m, 1H), 6.72 (m, 1H), 6.20 (m, 1H), 5.95 (m, 1H), 3.82 (s, 3H), 3.22 (t, J = 6.4, 2H), 1.94 (hp,
J = 6.7 Hz, 1H), 0.95 (d, J = 6.7 Hz, 6H). 13
C-NMR (CDCl3, 75 MHz): = 164.07, 142.40, 140.91(CH),
124.06 (CH), 122.85, 113.32(CH), 110.93 (CH), 110.81, 91.45 (CH), 58.75 (CH2), 58.71 (CH3), 29.73
(CH), 20.02 (CH3). HRMS (EI) m/z calcd for [C14H19N3O] 245.1523; found: 245,1528.
(13) (Z)-N-((3-methoxy-5-(1H-pyrrol-2-yl)-2H-pyrrol-2-ylidene)methyl)-3-methylbutan-1-amine
hydrochloride, Tambjamine K
Yield (93%). 1H NMR (300 MHz, CDCl3): δ = 13.41 (br s, 1H), 10.57 (br s, 1H), 9.37 (d, J = 14.4 Hz, 1H), 7.27 (d, J
= 14.9 Hz, 1H), 6.97 (m, 1H), 6.72 (m, 1H), 6.21 (m, 1H), 5.93 (m, 1H), 3.83 (s, 3H), 3.43 (m, 2H), 1.65
(m, 4H), 0.89 (d, J = 6.4 Hz, 6H).
Electronic Supplementary Material (ESI) for Chemical CommunicationsThis journal is © The Royal Society of Chemistry 2012
S5
13C NMR (75 MHz, CDCl3): = 163.90, 142.28, 140.54 (CH), 124.05 (CH), 122.88, 113.25 (CH), 110.92
(2 peaks) (CH), 91.39 (CH), 58.70 (CH3), 49.39 (CH2), 39.11 (CH2), 25.64 (CH), 22.50 (CH3).
HRMS (EI) m/z [M]+ calcd for [C15H21N3O] 259.1679; found: 259.1681
(14) (Z)-N-((3-(benzyloxy)-5-(1H-pyrrol-2-yl)-2H-pyrrol-2-ylidene)methyl)propan-1-amine
hydrochloride
Yield (83%). 1H-NMR (CDCl3, 300MHz): = 13.57 (br s, 1H), 10.61 (s, br, 1H), 9.48 (d, J = 13.8 Hz, 1H), 7.40-7.32
(6H), 7.00 (m, 1H), 6.73 (m, 1H), 6.25 (m, 1H), 6.02 (m, 1H), 5.10 (s, 2H), 3.40 (m, 2H), 1.75 (m, 2H),
0.99 (d, J = 7.4 Hz, 3H). 13
C-NMR (CDCl3, 75 MHz): = 162.77, 142.34, 140.82 (CH), 135.18, 129.09 (CH), 129.04 (CH),
128.26 (CH), 124.24 (CH), 122.88, 113.35 (CH), 111.15, 110.95 (CH), 92.28 (CH), 73.62 (CH2), 52.84
(CH2), 23.88 (CH2), 11.34 (CH3).
HRMS (EI) m/z calcd for [C19H21N3O] 307.1679; found: 307.1679
(15) (Z)-N-((3-(benzyloxy)-5-(1H-pyrrol-2-yl)-2H-pyrrol-2-ylidene)methyl)pentan-1-amine
hydrochloride
Yield (81%). 1H NMR (300 MHz, CDCl3): δ = 13.59 (br s, 1H), 10.61 (br s, 1H), 9.49 (d, J = 14.5 Hz, 1H), 7.39 (m,
5H), 7.35 (d, J = 15.0 Hz, 1H), 6.99 (m, 1H), 6.73 (m, 1H), 6.24 (m, 1H), 6.02 (m, 1H), 5.09 (s, 2H), 3.41
(m, 2H), 1.73 (m, 2H), 1.24 (m, 14H), 0.88 (t, J = 6.6 Hz, 3H). 13
C NMR (75 MHz, CDCl3): = 162.73, 142.31, 140.74 (CH), 135.22, 129.05 (CH), 129.01 (CH), 128.21
(CH), 124.17 (CH), 122.90, 113.30 (CH), 111.20, 110.93 (CH), 92.27 (CH), 73.62 (CH2), 51.20 (CH2),
30.17 (CH2), 28.79 (CH2), 22.39 (CH2), 14.10 (CH3).
HRMS (EI) m/z [M]+ calcd for [C21H25N3O] 335.1992; found: 335.2008
(16) (Z)-N-((3-(benzyloxy)-5-(1H-pyrrol-2-yl)-2H-pyrrol-2-ylidene)methyl)decan-1-amine hydrochloride
Yield (83%). 1H NMR (300 MHz, CDCl3): δ = 13.62 (br s, 1H), 10.61 (br s, 1H), 9.49 (d, J = 14.5 Hz, 1H), 7.42 (m,
5H), 7.35 (d, J = 15.0 Hz, 1H), 7.03 (m, 1H), 6.72 (m, 1H), 6.26 (m, 1H), 6.01 (m, 1H), 5.11 8 s, 2H),
3.44 (m, 2H), 1.73 (m, 2H), 1.24 (m, 14H), 0.86 (t, J = 6.6 Hz, 3H). 13
C NMR (75 MHz, CDCl3): = 162.72, 142.33, 140.71 (CH), 135.20, 129.09 (CH), 129.04 (CH), 128.23
(CH), 124.30 (CH), 122.88, 113.32 (CH), 111.18, 110.92 (CH), 92.21 (CH), 73.62 (CH2), 51.28 (CH2),
32.08 (CH2), 30.53 (CH2), 29.73 (CH2), 29.65 (CH2), 29.48 (CH2), 29.33 (CH2), 26.74 (CH2), 22.90
(CH2), 14.35 (CH3).
HRMS (EI) m/z [M]+ calcd for [C26H35N3O] 405.2775; found: 405.2782
Anion binding titrations
In order to estimate an association constant in solution the perchlorate salts of compounds 2 and 7 were
prepared by successive treatment a dichloromethane solutions of the corresponding hydrochloride salts
with diluted NaOH followed by diluted HClO4 (three times). These two compounds were titrated with
tetrabutyl ammonium chloride in d6-DMSO. And the data processed using WinEQNMR 2 software.3
3 M. J. Hynes, J. Chem. Soc. Dalton Trans., 1993, 311.
Electronic Supplementary Material (ESI) for Chemical CommunicationsThis journal is © The Royal Society of Chemistry 2012
S6
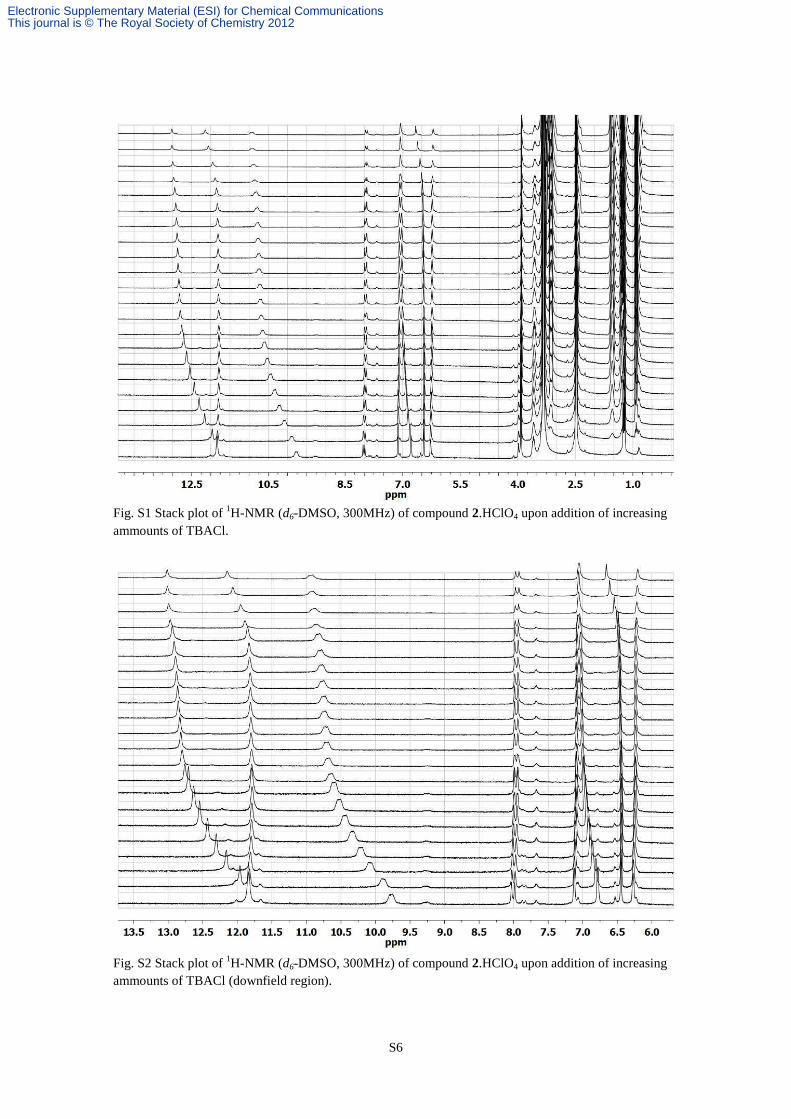
Fig. S1 Stack plot of 1H-NMR (d6-DMSO, 300MHz) of compound 2.HClO4 upon addition of increasing
ammounts of TBACl.
Fig. S2 Stack plot of
1H-NMR (d6-DMSO, 300MHz) of compound 2.HClO4 upon addition of increasing
ammounts of TBACl (downfield region).
Electronic Supplementary Material (ESI) for Chemical CommunicationsThis journal is © The Royal Society of Chemistry 2012

S7
Fig. S3 Changes in the chemical shift corresponding to NH1 (Figure S10) are fitted to a 1:1 model using
WinEQNMR2. Ka= 721 (87) M-1
.
Fig. S4 Stack plot of
1H-NMR (d6-DMSO, 300MHz) of compound 7.HClO4 upon addition of increasing
ammounts of TBACl.
Electronic Supplementary Material (ESI) for Chemical CommunicationsThis journal is © The Royal Society of Chemistry 2012
S8
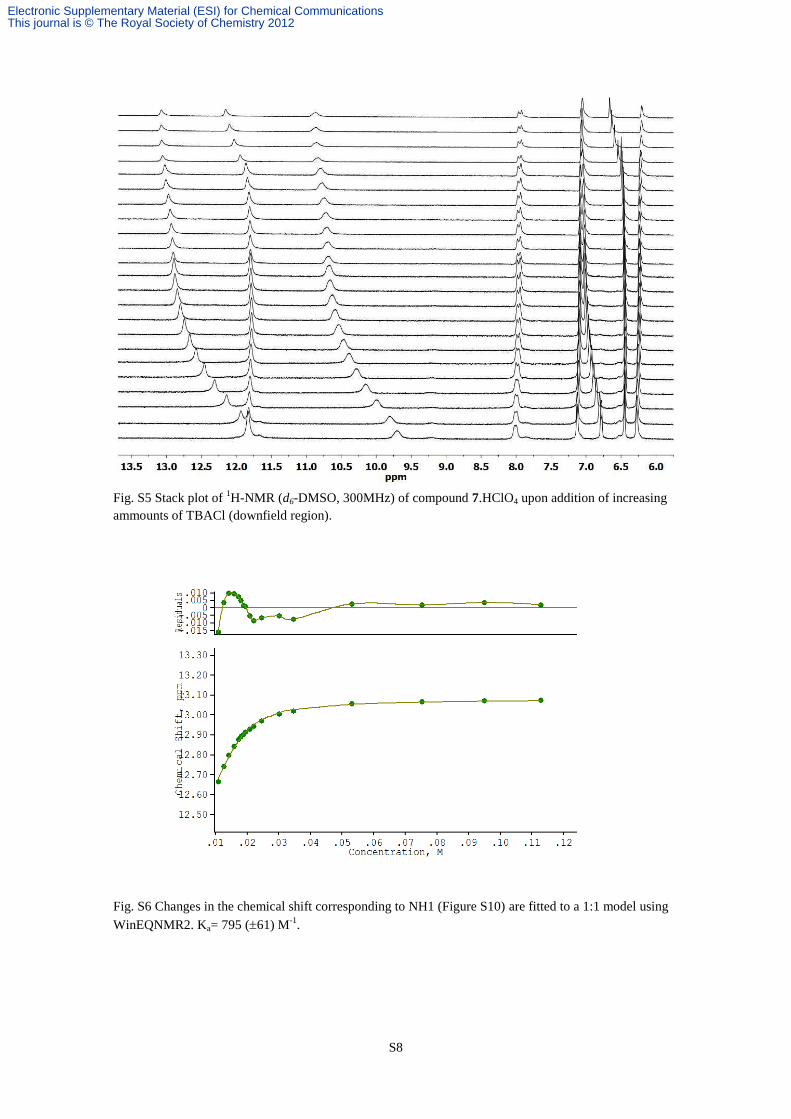
Fig. S5 Stack plot of
1H-NMR (d6-DMSO, 300MHz) of compound 7.HClO4 upon addition of increasing
ammounts of TBACl (downfield region).
Fig. S6 Changes in the chemical shift corresponding to NH1 (Figure S10) are fitted to a 1:1 model using
WinEQNMR2. Ka= 795 (61) M-1
.
Electronic Supplementary Material (ESI) for Chemical CommunicationsThis journal is © The Royal Society of Chemistry 2012
S9
Lipophilicity calculations
Lipophilicity is a parameter of prime importance in drug discovery. It is essential for predicting ADMET
properties and druglikeness of a given molecule. Therefore, there is an enormous interest in developing
computational methods of calculating logP. LogP (the octanol/water partition coefficient) is the parameter
most commonly used for estimating the lipophilicity of a compound. LogP can be experimentally
obtained by the traditional shake-flask method.4 Nevertheless this is time consuming and intensive
research efforts in developing computational methods to estimate logP values of small molecules have
been made.5 There are a number of methods to calculate the logP values of a substance. Essentially they
can be classified as substructure based methods and properties based methods. Substructure based
methods rely in calculations of logP values of fragments/atoms of the molecule and expressing the final
logP value as the sum of the individual contributions of the different fragments. Properties based methods
use descriptions of the whole molecule. VCCLab software allows the calculations of LogP using different
methods such as ALOGPS, AC LogP, ALOGP, MLOGP, KowWIN, XLOPGP2 or XLOGP3, and we
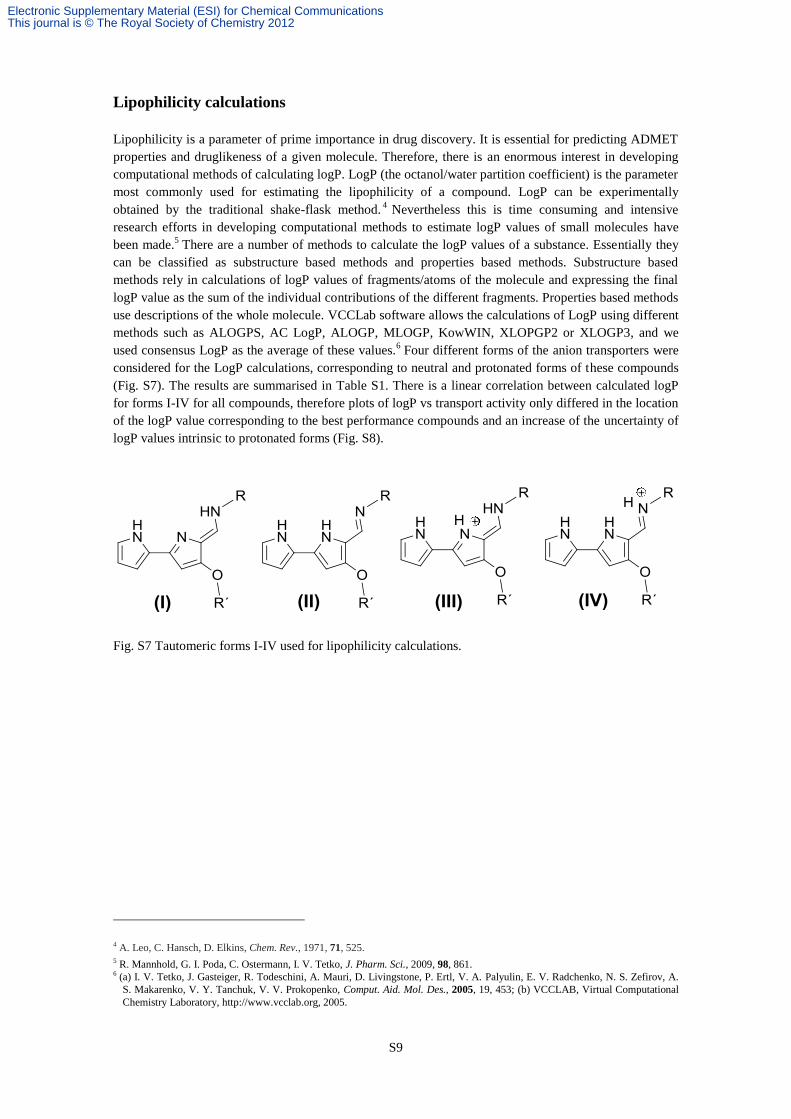
used consensus LogP as the average of these values.6 Four different forms of the anion transporters were
considered for the LogP calculations, corresponding to neutral and protonated forms of these compounds
(Fig. S7). The results are summarised in Table S1. There is a linear correlation between calculated logP
for forms I-IV for all compounds, therefore plots of logP vs transport activity only differed in the location
of the logP value corresponding to the best performance compounds and an increase of the uncertainty of
logP values intrinsic to protonated forms (Fig. S8).
Fig. S7 Tautomeric forms I-IV used for lipophilicity calculations.
4 A. Leo, C. Hansch, D. Elkins, Chem. Rev., 1971, 71, 525. 5 R. Mannhold, G. I. Poda, C. Ostermann, I. V. Tetko, J. Pharm. Sci., 2009, 98, 861. 6 (a) I. V. Tetko, J. Gasteiger, R. Todeschini, A. Mauri, D. Livingstone, P. Ertl, V. A. Palyulin, E. V. Radchenko, N. S. Zefirov, A.
S. Makarenko, V. Y. Tanchuk, V. V. Prokopenko, Comput. Aid. Mol. Des., 2005, 19, 453; (b) VCCLAB, Virtual Computational
Chemistry Laboratory, http://www.vcclab.org, 2005.
Electronic Supplementary Material (ESI) for Chemical CommunicationsThis journal is © The Royal Society of Chemistry 2012

S10
Table S1 Calculated LogP values for compounds 1-16.
Compound LogP I LogP II LogP III LogP IV
1 0.93 0.46 1.50 0.62 0.08 1.57 0.65 1.21
2 1.34 0.51 1.86 0.63 0.45 1.53 1.00 1.16
3 1.78 0.52 2.30 0.66 0.85 1.48 1.40 1.13
4 2.22 0.57 2.73 0.71 1.25 1.46 1.79 1.13
5 2.69 0.63 3.19 0.77 1.67 1.47 2.22 1.17
6 3.16 0.71 3.64 0.83 2.10 1.50 2.63 1.22
7 3.630.79 4.10 0.91 2.52 1.54 3.05 1.30
8 4.26 0.69 4.70 0.73 3.06 1.61 3.59 1.33
9 4.700.74 5.100.80 3.471.66 4.011.42
10 5.130.81 5.630.89 3.881.74 4.411.53
11 6.09 0.92 6.52 1.07 4.71 1.91 5.23 1.78
12 2.11 0.56 2.62 0.65 1.16 1.45 1.71 1.10
13 2.59 0.64 3.07 0.71 1.58 1.49 2.12 1.16
14 3.440.69 3.810.78 2.241.42 2.781.14
15 4.20 0.78 4.68 0.92 3.04 1.49 3.57 1.29
16 6.640.96 7.051.08 5.211.93 5.731.84
Fig. S8: Representation of logP values calculated for compounds 1-16 using the different tautomeric
forms I-IV vs transport activity.
We also gathered experimental data for measuring the lipophilicity of compounds 1-16 and checking the
reliability of calculated logP values. An easy, yet reliable method, for determine the relative lipophilicity
of a class of molecules involve the use of HPLC and reverse phase column.7 The retention time of each
7 (a) L.-G. Danielsson, Y.-H. Zhang, trends in analytical chemistry, 1996, 15, 188-196; (b) D. Henry, J. H. Block, J. L. Anderson, G.
R. Carlson, J. Med. Chem., 1976, 19, 619; (c) K. Valkó, J. Chromatogr. A, 2004, 1037, 299.
Electronic Supplementary Material (ESI) for Chemical CommunicationsThis journal is © The Royal Society of Chemistry 2012

S11
molecule on the reverse phase column is related to its lipophilicity. The products were dissolved in
MeOH at concentration of 1 to 2 mM and injected (2uL) on a phenomenex kromasil c8 (100Å,
250x4.6mm, 5 micron) using an Agilent 1100 HPLC. They were eluted using a linear gradient of 20% to
95% of acetonitrile in water in 30 min (Both solvent were modified by 0.1% of formic acid). The peaks
were detected at 254nm with reference on 550nm.
The retention time of each molecule was plotted against the calculated logP showing a linear correlation,
proving that the calculated logP are reliable (Fig. S9).
y = 2.9568x + 3.5293
R2 = 0.9836
0
5
10
15
20
25
0 1 2 3 4 5 6 7 8
LogP
Rete
nti
on
tim
e(m
in)
Fig. S9 Representation of retention times vs calculated logP values for compounds 1-16, showing the
linear relationships between both parameters.
Membrane transport assays
Preparation of Phospholipid Vesicles. A chloroform solution (20 mg/mL) of 1-palmitoyl-2-oleoyl-sn-
glycero-3-phosphocholine (POPC) (Sigma-Aldrich) was evaporated in vacuo using a rotary evaporator
and the lipid film obtained was dried under high vacuum for at least 2 hours. The lipid film was
rehydrated by addition of a sodium chloride solution (451 mM NaCl and 20 mM phosphate buffer, pH
7.2) followed by vortexing. The lipid suspension was then subjected to nine freeze-thaw cycles and
twenty-nine extrusions through a 200 nm polycarbonate Nucleopore membrane using a LiposoFast Basic
extruder (Avestin, Inc.). The resulting unilamellar vesicles were dialyzed against Na2SO4 solution (150
mM Na2SO4 and 20 mM phosphate buffer, pH 7.2) to remove unencapsulated chloride.
ISE Transport Assays. Unilamellar POPC vesicles (200 nm mean diameter) containing an encapsulated
solution of 451 mM NaCl and 20 mM phosphate buffer, pH 7.2, were suspended in a solution 150 mM
Na2SO4 and 20 mM phosphate buffer, pH 7.2, for a final lipid concentration of 0.5 mM and a total volume
of 5 mL. A DMSO solution of the carrier molecule, typically 5 µL to avoid influence of the solvent
molecules in the assay, was added, followed by a solution of NaHCO3 (500 mM in Na2SO4 buffered to
pH 7.2 with 20 mM sodium phosphate salts) for a final bicarbonate concentration of 40 mM. The chloride
release from vesicles was monitored using a sympHony chloride selective electrode. At the end of the
experiment the vesicles were lysed with detergent (triton-X 10% dispersion in water, 60 µL) to release all
chloride ions; the resulting value was considered to represent 100% release and used as such.
Electronic Supplementary Material (ESI) for Chemical CommunicationsThis journal is © The Royal Society of Chemistry 2012
S12
0
20
40
60
80
100
0 60 120 180 240 300 360
time , s
% C
hlo
rid
e e
fflu
x
1
2
3
4
5
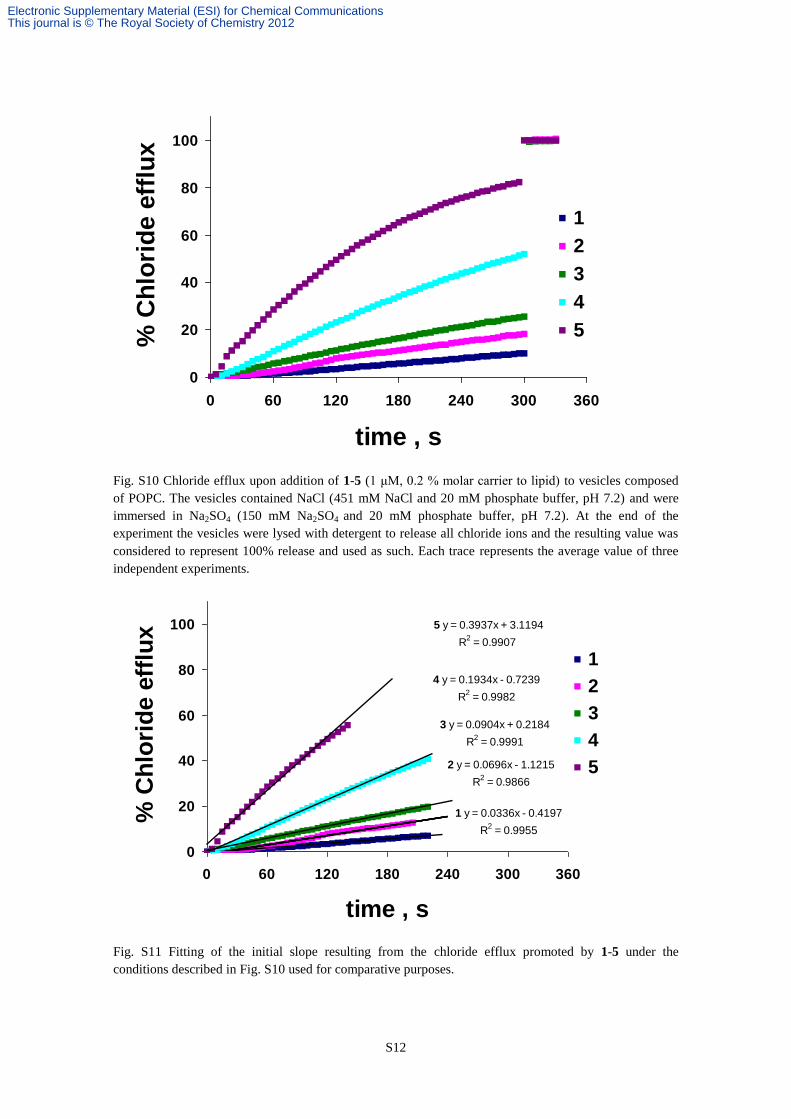
Fig. S10 Chloride efflux upon addition of 1-5 (1 μM, 0.2 % molar carrier to lipid) to vesicles composed
of POPC. The vesicles contained NaCl (451 mM NaCl and 20 mM phosphate buffer, pH 7.2) and were
immersed in Na2SO4 (150 mM Na2SO4 and 20 mM phosphate buffer, pH 7.2). At the end of the
experiment the vesicles were lysed with detergent to release all chloride ions and the resulting value was
considered to represent 100% release and used as such. Each trace represents the average value of three
independent experiments.
5 y = 0.3937x + 3.1194
R2 = 0.9907
4 y = 0.1934x - 0.7239
R2 = 0.9982
3 y = 0.0904x + 0.2184
R2 = 0.9991
2 y = 0.0696x - 1.1215
R2 = 0.9866
1 y = 0.0336x - 0.4197
R2 = 0.9955
0
20
40
60
80
100
0 60 120 180 240 300 360
time , s
% C
hlo
rid
e e
fflu
x
1
2
3
4
5
Fig. S11 Fitting of the initial slope resulting from the chloride efflux promoted by 1-5 under the
conditions described in Fig. S10 used for comparative purposes.
Electronic Supplementary Material (ESI) for Chemical CommunicationsThis journal is © The Royal Society of Chemistry 2012
S13
0
20
40
60
80
100
0 60 120 180 240 300 360
time , s
% C
hlo
rid
e e
fflu
x6
7
8
9
10
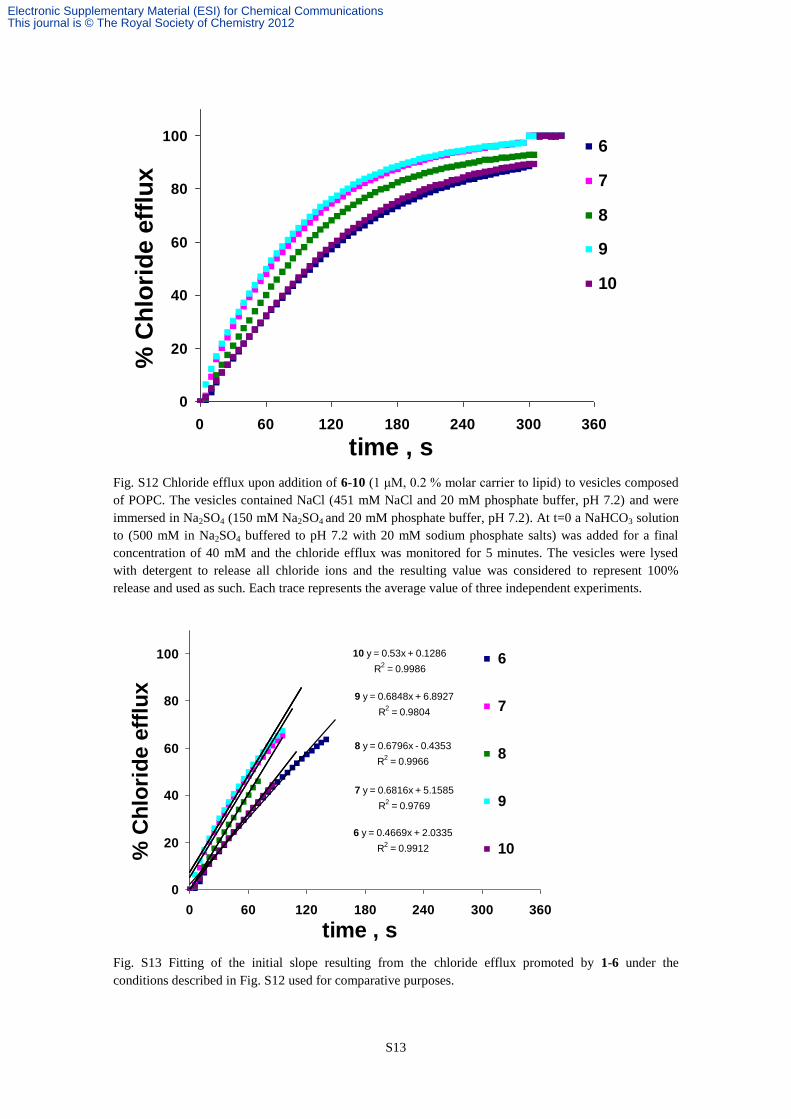
Fig. S12 Chloride efflux upon addition of 6-10 (1 μM, 0.2 % molar carrier to lipid) to vesicles composed
of POPC. The vesicles contained NaCl (451 mM NaCl and 20 mM phosphate buffer, pH 7.2) and were
immersed in Na2SO4 (150 mM Na2SO4 and 20 mM phosphate buffer, pH 7.2). At t=0 a NaHCO3 solution
to (500 mM in Na2SO4 buffered to pH 7.2 with 20 mM sodium phosphate salts) was added for a final
concentration of 40 mM and the chloride efflux was monitored for 5 minutes. The vesicles were lysed
with detergent to release all chloride ions and the resulting value was considered to represent 100%
release and used as such. Each trace represents the average value of three independent experiments.
6 y = 0.4669x + 2.0335
R2 = 0.9912
7 y = 0.6816x + 5.1585
R2 = 0.9769
8 y = 0.6796x - 0.4353
R2 = 0.9966
10 y = 0.53x + 0.1286
R2 = 0.9986
9 y = 0.6848x + 6.8927
R2 = 0.9804
0
20
40
60
80
100
0 60 120 180 240 300 360
time , s
% C
hlo
rid
e e
fflu
x
6
7
8
9
10
Lineal (7)
Lineal (8)
Lineal(10)Lineal (9)
Fig. S13 Fitting of the initial slope resulting from the chloride efflux promoted by 1-6 under the
conditions described in Fig. S12 used for comparative purposes.
Electronic Supplementary Material (ESI) for Chemical CommunicationsThis journal is © The Royal Society of Chemistry 2012

S14
0
20
40
60
80
100
0 60 120 180 240 300 360
time , s
% C
hlo
rid
e e
fflu
x
11
12
13
14
15
16
Fig. S14 Chloride efflux upon addition of 11-16 (0.1 μM, 0.02 % molar carrier to lipid) to vesicles
composed of POPC. The vesicles contained NaCl (476 mM NaCl and 10 mM phosphate buffer, pH 7.2)
and were immersed in NaNO3 (476 mM NaNO3 and 10 mM phosphate buffer, pH 7.2). Once the
electrode reading was stable the carrier was added and the chloride efflux was monitored for 5 minutes.
At the end of the experiment the vesicles were lysed with detergent to release all chloride ions and the
resulting value was considered to represent 100% release and used as such.
13 y = 0.3188x - 0.5564
R2 = 0.9978
14 y = 0.2994x + 0.3661
R2 = 0.9976
16 y = 0.2484x - 3.1707
R2 = 0.9968
12 y = 0.2045x - 1.3174
R2 = 0.9942
11 y = 0.4993x + 4.13
R2 = 0.9909
15 y = 0.6984x + 4.6574
R2 = 0.9782
0
20
40
60
80
100
0 60 120 180 240 300 360
time , s
% C
hlo
rid
e e
fflu
x 11
12
13
14
15
16
Fig. S15 Fitting of the initial slope resulting from the chloride efflux promoted by 11-16 under the
conditions described in Fig. S14 used for comparative purposes.
Electronic Supplementary Material (ESI) for Chemical CommunicationsThis journal is © The Royal Society of Chemistry 2012

S15
13C NMR liposome Assays.
6 mL of a chloroform solution of 1-palmitoyl-2-oleoyl-sn-glycero-3-phosphocholine (POPC) (20 mg/mL)
(Sigma-Aldrich) was evaporated in vacuo using a rotary evaporator and the lipid film obtained was dried
under high vacuum for at least 2 hours. The lipid film was rehydrated by addition of 2 mL of NaH13
CO3
500 mM followed by careful vortexing. The lipid suspension was then subjected to nine freeze-thaw
cycles and seven extrusions through a 200 nm polycarbonate Nucleopore membrane using a LiposoFast
Basic extruder (Avestin, Inc.). The resulting suspension of vesicles was dialyzed against Na2SO4 solution
(150 mM Na2SO4 and 20 mM phosphate buffer, pH 7.2 to exchange unencapsulated bicarbonate. 380 µL
of this suspension were placed in a NMR sample and 40 µL of D2O added. An initial 13
C NMR was
acquired (400 pulses). A NaCl was added next for a external chloride concentration of 50 mM followed
by 5 µL of a 10 mM solution of the compound studied in DMSO. After 5 minutes a 13
C NMR was
acquired (400 pulses). Finally 5 µL of a 40 mM solution of MnCl2 were added and a 13
C NMR was again
acquired (400 pulses).
Fig. S16 13
C NMR spectra evidencing the facilitated bicarbonate/chloride exchange. a) POPC vesicles
loaded with 500 mM NaH13
CO3 dispersed in 162 mM Na2SO4 buffered at pH 7.2 with 20 mM phosphate.
b) After addition of NaCl (50 mM) and active tambjamine carrier 8 (0.16 % mol carrier to lipid
concentration). c) After addition of MnCl2 (0.5 mM) a paramagnetic reagent affecting only extravesicular
H13
CO3─
anions the signal is broaden to the baseline.
Electronic Supplementary Material (ESI) for Chemical CommunicationsThis journal is © The Royal Society of Chemistry 2012

S16
Hill plot analyses. Transport assays were carried out using various concentrations of carriers using the
conditions described above. The chloride efflux (%) 290 s was plotted as a function of the carrier
concentration and the data fitted to the Hill equation: y=Vmax xn
/ (kn
+ xn) where x is the carrier
concentration, Vmax is the maximum chloride efflux (100%) and y is the chloride efflux at 290 s (%). n is
the Hill coefficient and k is the carrier concentration needed to reach 50% of chloride efflux k and n are
the parameters to be fitted. The results are summarized in Table S2. n (Hill coeficient) values close to 1
supported the discrete carrier mechanism for the transport mediated by these compounds.
Table S2 Overview of hill analyses for compounds 7,9,14 and 15.
Compound Transport activity (% s-1) EC50, 290 s [µM] EC50, 290 s
(% carrier to lipid) n (Hill coeficient)
7 0.682 0.121 0.024 1.14
9 0.685 0.112 0.022 1.08
14 0.299 0.38 0.076 1.02
15 0.698 0.146 0.029 1.12
Fig. S17 Right: Chloride efflux upon addition of 7 (5-0.05 μM, 1-0.01 % molar carrier to lipid) to vesicles
composed of POPC. The vesicles contained NaCl (451 mM NaCl and 20 mM phosphate buffer, pH 7.2)
and were immersed in Na2SO4 (150 mM Na2SO4 and 20 mM phosphate buffer, pH 7.2). At t=0 a NaHCO3
solution to (500 mM in Na2SO4 buffered to pH 7.2 with 20 mM sodium phosphate salts) was added for a
final concentration of 40 mM and the chloride efflux was monitored for 5 minutes. The vesicles were
lysed with detergent to release all chloride ions and the resulting value was considered to represent 100%
release and used as such; Left: Hill plot corresponding to chloride efflux under these conditions.
Fig. S18 Right: Chloride efflux upon addition of 9 (5-0.05 μM, 1-0.01 % molar carrier to lipid) to vesicles
composed of POPC. The vesicles contained NaCl (451 mM NaCl and 20 mM phosphate buffer, pH 7.2)
and were immersed in Na2SO4 (150 mM Na2SO4 and 20 mM phosphate buffer, pH 7.2). At t=0 a NaHCO3
solution to (500 mM in Na2SO4 buffered to pH 7.2 with 20 mM sodium phosphate salts) was added for a
final concentration of 40 mM and the chloride efflux was monitored for 5 minutes. The vesicles were
Electronic Supplementary Material (ESI) for Chemical CommunicationsThis journal is © The Royal Society of Chemistry 2012
S17
lysed with detergent to release all chloride ions and the resulting value was considered to represent 100%
release and used as such; Left: Hill plot corresponding to chloride efflux under these conditions.
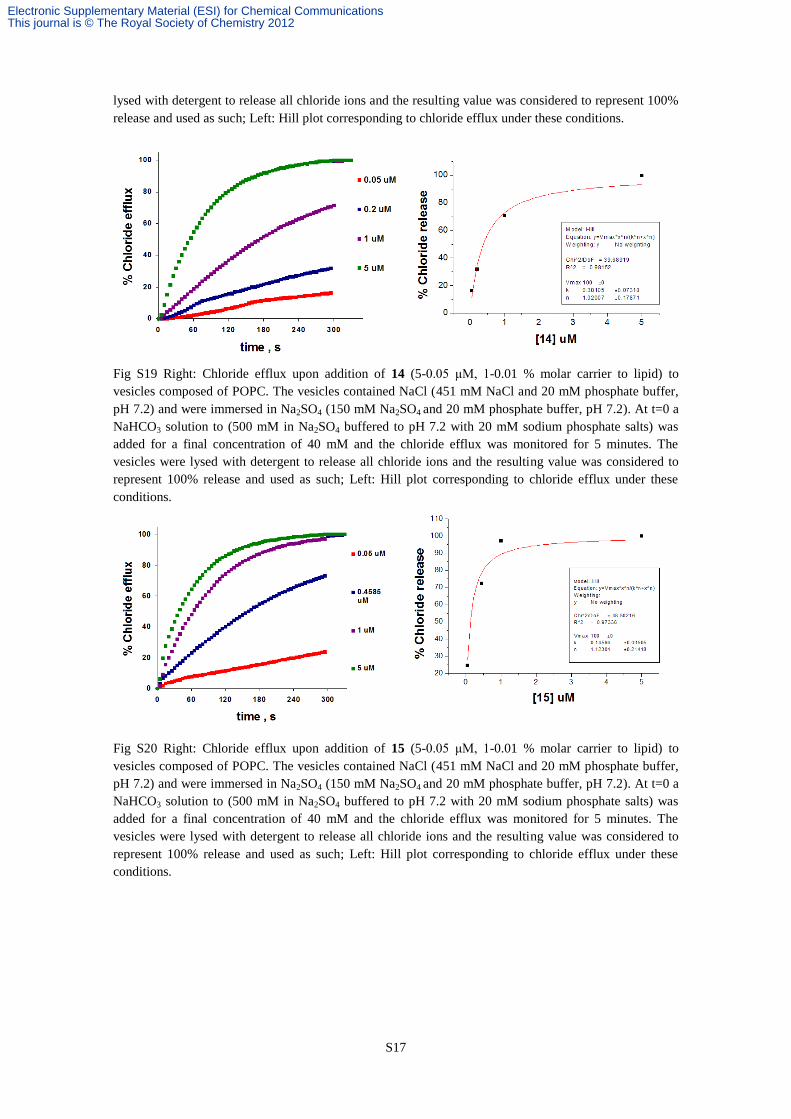
Fig S19 Right: Chloride efflux upon addition of 14 (5-0.05 μM, 1-0.01 % molar carrier to lipid) to
vesicles composed of POPC. The vesicles contained NaCl (451 mM NaCl and 20 mM phosphate buffer,
pH 7.2) and were immersed in Na2SO4 (150 mM Na2SO4 and 20 mM phosphate buffer, pH 7.2). At t=0 a
NaHCO3 solution to (500 mM in Na2SO4 buffered to pH 7.2 with 20 mM sodium phosphate salts) was
added for a final concentration of 40 mM and the chloride efflux was monitored for 5 minutes. The
vesicles were lysed with detergent to release all chloride ions and the resulting value was considered to
represent 100% release and used as such; Left: Hill plot corresponding to chloride efflux under these
conditions.
Fig S20 Right: Chloride efflux upon addition of 15 (5-0.05 μM, 1-0.01 % molar carrier to lipid) to
vesicles composed of POPC. The vesicles contained NaCl (451 mM NaCl and 20 mM phosphate buffer,
pH 7.2) and were immersed in Na2SO4 (150 mM Na2SO4 and 20 mM phosphate buffer, pH 7.2). At t=0 a
NaHCO3 solution to (500 mM in Na2SO4 buffered to pH 7.2 with 20 mM sodium phosphate salts) was
added for a final concentration of 40 mM and the chloride efflux was monitored for 5 minutes. The
vesicles were lysed with detergent to release all chloride ions and the resulting value was considered to
represent 100% release and used as such; Left: Hill plot corresponding to chloride efflux under these
conditions.
Electronic Supplementary Material (ESI) for Chemical CommunicationsThis journal is © The Royal Society of Chemistry 2012

S18
Computational Details
The protonated tambjamine derivatives 1-11 were described with default parameters from the General
AMBER Force Field (GAFF),8 apart the bond length between ylidene and bipyrrole fragments and the
ylidene bond length, which were changed based on the crystal structure data. The ideal bond lengths and
the corresponding force constants are given in Figure S21 with the atom types for bipyrrole-enamine
moiety transport unit.
Fig S21 GAFF atom types for the bipyrrole-enamine moiety assigned by antechamber. The cc-ce bond
length was changed to 1.3700 Å and the force constant to 440.30 kcalmol−1
Å−2
, while for ce-nh the
corresponding bond stretching terms were changed to 1.3120 Å and 534.90 kcalmol−1
Å−2
, respectively.
The Molecular Dynamics (MD) studies were carried out with the AMBER software package9 using the
following protocol:
Multi-conformational RESP charge fitting of the transporters.
Due to the conformational flexibility imposed by the R alkyl substituents and as well as the syn and anti
configurations that the bipyrrole moiety can assume derived from its eventual fluxional behaviour, four
distinct conformations of each transporter were used to calculate the atomic point charges by means of
multi-conformational RESP charge fitting methodology. Therefore, the transporters 1-11 were initially
geometry optimized at the HF/6-31G* level of theory using Gaussian0910 with a starting random structure.
Subsequently, parameters from GAFF were assigned to the transporters and RESP atomic charges were
fitted to the electrostatic potential obtained at the HF/6-31G* using 4 concentric layer of points per atom
and 6 points per unit area (Gaussian IOP 6/33=2, 6/41=4, 6/42=6) in agreement with the methodology
followed in the force field reference.8 Then, transporters 1-11 were submitted to a 3 ns MD run in the gas
phase at 1000 K using sander,10
which allows a stochastic covering of the conformational space of the
transporters, and saving a trajectory file composed of 30000 structures. All these structures were further
minimized by molecular mechanics (MM), through 1000 steps of the steepest descent method, followed
8 (a) J. Wang, R. M. Wolf, J. W. Caldwell, P. A. Kollman and D. A. Case, J Comput Chem, 2004, 25, 1157-1174. (b) J. Wang, R. M.
Wolf, J. W. Caldwell, P. A. Kollman and D. A. Case, Journal of Computational Chemistry, 2005, 26, 114-114. 9 D. A. Case, T. A. Darden, T.E. Cheatham III, C. L. Simmerling, J. Wang, R. E. Duke, R. Luo, R. C. Walker, W. Zhang, K. M.
Merz, B. P. Roberts, B. Wang, S. Hayik, A. Roitberg, G. Seabra, I. Kolossvai, K. F. Wong, F. Paesani, J. Vanicek, J. Liu, X. Wu, S. R. Brozell, T. Steinbrecher, H. Gohlke, Q. Cai, X. Ye, J. Wang, M.-J. Hsieh, G. Cui, D. R. Roe, D. H. Mathews, M. G.
Seetin, C. Sagui, V. Babin, T. Luchko, S. Gusarov, A. Kovalenko and P. A. Kollman, AMBER 11, (2010) University of
California, San Francisco. 10 M. J. Frisch, G. W. Trucks, H. B. Schlegel, G. E. Scuseria, M. A. Robb, J. R. Cheeseman, G. Scalmani, V. Barone, B. Mennucci,
G. A. Petersson, H. Nakatsuji, M. Caricato, X. Li, H. P. Hratchian, A. F. Izmaylov, J. Bloino, G. Zheng, J. L. Sonnenberg, M.
Hada, M. Ehara, K. Toyota, R. Fukuda, J. Hasegawa, M. Ishida, T. Nakajima, Y. Honda, O. Kitao, H. Nakai, T. Vreven, J. J. A. Montgomery, J. E. Peralta, F. Ogliaro, M. Bearpark, J. J. Heyd, E. Brothers, K. N. Kudin, V. N. Staroverov, R. Kobayashi,
J. Normand, K. Raghavachari, A. Rendell, J. C. Burant, S. S. Iyengar, J. Tomasi, M. Cossi, N. Rega, J. M. Millam, M. Klene,
J. E. Knox, J. B. Cross, V. Bakken, C. Adamo, J. Jaramillo, R. Gomperts, R. E. Stratmann, O. Yazyev, A. J. Austin, R. Cammi, C. Pomelli, J. W. Ochterski, R. L. Martin, K. Morokuma, V. G. Zakrzewski, G. A. Voth, P. Salvador, J. J.
Dannenberg, S. Dapprich, A. D. Daniels, Ö. Farkas, J. B. Foresman, J. V. Ortiz, J. Cioslowski and D. J. Fox, Gaussian 09,
(2009) Gaussian, Inc., Pittsburgh PA.
Electronic Supplementary Material (ESI) for Chemical CommunicationsThis journal is © The Royal Society of Chemistry 2012

S19
by the conjugate gradient method until a convergence criterion of 0.0001 kcalmol-1
was achieved. The
MM minimized conformations of each transporter were then clustered by root-mean-square deviation
(RMSD) similarity and 4 different conformations were chosen for each transporter.
These 4 conformations were again geometry optimized at the HF/6-31G* level of theory and the
electrostatic potential was calculated for each of them, allowing the calculation of multi-conformational
RESP atomic point charges, using identical weights for all conformations.
Simulations in Water and Surface Area calculations.
The lowest-energy conformation found in the previous step for tambjamine derivatives 1-11 was
immersed in a cubic box composed of 2090 SPC/E model water11 molecules using PACKMOL.12 The
solvent was initially relaxed, while keeping the solute fixed with a harmonic restraint of 500 kcalmol-1
Å-2
,
followed by a MM minimization off all system. Subsequently, the system was heated to 300 K during 50
ps using the Langevin thermostat with a collision frequency of 1 ps-1
in an NVT ensemble. After 200 ps
of equilibration in a NPT ensemble at 1 atm with isotropic pressure scaling using relaxation time of 2 ps,
the data were collected during 25 ns for all transporters. The SHAKE algorithm was used to constrain all
bonds involving hydrogen atoms, thus allowing the usage of 2 fs time step. A 10 Å cut-off was used for
the non-bonded van der Waals interactions. Frames were saved every 1.0 ps leading to a trajectory file
containing 25000 structures. All unconstrained MD simulations were carried out with the pmemd.cuda
AMBER executable, able to accelerate explicit solvent Particle Mesh Ewald (PME)13 calculations through
the use of GPUs.14
The polar surface area (PSA) was calculated over the 25000 frames, taking into account only the polar
atoms (N and O) of the bipyrrole entity of tambjamine derivatives 1-11 and the N-H hydrogen atoms,
using the Linear Combinations of Pairwise Overlaps (LCPO) algorithm15
as implemented in the cpptraj
utility of Ambertools 1.5.10
The total surface area (TSA) was calculated in the same way, but taking into
account all atoms of the transporters.
The results obtained are listed in Table S3 and plotted in Fig. S22, and demonstrate that the Total Surface
Area increases with the increase of the R alkyl substituent, while the Polar Surface Area remains almost
constant, regardless of the R substituent.
11 H. J. C. Berendsen, J. R. Grigera and T. P. Straatsma, J Phys Chem-Us, 1987, 91, 6269-6271. 12 L. Martinez, R. Andrade, E. G. Birgin and J. M. Martinez, J Comput Chem, 2009, 30, 2157-2164. 13 (a) T. Darden, D. York and L. Pedersen, J Chem Phys, 1993, 98, 10089-10092. (b) U. Essmann, L. Perera, M. L. Berkowitz, T.
Darden, H. Lee and L. G. Pedersen, Journal of Chemical Physics, 1995, 103, 8577-8593. 14 (a) A. W. Goetz, R. Salomon-Ferrer, D. Poole, S. L. Grand and R. C. Walker, “Routine microsecond molecular dynamics
simulations with AMBER – Part II: Particle Mesh Ewald” (in preparation), 2011. (b) see http://ambermd.org/gpus/ (accessed
in 2011/11/20) 15 J. Weiser, P. S. Shenkin and W. C. Still, Journal of Computational Chemistry, 1999, 20, 217-230.
Electronic Supplementary Material (ESI) for Chemical CommunicationsThis journal is © The Royal Society of Chemistry 2012

S20
Table S3. Computed TSA and PSA values for compounds 1-11 with the standard deviations (average ±
standard deviation).
Transporter TSA (Ų) PSA (Ų)
1 345.25 ± 4.57 78.54± 1.45
2 376.49 ± 3.95 74.85± 1.08
3 404.20 ± 6.86 72.07± 1.49
4 430.04 ± 9.85 69.68± 2.17
5 463.80 ± 9.11 70.64± 1.94
6 492.35± 11.84 70.54± 2.04
7 522.02± 12.51 70.38± 2.34
8 545.44± 21.18 69.23± 3.47
9 576.76± 22.10 69.70± 3.27
10 597.16± 34.93 68.64± 4.24
11 641.31± 51.56 67.60± 5.62
Fig. S22 Calculated TSA (blue markers) and PSA (red markers) values for the different transporters.
Estimation of the relative binding free energies for the chloride-protonated tambjamine complexes.
The chloride anion in the protonated tambjamine associations 1-7 was described with van der Waals
parameters developed to be used along the SPC/E water model 16 and with a charge set to -1. The
structures of the chloride protonated complexes were established in gas phase via a quenched molecular
dynamics run of 1 ns following a protocol identical to described above for conformational analyses of
free protonated tambjamine derivatives. The lowest energy binding arrangement of each complex or the
corresponding free tambjamine was subsequently solvated with 1273 DMSO molecules17 affording a
cubic box, which as further equilibrated under periodic conditions using a multistage protocol equivalent
to that explained above for the simulations carried out in water solution with free protonated transporters
1-11. After 200 ns of a NPT run performed with the PMEMD CUDA module within the AMBER11, the
density of the cubic boxes were in agreement with the experimental density of the DMSO and then the
system was considered equilibrated and suitable to be used in the subsequent constrained MD simulations.
16 I. S. Joung and T. E. Cheatham, J Phys Chem B, 2008, 112, 9020-9041. 17 T. Fox and P. A. Kollman, J Phys Chem B, 1998, 102, 8070-8079.
Electronic Supplementary Material (ESI) for Chemical CommunicationsThis journal is © The Royal Society of Chemistry 2012
S21
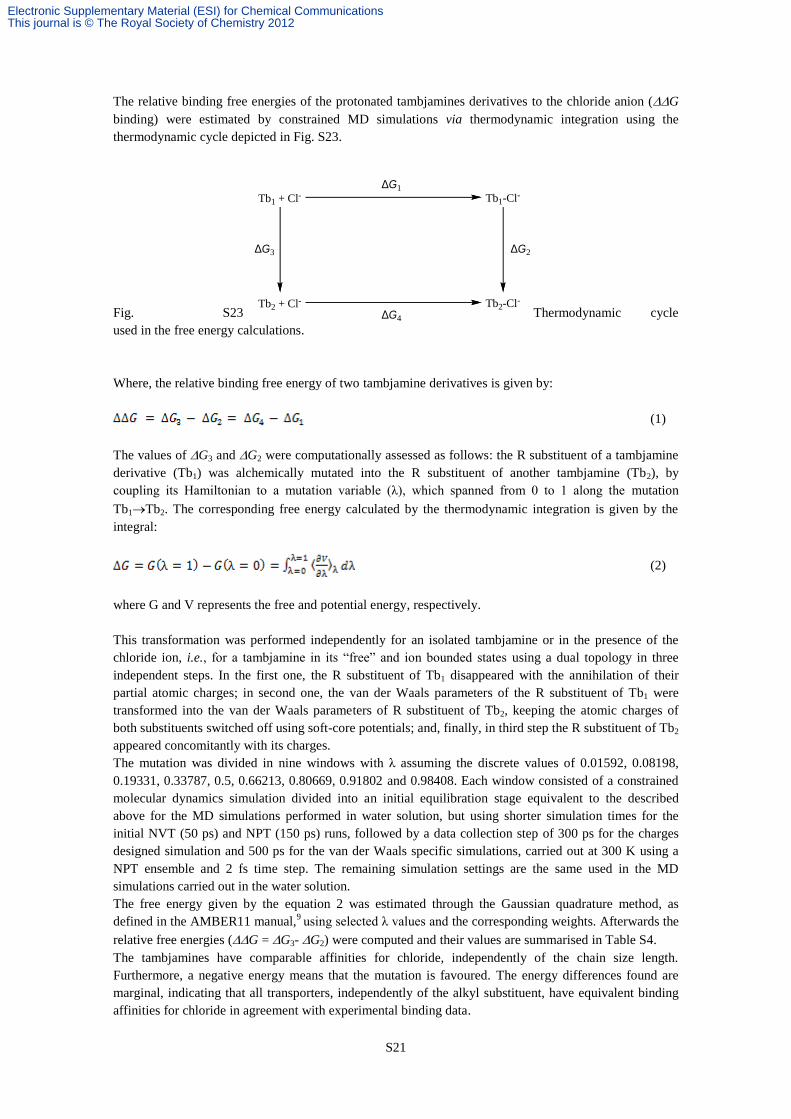
The relative binding free energies of the protonated tambjamines derivatives to the chloride anion (G
binding) were estimated by constrained MD simulations via thermodynamic integration using the
thermodynamic cycle depicted in Fig. S23.
Fig. S23 Thermodynamic cycle
used in the free energy calculations.
Where, the relative binding free energy of two tambjamine derivatives is given by:
(1)
The values of G3 and G2 were computationally assessed as follows: the R substituent of a tambjamine
derivative (Tb1) was alchemically mutated into the R substituent of another tambjamine (Tb2), by
coupling its Hamiltonian to a mutation variable (λ), which spanned from 0 to 1 along the mutation
Tb1Tb2. The corresponding free energy calculated by the thermodynamic integration is given by the
integral:
(2)
where G and V represents the free and potential energy, respectively.
This transformation was performed independently for an isolated tambjamine or in the presence of the
chloride ion, i.e., for a tambjamine in its “free” and ion bounded states using a dual topology in three
independent steps. In the first one, the R substituent of Tb1 disappeared with the annihilation of their
partial atomic charges; in second one, the van der Waals parameters of the R substituent of Tb1 were
transformed into the van der Waals parameters of R substituent of Tb2, keeping the atomic charges of
both substituents switched off using soft-core potentials; and, finally, in third step the R substituent of Tb2
appeared concomitantly with its charges.
The mutation was divided in nine windows with λ assuming the discrete values of 0.01592, 0.08198,
0.19331, 0.33787, 0.5, 0.66213, 0.80669, 0.91802 and 0.98408. Each window consisted of a constrained
molecular dynamics simulation divided into an initial equilibration stage equivalent to the described
above for the MD simulations performed in water solution, but using shorter simulation times for the
initial NVT (50 ps) and NPT (150 ps) runs, followed by a data collection step of 300 ps for the charges
designed simulation and 500 ps for the van der Waals specific simulations, carried out at 300 K using a
NPT ensemble and 2 fs time step. The remaining simulation settings are the same used in the MD
simulations carried out in the water solution.
The free energy given by the equation 2 was estimated through the Gaussian quadrature method, as
defined in the AMBER11 manual,9
using selected λ values and the corresponding weights. Afterwards the
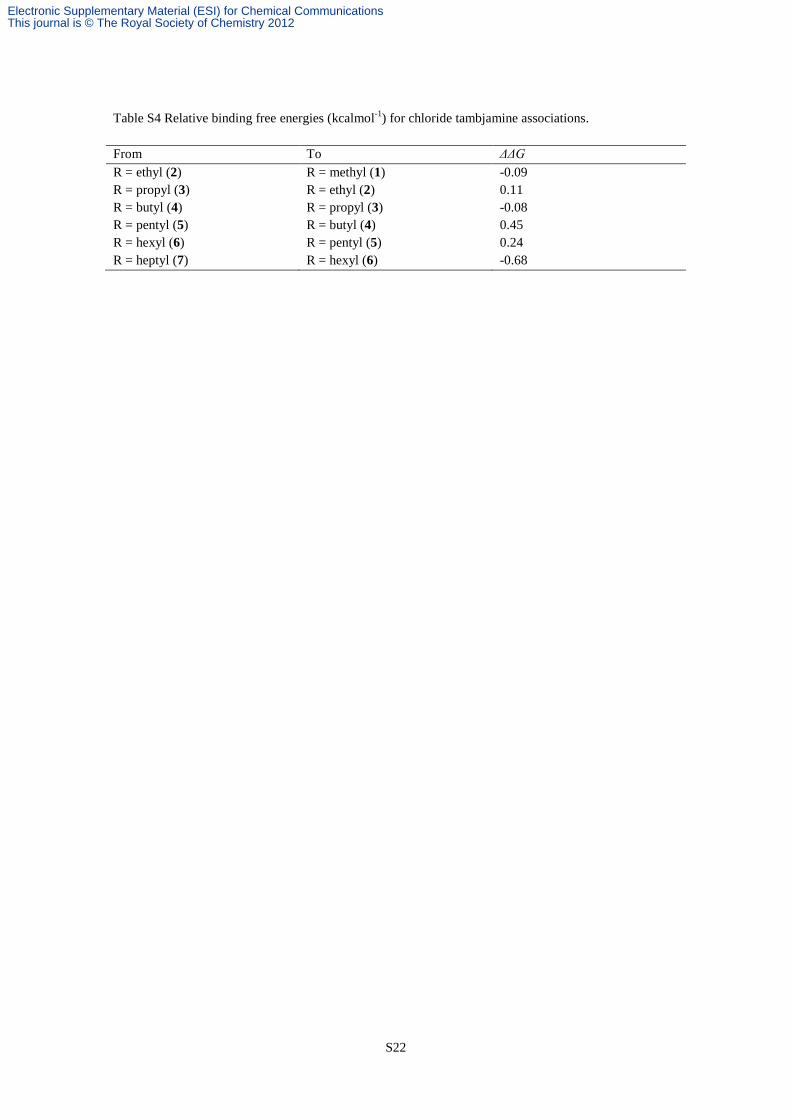
relative free energies (G = G3- G2) were computed and their values are summarised in Table S4.
The tambjamines have comparable affinities for chloride, independently of the chain size length.
Furthermore, a negative energy means that the mutation is favoured. The energy differences found are
marginal, indicating that all transporters, independently of the alkyl substituent, have equivalent binding
affinities for chloride in agreement with experimental binding data.
Tb1 + Cl-
Tb2 + Cl-
Tb1-Cl-
Tb2-Cl-
DG1
DG3
DG4
DG2
Electronic Supplementary Material (ESI) for Chemical CommunicationsThis journal is © The Royal Society of Chemistry 2012
S22
Table S4 Relative binding free energies (kcalmol-1
) for chloride tambjamine associations.
From To ΔΔG
R = ethyl (2) R = methyl (1) -0.09
R = propyl (3) R = ethyl (2) 0.11
R = butyl (4) R = propyl (3) -0.08
R = pentyl (5) R = butyl (4) 0.45
R = hexyl (6) R = pentyl (5) 0.24
R = heptyl (7) R = hexyl (6) -0.68
Electronic Supplementary Material (ESI) for Chemical CommunicationsThis journal is © The Royal Society of Chemistry 2012

S23
NMR spectra of compounds 1-16
Fig. S24
1H NMR spectrum of compound 1.HCl (CDCl3).
Fig. S25
13C NMR spectrum of compound 1.HCl (CDCl3).
Electronic Supplementary Material (ESI) for Chemical CommunicationsThis journal is © The Royal Society of Chemistry 2012
S24
Fig. S26
1H NMR spectrum of compound 2.HCl (CDCl3).
Fig. S27
13C NMR spectrum of compound 2.HCl (CDCl3).
Electronic Supplementary Material (ESI) for Chemical CommunicationsThis journal is © The Royal Society of Chemistry 2012

S25
Fig. S28
1H NMR spectrum of compound 3.HCl (CDCl3).
Fig. S29
13C NMR spectrum of compound 3.HCl (CDCl3).
Electronic Supplementary Material (ESI) for Chemical CommunicationsThis journal is © The Royal Society of Chemistry 2012

S26
Fig. S30
1H NMR spectrum of compound 4.HCl (CDCl3).
Fig. S31
13C NMR spectrum of compound 4.HCl (CDCl3).
Electronic Supplementary Material (ESI) for Chemical CommunicationsThis journal is © The Royal Society of Chemistry 2012

S27
Fig. S32 1H NMR spectrum of compound 5.HCl (CDCl3).
Fig. S33 13
C NMR spectrum of compound 5.HCl (CDCl3).
Electronic Supplementary Material (ESI) for Chemical CommunicationsThis journal is © The Royal Society of Chemistry 2012

S28
Fig. S34
1H NMR spectrum of compound 6.HCl (CDCl3).
Fig. S35 13
C NMR spectrum of compound 6.HCl (CDCl3).
Electronic Supplementary Material (ESI) for Chemical CommunicationsThis journal is © The Royal Society of Chemistry 2012
S29
Fig. S36
1H NMR spectrum of compound 7.HCl (CDCl3).
Fig. S37
13C NMR spectrum of compound 7.HCl (CDCl3).
Electronic Supplementary Material (ESI) for Chemical CommunicationsThis journal is © The Royal Society of Chemistry 2012
S30
Fig. S38 1H NMR spectrum of compound 8.HCl (CDCl3).
Fig. S39
13C NMR spectrum of compound 8.HCl (CDCl3).
Electronic Supplementary Material (ESI) for Chemical CommunicationsThis journal is © The Royal Society of Chemistry 2012
S31
Fig. S40
1H NMR spectrum of compound 9.HCl (CDCl3).
Fig. S41
13C NMR spectrum of compound 9.HCl (CDCl3).
Electronic Supplementary Material (ESI) for Chemical CommunicationsThis journal is © The Royal Society of Chemistry 2012
S32
Fig. S42
1H NMR spectrum of compound 10.HCl (CDCl3).
Fig. S43
13C NMR spectrum of compound 10 .HCl (CDCl3).
Electronic Supplementary Material (ESI) for Chemical CommunicationsThis journal is © The Royal Society of Chemistry 2012
S33
Fig. S44
1H NMR spectrum of compound 11.HCl (CDCl3).
Fig. S45
13C NMR spectrum of compound 11.HCl (CDCl3).
Electronic Supplementary Material (ESI) for Chemical CommunicationsThis journal is © The Royal Society of Chemistry 2012
S34
Fig. S46
1H NMR spectrum of compound 12.HCl (CDCl3).
Fig. S47
13C NMR spectrum of compound 12.HCl (CDCl3).
Electronic Supplementary Material (ESI) for Chemical CommunicationsThis journal is © The Royal Society of Chemistry 2012

S35
Fig. S48 1H NMR spectrum of compound 13.HCl (CDCl3).
Fig. S49 13
C NMR spectrum of compound 13.HCl (CDCl3).
Electronic Supplementary Material (ESI) for Chemical CommunicationsThis journal is © The Royal Society of Chemistry 2012

S36
Fig. S50
1H NMR spectrum of compound 14.HCl (CDCl3).
Fig. S51
13C NMR spectrum of compound 14.HCl (CDCl3).
Electronic Supplementary Material (ESI) for Chemical CommunicationsThis journal is © The Royal Society of Chemistry 2012

S37
Fig. S52 1H NMR spectrum of compound 15.HCl (CDCl3).
Fig. S53
13C NMR spectrum of compound 15.HCl (CDCl3).
Electronic Supplementary Material (ESI) for Chemical CommunicationsThis journal is © The Royal Society of Chemistry 2012

S38
Fig. S54
1H NMR spectrum of compound 16.HCl (CDCl3).
Fig. S55 13
C NMR spectrum of compound 16.HCl (CDCl3).
Electronic Supplementary Material (ESI) for Chemical CommunicationsThis journal is © The Royal Society of Chemistry 2012