the role of mountain glaciers and ice caps in sea level
TRANSCRIPT
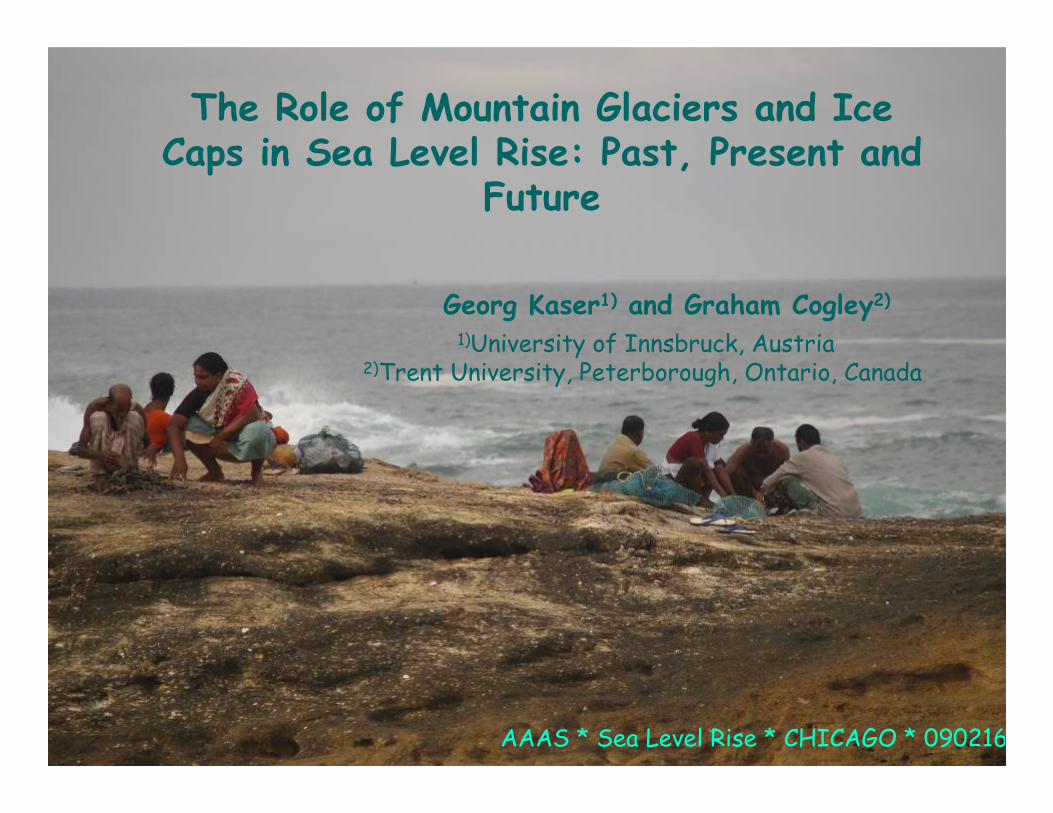
The Role of Mountain Glaciers and Ice Caps in Sea Level Rise: Past, Present and
Future
Georg Kaser1) and Graham Cogley2)
1)University of Innsbruck, Austria2)Trent University, Peterborough, Ontario, Canada
AAAS * Sea Level Rise * CHICAGO * 090216
09*0
2*16
aaas
*sea
leve
l*ch
icag
o
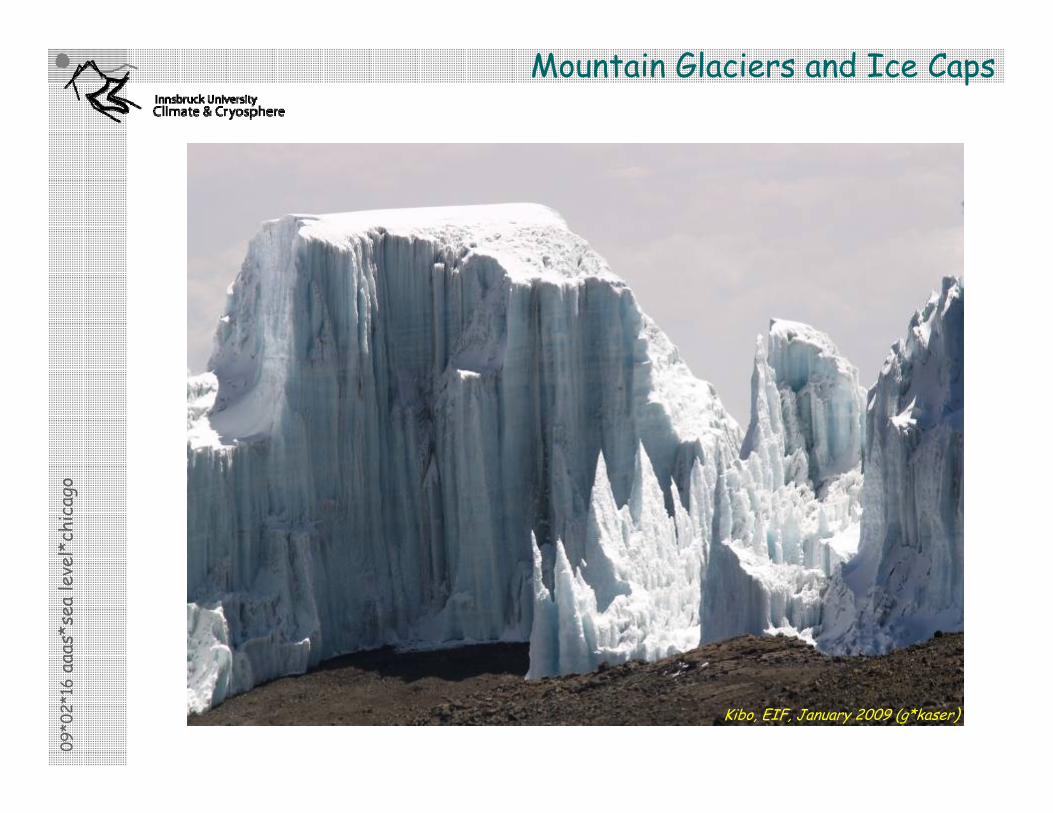
Kibo, EIF, January 2009 (g*kaser)
Mountain Glaciers and Ice Caps
09*0
2*16
aaas
*sea
leve
l*ch
icag
o
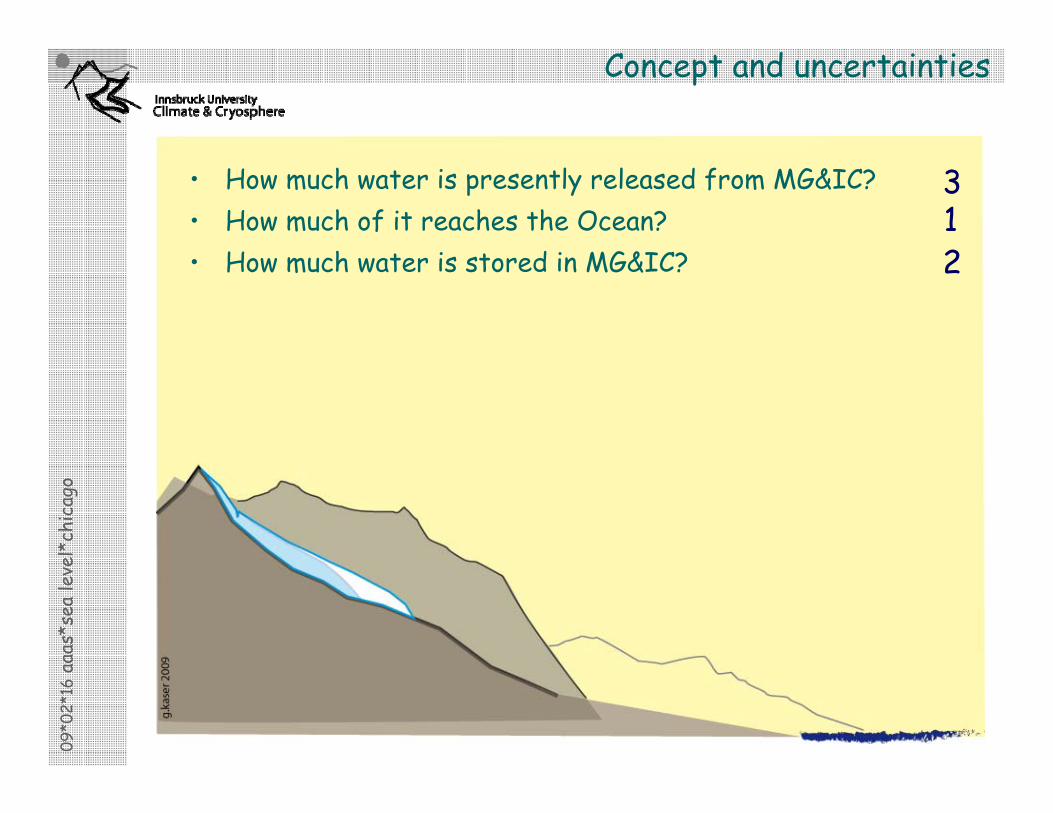
• How much water is presently released from MG&IC?• How much of it reaches the Ocean?• How much water is stored in MG&IC?
Concept and uncertainties
213
09*0
2*16
aaas
*sea
leve
l*ch
icag
o
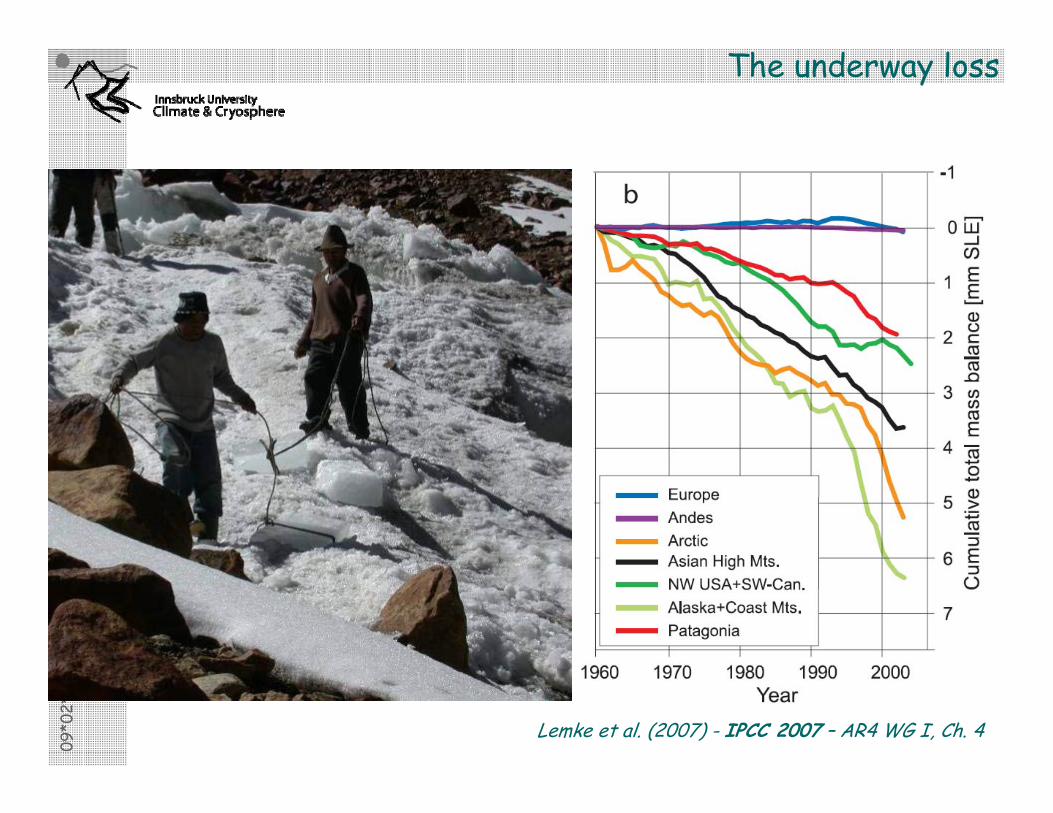
Lemke et al. (2007) - IPCC 2007 – AR4 WG I, Ch. 4
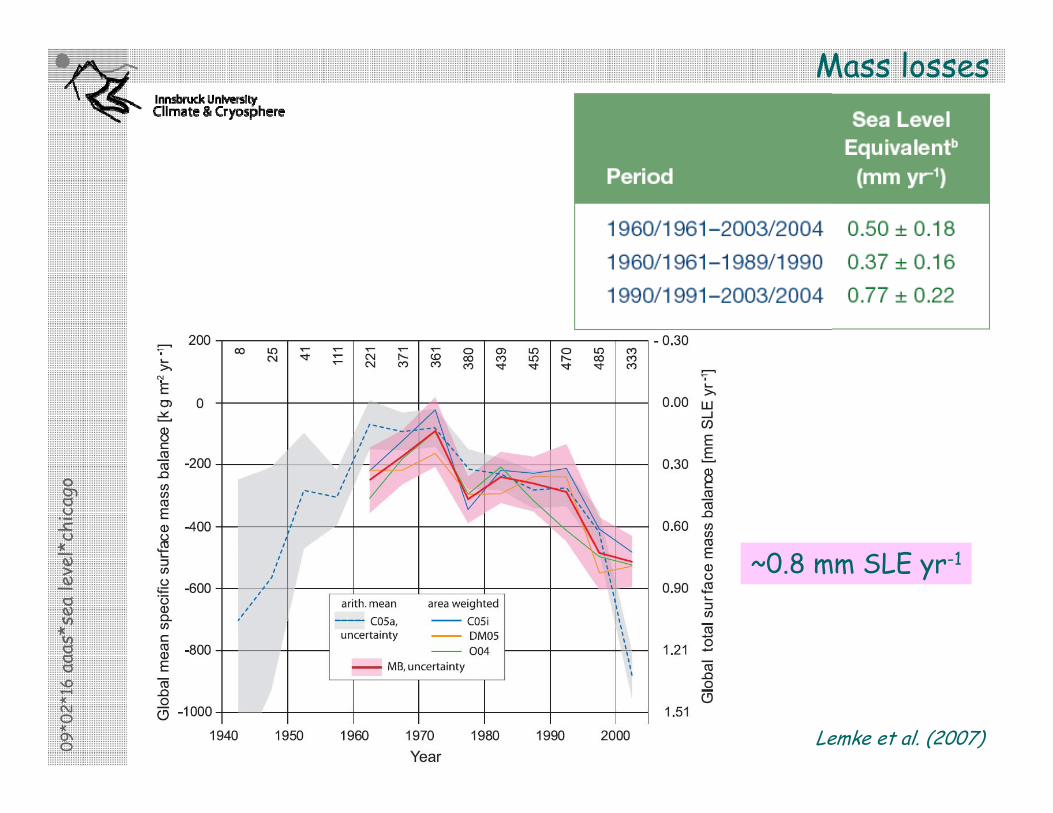
The underway loss

09*0
2*16
aaas
*sea
leve
l*ch
icag
o
MG&IC excluding those in GL and AA: 0.15 – 0.43 m SLEMG&IC including those in GL and AA: 0.49 – 0.74 m SLE
Lemke et al. (2007) - IPCC 2007 – AR4 WG I, Ch. 4
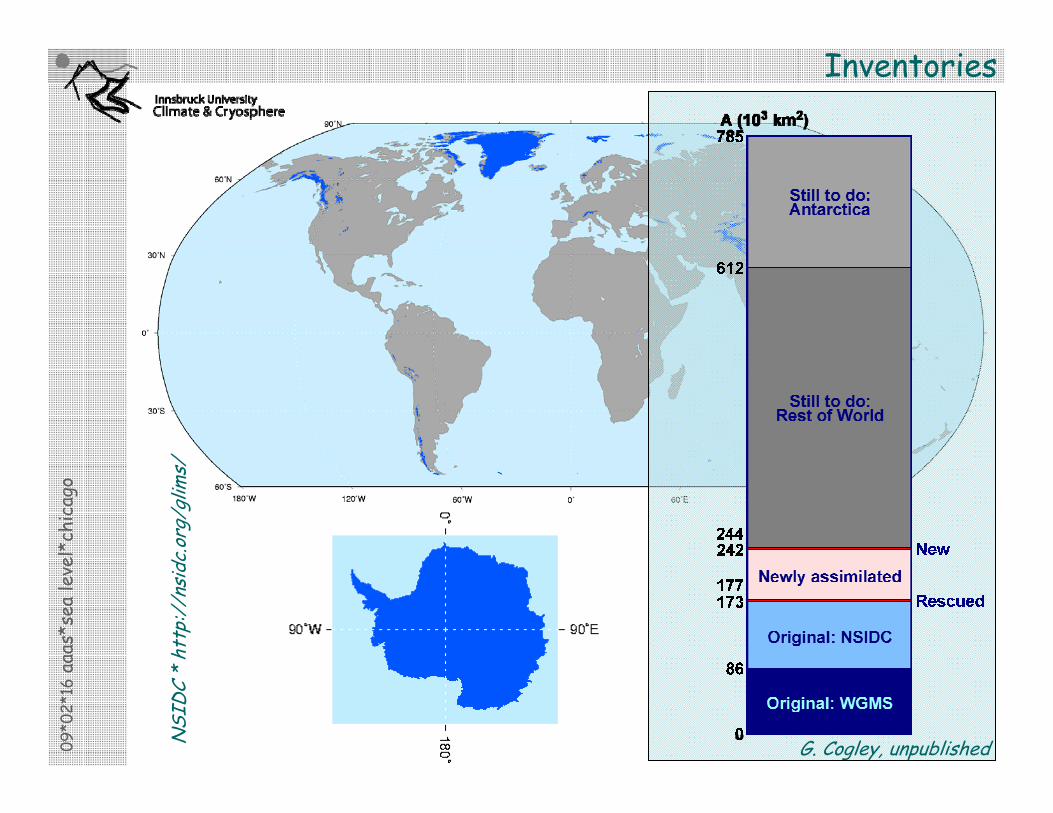
The total extent of MG&IC
09*0
2*16
aaas
*sea
leve
l*ch
icag
oInventories
NSI
DC *
htt
p://
nsid
c.or
g/gl
ims/
G. Cogley, unpublished
09*0
2*16
aaas
*sea
leve
l*ch
icag
o
Lemke et al. (2007)
~0.8 mm SLE yr-1
Mass losses
09*0
2*16
aaas
*sea
leve
l*ch
icag
o
IHP
High Mountains
‚Mass Budget‘ Glaciers
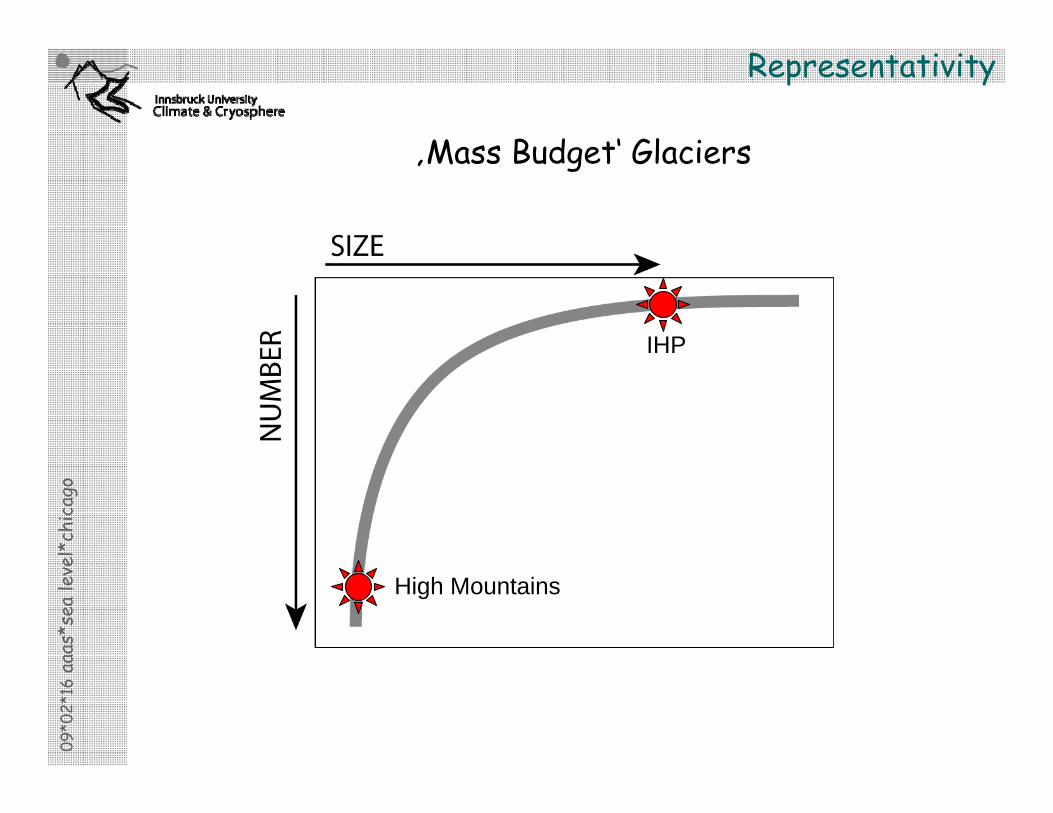
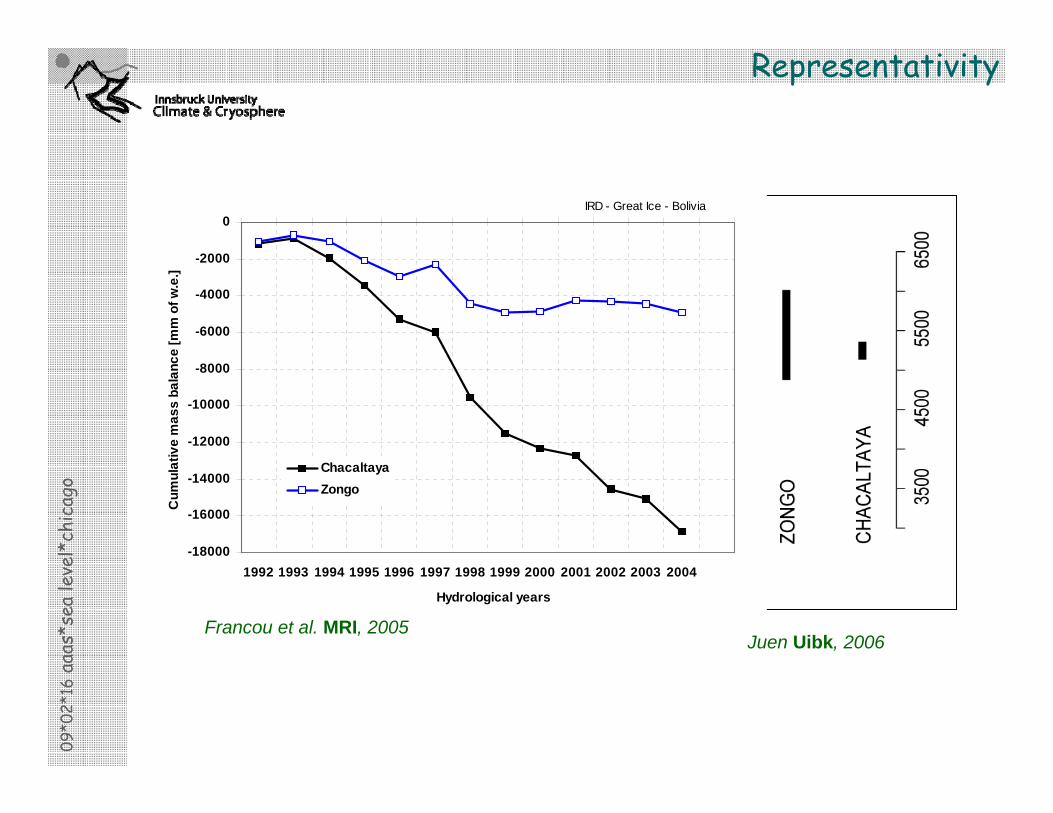
Representativity
09*0
2*16
aaas
*sea
leve
l*ch
icag
o
-18000
-16000
-14000
-12000
-10000
-8000
-6000
-4000
-2000
0
1992 1993 1994 1995 1996 1997 1998 1999 2000 2001 2002 2003 2004
Hydrological years
Cum
ulat
ive
mas
s ba
lanc
e [m
m o
f w.e
.]
ChacaltayaZongo
IRD - Great Ice - Bolivia
Francou et al. MRI, 2005
Representativity
Juen Uibk, 2006
09*0
2*16
aaas
*sea
leve
l*ch
icag
o
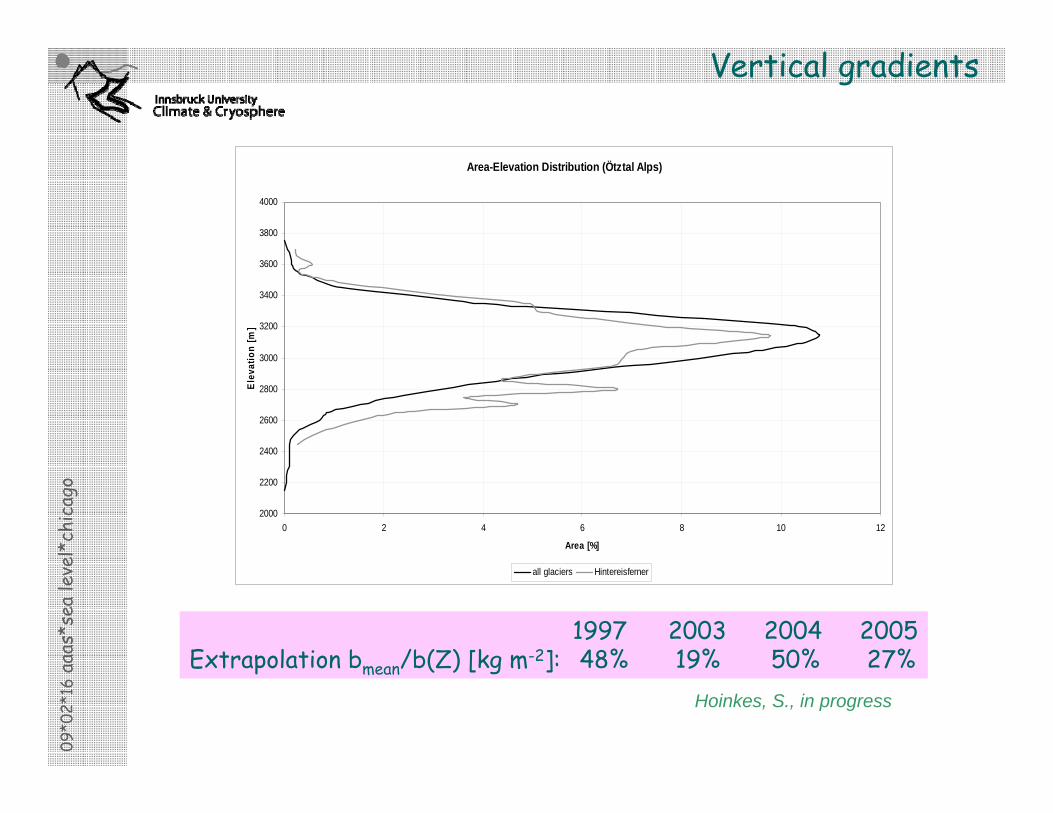
Area-Elevation Distribution (Ötztal Alps)
2000
2200
2400
2600
2800
3000
3200
3400
3600
3800
4000
0 2 4 6 8 10 12
Area [%]
Elev
atio
n [m
]
all glaciers Hintereisferner
1997 2003 2004 2005Extrapolation bmean/b(Z) [kg m-2]: 48% 19% 50% 27%
Vertical gradients
Hoinkes, S., in progress
09*0
2*16
aaas
*sea
leve
l*ch
icag
o
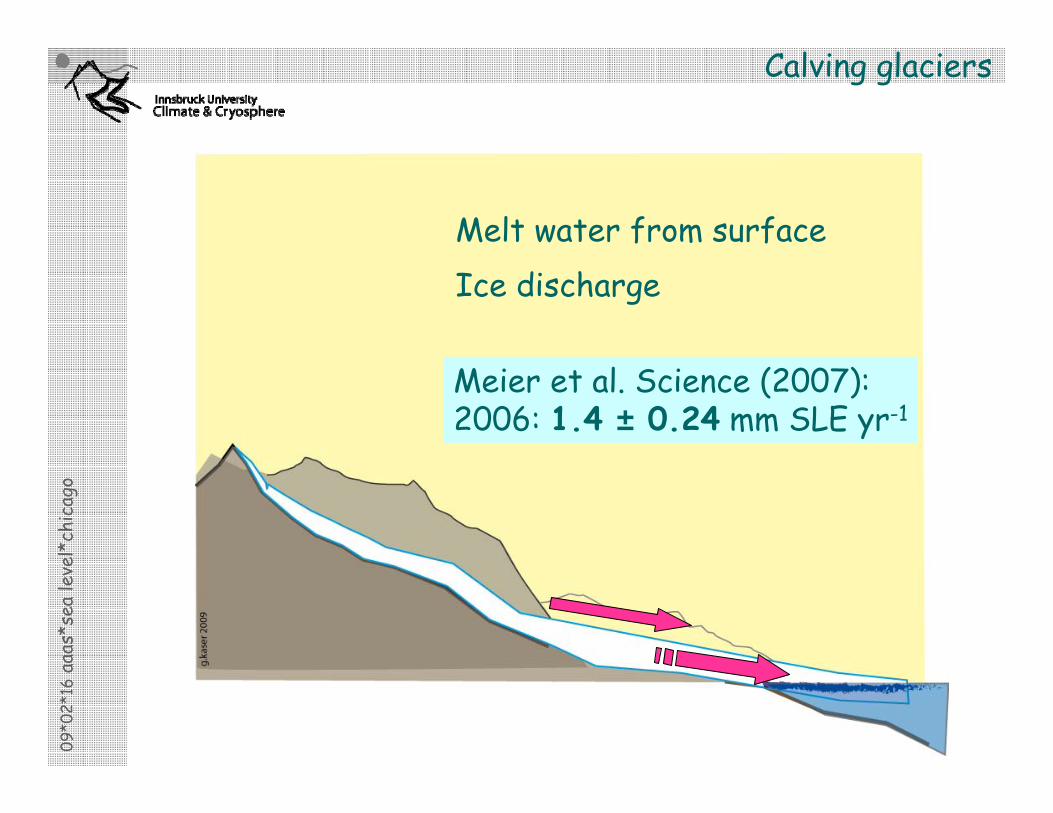
Melt water from surfaceIce discharge
Meier et al. Science (2007):2006: 1.4 ± 0.24 mm SLE yr-1
Calving glaciers

09*0
2*16
aaas
*sea
leve
l*ch
icag
o
Marine calving glaciers: from 3 to 16%Lake calving glaciers: from 4 to 16%
Directly and geodetically measured data
Cogley Ann. Glac., 2009

09*0
2*16
aaas
*sea
leve
l*ch
icag
o
Cogley, Ann. Glac. (2009)
1.1 mm SLE yr-1
Directly and geodetically measured data

09*0
2*16
aaas
*sea
leve
l*ch
icag
oModelling from atmospheric RA
Hock et al. GRL (in press)
1961 – 2004: 0.79 ± 0.34 mm SLE yr-1
09*0
2*16
aaas
*sea
leve
l*ch
icag
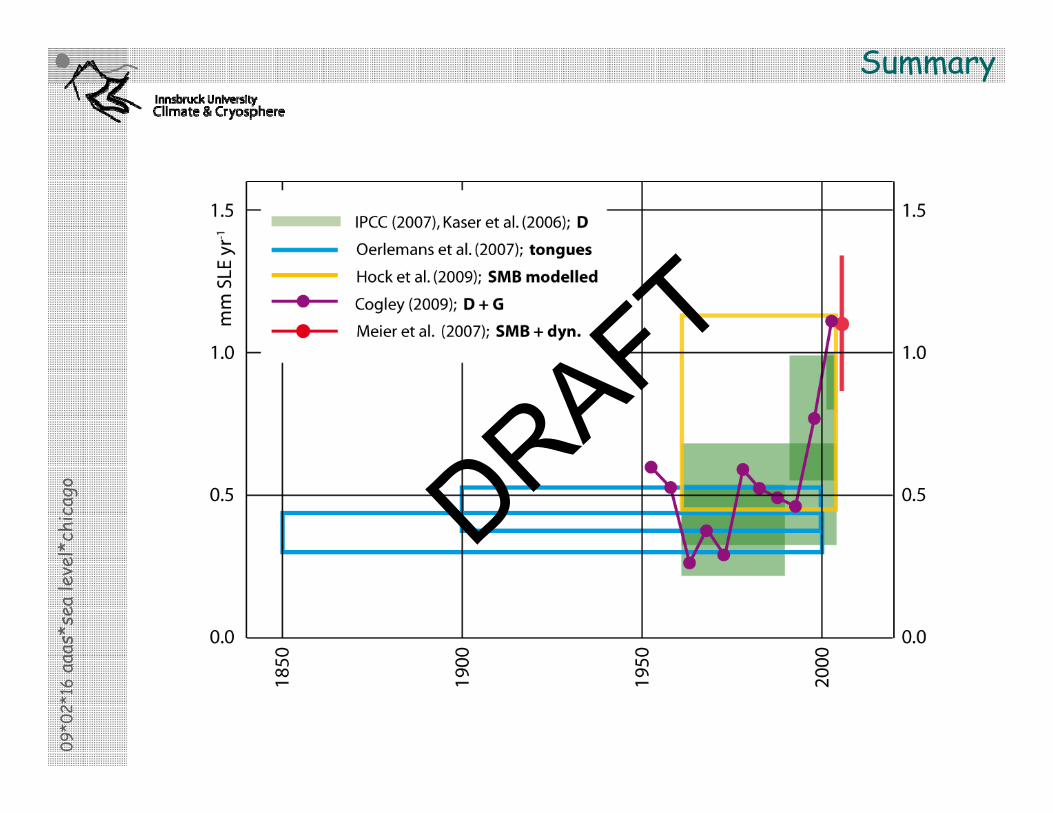
oSummary
09*0
2*16
aaas
*sea
leve
l*ch
icag
oThe future
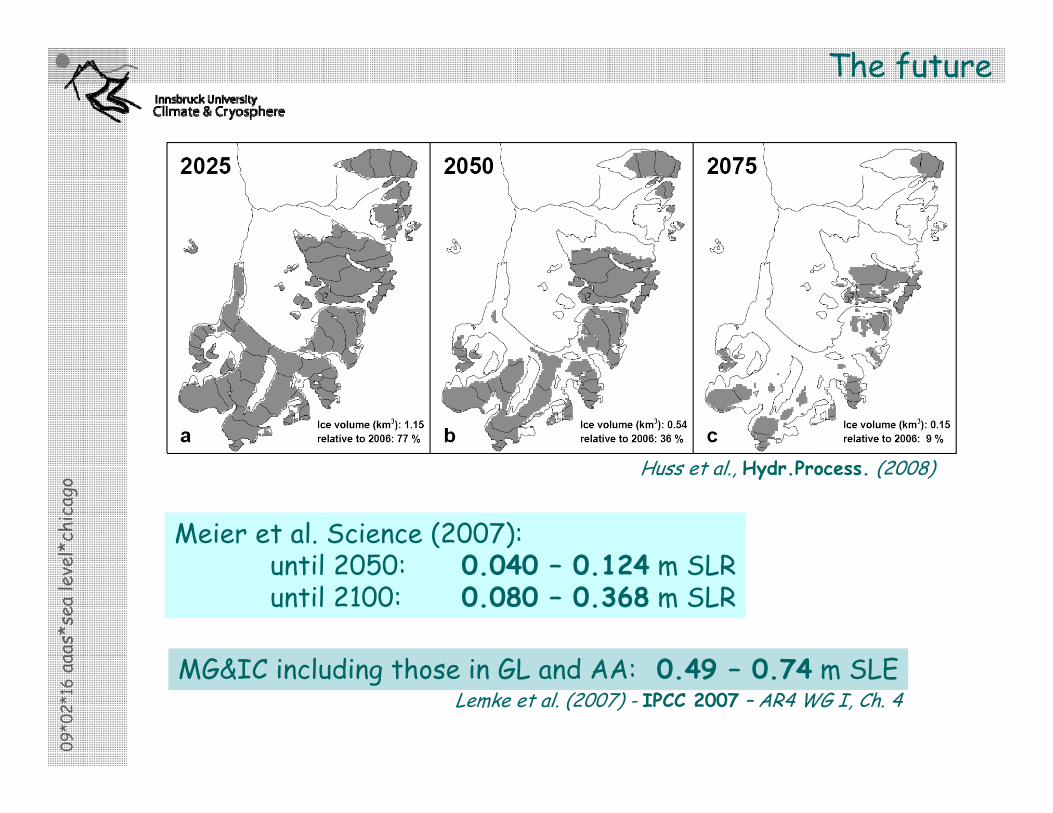
Huss et al., Hydr.Process. (2008)
Meier et al. Science (2007): until 2050: 0.040 – 0.124 m SLRuntil 2100: 0.080 – 0.368 m SLR
MG&IC including those in GL and AA: 0.49 – 0.74 m SLELemke et al. (2007) - IPCC 2007 – AR4 WG I, Ch. 4
09*0
2*16
aaas
*sea
leve
l*ch
icag
oConclusions
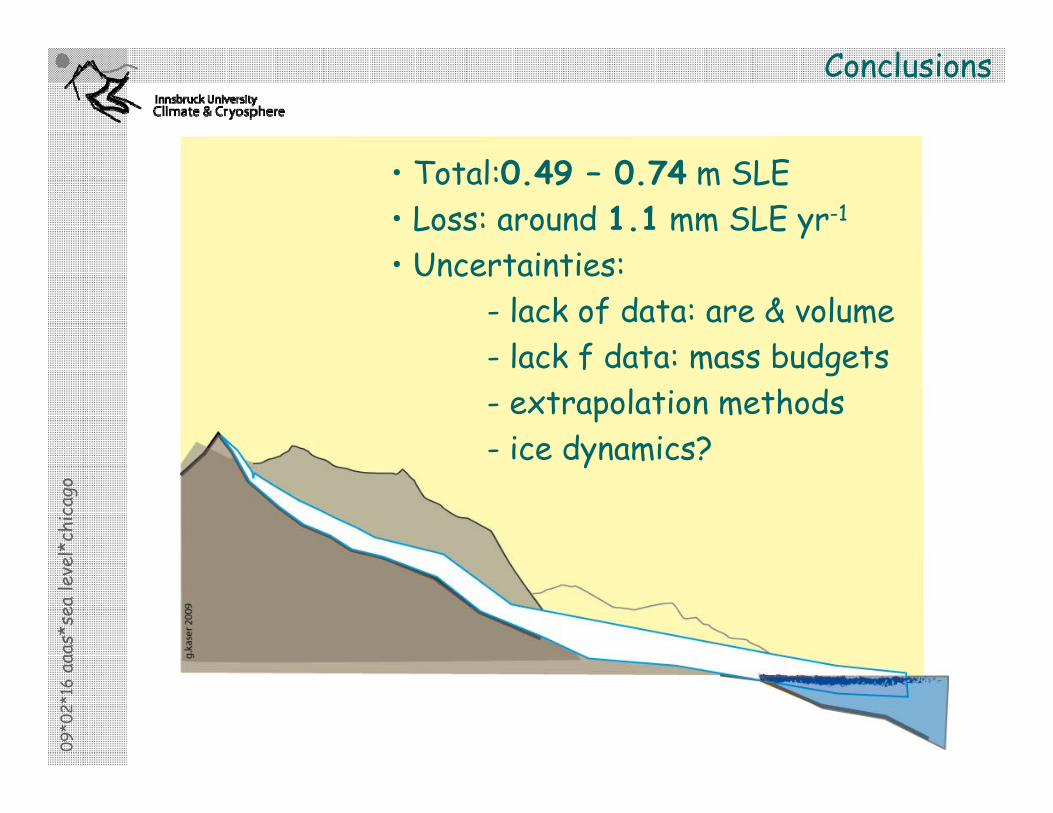
• Total:0.49 – 0.74 m SLE• Loss: around 1.1 mm SLE yr-1
• Uncertainties: - lack of data: are & volume- lack f data: mass budgets- extrapolation methods- ice dynamics?
09*0
2*16
aaas
*sea
leve
l*ch
icag
o
Thank you
Kibo, NIF, January 2009 (g*kaser)