the role of other financial intermediaries in monetary and credit
TRANSCRIPT
OCCAS IONAL PAPER SER IESNO 75 / OCTOBER 2007
THE ROLE OF
OTHER FINANCIAL
INTERMEDIARIES
IN MONETARY
AND CREDIT
DEVELOPMENTS IN
THE EURO AREA
Edited byPhilippe Moutotand coordinated byDieter Gerdesmeier,Adriana Lojschová andJulian von Landesberger
Date: 15 Oct, 2007 18:15:28;Format: (420.00 x 297.00 mm);Output Profile: SPOT IC300;Preflight: Failed!

In 2007 all ECB publications
feature a motif taken from the €20 banknote.
OCCAS IONAL PAPER SER IESNO 75 / OCTOBER 2007
Edited by
Philippe Moutot 2
and coordinated by
Dieter Gerdesmeier,
Adriana Lojschová and
Julian von Landesberger
THE ROLE OF OTHER FINANCIAL
INTERMEDIARIES IN MONETARY
AND CREDIT DEVELOPMENTS
IN THE EURO AREA 1
This paper can be downloaded without charge from
http : //www.ecb.europa.eu or from the Social Science Research Network
electronic library at http : //ssrn.com/abstract_id=1005933.
1 The views expressed in this paper are those of the authors only and in no way refl ect those of the European Central Bank or the ESCB.
We would like to thank H. Pill, C. Willeke, J.- M. Israel, P. Sandars and an anonymous referee for their helpful comments and
suggestions as well as S. Boehles for her help in preparing the publication.
All remaining errors are, of course, the sole responsibility of the authors.
2 Corresponding author: Philippe Moutot, European Central Bank, Kaiserstrasse 29, 60311 Frankfurt am Main, Germany,
e-mail [email protected].

© European Central Bank 2007
Address Kaiserstrasse 29 60311 Frankfurt am Main, Germany
Postal address Postfach 16 03 19 60066 Frankfurt am Main Germany
Telephone +49 69 1344 0
Website http://www.ecb.europa.eu
Fax +49 69 1344 6000
Telex 411 144 ecb d
All rights reserved. Any reproduction, publication or reprint in the form of a different publication, whether printed or produced electronically, in whole or in part, is permitted only with the explicit written authorisation of the ECB or the author(s).
The views expressed in this paper do not necessarily refl ect those of the European Central Bank.
ISSN 1607-1484 (print)ISSN 1725-6534 (online)

3ECB
Occasional Paper No 75October 2007
CONTENTS
CONTENTS 3
FOREWORD 4
NON-TECHNICAL SUMMARY 5
I INTRODUCTION 6
2 OFIs AND THEIR RELATIONSHIPS WITH
MFIs 7
2.1 Activities of the various OFI sub-categories 7
2.1.1 Investment funds 7
2.1.2 Financial vehicle corporations 7
2.1.3 Financial corporations engaged in lending 8
2.1.4 Financial holding corporations 8
2.1.5 Securities and derivatives dealers 8
2.2 The available statistical information on OFIs 9
2.3 Impact of OFIs’ fi nancial behaviour on the MFI balance sheet 10
3 THE ROLE OF OFIS IN MONETARY
ANALYSIS 16
3.1 Determinants of OFIs’ demand for money 16
3.2 The impact of OFIs’ money holdings on the indicator properties of money 16
3.3 The role of OFIs’ money holdings in assessing risks to future price stability 18
3.4 The role of OFIs in the transmission mechanism of monetary policy 19
4 A LOOK AT THE COUNTRY LEVEL 20
4.1 Overview 20
4.2 Country evidence 21
4.2.1 Belgium 21
4.2.2 Germany 24
4.2.3 Ireland 26
4.2.4 France 28
4.2.5 Greece 31
4.2.6 Italy 33
4.2.7 Luxembourg 35
4.2.8 Netherlands 37
4.2.9 Austria 40
4.2.10 Portugal 41
4.2.11 Spain 43
4.2.12 Finland 45
4.2.13 Denmark 46
4.2.14 Sweden 49
4.2.15 United Kingdom 51
4.3 An overall view 52
5 CONCLUSIONS 53
ANNEX 54
EUROPEAN CENTRAL BANK
OCCASIONAL PAPER SERIES 56
CONTENTS
4ECBOccasional Paper No 75October 2007
FOREWORD
Other fi nancial intermediaries except insurance corporations and pension funds (OFIs) have gained considerable importance over the last few years. However, in spite of this, the literature shows that there is still little understanding of the business undertaken by OFIs and its implications for money demand. Consequently, the impact of OFIs on monetary and credit developments is increasingly attracting the attention of central banks. Against this background, on 23 March 2006, the Monetary Policy Stance Division of the ECB’s Directorate Monetary Policy held an expert meeting with national central banks (NCBs) of the European System of Central Banks on the role of OFIs in euro area monetary and credit developments. The meeting discussed a number of key issues that were seen as being of particular relevance. This study presents the results of the analytical work carried out in preparation for the aforementioned NCB expert meeting. It therefore presents a unique compilation of material based on aggregate euro area data and cross-country evidence for the assessment of sectoral monetary developments.
5ECB
Occasional Paper No 75October 2007
NON-TECHNICALSUMMARY
NON-TECHNICAL SUMMARY
Monetary growth has increased signifi cantly in the euro area in recent years, raising concerns about the risks to price stability. Viewed from a sectoral perspective, this increase refl ects to a large extent the deposit holdings of other fi nancial intermediaries (OFIs).
This paper presents analytical work on the role of OFIs in monetary and credit developments in the euro area.
Although, at the moment, some shortcomings in the data available – such as the lack of long time series data – seriously limit the analysis of the role of OFIs in monetary and credit aggregates, it seems clear that OFIs have gained considerable importance in recent years, not only as a factor affecting monetary developments, but also for the functioning of the fi nancial system. This gain in importance may be due to fi nancial deregulation and liberalisation, as well as fi nancial innovation. These developments are refl ected in the integration and deepening of euro area fi nancial markets, as well as in investors’ attitude to risk.
A more detailed analysis that builds on descriptive statistical techniques reveals that OFIs constitute a very heterogeneous group of institutions, with investment funds (other than money market funds) being the main money holders among the OFI sub-sectors.
At the euro area level, refl ecting the nature of their business, OFIs seem to favour instruments within M3 with a stronger fi nancial market orientation, while also exhibiting a signifi cant share of cross-border deposit holdings. In practice, they follow quite different investment practices, a fact which needs to be taken into account when analysing the implications for the behaviour of monetary aggregates.
Finally, OFIs’ activities may have a relatively small direct impact on fi nal demand for goods and services. It can therefore be questioned whether the inclusion of short-term deposits
and repurchase agreements held by OFIs within M3 may affect the information content of the monetary aggregate for assessing infl ationary pressures in the economy. But, in order to come to a fi nal assessment, not only these direct but also the indirect linkages with other sectors and other key economic variables, such as asset prices, need to be investigated.
Against this background, gaining a deeper understanding of the reasons why OFIs hold liquid deposits and the implications of this behaviour will remain an important aspect of monetary analysis.
6ECBOccasional Paper No 75October 2007
I INTRODUCTION
Money held by fi nancial intermediaries other than monetary fi nancial institutions (MFIs) has become much more important in the analysis of monetary developments over the past decade. This is particularly true for the OFI sector,i.e. non-MFI fi nancial intermediaries other than insurance corporations and pension funds. OFIs typically provide fi nancial services to households and non-fi nancial corporations and/or trade in fi nancial markets on their own behalf. The sector also includes institutions created by MFIs to facilitate the securitisation of loans that would otherwise be held on the MFI balance sheet.
The key difference between OFIs and MFIs is that the latter can take deposits from the public, while the OFIs are fi nanced by other means,e.g. by issuing securities. OFIs are subject to less stringent regulatory requirements; in particular they often need to set aside less capital than MFIs for prudential supervisory purposes. Additionally, in some countries, OFIs may also benefi t from special tax treatment, which may render the conduct of certain fi nancial operations in a separate entity outside the MFI sector attractive.
Since OFIs are often subject to a lighter regulatory burden, they may adopt fi nancial innovations faster than MFIs. MFIs may establish non-deposit taking fi nancial subsidiaries precisely for the purpose of implementing fi nancial innovation, for instance, special purpose vehicles created to securitise MFI loans. OFIs may also represent an effi cient solution for specialised fi nancial activities, e.g. credit card issuance. Therefore, at least in part, the increased importance of this sector for monetary analysis refl ects fi nancial liberalisation and innovation, as well as the associated development of deeper and more liquid securities markets.
The remainder of this paper is organised as follows. Section 2 presents the statistical framework for the OFI sector. It provides institutional information on the sub-categories of
the OFI sector, presents the relative importance of the main assets and liabilities in the balance sheet for the individual sub-categories and highlights the transactions that the different types of OFIs typically undertake with MFIs. Section 3 addresses the relevance of the OFI sector from a monetary analysis perspective, looking in particular at its money-holding behaviour at the euro area level and the impact of OFIs’ money holdings for the indicator properties of money. In order to show the full breadth of the heterogeneity of the OFI sector, Section 4 provides a detailed analysis of OFIs’ money holdings at the country level. Section 5 concludes.

7ECB
Occasional Paper No 75October 2007
2 OF I s AND THEIR RELAT IONSHIPS
WITH MFIs2 OFIs AND THEIR RELATIONSHIPS
WITH MFIs
by A. Matas Mir, J. Matilainen and P. Poloni (ECB staff)
In light of the recent growth in OFIs’ money holdings, this section defi nes the entities constituting the OFI sector, presents in a schematic manner the typical activities undertaken by the different OFI sub-sectors and fl ags the cases where fi nancial liquid positions with MFIs may arise from their activity. Against this background, evidence is provided on the impact of the fi nancial behaviour of various types of OFI 1 on the MFI balance sheet. While these sub-categories are refl ected in statistical defi nitions that are meant to clearly defi ne their parameters, the sub-categories are described in a non-technical manner and practical examples provided.
2.1 ACTIVITIES OF THE VARIOUS OFI
SUB-CATEGORIES
The OFI sector is heterogeneous in itself, basically consisting of a range of very different entities. The fi ve most important categories are: 1) investment funds, 2) fi nancial corporations engaged in lending (fi nancial leasing, factoring, consumer credit, etc.), 3) fi nancial vehicle corporations, 4) fi nancial holding corporations and 5) securities and derivatives dealers.2 In order to give an overview of the different business models, the fi ve main different sub-categories are defi ned and institutional aspects are briefl y presented below.
2.1.1 INVESTMENT FUNDS
An investment fund (IF) is a fi nancial investment vehicle which is aimed at private investors – little or large – or institutional investors. Such investment funds use capital raised from the public to acquire fi nancial and non-fi nancial assets for their shareholders. Households and fi rms thus pool their savings. The benefi t of investment funds is essentially that they offer everybody – whether professional or institutional investors, or people with limited time or modest means – access to investment returns that would
otherwise only be available to more sophisticated investors able to buy their own professional portfolio management advice. Investment funds offer economies of scale, and generally entail less risk than direct holdings of securities.
At the same time, IFs are institutional investors that provide a source of funding (both credit and equity) to non-fi nancial corporations and governments. The units/shares of these investment funds are, at the request of the holders, repurchased or redeemed directly or indirectly out of the investment fund’s assets, and, in the case of those investment funds that have a fi xed number of shares, the holders entering or leaving the investment funds must buy or sell existing shares.
Investment funds can be further distinguished according to their main type of investment policy as equity funds, bond funds, mixed funds, real estate funds, hedge funds, and “other funds”.3 Among the group of “other funds”, in recent months, venture capital funds have attracted signifi cant public attention. However, when analysing the behaviour of the overall category of euro area investment funds, hedge funds and venture capital funds play only a subordinate role.4
2.1.2 FINANCIAL VEHICLE CORPORATIONS
A fi nancial vehicle corporation (FVC) is an undertaking that predominantly carries out one or more securitisations. The term “securitisation”
Except insurance companies and pension funds (ICPFs).1 There is also a sixth, residual sub-category which comprises 2 any other fi nancial intermediary other than MFIs, insurance corporations and pension funds (ICPF). Examples of OFIs in this sub-category are certain clearing houses, venture capital companies not structured as investment funds, fi nancial holding companies whose participation interest are mainly in non-fi nancial companies, and investment companies not open to the public.This classifi cation is made according to Guideline ECB/2007/9 3 for the reporting of assets and liabilities by the IF sector.According to data from the European Fund and Asset 4 Management Association (EFAMA) on the net asset value of investment funds in a number of Member States (namely Belgium, Germany, Greece, Spain, France, Italy, Luxembourg, the Netherlands, Austria, Portugal and Finland), a conservative estimate indicates that approximately 5% of the asset value placed in investment funds is held with hedge funds and venture capital entities.

8ECBOccasional Paper No 75October 2007
denotes a process whereby assets such as mortgage loans and corporate loans (or the risks associated with them) are pooled and repackaged as marketable securities (asset-backed securities) that can be sold to investors. There are two main types of securitisation: true-sale securitisation and synthetic securitisation. A true-sale securitisation takes place, for instance, when a bank (the originator) sells illiquid assets (e.g. loans, secured or not by mortgages) to a third party, which is often an FVC. The FVC fi nances the purchase by issuing securities, which are collateralised by the assets purchased from the bank. These asset-backed securities may be open to the public or sold on the basis of a private placement. A synthetic securitisation transfers the credit risk, but not the underlying assets, to the FVC. This is achieved by stipulating, for instance, a credit default swap between the originator and the FVC.
FVCs are often used by MFIs (and other originators) to mobilise loans and other non-tradable assets in exchange for cash. In other words, securitisations represent an alternative form of funding for the MFIs. Moreover, securitisations allow the required minimum capital that banks must respect for prudential purposes to be decreased. Regulatory and tax changes in the euro area have had a signifi cant impact on the extent of the different securitisation activities in recent years.
2.1.3 FINANCIAL CORPORATIONS ENGAGED IN
LENDING
A fi nancial corporation engaged in lending (FCL) is an entity that specialises in granting loans, often focusing on a specialised market segment, and is fi nanced by instruments other than deposits. This specialised market segment may be fi nancial leasing, factoring, mortgage lending, consumer lending, credit card issuance and other types of lending as defi ned by EU and/or national regulatory provisions. An appropriate organisational and technical structure facilitates the granting of loans in these specifi c forms. For instance, a fi nancial leasing company must be able to assess the value of the physical assets being leased in order to sell on the secondary market, or lease
again the assets that have not been eventually purchased by their customers.
Unlike credit institutions, FCLs do not collect deposits to fi nance their lending activity. The fi nancing of FCLs is therefore normally provided by MFIs, although some funds are also obtained by issuing debt securities. Most FCLs are not subject to specifi c supervisory rules although various FCLs are subject to consumer protection provisions.
2.1.4 FINANCIAL HOLDING CORPORATIONS
Financial holding corporations (FHCs) are entities principally engaged in controlling fi nancial corporations or groups of subsidiary fi nancial corporations and do not conduct the business of such fi nancial corporations themselves. FHCs control a corporation by owning more than half of its voting shares or by controlling more than half of the shareholders’ voting power, or by otherwise being able to determine the general corporate policy, or by controlling entities that control fi nancial corporations or groups of subsidiary fi nancial corporations. Normally, a FHC does not actively trade in participation interests and has no permanent staff. They are entities created to structure the control of fi nancial subsidiaries and to minimise the fi scal implications of the income generated by the subsidiaries.
2.1.5 SECURITIES AND DERIVATIVES DEALERS
Securities and derivatives dealers (SDDs) are fi rms that provide investment services for clients through brokerage, investing or market-making in securities and derivatives as their main business. The investment services provided include asset management advice, clearing and custody services as well as buying and selling of fi nancial instruments for the sole purpose of benefi ting from the margin between the acquisition and selling price.5 Securities and
This defi nition excludes MFIs as defi ned in Annex I of 5 Regulation (EC) No 2423/2001 of the European Central Bank of 22 November 2001 concerning the consolidated balance sheet of the monetary fi nancial institutions sector (ECB/2001/13) hereinafter “Regulation ECB/2001/13”.

9ECB
Occasional Paper No 75October 2007
2 OF I s AND THEIR RELAT IONSHIPS
WITH MFIsderivative dealers may be subjected to the same prudential regulation as credit institutions as far as their market activities are concerned, and they are often subsidiaries of credit institutions. At the same time, MFIs also often provide the same investment services and trading activities. As mentioned above, the main difference between an SDD and an MFI is that the latter can collect deposits from the public, while an SDD cannot.
2.2 THE AVAILABLE STATISTICAL INFORMATION
ON OFIs
There are currently two main statistical sources available for the analysis of the role of OFIs in monetary and credit developments in the euro area: unharmonised balance sheet data collected from OFIs and harmonised balance sheet statistics provided by MFIs.
As regards the fi rst data source, the ECB collects quarterly balance sheet statistics on most OFI sub-categories. The data are collected from the euro area NCBs on the basis of unharmonised information available at the national level. As a minimum common denominator to facilitate data aggregation at the euro area level, the ECB has set out a reporting scheme for national data compilers. At the moment, however, not all the Member States are able to compile all requested breakdowns of this reporting scheme. Moreover, the coverage of the reporting population is below 100% in several countries.
The available balance sheet statistics on OFIs are collected for four OFI sub-categories: IFs, FCLs, SDDs and a residual category of other OFIs for which balance sheet information is available at the national level.6 Balance sheet data refer to stocks only and are broken down by instrument. Maturity and (sector and residency) counterpart breakdowns are available for a limited subset of instruments (i.e. for investment funds, securities holdings data are broken down by maturity and counterpart). Furthermore, investment funds data are broken down by investment policy and by type of investor (general public, special investors). Owing to limited data availability and
quality, euro area aggregates are currently compiled and published only for IFs.
At present, in line with the requirements of Regulation ECB/2001/13, MFIs report balance sheet positions with OFIs, including deposit liabilities to OFIs. This facilitates the monitoring of OFIs’ holdings of deposits included in M3 and, hence, provides valuable information for monetary analysis purposes. However, it is diffi cult to relate these data on deposit holdings to the broad portfolio decisions of OFIs and capital market developments more generally. Furthermore, the function of the OFI sector as a counterpart to the portfolio shifts undertaken by private households, and the possible substitution of MFI loans for loans granted by OFIs (including through securitisation transactions) cannot be properly traced. Therefore, it has to be admitted that the usefulness of the currently available data for OFIs is rather limited.
Against this background and in view of the current shortcomings of the available information on OFIs, the ESCB is working towards a major overhaul. In particular, in order to improve the coverage of the OFI sector, the two most important sub-categories – namely IFs and FVCs – have been identifi ed as being of particular interest. To this regard in July 2007, the ECB has enacted a regulation (ECB/2007/8) directed at investment funds in order to obtain a comprehensive picture of the assets and liabilities of the IF sector in the participating Member States. It is worth mentioning that FVC balance sheet statistics will also prove particularly important for monetary analysis with regard to the analysis of the links between MFIs and OFIs that arise through (traditional and, partly, synthetic) loan securitisations and
The defi nitions of these sub-sectors are described in the 6 Guideline of the European Central Bank of 15 February 2005 amending Guideline ECB/2003/2 concerning certain statistical reporting requirements of the European Central Bank and the procedures for reporting by the national central banks of statistical information in the fi eld of money and banking statistics. However, NCB compilers might in practice deviate from these defi nitions depending on national circumstances.

10ECBOccasional Paper No 75October 2007
other loans sales. In this respect, enhanced FVC statistical information could lead to a signifi cant improvement in the analysis of monetary and credit developments. This information could in turn provide a fuller picture of (changes in) MFI lending activity with the euro area money-holding sector and of the accumulation of FVC deposits placed with MFIs. This would therefore make the analysis of M3 and its counterparts considerably more comprehensive.
2.3 IMPACT OF OFIs’ FINANCIAL BEHAVIOUR ON
THE MFI BALANCE SHEET
This section aims to review the main fi nancial relations with MFIs in each of the fi ve OFI sub-sectors.7 The heterogeneity of the business models has implications for the fi nancial relationship between OFIs and MFIs, and thus for the pattern of money holdings across OFIs. While leasing companies are more likely to be net borrowers from the MFI sector, IFs and factoring fi rms are typically net depositors. For other institutions in the OFI sector, such as FVCs, the net position with MFIs is less clear cut. Table 1 compares the size of the OFI sub-categories with that of the consolidated euro area MFI sector and that of the insurance corporations and pension funds (ICPF) sector in the euro area.8 While the total assets of IFs refer to consolidated holdings (i.e. when IFs’ holdings of shares/units issued by other euro area IFs have been excluded), the total assets of the other four OFI sub-categories are simply aggregated. However, this is not expected to make a signifi cant difference due to the low amount of business between institutions within the four sub-sectors. At the same time, entities belonging to one OFI
sub-sector may hold assets issued by another OFI sub-sector, something which may be particularly relevant for IFs’ holdings of debt securities issued by FVCs. However, no data about these positions are available to allow for consolidation.
The data show that the MFI sector is signifi cantly larger than all the OFI sub-categories combined. The largest sub-category, IFs, amounts to 25% of the MFI sector, while the other three are much smaller, constituting between 2% and 4%. Moreover, the ICPF sector, which is not discussed in this paper, seems to be of a similar size to the IF sector, when comparing their total fi nancial assets. In relation to the annual euro area GDP, the total assets of MFIs amounted to 225% of GDP, while the total assets of IFs amounted to 56% (calculated as at mid-2006). Since the institutional coverage of the available OFI statistics is not complete, the size of the OFI sub-sectors shown in Table 1 is underestimated.
Given the propensity of OFIs to implement fi nancial innovation, monitoring the relative size of the OFI sector (and sub-sectors) compared to the MFI sector might hint at fi nancial developments that may alter the transmission mechanism of monetary policy and/or the interpretation of traditional balance sheet data.
The growing signifi cance of the OFI sector has been particularly evident since mid-2004, as
It should be noted that although for some products OFIs and 7 MFIs are competitors, the focus of the present section is limited to direct fi nancial relations between the two sectors only and not to possible substitution effects.The ICPF data cover only fi nancial assets, hence partly 8 underestimating the total assets.
Table 1 OFI sub-sectors compared with other types of f inancial intermediaries in the third quarter of 2005
MFIs ICPFs 1OFIs
IFs FVCs 2 FCLs SDDs FHCs 3
Total assets (EUR billion) 18,714 4,967 4,684 500 684 350 338As % of MFI sector 100% 27% 25% 3% 4% 2% 2%
Note: The total assets of the residual category of other OFIs cannot be estimated.1) For insurance corporations and pension funds, only fi nancial assets are included.2) For FVCs, data estimated on the basis of Italian data as at end-2004 (source: Working Group on Money, Financial Institutions and Markets Statistics), Dutch data as at the third quarter of 2005 (source: De Nederlandsche Bank) and market shares as at the third quarter of 2005 (source: www.europeansecuritisation.com). The Italian and Dutch market shares jointly represent 45% of the euro area.3) For FHCs, the reference date is end-2003.
11ECB
Occasional Paper No 75October 2007
2 OF I s AND THEIR RELAT IONSHIPS
WITH MFIs
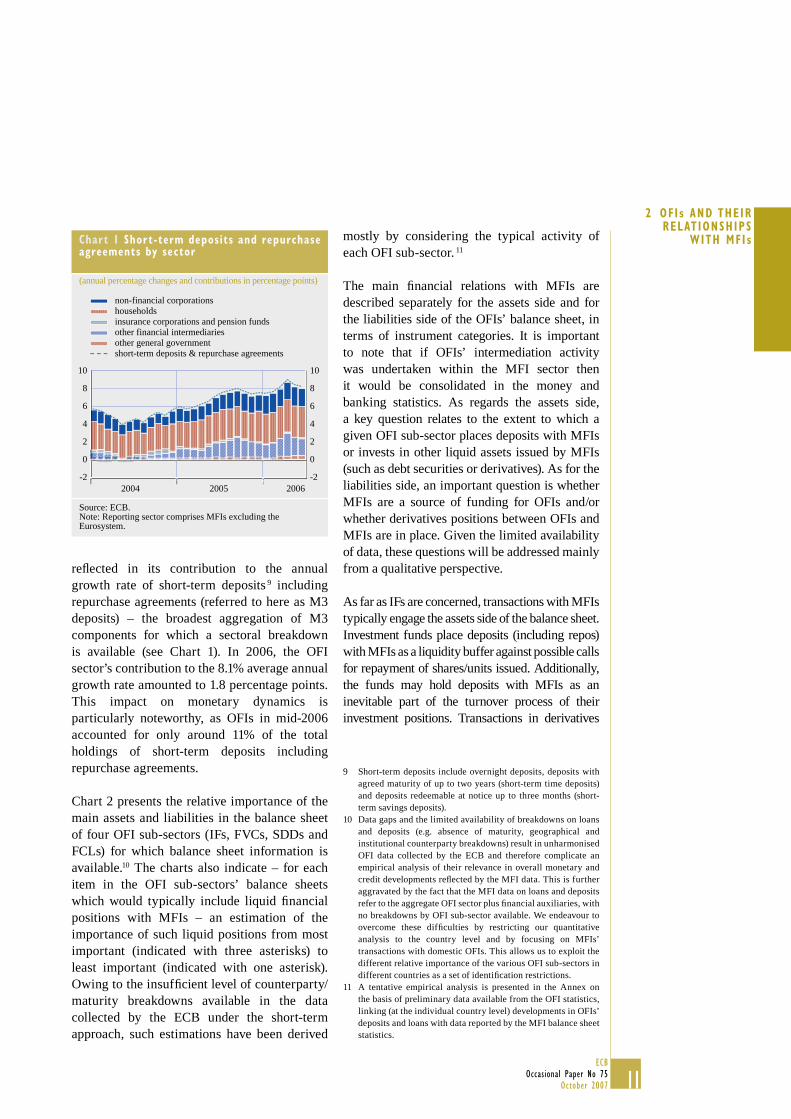
refl ected in its contribution to the annualgrowth rate of short-term deposits 9 including repurchase agreements (referred to here as M3 deposits) – the broadest aggregation of M3 components for which a sectoral breakdown is available (see Chart 1). In 2006, the OFI sector’s contribution to the 8.1% average annual growth rate amounted to 1.8 percentage points. This impact on monetary dynamics is particularly noteworthy, as OFIs in mid-2006 accounted for only around 11% of the total holdings of short-term deposits including repurchase agreements.
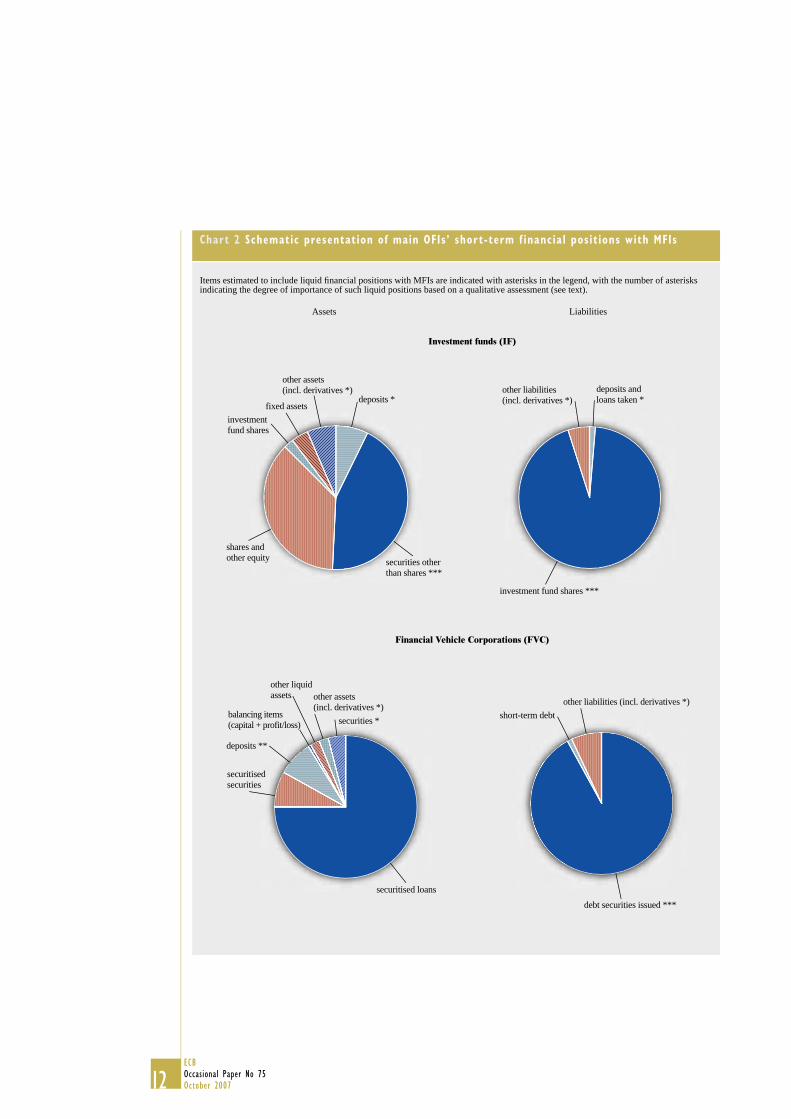
Chart 2 presents the relative importance of the main assets and liabilities in the balance sheet of four OFI sub-sectors (IFs, FVCs, SDDs and FCLs) for which balance sheet information is available.10 The charts also indicate – for each item in the OFI sub-sectors’ balance sheets which would typically include liquid fi nancial positions with MFIs – an estimation of the importance of such liquid positions from most important (indicated with three asterisks) to least important (indicated with one asterisk). Owing to the insuffi cient level of counterparty/maturity breakdowns available in the data collected by the ECB under the short-term approach, such estimations have been derived
mostly by considering the typical activity of each OFI sub-sector. 11
The main fi nancial relations with MFIs are described separately for the assets side and for the liabilities side of the OFIs’ balance sheet, in terms of instrument categories. It is important to note that if OFIs’ intermediation activity was undertaken within the MFI sector then it would be consolidated in the money and banking statistics. As regards the assets side, a key question relates to the extent to which a given OFI sub-sector places deposits with MFIs or invests in other liquid assets issued by MFIs (such as debt securities or derivatives). As for the liabilities side, an important question is whether MFIs are a source of funding for OFIs and/or whether derivatives positions between OFIs and MFIs are in place. Given the limited availability of data, these questions will be addressed mainly from a qualitative perspective.
As far as IFs are concerned, transactions with MFIs typically engage the assets side of the balance sheet. Investment funds place deposits (including repos) with MFIs as a liquidity buffer against possible calls for repayment of shares/units issued. Additionally, the funds may hold deposits with MFIs as an inevitable part of the turnover process of their investment positions. Transactions in derivatives
Short-term deposits include overnight deposits, deposits with 9 agreed maturity of up to two years (short-term time deposits) and deposits redeemable at notice up to three months (short-term savings deposits). Data gaps and the limited availability of breakdowns on loans 10 and deposits (e.g. absence of maturity, geographical and institutional counterparty breakdowns) result in unharmonised OFI data collected by the ECB and therefore complicate an empirical analysis of their relevance in overall monetary and credit developments refl ected by the MFI data. This is further aggravated by the fact that the MFI data on loans and deposits refer to the aggregate OFI sector plus fi nancial auxiliaries, with no breakdowns by OFI sub-sector available. We endeavour to overcome these diffi culties by restricting our quantitative analysis to the country level and by focusing on MFIs’ transactions with domestic OFIs. This allows us to exploit the different relative importance of the various OFI sub-sectors in different countries as a set of identifi cation restrictions. A tentative empirical analysis is presented in the Annex on 11 the basis of preliminary data available from the OFI statistics, linking (at the individual country level) developments in OFIs’ deposits and loans with data reported by the MFI balance sheet statistics.
Chart 1 Short-term deposits and repurchase agreements by sector
(annual percentage changes and contributions in percentage points)
-2
0
2
4
6
8
10
-2
0
2
4
6
8
10
2004 2005 2006
non-financial corporationshouseholdsinsurance corporations and pension fundsother financial intermediariesother general governmentshort-term deposits & repurchase agreements
Source: ECB. Note: Reporting sector comprises MFIs excluding the Eurosystem.
12ECBOccasional Paper No 75October 2007
Chart 2 Schematic presentation of main OFIs’ short-term f inancial positions with MFIs
Items estimated to include liquid fi nancial positions with MFIs are indicated with asterisks in the legend, with the number of asterisks indicating the degree of importance of such liquid positions based on a qualitative assessment (see text).
Assets Liabilities
Investment funds (IF)
securities other than shares ***
shares and other equity
deposits *
other assets (incl. derivatives *)
fixed assets
investment fund shares
investment fund shares ***
other liabilities (incl. derivatives *)
deposits and loans taken *
Financial Vehicle Corporations (FVC)
securitised loans
securitisedsecurities
deposits **
securities *
other liquidassets other assets
(incl. derivatives *)balancing items (capital + profit/loss)
debt securities issued ***
short-term debt
other liabilities (incl. derivatives *)

13ECB
Occasional Paper No 75October 2007
2 OF I s AND THEIR RELAT IONSHIPS
WITH MFIs
with MFIs counterparties are also possible, for hedging and/or speculative purposes. For some of these transactions, IFs may also place margin deposits with MFIs. Moreover, for investment purposes, IFs may purchase debt securities issued by MFIs or money market fund shares.
Looking at OFIs’ holdings of marketable securities included in M3, Chart 3 shows the estimated share of euro area IFs’ holdings of MFI debt securities with a maturity of up to one year in the total amount outstanding of such securities held by euro area residents other than MFIs. According to these estimates, the share of euro
area IFs as holders of such securities has steadily gained in importance, from a share of slightly less than 20% in the fourth quarter of 1998 to slightly over 60% in the second quarter of 2006. The extent to which the share of IFs’ holdings of MFI debt securities with a maturity of over one and up to two years has seen a similar increase over the period cannot be determined from the available OFI short-term data, although such securities play a smaller role in M3.12 As for
The average share (January 1999 to December 2005) of MFI 12 debt securities with a maturity of up to one year over total M3 is 1.6%, compared with 0.7% for those with a maturity of over one and up to two years.
Chart 2 Schematic presentation of main OFIs’ short-term f inancial positions with MFIs
Assets Liabilities
Financial Corporations engaged in Lending (FCL)
loans
securities otherthan shares
shares/other equityother assets
debt securities issued *
capital and reserves
other liabilities
deposits andloans taken ***
Securities and Derivatives Dealers (SDD)
securities other than shares ***
deposits **
shares/other equity
other assets (incl. derivatives *)
other liabilities (incl. derivatives *)
debt securities issued
capital andreserves
deposits and loans taken ***
Source: ECB estimates.

14ECBOccasional Paper No 75October 2007
money market fund shares/units, the proportion of IFs’ holdings in the total amount outstanding held by non-MFI euro area residents is much lower than in the case of debt securities, which is estimated at around 5%.
Turning to the liabilities side of IFs’ balance sheet, evidence of quantitatively signifi cant relationships between IFs and MFIs is more limited, as IFs normally promote the sale of their shares/units to the public while, in general, loans and deposits play only a subordinate role. It cannot be ruled out that MFIs purchase shares of IFs’, especially in the most innovative asset classes, e.g. shares/units issued by hedge funds. Moreover, this latter type of fund may seek leverage by borrowing from MFIs.13
However, in order for the positions of IFs with euro area MFIs to be included in the money and credit aggregates of the euro area, the investment funds need to be domiciled in a Member State. In particular, this tends to reduce the direct impact of hedge funds for euro area money and credit aggregates, as they tend to be domiciled in the United Kingdom, the United States or in offshore fi nancial centres. At the same time, transactions conducted by these foreign entities with euro area residents will be captured in the net external asset developments, and thus may
be indirectly refl ected in the developments of monetary aggregates.
FVCs often maintain close fi nancial relationships with MFIs, as the latter are often the originator of the assets that FVCs securitise. It should be noted that in a traditional securitisation scheme, transactions due to MFI loan (and other asset) sales to FVCs do not generate permanent liquid fi nancial positions. However, temporary liquid positions may arise in the period between the FVC purchase of securitised assets from MFIs and its actual cash settlement. Once the deal is settled, MFIs may purchase some (often the junior tranches) of the debt securities issued by FVCs. Moreover, FVCs may place deposits with MFIs, often on a temporary basis. Indeed, loans (and other asset) repayments are normally passed through to the end-investors as soon as they are cashed. As shown above, the estimated amount of the total balance sheet of euro area FVCs at the end of 2004 was €500 billion, three-quarters (€379 billion) of which related to the portfolio of securitised loans. At the same time, FVCs’ holdings of deposits are estimated to be around €41 billion. However, this fi gure may underestimate the overall magnitude, as other liquid assets held by FVCs (€9 billion) may partly refl ect transactions with MFIs. Furthermore, FVCs’ holdings of securities, which may include some issued by MFIs, amount to €46 billion. On the liabilities side, the amount of short-term debt issued by FVCs and presumably held by MFIs amounts to around €1 billion. In a synthetic securitisation scheme, MFIs do not sell the loans (and other assets) to FVCs, but rather stipulate fi nancial derivatives contracts, typically credit default swaps, to transfer credit risk. As long as the loans serving as collateral do not default, the FVC receives a premium payment from the MFI; however, in the case of a loan default, the FVC has to cover the capital losses of the MFI. This explains why
According to the ECB publication entitled “Large EU banks’ 13 exposures to hedge funds” (November 2005), at the end of 2004 for a sample of 14 banks from six EU countries, cash lending to hedge funds collateralised with securities amounted, on average, to 1.5% of surveyed banks’ assets, the range being from 0% to 5.5% across countries.
Chart 3 Euro area investment funds’ share of debt securities included in M3 with a maturity of up to one year
(in percentage)
70
60
50
40
30
20
10
0
70
60
50
40
30
20
10
01999 2000 2001 2002 2003 2004 2005 2006
IFs' holdings of MFI debt securities with amaturity of up to one year
Source: ECB calculations.

15ECB
Occasional Paper No 75October 2007
2 OF I s AND THEIR RELAT IONSHIPS
WITH MFIsFVCs’ derivatives positions may change from asset to liability rather rapidly. Importantly, FVCs issue debt securities and use the proceeds to invest in safe assets, including deposits and other fi nancial instruments issued by MFIs.
FCLs are often fi nanced (and owned) byMFIs, creating a double layer of intermediation which is justifi ed by the specialisation of such intermediaries. FCLs may also fi nance themselves by issuing short-term commercial paper and debt securities. The available data onFCLs indicate, albeit with limitations, the importance of lending with a maturity of up to fi ve years by MFIs to FCLs in some euro area countries.
SDDs trade securities and derivatives on their own account and risk. This trading activity may easily generate positions with MFIs, for example SDDs may invest in debt securities issued by MFIs and engage in fi nancial derivatives transactions (sometimes leading to the creation of margin deposits) and in repurchase agreement transactions with the MFI acting as a counterparty. SDDs may also place overnight deposits with MFIs for trading purposes. In order to fi nance their trading activity, which tends to be of a short-term nature, loans granted to SDDs by MFIs generally have a short maturity. In some euro area countries, where SDDs play a more signifi cant role, loans granted to SDDs can constitute a signifi cant share of MFIs’ lending business with the OFI sector.
The typical activity of FHCs is the management of participation interests in fi nancial corporations. This is an activity that is generally oriented towards the medium to longer term and therefore unlikely to generate sizeable short-term deposit holdings with MFIs. FHCs are generally funded through the issuance of an equity-type security.
The residual category of other OFIs may include a number of heterogeneous entities, such as venture capital companies not structured as IFs, in particular, special fi nancial institutions, etc. The importance of this sub-sector crucially depends on the pace and nature of fi nancial
innovation. For instance, clearing houses that were traditionally pure facilitators of fi nancial transactions may now assume a certain degree of counterparty risk in their fi nancial services. This tendency may have implications for monetary developments, as transactions with MFIs through these clearing houses would no longer be recorded as intra-MFI transactions.14
To sum up, there are manifold channels through which the fi nancial behaviour of the various business models classifi ed as OFIs can impact MFIs’ balance sheet. From this perspective, all types of OFIs (with the possible exception of FHCs) are of interest for the analysis of monetary developments. Currently, IFs and FVCs seem to be the two sub-categories displaying the strongest interaction with MFIs, particularly with respect to developments on the liability side of the MFI balance sheet. However, the remaining sub-categories may also be relevant for monetary analysis purposes. In particular, FCLs (and to a lesser extent SDDs) may be important for monitoring overall credit developments.
Finally, looking forward, fi nancial innovation may generate other types of OFI, which would initially be classifi ed in the residual category. However, some of these may become important over time and contribute to structural changes both in the MFI and other OFI sub-sectors. A close monitoring of the residual category is therefore warranted.
It should be noted that while traditional clearing houses are 14 statistically classifi ed as Financial Auxiliaries (S.124), special entities that assume counterparty risk may need to be classifi ed in the OFI sector (S.123).
16ECBOccasional Paper No 75October 2007
3 THE ROLE OF OFIS IN MONETARY ANALYSIS
by B. Fischer, D. Gerdesmeier, A. Lojschova and J. von Landesberger (ECB staff)
3.1 DETERMINANTS OF OFIs’ DEMAND FOR
MONEY
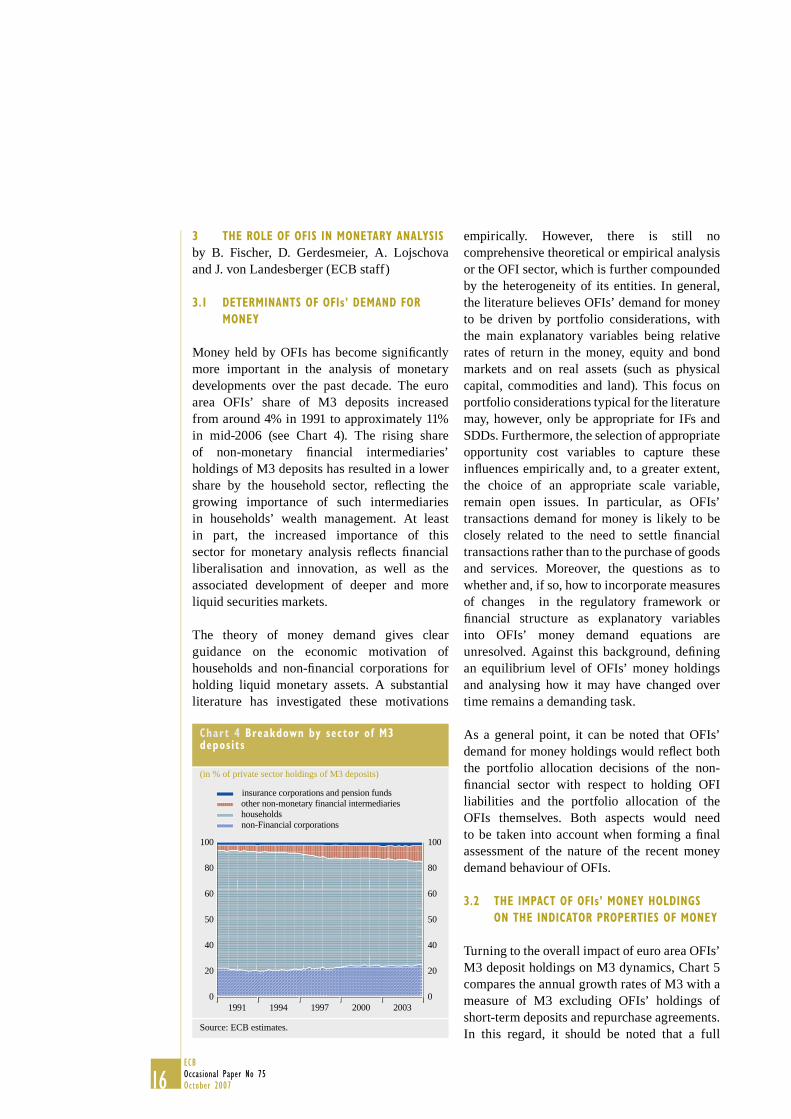
Money held by OFIs has become signifi cantly more important in the analysis of monetary developments over the past decade. The euro area OFIs’ share of M3 deposits increased from around 4% in 1991 to approximately 11% in mid-2006 (see Chart 4). The rising share of non-monetary fi nancial intermediaries’ holdings of M3 deposits has resulted in a lower share by the household sector, refl ecting the growing importance of such intermediaries in households’ wealth management. At least in part, the increased importance of this sector for monetary analysis refl ects fi nancial liberalisation and innovation, as well as the associated development of deeper and more liquid securities markets.
The theory of money demand gives clear guidance on the economic motivation of households and non-fi nancial corporations for holding liquid monetary assets. A substantial literature has investigated these motivations
empirically. However, there is still no comprehensive theoretical or empirical analysis or the OFI sector, which is further compounded by the heterogeneity of its entities. In general, the literature believes OFIs’ demand for money to be driven by portfolio considerations, with the main explanatory variables being relative rates of return in the money, equity and bond markets and on real assets (such as physical capital, commodities and land). This focus on portfolio considerations typical for the literature may, however, only be appropriate for IFs and SDDs. Furthermore, the selection of appropriate opportunity cost variables to capture these infl uences empirically and, to a greater extent, the choice of an appropriate scale variable, remain open issues. In particular, as OFIs’ transactions demand for money is likely to be closely related to the need to settle fi nancial transactions rather than to the purchase of goods and services. Moreover, the questions as to whether and, if so, how to incorporate measures of changes in the regulatory framework or fi nancial structure as explanatory variables into OFIs’ money demand equations are unresolved. Against this background, defi ning an equilibrium level of OFIs’ money holdings and analysing how it may have changed over time remains a demanding task.
As a general point, it can be noted that OFIs’ demand for money holdings would refl ect both the portfolio allocation decisions of the non-fi nancial sector with respect to holding OFI liabilities and the portfolio allocation of the OFIs themselves. Both aspects would need to be taken into account when forming a fi nal assessment of the nature of the recent money demand behaviour of OFIs.
3.2 THE IMPACT OF OFIs’ MONEY HOLDINGS
ON THE INDICATOR PROPERTIES OF MONEY
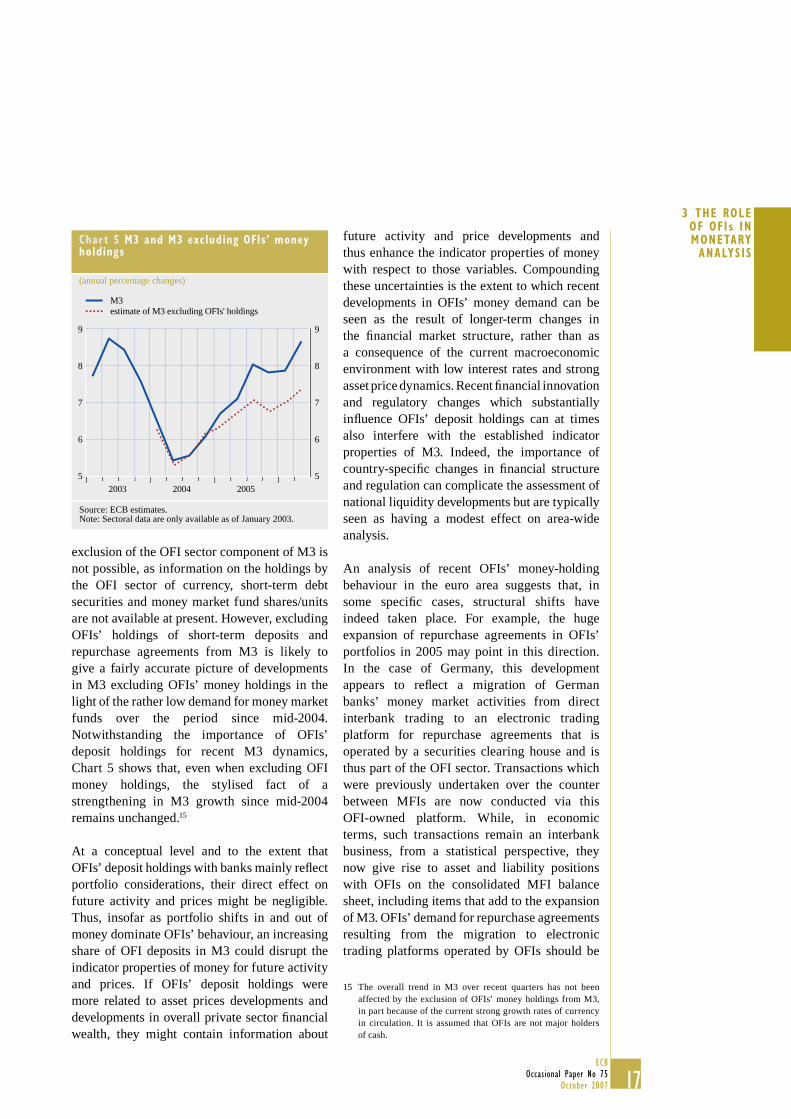
Turning to the overall impact of euro area OFIs’ M3 deposit holdings on M3 dynamics, Chart 5 compares the annual growth rates of M3 with a measure of M3 excluding OFIs’ holdings of short-term deposits and repurchase agreements. In this regard, it should be noted that a full
Chart 4 Breakdown by sector of M3 deposits
(in % of private sector holdings of M3 deposits)
insurance corporations and pension fundsother non-monetary financial intermediarieshouseholdsnon-Financial corporations
100
80
60
50
40
20
0
100
80
60
50
40
20
01991 1994 1997 2000 2003
Source: ECB estimates.
17ECB
Occasional Paper No 75October 2007
3 THE ROLE OF OF I s INMONETARY
ANALYS IS
exclusion of the OFI sector component of M3 is not possible, as information on the holdings by the OFI sector of currency, short-term debt securities and money market fund shares/units are not available at present. However, excluding OFIs’ holdings of short-term deposits and repurchase agreements from M3 is likely to give a fairly accurate picture of developments in M3 excluding OFIs’ money holdings in the light of the rather low demand for money market funds over the period since mid-2004. Notwithstanding the importance of OFIs’ deposit holdings for recent M3 dynamics, Chart 5 shows that, even when excluding OFI money holdings, the stylised fact of a strengthening in M3 growth since mid-2004 remains unchanged.15
At a conceptual level and to the extent that OFIs’ deposit holdings with banks mainly refl ect portfolio considerations, their direct effect on future activity and prices might be negligible. Thus, insofar as portfolio shifts in and out of money dominate OFIs’ behaviour, an increasing share of OFI deposits in M3 could disrupt the indicator properties of money for future activity and prices. If OFIs’ deposit holdings were more related to asset prices developments and developments in overall private sector fi nancial wealth, they might contain information about
future activity and price developments and thus enhance the indicator properties of money with respect to those variables. Compounding these uncertainties is the extent to which recent developments in OFIs’ money demand can be seen as the result of longer-term changes in the fi nancial market structure, rather than as a consequence of the current macroeconomic environment with low interest rates and strong asset price dynamics. Recent fi nancial innovation and regulatory changes which substantially infl uence OFIs’ deposit holdings can at times also interfere with the established indicator properties of M3. Indeed, the importance of country-specifi c changes in fi nancial structure and regulation can complicate the assessment of national liquidity developments but are typically seen as having a modest effect on area-wide analysis.
An analysis of recent OFIs’ money-holding behaviour in the euro area suggests that, in some specifi c cases, structural shifts have indeed taken place. For example, the huge expansion of repurchase agreements in OFIs’ portfolios in 2005 may point in this direction. In the case of Germany, this development appears to refl ect a migration of German banks’ money market activities from direct interbank trading to an electronic trading platform for repurchase agreements that is operated by a securities clearing house and is thus part of the OFI sector. Transactions which were previously undertaken over the counter between MFIs are now conducted via this OFI-owned platform. While, in economic terms, such transactions remain an interbank business, from a statistical perspective, they now give rise to asset and liability positions with OFIs on the consolidated MFI balance sheet, including items that add to the expansion of M3. OFIs’ demand for repurchase agreements resulting from the migration to electronic trading platforms operated by OFIs should be
The overall trend in M3 over recent quarters has not been 15 affected by the exclusion of OFIs’ money holdings from M3, in part because of the current strong growth rates of currency in circulation. It is assumed that OFIs are not major holders of cash.
Chart 5 M3 and M3 excluding OFIs’ money holdings
(annual percentage changes)
5
6
7
8
9
5
6
7
8
9
2003 2004 2005
M3estimate of M3 excluding OFIs' holdings
Source: ECB estimates. Note: Sectoral data are only available as of January 2003.
18ECBOccasional Paper No 75October 2007
seen as a distortion to the monetary data. Such developments (which may also be taking place, albeit on a more modest scale, in Italy) blur the indicator properties of monetary aggregates. However, the overall impact of the migration of repurchase agreement transactions to an OFI-operated platform in Germany on aggregate M3 developments is currently modest. Moreover, it is doubtful that the experience in Germany can be generalised for other countries or for the euro area as a whole.
Overall, evidence against major structural changes in OFIs’ money-holding behaviour can also be found. For example, IFs have maintained broadly similar liquidity ratios (i.e. ratio of monetary to total assets) in the euro area over recent years.
Finally, the analysis can also be extended to the components and counterparts of M3. A close link between synthetic loan securitisation by MFIs, the creation of special purpose vehicles (SPVs, classifi ed as FVCs and thus part of the OFI sector) and OFIs’ demand for longer-term fi nancial liabilities can be established. For example, such behaviour has been particularly important in Spain and Portugal in recent years, where regulatory changes (relating to the introduction of International Accounting Standard (IAS) 39) as well as strong mortgage market developments have played an important role in expanding securitisation. In the Netherlands, synthetic securitisations affected OFIs’ money demand, as SPVs often stored the funds raised through the issuance of debt securities as liquid deposits (that acted as collateral) and thus fuelled the growth rate of OFIs’ money holdings. The subsequent unwinding of such transactions dampened the growth rate of OFIs’ money holdings. Overall, the impact of synthetic loan securitisations on euro area M3 growth remains uncertain, as it is not known whether this type of activity causes substitution within M3 (without affecting euro area M3) or whether it affects euro area M3 through a change in the counterparts.
3.3 THE ROLE OF OFIs’ MONEY HOLDINGS
IN ASSESSING RISKS TO FUTURE PRICE
STABILITY
Are OFIs’ money holdings noise or relevant policy information? Given the predominance of such portfolio considerations in determining OFIs’ money holdings, one could wonder how to interpret monetary growth stemming from this sector when assessing the impact of monetary dynamics on infl ation and output prospects. This is particularly the case since OFIs’ activities – which, by nature, are typically in the fi nancial domain – create relatively little direct fi nal demand for goods and services, certainly as compared with the activity of private households and non-fi nancial corporations. Against this background, the link between OFIs’ money holdings and the medium to longer-term outlook for price stability requires specifi c analysis.
Preliminary fi ndings on the information content of sectoral money developments with respect to infl ation indicate that there is a closer relationship between consumer price infl ation and a measure of underlying household money holdings than is the case for broader aggregate M3 or other individual sectors. However, by aggregating money holdings over different sectors to construct M3, idiosyncratic elements seem to be averaged out and substitution effects (e.g. between direct holdings of bank deposits by households and indirect holdings through IFs and other non-monetary fi nancial intermediaries) appear to be internalised. Indeed, a broader sectoral coverage of the aggregate M3 series seems to improve the leading properties of M3 compared with the household M3 series, thereby facilitating an earlier prediction of turning points in euro area infl ation.16
While OFIs’ money holdings may have a somewhat different character to those of households or non-fi nancial corporations, their
See the box entitled “Sectoral money and the information content 16 of money with respect to infl ation” in the September 2006 issue of the ECB’s Monthly Bulletin.
19ECB
Occasional Paper No 75October 2007
3 THE ROLE OF OF I s INMONETARY
ANALYS IS
specifi c contribution to overall monetary developments cannot simply be omitted when assessing risks to price stability stemming from the monetary analysis. In particular, omitting OFIs’ money holdings could mean leaving out information on fi nancial linkages between money-holding sectors and substitution processes between asset classes, which could be relevant for price developments, especially over the medium to longer term.
3.4 THE ROLE OF OFIs IN THE TRANSMISSION
MECHANISM OF MONETARY POLICY
There are basically two main reasons why monetary growth attributable to OFIs might enter the transmission mechanism of monetary policy and would thus be relevant in the assessment of the outlook for infl ation and economic activity.
First, OFIs affect and/or refl ect developments in the economy through their fi nancial linkages with other sectors, to the extent that they enable fi rms or households to modify their spending and saving patterns. Hence, rapid growth in the total of money balances of OFIs may refl ect developments in asset markets and thus private sector wealth. Increases in wealth, in turn, could lead to higher infl ation via demand effects over time.
Second, excluding OFIs’ money holdings from monetary aggregates might reduce the information content of these aggregates with respect to nominal aggregate demand in the medium to longer term, the reason being that the information content of monetary aggregates rests on the fact that they subsume the complex substitution processes that occur between a large variety of assets and impact on unobservable liquidity and risk premia. These premia affect the ability of households and fi rms to borrow or lend, i.e. to bring forward or delay expenditure. Owing to professional risk management, OFIs may undertake transactions to provide liquidity to certain asset classes, by buying mortgage and corporate loan portfolios or factoring, for example, which are deemed
too risky by non-specialised investors. To a certain extent, the recent growth in OFIs’ deposits and loans may constitute a one-off structural adjustment in the fi nancial system. However, cyclical effects related to the low level of interest rates – inducing a desire for yield – may be reinforcing the attractiveness of certain liquidity-providing investments by OFIs. The change in the risk/return profi le of the asset classes could impact on the functioning of the transmission of monetary policy via its infl uence on asset prices. In this regard, OFIs’ money holdings are very likely to contain relevant information over the medium to longer term that would be overlooked when analysing the money-holding sector without this group.
Turning to the analysis of the potential impact of OFIs on specifi c linkages of the transmission mechanism, there are a variety of channels that might, in principle, be infl uenced. The traditional interest rate channel is probably less vulnerable to change, as it operates largely through the consumption and investment decisions of households and fi rms. By contrast, an expansion of leasing and securitisation activities could lead to an increase in credit supply. This, in turn, would make bank credit less “special”, which could weaken the credit channel of monetary transmission. At the same time, by increasing the liquidity of some fi nancial markets and acting in a pro-cyclical manner, hedge funds had tended – at least temporarily – to reduce market credit and term spreads. Finally, one can argue that if OFIs lead to an increased exposure of households to, for example, bond markets, changes in the wealth or balance sheet channel of monetary transmission could result.
At the current juncture, there is no concrete evidence regarding the infl uence of OFIs on the individual transmission channels. Taking differences at the country level into account, as well as the heterogeneity of the OFI sector, may help to explain the cross-country differences in the propagation of monetary policy impulses within the euro area.

20ECBOccasional Paper No 75October 2007
4 A LOOK AT THE COUNTRY LEVEL
4.1 OVERVIEW
As shown in the previous sections, the euro area OFI sector is characterised by a strong heterogeneity with respect to the types of activity undertaken. At the same time, the relevance of OFIs for monetary developments varies considerably across countries. In part, this variation refl ects the different sizes of fi nancial markets, proxied by the relative shares of outstanding quoted shares and bonds in Table 2. A look at the relative size of the OFI sectors across the euro area indicates that OFIs resident in Luxembourg, the Netherlands and France are particularly important. However, an analysis of the distribution of M3 deposits relevant for monetary developments indicates that OFIs’ deposit holdings are more evenly spread. OFIs’ deposit holdings with MFIs resident in Germany, the Netherlands, Spain and France are among the larger holdings. Putting M3 deposits into relation with nominal GDP indicates that the OFIs in Luxembourg, Ireland and the Netherlands have large “cash ratios”.
In order to gauge the impact of the individual OFI sectors on aggregate monetary dynamics, Chart 6 shows the national contributions to the euro area annual growth in OFIs’ M3 deposit holdings. The breakdown reveals that the countries mainly “responsible” for the growth in deposit holdings have changed signifi cantly over the last two years. Three pairs of countries can be identifi ed. First, in 2004, the annual growth rate was primarily supported by developments in France and Spain, while in 2005 these two countries played a more ancillary role. Second, while Germany and Luxembourg played only a marginal role for most of 2004 despite their large share of money holdings in the euro area, their contribution increased substantially over the course of 2005 and early 2006. Third, for most of 2004, negative contributions from Italy and, in particular, the Netherlands were observed. However, from early 2005 onwards these contributions turned positive, and in 2006 they increased to place these countries among the larger contributors.
Overall, this breakdown indicates that the dynamics in the individual euro area countries
Table 2 Financial markets and OFIs’ holdings of f inancial assets and M3 deposits
(end 2005)
In % of the euro area Relative to national nominal GDP
Total economy quote shares
issued
Total economy bonds
outstanding Financial assets
of OFIs
OFIs' short-term deposits
and repurchase agreements with MFIs1
Financial assets of OFIs
OFIs' short-term deposits
and repurchase agreements with MFIs 1
BE 4 4 3 8 0.90 0.14 DE 21 32 11 16 0.44 0.04 GR 2 2 0 0 0.18 0.01 ES 11 9 6 15 0.55 0.09 FR 27 9 13 13 0.71 0.04 IE 2 2 10 5 5.65 0.18 IT 13 21 9 11 0.57 0.04 NL 11 12 18 16 3.29 0.18 AT 2 4 2 2 0.74 0.03 PT 1 1 1 1 0.66 0.05 FI 4 1 0 0 0.28 0.01 LU 1 1 26 13 78.24 2.51 DK - - 3 - 0.87 -SE - - 3 - 0.62 -UK - - 55 - 1.79 -
Sources: ECB, ECB estimates and Eurostat.1) Resident in the respective Member State.

21ECB
Occasional Paper No 75October 2007
4 A LOOK AT THE
COUNTRY LEVEL
have diverged signifi cantly between the beginning of 2003 and mid-2006, and therefore a deeper analysis of the individual country developments is warranted. In particular, fi ve questions are of core interest, namely:
1. What are the main sub-sectors of the OFI sector in the individual countries and what is their relative size?
2. What have been the developments (in terms of both stocks and annual growth rates)in the OFIs’ M3 deposit holdings between 2004 and mid-2006?
3. Which economic considerations seem to drive OFIs’ demand for money (i.e. short-term deposits and repurchase agreements) in the individual countries and how do they relate to the money-holding behaviour of households and non-fi nancial corporations?
4. How important (in terms of both stocks and developments in annual growth rates) are
OFIs for the development of longer-term deposits in the individual countries? How is this related to fi nancial innovation, such as securitisation, and regulatory changes, such as the implementation of Basel II?
5. Looking across the maturity spectrum of OFIs’ deposit holdings included and excluded from M3, what conclusions regarding OFIs’ activities can be drawn?
4.2 COUNTRY EVIDENCE
4.2.1 BELGIUM
by A. Bruggeman (National Bank van België/Banque Nationale de Belgique)
As Belgian MFIs only report data for the OFI sector as a whole, these data cannot be used to analyse the relative importance of the main sub-sectors of the OFI sector in Belgium. However, it is possible to form an estimate on the basis of the more detailed (but not fully comparable) fi nancial accounts data.
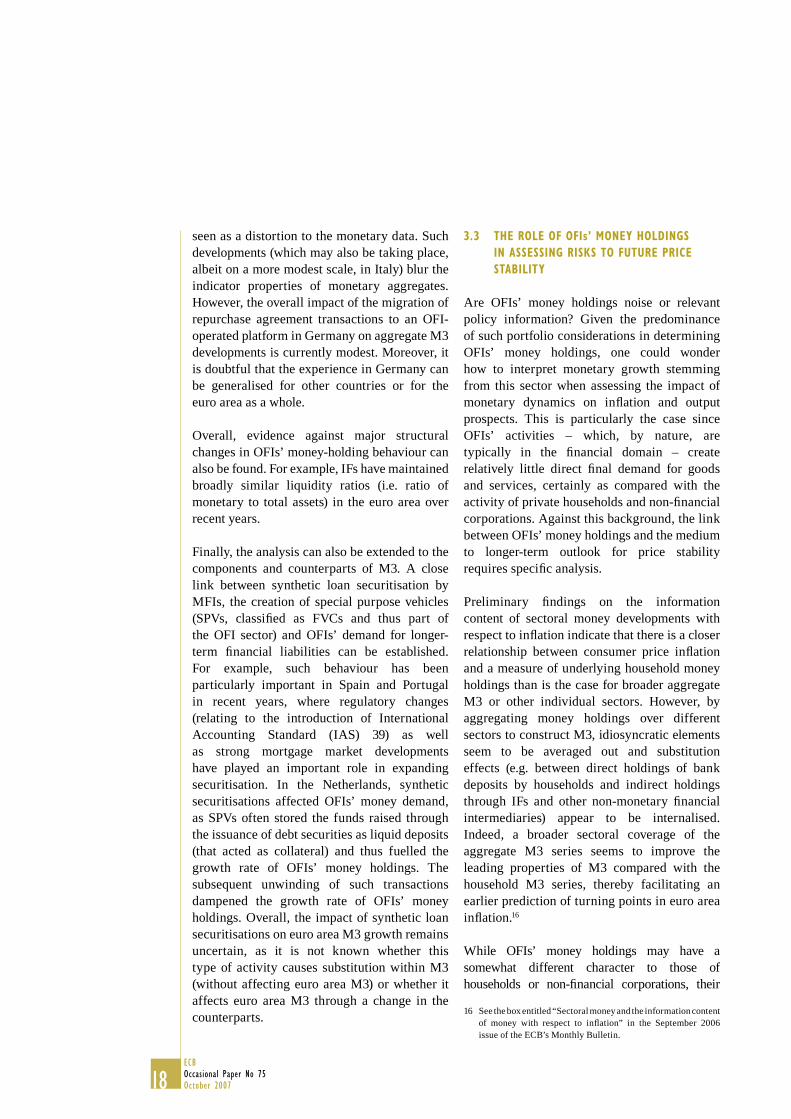
In terms of total deposit holdings, IFs are by far the largest sub-sector of the OFI sector in Belgium. They represented around 84% of all OFIs' deposit holdings in June 2006, while the FHCs, SDDs, the FCLs, and the other OFIs accounted for around 7%, 4%, 3%, and 2% respectively (see Chart 7).
In March 2006, the relative share of the IF sub-sector declined considerably in favour of the FCL sub-sector, most likely refl ecting a large temporary fl ow into overnight deposits held by the latter.
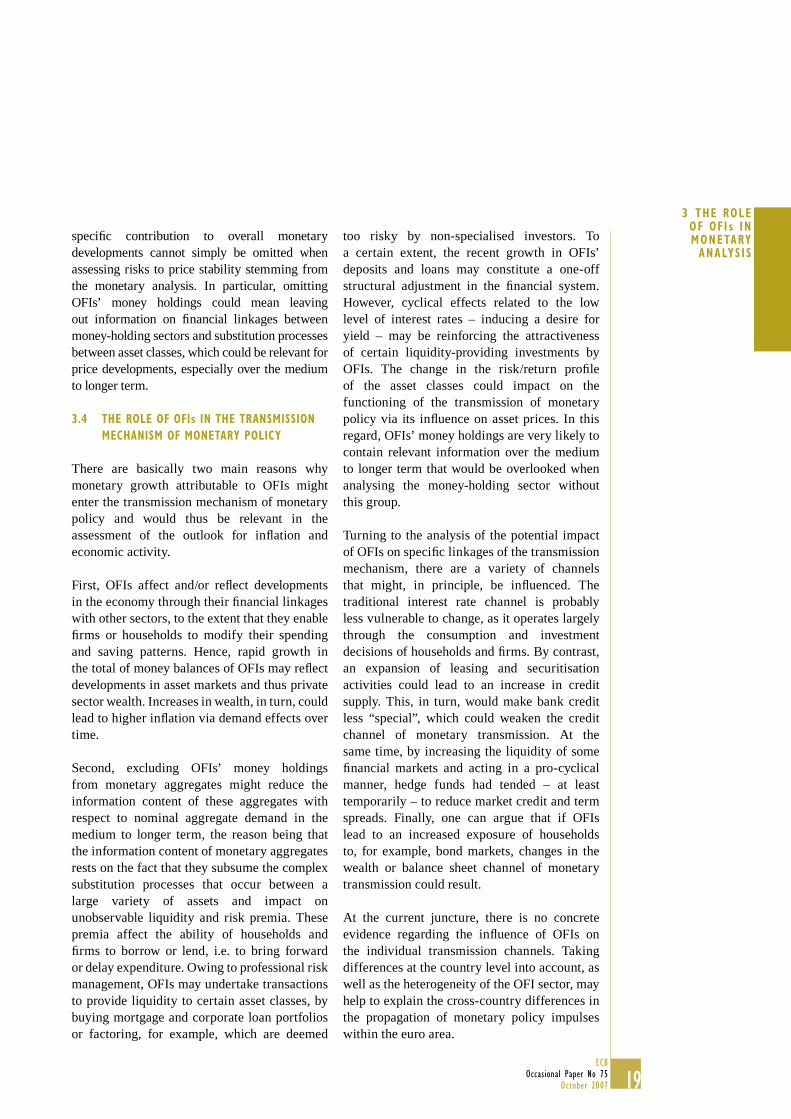
Regarding the main developments, a breakdown by instrument of OFIs' short-term deposit holdings with Belgian MFIs reveals that they have a strong preference for short-term time deposits and for overnight deposits, which over the period from 2003 to mid-2006 represented on average 73% and 22% respectively of their total short-term deposit holdings (including repurchase agreements) with Belgian MFIs.
Chart 6 OFIs’ holdings of short-term deposits and repurchase agreements by country
(annual percentage changes and contributions in percentage points)
30
25
20
15
10
5
0
-5
-10
30
25
20
15
10
5
0
-5
-102004 2005 2006
LUESPTDEBEAT
NLFIFRGRITIE
euro area
Source: ECB.Contributions may not add up due to rounding. MFI sector excludes the Eurosystem. Refer to the country of residence of the MFI.
22ECBOccasional Paper No 75October 2007
These average fi gures mask the growing importance of overnight deposits, whose share rose from a low of 15% in June 2003 to almost 30% in early 2006, before decreasing to 25% in June 2006.
Disregarding the large volatility of these data, the annual growth rate of OFIs’ holdings of short-term time deposits with Belgian MFIs rose sharply in the fi rst few months of 2004, but then fl uctuated around an average of 12¾% until October 2005 (see also Chart 8). Thereafter, the annual growth rate was on a clear downward trend. The developments in the annual growth rate of OFIs’ overnight deposit holdings were quite similar up until mid-2005: after a steep rise in early 2004, they fl uctuated around an average of 18½%. From then onwards, the annual growth rate was on an upward trend until March 2006, but then moderated again to even fall below the average level of the period from 2004 to mid-2005.
Between January 2003 and June 2006, OFIs’ short-term deposit holdings (including repurchase agreements) with Belgian MFIs recorded an annualised growth rate of 8%, compared with annualised rates of expansion of 8¼% for households and 10½% for non-fi nancial corporations. However, as households are by far the largest deposit-holding sector, their average contribution to total short-term deposit holdings with Belgian MFIs was about three times higher than that of each of the other two sectors(see Chart 9).
OFIs’ strong demand for money is most likely being driven by the substantial infl ows into IFs in recent years, rather than by a change in their investment strategy. According to fi nancial accounts data up to the second quarter of 2006, the total fi nancial assets of Belgian OFIs increased at an annualised rate of 18½% from the fi rst quarter of 2003. These substantial infl ows originated mainly from households
Chart 7 OFIs’ holdings by sector
(percentages, June 2006)
2.0%
83.9%
2.9%
4.3%
6.9%
investment funds
financialcorporations engaged in lending
securities and derivatives dealers
financial holding companies
other OFIs
Source: Nationale Bank van België/Banque Nationale de Belgique.Note: Data refer to June 2006 (instead of March), because the relative share of the investment funds sub-sector fell temporarily in March in favour of the sub-sector of the fi nancial corporations engaged in lending, refl ecting a large temporary fl ow into overnight deposits held by the latter sub-sector.
Chart 8 Breakdown of short-term deposits and repurchase agreements by instrument
(annual growth rate in percent; contributions in percentage points; neither seasonally nor calendar effect adjusted)
25
20
15
5
10
0
-5
-10
25
20
15
10
5
0
-5
-102004 2005 2006
repurchase agreementsdeposits redeemable up to 3 monthsdeposits with agreed mat. up to 2 yearsovernight depositsshort-term deposits and repurchase agreements
Note: MFI sector excludes the Eurosystem. Refer to the country of residence of the MFI.

23ECB
Occasional Paper No 75October 2007
4 A LOOK AT THE
COUNTRY LEVEL
and from ICPFs that had been investing a larger proportion of their total fi nancial assets in mutual fund shares. Belgian households’ holdings of mutual fund shares grew at an annualised rate of 12½% from the fi rst quarter of 2003 (while their total fi nancial assets rose by 6¼%). Similarly, Belgian ICPFs increased their holdings of mutual fund shares at an annualised rate of 15¾% (compared with 14½% for their total fi nancial assets).
Belgian OFIs’ demand for money would have been even higher in recent years had they not reduced the proportion of deposits in their total fi nancial assets, from 17% in 2003 to 12% in the second quarter of 2006. The apparent lower liquidity preference of Belgian OFIs could refl ect their reduced liquidity needs to cover potential withdrawals of funds, given the large infl ows that they had received. At the same time, it could also refl ect a change in the investment strategy (of both investors in mutual funds and of IFs themselves) in a context of reduced risk aversion and the desire for yield in an environment of persistently low interest rates.
Longer-term deposits with Belgian MFIs are mainly held by OFIs (see Chart 10). During the last three and a half years of the period under review, their share gradually increased from 86% in January 2003 to 93% in June 2006, at the expense of households’ holdings of longer-term deposits. To some extent, this was a result of the fact that the annual growth rate of households’ holdings of longer-term deposits had been consistently negative over the period under review. At the same time, OFIs’ holdings of longer-term deposits with Belgian MFIs accelerated towards the end of the period under review, growing at an annualised rate of 23¾% between December 2005 and June 2006, compared with an annualised rate of expansion of 15¾% between January 2003 andDecember 2005.
A closer look at the maturity spectrum reveals that OFIs’ deposit holdings with Belgian MFIs mainly took the form of short-term time deposits (43%), longer-term (time) deposits (42%) and overnight deposits (13%), although their preference for longer-term (time) deposits seemed to increase recently. This distribution
Chart 9 Breakdown of short-term deposits and repurchase agreements by sector
(annual growth rate in percent; contributions in percentage points; neither seasonally nor calendar effect adjusted)
12
10
8
6
4
2
0
-2
12
10
8
6
4
2
0
-22004 2005 2006
householdsnon-financial corporationsinsurance corporations and pension fundsother general governmentother non-monetary financial intermediariesshort-term deposits and repurchase agreements
Note: MFI sector excludes the Eurosystem. Refer to the country of residence of the MFI.
Chart 10 Breakdown of longer-term deposits by sector
(annual growth rate in percent; contributions in percentage points; neither seasonally nor calendar effect adjusted)
30
25
20
15
10
5
0
-5
30
25
20
15
10
5
0
-52004 2005 2006
householdsnon-financial corporationsinsurance corporations and pension fundsother general governmentother non-monetary financial intermediarieslonger-term deposits
Note: MFI sector exclude the Eurosystem. Refer to the country of residence of the MFI.

24ECBOccasional Paper No 75October 2007
suggests that OFIs’ holdings of deposits with Belgian MFIs are used both for investment purposes and for transaction purposes.
To sum up, developments in Belgian OFIs’ deposit holdings refl ect a reduction in their share in OFIs’ total fi nancial assets, which in turn grew vigorously in recent years. The impact of OFIs on developments in total deposit holdings with Belgian MFIs is particularly important for the longer-term deposits that are not included in M3. For the short-term deposits included in M3, the impact has generally been limited until now, in the sense that excluding OFIs’ short-term deposit holdings from M3 would not change the pattern of the Belgian contribution to euro area M3 growth signifi cantly.
4.2.2 GERMANY
by J. Reischle (Deutsche Bundesbank)
The OFI sector in Germany is dominated by IFs (excluding money market funds). IFs deposits and repurchase agreements with German banks account for around three-quarters of all the German OFI sector’s deposits and repurchase
agreement transactions with domestic banks (see Chart 11). The fact that the residual category of other OFIs still accounts for almost one quarter of bank deposits and repurchase agreement transactions is mainly because this sub-sector also includes a big German securities trading house, the subsidiary of which – a distinguished German custodian – provides a trading and clearing platform for repurchase agreement transactions, which is used by some German banks for secure money market trading. Since the custodian has attracted a greater trading volume since the beginning of 2005, and because it acts as the central counterparty in such transactions, both domestic banks’ repurchase agreement transactions with and short-term bank loans to this OFI (see Chart 12) have increased markedly.
With regard to short-term deposits held by German OFIs with German domestic banks, overnight deposits account for the largest share, which, in June 2006, constituted about two-thirds of the short-term deposits and repurchase agreement transactions of German OFIs. The domestic OFI sector also holds short-term time
Chart 11 German OFIs’ holdings of deposits and repurchase agreements
(percentages, March 2006)
investment funds
remaining OFIs sub-sectors (including Deutsche Boerse, SDD, FCLs)
26.3 %
73.7 %
Source: Deutsche Bundesbank.
Chart 12 Breakdown of short-term deposits and repurchase agreements by instrument
(annual growth rate in percent; contributions in percentage points; neither seasonally nor calendar effect adjusted)
-15
0
15
30
45
-15
0
15
30
45
2004 2005 2006
repurchase agreementsdeposits redeemable up to 3 monthsdeposits with agreed mat. up to 2 yearsovernight depositsshort-term deposits and repurchase agreements
Note: MFI sector excludes the Eurosystem. Refer to the country of residence of the MFI.

25ECB
Occasional Paper No 75October 2007
4 A LOOK AT THE
COUNTRY LEVEL
deposits, but with a share of only 6%, these are relatively unimportant. Furthermore, from the beginning of 2005 onwards repurchase agreement transactions by German OFIs with domestic banks also played an important role. However, since these transactions are mainly money market transactions between banks, they do not involve a net infl ow of funds to the private non-banking sector. In addition to domestic OFIs’ deposit holdings, OFIs domiciled in other euro-area countries hold short-term deposits and carry out repo transactions. Compared with domestic OFIs’ holdings, however, foreign OFIs’ holdings are low.
As IFs are of paramount signifi cance for the OFI sector in Germany, the short-term deposits of this sub-sector (excluding repurchase agreement transactions) are likely to refl ect, in particular, its liquidity requirements. While the money holdings feed on the infl ow of capital from the sale of IF certifi cates, they are at the same time needed for the redemption of these fund certifi cates, which can occur at any time. According to the statistics concerning IFs in Germany, open-end real estate funds in Germany held 11% of their fund assets as bank deposits in June 2006. Standing at 5%, the corresponding share for securities-based funds was only half as large. This percentage matched the legal requirement exactly. Owing to their large fund assets, the domestic securities-based specialised funds accounted for the largest amount – €30 billion – of the bank deposits held by German IFs. Fund managers state that liquidity reserves are one of the most important risk management tools in investment activity. In addition to the increased performance pressure on German securities-based funds, the interest rate level and the situation on the fi nancial and real estate markets, in particular, are likely to infl uence the liquidity holdings of IFs.
As regards developments in longer-term deposits, it can be noted that domestic OFIs do not play a signifi cant role. The fact that long-term time deposits of German OFIs nevertheless contributed to the growth in all long-term bank deposits in Germany over the
last few months of the period under review is due to the fact that, after taking over a German bank, a fi nancial investor made a longer-term time deposit with the acquired bank via its German asset holding company. In return, the acquired bank extended a loan to the holding company. In contrast to the low level of long-term deposits of the domestic OFI sector, the approximate 4½% share of long-term time deposits held by OFIs resident in other euro area countries could be said to have a certain relevance. These deposits are mostly due to the fact that German banks issue securities through fi nancial subsidiaries domiciled in other euro area countries and arrange for the received funds to be transferred to them as long-term time deposits. From a longer-term perspective, however, the volume of funds received in this way markedly declined in the last few years of the period under review, probably as a result of banks’ reduced needs for long-term fi nance on account of their weak lending business.
When considering the deposits and repurchase agreement transactions of German OFIsacross the maturity spectrum, a marked increase in short-term deposits (including repurchase agreements) becomes evident. Overnight deposit holdings, short-term time and savings deposits as well as repurchase agreement transactions – which have only a short maturity – increased sharply from the beginning of 2003 onwards (by €40 billion, or 68%). The short-term deposit holdings of OFIs domiciled inother euro area countries also increased strongly(by €13 billion, or 184%). By contrast, long-term time and savings deposits of OFIs in the euro area fell by a quarter (or €13 billion) over the same period. In spite of the more pronounced short-term orientation of OFIs, their overall bank deposits ultimately expanded only a little more than the bank deposits of the other money-holding sectors. Consequently, the share of OFIs’ holdings increased only slightly, from 6% at the beginning of 2003 to 6.8% in June 2006.
All in all, the deposits held by euro area OFIs at banks in Germany are clearly dominated by IFs. This notwithstanding, owing to repurchase

26ECBOccasional Paper No 75October 2007
agreement transactions between a large German custodian and domestic credit institutions, the German OFI sector at times had a notable impact on the monetary dynamics in Germany, namely in 2005 and early 2006. However, on balance the OFI sector resident in Germany as well as in other euro area countries is virtually of no relevance to monetary developments in Germany. In spite of a somewhat stronger underlying trend, OFIs’ short-term bank deposits (with and without repurchase agreement transactions) are, for the most part, developing in parallel with the M3 deposits held by the euro area private sector with German MFIs, particularly households’ deposits.
4.2.3 IRELAND
by M. Cussen, D. Doran & R. Mottiar (Central Bank and Financial Services Authority of Ireland)
OFIs in Ireland have grown sharply over the last decade so that they now account for a substantial proportion of the fi nancial system. Estimates indicate that Irish OFIs’ balance sheet totals increased from around €360 billion in 2000 to around €870 billion in March 2006. OFIs themselves are a rather heterogeneous group of institutions which, in an Irish context, can be broken down into three broad types of entity:
1. IFs: Also referred to as collective investment schemes. At the end of 2005, there were approximately 3,890 funds in this sub-sector in Ireland, constituting approximately 47% of OFIs’ total holdings in Ireland in March 2006. A large proportion of the IFs are issued in non-euro currencies and a breakdown of their assets and liabilities indicates that they predominantly hold and issue securities and equity. These IFs are traded predominantly with the rest of the world and, as such, are largely vehicles enabling non-residents to invest and have little direct relationship with the domestic banking system.
2. Stand-alone treasuries: this OFI sub-sector includes three different vehicles for treasury operations; namely stand-alone treasury
companies, agency treasury centres and captive fi nance companies. In March 2006 this sub-sector accounted for approximately 16% of OFIs’ total holdings in Ireland. Similar to the IF sector, the international trading nature of these entities means that they have little direct relationship with the domestic banking system.
3. Miscellaneous international trading companies: this OFI sub-sector in Ireland is quite signifi cant and growing, accounting for approximately 37% of OFIs’ total holdings in March 2006. This sub-sector includes specialist debt/fi nancing entities that specialise in securitisation, as well as leasing companies, asset management companies, securities trading companies, and agency and captive treasury companies (see Chart 13).
The annual growth rate of short-term deposits and repurchase agreements in Ireland rose steadily from 2004 onwards, reaching approximately 30% by mid-2006 (see Chart 14). Much of this annual growth rate was attributable to the increased contribution of overnight deposits and, towards the end of the period under review, to
Chart 13 OFIs’ holdings by sector
(percentages, March 2006)
investment funds
standalone treasuries
miscellaneous international trading
16.3 %
37.1 %
46.6 %
Source: Central Bank and Financial Services Authority of Ireland.

27ECB
Occasional Paper No 75October 2007
4 A LOOK AT THE
COUNTRY LEVEL
the strengthening contribution of deposits with an agreed maturity of up to two years. However, the impact of the strong annual growth rate of short-term deposits was somewhat diluted by the negative growth rate of repurchase agreements from December 2005 onwards.
From 2004 onwards during the period under review, there was a strong increase in the annual growth rate of short-term deposits and repurchase agreements in Ireland. While the OFI sector experienced strong annual growth rates during this period, the household and non-fi nancial corporation sectors recorded similar growth rates (see Chart 15). Consequently, there was no signifi cant change in OFIs’ short-term deposit holdings and repurchase agreements as a percentage of total short-term deposits and repurchase agreements. While low interest rates and opportunity costs led the household and non-fi nancial corporation sectors to engage in portfolio shifts from longer-term and riskier investments to short-term deposits towards the end of the period, evidence suggests that the OFI sector did not necessarily engage in such
portfolio shifts. Generally, the growth in OFIs’ deposit holdings seems to be related to the growth in different asset classes.
The annual growth rate of longer-term deposits in Ireland declined from approximately 30% in January 2004 to approximately 15% by mid-2006 (see Chart 16). Much of this decline was the result of the declining annual growth rate of longer-term deposits made by households, whose contribution to annual growth in longer-term deposits fell from 17.8 percentage points to 5.7 percentage points during the same period. While the contribution of OFIs to longer-term deposit annual growth fl uctuated during the period, its trend contribution did not change signifi cantly. SPVs constitute a signifi cant proportion of the OFIs in Ireland. Quite a large number of euro area securitisation transactions, from mortgage-backed securities to collateralised debt obligations, are issued through SPVs in Ireland, with the result that the cash fl ow from securitisations to these entities is quite large and disproportionate to the level of activity in Ireland.
Chart 14 Breakdown of short-term deposits and repurchase agreements by instrument
(annual growth rate in percent; contributions in percentage points; neither seasonally nor calendar effect adjusted)
-15
0
15
30
45
-15
0
15
30
45
2004 2005 2006
repurchase agreementsdeposits redeemable up to 3 monthsdeposits with agreed mat. up to 2 yearsovernight depositsshort-term deposits and repurchase agreements
Note: MFI sector excludes the Eurosystem. Refer to the country of residence of the MFI.
Chart 15 Breakdown of short-term deposits and repurchase agreements by sector
(annual growth rate in percent; contributions in percentage points; neither seasonally nor calendar effect adjusted)
-5
0
5
10
15
20
-5
0
5
10
15
20
2004 2005 2006
householdsnon-financial corporationsinsurance corporations and pension fundsother general governmentother non-monetary financial intermediariesshort-term deposits and repurchase agreements
Note: MFI sector excludes the Eurosystem. Refer to the country of residence of the MFI.

28ECBOccasional Paper No 75October 2007
Looking across the maturity spectrum of OFIs’ deposit holdings included and excluded from M3, evidence suggests that the growth in these deposit holdings was the result of an increase in OFIs’ investment volume and not necessarily the result of OFIs shifting from longer-term and riskier assets to shorter-term investments. An analysis of OFIs’ deposit holdings by duration as a proportion of total deposit holdings indicates that OFIs’ deposit holdings in each duration, both those included in and excluded from M3, grew in similar proportions in relation to total deposit holdings. This indicates that OFIs apportioned funds across deposit categories in a uniform manner and did not increase the number of short-term deposits at the expense of longer-term deposits. OFIs in Ireland, in the aggregate, apportioned funds across deposit durations according to a pre-defi ned investment strategy, as no single deposit duration category became more important relative to total deposit holdings over the period. An analysis of the growth rates of OFIs’ different assets classes adds further support to this observation, as similar growth rates were experienced across asset
classes. This also suggests that OFIs did not switch from riskier assets to safer short-term deposits.
The Irish economy has expanded at substantial annual growth rates over the last decade. This rapid growth has been accompanied by a signifi cant increase in the size of both bank and non-bank intermediaries. While the main channel for intermediation remains the banks, which comprise large domestic credit institutions conducting business mainly with residents and other domestic banks, and branches and subsidiaries of foreign banks with mainly non-domestic business, non-bank intermediation is also an important channel through which funds are intermediated.
Within this category, OFIs have grown sharply in the last decade and now account for a substantial proportion of the fi nancial system in Ireland. A friendly and supportive economic environment, including favourable corporation tax rates, remains one of the key reasons for the establishment of a wide range of fi nancial services in Ireland.
4.2.4 FRANCE
by E. Fonteny & S. Frappa (Banque de France)
In France, the main OFI sub-sector is IFs, which make up 72.4% of the balance sheet of the OFI sector (i.e. €1,083 billion in June 2006). French IFs account for 20% of the total activity of euro area IFs. The second most important sub-sector includes SDDs (around 160 “investment fi rms”) and accounts for 23.1% of the total balance sheet OFIs (i.e. €346 billion). The third sub-sector refers to FCLs, which include specifi c institutions fi nancing social housing through contributions from fi rms (“Comités interprofessionnels du logement”) or motorways (“Caisse Nationale des Autoroutes”). These institutions account for 3% of OFIs’ total balance sheet. The last sub-sector consists of FVCs, which make up 1.4% of OFIs’ total balance sheet (see Chart 17).
Developments in OFIs’ short-term deposit holdings included in M3 refl ect strong growth in
Chart 16 Breakdown of longer-term deposits by sector
(annual growth rate in percent; contributions in percentage points; neither seasonally nor calendar effect adjusted)
-5
0
5
10
15
20
25
30
35
40
-5
0
5
10
15
20
25
30
35
40
2004 2005 2006
householdsnon-financial corporationsinsurance corporations and pension fundsother general governmentother non-monetary financial intermediarieslonger-term deposits
Note: MFI sector excludes the Eurosystem. Refer to the country of residence of the MFI.
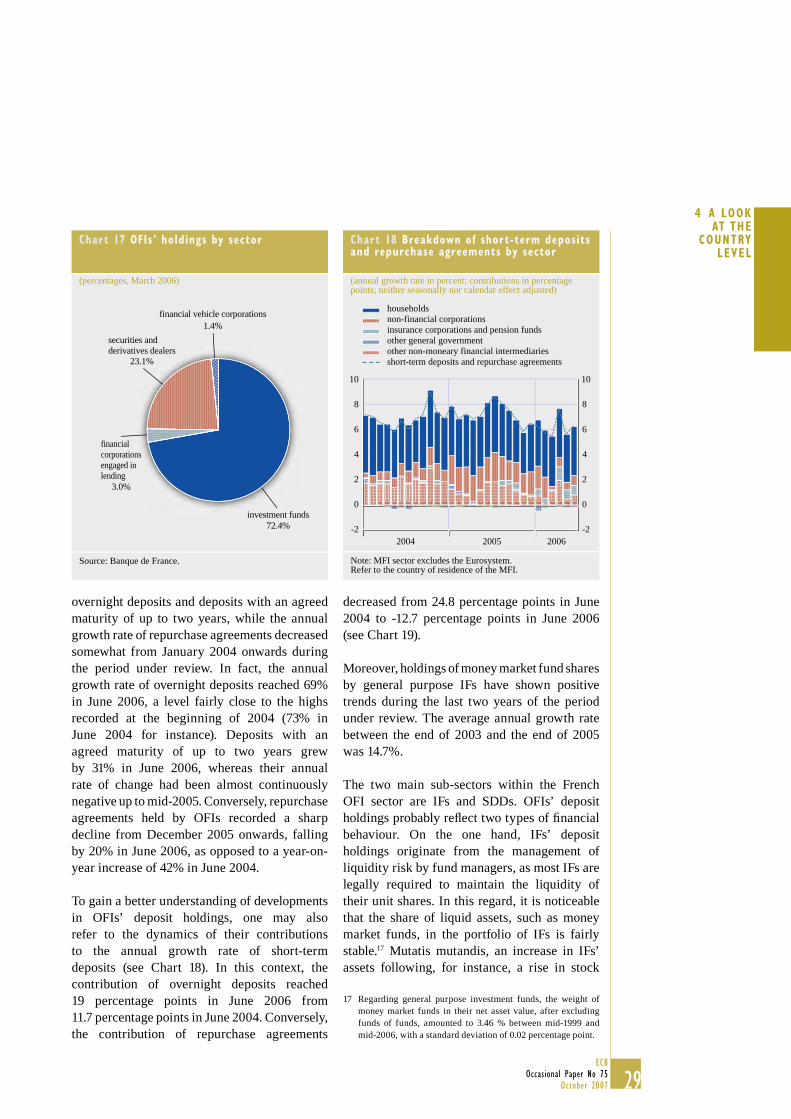
29ECB
Occasional Paper No 75October 2007
4 A LOOK AT THE
COUNTRY LEVEL
overnight deposits and deposits with an agreed maturity of up to two years, while the annual growth rate of repurchase agreements decreased somewhat from January 2004 onwards during the period under review. In fact, the annual growth rate of overnight deposits reached 69% in June 2006, a level fairly close to the highs recorded at the beginning of 2004 (73% inJune 2004 for instance). Deposits with an agreed maturity of up to two years grew by 31% in June 2006, whereas their annual rate of change had been almost continuously negative up to mid-2005. Conversely, repurchase agreements held by OFIs recorded a sharp decline from December 2005 onwards, falling by 20% in June 2006, as opposed to a year-on-year increase of 42% in June 2004.
To gain a better understanding of developments in OFIs’ deposit holdings, one may also refer to the dynamics of their contributions to the annual growth rate of short-term deposits (see Chart 18). In this context, the contribution of overnight deposits reached 19 percentage points in June 2006 from 11.7 percentage points in June 2004. Conversely, the contribution of repurchase agreements
decreased from 24.8 percentage points in June 2004 to -12.7 percentage points in June 2006 (see Chart 19).
Moreover, holdings of money market fund shares by general purpose IFs have shown positive trends during the last two years of the period under review. The average annual growth rate between the end of 2003 and the end of 2005was 14.7%.
The two main sub-sectors within the French OFI sector are IFs and SDDs. OFIs’ deposit holdings probably refl ect two types of fi nancial behaviour. On the one hand, IFs’ deposit holdings originate from the management of liquidity risk by fund managers, as most IFs are legally required to maintain the liquidity of their unit shares. In this regard, it is noticeable that the share of liquid assets, such as money market funds, in the portfolio of IFs is fairly stable.17 Mutatis mutandis, an increase in IFs’ assets following, for instance, a rise in stock
Regarding general purpose investment funds, the weight of 17 money market funds in their net asset value, after excluding funds of funds, amounted to 3.46 % between mid-1999 and mid-2006, with a standard deviation of 0.02 percentage point.
Chart 17 OFIs’ holdings by sector
(percentages, March 2006)
investment funds
financial corporationsengaged inlending
securities and derivatives dealers
financial vehicle corporations1.4%
72.4%
3.0%
23.1%
Source: Banque de France.
Chart 18 Breakdown of short-term deposits and repurchase agreements by sector
(annual growth rate in percent; contributions in percentage points; neither seasonally nor calendar effect adjusted)
-2
0
2
4
6
8
10
-2
0
2
4
6
8
10
2004 2005 2006
householdsnon-financial corporationsinsurance corporations and pension fundsother general governmentother non-moneary financial intermediariesshort-term deposits and repurchase agreements
Note: MFI sector excludes the Eurosystem. Refer to the country of residence of the MFI.
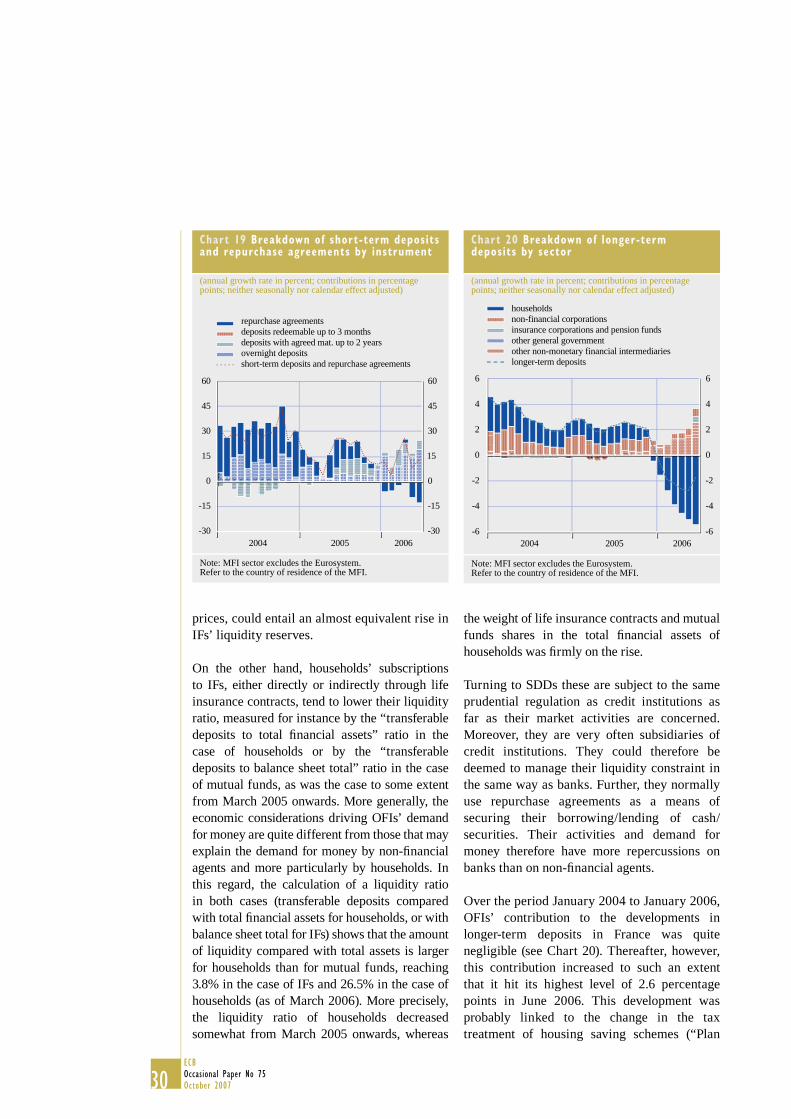
30ECBOccasional Paper No 75October 2007
prices, could entail an almost equivalent rise in IFs’ liquidity reserves.
On the other hand, households’ subscriptions to IFs, either directly or indirectly through life insurance contracts, tend to lower their liquidity ratio, measured for instance by the “transferable deposits to total fi nancial assets” ratio in the case of households or by the “transferable deposits to balance sheet total” ratio in the case of mutual funds, as was the case to some extent from March 2005 onwards. More generally, the economic considerations driving OFIs’ demand for money are quite different from those that may explain the demand for money by non-fi nancial agents and more particularly by households. In this regard, the calculation of a liquidity ratio in both cases (transferable deposits compared with total fi nancial assets for households, or with balance sheet total for IFs) shows that the amount of liquidity compared with total assets is larger for households than for mutual funds, reaching 3.8% in the case of IFs and 26.5% in the case of households (as of March 2006). More precisely, the liquidity ratio of households decreased somewhat from March 2005 onwards, whereas
the weight of life insurance contracts and mutual funds shares in the total fi nancial assets of households was fi rmly on the rise.
Turning to SDDs these are subject to the same prudential regulation as credit institutions as far as their market activities are concerned. Moreover, they are very often subsidiaries of credit institutions. They could therefore be deemed to manage their liquidity constraint in the same way as banks. Further, they normally use repurchase agreements as a means of securing their borrowing/lending of cash/securities. Their activities and demand for money therefore have more repercussions on banks than on non-fi nancial agents.
Over the period January 2004 to January 2006, OFIs’ contribution to the developments in longer-term deposits in France was quite negligible (see Chart 20). Thereafter, however, this contribution increased to such an extent that it hit its highest level of 2.6 percentage points in June 2006. This development was probably linked to the change in the tax treatment of housing saving schemes (“Plan
Chart 20 Breakdown of longer-term deposits by sector
(annual growth rate in percent; contributions in percentage points; neither seasonally nor calendar effect adjusted)
6
4
2
0
-2
-4
-6
6
4
2
0
-2
-4
-62004 2005 2006
householdsnon-financial corporationsinsurance corporations and pension fundsother general government other non-monetary financial intermediarieslonger-term deposits
Note: MFI sector excludes the Eurosystem. Refer to the country of residence of the MFI.
Chart 19 Breakdown of short-term deposits and repurchase agreements by instrument
(annual growth rate in percent; contributions in percentage points; neither seasonally nor calendar effect adjusted)
60
45
30
15
0
-15
-30
60
45
30
15
0
-15
-302004 2005 2006
repurchase agreementsdeposits redeemable up to 3 monthsdeposits with agreed mat. up to 2 yearsovernight depositsshort-term deposits and repurchase agreements
Note: MFI sector excludes the Eurosystem. Refer to the country of residence of the MFI.

31ECB
Occasional Paper No 75October 2007
4 A LOOK AT THE
COUNTRY LEVEL
d’Epargne Logement”) that came into force at the beginning of 2006. In response to this change, which reduced tax incentives on these schemes, households shifted part of their holdings from this instrument to life insurance contracts, money market funds or IFs. However, IFs could have reinvested this fl ow of new resources in longer-term deposits. The impact of securitisation on longer-term deposits remains negligible in France.
OFIs’ deposit holdings are mainly composed of short-term instruments included in M3 (80% in July 2006) but also, to a lesser extent, of long-term deposits (20% in July 2006). Repurchase agreements account for 52%, overnight deposits for 33% and deposits with an agreed maturity of less than two years for 15% of the total holdings of short-term deposits and repurchase agreements. This maturity distribution refl ects the behaviour of the two main sub-sectors previously mentioned: IFs, which favour short-term deposits for investment purposes but also to ensure the liquidity of their shares, and SDDs, which favour repurchase agreements.
Taken together, IFs in France developed steadily during the period under review. From September 2003, the annual growth rate of their aggregated balance sheet was continuously higher than 10%. These developments may have been linked to several tax and regulatory changes. For example, as mentioned before, the recent reduction in tax incentives on housing saving schemes induced, inter alia, a shift in savings from these schemes to mutual funds, which, in turn, may have partly reinvested this fl ow in short-term deposits and money market fund shares.
4.2.5 GREECE
by Th. Vlassopoulos (Bank of Greece)
In terms of holdings of liquid assets (cash, deposits, repurchase agreements and bank bonds) the OFI sector in Greece is dominated by IFs, which command more than two-thirds of the sector’s total holdings. Within this sub-sector, open-ended IFs are by far the largest
holders of liquid assets, while closed-end funds hold less than 3% of the sub-sector’s total holdings. SDDs are the second largest sub-sector, closely followed by the residual category of other OFIs, which, in the case of Greece, comprises almost exclusively FHCs. FCLs make a small contribution to OFIs’ total holdings of liquid assets, as their relationship with MFIs is refl ected mainly on the liabilities side of their balance sheets. There are no FVCs based in Greece (see Chart 21).
Repurchase agreements were the dominant instrument within OFIs’ holdings of short-term deposits and repurchase agreements at the start of the period under review, representing approximately 80% of the total in January 2004. However, this share declined as OFIs replaced their holdings of repurchase agreements with overnight deposits and deposits with an agreed maturity. This process was greatly expedited by the introduction, in January 2005, of a harmonised tax rate of 10% on the returns of deposits (previously 15%) and of repurchase agreements (previously 7%). Owing to this change, deposits with an agreed maturity of up to two years exhibited very high growth rates, as they attracted funds not only from
Chart 21 OFIs’ holdings by sector
(percentages, March 2006)
investment funds
financialcorporations
engagedin lending
securities andderivatives dealers
financial holdingcompanies other OFIs
financialvehicles
corporations
0.6 %
71.8 %
4.4 %
13.7 %
9.5 %
0.0 %
Source: Bank of Greece.Note: Holdings refer to cash, deposits, repurchase agreements and bank bonds of all maturities held by OFIs in Greece, with counterparts in the euro area.
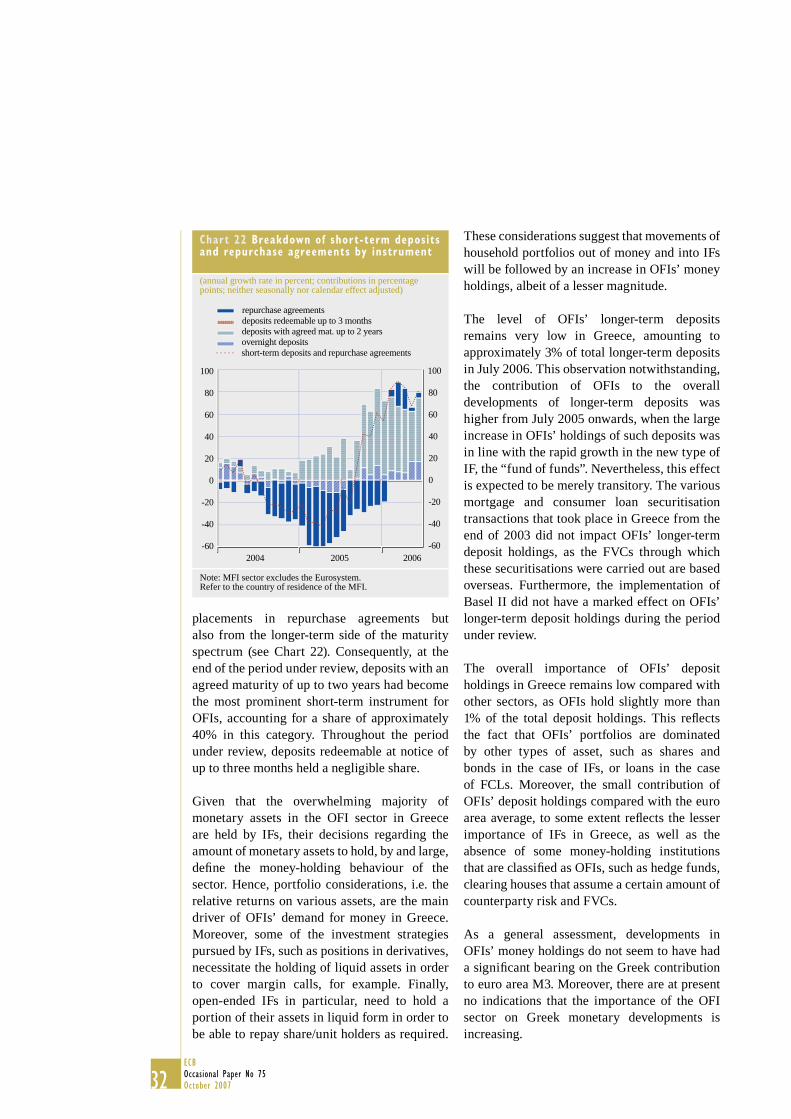
32ECBOccasional Paper No 75October 2007
placements in repurchase agreements but also from the longer-term side of the maturity spectrum (see Chart 22). Consequently, at the end of the period under review, deposits with an agreed maturity of up to two years had become the most prominent short-term instrument for OFIs, accounting for a share of approximately 40% in this category. Throughout the period under review, deposits redeemable at notice of up to three months held a negligible share.
Given that the overwhelming majority of monetary assets in the OFI sector in Greece are held by IFs, their decisions regarding the amount of monetary assets to hold, by and large, defi ne the money-holding behaviour of the sector. Hence, portfolio considerations, i.e. the relative returns on various assets, are the main driver of OFIs’ demand for money in Greece. Moreover, some of the investment strategies pursued by IFs, such as positions in derivatives, necessitate the holding of liquid assets in order to cover margin calls, for example. Finally, open-ended IFs in particular, need to hold a portion of their assets in liquid form in order to be able to repay share/unit holders as required.
These considerations suggest that movements of household portfolios out of money and into IFs will be followed by an increase in OFIs’ money holdings, albeit of a lesser magnitude.
The level of OFIs’ longer-term deposits remains very low in Greece, amounting to approximately 3% of total longer-term deposits in July 2006. This observation notwithstanding, the contribution of OFIs to the overall developments of longer-term deposits was higher from July 2005 onwards, when the large increase in OFIs’ holdings of such deposits was in line with the rapid growth in the new type of IF, the “fund of funds”. Nevertheless, this effect is expected to be merely transitory. The various mortgage and consumer loan securitisation transactions that took place in Greece from the end of 2003 did not impact OFIs’ longer-term deposit holdings, as the FVCs through which these securitisations were carried out are based overseas. Furthermore, the implementation of Basel II did not have a marked effect on OFIs’ longer-term deposit holdings during the period under review.
The overall importance of OFIs’ deposit holdings in Greece remains low compared with other sectors, as OFIs hold slightly more than 1% of the total deposit holdings. This refl ects the fact that OFIs’ portfolios are dominated by other types of asset, such as shares and bonds in the case of IFs, or loans in the case of FCLs. Moreover, the small contribution of OFIs’ deposit holdings compared with the euro area average, to some extent refl ects the lesser importance of IFs in Greece, as well as the absence of some money-holding institutions that are classifi ed as OFIs, such as hedge funds, clearing houses that assume a certain amount of counterparty risk and FVCs.
As a general assessment, developments in OFIs’ money holdings do not seem to have had a signifi cant bearing on the Greek contribution to euro area M3. Moreover, there are at present no indications that the importance of the OFI sector on Greek monetary developments is increasing.
Chart 22 Breakdown of short-term deposits and repurchase agreements by instrument
(annual growth rate in percent; contributions in percentage points; neither seasonally nor calendar effect adjusted)
repurchase agreementsdeposits redeemable up to 3 monthsdeposits with agreed mat. up to 2 yearsovernight depositsshort-term deposits and repurchase agreements
2004 2005 2006
100
80
60
40
20
0
-20
-40
-60
100
80
60
40
20
0
-20
-40
-60
Note: MFI sector excludes the Eurosystem. Refer to the country of residence of the MFI.

33ECB
Occasional Paper No 75October 2007
4 A LOOK AT THE
COUNTRY LEVEL
4.2.6 ITALY
by G. Ferrero & A. Nobili (Banca d'Italia)
In terms of total fi nancial asset holdings, IFs are by far the largest OFI sub-sector in Italy. Calculated from balance sheet data, open-ended IFs represented around 69% of all OFIs’ fi nancial asset holdings in March 2006. FCLs are the second largest sub-sector, representing around 31% of OFIs’ total fi nancial assets. SDDs, which refer to SIMs (Società d’intermediazione mobiliare) and the residual category of other OFIs accounted for only around 0.3% (see Chart 23). In terms of total deposit holdings, IFs constituted 96% of OFIs’ total holdings, the remaining 4% being held by SIMs. FCLs, on the other hand, made a negligible contribution to OFIs’ total liquid asset holdings, as their relationship with MFIs is mainly refl ected on the liabilities side of their balance sheet. There are no balance sheet data available for total deposits held by the residual category of other OFIs.
Between January 2004 and mid-2006 the patterns of OFIs’ short-term deposits and
repurchase agreements included in M3 were characterised by two different phases. They experienced a signifi cant contraction up to November 2004 and then accelerated considerably in the subsequent period (see Chart 24). The pattern over time of the implied annual growth rates was rather volatile. Among the different instruments, these developments mainly mirrored the pattern of the individual contribution of repurchase agreements to the overall growth rate of deposits, and, to a small extent, that of overnight deposits.
In Italy, OFIs hold money primarily for speculative purposes, as they distribute their total fi nancial assets among risky assets and liquidity. Consequently, their demand for money is largely driven by portfolio considerations and is expected to depend on the relative rates of return in the money, equity and bond markets and on real assets, as well as volatility in fi nancial markets. OFIs’ demand for money basically refl ects IFs’ money holdings, which manage long-term private savings. Higher money balances are usually held as a buffer to allow for unpredictable shifts in the fl ow of
Chart 24 Breakdown of short-term deposits and repurchase agreements by instrument
(annual growth rate in percent; contributions in percentage points; neither seasonally nor calendar effect adjusted)
0
2004 2005 2006
45
30
15
-15
-30
45
30
15
0
-15
-30
repurchase agreementsdeposits redeemable up to 3 monthsdeposits with agreed mat. up to 2 yearsovernight depositsshort-term deposits and repurchase agreements
Note: MFI sector excludes the Eurosystem. Refer to the country of residence of the MFI.
Chart 23 OFIs’ holdings by sector
(percentages, March 2006)
investment funds
financial corporations engaged in lending
securities and derivatives dealers other OFIs
68.6 %
30.7 %
0.3 % 0.3 %
Source: Banca d’Italia
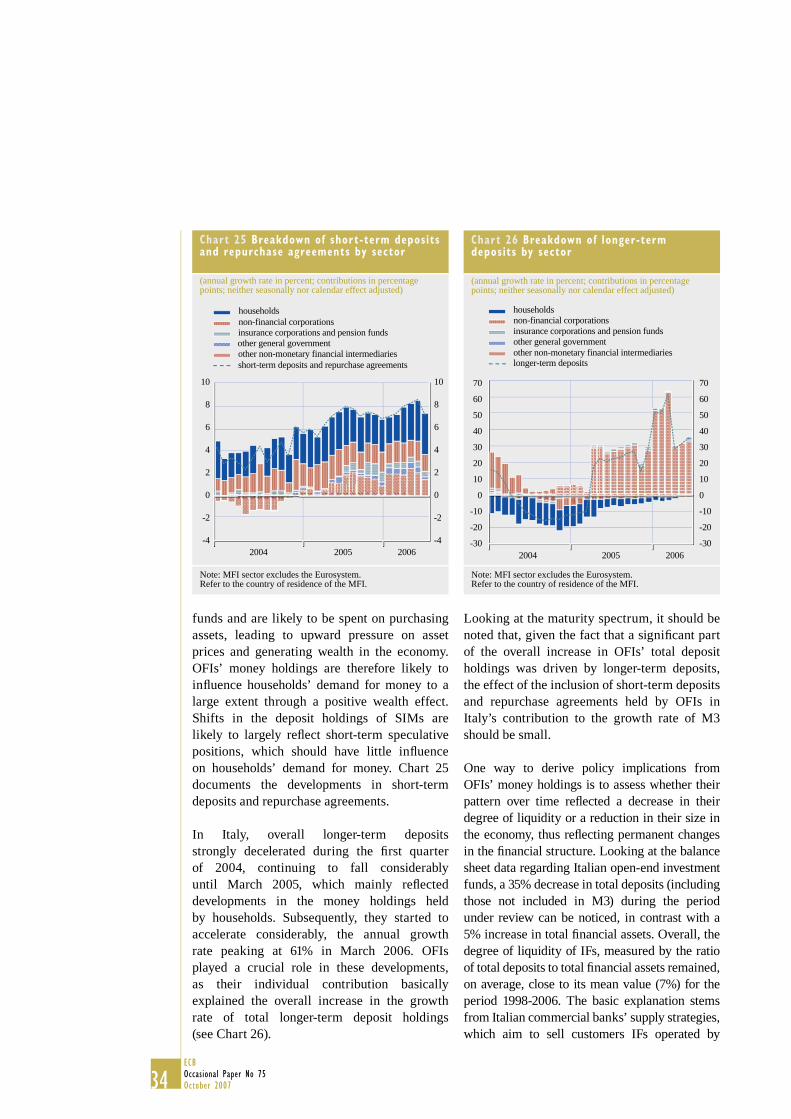
34ECBOccasional Paper No 75October 2007
funds and are likely to be spent on purchasing assets, leading to upward pressure on asset prices and generating wealth in the economy. OFIs’ money holdings are therefore likely to infl uence households’ demand for money to a large extent through a positive wealth effect. Shifts in the deposit holdings of SIMs are likely to largely refl ect short-term speculative positions, which should have little infl uence on households’ demand for money. Chart 25 documents the developments in short-term deposits and repurchase agreements.
In Italy, overall longer-term deposits strongly decelerated during the fi rst quarter of 2004, continuing to fall considerably until March 2005, which mainly refl ected developments in the money holdings held by households. Subsequently, they started to accelerate considerably, the annual growth rate peaking at 61% in March 2006. OFIs played a crucial role in these developments, as their individual contribution basically explained the overall increase in the growth rate of total longer-term deposit holdings (see Chart 26).
Looking at the maturity spectrum, it should be noted that, given the fact that a signifi cant part of the overall increase in OFIs’ total deposit holdings was driven by longer-term deposits, the effect of the inclusion of short-term deposits and repurchase agreements held by OFIs in Italy’s contribution to the growth rate of M3 should be small.
One way to derive policy implications from OFIs’ money holdings is to assess whether their pattern over time refl ected a decrease in their degree of liquidity or a reduction in their size in the economy, thus refl ecting permanent changes in the fi nancial structure. Looking at the balance sheet data regarding Italian open-end investment funds, a 35% decrease in total deposits (including those not included in M3) during the period under review can be noticed, in contrast with a 5% increase in total fi nancial assets. Overall, the degree of liquidity of IFs, measured by the ratio of total deposits to total fi nancial assets remained, on average, close to its mean value (7%) for the period 1998-2006. The basic explanation stems from Italian commercial banks’ supply strategies, which aim to sell customers IFs operated by
Chart 26 Breakdown of longer-term deposits by sector
(annual growth rate in percent; contributions in percentage points; neither seasonally nor calendar effect adjusted)
70
60
50
40
30
20
10
0
-10
-20
-30
70
60
50
40
30
20
10
0
-10
-20
-302004 2005 2006
householdsnon-financial corporationsinsurance corporations and pension fundsother general governmentother non-monetary financial intermediarieslonger-term deposits
Note: MFI sector excludes the Eurosystem. Refer to the country of residence of the MFI.
Chart 25 Breakdown of short-term deposits and repurchase agreements by sector
(annual growth rate in percent; contributions in percentage points; neither seasonally nor calendar effect adjusted)
10
8
6
4
2
0
-2
-4
10
8
6
4
2
0
-2
-42004 2005 2006
householdsnon-financial corporationsinsurance corporations and pension fundsother general governmentother non-monetary financial intermediariesshort-term deposits and repurchase agreements
Note: MFI sector excludes the Eurosystem. Refer to the country of residence of the MFI.
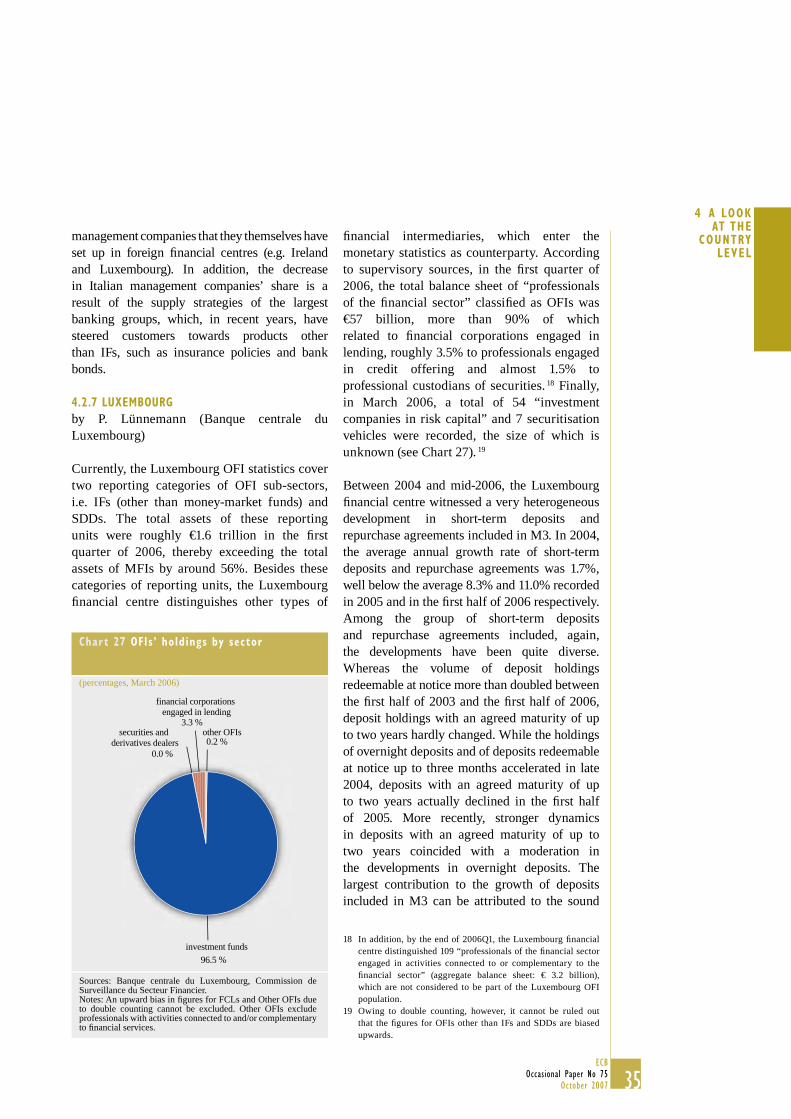
35ECB
Occasional Paper No 75October 2007
4 A LOOK AT THE
COUNTRY LEVEL
management companies that they themselves have set up in foreign fi nancial centres (e.g. Ireland and Luxembourg). In addition, the decrease in Italian management companies’ share is a result of the supply strategies of the largest banking groups, which, in recent years, have steered customers towards products other than IFs, such as insurance policies and bank bonds.
4.2.7 LUXEMBOURG
by P. Lünnemann (Banque centrale du Luxembourg)
Currently, the Luxembourg OFI statistics cover two reporting categories of OFI sub-sectors, i.e. IFs (other than money-market funds) and SDDs. The total assets of these reporting units were roughly €1.6 trillion in the fi rst quarter of 2006, thereby exceeding the total assets of MFIs by around 56%. Besides these categories of reporting units, the Luxembourg fi nancial centre distinguishes other types of
fi nancial intermediaries, which enter the monetary statistics as counterparty. According to supervisory sources, in the fi rst quarter of 2006, the total balance sheet of “professionals of the fi nancial sector” classifi ed as OFIs was €57 billion, more than 90% of which related to fi nancial corporations engaged in lending, roughly 3.5% to professionals engaged in credit offering and almost 1.5% to professional custodians of securities. 18 Finally, in March 2006, a total of 54 “investment companies in risk capital” and 7 securitisation vehicles were recorded, the size of which is unknown (see Chart 27). 19
Between 2004 and mid-2006, the Luxembourg fi nancial centre witnessed a very heterogeneous development in short-term deposits and repurchase agreements included in M3. In 2004, the average annual growth rate of short-term deposits and repurchase agreements was 1.7%, well below the average 8.3% and 11.0% recorded in 2005 and in the fi rst half of 2006 respectively. Among the group of short-term deposits and repurchase agreements included, again,the developments have been quite diverse. Whereas the volume of deposit holdings redeemable at notice more than doubled between the fi rst half of 2003 and the fi rst half of 2006, deposit holdings with an agreed maturity of up to two years hardly changed. While the holdings of overnight deposits and of deposits redeemable at notice up to three months accelerated in late 2004, deposits with an agreed maturity of up to two years actually declined in the fi rst half of 2005. More recently, stronger dynamics in deposits with an agreed maturity of up to two years coincided with a moderation in the developments in overnight deposits. The largest contribution to the growth of deposits included in M3 can be attributed to the sound
In addition, by the end of 2006Q1, the Luxembourg fi nancial 18 centre distinguished 109 “professionals of the fi nancial sector engaged in activities connected to or complementary to the fi nancial sector” (aggregate balance sheet: € 3.2 billion), which are not considered to be part of the Luxembourg OFI population.Owing to double counting, however, it cannot be ruled out 19 that the fi gures for OFIs other than IFs and SDDs are biased upwards.
Chart 27 OFIs’ holdings by sector
(percentages, March 2006)
investment funds
securities and derivatives dealers
financial corporations engaged in lending
other OFIs0.2 %
96.5 %
0.0 %
3.3 %
Sources: Banque centrale du Luxembourg, Commission de Surveillance du Secteur Financier.Notes: An upward bias in fi gures for FCLs and Other OFIs due to double counting cannot be excluded. Other OFIs exclude professionals with activities connected to and/or complementary to fi nancial services.

36ECBOccasional Paper No 75October 2007
growth in overnight deposits in both 2004 and 2005; this is compounded by the signifi cant share of overnight deposits in overall short-term deposits and repurchase agreements. In total, overnight deposits contributed approximately 10 percentage points to the cumulated growth of deposits included in M3 recorded between 2003 and mid-2006 (approximately 15%). deposits redeemable at notice up to three months and deposits with an agreed maturity of up to one year contributed another cumulated 3.6 and 1.5 percentage points, respectively. Deposits with an agreed maturity of between one and two years and repurchase agreements, by contrast, hardly affected the dynamics in short-term deposits and repurchase agreements (roughly 0.1 percentage points cumulated).
Contrary to the situation at the euro area level, where OFIs account for just over 10% of total short-term deposits and repurchase agreements, in Luxembourg they account for almost 50% of the deposits in M3. Similar to the euro area, OFI holdings contributed substantially to the cumulated growth in short-term deposits and repurchase agreements included in M3 recorded over the three and a half years of the period under review. In general, the OFI holdings reveal a very limited correlation with the traditional money-holding sectors. The reasons for this may be manifold: fi rst, OFI money holdings may depend on fundamentals other than determinants of money-holding behaviour among households and non-fi nancial corporations, even though common money demand determinants may extend to OFIs. For example, similar to non-fi nancial corporations, the rising interest rate expectations mighthave increased OFIs’ demand for time deposits. However, narrative evidence suggests that OFIs are responsive to differences in national legislation. Anecdotal evidence suggests that the explanatory variables of OFI money demand may relate to group-specifi c cash management activities and treasury management operations not necessarily linked to the fundamentals of the Luxembourg and/or the European economy. This is of particular importance for Luxembourg considering that a large share of deposits is not actually held by domestic residents. Moreover,
OFI money demand is generally considered to be driven by portfolio considerations and the money-holding behaviour of OFIs is more volatile than the money-holding behaviour of households. By contrast, OFI behaviour is not necessarily more volatile than that of non-fi nancial corporations, insurance companies and pension funds. Contrary to other money-holding sectors, OFIs tend to invest relatively more in assets denominated in currencies other than the euro (e.g. in the case of overnight deposits, roughly 40% for OFIs against less than 10% for private households). Differences across money-holding sectors not only apply to the share of non-euro deposits, but also to the developments therein, which might suggest a more important role as regards international developments, exchange rates, etc. for OFIs. Second, whereas some of the determinants of money holding may be identical, OFIs may react to changes in determinants in a way different from households and non-fi nancial corporations. Third, the OFI sector is still expanding, more so than other private money-holding sectors. Moreover, banks might have outsourced activities (e.g. trading) to their group-specifi c investment fi rm. Whereas from June 2003 to June 2006 the total assets of Luxembourg MFIs increased by less than 25%, the total assets of OFIs more than doubled. Fourth, OFI money demand behaviour itself may have been subject to changes. The fact that the share of short-term deposits and repurchase agreements to total assets diminished by roughly one third over the last three years of the period under review might indicate a change in OFI money demand. A distinction between money demand by residents on the one hand and money demand from other euro area Member States can only attenuate the divergences observed. To sum up, the determinants of OFI money-holding behaviour in Luxembourg are less clear than for traditional money holding sectors. Moreover, contrary to the case of private households, restricting the analysis to OFIs resident in Luxembourg is unlikely to provide a strong link between money demand and the fundamentals of the national economy, as “domestic” OFIs’ clients are only partly domestic, they mainly reside abroad.

37ECB
Occasional Paper No 75October 2007
4 A LOOK AT THE
COUNTRY LEVEL
OFIs have been the single most important driver for the growth in longer-term deposits. More recently, however, growth has been drivenby non-fi nancial corporations while the contribution to growth from OFIs has declined somewhat and even turned slightly negative in June 2006. The dynamic expansion of longer-term OFI deposits (before the recent slowdown) relative to other money-holding sectors entailed a major sectoral reallocation: in early 2003, OFIs held just over 10% of total longer-term deposits; by mid-2006, this share reached over 50%. On the basis of currently available data, it is impossible to conclude whether this is linked to a rise in securitisation activity. Although the new law of March 2004 establishes a legal framework for securitisation vehicles, there is no published data on the volume of securitisation activity in Luxembourg. Even if there were data on the business activity of the 12 securitisation vehicles registered under the new law by the end of February 2007, it would still not be possible to give an unbiased account of securitisation activity as there could potentially be a large number of unregistered FVCs. 20
Total deposits held by OFIs have increased across virtually the entire maturity spectrum since 2003; however, there are considerable variations across instruments. In particular, although short-term deposits including repurchase agreements held by OFIs have increased signifi cantly, longer-term deposits not included in M3 have risen exponentially in comparison. The dynamic expansion in longer-term deposits is almost entirely attributable to a steep rise in deposits with an agreed maturity of over two years, as OFI holdings of deposits redeemable at notice over three months are virtually non-existent in comparison. As for the evolution of short-term deposits, OFI holdings remain largely concentrated in overnight deposits, which now make up almost half of all short-term deposits held by OFIs, as well as in deposits with an agreed maturity of up to two years. Repurchase agreements held by OFIs remain insignifi cant compared with other short-term instruments.
4.2.8 NETHERLANDS
by M. Hendrikx & M. de Jong (De Nederlandsche Bank)
In the Netherlands, FCLs represent the largest OFI sub-sector. Rough approximations indicate that about half of OFIs’ deposits and three-quarters of the loans to OFIs made by MFIs are held by FCLs. This sub-sector is a mixture of fi nancing corporations, mail-order fi rms that extend consumer credit, public credit institutions, real estate fi nancing funds and development agencies. Around a third of OFIs’ deposits with MFIs are held by SPVs, mainly related to the rapid increase in the securitisation of bank loans. IFs are a relatively small sub-sector in the Netherlands. This is a result of large pension savings, which reduces the demand for IFs. Around 18% could not be classifi ed(see Chart 28).
From mid-2005 onwards, OFIs’ short-term deposits contributed substantially (approximately
It is not possible to tackle this issue using information reported 20 under Regulation ECB/2001/13 as MFIs are not required to indicate whether or not the loans on their balance sheets have been securitised.
Chart 28 OFIs’ holdings by sector
(percentages, end 2003)
investment funds
financial corporations engaged in lending
securities and derivatives dealers
financial holding companies
financial vehicle corporations
other OFIs
49.0 %
30.0 %
18.0 %
2.0 %
1.0 %
0.0 %
Sources: De Nederlandsche Bank, CBS, anecdotal information.

38ECBOccasional Paper No 75October 2007
six percentage points, i.e. around half of the total growth rate of the Dutch contribution to M3) to the annual growth rate of total short-term deposits and repurchase agreements in the Netherlands (see Chart 29).
The largest part of the growth in OFIs’ holdings – around 90% – stems from deposits with an agreed maturity of up to two years (see Chart 30), with overnight deposits being responsible for the remaining 10%. The contribution of repurchase agreements and deposits redeemable up to three months to the growth rate of OFIs’ short-term deposits and repurchase agreements is negligible. OFIs’ deposit holdings with an agreed maturity of up to two years partly represent collateral for synthetic securitisations that is deposited at the securitising MFI.
As regards the factors driving OFIs’ demand for money, FCLs’ demand for money is likely to be related to lending and borrowing developments in the private sector, and is thus connected to the business cycle. In addition, FCLs’ demand
for money may refl ect fi nancial innovation in the Netherlands, which has stimulated the growth of the fi nancial services sector.
Turning to SPVs, the demand for money seems to be driven primarily by synthetic securitisations. SPVs usually hold short-term deposits as collateral for the asset-backed securities that are issued to fi nance synthetic securitisations. The growth rate of OFIs’ short-term deposit holdings is therefore affected by synthetic securitisations undertaken by MFIs. In the Netherlands, a number of factors contributed to the strong growth in securitisation in recent years. First, the volume of outstanding mortgages grew rapidly over the last decade, in part owing to the strong housing market developments. Second, the Dutch banking sector is characterised by a few large banks that can securitise large pools of loans at once, thus allowing banks to perform securitisations in a cost-effective way. Third, the new regulation that was introduced in 2004 facilitated securitisation growth, as banks are no longer required to inform debtors about the securitisation of the loan (so-called
Chart 30 Breakdown of short-term deposits and repurchase agreements by instrument
(annual growth rate in percent; contributions in percentage points; neither seasonally nor calendar effect adjusted)
75
60
45
30
15
0
-15
-30
75
60
45
30
15
0
-15
-30
2004 2005 2006
repurchase agreementsdeposits redeemable up to 3 monthsdeposits with agreed mat. up to 2 yearsovernight depositsshort-term deposits and repurchase agreements
Note: MFI sector excludes the Eurosystem. Refer to the country of residence of the MFI.
Chart 29 Breakdown of short-term deposits and repurchase agreements by sector
(annual growth rate in percent; contributions in percentage points; neither seasonally nor calendar effect adjusted)
16
14
12
10
8
6
4
2
0
-2
-4
-6
2004 2005 2006
householdsnon-financial corporationsinsurance corporations and pension fundsother general governmentother non-monetary financial intermediariesshort-term deposits and repurchase agreements
16
14
12
10
8
6
4
2
0
-2
-4
-6
Note: MFI sector excludes the Eurosystem. Refer to the country of residence of the MFI.
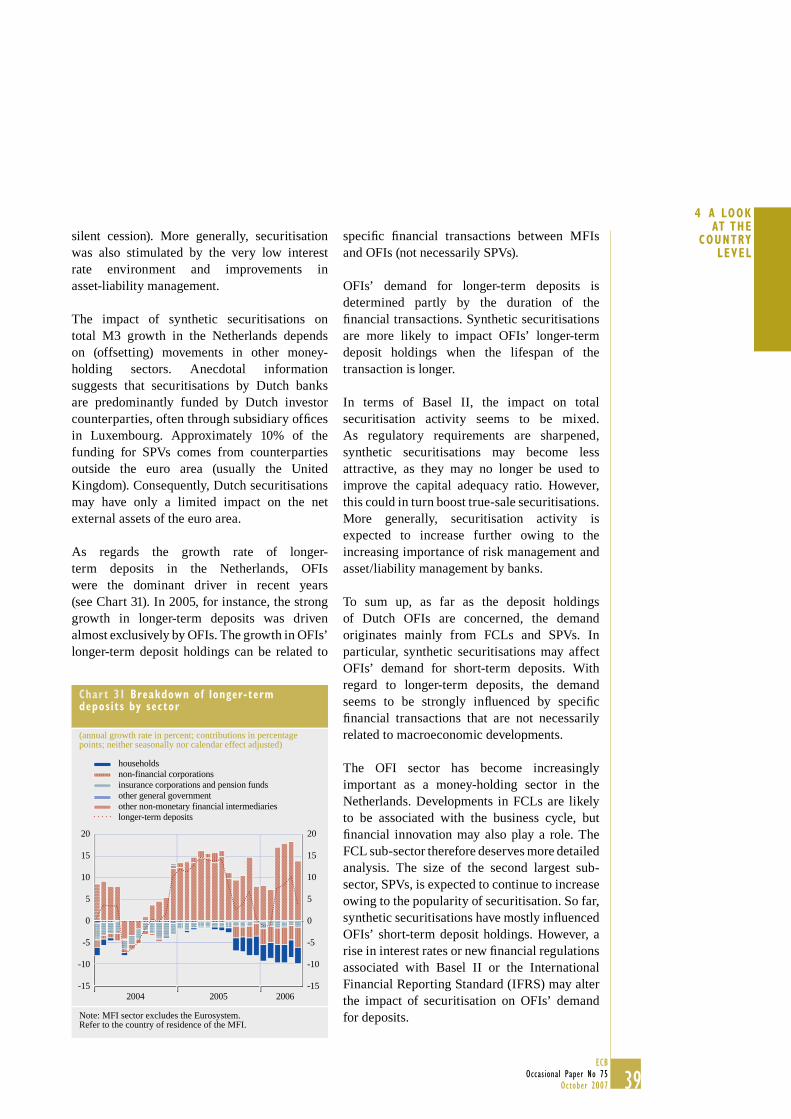
39ECB
Occasional Paper No 75October 2007
4 A LOOK AT THE
COUNTRY LEVEL
silent cession). More generally, securitisation was also stimulated by the very low interest rate environment and improvements in asset-liability management.
The impact of synthetic securitisations on total M3 growth in the Netherlands depends on (offsetting) movements in other money-holding sectors. Anecdotal information suggests that securitisations by Dutch banks are predominantly funded by Dutch investor counterparties, often through subsidiary offi ces in Luxembourg. Approximately 10% of the funding for SPVs comes from counterparties outside the euro area (usually the United Kingdom). Consequently, Dutch securitisations may have only a limited impact on the net external assets of the euro area.
As regards the growth rate of longer-term deposits in the Netherlands, OFIs were the dominant driver in recent years (see Chart 31). In 2005, for instance, the strong growth in longer-term deposits was driven almost exclusively by OFIs. The growth in OFIs’ longer-term deposit holdings can be related to
specifi c fi nancial transactions between MFIs and OFIs (not necessarily SPVs).
OFIs’ demand for longer-term deposits is determined partly by the duration of the fi nancial transactions. Synthetic securitisations are more likely to impact OFIs’ longer-term deposit holdings when the lifespan of the transaction is longer.
In terms of Basel II, the impact on total securitisation activity seems to be mixed. As regulatory requirements are sharpened, synthetic securitisations may become less attractive, as they may no longer be used to improve the capital adequacy ratio. However, this could in turn boost true-sale securitisations. More generally, securitisation activity is expected to increase further owing to the increasing importance of risk management and asset/liability management by banks.
To sum up, as far as the deposit holdings of Dutch OFIs are concerned, the demand originates mainly from FCLs and SPVs. In particular, synthetic securitisations may affect OFIs’ demand for short-term deposits. With regard to longer-term deposits, the demand seems to be strongly infl uenced by specifi c fi nancial transactions that are not necessarily related to macroeconomic developments.
The OFI sector has become increasingly important as a money-holding sector in the Netherlands. Developments in FCLs are likely to be associated with the business cycle, but fi nancial innovation may also play a role. The FCL sub-sector therefore deserves more detailed analysis. The size of the second largest sub-sector, SPVs, is expected to continue to increase owing to the popularity of securitisation. So far, synthetic securitisations have mostly infl uenced OFIs’ short-term deposit holdings. However, a rise in interest rates or new fi nancial regulations associated with Basel II or the International Financial Reporting Standard (IFRS) may alter the impact of securitisation on OFIs’ demand for deposits.
Chart 31 Breakdown of longer-term deposits by sector
(annual growth rate in percent; contributions in percentage points; neither seasonally nor calendar effect adjusted)
-15
-10
-5
10
15
20
-15
-10
-5
0
5
10
15
20
2004 2005 2006
0
5
householdsnon-financial corporationsinsurance corporations and pension fundsother general governmentother non-monetary financial intermediarieslonger-term deposits
Note: MFI sector excludes the Eurosystem. Refer to the country of residence of the MFI.
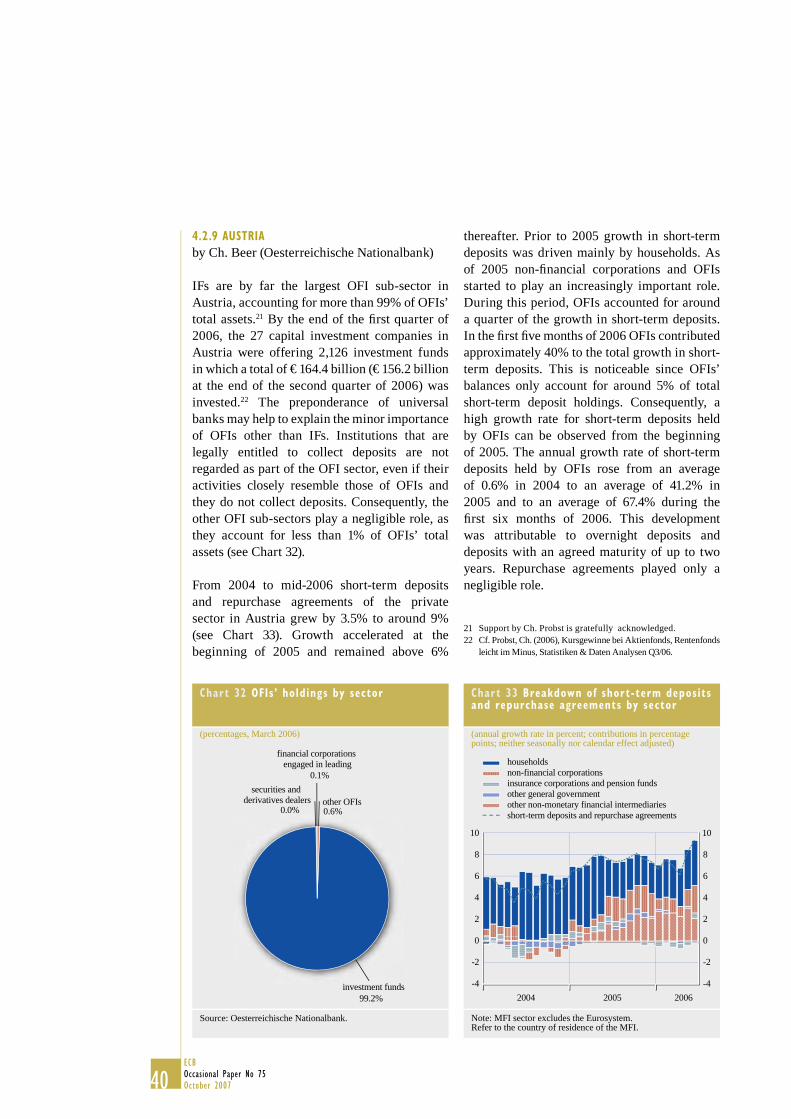
40ECBOccasional Paper No 75October 2007
4.2.9 AUSTRIA
by Ch. Beer (Oesterreichische Nationalbank)
IFs are by far the largest OFI sub-sector in Austria, accounting for more than 99% of OFIs’ total assets.21 By the end of the fi rst quarter of 2006, the 27 capital investment companies in Austria were offering 2,126 investment funds in which a total of € 164.4 billion (€ 156.2 billion at the end of the second quarter of 2006) was invested.22 The preponderance of universal banks may help to explain the minor importance of OFIs other than IFs. Institutions that are legally entitled to collect deposits are not regarded as part of the OFI sector, even if their activities closely resemble those of OFIs and they do not collect deposits. Consequently, the other OFI sub-sectors play a negligible role, as they account for less than 1% of OFIs’ total assets (see Chart 32).
From 2004 to mid-2006 short-term deposits and repurchase agreements of the private sector in Austria grew by 3.5% to around 9%(see Chart 33). Growth accelerated at the beginning of 2005 and remained above 6%
thereafter. Prior to 2005 growth in short-term deposits was driven mainly by households. As of 2005 non-fi nancial corporations and OFIs started to play an increasingly important role. During this period, OFIs accounted for around a quarter of the growth in short-term deposits. In the fi rst fi ve months of 2006 OFIs contributed approximately 40% to the total growth in short-term deposits. This is noticeable since OFIs’ balances only account for around 5% of total short-term deposit holdings. Consequently, a high growth rate for short-term deposits held by OFIs can be observed from the beginning of 2005. The annual growth rate of short-term deposits held by OFIs rose from an average of 0.6% in 2004 to an average of 41.2% in 2005 and to an average of 67.4% during the fi rst six months of 2006. This development was attributable to overnight deposits and deposits with an agreed maturity of up to two years. Repurchase agreements played only a negligible role.
Support by Ch. Probst is gratefully acknowledged.21 Cf. Probst, Ch. (2006), Kursgewinne bei Aktienfonds, Rentenfonds 22 leicht im Minus, Statistiken & Daten Analysen Q3/06.
Chart 33 Breakdown of short-term deposits and repurchase agreements by sector
(annual growth rate in percent; contributions in percentage points; neither seasonally nor calendar effect adjusted)
-4
-2
0
2
4
6
8
10
-4
-2
0
2
4
6
8
10
20062004 2005
householdsnon-financial corporationsinsurance corporations and pension fundsother general governmentother non-monetary financial intermediariesshort-term deposits and repurchase agreements
Note: MFI sector excludes the Eurosystem. Refer to the country of residence of the MFI.
Chart 32 OFIs’ holdings by sector
(percentages, March 2006)
investment funds
financial corporations engaged in leading
securities and derivatives dealers other OFIs
99.2%
0.6%
0.1%
0.0%
Source: Oesterreichische Nationalbank.

41ECB
Occasional Paper No 75October 2007
4 A LOOK AT THE
COUNTRY LEVEL
IFs are the main OFI sub-sector. Consequently, the economic considerations that drive OFIs’ demand for money are mainly those that drive IFs’ demand for money (i.e. portfolio considerations). A trend towards asset accumulation through IFs by households can be observed. Hence, the scale at which IFs operate has increased. This development also has an impact on OFIs’ demand for money.
OFIs’ long-term deposits account only for a negligible fraction of total long-term deposits of the private sector. The annual growth rate of long-term deposits in Austria was around 2% during most of 2005. It dropped at the beginning of 2006 and even became negative in the second quarter of 2006. In Austria, the growth rate of long-term deposits was therefore relatively modest compared with that of other countries. The contribution of OFIs to the growth rate of long-term deposits was relatively high given their small share of outstanding amounts. However, other fi nancial intermediaries were not the driving force behind the growth in long-term deposits. The decline in the growth rate of long-term deposits in 2006 was mainly attributable to households, but OFIs also contributed to the decline. On the other hand, ICPFs were the main sector with a positive impact on the growth rate of long-term deposits. Basel II and securitisation did not have any major impact on the behaviour of OFIs with regard to long-term deposits. Securitisation is – at least currently – not very widespread in Austria.
To sum up, OFIs’ deposit holdings to a large extent constitute short-term deposits. Taken together with the importance of IFs, this may suggest that OFIs’ deposit holdings primarily make up IFs’ short-term liquidity. IFs hold only a relatively minor share of their assets as deposits (4.6%), the larger part of their holdings being securities other than shares (54%), holdings of shares/other equity (16%), and holdings of IF shares (23.4%).
4.2.10 PORTUGAL
by D. Bonfi m (Banco de Portugal)
The Portuguese OFI sector has grown considerably over the last few years. This part of the fi nancial sector is composed mainly of IFs (excluding money market funds), FVCs, FHCs and FCLs.
As can be seen from Chart 34, IFs account for the largest part of OFIs’ total assets (31.4% in June 2006). Assets held by IFs grew over the last few years of the period under review. In fact, amid persistent negative real rates of return on time deposits, households (and other investors) channelled a signifi cant share of their fi nancial investments into life insurance and IFs. However, as regards IFs’ holdings of deposits and other similar investments, there was some decrease over the two and a half years up to June 2006, which may also have been caused by the relatively low returns on this type of investment.
Over the period under review, some new fi nancial intermediaries recorded strong growth rates. Among these, securitisation funds and FCLs showed the more remarkable developments. Strong credit growth, accompanied by a moderate growth in deposits, led to an increased diversifi cation of the banking system’s funding sources, among which loan securitisation played an important role. Against this background, assets held by resident securitisation funds recorded remarkable growth rates. Moreover, credit fi nancial institutions are a new type of fi nancial intermediary, which simultaneously carry out most lending activities, such as factoring, leasing or credit-purchase fi nancing (the latter typically indirectly fi nance the purchase of specifi c goods and services by offering credit at retailers’ outlets). These institutions are included in the FCL sub-sector in Chart 34.
As far as monetary developments are concerned, the growth rate of the Portuguese contribution to euro area M3 increased at a lower pace than that of aggregate euro area M3 (3.9 percentage

42ECBOccasional Paper No 75October 2007
points in Portugal between December 2003 and June 2006 compared with 7.5% in the euro area, using annualised growth rates). Short-term deposits (deposits and deposit-like instruments up to two years and deposits redeemable at notice) and repurchase agreements increased by 3.1 percentage points during this period, which was slightly below the 3.4% growth rate recorded at the euro area level (annualised growth rates). Short-term deposits held by non-fi nancial corporations were one of the main contributors to this evolution. The contribution of other non-monetary fi nancial intermediaries increased somewhat from early 2005 onward, although it remained at a fairly low level.
As regards the maturity structure of M3, the share of total short-term deposits in total deposits held by residents in Portugal decreased slightly during the period under review, from 97% to 90%. This notwithstanding, OFIs’ short-term deposit holdings recorded a strong increase between December 2003 and June 2006 (17.0% on an annual basis). It should be noted, however, that the share of OFIs’ short-term deposit holdings in total short-term
deposits was only 5.0% in June 2006 (compared with 3.6% at the end of 2003) and therefore made a very modest contribution to M3.
To a large extent, the increase observed in Portuguese OFIs’ deposit holdings is likely to have stemmed from the buoyancy of their activity. IFs’ total deposits decreased over the period under review, meaning that the main contribution to the growth in OFIs’ short-term deposit holdings is most likely to have been caused by the growth observed in deposits held by OFIs other than IFs. Nevertheless, there is no information on the maturity structure of deposits held by each type of OFI, thus limiting the conclusions that can be drawn in this area. The available information suggests that the main contributions to the total growth rate of deposits held by OFIs are likely to be associated with deposits of FHCs.
Even though OFIs’ short-term deposit holdings accounted for only 5% of total short-term deposits in June 2006, its long-term deposit holdings represented 63% of total deposits with a maturity of over two years (compared with 5.6% in December 2003). Between the end of 2003 and June 2006, these long-term deposit holdings of OFIs recorded an extraordinary increase of 331.6% in annualised rates, implying a fl ow of new deposits of roughly €9 billion. Nevertheless, they did not affect the evolution of M3.
This remarkable increase refl ects accounting changes resulting from the implementation of IAS/IFRS in early 2005. The new accounting framework introduced stricter criteria for the full removal of securitised assets from banks’ balance sheets. In the Money and Banking Statistics, securitised credit, which is not derecognised, continues to be recorded in banks’ loan book. However, the liquidity received by MFI’s from SPVs under the securitisation operation adds to banks’ cash holdings, hence generating a double record in banks’ assets. To offset this duplication, the counterpart of the liquidity received from SPVs under the securitisation operation is classifi ed as deposits (and deposit-like instruments) of OFIs. However, it should be stressed that these deposits are merely a statistical
Chart 34 OFIs’ holdings by sector
(percentages, June 2006)
investment funds
financial corporation engaged in lendingsecurities and
derivatives dealers
financial holding companies
financial vehicle corporations
other OFIs
27.0%
2.3%
31.4%
15.7%
0.1%
23.5%
Source: Banco de Portugal.Note: The pie chart refers to June 2006 given that FHCs’ data is available only on a semi-annual basis.

43ECB
Occasional Paper No 75October 2007
4 A LOOK AT THE
COUNTRY LEVEL
counterpart. In June 2006, 99% of OFIs’ long-term deposits referred to securitisation operations that were not derecognised.
Looking across the full maturity spectrum of OFIs’ deposit holdings, short and long-term deposits show very different evolutions. On one hand, OFIs’ deposits with maturities of up to two years (and thus included in monetary aggregates) recorded a strong pace of growth (although broadly in line with the asset growth of this sector) to account for 41% of OFIs’ total deposit holdings. In turn, OFIs’ deposits with maturities of over two years increased considerably from early 2005 onwards, as discussed above, which mostly refl ected the statistical counterpart of liquidity obtained by banks with securitisation operations that were not derecognised from banks’ balance sheets. However, these long-term deposits did not affect the evolution of M3.
To sum up, the Portuguese OFI sector recorded a strong growth during the period under review, but its contribution to M3 growth was almost negligible. OFIs’ long-term deposit holdings increased very signifi cantly, even though such an increase refl ects only a statistical counterpart of the liquidity obtained by banks through securitisation operations.
4.2.11 SPAIN
by C. Martinez-Carrascal & M.-A. Menéndez (Banco de España)
In the last few years, the activity of the OFI sector has been concentrated in IFs, FVCs and SPVs issuing preference shares and other marketable securities.23 The increase in activity has been especially remarkable for FVCs, as well as for SPVs from the end of 2004. Consequently, their weight in the OFI sector signifi cantly increased up to early 2006, with FVCs accounting for a third of OFIs’ assets in the fi rst quarter of 2006 (see Chart 35). Although IFs remain the main sub-sector, accounting for nearly 50% of OFIs’ assets, their weight in this sector has decreased signifi cantly, accounting for more than 85% of its assets at the end of the 1990s.
Short-term deposits and repurchase agreements included in M3 grew signifi cantly in Spain in the last few years of the period under review (see Chart 36 and Chart 37). While at the beginning of 2004 their growth rate stood at 6.5%, it nearly doubled thereafter, reaching 12% year-on-year in mid-2006. Non-fi nancial corporations and, more signifi cantly, households made the largest contribution to this increase (their contribution to the growth rate of short-term deposits and repurchase agreements included in M3 increased by 1.7 and 3.4 percentage points respectively during this period to reach 3.5 and 5.9 percentage points respectively in mid-2006). The OFI sector’s contribution was not negligible either: during this period, it accounted for, on average, 1.4 percentage points of the increase in these deposits, the highest values being observed in early 2004 (around 3 percentage points). Subsequently, its contribution fell, and then increased again from mid-2005. As for other general government, its contribution was, on average, close to 1 percentage point during this period.
In Spain, FCLs are not considered to be OFIs but MFIs, which 23 is why a zero value appears in the chart for the FCL position.
Chart 35 OFIs’ holdings by sector
(percentages, March 2006)
investment funds
financial corporatins engaged in lending
securities and derivatives dealers
financial holding companies
financial vehicle corporations
other OFIs
0.3%
33.5%
16.8%
47.4%
0.0%
2.1%
Source: Banco de España.

44ECBOccasional Paper No 75October 2007
IFs account for a signifi cant part of the short-term deposits held by the OFI sector. This sub-sector’s demand for money can be affected by the investment decisions of non-fi nancial corporations and households, to the extent that these decisions involve allocation to IFs. Moreover, the IFs’ own portfolio allocation decisions, driven by the relative rates of return in the money, equity, bond markets or other assets, will affect their money-holding decisions. As for the other two main sub-sectors (FVCs and SPVs issuing preference shares and other marketable securities), they mainly hold – at least at the moment – MFI longer-term fi nancial liabilities, not included in monetary aggregates. Consequently, their activity is not expected to signifi cantly affect the evolution, and thus the indicator properties, of monetary aggregates.
In the last few years of the period under review, long-term deposits held by the OFI sector rose sharply in Spain (see Chart 38). Consequently, their weight in the long-term deposits held by the money-holding sector signifi cantly increased,
Chart 38 Breakdown of longer-term deposits by sector
(annual growth rate in percent; contributions in percentage points; neither seasonally nor calendar effect adjusted)
-10
0
10
20
30
40
50
60
70
-10
0
10
20
30
40
50
60
70
20062004 2005
householdsnon-financial corporationsinsurance corporations and pension fundsother general governmentother non-monetary financial intermediarieslonger-term deposits
Note: MFI sector excludes the Eurosystem. Refer to the country of residence of the MFI.
Chart 37 Breakdown of short-term deposits and repurchase agreements by instrument
(annual growth rate in percent; contributions in percentage points; neither seasonally nor calendar effect adjusted)
-15
0
15
30
45
60
75
-15
0
15
30
45
60
75
20062004 2005
repurchase agreementsdeposits redeemable up to 3 monthsdeposit with agreed mat. up to 2 yearsovernight depositsshort-term deposits and repurcase agreements
Note: MFI sector excludes the Eurosystem. Refer to the country of residence of the MFI.
Chart 36 Breakdown of short-term deposits and repurchase agreements by sector
(annual growth rate in percent; contributions in percentage points; neither seasonally nor calendar effect adjusted)
-2
0
2
4
6
8
10
12
14
-2
0
2
4
6
8
10
12
14
20062004 2005
householdsnon-financial corporationsinsurance corporation and pension fundsother general governmentother non-monetary financial intermediariesshort-term deposits and repurchase agreements
Note: MFI sector excludes the Eurosystem. Refer to the country of residence of the MFI.

45ECB
Occasional Paper No 75October 2007
4 A LOOK AT THE
COUNTRY LEVEL
more than doubling from the end of 2003 to nearly 70% in early 2006. In line with this increasing weight and the high growth rates of their long-term deposits, the OFI sector played a primary role in the developments of long-term deposits in Spain. From 2004 to mid-2006 the year-on-year growth rate of these deposits stood, on average, at 54%, the OFI sector accounting for nearly 80% of this increase.
Securitisation, together with the appearance of SPVs issuing preference shares and other marketable securities, accounted for a large part of the high growth rates of OFIs’ long-term deposit holdings towards the end of the period under review. As a result of legislative changes in order to implement IAS, from May 2005, the conditions for allowing securitised loans transferred to an FVC’s balance sheet to be removed from the credit institution’s balance sheet (and therefore to have no impact on OFIs’ deposits) are now more restrictive. The new regulation requires institutions to reinstate in their balance sheet any securitised loans granted since 2004 that had been derecognised without meeting the conditions set by the new regulations. This led to a signifi cant increase in the OFI sector’s deposit holdings, resulting in this sector making a greater contribution to the growth rate of total long-term deposits held by the money-holding sector.
The maturity of deposits held by the OFI sector increased signifi cantly in the last few years of the period under review. While in early 2003, long-term deposits accounted for somewhat less than 20% of total deposits, this percentage stood at around 70% in early 2006. This shift refl ected the changes observed in the OFI sector’s activities, namely the larger weight in the OFI sector of FVCs and SPVs issuing preference shares and other marketable securities, which held a signifi cant share of long-term deposits in their assets.
Regulatory changes signifi cantly affected OFIs’ activities in Spain, specifi cally the activities of SPVs and securitisation through FVCs. A law on capital movements approved at the end
of 2004 facilitated the development of SPVs issuing preference shares and other marketable securities activities. With the approval of this law, funds, which were previously raised by credit institutions via certain issues abroad by non-resident FVCs created by those credit institutions to benefi t from fi scal advantages, are now often raised by the same procedure through resident FVCs. Furthermore, as a result of the legislative changes to implement IAS, securitisation had a more signifi cant impact on OFI deposits from mid-2005 than previously.
4.2.12 FINLAND
by R. Herrala (Suomen Pankki – Finlands Bank)
Although growing quickly, the OFI sector is still relatively small in Finland. There are no comprehensive statistics about this sector available at present. However, the available information does suggest that the most important OFIs are IFs, which constitute around 80% of this sector by balance sheet share. IFs are typically established and run by banks and other fi nancial institutions. During the past decade, the growth in IFs has been boosted
Chart 39 OFIs’ holdings by sector
(percentages, March 2006)
0.0%
investment funds
financial vehicle corporations
financial corporations engaged in lending
financial holding corporations
security and derivative dealers
other OFIs
78.8%
0.0%
1.7%
19.0%
0.6%
Source: Suomen Pankki.

46ECBOccasional Paper No 75October 2007
by increased marketing efforts by fi nancial institutions and an increase in the demand for IF shares among the general public. FHCs constitute close to 20%, and other OFIs around 2%, of the OFI sector (see Chart 39).
In Finland, the annual growth in short-term deposits and other instruments included in M3 was between 4% and 8% between 2004 and mid-2006, while the market for repurchase agreements remained very small. In practice, the growth in deposits was accounted for by the growth in overnight deposits and deposits with an agreed maturity of up to two years. The Finnish OFI sector, in general, contributed positively to the growth rate of short-term deposits. After the household and the non-fi nancial corporate sector, it was the third largest contributor to the growth in short-term deposits (see chart 40). At the end of the period under review, it held around 3% of all short-term deposits in Finland.
At present, not many analytical studies have been devoted to the topic of the determinants of the demand for money by the OFI sector in
Finland. IFs are required by law to maintain “suffi cient” cash balances. Some anecdotal evidence suggests that OFIs’ demand for short-term deposits is, in practice, largely driven by the transaction motive and, therefore, account balances are mainly used to settle securities transactions. Apart from the transaction demand, short-term account balances are held at a minimum level owing to opportunity cost considerations.
The growth of the OFI sector contributed positively to the growth in long-term deposits in Finland during the period from December 2003to mid-2006. At the end of the period under review, the OFI sector held approximately 6% of all long-term deposits. OFIs’ demand for long-term deposits is driven mostly by other considerations besides securitisation andBasel II.
While the growth of the OFI sector contributed to both the growth in short-term and long-term deposits, the magnitude of its contribution to long-term deposits has clearly been more signifi cant. Even during the period of low interest rates, OFIs tended to minimise their holdings of short-term deposits. There is, however, also some demand for long-term deposits by OFIs, mainly as a safe, long-term, interest-bearing fi nancial investment.
4.2.13 DENMARK
by Ch. Petersen & K. Theill Jensen (Danmarks Nationalbank)
In Denmark, the OFI sector is clearly dominated by IFs (see Chart 41), which hold approximately 70% of the sector’s total assets. FHCs and FCLs also hold signifi cant shares, with 20.9% and 8.8%, respectively. Notably, FVCs, which have generated increased deposit activity in euro area countries, are non-existent in Denmark.
The main issue regarding the OFI sector in the context of monetary aggregates (M2 and M3) is its holdings of and activity in short-term deposits and repurchase agreements. In the case of Denmark, it should be noted that M3 is
Chart 40 Breakdown of short-term deposits and repurchase agreements by sector
(annual growth rate in percent; contributions in percentage points; neither seasonally nor calendar effect adjusted)
9
8
7
6
5
4
3
2
1
0
-1
-2
9
8
7
6
5
4
3
2
1
0
-1
-2
2004 2005 2006
householdsnon-financial corporationsinsurance corporations and pension fundsother general governmentother non-monetary financial intermediariesshort-term deposits and repurchase agreements
Note: MFI sector excluding Eurosystem. Refer to the country of residence of MFI.

47ECB
Occasional Paper No 75October 2007
4 A LOOK AT THE
COUNTRY LEVEL
affected by technicalities concerning the issue of bonds to fi nance adjustable-rate mortgage loans. More precisely, short-term adjustable-rate loans, in principle, can be fi nanced in two different ways. If the mortgage credit institutes have no open series with the desired coupon and maturity, the loans can be refi nanced in new bond series with a short original maturity and the bond issues will be included in M3. If the mortgage credit institutes instead choose to fi nance the adjustable-rate loans in already open bond series with an original maturity of more than two years, those bonds will not be included in M3. Hence, the difference in the fi nancing pattern is the main reason for the different development in the annual growth in M2 and M3 respectively. Therefore, in the Danish context, it seems more plausible to look at M2 rather than M3. Evidence shows that OFIs’ deposit holdings only account for about 5% of M2. While constituting only a minor share of total M2, OFIs’ short-term deposit holdings show a much higher volatility compared with the total money stock. As IFs are the only sub-sector for which Danmarks Nationalbank produces statistics, a complete picture of deposit holdings on a sub-sector level
is not possible. It can be stated, however, that IFs’ share in the OFI sector’s total short-term deposit holdings is fairly stable at around 50%.
OFIs’ total short-term deposit holdings and repurchase agreements included in M3 have on aggregate risen from 2004 onwards. The annual growth rate of the OFI sector’s total short-term deposit holdings and repurchase agreements was quite high from the end of 2005 onwards, with annual growth rates in the region of 25% to 60%. This development could be explained by a slightly higher share of deposits compared with total assets, combined with an increase in the stock of assets in the OFI sector. Moreover, the annual growth rate of repurchase agreements was especially high during the period under review, but also quite volatile. Compared with other money-holding sectors, the Danish OFI sector has more or less a similar structure, where the main components of OFIs’ short-term deposits and repurchase agreements are overnight deposits (around 74% of the total) and deposits with a maturity of up to two years (around 21% of the total). Most of these deposits have a maturity of up to one year. Changes in the contributions to the annual growth
Chart 41 OFIs’ holdings by sector
(percentages, end 2005)
investment funds
financial corporations engaged in
lending
securities and derivatives
dealers
financial holding companies
other OFIs1.0%
69.1%
8.8%
0.2%
20.9%
Source: Danmarks Nationalbank.
Chart 42 Breakdown of short-term deposits and repurchase agreements by instrument
(annual growth rate in percent; contributions in percentage points; neither seasonally nor calendar effect adjusted)
75
60
45
30
15
0
-15
-30
75
60
45
30
15
0
-15
-302004 2005 2006
repurchase agreementsdeposits redeemable up to 3 monthsdeposits with agreed mat. up to 2 yearsovernight depositsshort-term deposits and repurchase agreements
Note: MFI sector excludes the Eurosystem.Refer to the country of residence of the MFI.
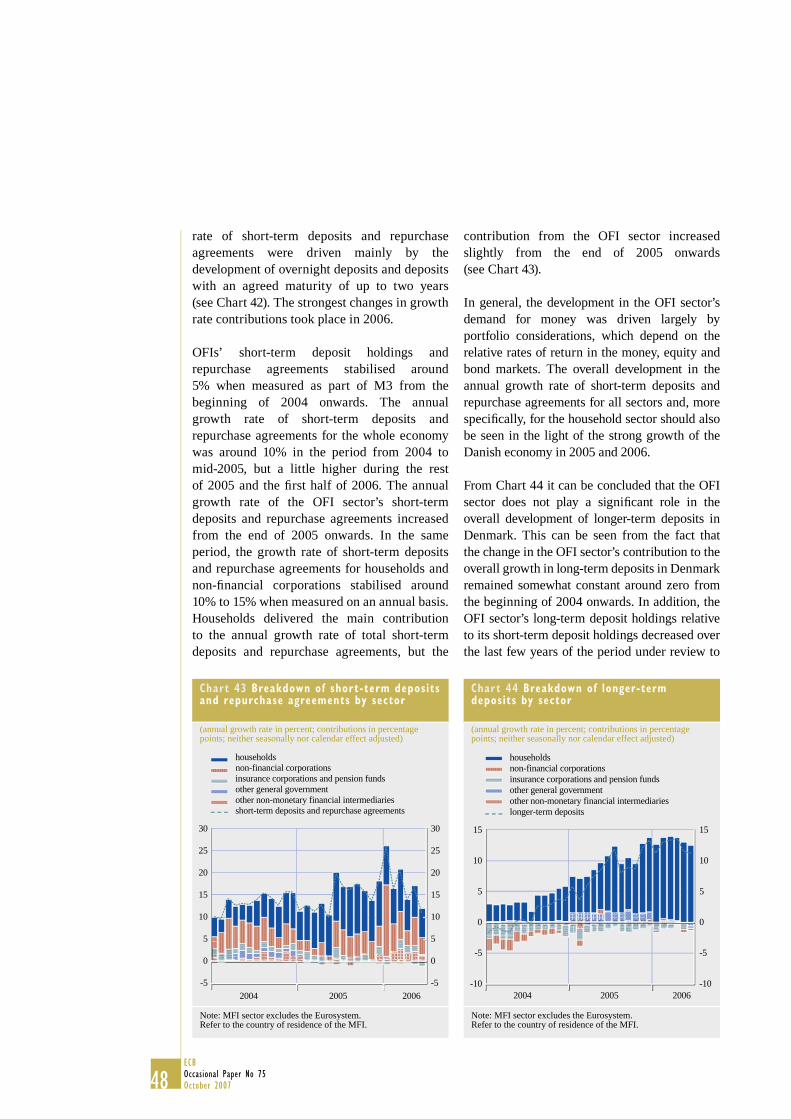
48ECBOccasional Paper No 75October 2007
rate of short-term deposits and repurchase agreements were driven mainly by the development of overnight deposits and deposits with an agreed maturity of up to two years(see Chart 42). The strongest changes in growth rate contributions took place in 2006.
OFIs’ short-term deposit holdings and repurchase agreements stabilised around 5% when measured as part of M3 from the beginning of 2004 onwards. The annual growth rate of short-term deposits and repurchase agreements for the whole economy was around 10% in the period from 2004 tomid-2005, but a little higher during the rest of 2005 and the fi rst half of 2006. The annual growth rate of the OFI sector’s short-term deposits and repurchase agreements increased from the end of 2005 onwards. In the same period, the growth rate of short-term deposits and repurchase agreements for households and non-fi nancial corporations stabilised around 10% to 15% when measured on an annual basis. Households delivered the main contribution to the annual growth rate of total short-term deposits and repurchase agreements, but the
contribution from the OFI sector increased slightly from the end of 2005 onwards (see Chart 43).
In general, the development in the OFI sector’s demand for money was driven largely by portfolio considerations, which depend on the relative rates of return in the money, equity and bond markets. The overall development in the annual growth rate of short-term deposits and repurchase agreements for all sectors and, more specifi cally, for the household sector should also be seen in the light of the strong growth of the Danish economy in 2005 and 2006.
From Chart 44 it can be concluded that the OFI sector does not play a signifi cant role in the overall development of longer-term deposits in Denmark. This can be seen from the fact that the change in the OFI sector’s contribution to the overall growth in long-term deposits in Denmark remained somewhat constant around zero from the beginning of 2004 onwards. In addition, the OFI sector’s long-term deposit holdings relative to its short-term deposit holdings decreased over the last few years of the period under review to
Chart 44 Breakdown of longer-term deposits by sector
(annual growth rate in percent; contributions in percentage points; neither seasonally nor calendar effect adjusted)
15
10
5
0
-5
-10
15
10
5
0
-5
-102004 2005 2006
householdsnon-financial corporationsinsurance corporations and pension fundsother general governmentother non-monetary financial intermediarieslonger-term deposits
Note: MFI sector excludes the Eurosystem.Refer to the country of residence of the MFI.
Chart 43 Breakdown of short-term deposits and repurchase agreements by sector
(annual growth rate in percent; contributions in percentage points; neither seasonally nor calendar effect adjusted)
30
25
20
15
10
5
0
-5
30
25
20
15
10
5
0
-52004 2005 2006
householdsnon-financial corporationsinsurance corporations and pension fundsother general governmentother non-monetary financial intermediariesshort-term deposits and repurchase agreements
Note: MFI sector excludes the Eurosystem. Refer to the country of residence of the MFI.

49ECB
Occasional Paper No 75October 2007
4 A LOOK AT THE
COUNTRY LEVEL
less than 2%, while the average for all sectors was approximately 20%. This development in the OFI sector’s long-term deposit holdings has little to do with securitisation and Basel II, as there is and historically has been a very limited activity within true-sale securitisation in Denmark, which is also refl ected in the non-existent population of FVCs and SPVs in the country.
Until 2006 the OFI sector did not infl uence the growth in M3 to a great extent. Quite notably, the peak in M3 in January 2006 was the direct effect of a temporary requirement for large deposits due to merger and acquisition activities. The deviation between M3 and M3 excluding the OFI sector in 2006 can also be related to these merger and acquisition activities, which created a signifi cant amount of cash to be reinvested. A major part of these holdings were either directly or indirectly, through new placements from either households or pension funds, under the management of IFs, which created higher short-term deposit holdings among IFs, and thus in the OFI sector. Consequently, there is reason to believe that the above-depicted impact of OFIs on M3 should be seen as a temporary effect.
As a sub-sector, IFs grew in importance within the OFI sector from 2003 to 2005, at the expense of FHCs and FCLs. The explicit reason for this development was that IFs saw a signifi cantly higher growth in their assets during this period than the other two sub-sectors, which experienced declining growth rates. This can be attributed mainly to a new regulation in 2004, which allowed for the establishment of limited-membership associations, i.e. IFs are allowed to receive funds from only a few large investors, such as pension funds, and not from the general public. This resulted in several large pension funds, such as Lønmodtagernes Dyrtidsfond 24, Særlige Pensionsordning 25 and Arbejdsmarkedets Tillægs Pension 26 establishing this type of investment association.
Overall, the OFI sector has grown by around 65% measured in assets from 2003 to 2005, which, of course, is signifi cant above the growth in the Danish economy. As shown above, this
can be attributed mainly to the developmentinside the IF sub-sector. Besides the above-mentioned regulation regarding limited-membership associations relating to the OFI sector, a legal framework for the regulation of hedge associations (hedge funds) was introduced in 2005. The size of the Danish hedge funds’ assets is quite small compared with the value of the total assets in the Danish capital markets. Moreover, it is still diffi cult to draw any conclusions on hedge fund activity owing to the relatively short period of time such funds have existed in Denmark.
4.2.14 SWEDEN
by M. Karlsson (Sveriges Riksbank)
As can be seen from Chart 45 the main OFI sub-sector in Sweden is IFs, followed by investment corporations and “non-monetary securities companies and investment fi rms”. The residual category of other OFIs includes, for example, non-monetary credit market corporations and fi nancial intermediaries.27
Frozen cost-of-living allowances fund.24 Special Pension Scheme.25 The Labour Market Supplementary Pension Scheme.26 The fi gures refer to the fi nancial accounts tables. The division 27 of sub-sectors might slightly differ from the one commonly used within the Eurosystem.
Chart 45 OFIs’ holdings by sector
(percentages, March 2006)
investment corporations
investment funds
non-monetary securities companies and
investment firms
other OFIs
18.3%
3.0%
0.9%
77.8%
Source: Sveriges Riksbank.

50ECBOccasional Paper No 75October 2007
Over the last three or four years of the period under review, the OFI sector experienced quite a stable development in MFI short-term deposits. This notwithstanding, the respective time series shows a signifi cant jump in December 2004 and, after that, a stabilisation at a higher level (see Chart 46).28
Looking over the last fi ve years on the basis of fi nancial accounts data, the OFI sector recorded a very stable development in short-term deposits which remained on the same level from December 2001 onwards. 29 The allocation of the deposits is between transactions accounts and deposits with an agreed maturity of up to three months. Repurchase agreements were much more volatile. An analysis of the last three years of the period under review shows that IFs (above 95% of all repurchase agreements in the OFI sector) peaked at the end of 2005 and at the beginning of 2006 and thereafter declined towards a more stable longer-term value.
According to the MFI Balance Sheet Item statistics, the OFIs’ deposit holdings increased
somewhat. Financial account data show the same level, but with a less pronounced volatility. Repurchase agreements were quite volatile, which also, to some extent, holds true for deposits with a maturity of more than three months. Compared with the OFI sector, households depict a much smoother increase, while non-fi nancial corporations report a steeper increase. The repurchase agreements of non-fi nancial corporations were also quite volatile. Households and non-fi nancial corporations also held longer-term deposits, while the OFI sector did not seem to invest in these assets at all (see Chart 47). The Swedish OFI sector did not appear to have any infl uence on longer-term deposits as the amounts involved were rather small and, from an economic point of view, negligible. Overall, OFIs in Sweden only hold deposits that are included in M3.
The fi gures are derived from Balance Sheet Item Statistics.28 This result is based on the fi gures from the fi nancial accounts.29
Chart 47 Breakdown of longer-term deposits by sector
(annual growth rate in percent; contributions in percentage points; neither seasonally nor calendar effect adjusted)
-40 -40
-30
-20
-10
0
10
20
30
40
50
2004 2005 2006
-30
-20
-10
0
10
20
30
40
50
householdsnon-financial corporationsinsurance corporations and pension funds other general governmentother non-monetary financial intermediarieslonger-term deposits
Note: MFI sector excludes the Eurosystem.Refer to the country of residence of the MFI.
Chart 46 Breakdown of short-term deposits and repurchase agreements by instrument
(annual growth rate in percent; contributions in percentage points; neither seasonally nor calendar effect adjusted)
2004 2005 2006
60
45
30
15
0
-15
-30
-45
-60
60
45
30
15
0
-15
-30
-45
-60
Repurchase agreementsDeposits redeemable up to 3 monthsDeposits with agreed mat. up to 2 yearsOvernight depositsShort-term deposits and repurchase agreements
Note: MFI sector excludes the Eurosystem.Refer to the country of residence of the MFI.
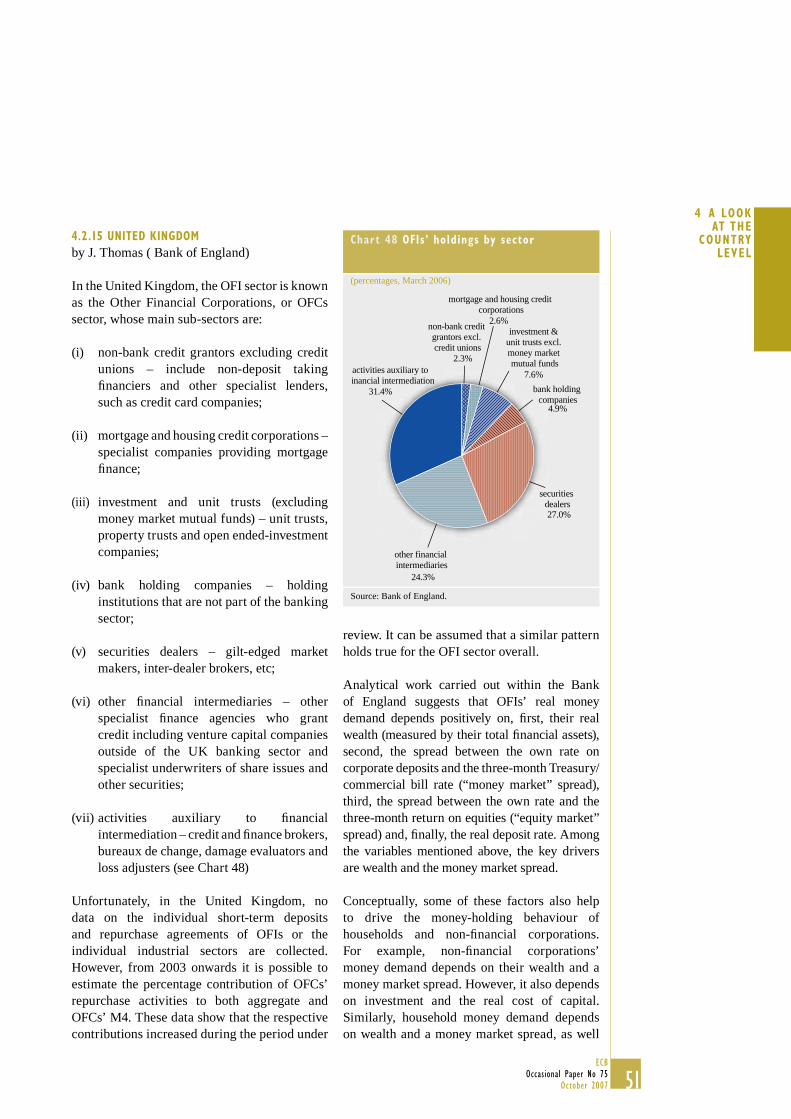
51ECB
Occasional Paper No 75October 2007
4 A LOOK AT THE
COUNTRY LEVEL
4.2.15 UNITED KINGDOM
by J. Thomas ( Bank of England)
In the United Kingdom, the OFI sector is known as the Other Financial Corporations, or OFCs sector, whose main sub-sectors are:
(i) non-bank credit grantors excluding credit unions – include non-deposit taking fi nanciers and other specialist lenders, such as credit card companies;
(ii) mortgage and housing credit corporations – specialist companies providing mortgage fi nance;
(iii) investment and unit trusts (excluding money market mutual funds) – unit trusts, property trusts and open ended-investment companies;
(iv) bank holding companies – holding institutions that are not part of the banking sector;
(v) securities dealers – gilt-edged market makers, inter-dealer brokers, etc;
(vi) other fi nancial intermediaries – other specialist fi nance agencies who grant credit including venture capital companies outside of the UK banking sector and specialist underwriters of share issues and other securities;
(vii) activities auxiliary to fi nancial intermediation – credit and fi nance brokers, bureaux de change, damage evaluators and loss adjusters (see Chart 48)
Unfortunately, in the United Kingdom, no data on the individual short-term deposits and repurchase agreements of OFIs or the individual industrial sectors are collected. However, from 2003 onwards it is possible to estimate the percentage contribution of OFCs’ repurchase activities to both aggregate and OFCs’ M4. These data show that the respective contributions increased during the period under
review. It can be assumed that a similar pattern holds true for the OFI sector overall.
Analytical work carried out within the Bank of England suggests that OFIs’ real money demand depends positively on, fi rst, their real wealth (measured by their total fi nancial assets), second, the spread between the own rate on corporate deposits and the three-month Treasury/commercial bill rate (“money market” spread), third, the spread between the own rate and the three-month return on equities (“equity market” spread) and, fi nally, the real deposit rate. Among the variables mentioned above, the key drivers are wealth and the money market spread.
Conceptually, some of these factors also help to drive the money-holding behaviour of households and non-fi nancial corporations. For example, non-fi nancial corporations’ money demand depends on their wealth and a money market spread. However, it also depends on investment and the real cost of capital. Similarly, household money demand depends on wealth and a money market spread, as well
Chart 48 OFIs’ holdings by sector
(percentages, March 2006)
non-bank credit grantors excl. credit unions
mortgage and housing credit corporations
investment & unit trusts excl. money market mutual funds
bank holding companies
securities dealers
other financial intermediaries
activities auxiliary to inancial intermediation
2.6%
7.6%
4.9%
27.0%
24.3%
31.4%
2.3%
Source: Bank of England.

52ECBOccasional Paper No 75October 2007
as on the households’ real disposable income and infl ation.
Under current UK (Basel I) regulations, banks can achieve regulatory capital relief by securitising assets. As banks are required to hold relatively large amounts of capital against residential mortgage exposures under Basel I, this has been one of the factors driving issuance of residential mortgage-backed securities (RMBS). Covered bond issuance has only recently become more widespread in the United Kingdom. The introduction of Basel II may lead to a reduction in the issuance of residential mortgage-backed securities in favour of covered bonds.
OFIs’ share of broad money holdings rose from around 2% in 1965 to around 25% at the end of the period under review. This increase was accompanied by a decline in households’ share of holdings from around 80% to around 60%. These developments partly refl ect a relative shift in household savings away from direct holdings of bank deposits towards fi nancial intermediaries, such as retail unit trusts, as well as the build-up of households’ wealth held in the form of pension savings. Over the same period, the rate of growth of OFIs’ broad money holdings was far more volatile than that of non-fi nancial corporations or households.
4.3 AN OVERALL VIEW
Taking an overarching perspective, the documented evidence confi rms the considerable heterogeneity in the structure and importance of OFIs across countries. Some commonalities, however, can be detected. First, in most euro area countries, the largest OFI sub-sector is IFs, which seem to hold short-term deposits with MFIs in order to manage their liquidity risk, as most IFs are legally required to maintain the liquidity of their unit shares. From an economic perspective, OFIs’ demand for money is determined by portfolio allocation decisions based on the relative rates of return in the money, equity, bond markets or other assets. Moreover, OFIs transactions demand for money
is likely to be closely related to the need to settle fi nancial transactions. Second, in several countries, repurchase agreements account for a much larger share of M3 deposit holdings than observed for other money-holding sectors, as they are used as the usual means of securing the borrowing/lending of cash and securities. Third, in a number of Member States, securitisation through SPVs may have contributed to the demand for MFI deposits. However, country-specifi c factors and the type of securitisation undertaken (“true-sale” or “synthetic”) has played a role in the maturity of the deposits, and thus in whether or not they impacted on M3 or longer-term fi nancial liabilities.
53ECB
Occasional Paper No 75October 2007
5 CONCLUS IONS
5 CONCLUSIONS
by Ph. Moutot (ECB staff)
A number of conclusions can be drawn from this extensive analysis. Both on theoretical and empirical grounds, the monetary nature of infl ation is not brought into question by the strong growth in OFIs’ deposit holdings. However, given the predominant portfolio considerations in their demand for liquid assets, the impact of OFIs on monetary dynamics raises a particular set of challenges when assessing the medium to longer-term risks to price stability from monetary developments.
One aspect of addressing these challenges is the need for a more detailed sectoral analysis of money and credit, including of the OFI sector. More specifi cally, three key issues deserve closer attention in the future, as follows.
- Eliminating some of the existing statistical shortcomings, such as the lack of timely and frequent data with a good level of detail and coverage, as well as long time-series data on the various OFI sub-sectors. In this respect, the planned improvements to IF data, transactions data and data on fi nancial corporations currently being discussed within the ESCB’s Statistics Committee (for instance, regarding a more detailed breakdown) are very promising.
- The need to identify, by means of appropriate techniques, the impact of OFIs on monetary developments, the indicator properties of money and the monetary policy transmission mechanism. Among other things, the direct modelling of OFIs' money demand, the impact of including or not including OFIs in M3, as well as assessments of the impact of OFIs’ deposit holdings on indicator model results (Bayesian, Stock and Watson techniques, etc.) are seen as a useful way to proceed.
- The rising importance of OFIs in the fi nancial sector in recent years, which will have implications not only for monetary
developments, but also for the functioning of the fi nancial system as a whole.
Against this background, it can be suggested that further work to foster the understanding of OFIs’ demand for deposits and its implications for price stability will remain an important aspect of monetary analysis in the coming months and years. However, ultimately, a better understanding of the motives of OFIs’ money demand and credit demand rests on a deeper investigation into the economic rationale for the existence of these entities. Such an analysis was however beyond the scope of this paper and is left for future research.
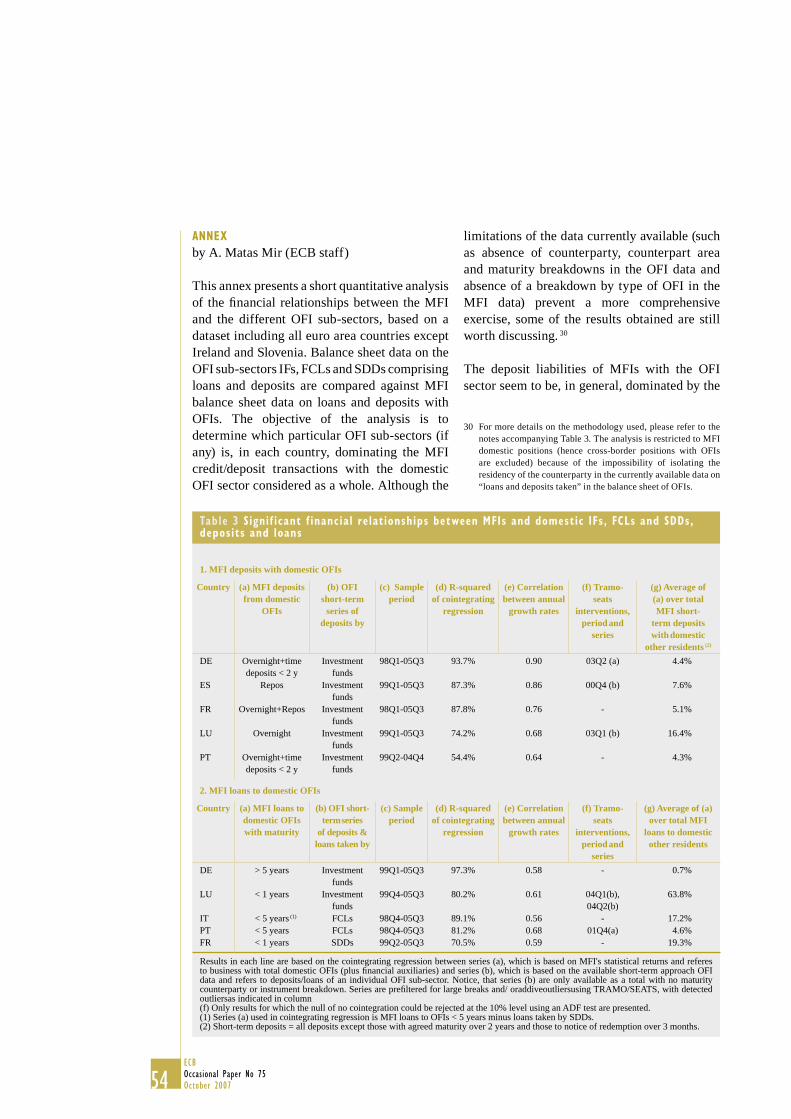
54ECBOccasional Paper No 75October 2007
ANNEX
by A. Matas Mir (ECB staff)
This annex presents a short quantitative analysis of the fi nancial relationships between the MFI and the different OFI sub-sectors, based on a dataset including all euro area countries except Ireland and Slovenia. Balance sheet data on the OFI sub-sectors IFs, FCLs and SDDs comprising loans and deposits are compared against MFI balance sheet data on loans and deposits with OFIs. The objective of the analysis is to determine which particular OFI sub-sectors (if any) is, in each country, dominating the MFI credit/deposit transactions with the domestic OFI sector considered as a whole. Although the
limitations of the data currently available (such as absence of counterparty, counterpart area and maturity breakdowns in the OFI data and absence of a breakdown by type of OFI in the MFI data) prevent a more comprehensive exercise, some of the results obtained are still worth discussing. 30
The deposit liabilities of MFIs with the OFI sector seem to be, in general, dominated by the
For more details on the methodology used, please refer to the 30 notes accompanying Table 3. The analysis is restricted to MFI domestic positions (hence cross-border positions with OFIs are excluded) because of the impossibility of isolating the residency of the counterparty in the currently available data on “loans and deposits taken” in the balance sheet of OFIs.
Table 3 Signif icant f inancial relationships between MFIs and domestic IFs, FCLs and SDDs, deposits and loans
1. MFI deposits with domestic OFIs
Country (a) MFI deposits from domestic
OFIs
(b) OFI short-term
series of deposits by
(c) Sample period
(d) R-squared of cointegrating
regression
(e) Correlation between annual
growth rates
(f) Tramo-seats
interventions, period and
series
(g) Average of (a) over total MFI short-
term deposits with domestic
other residents (2)
DE Overnight+time deposits < 2 y
Investment funds
98Q1-05Q3 93.7% 0.90 03Q2 (a) 4.4%
ES Repos Investment funds
99Q1-05Q3 87.3% 0.86 00Q4 (b) 7.6%
FR Overnight+Repos Investment funds
98Q1-05Q3 87.8% 0.76 - 5.1%
LU Overnight Investment funds
99Q1-05Q3 74.2% 0.68 03Q1 (b) 16.4%
PT Overnight+time deposits < 2 y
Investment funds
99Q2-04Q4 54.4% 0.64 - 4.3%
2. MFI loans to domestic OFIs
Country (a) MFI loans to domestic OFIs with maturity
(b) OFI short-term series
of deposits & loans taken by
(c) Sample period
(d) R-squared of cointegrating
regression
(e) Correlation between annual
growth rates
(f) Tramo-seats
interventions, period and
series
(g) Average of (a) over total MFI
loans to domestic other residents
DE > 5 years Investment funds
99Q1-05Q3 97.3% 0.58 - 0.7%
LU < 1 years Investment funds
99Q4-05Q3 80.2% 0.61 04Q1(b), 04Q2(b)
63.8%
IT < 5 years (1) FCLs 98Q4-05Q3 89.1% 0.56 - 17.2%PT < 5 years FCLs 98Q4-05Q3 81.2% 0.68 01Q4(a) 4.6%FR < 1 years SDDs 99Q2-05Q3 70.5% 0.59 - 19.3%
Results in each line are based on the cointegrating regression between series (a), which is based on MFI's statistical returns and referes to business with total domestic OFIs (plus fi nancial auxiliaries) and series (b), which is based on the available short-term approach OFI data and refers to deposits/loans of an individual OFI sub-sector. Notice, that series (b) are only available as a total with no maturity counterparty or instrument breakdown. Series are prefi ltered for large breaks and/ oraddiveoutliersusing TRAMO/SEATS, with detected outliersas indicated in column (f) Only results for which the null of no cointegration could be rejected at the 10% level using an ADF test are presented. (1) Series (a) used in cointegrating regression is MFI loans to OFIs < 5 years minus loans taken by SDDs. (2) Short-term deposits = all deposits except those with agreed maturity over 2 years and those to notice of redemption over 3 months.

55ECB
Occasional Paper No 75October 2007
ANNEX
activities of IFs according to results presented in Table 3.1. Indeed, developments in various types of MFI short-term deposit, as indicated in column (a) of the table, are signifi cantly explained by developments in the IF series “Deposits placed” in Germany, Spain, France, Luxembourg and Portugal, with the other OFI categories having only a residual importance.31
The liquidity buffering needs of open-ended investment funds, as well as liquid positions held by all fund types for speculative purposes, possibly explain the prominent role of IFs in the placement of deposits by the OFI sector as a whole.32
In turn, MFI credit to the OFI sector does not appear to be driven by IFs, according to the available data (see Table 3.2). Only in two countries, Germany and Luxembourg, does the series “IF deposits and loans taken” explain a signifi cant proportion of total MFI lending to the OFI sector in any given maturity band, with the case of Germany being irrelevant in terms of impact on overall private sector lending(see column (g)). Notwithstanding the limitations of the present analysis, it would thus appear that high leverage is not a main feature of the IF sector as a whole in the euro area.33
Lending to FCLs appears to play an important role in Portugal, which has experienced recently an important expansion in factoring, leasing and credit-purchase transactions carried out by non-MFIs (see section IV.2.10) and even more so in Italy, where a signifi cant proportion of lending to the private sector appears to be channelled through these specialised lenders. Indeed, Italian FVCs account for around 30% of the fi nancial assets of the domestic OFI sector(see section IV.2.6), whilst the order of magnitude of their liabilities in the form of loans is roughly equivalent to 10% of all MFI domestic loans to the private sector.
Finally, lending to SDDs seems to be the most important component of short-term lendingto the OFI sector in France, with a quantitatively signifi cant impact in total MFI lending. Although an instrument breakdown is currently
not available, it is likely that most of these positions correspond to reverse repurchase agreements, refl ecting collaterised cash borrowing from MFIs by the securities fi rms and/or their securities lending to MFIs against cash collateral.
This is suggested by the fact that the addition of SDDs and/31 or FCLs data (when available) as additional conditioning variables in regressions of the form presented in Table 3.1 and their dynamic extensions did not signifi cantly change their overall results after correcting for spurious goodness-of-fi t increases. Note also that the absence of data for the FVC sub-sector could explain the fact that similar relationships were not found to be signifi cant in other countries (although this caveat would apply mainly to longer-term deposits). The deposit categories involved would also be consistent with 32 IFs holding positions as margin deposits in the context of hedging strategies and/or speculative positions in derivatives, or as cash collateral when borrowing securities from MFIs. However, given the level of limited breakdown detail in the OFI data currently available, it is not possible to quantify the overall importance of those positions.In Luxembourg, short-term “deposits and loans taken” by 33 IFs could potentially explain a relevant part of total domestic MFI credit. However, this would be more a refl ection of the large size of the IF industry relative to the rest of the domestic private sector in Luxembourg. In addition, the available IF data does not allow to discern whether those “deposits and loans taken” refl ect the activity of investment funds pursuing non-traditional investment strategies (e.g. highly geared funds), versus that of traditional funds engaged in repurchase agreements with MFIs (e.g. securities lending to MFIs by long-only, non-leveraged funds).

56ECBOccasional Paper No 75October 2007
EUROPEAN CENTRAL BANK
OCCASIONAL PAPER SERIES
1 “The impact of the euro on money and bond markets” by J. Santillán, M. Bayle and C. Thygesen, July 2000.
2 “The effective exchange rates of the euro” by L. Buldorini, S. Makrydakis and C. Thimann, February 2002.
3 “Estimating the trend of M3 income velocity underlying the reference value for monetary growth” by C. Brand, D. Gerdesmeier and B. Roffi a, May 2002.
4 “Labour force developments in the euro area since the 1980s” by V. Genre andR. Gómez-Salvador, July 2002.
5 “The evolution of clearing and central counterparty services for exchange-traded derivatives in the United States and Europe: a comparison” by D. Russo, T. L. Hart and A. Schönenberger, September 2002.
6 “Banking integration in the euro area” by I. Cabral, F. Dierick and J. Vesala, December 2002.
7 “Economic relations with regions neighbouring the euro area in the ‘Euro Time Zone’”by F. Mazzaferro, A. Mehl, M. Sturm, C. Thimann and A. Winkler, December 2002.
8 “An introduction to the ECB’s survey of professional forecasters” by J. A. Garcia,September 2003.
9 “Fiscal adjustment in 1991-2002: stylised facts and policy implications” by M. G. Briotti, February 2004.
10 “The acceding countries’ strategies towards ERM II and the adoption of the euro: an analytical review” by a staff team led by P. Backé and C. Thimann and including O. Arratibel,O. Calvo-Gonzalez, A. Mehl and C. Nerlich, February 2004.
11 “Offi cial dollarisation/euroisation: motives, features and policy implications of current cases” by A. Winkler, F. Mazzaferro, C. Nerlich and C. Thimann, February 2004.
12 “Understanding the impact of the external dimension on the euro area: trade, capital fl ows and other international macroeconomic linkages“ by R. Anderton, F. di Mauro and F. Moneta, March 2004.
13 “Fair value accounting and fi nancial stability” by a staff team led by A. Enria and including L. Cappiello, F. Dierick, S. Grittini, A. Maddaloni, P. Molitor, F. Pires and P. Poloni,April 2004.
14 “Measuring fi nancial integration in the euro area” by L. Baele, A. Ferrando, P. Hördahl,E. Krylova, C. Monnet, April 2004.

57ECB
Occasional Paper No 75October 2007
EUROPEAN CENTRAL BANK
OCCAS IONAL PAPER SERIES
15 “Quality adjustment of European price statistics and the role for hedonics” by H. Ahnert andG. Kenny, May 2004.
16 “Market dynamics associated with credit ratings: a literature review” by F. Gonzalez, F. Haas, R. Johannes, M. Persson, L. Toledo, R. Violi, M. Wieland and C. Zins, June 2004.
17 “Corporate ‘excesses’ and fi nancial market dynamics” by A. Maddaloni and D. Pain,July 2004.
18 “The international role of the euro: evidence from bonds issued by non-euro area residents”by A. Geis, A. Mehl and S. Wredenborg, July 2004.
19 “Sectoral specialisation in the EU: a macroeconomic perspective” by MPC task force of the ESCB, July 2004.
20 “The supervision of mixed fi nancial services groups in Europe” by F. Dierick,August 2004.
21 “Governance of securities clearing and settlement systems” by D. Russo, T. Hart,M. C. Malaguti and C. Papathanassiou, October 2004.
22 “Assessing potential output growth in the euro area: a growth accounting perspective”by A. Musso and T. Westermann, January 2005.
23 “The bank lending survey for the euro area” by J. Berg, A. van Rixtel, A. Ferrando, G. de Bondt and S. Scopel, February 2005.
24 “Wage diversity in the euro area: an overview of labour cost differentials across industries”by V. Genre, D. Momferatou and G. Mourre, February 2005.
25 “Government debt management in the euro area: recent theoretical developments and changes in practices” by G. Wolswijk and J. de Haan, March 2005.
26 “The analysis of banking sector health using macro-prudential indicators” by L. Mörttinen,P. Poloni, P. Sandars and J. Vesala, March 2005.
27 “The EU budget – how much scope for institutional reform?” by H. Enderlein, J. Lindner,O. Calvo-Gonzalez, R. Ritter, April 2005.
28 “Reforms in selected EU network industries” by R. Martin, M. Roma, I. Vansteenkiste,April 2005.
29 “Wealth and asset price effects on economic activity”, by F. Altissimo, E. Georgiou, T. Sastre, M. T. Valderrama, G. Sterne, M. Stocker, M. Weth, K. Whelan, A. Willman, June 2005.
30 “Competitiveness and the export performance of the euro area”, by a Task Force of the Monetary Policy Committee of the European System of Central Banks, June 2005.

58ECBOccasional Paper No 75October 2007
31 “Regional monetary integration in the member states of the Gulf Cooperation Council (GCC)” by M. Sturm and N. Siegfried, June 2005.
32 “Managing fi nancial crises in emerging market economies: experience with the involvement of private sector creditors” by an International Relations Committee task force, July 2005.
33 “Integration of securities market infrastructures in the euro area” by H. Schmiedel,A. Schönenberger, July 2005.
34 “Hedge funds and their implications for fi nancial stability” by T. Garbaravicius and F. Dierick, August 2005.
35 “The institutional framework for fi nancial market policy in the USA seen from anEU perspective” by R. Petschnigg, September 2005.
36 “Economic and monetary integration of the new Member States: helping to chart the route”by J. Angeloni, M. Flad and F. P. Mongelli, September 2005.
37 “Financing conditions in the euro area” by L. Bê Duc, G. de Bondt, A. Calza,D. Marqués Ibáñez, A. van Rixtel and S. Scopel, September 2005.
38 “Economic reactions to public fi nance consolidation: a survey of the literature” by M. G. Briotti, October 2005.
39 “Labour productivity in the Nordic EU countries: a comparative overview and explanatory factors – 1998-2004” by A. Annenkov and C. Madaschi, October 2005.
40 “What does European institutional integration tell us about trade integration?” by F. P. Mongelli, E. Dorrucci and I. Agur, December 2005.
41 “Trends and patterns in working time across euro area countries 1970-2004: causes and consequences” by N. Leiner-Killinger, C. Madaschi and M. Ward-Warmedinger,December 2005.
42 “The New Basel Capital Framework and its implementation in the European Union”by F. Dierick, F. Pires, M. Scheicher and K. G. Spitzer, December 2005.
43 “The accumulation of foreign reserves” by an International Relations Committee Task Force, February 2006.
44 “Competition, productivity and prices in the euro area services sector” by a Task Force of the Monetary Policy Committee of the European System of Central banks, April 2006.
45 “Output growth differentials across the euro area countries: Some stylised facts” by N. Benalal, J. L. Diaz del Hoyo, B. Pierluigi and N. Vidalis, May 2006.
46 “Infl ation persistence and price-setting behaviour in the euro area – a summary of the IPN evidence”, by F. Altissimo, M. Ehrmann and F. Smets, June 2006.

59ECB
Occasional Paper No 75October 2007
EUROPEAN CENTRAL BANK
OCCAS IONAL PAPER SERIES
47 “The reform and implementation of the stability and growth pact” by R. Morris, H. Ongena and L. Schuknecht, June 2006.
48 “Macroeconomic and fi nancial stability challenges for acceding and candidate countries”by the International Relations Committee Task Force on Enlargement, July 2006.
49 “Credit risk mitigation in central bank operations and its effects on fi nancial markets: the case of the Eurosystem” by U. Bindseil and F. Papadia, August 2006.
50 “Implications for liquidity from innovation and transparency in the European corporate bond market” by M. Laganá, M. Perina, I. von Köppen-Mertes and A. Persaud, August 2006.
51 “Macroeconomic implications of demographic developments in the euro area” by A. Maddaloni, A. Musso, P. Rother, M. Ward-Warmedinger and T. Westermann, August 2006.
52 “Cross-border labour mobility within an enlarged EU” by F. F. Heinz and M. Ward-Warmedinger, October 2006.
53 “Labour productivity developments in the euro area” by R. Gomez-Salvador, A. Musso,M. Stocker and J. Turunen, October 2006.
54 “Quantitative quality indicators for statistics – an application to euro area balance of payment statistics” by V. Damia and C. Picón Aguilar, November 2006
55 “Globalisation and euro area trade: Interactions and challenges” by U. Baumann andF. di Mauro, February 2007.
56 “Assessing fi scal soundness: Theory and practice” by N. Giammarioli, C. Nickel, P. Rother, J.-P. Vidal, March 2007.
57 “Understanding price developments and consumer price indices in south-eastern Europe”by S. Herrmann and E. K. Polgar, March 2007.
58 “Long-Term Growth Prospects for the Russian Economy” by R. Beck, A. Kamps and E. Mileva, March 2007.
59 “The ECB Survey of Professional Forecasters (SPF) a review after eight years’ experience”,by C. Bowles, R. Friz, V. Genre, G. Kenny, A. Meyler and T. Rautanen, April 2007.
60 “Commodity price fl uctuations and their impact on monetary and fi scal policies in Western and Central Africa” by U. Böwer, A. Geis and A. Winkler, April 2007.
61 “Determinants of growth in the central and eastern European EU Member States – A production function approach” by O. Arratibel, F. Heinz, R. Martin, M. Przybyla, L. Rawdanowicz,R. Serafi ni and T. Zumer, April 2007.
62 “Infl ation-linked bonds from a Central Bank perspective” by J. A. Garcia and A. van Rixtel, June 2007.

60ECBOccasional Paper No 75October 2007
63 “Corporate fi nance in the euro area – including background material”, Task Force of the Monetary Policy Committee of the European System of Central Banks, June 2007.
64 “The use of portfolio credit risk models in central banks”, Task Force of the Market Operations Committee of the European System of Central Banks, July 2007.
65 “The performance of credit rating systems in the assessment of collateral used in Eurosystem monetary policy operations” by F. Coppens, F. González and G. Winkler, July 2007.
66 “Structural reforms in EMU and the role of monetary policy – a survey of the literature”by N. Leiner-Killinger, V. López Pérez, R. Stiegert and G. Vitale, July 2007.
67 “Towards harmonised balance of payments and international investment position statistics – the experience of the European compilers” by J.-M. Israël and C. Sánchez Muñoz, July 2007.
68 “The securities custody industry” by D. Chan, F. Fontan, S. Rosati and D. Russo, August 2007.
69 “Fiscal policy in Mediterranean countries – Developments, structures and implications for monetary policy” by M. Sturm and F. Gurtner, August 2007.
70 The search for Columbus’ egg: Finding a new formula to determine quotas at the IMFby M. Skala, C. Thimann and R. Wölfi nger, August 2007.
71 “The economic impact of the Single Euro Payments Area” by H. Schmiedel, August 2007.
73 “Reserve accumulation: objective or by-product?” by J. O. de Beaufort Wijnholds and Lars Søndergaard, September 2007.
74 “Analysis of revisions to general economic statistics” by H. C. Dieden and A. Kanutin, October 2007.
75 “The role of other fi nancial intermediaries in monetary and credit developments in the euro area” edited by P. Moutot and coordinated by D. Gerdesmeier, A. Lojschová and J. von Landesberger, October 2007.
72 “The role of fi nancial markets and innovation in productivity and growth in Europe”by P. Hartmann, F. Heider, E. Papaioannou and M. Lo Duca, September 2007.

OCCAS IONAL PAPER SER IESNO 75 / OCTOBER 2007
THE ROLE OF
OTHER FINANCIAL
INTERMEDIARIES
IN MONETARY
AND CREDIT
DEVELOPMENTS IN
THE EURO AREA
Edited byPhilippe Moutotand coordinated byDieter Gerdesmeier,Adriana Lojschová andJulian von Landesberger
Date: 15 Oct, 2007 18:15:28;Format: (420.00 x 297.00 mm);Output Profile: SPOT IC300;Preflight: Failed!