the role of pension funds in economic development & the promotion of social & economic...
TRANSCRIPT

The Role of Pension Funds in Economic Development & the promotion of Social &
Economic EqualityDr. Azar Jammine
Director & Chief Economist of Econometrix

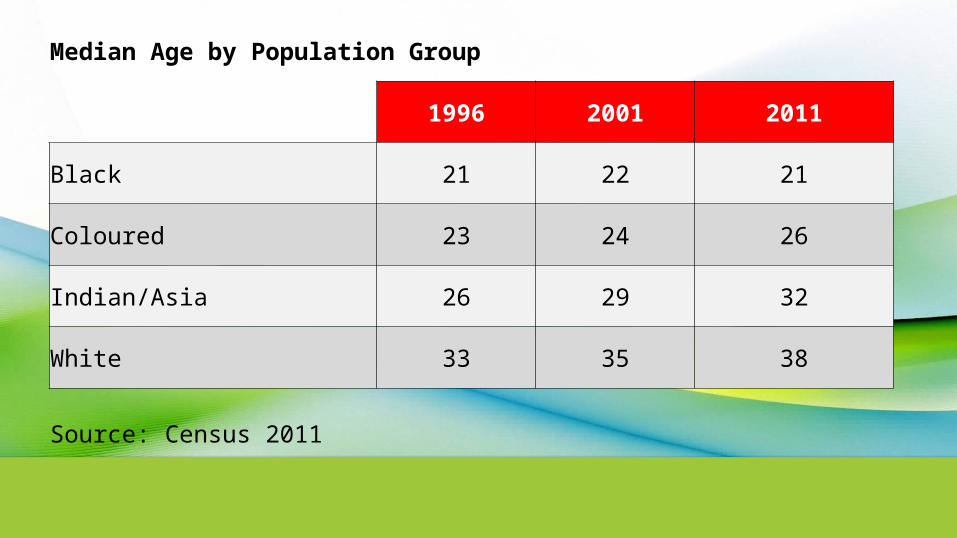
Median Age by Population Group
1996 2001 2011
Black 21 22 21
Coloured 23 24 26
Indian/Asia 26 29 32
White 33 35 38
Source: Census 2011


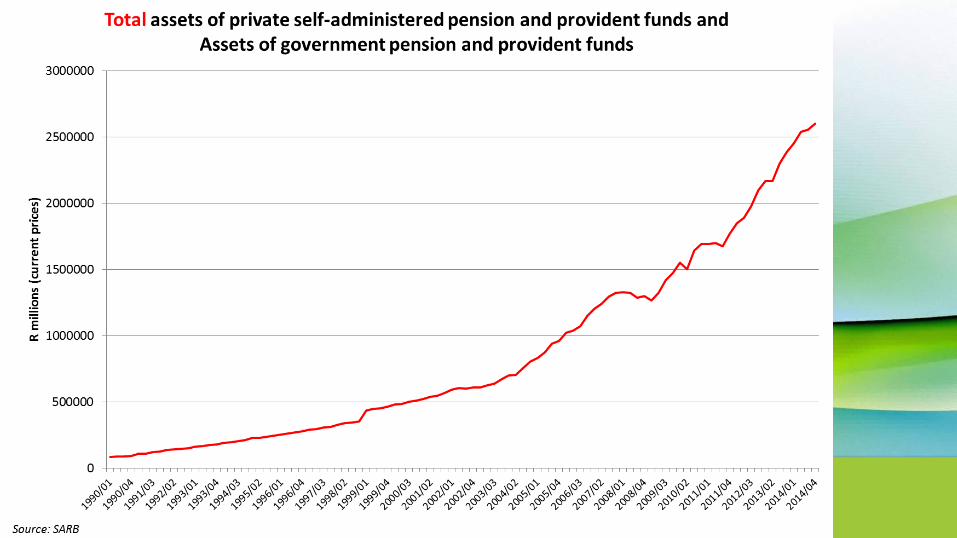
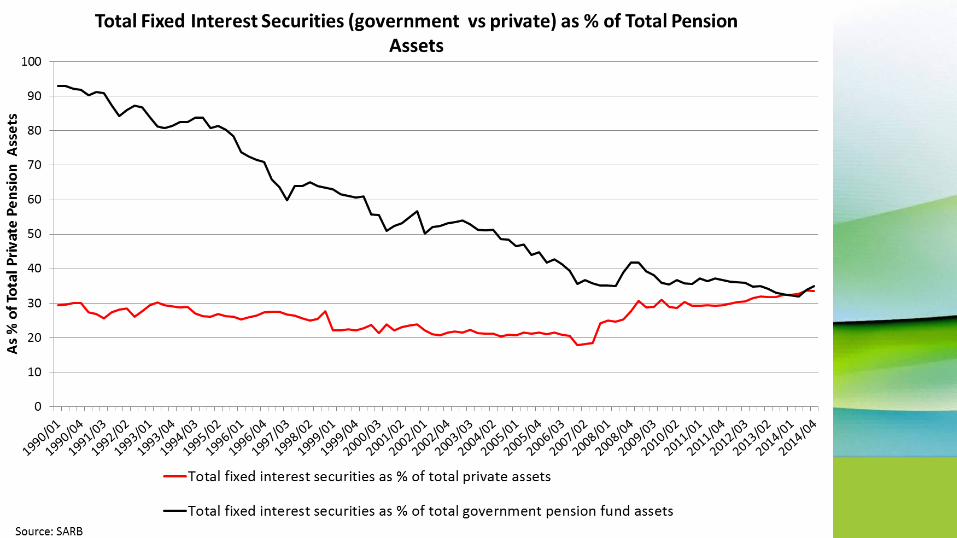
Private & Public Pensions 2014 (Assets)
R 'bn AS % of GDP AS % of GFCF
Public 1693 44.6 220.1Private 908 23.9 118Total 2621 68.5 338.1
Private & Public Pensions 2014 (Net Cash Flow)
R 'bn As % of assets As % of GDP As % of GFCF
Public 70 4.2 1.9 9.1Private 68 7.5 1.8 8.9Total 138 5.2 3.6 9.0
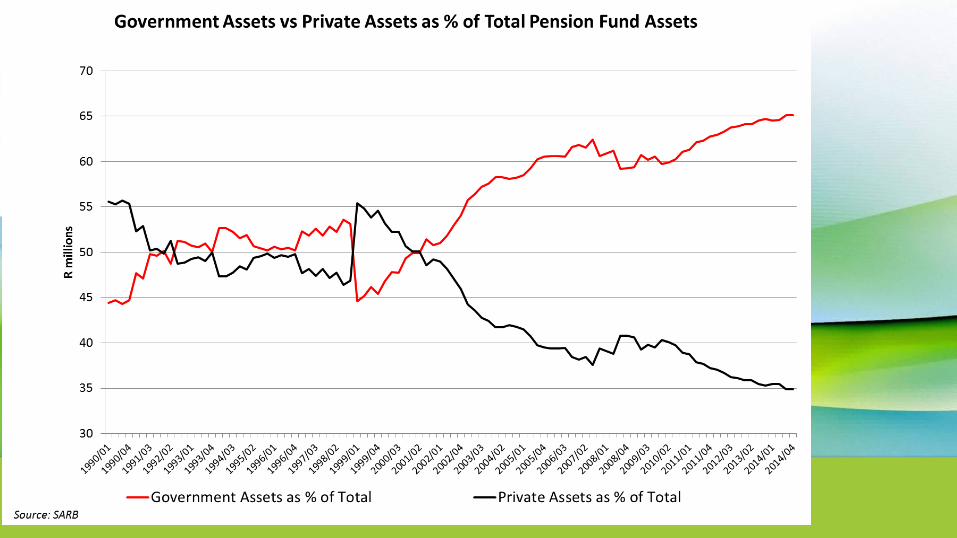
Source: SARB


Factors Affecting Business Confidence Poor education & skills development outcomes Tense industrial relations & strike threats Concerns about electricity outages & energy security Xenophobic violence & its damaging economic effects Poor municipal service delivery & ongoing service delivery protests Poor leadership & management at many parastatals Counterproductive government policy decisions & retractions Economic costs associated with empowerment of the few via
exploitation of tendering, procurement & licensing processes Perceptions of rising corruption & cadre deployment at cost of economic
growth for all Perception by private sector that government unwilling to listen &
regards it as enemy

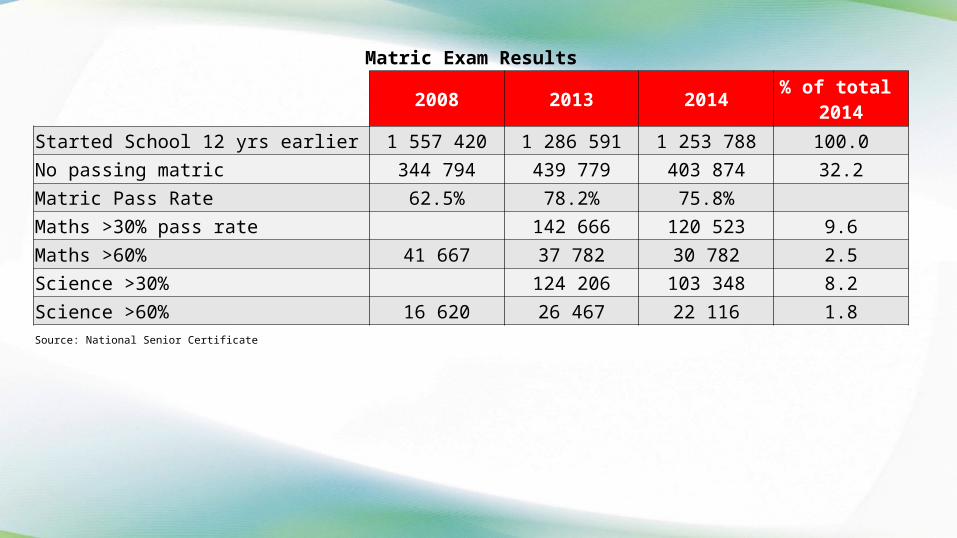
Matric Exam Results
2008 2013 2014% of total
2014
Started School 12 yrs earlier 1 557 420 1 286 591 1 253 788 100.0
No passing matric 344 794 439 779 403 874 32.2
Matric Pass Rate 62.5% 78.2% 75.8%
Maths >30% pass rate 142 666 120 523 9.6
Maths >60% 41 667 37 782 30 782 2.5
Science >30% 124 206 103 348 8.2
Science >60% 16 620 26 467 22 116 1.8Source: National Senior Certificate

Unemployment Rate by Population Group
Q4 2014 Q1 2015
Black/African 27.2 29.7
Coloured 22.9 23.3
Indian/Asian 11.9 15.7
White 7.7 7.2
TOTAL 24.3 26.4Source: Quarterly Labour Force Survey, Statistics South Africa

Educational attainment of the employed by population group, Q1 2015
Less than Matric Matric Tertiary Other
Black/African 54.8 28.0 15.8 1.3
Coloured 52.7 33.1 12.9 1.4
Indian/Asian 18.4 47.0 34.2 0.5
White 11.6 41.5 46.3 0.6
Source: Quarterly Labour Force Survey, Statistics South Africa

Expenditure of Households% of Total
2014
% of Total Black Other
R0-R399 4.2 5.0 0.7R400-R799 8.3 9.9 1.5R800-R1199 12.2 14.5 3.1R1200-R1799 13.8 16.1 4.5R1800-R2499 13.1 14.8 6.2R2500-R4999 17.6 18.4 14.6R5000-R9999 12.5 10.5 20.3R10000-more 15.2 8.1 44.1Total 100.0 100.0 100.0
General Household Survey, Stats SA

CPI weights by Income Group
Expenditure Quintile WeightCurrent Inflation
Rate%
1: up to R21 399 2.27 5.2
2: R21 400 up to R35 750 4.58 5.1
3: R35 751 up to R61 624 8.08 4.9
4: R61 625 up to R142 083 18.60 4.5
5: R 142 084 and more 66.47 4.6
Source: StatsSA
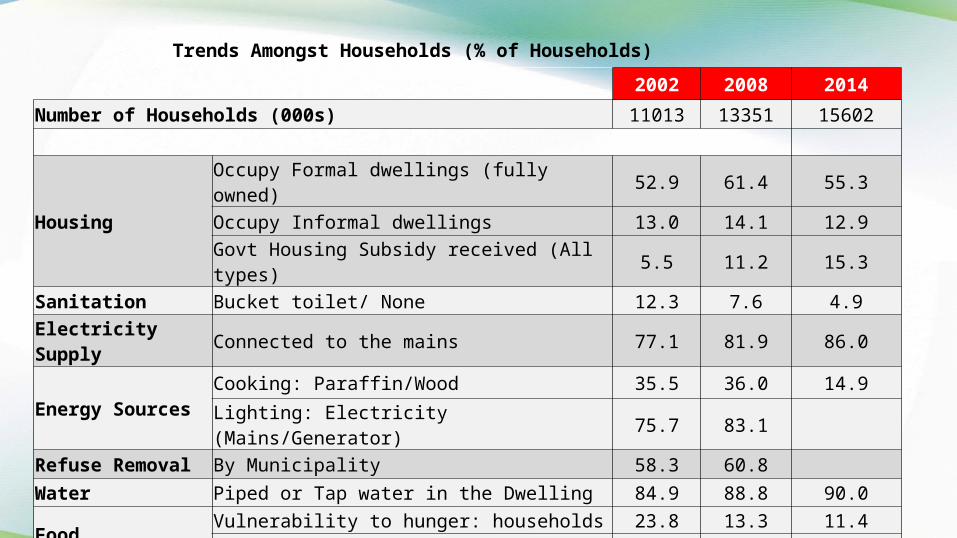
Trends Amongst Households (% of Households)
2002 2008 2014
Number of Households (000s) 11013 13351 15602
HousingOccupy Formal dwellings (fully owned) 52.9 61.4 55.3Occupy Informal dwellings 13.0 14.1 12.9Govt Housing Subsidy received (All types) 5.5 11.2 15.3
Sanitation Bucket toilet/ None 12.3 7.6 4.9Electricity Supply Connected to the mains 77.1 81.9 86.0
Energy SourcesCooking: Paraffin/Wood 35.5 36.0 14.9
Lighting: Electricity (Mains/Generator) 75.7 83.1 Refuse Removal By Municipality 58.3 60.8 Water Piped or Tap water in the Dwelling 84.9 88.8 90.0
FoodVulnerability to hunger: households 23.8 13.3 11.4Vulnerability to hunger: population 29.3 15.9 13.1
Source: General Household Survey

Audit outcomes of municipalities
Number of Municipalities
2011/12 2012/13 2013/14
Unqualified with no findings 17 30 58
Municipalities - unauthorised, irregular & wasteful expenditure
R 'bn
2011/12 2012/13 2013/14
Total unauthorised, irregular & wasteful exp 20.0 21.6 23.6
Source: Auditor Generals Report

Corruption Perception Index
2004 2009 2014 Change2009-2014Score
United Kingdom 86 77 78 United States 75 75 74 Botswana 60 56 63 Cape Verde 51 57 Seychelles 44 48 55 Mauritius 41 54 54 - Rwanda 33 49 Lesotho 33 49 Namibia 41 45 49 Ghana 36 39 48 South Africa 46 47 44 Senegal 30 30 43 Zambia 26 30 38 Egypt 32 28 37 China 34 36 36 - Malawi 28 33 33 - Ethiopia 23 27 33 Cote d'Ivoire 20 21 32 Tanzania 28 26 31 Mozambique 28 25 31 Madagascar 31 30 28 Nigeria 16 25 27 Uganda 26 25 26 Kenya 21 22 25 Congo dem. Rep 20 21 22 Zimbabwe 23 22 21 Angola 20 19 19 - Libya 25 25 18 Source: CPI
Note:* 100 (Highly Clean) and 0(Highly Corrupt) Improvement Deterioration

Dollar millionaires in South Africa
2007 2014 2007 2014
Number % of Total
Total 42 800 46 800 100 100
Whites 36 900 32 100 86.2 68.6
Indian, Asian and Coloureds 3 600 9 800 8.4 20.9
Black Africans 2 300 4 900 5.4 10.5
Source: South Africa 2015 Wealth Report by New World Wealth
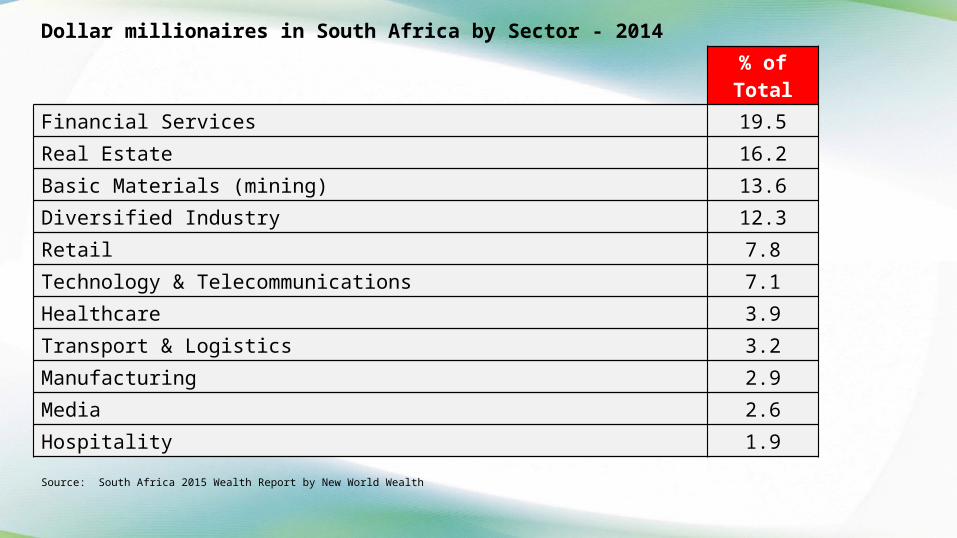
Dollar millionaires in South Africa by Sector - 2014
% of Total
Financial Services 19.5
Real Estate 16.2
Basic Materials (mining) 13.6
Diversified Industry 12.3
Retail 7.8
Technology & Telecommunications 7.1
Healthcare 3.9
Transport & Logistics 3.2
Manufacturing 2.9
Media 2.6
Hospitality 1.9
Source: South Africa 2015 Wealth Report by New World Wealth

Proportion of Population by Group
2002Actual ‘000s
2014Actual ‘000s
Change 2002-2014‘000s
2002 % of Total
2014 % of Total
Black 35474 43334 7860 78.0 80.2
Coloured 3918 4772 854 8.6 8.8
Indian 1122 1342 220 2.5 2.5
White 4555 4555 0 10.0 8.4
Total 45454 54002 8548 100 100.0
Source: Stats SA, Mid-year Population Estimates

Two seldom recognised sources of inequalityHuge Increases in Inequality Worldwide• Industrial unrest driven by increased awareness of inequality (both income & wealth)• In SA problem is more acute because of apartheid legacy• Stunning increases in income inequality worldwide (FTSE100 CEO pay 120x ave
employee earnings vs 47x 1998, Source: Manifest. Worse in US; top 1% of US workforce has captured 96% of income gains since global financial crisis)
• Has led to wealth inequality (global wealth has increased by 5.4% pa in past decade, to $241 trillion (Credit Suisse), well above global growth in GDP of 3.8%; 2/3 of adults have net wealth of < $10000)
• 32 million Dollar millionaires worldwide• 46,800 Dollar millionaires in SA• 600 high net worth individuals in SA with net worth of >$30 million (SARS)

Education disparities an obvious contributor
….but also
• Global monetary policy, especially QE (driving financial asset prices upwards more
than real economic activity; keeping real interest rates for savers exceptionally
low)
• Corporate governance insofar as determination of executive remuneration
(upward bias arises from use of remuneration agencies) – inverse correlation
between SA’s improvements in corporate governance & rise in inequality
Two seldom recognised sources of inequality


How Overvalued are Equity Markets? S&P is on a P/E ratio of 17, not excessively high yet relative to 14 average NASDAQ is on a P/E ratio of 25, compared with 193 at height of dot.com
bubble JSE Alsi is on a P/E ratio of 17 based on forecast earnings, compared with
ave P/E ratio over past 25 years, of 11.4 MSCI All Countries Index is on a P/E of 16.3, not much higher than 15.9
average over past 25 years MSCI Emerging Markets P/E is 12.7, the highest since 2010 SA equities average ratio to book value 2.4 times currently, compared with
2.0 globally and average of 2.2 over past 30 years
Conclusion: SA equities look overpriced relative to global equities, global equities expensive, but not excessively so
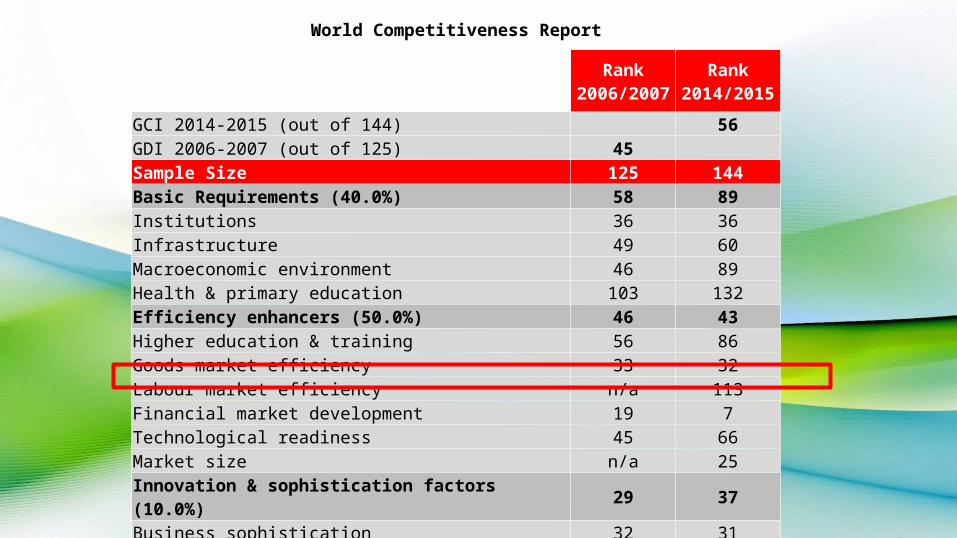
World Competitiveness Report
Rank 2006/2007
Rank 2014/2015
GCI 2014-2015 (out of 144) 56GDI 2006-2007 (out of 125) 45 Sample Size 125 144Basic Requirements (40.0%) 58 89Institutions 36 36Infrastructure 49 60Macroeconomic environment 46 89Health & primary education 103 132Efficiency enhancers (50.0%) 46 43Higher education & training 56 86Goods market efficiency 33 32Labour market efficiency n/a 113Financial market development 19 7Technological readiness 45 66Market size n/a 25Innovation & sophistication factors (10.0%) 29 37Business sophistication 32 31Innovation 29 43Source: The Global Competitiveness Report

Contradictions in the Challenge of Executive Pay• Growing recognition of pay gap between executives and workers an important contributor to increased union militancy• Especially acute problem in SA• Base pay of CEO’s much higher abroad (e.g. $12.5m in US, $7.5m in Switzerland, $3.5m in Netherlands & $2.5m in SA)• But ratio much higher in SA • Talent pool of large companies increasingly multinational• Could we ask CEO’s to close gap as part of their KPI’s• CEO’s happy to discuss but reluctant to take public position• Arithmetic problem of widening absolute gap despite differential wage increases• Growing worldwide threat of imposition of binding vote on ratio of executive to worker remuneration• Significant increase in shareholder activism, but is this not contradictory? (Shareholders want maximum returns, but reluctant for
executives to be compensated accordingly)• Publication of executive remuneration has had unintended consequences of boosting executive pay• In part a function of global loose monetary policy, which has boosted financial asset prices (boosting benefits of share incentive schemes)
& boosted financial sector at expense of others.• High executive remuneration goes hand-in-hand with huge stress levels and broken homes• Share incentive schemes become a disincentive when out-of-the-money • Moves to defer bonuses has resulted in driving up fixed pay• Share grants assume CEO’s will run businesses in interests of shareholders, but latter are “invisible” so alignment of interests need not
coincide• SOE executive remuneration and attracting appropriate candidates hugely problematical• Distortion of package comparisons by media heightens hype about the issue

Income Tax by Income Group 2014/15
Taxable BracketTaxable income
R billionNo. of Taxpayers
Proportion of Taxpayers
Proportion of Population
Proportion of Tax Paid
R70,000 - R250,000 627.8 4 472 931 63.7 8.3 12.2
R250,000 - R500,000 602.9 1 767 847 25.2 3.3 26.9
R500,000 - R1m 399.8 594 192 8.5 1.1 27.2
R1m - R1.5m 132.2 110 686 1.6 0.2 11.0
More than R1.5m 236.6 78 543 1.1 0.1 22.7
Total 1999.4 7 024 199 100.0 13.0 100.0
Source: National Treasury, Econometrix
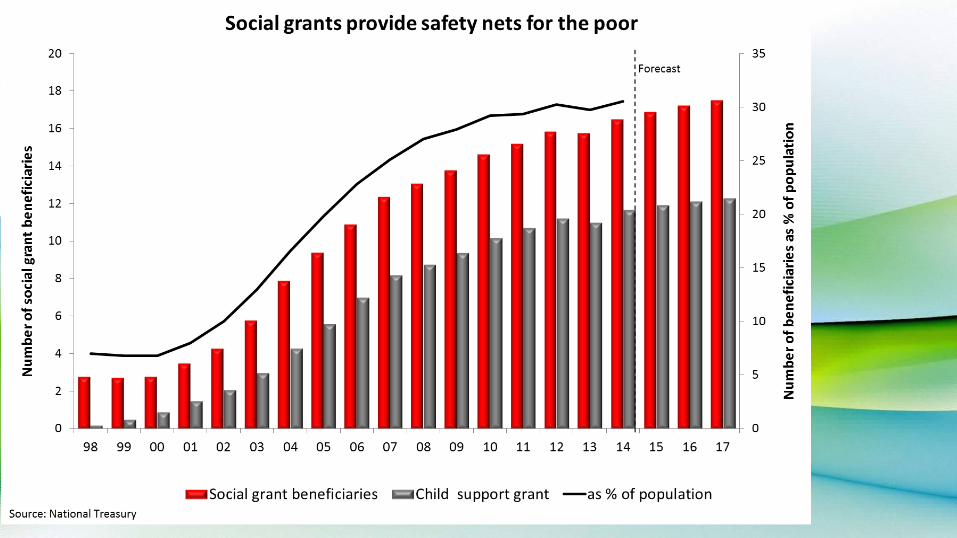

Social protection expenditure2014/15
R million As % of Total
Social protection expenditure 143 926 100
of which:
Social grants 120 702 83.9
of which:
Child support 43 428 30.2
Old-age 49 422 34.3
Disability 18 957 13.2
Foster care 5 851 4.1
Care dependency 2 259 1.6
South African Social Security Agency 6 705 4.7
Provincial social development 15 319 10.6
Total 143 926 100.0
Social grants as percentage of GDP 3.1% Source: National Treasury

Is there a case for a wealth tax to reduce income tax?• Market system cannot accommodate systemic distortions caused by QE & corporate governance
processes• The incentive to accumulate wealth is greater than the incentive to work• A regular small (percentage wise) tax on assets could pave way for reduction in income tax• SA asset base around R16 trillion (R12 trillion in financial assets & R4 trillion in property)• Capital gains tax too slow as revenue source • A 0.5% tax on net assets would raise R80bn, enough to reduce personal income tax by 15%• Challenges: government might abuse such a tax; risk of financial market downturn; it’s reliant on
honest declaration of assets; will be opposed by vested interestsBut…• It could stave off implosion of capitalism worldwide & populist revolution in SA• It is a better idea than capping executive remuneration, suggested by New Growth Path & others• Psychologically it might be more acceptable than higher income taxes• It could serve as a basis for critical economic dialogue to prevent social unrest

- Thank you -