the role of pollinator shifts in the floral
TRANSCRIPT

ORIGINAL ARTICLE
doi:10.1111/j.1558-5646.2008.00327.x
THE ROLE OF POLLINATOR SHIFTS IN THEFLORAL DIVERSIFICATION OF IOCHROMA(SOLANACEAE)Stacey DeWitt Smith,1,2,3 Cecile Ane,1,4,5 and David A. Baum1,6
1Department of Botany, University of Wisconsin, 430 Lincoln Drive, Madison, Wisconsin 537062E-mail: [email protected]
4Department of Statistics, University of Wisconsin, 1300 University Avenue, Madison, Wisconsin 537065E-mail: [email protected]: [email protected]
Received August 21, 2007
Accepted December 23, 2007
Differences in floral traits among plant species have often been attributed to adaptation to pollinators. We explored the impor-
tance of pollinator shifts in explaining floral divergence among 15 species of Iochroma. We examined four continuously varying
floral traits: corolla length, nectar reward, display size, and flower color. Pollinator associations were characterized with a contin-
uously varying measure of pollinator importance (the product of visitation and pollen deposition) for four groups of pollinators:
hummingbirds, Hymenoptera, Lepidoptera, and Diptera. A phylogenetic generalized least squares approach was used to estimate
correlations between pollinator groups and floral traits across a sample of Bayesian trees using different models of trait evolu-
tion. Multivariate analyses were also employed to identify suites of traits associated with each pollinator group. We found that
nonphylogenetic models typically fit the data better than phylogenetic models (Brownian motion, Ornstein–Uhlenbeck), and thus
results varied little across trees. Our results indicated that species with high nectar reward and large displays are significantly more
likely to be pollinated by hummingbirds and less likely to be pollinated by all groups of insects. Corolla length and flower color did
not show any consistently significant associations with pollinator groups. For these two traits, we discuss alternative evolutionary
forces, including phylogenetic inertia and community-level factors.
KEY WORDS: Floral display, flower color, nectar, PGLS, pollinators, quantitative convergence index.
Botanists have long offered adaptive explanations of floral
diversity in terms of biotic pollination (Faegri and van der Pijl
1966; Stebbins 1970). Differences in floral traits among closely
related species have been explained as adaptations to different
pollinators (e.g., Schemske and Bradshaw 1999; Muchhala 2003;
Streisfeld and Kohn 2007), whereas floral convergence has been
tied to parallel adaptation to the same pollinators (e.g., Schemske
1981; Patterson and Givnish 2004; Whittall et al. 2006). The
latter phenomenon has been formalized as pollination syndromes,
3Current address: Department of Biology, Box 90338, Duke Univer-
sity, Durham, North Carolina 27708
wherein suites of floral characters are associated with different
modes of pollination (Faegri and van der Pijl 1966). Despite
ongoing debate over the relevance of pollination syndromes
(Herrera 1996; Ollerton 1996; Waser et al. 1996), the concept
continues to serve as the overarching framework for many studies
of floral diversity (Johnson and Steiner 2000; Kay and Schemske
2003; Fenster et al. 2004).
The basic assumptions underlying the pollination syndrome
framework have been largely supported by empirical studies.
Pollinators have been shown to exert selection pressure on a
wide array of floral traits such as flower color, corolla shape,
and nectar reward (Galen 1989; Cresswell and Galen 1991;
1C© 2007 The Author(s). Journal compilation C© 2007 The Society for the Study of Evolution.Evolution

STACEY DEWITT SMITH ET AL.
Melendez-Ackerman et al. 1997). Moreover, different functional
groups of pollinators (sensu Fenster et al. 2004) can select in differ-
ent directions, theoretically generating fitness trade-offs (Aigner
2001). Although pollinator-mediated trade-offs for floral traits
have been hard to demonstrate (Wilson and Thomson 1996;
Castellanos et al. 2004; Aigner 2005), several studies provide
compelling evidence for the importance of pollinators in adaptive
divergence of flower color and form (Schemske and Bradshaw
1999; Muchhala 2007).
The role of pollinators in floral evolution has been explored
to a lesser extent with phylogenetic approaches. Several studies
have reconstructed the evolution of floral traits and discussed their
relationship to pollinators (e.g., Hapeman and Inoue 1997; John-
son et al. 1998; Kay et al. 2005; Perez et al. 2006), but these
failed to include any statistical analyses to quantify the relation-
ship. To our knowledge, the series of Dalechampia studies by
Armbruster (1996, 2002) represents the only previous attempt to
use direct observations of pollinators (rather than inferences from
floral biology) and phylogenetically corrected statistical analyses
to examine this association. Although the Dalechampia studies
provide an excellent example of using a phylogenetic approach to
test hypotheses about floral adaptation, the system is somewhat
limited in that all species are bee-pollinated and thus may not ex-
hibit the range of variation thought to be associated with different
pollination syndromes.
Here we take a comparative approach to estimate correla-
tions between several groups of pollinators and floral traits using
14 species of Iochroma and the nested monotypic genus Acnistus.
Previous phylogenetic studies in Iochrominae, a clade of around
35 predominantly Andean species, have shown that members of
Iochroma are divided among three clades (Smith and Baum 2006).
Our sampling was concentrated in the “ACLF” subclade (sensu
Smith and Baum 2006), a group of 16 species that exhibits dra-
matic diversity in flower form and color (Fig. 1). The combination
of a moderate number of species with a well-resolved phylogeny
and a wide diversity of floral traits makes this an ideal group for
testing the role of pollinators in floral diversification.
We focused on four floral traits: corolla length, flower color,
nectar reward and display size. Variation in corolla tube length,
which affects both access to reward and pollen deposition/receipt,
has been related to differences in the length of animal feeding
apparatuses (e.g., Nilsson 1988; Schemske and Horvitz 1989).
Shallower flowers are often associated with pollination by bees
and flies whereas deeper flowers can only be accessed by polli-
nators with comparably long mouthparts, such as hummingbirds
and moths (Faegri and van der Pijl 1966; Whittall and Hodges
2007). Flower color is involved in signaling to pollinators, with the
classic prediction being that bird-pollinated flowers reflect longer
wavelengths (especially red) than most insect-pollinated flowers
(Stiles 1976; Altshuler 2003). Although the importance of par-
ticular colors in attracting different pollinators remains a source
of contention (Chittka and Waser 1997), the assumption that red
flowers indicate bird pollination remains common (e.g., Harrison
et al. 1999; Dressler et al. 2004). Reward type and size are impor-
tant in determining and maintaining interactions between plants
and their pollinators (Armbruster 1993; Goldblatt and Manning
2006), with the most consistent pattern being a positive correlation
between the energetic needs of pollinators and the energy content
of the reward (Heinrich and Raven 1972). Although display size
is not a trait commonly included in pollination syndromes, it has
well-documented effects on pollinator visitation rate (Brody and
Mitchell 1997; Galloway et al. 2002), and recent work reveals
that different pollinator groups respond differently to variation in
display (Thompson 2001). Here we were particularly interested
in the possibility that species with low reward flowers may attract
hummingbirds by producing large displays (Feinsinger 1976). Al-
though there are clearly many additional traits that could have been
chosen for study, these four have all been featured in the pollina-
tion literature, and together they encompass much of the floral
diversity in Iochroma.
We consider pollination system as a continuous trait, where
each species receives varying contributions to pollination by dif-
ferent groups of animals. Visitors to Iochroma were classed into
four functional groups: hummingbirds, Hymenoptera (bees and
wasps), Lepidoptera (moths and butterflies), and Diptera (flies);
the importance of each group was estimated from field studies (S.
D. Smith, S. J. Hall, P. R. Izquierdo, and D. A. Baum, unpubl.
ms.). We estimate single and multiple correlations between the
continuously varying pollinator importance values and the floral
traits using phylogenetic generalized least squares (PGLS) with
an Ornstein–Uhlenbeck (OU) model of trait evolution (Garland
et al. 1993; Martins and Hansen 1997). As the amount of observed
phylogenetic signal (similarity due to shared history) varies across
traits and lineages, so does the need for phylogenetic correction
in comparative analyses (Blomberg et al. 2003). We chose the
PGLS approach because it allows us to directly compare analyses
assuming different levels of phylogenetic signal by varying the pa-
rameters of the OU model. Using the Akaike Information Criterion
(AIC) as a measure of model fit, we simultaneously determine the
appropriate level of phylogenetic signal and the best estimates of
the parameters of interest, namely the correlations between polli-
nator groups and floral traits. Applying this process to multivariate
analyses, we identify suites of floral traits significantly associated
with different pollination systems across Iochroma.
Materials and MethodsSTUDY TAXA AND PHYLOGENETIC RELATIONSHIPS
Fifteen species within Iochrominae were selected for this study.
The taxon sampling encompasses 13 of 16 species in the core
clade of the iochromas (ACLF clade sensu Smith and Baum 2006),
2 EVOLUTION 2008

THE ROLE OF POLLINATOR SHIFTS IN THE FLORAL DIVERSIFICATION
Figure 1. Phylogenetic relationships and floral trait diversity in Iochroma. The topology shown is a consensus tree from Bayesian analysis
of the three-gene dataset (Smith and Baum 2006) pruned to show only the 15 taxa studied here with all compatible groupings included.
Branches with greater than 95% posterior probability are bolded. Flowers for each species are shown to scale. The droplet and star
symbols indicate reward per flower and display size, respectively, with darker shading showing higher values. The pie-graphs show
proportion of pollinator importance from each of the four groups: hummingbirds (white), hymenopterans (light gray), lepidopterans
(dark gray), and dipterans (black) (See Table 1).
which includes the nested monotypic Acnistus arborescens. One
of these species, I. peruvianum, was previously known only from
the type specimen, and its determination remains tentative. An-
other species, I. stenanthum, is suspected to have some hybrid
ancestry based on its morphological features. However, we chose
to include it because its phylogenetic position was not strongly
contested by independent loci (Smith and Baum 2006). We also
sampled one representative of the sister clade (I. parvifolium) and
one more distantly related species (I. umbellatum) to serve as an
outgroup.
Phylogenetic relationships among the 15 study taxa follow
the analysis of Smith and Baum (2006), which used three nuclear
genes: the internal transcribed spacer (ITS), the second intron of
LEAFY (LFY), and exons 2–9 of the granule-bound starch syn-
thase gene (waxy). For this study, we extracted 500 trees from
Bayesian analysis of the combined three-gene dataset, by sam-
pling every 500 generations after burn-in. Adequate mixing dur-
ing the runs and convergence among independent runs (Smith
and Baum 2006) suggest that these post–burn-in trees represent a
reasonable sample of the posterior distribution of trees. The trees
EVOLUTION 2008 3

STACEY DEWITT SMITH ET AL.
were pruned to include only the 15 studied species while retaining
the total path length between each species in each tree. The 500-
tree sample was used in two sets of analyses. First, we used the
trees to estimate the Quantitative Convergence Index (QVI) for
our characters of interest (see Analysis of trait convergence). Sec-
ond, we conducted PGLS analyses on the 500 trees to examine the
sensitivity of the single and multiple correlations to phylogenetic
uncertainty (see Correlation analyses).
POLLINATION ECOLOGY
Field studies were conducted in Ecuador and Peru to character-
ize the importance of groups of pollinators to each species (S. D.
Smith, S. J. Hall, P. R. Izquierdo, and D. A. Baum, unpubl. ms.).
Pollinators were clustered in four major groups (hummingbirds,
hymenopterans, lepidopterans, and dipterans), which seem to en-
compass the principal functional groups (sensu Fenster et al. 2004)
of visitors to Iochroma species. Hummingbird visitors probed
Iochroma flowers for nectar, accumulating pollen on their beaks
as they probed. The hymenopteran pollinators were mainly honey
bees (Apis mellifera) and wasps, which crawled around the open-
ing of the corolla and sometimes down into the tube, foraging
for pollen and nectar. Most dipteran visitors were syrphid flies,
which landed at the mouth of the corolla, probing for nectar, and
consuming pollen. Moths and butterflies both occasionally for-
age, for nectar on Iochroma species although, for the two species
with substantial lepidopteran pollination, A. arborescens and I.
ellipticum, all of the lepidopteran visitors were moths.
The visitation rate for each pollinator group was estimated
from field observations, in which we recorded the number of
flower visits per flower per hour (Dafni 1992). Pollinator im-
portance was quantified as the product of the visitation rate of
a pollinator group and the proportion of ovules potentially pol-
linated per visit by a member of that group (maximum = 1.0).
This proportion was calculated by comparing the average num-
ber of ovules per flower of each species to the amount of pollen
deposited on a single visit by a given pollinator to that species.
Although the relationship between pollen deposition and seed set
is not known in Iochroma, studies in other taxa indicate that at
least as many pollen grains as ovules are required to achieve max-
imal seed set (Silander and Primack 1978; Snow 1982). Choosing
higher thresholds for effective pollination (e.g., twice the number
of ovules) as observed in some species (Kohn and Waser 1985)
would have little effect on the estimated importance because most
legitimate pollinators deposited several times more pollen grains
than there were ovules present (S. D. Smith, S. J. Hall, P. R.
Izquierdo, and D. A. Baum, unpubl. ms.).
FLORAL TRAITS
Nectar measurements were collected in the plant populations
used for pollinator observations. Nectar was sampled from 10 to
40 bagged, first- and second-day flowers. Reward per flower was
calculated as the product of nectar volume and sugar concentra-
tion measured in the field (S. D. Smith, S. J. Hall, P. R. Izquierdo,
and D. A. Baum, unpubl. ms.). Display size, the number of open
flowers on a plant, was also estimated in the field by averaging
across the individuals used for pollinator observations.
Corolla length data for each species was collated from herbar-
ium specimens and the taxonomic literature (Leiva 1995; Leiva
et al. 1998; Shaw 1998; Hunziker 2001). When a range of val-
ues was presented in the taxonomic descriptions, the midpoint
value was used. For I. peruvianum, a poorly known species, the
mean corolla length was obtained by averaging across herbarium
collections from the study site and nearby localities (n = 6).
Flower color was characterized through analysis of standard-
ized reflectance spectra. Raw reflectance measurements, in 3.3 nm
segments from 400 nm to 700 nm were collected with a Unispec
spectrometer (PP Systems, Inc., Amesbury, MA) with a built-in
7.0 W halogen light source (shorter wavelengths could not be col-
lected by this equipment). Fresh corolla tissue to be measured
was placed in a standard-clip, which holds the fiber-optic cable
(light output and input) at a fixed 60◦ angle and excludes ambient
light. The tissue was sampled from the midpoint of the corolla
tube, and measurements were taken with the exterior (abaxial sur-
face) oriented toward the fiber optic. One first-day flower from the
plant sampled as the voucher specimen for each study population
(Smith 2006) was used for the measurements. Each measurement
was done three times to ensure that the reading was repeatable.
In the rare case that it was not repeatable, a new flower was used.
Standardized reflectance spectra were calculated by dividing the
amount of light reflected by corolla tissue in each 3.3 nm segment
by that reflected by a Spectralon white standard (Labsphere, North
Sutton, NH).
Variation in reflectance spectra across species was summa-
rized using segment classification (Endler 1990). This system di-
vides color into brightness, chroma, and hue. Brightness is the total
visible light reflected, that is the total area under the reflectance
curve from 400 to 700 nm. Chroma is√
(R − G)2 + (Y − B)2,
where B is the proportion of total brightness occurring between
400 and 475nm, G is the proportion between 475 and 550 nm, Y
is the proportion between 550 and 625, and R is the proportion be-
tween 625 and 700 nm. Hue is calculated as arcsine ( Y−BC ),where
C is chroma.
COMPARATIVE ANALYSES
Analysis of trait convergenceAs an initial assessment of phylogenetic signal in the floral traits
and pollinator importance values, we computed their QVI (Ack-
erly and Donoghue 1998). QVI provides a measure of homoplasy
in a continuous character across a phylogeny, analogous to the re-
tention index for discrete characters (Farris 1989). It ranges from
4 EVOLUTION 2008

THE ROLE OF POLLINATOR SHIFTS IN THE FLORAL DIVERSIFICATION
0 to 1, with higher values signifying higher convergence, that is,
greater similarities among distantly related species. We used the
program CACTUS (Schwilk and Ackerly 2001) to compute QVI
for the pollinator importance values and floral traits on 500 trees
extracted from the Bayesian posterior of the combined three-gene
analysis. To test the hypothesis that the observed QVI is less than
expected by chance (i.e., that the traits exhibit some phylogenetic
autocorrelation), we permuted the character values for each trait
across taxa 1000 times to produce null distributions for each tree,
and compared the observed to the null distributions using a one-
tailed test of significance, as implemented in CACTUS.
Correlation analysesA variety of comparative methods have been proposed to accom-
modate the fact that species cannot be viewed as independent
datapoints due to their shared evolutionary history. Here we used
a PGLS approach with an Ornstein–Uhlenbeck (OU) model of
trait evolution to estimate correlations between pollinators and
floral traits while accounting for phylogeny (see Appendix). First
proposed by Grafen (1989), PGLS generalizes the independent
contrasts approach and can be used to incorporate a variety of
models of evolutionary change (Martins and Hansen 1997). Un-
like the Brownian motion model, which assumes that trait vari-
ation increases linearly along the phylogeny (Felsenstein 1985),
the OU model assumes that trait evolution is constrained as might
be expected for traits under stabilizing selection, and the level
of constraint is determined by the OU parameter � (Martins and
Hansen 1997). As in an increasing number of comparative studies
(e.g., Ives and Godfray 2006; Ord and Martins 2006), we used the
OU model here as a flexible approach for exploring the effects
of assuming different levels of phylogenetic signal (Blomberg
et al. 2003). When the OU parameter � is zero (assuming strong
phylogenetic signal), the model is equivalent to Brownian mo-
tion and covariance in trait values between any two species is
linearly related to their shared branch length. With higher values
of � (lower phylogenetic signal), the expected similarity between
any pair of taxa exponentially decreases with increasing phyloge-
netic distance. As � approaches infinity, the OU model reduces
to a nonphylogenetic “TIPS” model in which the trait values are
independent of the tree.
In phylogenetic regression and correlation analyses with the
OU model (Martins and Hansen 1997), a selected value of � and
a phylogeny with branch lengths are used to produce a variance–
covariance matrix that describes the expected similarity in trait
values due to phylogenetic relatedness (see Appendix). The ob-
served trait values can then be transformed with this matrix before
analyses to account for phylogenetic dependence. Because we do
not know a priori how strongly the trait values depend on phy-
logeny, we explored a range of values of � (0, 10, 100, ∞). To
make the results fully comparable across models, we used a fixed
parameter value at the root (see Appendix). Because � acts as a
transformation of the branch lengths, the effect of a chosen value
of � will depend on the phylogenetic tree. Based on the branch
lengths in the Iochroma phylogeny, � values of 10 and 100 were
chosen as intermediates between Brownian motion (� = 0) and
TIPS (� = ∞) (see Appendix).
Correlation analyses incorporating the OU variance–
covariance matrix were used to estimate single and multiple corre-
lations between each group of pollinators and floral traits. Analy-
ses were conducted using the APE (Paradis et al. 2004) and MASS
(Venables and Ripley 2002) packages in R (R Development Core
Team 2005). We estimated correlations among variables instead
of regression coefficients because all of the variables under con-
sideration were random, and we did not want to assume that any
is causally dependent on any other (Sokal and Rohlf 1995). As
standard parametric statistical analyses, including regression and
correlation, assume that data are normally distributed, we cre-
ated quantile–quantile plots for each variable and assessed the
need for transformation before undertaking any analyses. The rel-
ative pollinator importance values, estimated as proportions, were
arcsine-square root transformed to produce a more normal distri-
bution, display size and chroma were log transformed, and reward
per flower was square-root transformed. The remaining variables
were analyzed without transformation.
To explore the effect of phylogenetic uncertainty on the cor-
relations, we repeated these analyses on the sample of 500 trees
from Bayesian analysis of the combined three-gene dataset (Smith
and Baum 2006). For the pairwise analyses, we computed the cor-
relation coefficient between each pollinator group and each trait
separately using the four values of � for each of the 500 trees. We
used AIC scores (Akaike 1974) to examine the model fit across
trees and values of �. The value of � that resulted in the lowest AIC
score on the majority of trees was judged to be optimal, and the
mean correlation with this � across all trees was taken as the best
estimate of the correlation. We removed the tails of the distribu-
tion (highest and lowest 2.5% of trees) to produce a 95% interval
around this correlation estimate. Although this interval accounts
for uncertainty in the tree topology and branch lengths, it does not
account for other possible sources of error (measurement error,
stochastic variation).
Next, we used multiple correlation analyses to determine
which sets of floral characters jointly explain the largest amount
of variance in pollinator importance values. We used a two-step
procedure to eliminate floral traits from the model for each pol-
linator group for each value of �. First, we used stepwise model
selection (stepAIC function in R) to eliminate variables from the
full set (a pollinator group regressed on all floral traits), repeat-
ing for each of the 500 trees. Those variables (floral traits) that
were retained by the majority of trees for a given value of � were
kept, and the multiple correlation analysis was repeated, using
EVOLUTION 2008 5

STACEY DEWITT SMITH ET AL.
the same reduced set of variables for all trees. Because variables
with intermediate partial correlations (0.20–0.40) were not con-
sistently retained or lost across all the trees during stepwise model
selection, this two-step procedure ensured that the same param-
eters were computed and summarized across all trees. However,
it remains possible that different sets of variables will be retained
when different values of � are used.
Comparing across values of �, we chose the value that gave
the lowest AIC score for the majority of trees, and we consid-
ered the mean partial correlations across the trees with this value
of � as the best estimates of these correlations. The partial cor-
relations we present are marginal, that is, corrected for all other
floral traits retained in the model. Again we pruned the extremes
of the distribution across trees to produce a 95% interval for each
partial correlation. Although these sets of analyses entail many
correlation estimates, the selection of a single multivariate model
per pollinator group reduces the potential issue of multiple tests.
ResultsFLORAL AND POLLINATION DATA
Pollinator variables and floral traits are given in Table 1. The
only missing data were the reflectance spectra for the Galapagos
endemic I. ellipticum. Because the methods of analysis used here
are not equipped to deal with missing data, the creamy flowers of I.
ellipticum were given intermediate color values between the white
flowers of A. arborescens and the more yellowish-white flowers
of I. confertiflorum. Because both species are closely related to
I. ellipticum, this extrapolation should have minimal effect on
phylogenetic correlations. The standardized reflectance curves are
shown in online Supplementary Figure S1.
Variation was observed in all traits of interest (Table 1).
Pollination systems vary from entirely insect to entirely bird,
with many species tending toward the latter. Average corolla
length showed approximately sixfold variation across the sampled
species (0.95 cm in A. arborescens to 5.75 cm in I. calycinum),
display size (number of flowers per plant) varied 24-fold, and re-
ward per flower (nectar volume × concentration) nearly 80-fold.
The wide range in chroma, hue, and brightness reflected diversity
of flower colors among the studied taxa (Fig. 1).
TRAIT CONVERGENCE
Table 2 summarizes the observed QVIs for each trait across the
500 Bayesian trees and the expected QVIs if the trait values were
unrelated to the phylogeny. Average QVI values for pollinator
importance ranged from 0.78 to 1.00 and were indistinguish-
able from the expected (random) distribution (P = 0.17–0.81),
suggesting little phylogenetic autocorrelation. Most of the floral
traits had similarly high QVI values that were not significantly
different from that expected by chance (Table 2). Only corolla Tab
le1.
Polli
nat
or
imp
ort
ance
and
flo
ralt
rait
sva
lues
for
stu
dy
taxa
.Det
ails
of
dat
aco
llect
ion
des
crib
edin
the
met
ho
ds.
Spec
ies
Hum
min
gbir
dH
ymen
opte
ran
Lep
idop
tera
nD
ipte
ran
Cor
olla
Nec
tar
rew
ard
Dis
play
Chr
oma
Hue
Bri
ghtn
ess
impo
rtan
ceim
port
ance
impo
rtan
ceim
port
ance
leng
th(c
m)
per
flow
ersi
ze
A.a
rbor
esce
ns0.
000.
190.
210.
600.
950.
1121
.40.
1369
.58
0.24
I.ca
lyci
num
0.74
0.20
0.00
0.06
5.75
5.68
29.8
0.09
9.10
0.06
I.co
nfer
tifl
orum
0.78
0.19
0.03
0.00
2.25
3.78
112.
20.
1779
.49
0.42
I.co
rnif
oliu
m0.
960.
040.
000.
003.
506.
9187
.00.
1259
.65
0.16
I.cy
aneu
m0.
840.
140.
020.
003.
254.
0941
.50.
1746
.96
0.16
I.ed
ule
0.99
0.01
0.01
0.00
2.10
2.26
311.
20.
3550
.78
0.23
I.el
lipt
icum
0.00
0.38
0.38
0.23
2.75
0.20
50.0
0.15
74.5
30.
33I.
fuch
sioi
des
0.70
0.24
0.07
0.00
2.50
5.24
79.2
0.50
24.5
20.
25I.
gesn
erio
ides
0.90
0.06
0.04
0.00
3.25
1.67
505.
00.
1824
.42
0.10
I.lo
xens
e0.
890.
110.
000.
003.
508.
7112
0.3
0.18
80.7
70.
28I.
parv
ifol
ium
0.70
0.30
0.00
0.00
2.25
3.50
98.0
0.05
5.59
0.04
I.cf
.per
uvia
num
0.44
0.56
0.00
0.00
1.57
1.44
85.0
0.13
44.9
00.
18I.
lehm
anni
i0.
990.
010.
000.
002.
751.
8727
5.0
0.20
69.2
60.
34I.
sten
anth
um0.
990.
010.
000.
003.
954.
2120
9.3
0.07
10.7
00.
19I.
umbe
llat
um0.
320.
670.
010.
001.
750.
3980
.50.
1196
.02
0.11
6 EVOLUTION 2008
THE ROLE OF POLLINATOR SHIFTS IN THE FLORAL DIVERSIFICATION
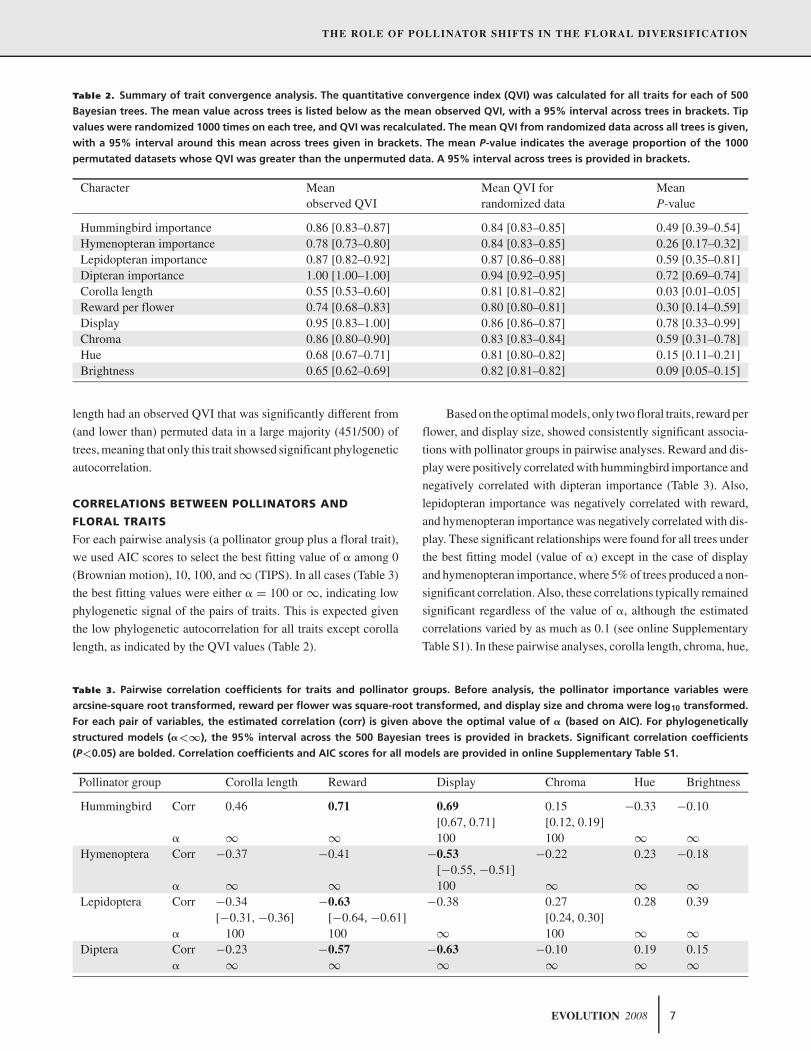
Table 2. Summary of trait convergence analysis. The quantitative convergence index (QVI) was calculated for all traits for each of 500
Bayesian trees. The mean value across trees is listed below as the mean observed QVI, with a 95% interval across trees in brackets. Tip
values were randomized 1000 times on each tree, and QVI was recalculated. The mean QVI from randomized data across all trees is given,
with a 95% interval around this mean across trees given in brackets. The mean P-value indicates the average proportion of the 1000
permutated datasets whose QVI was greater than the unpermuted data. A 95% interval across trees is provided in brackets.
Character Mean Mean QVI for Meanobserved QVI randomized data P-value
Hummingbird importance 0.86 [0.83–0.87] 0.84 [0.83–0.85] 0.49 [0.39–0.54]Hymenopteran importance 0.78 [0.73–0.80] 0.84 [0.83–0.85] 0.26 [0.17–0.32]Lepidopteran importance 0.87 [0.82–0.92] 0.87 [0.86–0.88] 0.59 [0.35–0.81]Dipteran importance 1.00 [1.00–1.00] 0.94 [0.92–0.95] 0.72 [0.69–0.74]Corolla length 0.55 [0.53–0.60] 0.81 [0.81–0.82] 0.03 [0.01–0.05]Reward per flower 0.74 [0.68–0.83] 0.80 [0.80–0.81] 0.30 [0.14–0.59]Display 0.95 [0.83–1.00] 0.86 [0.86–0.87] 0.78 [0.33–0.99]Chroma 0.86 [0.80–0.90] 0.83 [0.83–0.84] 0.59 [0.31–0.78]Hue 0.68 [0.67–0.71] 0.81 [0.80–0.82] 0.15 [0.11–0.21]Brightness 0.65 [0.62–0.69] 0.82 [0.81–0.82] 0.09 [0.05–0.15]
length had an observed QVI that was significantly different from
(and lower than) permuted data in a large majority (451/500) of
trees, meaning that only this trait showsed significant phylogenetic
autocorrelation.
CORRELATIONS BETWEEN POLLINATORS AND
FLORAL TRAITS
For each pairwise analysis (a pollinator group plus a floral trait),
we used AIC scores to select the best fitting value of � among 0
(Brownian motion), 10, 100, and ∞ (TIPS). In all cases (Table 3)
the best fitting values were either � = 100 or ∞, indicating low
phylogenetic signal of the pairs of traits. This is expected given
the low phylogenetic autocorrelation for all traits except corolla
length, as indicated by the QVI values (Table 2).
Table 3. Pairwise correlation coefficients for traits and pollinator groups. Before analysis, the pollinator importance variables were
arcsine-square root transformed, reward per flower was square-root transformed, and display size and chroma were log10 transformed.
For each pair of variables, the estimated correlation (corr) is given above the optimal value of � (based on AIC). For phylogenetically
structured models (�<∞), the 95% interval across the 500 Bayesian trees is provided in brackets. Significant correlation coefficients
(P<0.05) are bolded. Correlation coefficients and AIC scores for all models are provided in online Supplementary Table S1.
Pollinator group Corolla length Reward Display Chroma Hue Brightness
Hummingbird Corr 0.46 0.71 0.69 0.15 −0.33 −0.10[0.67, 0.71] [0.12, 0.19]
� ∞ ∞ 100 100 ∞ ∞Hymenoptera Corr −0.37 −0.41 −0.53 −0.22 0.23 −0.18
[−0.55, −0.51]� ∞ ∞ 100 ∞ ∞ ∞
Lepidoptera Corr −0.34 −0.63 −0.38 0.27 0.28 0.39[−0.31, −0.36] [−0.64, −0.61] [0.24, 0.30]
� 100 100 ∞ 100 ∞ ∞Diptera Corr −0.23 −0.57 −0.63 −0.10 0.19 0.15
� ∞ ∞ ∞ ∞ ∞ ∞
Based on the optimal models, only two floral traits, reward per
flower, and display size, showed consistently significant associa-
tions with pollinator groups in pairwise analyses. Reward and dis-
play were positively correlated with hummingbird importance and
negatively correlated with dipteran importance (Table 3). Also,
lepidopteran importance was negatively correlated with reward,
and hymenopteran importance was negatively correlated with dis-
play. These significant relationships were found for all trees under
the best fitting model (value of �) except in the case of display
and hymenopteran importance, where 5% of trees produced a non-
significant correlation. Also, these correlations typically remained
significant regardless of the value of �, although the estimated
correlations varied by as much as 0.1 (see online Supplementary
Table S1). In these pairwise analyses, corolla length, chroma, hue,
EVOLUTION 2008 7
STACEY DEWITT SMITH ET AL.
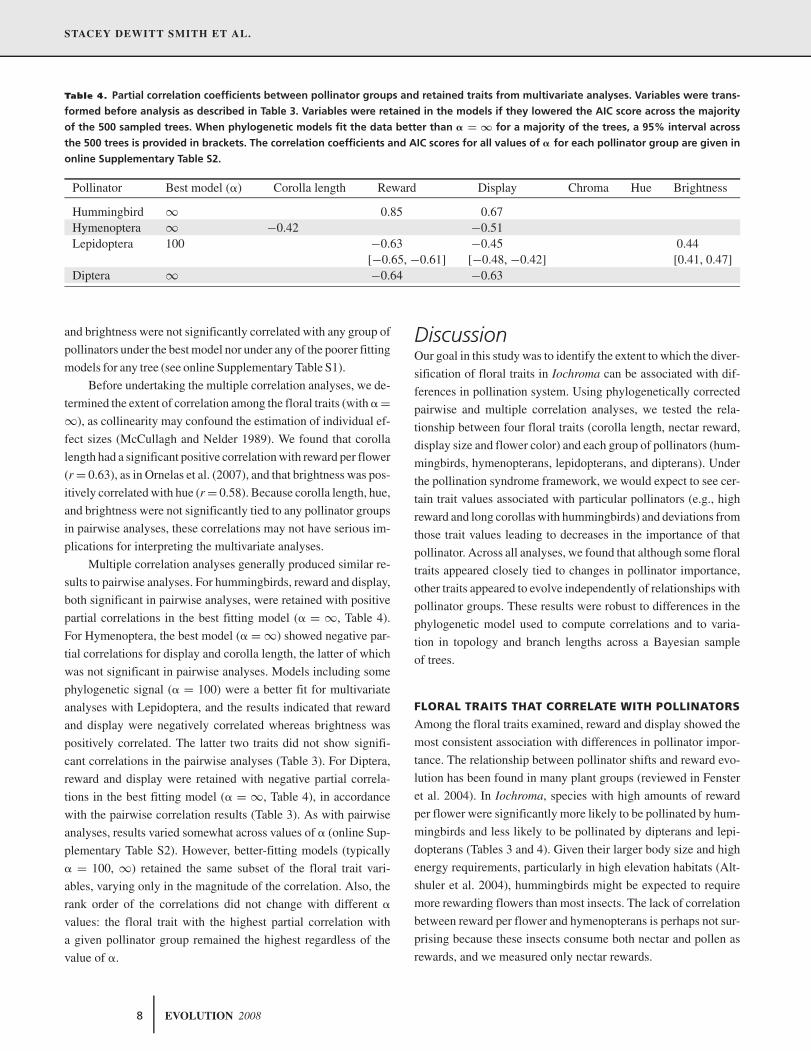
Table 4. Partial correlation coefficients between pollinator groups and retained traits from multivariate analyses. Variables were trans-
formed before analysis as described in Table 3. Variables were retained in the models if they lowered the AIC score across the majority
of the 500 sampled trees. When phylogenetic models fit the data better than � = ∞ for a majority of the trees, a 95% interval across
the 500 trees is provided in brackets. The correlation coefficients and AIC scores for all values of � for each pollinator group are given in
online Supplementary Table S2.
Pollinator Best model (�) Corolla length Reward Display Chroma Hue Brightness
Hummingbird ∞ 0.85 0.67Hymenoptera ∞ −0.42 −0.51Lepidoptera 100 −0.63 −0.45 0.44
[−0.65, −0.61] [−0.48, −0.42] [0.41, 0.47]Diptera ∞ −0.64 −0.63
and brightness were not significantly correlated with any group of
pollinators under the best model nor under any of the poorer fitting
models for any tree (see online Supplementary Table S1).
Before undertaking the multiple correlation analyses, we de-
termined the extent of correlation among the floral traits (with � =∞), as collinearity may confound the estimation of individual ef-
fect sizes (McCullagh and Nelder 1989). We found that corolla
length had a significant positive correlation with reward per flower
(r = 0.63), as in Ornelas et al. (2007), and that brightness was pos-
itively correlated with hue (r = 0.58). Because corolla length, hue,
and brightness were not significantly tied to any pollinator groups
in pairwise analyses, these correlations may not have serious im-
plications for interpreting the multivariate analyses.
Multiple correlation analyses generally produced similar re-
sults to pairwise analyses. For hummingbirds, reward and display,
both significant in pairwise analyses, were retained with positive
partial correlations in the best fitting model (� = ∞, Table 4).
For Hymenoptera, the best model (� = ∞) showed negative par-
tial correlations for display and corolla length, the latter of which
was not significant in pairwise analyses. Models including some
phylogenetic signal (� = 100) were a better fit for multivariate
analyses with Lepidoptera, and the results indicated that reward
and display were negatively correlated whereas brightness was
positively correlated. The latter two traits did not show signifi-
cant correlations in the pairwise analyses (Table 3). For Diptera,
reward and display were retained with negative partial correla-
tions in the best fitting model (� = ∞, Table 4), in accordance
with the pairwise correlation results (Table 3). As with pairwise
analyses, results varied somewhat across values of � (online Sup-
plementary Table S2). However, better-fitting models (typically
� = 100, ∞) retained the same subset of the floral trait vari-
ables, varying only in the magnitude of the correlation. Also, the
rank order of the correlations did not change with different �
values: the floral trait with the highest partial correlation with
a given pollinator group remained the highest regardless of the
value of �.
DiscussionOur goal in this study was to identify the extent to which the diver-
sification of floral traits in Iochroma can be associated with dif-
ferences in pollination system. Using phylogenetically corrected
pairwise and multiple correlation analyses, we tested the rela-
tionship between four floral traits (corolla length, nectar reward,
display size and flower color) and each group of pollinators (hum-
mingbirds, hymenopterans, lepidopterans, and dipterans). Under
the pollination syndrome framework, we would expect to see cer-
tain trait values associated with particular pollinators (e.g., high
reward and long corollas with hummingbirds) and deviations from
those trait values leading to decreases in the importance of that
pollinator. Across all analyses, we found that although some floral
traits appeared closely tied to changes in pollinator importance,
other traits appeared to evolve independently of relationships with
pollinator groups. These results were robust to differences in the
phylogenetic model used to compute correlations and to varia-
tion in topology and branch lengths across a Bayesian sample
of trees.
FLORAL TRAITS THAT CORRELATE WITH POLLINATORS
Among the floral traits examined, reward and display showed the
most consistent association with differences in pollinator impor-
tance. The relationship between pollinator shifts and reward evo-
lution has been found in many plant groups (reviewed in Fenster
et al. 2004). In Iochroma, species with high amounts of reward
per flower were significantly more likely to be pollinated by hum-
mingbirds and less likely to be pollinated by dipterans and lepi-
dopterans (Tables 3 and 4). Given their larger body size and high
energy requirements, particularly in high elevation habitats (Alt-
shuler et al. 2004), hummingbirds might be expected to require
more rewarding flowers than most insects. The lack of correlation
between reward per flower and hymenopterans is perhaps not sur-
prising because these insects consume both nectar and pollen as
rewards, and we measured only nectar rewards.
8 EVOLUTION 2008

THE ROLE OF POLLINATOR SHIFTS IN THE FLORAL DIVERSIFICATION
The importance of display size in attracting pollinators has
been confirmed by many studies although few have looked at how
different pollinator groups respond to variation in display (Thomp-
son 2001). We found that species with larger displays (more flow-
ers per plant) were more likely to be pollinated by hummingbirds,
and species with small displays were more likely to be pollinated
by insects (Tables 3 and 4; Fig. 1). This effect could result partly
from enhanced signaling to visually foraging and wide-ranging
pollinators such as hummingbirds and less so to local, possibly
olfactorily foraging, animals such as flies and moths. This pat-
tern is illustrated by A. arborescens and I. ellipticum, two species
with small displays, which produced a sweet scent and attracted
only insect pollinators (Fig. 1). The only other scented species, I.
confertiflorum, has a larger display and more reward per flower
and attracted a mix of hummingbirds and insects. The observed
correlations between pollinator groups and display size could also
relate to differences in energetic needs. The presentation of a large
number of flowers on a single plant may render the plant a more
attractive resource to a high-energy visitor. This is particularly
important for territorial hummingbirds, like those observed in this
study, because large display sizes increase the energy obtained per
guarded plant.
FLORAL TRAITS THAT DO NOT CORRELATE WITH
POLLINATORS
In contrast to the strong relationship between reward and dis-
play and pollinators, we found little evidence for correlations
between any group of pollinators and corolla length or flower
color. Although the mostly insect-pollinated species tended to
be small (e.g., I. umbellatum, A. arborescens), some insect-
pollinated species (I. ellipticum) have longer flowers than
some hummingbird-pollinated species. Also, there is substan-
tial corolla length variation among the mostly hummingbird-
pollinated species, from the small I. edule to the very long I. corni-
folium (Fig. 1). A similar lack of correlation is observed between
pollination system and flower color. Lepidopterans tended to be
associated with white-flowered species but also pollinated red
and purple flowers. Dipterans visited white- and purple-flowered
species, and hymenopterans visited all colors. Interestingly, hum-
mingbirds pollinated flowers with a wide array of colors, includ-
ing classic “bee” colors such as blue and yellow (Fig. 1). These
results contrast with the close association between color and pol-
linator identity found in some taxa (e.g., Schemske and Bradshaw
1999; Wilson et al. 2004) but corroborate the findings of several
ecological surveys of plant–pollinator interactions in the tropics
(Feinsinger 1976; Snow and Snow 1980; Momose et al. 1998;
Dziedzioch et al. 2003).
The lack of a consistent correlation between either corolla
length or flower color and pollination mode has several possi-
ble explanations: (1) these traits do not represent adaptations for
different pollination systems (nonadaptation), (2) these traits do
represent adaptations, but shifts in pollination syndrome have been
frequent relative to the rate of corolla length and color evolution
(nonequilibrium), or (3) these traits are evolving in response to fac-
tors other than (or in addition to) simple pollinator group identity,
for example community composition. We will consider how well
each of these hypotheses, in turn, explains the observed patterns
of variation in Iochroma.
NonadaptationThe adaptive significance of corolla length variation has been
extensively investigated at both the micro- and macroevolution-
ary scales. Intraspecific studies have demonstrated pollinator-
mediated selection on corolla length (Nilsson 1988; Galen and
Cuba 2001; Engel and Erwin 2003) whereas a growing number of
macroevolutionary studies have tied differences in corolla length
among species to differences in pollination system (Grant and
Temeles 1992; Whittall and Hodges 2007). Also, the rapid evo-
lutionary diminution of corolla size in selfing lineages (Ornduff
1969; Wyatt 1988) underscores the presumed cost of building
large corollas and the importance of pollinators as selective agents
on floral morphology. Considering the energetic cost associated
with large corollas and evidence of an interaction between flower
depth and pollinator mouthpart length (Nilsson 1988; Schemske
and Horvitz 1989), it is hard to imagine that corolla length is not
primarily evolving by selection.
Because of its role in signaling, flower color has also been
seen as an important trait in plant–pollinator relationships. Many
studies have reported associations between pollination mode
and particular flower colors (Grant and Grant 1965; Melendez-
Ackermann et al. 1997; Wilson et al. 2004). These associations
have often been attributed to an innate ability of particular ani-
mal groups (e.g., bees, birds) to more easily distinguish certain
colors (Raven 1972; Bleiweiss 1990), although such functional
explanations for flower color diversity remain the subject of de-
bate (Chittka and Waser 1997). Unlike the case of corolla tubes,
however, the energetic costs of a “mismatching” color may be
minimal, and thus nonadaptive evolution is a possible explanation
for a lack of correlation between pollinator group and color in
Iochroma.
NonequilibriumAnother explanation for the lack of a significant correlation be-
tween pollination groups and flower color or tube length is phylo-
genetic inertia. That is, shifts in pollination system cause changes
in the selective regime acting on flower color and tube length,
but these traits have been slow to respond to repeated and/or re-
cent pollinator shifts. This hypothesis would predict that color
and tube length would show stronger phylogenetic autocorrela-
tion than pollination system.
EVOLUTION 2008 9

STACEY DEWITT SMITH ET AL.
Corolla length had a lower QVI (0.55; P = 0.03), in other
words, greater phylogenetic autocorrelation, than pollinator im-
portance values (0.78–1.00; P = 0.26–0.99). This implies that
corolla length tends to evolve more slowly than pollinator identity.
This may seem at odds with quantitative genetic studies that have
demonstrated significant heritable variation in corolla length, im-
plying great evolvability of this trait, in a wide variety of plant taxa
(Conner and Via 1993; Mitchell and Shaw 1993; Caruso 2004).
However, there could be less genetic variation in corolla length in
Iochroma populations and/or the genetic architecture in Iochroma
could be such that genes influencing corolla length tend to have
pleiotropic effects, resulting in a reduced rate of adaptive transi-
tions. Consequently, it remains plausible that the weak correlation
between corolla length and pollinator identity could be due to a
delay in the response of floral morphology to a rapidly changing
pollination environment.
Color evolution, on the other hand, cannot easily be ex-
plained by phylogenetic inertia. Flower color variables (chroma,
hue, brightness) had mean QVI measures that were nearly as high
as those for pollinator identity and that were statistically indistin-
guishable from those expected by chance. This suggests that color
is sufficiently labile to produce a response to a change in the se-
lection regime that might accompany a pollinator shift. Thus, the
lack of an association between flower colors and pollinator groups
is not well explained by phylogenetic constraints on flower color.
Alternative drivers of adaptationThe lack of association between floral traits and pollination mode
has often led to the exploration of alternate selective agents (re-
viewed in Strauss and Whittall 2006). In the case of corolla length
many other selective factors may have contributed to interspe-
cific differences in Iochroma. For example, larger flowers may be
more likely to be attacked by herbivores (Ashman et al. 2004), and
plants with longer corollas experience increased nectar robbing
(Lara and Ornelas 2001; Urcelay et al. 2006). Although Iochroma
flowers are not typically consumed by herbivores, they do suf-
fer from nectar-robbing by bees and flower-piercing birds (S. D.
Smith, pers. obs). Thus, although the corolla may need to be suffi-
ciently long to hold an attractive reward, the benefit of additional
increases in corolla length may vary depending on the composi-
tion and abundance of the nectar robber guild. It is noteworthy that
the two longest species, I. cornifolium and I. calycinum, appear
to have evolved additional protection from nectar-robbers in the
form of greatly inflated calyces (Fig. 1).
Selective forces other than pollinators may also affect flower
color evolution. Several authors have suggested that differences
in flower color within and between species may be influenced
by indirect selection because many flower pigments are derived
from the flavonoid pathway, which also produces compounds im-
portant for defense and UV protection. For example, Armbruster
(1996, 2002) found that although blossom color in Dalechampia
did not covary with pollinators, the species with pigmented blos-
soms tended to also have pigmented vegetative tissue. Thus, he
suggested that colored blossoms may have evolved as an indirect
response to selection for pigmented stems and leaves. Iochroma
species do not produce the same pigments in vegetative tissue as
in the corolla (S. Smith, unpubl. data), making this hypothesis an
unlikely explanation for its radiation of flower colors.
Community-level factors are another potential selective
agent. Grant (1966) proposed that the convergence of North Amer-
ican hummingbird-pollinated species on red coloration is a form
of Mullerian mimicry, related to the birds’ migratory lifestyle.
By sharing a common signal (red flowers), the migrating birds
quickly learn to associate the color with reward and do not have
to learn new signals as they move to new areas. In Central and
South America where hummingbirds are resident, she suggested
that such selection for a shared signal would be absent, and that a
wider diversity of colors would be found among the hummingbird-
pollinated species. Subsequent studies have largely supported this
prediction (Feinsinger 1976; Snow and Snow 1980; Dziedzioch
et al. 2003; but see Stiles 1975), suggesting that selection for
local convergence among hummingbird flowers may be relaxed
when hummingbirds are resident. This raises the question: Could
community-level factors actively drive divergence?
In the case of Iochroma, the cooccurrence of hummingbird-
pollinated taxa and the variety of colors present in these taxa raise
the possibility of competitive interactions as drivers of diversify-
ing selection. The principally hummingbird-pollinated iochromas,
which comprise most of the flower color diversity (Fig. 1), typi-
cally occur in mid- to high-elevation Andean communities, often
containing multiple hummingbird-pollinated taxa (e.g., members
of Fuchsia, Macleania, Salvia) and in some areas, multiple species
of Iochroma. In such mixed communities, successful reproduction
is aided by the targeted movement of pollen between members of
the same species, which will be facilitated by the presence of
distinct signals. Indeed, individual hummingbirds were found to
exhibit markedly biased patterns of visitation toward particular
Iochroma species in areas of sympatry (S. D. Smith, S. J. Hall,
P. R. Izquierdo, and D. A. Baum, unpubl. ms.). It is, therefore,
plausible that color differences facilitate resource partitioning and
the resulting assortative pollen targeting.
ConclusionsAlthough we have considered the various factors that may have in-
fluenced flower color and corolla length evolution independently,
it is certainly possible that several factors are at play. In the case
of corolla length, the lack of a direct correlation with pollinator
groups may be attributable to a combination of phylogenetic in-
ertia and alternative selective forces (such as those imposed by
nectar-robbers). Although we cannot rule out the possibility of
10 EVOLUTION 2008

THE ROLE OF POLLINATOR SHIFTS IN THE FLORAL DIVERSIFICATION
nonadaptive flower color evolution, the patterns of diversifica-
tion seem most easily explained by community-level selection
for diversified signals, particularly among the species that share
hummingbird pollinators. The latter hypothesis can potentially be
examined by testing the importance of color in assortative pollen
transfer and by surveying flower color diversity in communities
containing Iochroma species.
This study, along with many others (Herrera 1996; Ollerton
1996; Waser et al. 1996; Waser 2001), suggests that the role of
pollination syndromes in floral diversification is in need of ongo-
ing reassessment. We have shown that Iochroma does not fit the
patterns predicted by the classical pollination syndromes because
only a few traits (reward and display) can be directly associated
with selection by functional groups of pollinators whereas other
traits (size and color) cannot. A full understanding of floral diver-
sity will require that we move away from viewing a flower as a
set of well-atomized traits that have each been optimized by se-
lection for current pollinators, and toward a view that includes the
possibility of functional trade-offs, nonadaptive evolution, phylo-
genetic inertia and complex interactions among cooccurring plant
species and the animals with which they live. Because of their
relative ease of study and the occurrence of both allopatric and
sympatric species, Iochroma may prove to be an excellent system
in which to further explore these interesting topics.
ACKNOWLEDGMENTSThe authors would like to thank J. W. Boughman, A. R. Ives, T. J. Givnish,B. Larget, and K. J. Sytsma for discussion; M. A. Streisfeld, P. Wilson, J.B. Whittall, and associate editor Jon Agren for useful comments on themanuscript; and T. J. Givnish for use of his spectrometer. The authors ac-knowledge financial support from the National Science Foundation grantDEB-0309310 and the UW Department of Botany O. N. Allen MemorialFund.
LITERATURE CITEDAckerly, D. D., and M. J. Donoghue. 1998. Leaf size, sapling allometry, and
Corner’s rules: phylogeny and correlated evolution in maples (Acer).Am. Nat. 152:767–791.
Aigner, P. A. 2001. Optimality modeling and fitness trade-offs: when shouldplants become pollinator specialists? Oikos 95:177–184.
———. 2005. Variation in pollination performance gradients in a Dudleyaspecies complex: can generalization promote floral divergence? Funct.Ecol. 19:681–689.
Akaike, H. 1974. A new look at the statistical model identification. IEEETrans. Automat. Control AC-19:716–723.
Altshuler, D. L. 2003. Flower color, hummingbird pollination, and habitatirradiance in four Neotropical forests. Biotropica 35:344–355.
Altshuler, D. L., R. Dudley, and J. A. McGuire. 2004. Resolution of a paradox:hummingbird flight at high elevation does not come without a cost. Proc.Natl. Acad. Sci. USA 101:17731–17736.
Armbruster, W. S. 1993. Evolution of plant pollination systems—hypothesesand tests with the neotropical vine Dalechampia. Evolution 47:1480–1505.
———. 1996. Evolution of floral morphology and function: an integratedapproach to adaptation, constraint, and compromise in Dalechampia
(Euphorbiaceae). Pp. 241–272 in D. Lloyd and S. Barrett, eds. Floralbiology. Chapman & Hall, New York, NY.
———. 2002. Can indirect selection and genetic context contribute to traitdiversification? A transition-probability study of blossom-colour evolu-tion in two genera. J. Evol. Biol. 15:468–486.
Ashman, T-L., D. H. Cole, and M. Bradburn. 2004. Sex-differential resistanceand tolerance to herbivory in a gynodioecious wild strawberry. Ecology85:2550–2559.
Bleiweiss, R. 1990. Spectral confusion by hummingbirds and the evolution ofred coloration in their flowers: a new hypothesis. Wisc. Acad. Sci. Arts.Lett. 78:33–38.
Blomberg, S. P., T. Garland, and A. R. Ives. 2003. Testing for phylogeneticsignal and comparative date: behavioral traits are more labile. Evolution57:717–745.
Brody, A. K., and R. J. Mitchell. 1997. Effects of experimental manipulation ofinflorescence size on pollination and pre-dispersal seed predation in thehummingbird-pollinated plant Ipomopsis aggregata. Oecologia 110:86–93.
Butler, M. A., and A. A. King. 2004. Phylogenetic comparative analy-sis: a modeling approach for adaptive evolution. Am. Nat. 164:683–695.
Caruso, C. M. 2004. The quantitative genetics of floral trait variation in Lo-belia: potential constraints on adaptive evolution. Evolution 58:732–740.
Castellanos, M. C., P. Wilson, and J. D. Thomson. 2004. ‘Anti-bee’ and ‘pro-bird’ changes during the evolution of hummingbird pollination in Pen-stemon flowers. J. Evol. Biol. 17:876–885.
Chittka, L., and N. M. Waser. 1997. Why red flowers are not invisible to bees.Israel J. Pl. Sci. 45:169–183.
Conner, J., and S. Via. 1993. Patterns of phenotypic and genetic correlationsamong morphological and life-history traits in wild radish, Raphanusraphanistrum. Evolution 47:704–711.
Cresswell, J. E., and C. Galen. 1991. Frequency-dependent selection and adap-tive surfaces for floral character combinations—the pollination of Pole-monium viscosum. Am. Nat. 138:1342–1353.
Dafni, A. 1992. Pollination ecology: a practical approach. Oxford Univ. Press,Oxford.
Dressler, R. L., W. M. Whitten, and N. H. Williams. 2004. Phylogenetic re-lationships of Scaphyglottis and related genera (Laeliinae:Orchidaceae)based on nrDNA ITS sequence data. Brittonia 56:58–66
Dziedzioch, C., A. D. Stevens, and G. Gottsberger. 2003. The hummingbirdplant community of a tropical montane rain forest in southern Ecuador.PLOS Biol. 5:331–337.
Endler, J. A. 1990. On the measurement and classification of color in studiesof animal color patterns. Biol. J. Linn. Soc. 41:315–352.
Engel, E. C., and R. Irwin. 2003. Linking pollinator visitation rate and pollenreceipt. Am. J. Bot. 90:1612–1618.
Faegri, K., and L. Van Der Pijl. 1966. The principles of pollination ecology.Pergamon Press, New York.
Farris, J. S. 1989. The retention index and homoplasy excess. Syst. Zool.38:406–407.
Feinsinger, P. 1976. Organization of a tropical guild of nectarivorous birds.Ecol. Monogr. 46:257–291.
Felsenstein, J. 1985. Phylogenies and the comparative method. Am. Nat.125:1–15.
Fenster, C. B., W. S. Armbruster, P. Wilson, M. R. Dudash, and J. D. Thomson.2004. Pollination syndromes and floral specialization. Ann. Rev. Ecol.Syst. 35:375–403.
Galen, C. 1989. Measuring pollinator-mediated selection on morphometricfloral traits: bumblebees and the alpine skypilot, Polemonium viscosum.Evolution 43:882–890.
EVOLUTION 2008 11

STACEY DEWITT SMITH ET AL.
Galen, C., and J. Cuba. 2001. Down the tube: pollinators, predators, and theevolution of flower shape in the alpine skypilot, Polemonium viscosum.Evolution 55:1963–1971.
Galloway, L. F., T. Cirigliano, and K. Gremski. 2002. The contribution ofdisplay size and dichogamy to potential geitonogamy in Campanulaamericana. Int. J. Plant Sci. 163:133–139.
Garland, T., A. W. Dickerman, C. M. Janis, and J. A. Jones. 1993. Phyloge-netic analysis of covariance by computer simulation. Syst. Biol. 42:265–292.
Goldblatt, P., and J. C. Manning. 2006. Radiation of pollination systems in theIridaceae of sub-Saharan Africa. Ann. Bot. 97:317–344.
Grafen, A. 1989. The phylogenetic regression. Phil. Trans. R. Soc. Lond. B326:119–157.
Grant, K. A. 1966. A hypothesis concerning the prevalence of red colorationin California hummingbird flowers. Am. Nat. 100:85–97.
Grant, V., and K. A. Grant. 1965. Flower pollination in the Phlox family.Columbia Univ. Press, New York, NY.
Grant, V., and E. J. Temeles. 1992. Foraging ability of rufous hummingbirdson hummingbird flowers and hawkmoth flowers. Proc. Natl. Acad. Sci.USA 89:9400–9404.
Hansen, T. F. 1997. Stabilizing selection and the comparative analysis of adap-tation. Evolution 51:1341–1351.
Hapeman, J. R., and K. Inoue. 1997. Plant-pollinator interactions and floral ra-diation in Platanthera (Orchidaceae). Pp. 433–454 in T. J. Givnish and K.J. Sytsma, eds. Molecular evolution and adaptive radiation. CambridgeUniv. Press, Cambridge.
Harrison, C. J., M. Moller, and Q. C. B. Cronk. 1999. Evolution and devel-opment of floral diversity in Streptocarpus and Saintpaulia. Ann. Bot.84:49–60.
Heinrich, B., and P. H. Raven. 1972. Energetics and pollination ecology. Sci-ence 176:597–602.
Herrera, C. M. 1996. Floral traits and plant adaptation to insect pollinators: adevil’s advocate approach. Pp. 88–111 in D. Lloyd and S. C. H. Barrett,eds. Floral biology. Chapman and Hall, New York, NY.
Hunziker, A.T. 2001. Genera of Solanaceae. A. R. G. Ganter Verlag K. G.,Konigstein, Germany.
Ives, A. R, and H. C. J. Godfray. 2006. Phylogenetic analysis of trophic asso-ciations. Am. Nat. 168:E1–E14.
Johnson, S. D., and K. E Steiner. 2000. Generalization versus specializationin plant pollination systems. Trends Ecol. Evol. 15:140–143.
Johnson, S. D., H. P. Linder, and K. E. Steiner. 1998. Phylogeny and radia-tion of pollination systems in Disa (Orchidaceae). Am. J. Bot. 85:402–411.
Kay, K. M., and D.W. Schemske. 2003. Pollinator assemblages and visitationrates for 11 species of Neotropical Costus. Biotropica 35:198–207.
Kay, K. M., P. A. Reeves, R. G. Olmstead, and D.W. Schemske. 2005. Rapidspeciation and the evolution of hummingbird pollination in neotropicalCostus subgenus Costus (Costaceae): evidence from nrDNA ITS andETS sequences. Am. J. Bot. 92:1899–1910.
Kohn, J. R., and N. M. Waser. 1985. The effect of Delphinium nelsonii pollenon seed set in Ipomopsis aggregata, a competitor for hummingbird pol-lination. Am. J. Bot. 72:1144–1148.
Lara, C., and J. F. Ornelas. 2001. Preferential nectar robbing of flowers withlong corollas: experimental studies of two hummingbird species visitingthree plant species. Oecologia 128:263–273.
Leiva, S. 1995. Una nueva especie de Iochroma (Solanaceae: Solaneae) delnorte del Peru. Arnaldoa 3:41–44.
Leiva, S., V. Quipuscoa S., and N. W. Sawyer. 1998. Iochroma stenanthum(Solanaceae: Solaneae), una nueva especie del norte de Peru. Arnaldoa5:77–82.
Martins, E. P., and T. F. Hansen. 1997. Phylogenies and the compara-tive method: a general approach to incorporating phylogenetic in-formation into the analysis of interspecific data. Am. Nat. 149:646–667.
McCullagh, P., and J. A. Nelder. 1989. Generalized linear models. Chapmanand Hall, London.
Melendez-Ackerman, E., D. R. Campbell, and N. M. Waser. 1997. Humming-bird behavior and mechanisms of selection on flower color in Ipomopsis.Ecology 78:2532–2541.
Mitchell, R. J., and R. G. Shaw. 1993. Heritability of floral traits for theperennial wild flower Penstemon cetranthifolius (Scrophulariaceae)—clones and crosses. Heredity 71:185–192.
Momose, K., T. Yumoto, T. Nagamitsu, M. Kato, H. Nagamasu, S. Sakai, R. D.Harrison, T. Itioka, A. A. Hamid, and T. Inoue. 1998. Pollination biologyin a lowland dipterocarp forest in Sarawak, Malaysia. I. Characteristicsof the plant-pollinator community in a lowland dipterocarp forest. Am.J. Bot. 85:1477–1501.
Muchhala, N. 2003. Exploring the boundary between pollination syn-dromes: bats and hummingbirds as pollinators of Burmeistera cy-clostigmata and B. tenuiflora (Campanulaceae). Oecologia 134:373–380.
———. 2007. Adaptive trade-off in floral morphology mediates specializationfor flowers pollinated by bats and hummingbirds. Am. Nat. 169:494–504.
Nilsson, L. A. 1988. The evolution of flowers with deep tubes. Nature 334:147–149.
Ollerton, J. 1996. Reconciling ecological processes with phylogenetic pat-terns: the apparent paradox of plant-pollinator systems. J. Ecol. 84:767–769.
Ord, T. J., and E. P. Martins. 2006. Tracing the origins of signal diversityin anole lizards: phylogenetic approaches to inferring the evolution ofcomplex behavior. Anim. Behav. 71:1411–1429.
Ornduff, R. 1969. Reproductive biology in relation to systematics. Taxon18:121–133.
Ornelas, J. F., M. Ordano, A. J. de Nova, M. E. Quintero, and T. Gar-land. 2007. Phylogenetic analysis of interspecific variation in nectar ofhummingbird-visited plants. J. Evol. Biol. 20:1904–1917.
Paradis, E., J. Claude and K. Strimmer. 2004. APE: analyses of phylogeneticsand evolution in R language. Bioinformatics 17:662–663.
Patterson, T. B., and T. J. Givnish. 2004. Geographic cohesion, chromosomalevolution, parallel adaptive radiations, and consequent floral adaptationsin Calochortus (Calochortaceae): evidence from a cpDNA phylogeny.New Phytol. 161:253–264.
Perez, F., M. T. K. Arroyo, R. Medel, and M. A. Hershkovitz. 2006. An-cestral reconstruction of flower morphology and pollination systems inSchizanthus (Solanaceae). Am. J. Bot. 93:1029–1038.
R Development Core Team. 2005. R: a language and environment for statisticalcomputing. R foundation for statistical computing. Vienna, Austria.
Raven, P. H. 1972. Why are bird-visited flowers predominantly red? Evolution26:674.
Schemske, D. W. 1981. Floral convergence and pollinator sharing in two bee-pollinated tropical herbs. Ecology 62:946–954.
Schemske, D. W., and H. D. Bradshaw, Jr. 1999. Pollinator preference and theevolution of floral traits in monkeyflowers (Mimulus). Proc. Natl. Acad.Sci. USA 96:11910–11915.
Schemske, D. W., and C. C. Horvitz. 1989. Temporal variation in selection ona floral character. Evolution 43:461–465.
Schwilk, D. W., and D. D. Ackerly. 2001. Flammability and serotiny as strate-gies: correlated evolution in pines. Oikos 94:326–336.
Shaw, J. M. H. 1998. Iochroma—a review. New Plantsman 5:153–191.
12 EVOLUTION 2008

THE ROLE OF POLLINATOR SHIFTS IN THE FLORAL DIVERSIFICATION
Silander, J. A., and R. B. Primack. 1978. Pollination intensity and seed set inthe evening primrose (Oenothera fruticosa). Am. Midl. Nat. 100:213–216.
Smith, S. D. 2006. Floral diversification and pollination biology of the An-dean clade Iochrominae (Solanaceae). Ph.D. Thesis, Univ. of Wisconsin,Madison.
Smith, S. D., and D. A. Baum. 2006. Phylogenetics of the florally di-verse Andean clade Iochrominae (Solanaceae). Am. J. Bot. 93:1140–1153.
Snow, A. A. 1982. Pollination intensity and potential seed set in Passifloravitifolia. Oecologia 55:231–237.
Snow, D. W., and B. K. Snow. 1980. Relationships between hummingbirdsand flowers in the Andes of Colombia. Bull. Br. Mus. Nat. Hist. Zool.38:105–139.
Sokal, R. R., and F. J. Rohlf. 1995. Biometry: the principles and prac-tice of statistics in biological research. W. H. Freeman and Co.,New York.
Stebbins, G. L. 1970. Adaptive radiation of reproductive characters in an-giosperms I: pollination mechanisms. Ann. Rev. Ecol. Syst. 1:307–326.
Strauss, S., and J. B. Whittall. 2006. Non-pollinator agents of selection onfloral traits. Pp. 120–138 in L. Harder and S. Barrett, eds. Ecology andevolution of flowers. Oxford Univ. Press, Oxford.
Streisfeld, M. A., and J. R. Kohn. 2007. Environment and pollinator-mediatedselection on parapatric floral races of Mimulus aurantiacus. J. Evol. Biol.20:122–132.
Stiles, F. G. 1975. Ecology, flowering phenology, and hummingbird pol-lination of some Costa Rican Heliconia species. Ecology 56:285–301.
———. 1976. Taste preferences, color preferences, and flower choice in hum-mingbirds. Condor 78:10–26.
Thompson, J. D. 2001. How do visitation patterns vary among pollinatorsin relation to floral display and floral design in a generalist pollinationsystem? Oecologia 126:386–394.
Urcelay, C., C. L. Morales, and V. R. Chalcoff. 2006. Relationship betweencorolla length and floral larceny in the South American hummingbird-pollinated Campsidium valdivianum (Bignoniaceae). Ann. Bot. Fennici43:205–211.
Venables, W. N., and B. D. Ripley. 2002. Modern applied statistics with S.Springer, New York.
Waser, N. M. 2001. Pollinator behavior and plant speciation: looking beyondthe “ethological isolation” paradigm. Pp. 318–335 in L. Chittka and J.D. Thomson, eds. Cognitive ecology of pollination: animal behavior andfloral evolution. Cambridge Univ. Press, Cambridge.
Waser, N. M., L. Chittka, M. V. Price, N. M. Williams, and J. Ollerton.1996. Generalization in pollination systems, and why it matters. Ecology77:1043–1060.
Whittall, J. B., and S. A. Hodges. 2007. Pollinator shifts drive increasinglylong nectar spurs in columbine flowers. Nature 447:406–409.
Whittall, J. B., C. Voelckel, D. J. Kliebenstein, and S. A. Hodges. 2006.Convergence, constraint and the role of gene expression during adap-tive radiation: floral anthocyanins in Aquilegia. Mol. Ecol. 15:4645–4657.
Wilson, P., and J. D. Thomson. 1996. How do flowers diverge? Pp. 88–111 inD. Lloyd and S. C. H. Barrett, eds. Floral biology. Chapman and Hall,New York, NY.
Wilson, P., M. C. Castellanos, J. N. Hogue, J. D. Thomson, and W. S. Arm-bruster. 2004. A multivariate search for pollination syndromes amongpenstemons. Oikos 104:345–361.
Wyatt, R. 1988. Phylogenetic aspects of the evolution of self-pollination. Pp.
109–131 in L. D. Gottlieb and S. K. Jain, eds. Plant evolutionary biology.Chapman and Hall, London, UK.
Associate Editor: J. Ågren
AppendixOrnstein–Uhlenbeck (OU) models of trait evolution were first
developed by Hansen (1997), and have been incorporated into a
variety of comparative methods (e.g., Blomberg et al. 2003; Butler
and King 2004). Here we used OU models that included the root
state as a parameter instead of assuming equilibrium at the root,
so that OU with � = 0 corresponds to Brownian motion (BM)
exactly. In other words, the covariance of a trait between two
species separated by a distance dij and sharing time tij from the
root to their common ancestor was uniformly taken to be �2V�(i,j)
where
V�(i, j) = e−�dij ∗ (1 − e−2�tij )/2�
(Hansen 1997). With small �, e−�dij is about 1 and the dominant
term is (1 − e−2�tij)/2�, which is about tij, the amount of branch
length shared by the two species, as in the BM model. With large
�, the dominant term is e−�dij, making distantly related species
largely independent. As � approaches infinity, the OU model re-
duces to a nonphylogenetic TIPS model. In this study, we sought
to explore intermediate models between BM and TIPS model.
The appropriate values of � to serve as intermediate points de-
pend on branch lengths in the phylogeny because � appears as a
multiplicative factor to path lengths dij and tij. Values for dij and
tij among the sampled taxa range from 0.01 to 0.04 (in terms of
average substitutions per site). Thus, values of � under 5 produce
results very similar to BM because e−5d and e−5×2t are close to 1,
whereas values of � above 200 quickly approach the TIPS model
because e−200d is almost zero. Values of 10 and 100 were selected
as intermediates in our study.
Using the phylogenetic covariance matrix obtained with the
above formula, traits were linearly transformed to remove phy-
logenetic correlation, as in PGLS (Martins and Hansen 1997).
Pairwise and partial correlations were obtained based on the trans-
formed traits. In the BM model (� = 0), the results are equivalent
to those using independent contrasts. The PGLS transformation
was preferred over independent contrasts because it generalizes to
the OU model and provides a likelihood framework to assess the
fit of each model. Partial correlations were obtained from multi-
ple linear regressions with the signs derived from the regression
coefficients. The maximum log-likelihood of a regression model
assuming phylogenetic covariance matrix V� is
log L = −n
2− n log(2��2)
2− log(det(V�))
2,
EVOLUTION 2008 13

STACEY DEWITT SMITH ET AL.
where n is the number of species and �is the ML estimate of
the variance component. The log likelihood obtained from the
linear regression on the PGLS-transformed traits in R includes
the first two terms only, so the last term, which depends on �
only, was added to it. We used these likelihood values to cal-
culate AIC scores (Akaike 1974) for use in model selection
where
AI C = −2 ln L + 2p,
and p is the number of free parameters in the model, which here
included the effects of the predictors and the intercept. A script
written for the R program, which calculates the single and multi-
ple correlations with varying � values and performs AIC model
selection is available from the authors upon request.
Supplementary MaterialThe following supplementary material is available for this article:
Figure S1. Standardized reflectance curves for study taxa.
Table S1. Pairwise correlations between pollinator groups and floral traits.
Table S2. Partial correlation coefficients for individual traits with pollinator groups from multivariate analyses.
This material is available as part of the online article from:
http://www.blackwell-synergy.com/doi/abs/10.1111/j.1558-5646.2007.00327.x
(This link will take you to the article abstract).
Please note: Blackwell Publishing is not responsible for the content or functionality of any supplementary materials supplied by
the authors. Any queries (other than missing material) should be directed to the corresponding author for the article.
14 EVOLUTION 2008