the role of private equity and debt funds in sme and...
TRANSCRIPT

THE ROLE OF PRIVATE EQUITY
AND DEBT FUNDS IN SME AND
INFRASTRUCTURE FINANCE
December 7, 2015
101672
Pub
lic D
iscl
osur
e A
utho
rized
Pub
lic D
iscl
osur
e A
utho
rized
Pub
lic D
iscl
osur
e A
utho
rized
Pub
lic D
iscl
osur
e A
utho
rized

Outline
Section 1: Overall Evolution of PE Funds
Section 2: Emergence of Private Debt Funds
Section 3: Venture Capital Funds
Section 4: Infrastructure Funds
The Role of Private Equity and Debt Funds in SME and Infrastructure Finance1

Section 1: Private equity funds assets under management (AUM)
have grown from US$ 963 billion in 2004 to US$ 3.4 trillion in 2013.
The Role of Private Equity and Debt Funds in SME and Infrastructure Finance2
298 377 407 402 409563
8061,011 1,075 1,067 993 1,007 941 1,046418 374 360 465 554
675
898
1,265 1,2041,413
1,7832,029
2,3322,420
0
500
1,000
1,500
2,000
2,500
3,000
3,500
4,000
Dec-0
0
Dec-0
1
Dec-0
2
Dec-0
3
Dec-0
4
Dec-0
5
Dec-0
6
Dec-0
7
Dec-0
8
Dec-0
9
Dec-1
0
Dec-1
1
Dec-1
2
Ju
n-1
3
Private Equity Assets under Management December 2004 - June 2013 (US$ billion)
Dry Powder Unrealized ValueSource: 2014 Preqin Global Private Equity Report

Section 1: By geographical area, the main areas of focus are the US
and Europe, followed by Asia. The rest of the world is at a low level,
but growing slowly.
The Role of Private Equity and Debt Funds in SME and Infrastructure Finance3
Source: 2014 Preqin Global Private Equity Report
0
100
200
300
400
500
600
700
Dec-03 Dec-04 Dec-05 Dec-06 Dec-07 Dec-08 Dec-09 Dec-10 Dec-11 Dec-12 Dec-13
Dry
Po
wd
er
($b
n)
Private Equity Dry Powder by Primary Geographic Focus 2003 – 2013 (US$ billion)
North America Europe Asia Rest of World

Section 1: Among emerging markets, emerging Asia is the
main geographical focus area (with China and India leading),
followed by Latin America (with Brazil leading)
4 Presentation Title
-
5.00
10.00
15.00
20.00
25.00
2009 2010 2011 2012 2013
Evolution on PE investments in Emerging Markets by region, in US$ billion
Emerging Asia China India
CEE and CIS Russia Latin America
Brazil MENA Sub-Saharan Africa
Source: EMPEA Database

Section 1: By type of fund, buyout funds dominate, followed by real
estate, venture capital and infrastructure. Mezzanine debt represents
a small share of the total, but is growing.
The Role of Private Equity and Debt Funds in SME and Infrastructure Finance5
0
200
400
600
800
1,000
1,200
Dec-03 Dec-04 Dec-05 Dec-06 Dec-07 Dec-08 Dec-09 Dec-10 Dec-11 Dec-12 Dec-13
Dry
Po
wd
er
($b
n)
Private Equity Dry Powder by Fund Type 2004 – 2013 (US$ billion)
Buyout Distressed Private Equity GrowthInfrastructure Mezzanine Real EstateVenture Capital Other
Source: 2014 Preqin Global Private Equity Report

Section 1: After dropping following the international financial crisis in
2008, private equity-backed exits have rebounded sharply in the
2010-2013 period.
The Role of Private Equity and Debt Funds in SME and Infrastructure Finance6
0
20
40
60
80
100
120
140
0
50
100
150
200
250
300
350
400
Q1
Q2
Q3
Q4
Q1
Q2
Q3
Q4
Q1
Q2
Q3
Q4
Q1
Q2
Q3
Q4
Q1
Q2
Q3
Q4
Q1
Q2
Q3
Q4
Q1
Q2
Q3
Q4
Q1
Q2
Q3
Q4
2006 2007 2008 2009 2010 2011 2012 2013
Ag
gre
ga
te E
xit V
alu
e ($
bn
)
No
. o
f E
xit
s
Private Equity-Backed Exits by Type Q1 2006 - Q4 2013
IPO Restructuring Sale to GP Trade Sale Aggregate Exit Value ($bn)
Source: 2014 Preqin Global Private Equity Report

Section 1: The investor base for private equity funds has
undergone major transformation over the past 6 years.
The Role of Private Equity and Debt Funds in SME and Infrastructure Finance7
Source: 2014 Preqin Global Private Equity Report
27%
11%
6%
9%
7%
2%
10%
1% 1%
7%
9%10%
13%
14%
7%
11%
8%
10%
4%
6%
8%
6%
3%
10%
0%
5%
10%
15%
20%
25%
30%
Pub
lic P
ensio
nF
und
s
Fu
nd
of
Fu
nd
sM
an
ag
ers
Priva
te S
ecto
rP
en
sio
n F
un
ds
Hig
h-N
et-
Wo
rth
Ind
ivid
uals
Insu
ran
ce
Com
pan
ies
Gove
rnm
en
tA
ge
ncie
s
End
ow
me
nt
Pla
ns
Co
rpora
teIn
ve
sto
rs
Fa
mily
Off
ices
Ban
ks &
Inve
stm
ent
Ban
ks
Fo
un
datio
ns
Oth
er
Pro
po
rtio
n o
f C
ap
ital C
om
mit
ted
Investor Type
Make-up of LPs in the Average Fund by LP Type (Capital Committed to Funds Closed in 2008-2013)
2008-2010
2011-2013

Section 1: In terms of performance, private equity horizon IRR
outperformed major market indices in 2013. However, this
performance was driven by buyout fund, while venture capital
underperformed market indices.
The Role of Private Equity and Debt Funds in SME and Infrastructure Finance8
-5%
0%
5%
10%
15%
20%
25%
30%
1 Year to Jun-13 3 Years to Jun-13 5 Years to Jun-13 10 Years to Jun-13
An
nu
ali
ze
d R
etu
rns
Private Equity Horizon IRRs vs. Public Indices as of 30 June 2013
All Private Equity
Buyout
Venture Capital
S&P 500
MSCI Europe
MSCI EmergingMarkets
Source: 2014 Preqin Global Private Equity Report
Outline
Section 1: Overall Evolution of PE Funds
Section 2: Emergence of Private Debt Funds
Section 3: Venture Capital Funds
Section 4: Infrastructure Funds
The Role of Private Equity and Debt Funds in SME and Infrastructure Finance9

Section 2: Since the international financial crisis in 2008, private
debt funds (including mezzanine funds) have grown rapidly.
The Role of Private Equity and Debt Funds in SME and Infrastructure Finance10
Source: Preqin Special Report: Private Debt Report, November 2014
60
8388
94
137
69
23
4145
60
77
37
0
20
40
60
80
100
120
140
160
2009 2010 2011 2012 2013 2014 YTD
Year of Final Close
Annual Private Debt Fundraising 2009 - 2014 YTD (As at 20 October 2014)
No. of Funds Closed
Aggregate CapitalRaised ($bn)

Section 2: By geographical area, the main areas of focus are North
America, followed by Europe and Asia and the rest of the world.
The Role of Private Equity and Debt Funds in SME and Infrastructure Finance11
Source: Preqin Special Report: Private Debt Report, November 2014
17%17%
15% 17% 13% 14%
22%
22%
20%26%
21%
33%
62%
31%
65%57%
66%
52%
0%
10%
20%
30%
40%
50%
60%
70%
80%
90%
100%
2009 2010 2011 2012 2013 2014 YTD
Pro
po
rtio
n o
f F
un
ds
Year of Final Close
Breakdown of the Number of Private Debt Funds Closed by Primary Geographic Focus 2009 - 2014 YTD (As at 11.20.2014)
North America
Europe
Asia & Rest ofWorld

Section 2: By type of fund, direct lending funds dominate,
followed by mezzanine and distressed debt.
The Role of Private Equity and Debt Funds in SME and Infrastructure Finance12
Source: Preqin Special Report: Private Debt Report, November 2014
40%
36%
12%
9%3%
Primary Strategy of Private Debt Fund Managers Established Since 2008
Direct Lending
Mezzanine
Distressed Debt
Special Situation
Venture Debt

Outline
Section 1: Overall Evolution of PE Funds
Section 2: Emergence of Private Debt Funds
Section 3: Venture Capital Funds
Section 4: Infrastructure Funds
The Role of Private Equity and Debt Funds in SME and Infrastructure Finance13

Section 3: After reaching a peak in 2008, venture capital fund raising
dropped significantly following the international financial crisis in
2009 and 2010. It rebounded significantly in 2011, but has tapered off
since then.
The Role of Private Equity and Debt Funds in SME and Infrastructure Finance14
Source: 2014 Preqin Global Private Equity Report
31
1417
2216
7
9
54
3
6
5
12
6 5
1515
15
0
10
20
30
40
50
60
2008 2009 2010 2011 2012 2013
Ag
gre
ga
te C
ap
ital
Rais
ed
($b
n)
Year of Final Close
Annual Venture Capital Fundraising by Primary Industry Focus 2008 – 2013 (US$ billion)
InformationTechnology
Healthcare
Other Industries

Section 3: By stage, venture capital deal flow is led by angel/seed
deals, followed by round 1 deals and round 2 deals, showing the
critical role played by private equity at early stages of development of
SMEs. Venture debt represents less than 7% of the total.
The Role of Private Equity and Debt Funds in SME and Infrastructure Finance15
Source: 2014 Preqin Global Private Equity Report
22%
2%
22%
2%
13%
10%
15%
11%
8%
12%
9%
12%
4%
12%
4%
10%
3%
13%
3%
14%
2% 5%2%
3%1% 2% 1%
1%
32%27%
33%31%
6%
5%
4%7%
8%13%
7% 9%
0%
10%
20%
30%
40%
50%
60%
70%
80%
90%
100%
No. of Deals Aggregate Deal Value No. of Deals Aggregate Deal Value
2012 2013
Pro
po
rtio
n o
f To
tal
Proportion of Number and Aggregate Value of Venture Capital Deals by Stage 2012 – 2013
Angel/Seed Series A/Round 1 Series B/Round 2 Series C/Round 3
Series D/Round 4 and Later Growth Capital/Expansion PIPE Unspecified Round
Venture Debt Add-on & Other
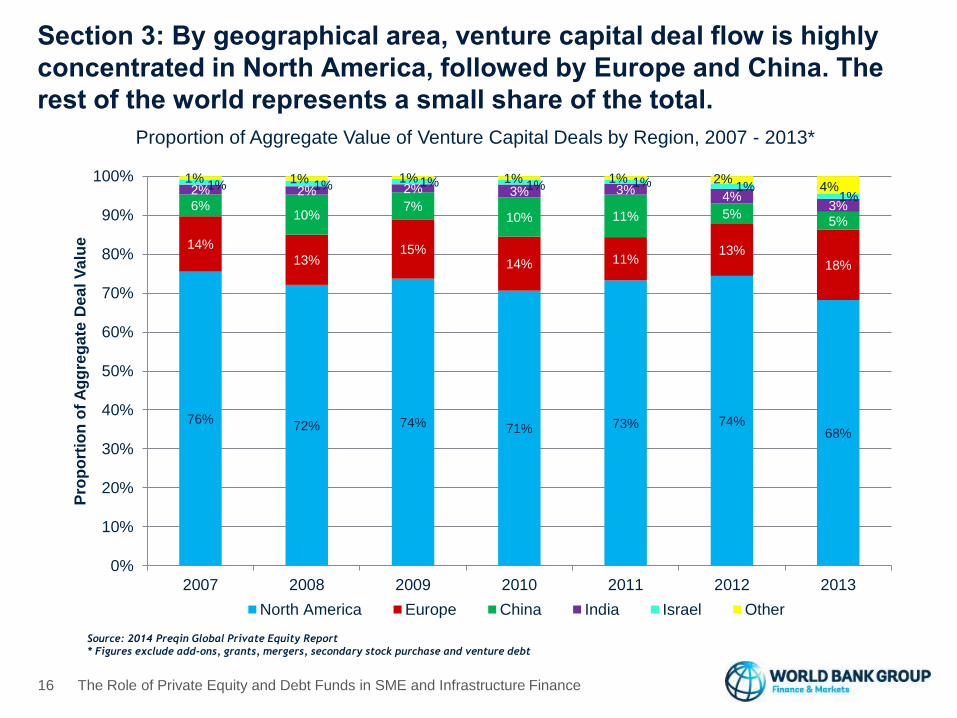
Section 3: By geographical area, venture capital deal flow is highly
concentrated in North America, followed by Europe and China. The
rest of the world represents a small share of the total.
The Role of Private Equity and Debt Funds in SME and Infrastructure Finance16
Source: 2014 Preqin Global Private Equity Report
* Figures exclude add-ons, grants, mergers, secondary stock purchase and venture debt
76%72% 74% 71% 73% 74%
68%
14%
13%15%
14% 11%13%
18%
6%10%
7%10% 11% 5%
5%
2% 2% 2% 3% 3%4%
3%
1% 1% 1% 1% 1% 1%1%
1% 1% 1% 1% 1% 2%4%
0%
10%
20%
30%
40%
50%
60%
70%
80%
90%
100%
2007 2008 2009 2010 2011 2012 2013
Pro
po
rtio
n o
f A
gg
reg
ate
Dea
l V
alu
e
Proportion of Aggregate Value of Venture Capital Deals by Region, 2007 - 2013*
North America Europe China India Israel Other

Section 3: By industry, venture capital deal flow is led by
internet, followed by software, healthcare and telecoms.
The Role of Private Equity and Debt Funds in SME and Infrastructure Finance17
Source: 2014 Preqin Global Private Equity Report
27%22% 25% 23%
18%
14%
22%21%
18%
25%
16% 22%
12%9%
14% 10%
8%
8%
8% 9%2%
2%
3% 3%4%9%
3% 4%4% 2% 3% 2%3% 2%2% 1%3% 3% 2% 3%3% 3% 3% 2%
0%
10%
20%
30%
40%
50%
60%
70%
80%
90%
100%
No. of Deals Aggregate DealValue
No. of Deals Aggregate DealValue
2012 2013
Pro
po
rtio
n o
f To
tal
Proportion of Number and Aggregate Value of Venture Capital Deals by Industry 2012 – 2013
Internet Software & Related Healthcare
Telecoms Other IT Business Services
Clean Technology Consumer Discretionary Industrials
Semiconductors & Electronics Other

Outline
Section 1: Overall Evolution of PE Funds
Section 2: Emergence of Private Debt Funds
Section 3: Venture Capital Funds
Section 4: Infrastructure Funds
The Role of Private Equity and Debt Funds in SME and Infrastructure Finance18

Section 4: Unlisted infrastructure funds AUM have grown from
US$ 17 billion in 2004 to US$ 244 billion in 2013.
The Role of Private Equity and Debt Funds in SME and Infrastructure Finance19
Source: 2014 Preqin Global Infrastructure Report
3 4 11 15
37
61 63 64 6890 82 87
4 56 9
16
3349
60
92
127 149157
0
50
100
150
200
250
300
Dec-0
2
Dec-0
3
Dec-0
4
Dec-0
5
Dec-0
6
Dec-0
7
Dec-0
8
Dec-0
9
Dec-1
0
Dec-1
1
Dec-1
2
Ju
n-1
3
As
se
ts u
nd
er
Ma
na
ge
me
nt
($b
n)
Unlisted Infrastructure Assets under Management December 2004 - June 2013
UnrealizedValue ($bn)
Dry Powder($bn)

Section 4: By project stage, infrastructure fund deals are led
by secondary stage, followed by greenfield and brownfield.
The Role of Private Equity and Debt Funds in SME and Infrastructure Finance20
Source: 2014 Preqin Global Infrastructure Report
59%
28%
13%
Breakdown of Unlisted Infrastructure Deals by Project Stage 2008 – 2013
Secondary Stage
Greenfield
Brownfield

Section 4: By geographical area, the main areas of focus are
North America, followed by Europe and Asia.
The Role of Private Equity and Debt Funds in SME and Infrastructure Finance21
Source: 2014 Preqin Global Infrastructure Report
36 31
11 8
73
52
1616
0
20
40
60
80
100
120
North America Europe Asia Rest of World
As
se
ts u
nd
er
Ma
na
ge
me
nt
($b
n)
Fund Primary Geographic Focus
Unlisted Infrastructure Assets under Management by Fund Primary Geographic Focus as of June 2013
Unrealized Value($bn)
Dry Powder ($bn)

Section 4: By industry, infrastructure fund deal flow is led by
renewable energy, followed by transport, social infrastructure and
energy.
The Role of Private Equity and Debt Funds in SME and Infrastructure Finance22
Source: 2014 Preqin Global Infrastructure Report
29%
18%
18%
15%
14%
3% 3%
Breakdown of Infrastructure Deals by Industry, 2008 – 2013
Renewable Energy
Transport
Social
Energy
Utilities
Telecoms
Other

Section 4: By type of investor, private pension funds dominate,
followed by public pension funds, insurance companies and
foundations.
The Role of Private Equity and Debt Funds in SME and Infrastructure Finance23
Source: 2014 Preqin Global Infrastructure Report
19%
16%
10%
8%
6% 6% 6%
4% 4% 4% 4%
3% 3%2%
5%
0%
2%
4%
6%
8%
10%
12%
14%
16%
18%
20%
Private
Secto
rP
ensio
n F
unds
Public
Pensio
nF
un
ds
Insu
rance
Co
mpa
nie
s
Fou
nda
tio
ns
Asset
Man
age
rs
Banks
Endo
wm
ent
Pla
ns
Fun
d o
f F
und
sM
anag
ers
Inve
stm
ent
Co
mpa
nie
s
Wealth
Ma
nag
ers
Fam
ily O
ffic
es
Supe
rannu
ation
Sch
em
es
Govern
ment
Agen
cie
s
Sovere
ign
Wealth F
unds
Oth
er
Pro
po
rtio
n o
f In
ve
sto
rs
Investor Type
Breakdown of Infrastructure Investors by Type, 2013

Section 4: Since 2007, infrastructure investment funds have
outperformed the private equity class.
The Role of Private Equity and Debt Funds in SME and Infrastructure Finance24
Source: 2014 Preqin Global Infrastructure Report
0
20
40
60
80
100
120
140
160
Ind
ex R
etu
rns
(R
eb
ase
d t
o 1
00
as o
f 3
1 D
ece
mb
er
200
7) PrEQIn Index: Infrastructure vs. All Private Equity December 2007 – June 2013
PrEQIn AllPrivate EquityIndex
PrEQInInfrastructureIndex

Section 4: Following low levels of activity until 2005, unlisted private
infrastructure debt funds increased rapidly until the financial crisis in
2008. Following a sharp drop in 2009, infrastructure debt funds
recovered quickly, raising US$ 7.5 billion in 2013.
The Role of Private Equity and Debt Funds in SME and Infrastructure Finance25
Source: 2014 Preqin Global Infrastructure Report
5
3
6
9
1
6
7
10
7
1.81.2
3.5 3.6
0.2
1.3
6.2
3.4
7.5
0
2
4
6
8
10
12
199
8-2
00
5
200
6
200
7
200
8
200
9
201
0
201
1
201
2
201
3
Year of Final Close
Annual Infrastructure Debt Fund Raising, 1998-2013
No. of FundsClosed
Aggregate CapitalRaised ($bn)

Section 4: By geographical area, the main areas of concentration are
North America, followed by Europe and the rest of the world
The Role of Private Equity and Debt Funds in SME and Infrastructure Finance26
Source: 2014 Preqin Global Infrastructure Report
15
19 19
21
18.3
10.9
6.3
8.2
0
5
10
15
20
25
North America Europe Asia Rest of World
Breakdown of Unlisted Infrastructure Debt Fund Universe by Primary Geographic Focus, 2013
No. of FundsClosed/Raising
Aggregate CapitalRaised/Targeted($bn)

Section 4: The number of listed infrastructure funds raised increased
from 2001 to 2009, but has remained stagnant since then.
The Role of Private Equity and Debt Funds in SME and Infrastructure Finance27
Source: 2014 Preqin Global Infrastructure Report
32
1 39
3537
132
5
3
4
6
5
7
5 1
7
0
0
0
0
0
0
10
4 35
0
2
0
5
10
15
20
25
30
35
40
45
50
200
1
200
2
200
3
200
4
200
5
200
6
200
7
200
8
200
9
201
0
201
1
201
2
201
3
Listed Infrastructure Fund Launches, 2004 – 2013
No. of Funds Already Trading No. of Funds Launched
No. of Funds Delisted No. of Funds Liquidated
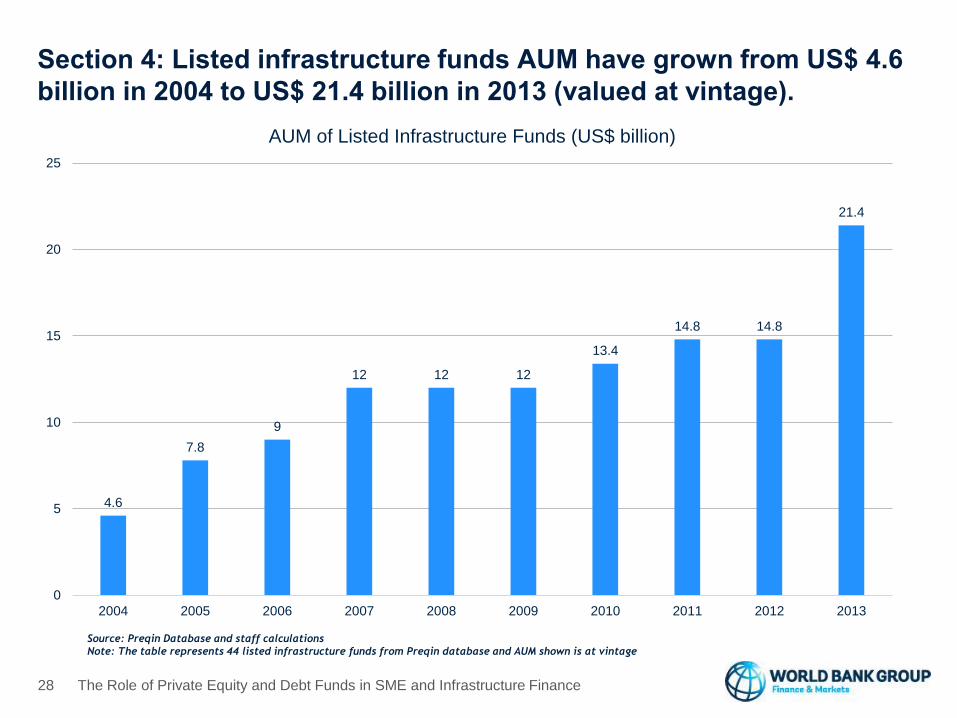
Section 4: Listed infrastructure funds AUM have grown from US$ 4.6
billion in 2004 to US$ 21.4 billion in 2013 (valued at vintage).
The Role of Private Equity and Debt Funds in SME and Infrastructure Finance28
Source: Preqin Database and staff calculations
Note: The table represents 44 listed infrastructure funds from Preqin database and AUM shown is at vintage
4.6
7.8
9
12 12 12
13.4
14.8 14.8
21.4
0
5
10
15
20
25
2004 2005 2006 2007 2008 2009 2010 2011 2012 2013
AUM of Listed Infrastructure Funds (US$ billion)

Investment Funds Group Team
The Role of Private Equity and Debt Funds in SME and Infrastructure Finance29
Contact information:
Michel Noel
202-203-0874
Nikoloz Anasashvili
Consultant
Patrick J. McGinnis
ConsultantSevara Atamuratova
Research Analyst
Shanthi Divakaran
Sr. Financial Sector Specialist
Michel Noel
Head
Thelma Ayamel
Program Assistant