the role of process analytical technologies in the quality by design framework carl a. anderson,...
TRANSCRIPT

The Role of Process Analytical Technologies
in the Quality by Design Framework
Carl A. Anderson, Ph.D.James K. Drennen, III, Ph. D.
Benoît Igne, Ph. D.Interfex, 23 April 2013
New York, NY
“The pharmaceutical industry has a little secret: Even as it invents futuristic new drugs, its manufacturing techniques lag far
behind those of potato-chip and laundry-soap makers.”
“In other industries, manufacturers constantly fiddle with their production lines to find improvements. But FDA regulations
leave drug-manufacturing processes virtually frozen in time.”
Abboud, L; Hensley, S. Factory shift: New prescription for drug makers: Update the plants; After years of neglect, Industry focuses on manufacturing; FDA acts as a catalyst; The three-story blender. Wall Street Journal (Eastern Edition). September 3, 2003, pg. A.1.
THE WALL STREET JOURNAL
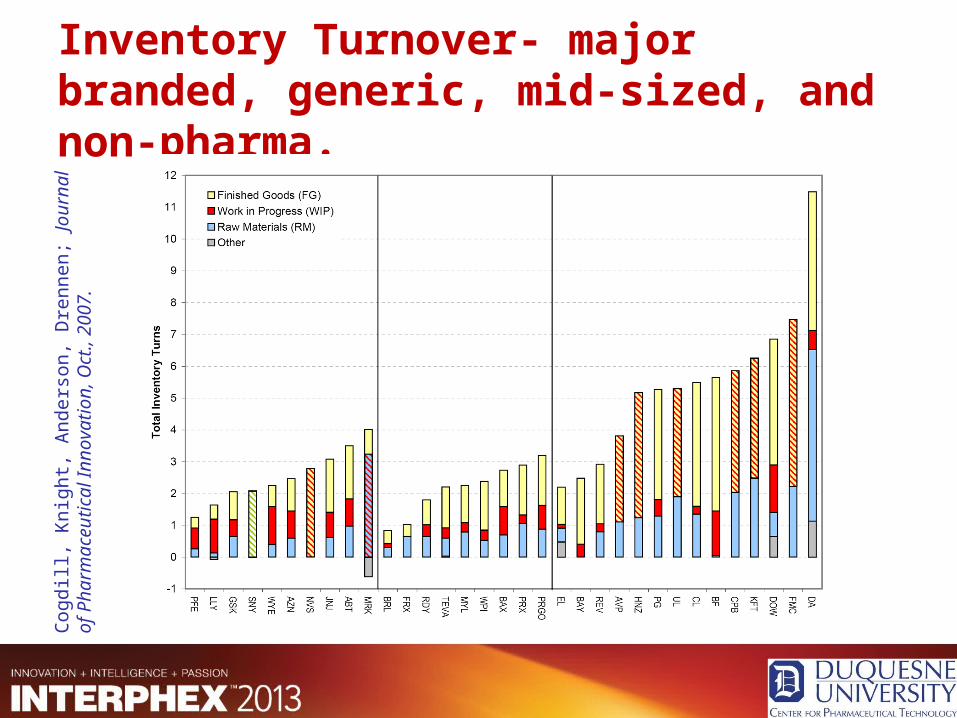
Inventory Turnover- major branded, generic, mid-sized, and non-pharma.
Cogdill
, K
nig
ht,
And
ers
on, D
renn
en
; Jo
urn
al of
Pharm
ace
uti
cal In
novati
on
, O
ct., 2
00
7.
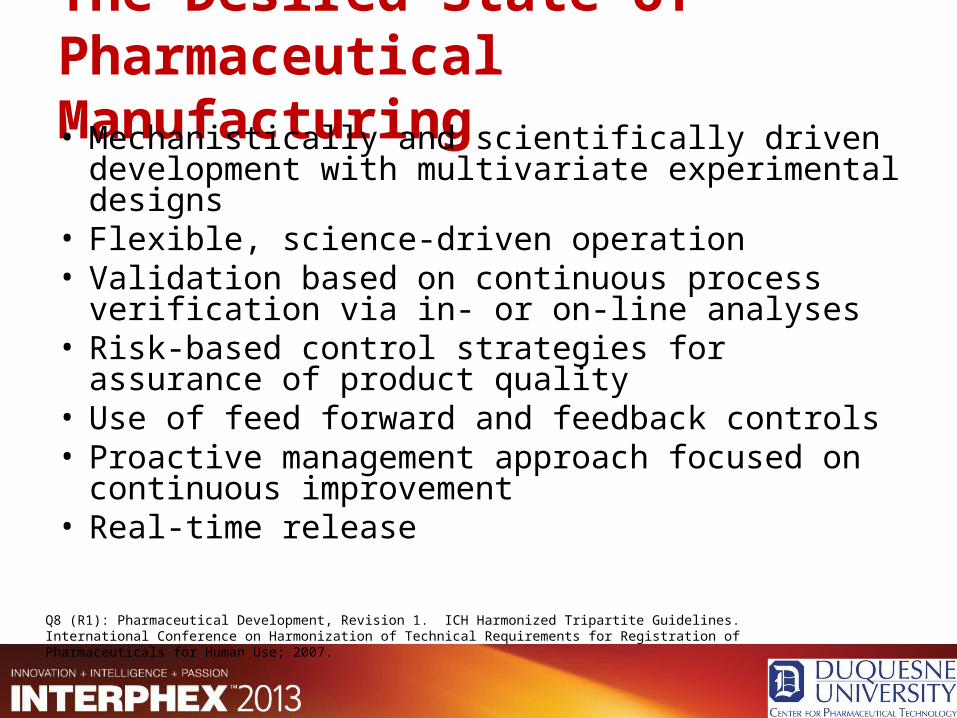
The Desired State of Pharmaceutical Manufacturing• Mechanistically and scientifically driven
development with multivariate experimental designs
• Flexible, science-driven operation • Validation based on continuous process
verification via in- or on-line analyses• Risk-based control strategies for assurance
of product quality• Use of feed forward and feedback controls • Proactive management approach focused
on continuous improvement• Real-time release
Q8 (R1): Pharmaceutical Development, Revision 1. ICH Harmonized Tripartite Guidelines. International Conference on Harmonization of Technical Requirements for Registration of Pharmaceuticals for Human Use; 2007.

Advantages of the Desired State
• Demonstration of process understanding• Additional regulatory flexibility• Enhanced product quality and process
efficiency• Foundation for continuous improvement• Potential reductions in the time-to-market
for finished products
Product Attributes Patient Characteristics
PAT QbD Design Space PBQS
From the PAT Guidance
“…(PAT) is intended to support innovation and efficiency in pharmaceutical development, manufacturing, and quality assurance.”
“…(efficient pharmaceutical manufacturing) is a critical part of an effective U.S. health care system. The health of our citizens depends on the availability of safe, effective, and affordable medicines.”
“Guidance for Industry: PAT -- A Framework for Innovative Pharmaceutical Development, Manufacturing, and Quality Assurance” (U.S. Department of Health and Human Services, Food and Drug Administration, 2004).

Quality
Quality by Design (QbD)
• ICH Q8R1 describes QbD as a: “systematic approach to development that begins
with predefined objectives and emphasizes product and process understanding and process control, based on sound science and quality risk management”
Adapted from: R.C. Lyon, Process monitoring of pilot-scale pharmaceutical blends by near-infrared chemical imaging and spectroscopy, Eastern Analytical Symposium (EAS), Somerset, NJ, 2006.
QbD facilitates PAT system development
PAT verifies QbD

Manufacturing Systems designed using QbD and Implemented via PAT
SPCTech QbD/PAT Philosophy © 2006

Cycle Time Improvement with PAT
Cogdill, Knight, Anderson, Drennen; Journal of Pharmaceutical Innovation, Oct., 2007.

Quality + Efficiency = Profitability
“…there is ample evidence that process analytics can be implemented with an expressed goal of improving efficiency and profitability so long as the new technology’s impact on process quality assurance is positive (as detailed in advance, e.g. by a project comparability protocol).”
The Financial Returns on Investments in Process analytical technology and Lean Manufacturing: Benchmarks and Case Study. Cogdill, Knight, Anderson, Drennen; Journal of harmaceutical Innovation, Oct., 2007.

Where does QRM fit within Development and Manufacturing?
•Elements of Pharmaceutical Development • Quality Target Product Profile• Critical Quality Attributes• Select manufacturing process• Risk Assessment: Linking Material Attributes and Process
Parameters to Drug Product CQAs• Design Space• Control Strategy• Product Lifecycle Management and Continual
Improvement
ICH Q8(R2), Part II: Pharmaceutical Development- Annex
QbD Approach Includes:• Systematic evaluation, understanding and
refining of the formulation and process– Identify through prior knowledge, experimentation, and
risk assessment, the material attributes and process parameters that can have an effect on product CQAs
– Determine the functional relationships that link material attributes and process parameters to product CQAs
• Using product and process understanding in combination with quality risk management to establish an appropriate control strategy which can include a proposal for a design space and/or real-time release testing.– This facilitates continual improvement and innovation
throughout the product lifecycle
12
Risk Assessment
• Risk Assessment: Linking Material Attributes and Process Parameters to Drug Product CQAs– A science-based process used in quality risk
management, to aid in identifying which material attributes and process parameters have an effect on product CQAs• Performed early in product development, and
revisited as more information becomes available• Identify and rank parameters that might have an
impact on product quality
13

Risk Assessment
• List of potential parameters is refined through experimentation to determine the significance of individual variables and potential interactions
• Study of significant parameters leads to process understanding
14
Risk Assessment
• An important component of product lifecycle management and continual improvement– identify functional relationships linking
material attributes and process parameters to product CQAs
– link the design of the manufacturing process to product quality
15
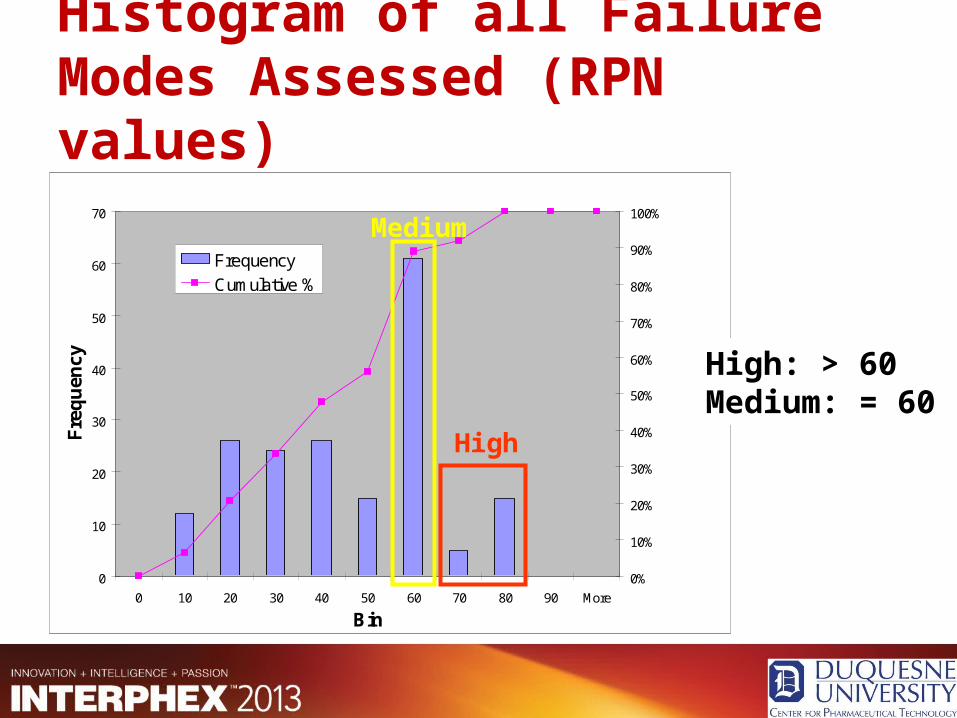
Histogram of all Failure Modes Assessed (RPN values)
0
10
20
30
40
50
60
70
0 10 20 30 40 50 60 70 80 90 More
Bin
Fre
qu
ency
0%
10%
20%
30%
40%
50%
60%
70%
80%
90%
100%
Frequency
Cumulative %
Medium
High
High: > 60Medium: = 60
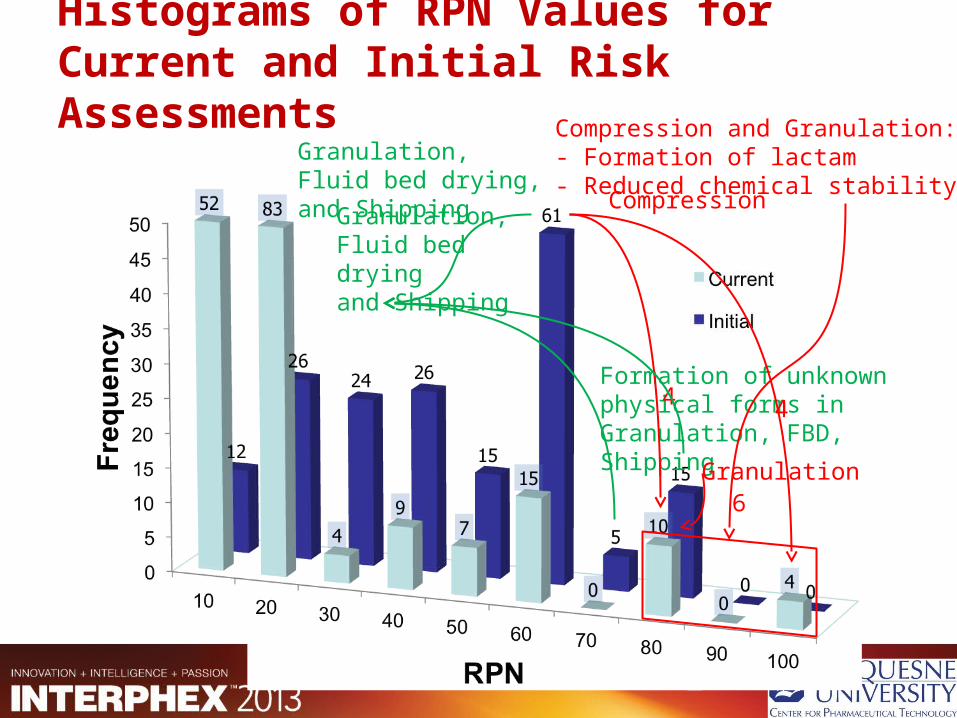
Histograms of RPN Values for Current and Initial Risk Assessments
Formation of unknown physical forms inGranulation, FBD, Shipping
Compression
4 4
Granulation,Fluid bed drying,and Shipping
Compression and Granulation:- Formation of lactam- Reduced chemical stability
6Granulation
Granulation,Fluid bed dryingand Shipping

Quality Risk Management and Continuous Improvement
Adapted from: ICHQ9
InitiateQuality Risk Management Process
Risk Assessment
Risk Control
Risk Review
Risk Identification
Risk Analysis
Risk Evaluation
Risk Reduction
Risk Acceptance
Review Events
Output / Result of theQuality Risk Management Process
Ris
k C
omm
unic
atio
n
Risk M
anagement T
oolsunacceptable
Risk Reduction
Continuous
improvem
ent cycle

Validation Pathway
1 2 3 4
Intended Routine PAT Measurement
Mode
Off-line/At-line
On-line/In-line
On-line/In-line
On-line/In-line
Validation PATMeasurement
Mode
Off-line/At-line
Off-line/At-line
On-line/In-line Pilot Scale
On-line/In-line Commercial
Scale
Validation Sampling
Static Static Dynamic Dynamic
Validation Reference
Measurement Mode
(if necessary)
Off-line/At-line
Off-line/At-line
On/In-line or Off/At-line
On/In-line or Off/At-line
Additional Validation
on Transfer toOn-line/In-line
N/A Yes Yes N/AAdapted from ASTM E55 standard.
Validation Pathways for PAT Methods

Connecting Quality Specifications with Patient Needs:Performance Based Quality Specifications (PBQS)
Theophylline (% Nominal)
T 63.2
(H
ours
)
94 96 98 100 102 104 106
2
3
4
5
6
7
8
24
25
26
27
28
29
30
31
32
Theophylline (% Nominal)
T 63.2
(H
ours
)
94 96 98 100 102 104 106
2
3
4
5
6
7
8
5
6
7
8
9
10
11
12
13
14
15
16
Inefficacy Toxicity
Inefficacy and Toxicity Risk Contour Plots
Adapted from:Short, Robert P. et.al., J. Pharm. Sci., 2010, 99(12), 5046-5059Short, Robert P. et.al., J. Pharm. Sci., 2011, 100(4), 1566-1575

PAT
Feedback Control
Blending
ContentUniformity
Risk = f(CU,T63.2,…)
Theophylline (% Nominal)
T 63.2
(H
ours
)
94 96 98 100 102 104 106
2
3
4
5
6
7
8
Design Space
Tableting
RTS = f(Pressure,
Concentrations,…)
PAT
T63.2 = f(RTS,...)
Dissolution
Feedforward Control

Introduction
• Acceptable CQA ranges defines the design space: “the multidimensional combination and interaction of input variables (e.g., material attributes) and process parameters that have been demonstrated to provide assurance of quality” (ICHQ8)
MacGregor et al.,2008. JPI, 3, 15-22
Introduction
• Factors not typically studied in initial DoE:– Full extent of raw material variability– Supply chain disruption– Manufacturing chain relocation– Storage condition variability– Equipment wear
• When variability is detected in the underlying factors of the design space, it is necessary to adapt the relevant models (the design space) while maintaining product efficacy and safety

Objectives
• Evaluate the possibility to adapt critical process parameters and consequently establish a dynamic design space based on raw material characteristics while maintaining product quality

Strategy
1. Create knowledge space2. Determine CQAs and the design space3. Test robustness of design space with
respect to raw material variability4. Evaluate the possibilities of a dynamic
design space to compensate for variability (from raw material properties)
– Key goal: maintain product quality

Results: Knowledge and design spaces• Knowledge space
– CQAs: RTS and disintegration time– CPPs: Excipient ratio and tablet force to
failure
Excipient ratio (MCC:Lactose)
Tab
let
forc
e to
fai
lure
(kP
)
Disintegration time (s)
1 1.5 2 2.5 3 3.5 46
7
8
9
10
11
12
20
40
60
80
100
120
140
160
180
200
Excipient ratio (MCC:Lactose)
Tab
let
forc
e to
fai
lure
(kP
)
Radial Tensile Strength (MPa)
1 1.5 2 2.5 3 3.5 46
7
8
9
10
11
12
800
1000
1200
1400
1600
1800
( > 80s) (1.25 - 1.60 MPa)
1.8
0.8
1.6
1.4
1.2
1.0

Results: Knowledge and design spaces• Design space
Excipient ratio (MCC:Lactose)
Table
t fo
rce t
o f
ailu
re (
kP
)
Design space
1 1.5 2 2.5 3 3.5 46
7
8
9
10
11
12
The multidimensional combination and interaction of input variables and process parameters
Results: Effect of raw material properties on the robustness of the design space
• An optimal set of critical process parameters was chosen and its robustness tested regarding raw material variability– Excipient ratio of 2 (41.3% of MCC and 20.7% of
lactose)
– 2% of Croscarmellose Sodium– Target force to failure at the press of 11
kp – RMSNV weights were 1-1-1 (for APIs,
Excipients and Croscarmellose Sodium respectively)

Results: Effect of raw material properties on the robustness of the design space
• Given these CPPs, the corresponding CQAs were 1.53 MPa and 104 s for RTS and disintegration time respectively.
Excipient ratio (MCC:Lactose)
Table
t fo
rce t
o f
ailu
re (
kP
)
Design space
1 1.5 2 2.5 3 3.5 46
7
8
9
10
11
12

Results: Effect of raw material properties on the robustness of the design space
• When considering the variability in raw materials, 2 of the 3 runs were outside of the design space
Run # RMCharacteristic
Disintegration Time (s)
Radial Tensile Strength (MPa)
1Larger APAP 63
1452
2 50:50 Lac 68 1396
3 Both 98 1395

Results: Process adjustments to compensate for raw material characteristics
Changing CPPs can allow specifications to be met!
Adjustments to tablet force to failure setting
Design points
Tab
let
forc
e to
fai
lure
(kp
)
Design space
1A 1B 1C 1D 1E 1F 2A 2B 2C 2D 2E 2F 3A 3B 3C 3D 3E 3F7
8
9
10
11
12
13
14*
*
*Compression force outside of original design space required to meet specificationsAPAP Excip Excip +APAP

Conclusions
• Adapting CPPs based on raw material characterization allows the creation of drug products with repeatable acceptable characteristics
• Adjustments to design space are critical to ensure process robustness

Conclusions• Process analytical technology plays a
critical role in monitoring the state of the process and enables control to achieve desired product attributes by adjusting process parameters– Improved raw material characterization
can mitigate some, but not all of the potential variations
– Such approach currently exist for granulation and drying control based on Environment Equivalency Factors

Acknowledgements
Steve Short, Ph.D.Zhenqi (Pete) Shi,
Ph.D.Ma Hua, Ph. D.Robert Bondi, Ph.D.
NIPTE
