the role of recycled water in and gas reduction role of recycled water in energy efficiency and ......
TRANSCRIPT
The Role of Recycled Water In Energy Efficiency and Greenhouse Gas Reduction
A Study Conducted by:
A Navigant Consulting Program, Funded by California utility customers under the auspices of the California Public Utilities Commission
May 2, 2008

The California Sustainability Alliance (the Alliance) is an innovative market transformation program funded by California utility customers under the auspices of the California Public Utilities Commission. The Alliance leverages action on environmental initiatives such as climate, smart land use and growth, renewable energy, waste management, water use efficiency and transportation planning to help the State of California achieve its aggressive energy efficiency goals more effectively and economically. In partnership with public and private organizations throughout California, the Alliance precipitates widespread market transformation by tackling major barriers to sustainability. Seasoned advisors from both the public and private sectors have joined the Alliance to develop, test and deploy creative strategies to transform sectors with high energy efficiency potential. Initial pilots are targeting the greening of local government, commercial office space, sustainable community development, and recycled water. The Alliance’s extensive network of environmental sustainability leaders include leading public and private entities and State agencies responsible for implementing Californiaʹs landmark environmental initiatives. The Alliance program is guided by a Steering Committee comprised of leaders in sustainability policy, programs and initiatives:
Richard S. Cohen, Managing Director, Strategic Investments Group, Bank of America Mark Cowin, Deputy Director for Regional Water Planning and Management,
California Department of Water Resources Gary Gero, President, California Climate Action Registry Rob Hammon Ph.D., Principal, Consol, Inc. Bridgett Luther, Director, State of California Department of Conservation Timothy Tutt, Advisor to California Energy Commission Chair J.Pfannenstiel Laurie Weir, Portfolio Manager, CalPERS Global Real Estate Investment
For information about the California Sustainability Alliance, go to:
www.sustainca.org
This study was conducted by the California Sustainability Alliance with the assistance of its Water‐Energy Committee:
John Andrew, Executive Manager for Climate Change, Department of Water
Resources Martha Davis, Executive Manager for Policy Development, Inland Empire
Utilities Agency Kamyar Guivetchi, P.E., Manager, Statewide Water Planning, Department of
Water Resources Fawzi Karajeh, Chief, Water Recycling and Desalination Branch, Office of
Water Use Efficiency and Transfers, California Department of Water Resources
Lillian Kawasaki, Director, Water Replenishment District of Southern California
Bill McDonnell, Senior Resource Specialist, Metropolitan Water District of Southern California
Richard Sapudar, Water & Energy Efficiency Specialist, Public Interest Energy Program, California Energy Commission
Meena Westford, Area Planning Officer, Southern California Area Office, U.S. Bureau of Reclamation
Lorraine White, Specialist, California Energy Commission Robert Wilkinson, Ph.D., Director, Water Policy Program, Bren School of
Environmental Science and Management at the University of California, Santa Barbara
Principal authors Laurie Park, Bill Bennett, Stacy Tellinghuisen, Chris Smith and Robert Wilkinson were assisted by members of the WateReuse Association. Craig McDonald, Managing Director of Navigant Consulting and David Blanke, Manager of New Construction for Southern California Gas Company and San Diego Gas and Electric Co. served as Principal Technical Advisors. Special thanks are due to the management and staff of the water and wastewater agencies – Inland Empire Utilities Agency, Los Angeles Department of Water and Power, Metropolitan Water District of Southern California, San Diego County Water Authority, and the Cities of Ontario and San Diego ‐ who directly participated in this study and provided valuable information and data about their water systems, plans and operations.
i
TABLE OF CONTENTS Glossary ......................................................................................................................................... ii Abbreviations and Acronyms.................................................................................................... iv List of Tables and Figures........................................................................................................... vi Executive Summary ..................................................................................................................... 1 Introduction................................................................................................................................... 6 Section 1 ‐ California’s Water Supply Challenges ................................................................... 9 Section 2 ‐ The Energy Intensity of Water............................................................................... 13 Section 3 – The Role of Marginal Supplies in Determining Avoided Energy Costs ......... 17
Average and Marginal Resources ........................................................................................ 17 The Single Customer Perspective ........................................................................................ 18 The Statewide Perspective .................................................................................................... 20 The Relationship of Avoided Energy Costs to Water ....................................................... 22 Statewide Marginal Water Supply(s) .................................................................................. 23 Seawater Desalination’s Role in California’s Water Supply Portfolio............................ 27
Section 4 – The Recycled Water Opportunity......................................................................... 34 The Energy and Carbon Benefits of Recycled Water ........................................................ 36 The Stateʹs Recycled Water Potential .................................................................................. 39 Recycled Water Opportunity Profiles of Select Southern California Water Agencies . 44 The Single Agency Perspective ............................................................................................ 55 The Statewide Perspective .................................................................................................... 57 California’s Avoided Energy & Carbon Cost of Recycled Water.................................... 61 The High Cost of Using Recycled Water ............................................................................ 64
Section 5 – Summary of Findings............................................................................................. 67 Section 6 – Recommendations .................................................................................................. 74 APPENDICES A Significant Recycled Water Policies, Rules and Regulations B Water Agency Profile: Inland Empire Utilities Agency C Water Agency Profile: City of Ontario D Water Agency Profile: City of San Diego E Water Agency Profile: Los Angeles Department of Water and Power
ii
GLOSSARY Base‐load supply – The primary source(s) of water used to meet an organizationʹs demand.
Beneficial use – Use of water that either directly or indirectly benefits people, animals or the environment.
Brackish water ‐ Water containing dissolved minerals in amounts that exceed normally acceptable standards for municipal, domestic, and irrigation uses (considerably less saline than sea water). Conjunctive use ‐ The operation of a groundwater basin in combination with a surface water storage and conveyance system (i.e., where water is stored in the ground water basin for later use by intentionally recharging the basin during years of above‐average water supply). Conveyance – Transportation of water over extensive distances, through canals, aqueducts, pipelines, and pumping systems.
Direct water recycling – A direct, intentional use or application of treated wastewater. Distribution – Transportation of water within an agency or utility’s service territory, through a system of pipelines and pumps.
Effluent ‐ Waste water or other liquid, partially or completely treated or in its natural state, flowing from a treatment plant.
Groundwater – Water that occurs beneath the land surface, stored in the pore spaces of alluvium, soil, or rock formations. It excludes soil moisture.
Groundwater recharge – The natural or artificial process of surface water infiltration into a groundwater basin.
Indirect potable reuse – The use of treated wastewater for potable purposes following an intermediary step, such as storage in a surface reservoir or groundwater aquifer.
Indirect water recycling – Unintentional or incidental reuse of treated wastewater. Marginal water supply – The last unit of water supply used to meet demand. On a short‐run basis, that tends to be the last unit of existing water supply. On a long‐run basis, that tends to be the next unit of water supply that needs to be developed to meet future demand.
Primary supply – The main, preferred source of water for an agency, utility, or city. Primary treatment – physical removal of solids and greases from wastewater. Reclaimed water – Generally used synonymously with “recycled water”, but typically implying additional treatment above the minimum level required for discharge of wastewater effluent.
iii
Recycled water – Municipal, industrial, or agricultural wastewater which, as a result of treatment, is suitable for a direct beneficial use or a controlled use that would not otherwise occur.
Retail water deliveries – Water that is provided to individual customers and end users by a water purveyor.
Reuse – Generally used synonymously with “recycled water”. Water reuse can, however, include use of any water, treated to any level (primary, secondary, tertiary) or untreated.
Seawater intrusion barrier – Injection of surface water supplies into a groundwater basin that retards the infiltration of seawater into a (fresh) groundwater basin.
Secondary treatment –biological treatment to remove dissolved organic matter. Disinfection is usually required before discharge.
Service area – The geographic area served by a water agency or utility. Tertiary treatment – Wastewater treatment that includes the processes defined by primary and secondary treatment, plus an additional treatment phase, which may involve removal of additional nutrients and suspended organic matter, and/or additional disinfection.
Wholesale deliveries – Water that is provided to an agency or utility for resale to end users of water.
iv
ABBREVIATIONS AND ACRONYMS AF – Acre foot AFY – Acre feet per year AWT – Advanced water treatment CDA – Chino Basin Desalter Authority CO2 – Carbon Dioxide CPUC – California Public Utilities Commission DPH – Department of Public Health DWR – Department of Water Resources GW ‐ Gigawatts GWh – Gigawatt hour HOA – Homeowners’ association IEUA – Inland Empire Utilities Agency IOU – Investor Owned Utility IPR – Indirect potable reuse kW ‐ Kilowatt kWh – Kilowatt hour LADWP – Los Angeles Department of Water and Power MAF – Million acre‐feet MG – Millions of gallons MGD – Millions of gallons per day MW – Megawatt MWD – Metropolitan Water District of Southern California MWDOC – Municipal Water District of Orange County MWh – Megawatt hour NCWRP – North City Water Reclamation Plant (City of San Diego) NMC – New Model Colony of Ontario, CA NRW – Non‐reclaimable wastewater OCWD – Orange County Water District OMC – Old Model Colony of Ontario, CA OWD – Otay Water District RP‐1, RP‐2, RP‐4, RP‐5, CCWRF – IEUA’s wastewater treatment facilities RWQCB – Regional Water Quality Control Board SARWQB – Santa Ana Regional Water Quality Control Board SAWC – San Antonio Water Company SAWPA – Santa Ana Watershed Project Authority
v
SBWRP – South Bay Water Reclamation Plant (City of San Diego) SCE – Southern California Edison SDCWA – San Diego County Water Authority SDG&E – San Diego Gas and Electric Company SRF – State Revolving Fund SWP – State Water Project SWRCB – State Water Resources Control Board TAF – Thousand acre‐feet TDS – Total dissolved solids TP – Treatment plant UWMP – Urban Water Management Plan WFA – Water Facilities Authority WWTP – Waste Water Treatment Plant
vi
LIST OF TABLES AND FIGURES
Tables
3‐1 Application of Avoided Cost in Determination of Cost Effectiveness
3‐2 Planned Seawater Desalination Plants as of 2006
4‐1 Approved Uses of Recycled Water
4‐2 Comparison of Four Southern California Water Agencies
4‐3 Recycled Water Opportunity Profiles of Four Southern California Water Agencies
4‐4 IEUA Recycled Water Profile
4‐5 IEUA Annual Recycled Water Added Capacity Summary
4‐6 Estimated Recycled Water Benefit Under IEUA’s Accelerated Plan
4‐7 Costs of Retrofitting Customer Sites for Recycled Water
4‐8 Estimated Capital Costs for IEUAʹs Accelerated Three‐Year Business Plan
4‐9 Treatment Capacity and Flows of San Diego’s Wastewater Treatment Plants in 2005
4‐10 City of San Diego Recycled Water Profile
4‐11 San Diegoʹs Strategies for Development of Its Recycled Water Infrastructure
4‐12 City of Los Angelesʹ Recycled Water Profile
4‐13 Single Agency Perspectives
4‐14 Statewide Perspective
4‐15 The Energy and Carbon Value of Recycled Water
4‐16 Range of Heat Rates and Emissions Used to Compute Avoided Energy Costs
4‐17 Average Emissions Factors
4‐18 Comparison of Recycled vs. Potable Water Rates
5‐1 Quantifying the Societal Value of Recycled Water
5‐2 The Energy and Carbon Benefits of Accelerated Recycled Water Development
A‐1 Potential Uses of Secondary‐ and Tertiary‐Treated Recycled Water
A‐2 California’s Policies and Regulations Governing Recycled Water Use and Development
B‐1 Projected Water Supply in IEUA Service Area by Source
B‐2 Average Regional Plant Wastewater Daily Flow Projections

vii
B‐3 Projected Recycled Water Demand Under Accelerated Plan
B‐4 Projected Direct Use & Groundwater Recharge Capacity Added
B‐5 Water Agencies Within IEUA Service Area
B‐6 Water Demand in IEUA’s Service Area
B‐7 Summary of Projected Recycled Water Use
B‐8 Costs of Retrofitting Customer Sites for Recycled Water
B‐9 Build‐Up of Energy Along the Water Cycle in IEUAʹs Primary Water Supplies
B‐10 Power Use at the Chino I Desalter
B‐11 Energy Used in Developing IEUAʹs Water Supplies
B‐12 Phased Recycled Water Development Plan as of 2005
B‐13 Recycled Water System Expansion Projects
C‐1 Total Projected Demand for the City of Ontario
C‐2 Projected Recycled Water Demand in the City of Ontario
C‐3 Projected Recycled Water Demand by User Type
C‐4 Monthly Volume Commodity Charge
C‐5 Energy Intensity of the City of Ontario’s Water Supplies (By Production Step)
C‐6 Total Energy Intensity of the City of Ontario’s Water Supplies
C‐7 Recycled Water System – Planned Expansion Projects and Associated Costs
D‐1 Water Customers in the City of San Diego
D‐2 Projected Water Supply Sources for the City of San Diego, 2010 – 2030
D‐3 Capacity and Flows of San Diego’s Wastewater Treatment Plants
D‐4 Strategies for Development of Recycled Water Infrastructure
D‐5 Recycled Water System Expansion Opportunities Beyond “Baseline” Expansions
D‐6 Total Potable Water Use and Estimated Savings from Existing and Potential
(Undeveloped) Demand Management and Conservation Programs
D‐7 Projected Deliveries of Potable and Recycled Water to Wholesale Customers Outside of
San Diego’s City Limits
D‐8 Recycled Water Use in 2005 in San Diego
D‐9 Funding Programs Available to Recycled Water Programs in the Greater San Diego Area
D‐10 Proposed Mandatory Use of Recycled Water in Existing Buildings
viii
D‐11 Proposed Mandatory Use of Recycled Water in New Buildings
D‐12 City of San Diego Energy Requirements and Water Summary
D‐13 Total Energy Intensity of the City of San Diego Water Supplies
D‐14 City of San Diego Energy Requirements and Water Summary for Water Reuse
Alternatives
D‐15 Energy Savings Summary for Water Reuse Study ‐ Strategy NC‐1
D‐16 Summary of Energy Savings
D‐17 Summary of Water Reuse Rebates for Strategy NC‐1
D‐18 Comparison of Costs, Rebates, and Avoided Costs for Strategy NC‐1
E‐1 LADWPʹs Water Supply Portfolio Under Average Year Hydrology
E‐2 The City of Los Angeles’ Three Tertiary Treatment Plants
E‐3 Historical and Projected Water Use in LADWP’s Service Area Under Normal Weather
Conditions
E‐4 Potential Recycled Water Demand in the City of Los Angeles
E‐5 Summary of Use and Projected Supply of Recycled Water for the City of Los Angeles
E‐6 Additional Opportunities for System Expansion in the LADWP Service Territory
E‐7 Energy Intensity of LADWP’s Water Supplies (By Production Step)
E‐8 Total Energy Intensity of LADWP’s Water Supplies
ix
Figures
1‐1 Variations in California’s Annual Hydrology
1‐2 Californiaʹs Multi‐Year Historical Dry Periods, 1850‐Present
1‐3 Range of Average Annual Precipitation Across Regions, 1961 – 1990
1‐4 Range of Additional Annual Water for Eight Resource Management Choices
2‐1 The Water Use Cycle with Range of Energy Intensity Estimates
2‐2 Energy Intensity of Selected Southern California Water Supplies
3‐1 Average and Marginal Resources
3‐2 ILLUSTRATIVE Factors Driving Supply Choices
3‐3 Targeted Development of Local Resources in MWD’s Service Area
3‐4 Planned Desalination Plants in California as of Spring 2006
4‐1 Approach for Determining the Energy & Carbon Benefits of Recycled Water
4‐2 Map Showing Geographic Relationship of Water Agencies Studied
4‐3 Relationship of the Water Systems Studied
4‐4 Recycled Water Benefit Under IEUA’s Accelerated Plan
4‐5 A New Water‐Energy‐Climate Paradigm
4‐6 “Typical” Build‐Out of Recycled Water System
5‐1 Relative Energy Intensity of Water Resources for Four Southern California Water
Agencies
6‐1 Including Energy & Carbon Benefits Expands the Portfolio of ʺCost‐Effectiveʺ Options
A‐1 Treatment Stages for Recycled Water
B‐1 Projected Water Supplies for the IEUA Service Area
B‐2 Chino Groundwater Basin in IEUA Service Territory
B‐3 Current Status and Anticipated Construction Projects in IEUA’s Recycled Water System
B‐4 IEUA Service Area and Contracting Agencies’ Spheres of Influence
B‐5 Urban Water Use
B‐6 Recycled Water Demand by End Use in 2005
B‐7 Direct Use of Recycled Water in IEUA’s Service Area 2006‐2007
B‐8 Projected Distribution of Recycled Water for Direct Use 2010/1011
B‐9 ʺTypicalʺ Build‐Out of Recycled Water Distribution Systems
x
B‐10 Relative Energy Intensity of IEUA Water Supply Options
C‐1 Water Supplies for the City of Ontario, 1990 – 2004
C‐2 Projected Potable Water Demand for the City of Ontario
C‐3 Projected Recycled Water Demand in the City of Ontario
C‐4 Recycled Water Demand in the City of Ontario by End User
D‐1 Map of San Diego County Water Authority Service Territory and Member Agencies
D‐2 Existing and Planned Distribution Lines, Storage, and Treatment Facilities Surrounding
the North City Water Reclamation Plant
D‐3 Existing and Planned Distribution Lines, Storage, and Treatment Facilities Surrounding
the South Bay Water Reclamation Plant
D‐4 Annual Water Demands by Sector for the City of San Diego
E‐1 Historical Water Supply for LADWP
E‐2 Major Sources of Water Supply for Los Angeles
E‐3 Wastewater Treatment in the City of Los Angeles
E‐4 Map Showing the Locations of City of Los Angeles’ Four Wastewater Treatment Plants
and the Seven Sewersheds
E‐5 LADWP’s Existing, Planned and Potential Recycled Water Project Infrastructure
E‐6 The City of Los Angeles’ Projected Water Demands Under Three Different Weather
Scenarios
E‐7 Map of Potential Recycled Water Customers, Existing Pipelines, and Supply Expansion
Regions
E‐8 Energy Use in LADWP’s Service Area
1
EXECUTIVE SUMMARY
Background The California Sustainability Alliance (www.sustainca.org) is an innovative cross‐cutting market transformation program designed to significantly increase and accelerate adoption of energy efficiency by packaging it with complementary ʺsustainabilityʺ measures (i.e., energy and water use efficiency, renewable energy, ‘smart’ land use and growth, waste management, and transportation management). In this manner, energy efficiency can be achieved more effectively and cost‐effectively. The Alliance program is comprised of multiple projects and programs, all dedicated towards (1) advancing and promulgating the body of sustainability best practices, tools and techniques; (2) leveraging the collective resources of all partners ‐‐ both public and private; local, state and federal; and (3) widely disseminating knowledge about emerging and existing best sustainability practices. The ultimate goal of the program is widespread holistic adoption of comprehensive sustainability throughout California. An important aspect of the Alliance’s path to market transformation is the participation of market and policy leaders in the identification of high potential opportunities, and then in the development, pilot‐testing and implementation of innovative initiatives designed to overcome primary barriers to sustainability. California’s water industry is one of five high priority sectors targeted by the Alliance program.1 Senior water and wastewater agency managers throughout the state brainstormed about opportunities for significantly reducing the water sector’s energy and carbon footprint. Recycled water was selected as a high potential area that is becoming increasingly important as a means of reserving limited potable water supplies for potable uses. A decision was made to focus the study on water, energy and carbon‐stressed Southern California where significant recent reductions of historical water supplies and continued high growth in water demand is triggering substantial investments in new water resources and infrastructure.
Significant Findings
1. Southern California is preparing to invest hundreds of millions of dollars in water resources and infrastructure to assure long‐term water reliability. Decisions made today will lock in energy and carbon implications for many years.
2. Recycled water is a relatively low energy intensity resource that is available now in substantial quantities, but is largely being released without application to beneficial
1 The other four sectors targeted during the Alliance’s 2006‐2008 program are affordable housing, new mixed use communities, commercial office buildings, and local government.
2
uses. Presently, about 415,000 acre‐feet of tertiary and secondary wastewater is being discharged by four water agencies in Southern California which could be used as a beneficial water supply. That number is higher – about 580,000 acre‐feet per year – when advanced primary effluent is included. These numbers do not include recycled water that is used to provide water for environmental purposes or for recharging aquifers.
Southern California is presently seeking an additional 1 million acre‐feet of water to make up for reductions in historical imported and other water supplies. Incremental recycled water available now from the four agencies studied (Inland Empire Utilities Agency and the Cities of Ontario, Los Angeles and San Diego) could potentially meet more than 50% of that supply shortfall if methods or incentives for customers to use the supplies could be implemented.
3. The high cost of dual‐plumbing needed to transport and use recycled water is a major barrier. Substantial investments in recycled water infrastructure by both water and wastewater agencies and their customers will be needed to beneficially use all of the available recyclable water. More than $500 million in capital improvements is needed just to develop the distribution infrastructure for 90,000 acre‐feet per year of unutilized tertiary wastewater. These estimates do not include the additional costs of improvements needed to dual‐plumb customer facilities so that they can use the recycled water. The costs for developing and delivering an additional 325,000 acre‐feet per year of secondary wastewater are not yet known.
4. The energy and carbon benefits achievable by increasing use of recycled water in favor of more energy intensive options such as seawater desalination are significant. For the four agencies studied, the annual energy and carbon benefits of accelerated development of available tertiary and secondary recyclable water totals 1,400 gigawatt hours and 540,000 metric tons of CO2 – about 16% of California’s annual energy efficiency goals, the equivalent of a very efficient 180 MW power plant (or a more ‘typical’ 240 MW power plant with an average heat rate of 9600 BTUs/kWh).
Conclusions The urgency of the water supply situation in Southern California provides a timely opportunity to influence hundreds of millions of dollars in water sector investments to support the state’s aggressive energy and carbon reduction goals. A conservative estimate indicates that the value of the energy and carbon benefit of recycled water is about $270 per acre‐foot – coincidentally, a level similar to the $250/AF maximum subsidy presently paid by the Metropolitan Water District of Southern California (MWD) to its 26 member cities and agencies to develop new wholesale water supplies. California’s long‐term water reliability will ultimately depend on a diversified resource portfolio that includes drought risk mitigation measures. Seawater desalination is viewed as the superior drought hedge – not just in California, but globally. Recycled
3
water also has some drought tolerance; but since recycled water is produced by the consumption of water, water conservation and efficiency reduces the availability of recyclable water. Since water use reductions will occur during droughts, recycled water is not as reliable as a drought hedge. Conversely, while seawater desalination has important implications for long‐term water reliability and security, it has a comparatively high energy and carbon footprint; and its highest energy needs may coincide with periods of extended drought when the state’s hydropower production may be lower and the costs of energy higher. Recycled water and seawater desalination both have important roles in California’s diverse portfolio of water supply options which represent a wide range of energy and carbon characteristics. Of these resource options, water conservation and efficiency –avoiding water consumption – is the most beneficial option from an energy and carbon perspective. The next most beneficial option in Southern California from an energy and carbon perspective is recycled water.
Recommendations 1. The state should take definitive actions now to accelerate the beneficial use of
tertiary and secondary wastewater that is being discharged to the ocean and to other natural waterways but is not needed for environmental water or serving any other important purposes.
• Adopt an interim proxy for valuing the energy and carbon benefits of recycled
water. Every acre‐foot of recycled water discharged to the ocean or other natural waterway that could have offset use of limited potable water supplies represents a significant lost opportunity for California. Adopting an interim proxy facilitates near‐term investment decisions that fully consider the water, energy and carbon benefits of recycled water options on a holistic societal basis. Including consideration of these additional value streams increases the portfolio of cost‐effective recycled water options. Based on its investigations, the Alliance recommends a proxy of 3,400 kWh per acre‐foot of additional recycled water developed and used in Southern California. At a levelized electricity price of $0.08/kWh, this equates to about $270 per acre‐foot. There is substantial precedent in California for employing proxies to allow important decisions to be made to minimize lost opportunities, while studies proceed in parallel to further refine data and methods.
• Develop a “California Recycled Water Blueprint” (Blueprint). This study focused on four agencies in water, energy and carbon‐stressed Southern California. Additional work should be conducted to assess the statewide recycled water potential by region to facilitate effective allocation of the state’s investments in water resources and infrastructure. The Blueprint should include a comprehensive ranked inventory of recycled water programs and projects that
4
could be constructed within 3‐5 years to minimize lost opportunities and maximize energy and carbon benefits. The ranking of investments should include the total resource costs and benefits of recycled water options (i.e., including energy and carbon benefits).
• Convene a cross‐cutting policy leadership group to develop and expedite remedies to significant recycled water barriers. Most water and wastewater agencies cited two primary barriers to increasing use of recycled water: (a) public perception, and (b) the high cost of dual‐plumbing. In addition to these challenges, it is well documented and known that dual plumbing is much less expensive when installed in new construction than during retrofits. Some cities and agencies have local ordinances that strongly encourage use of recycled water for certain large water uses, such as for landscape irrigation in new developments. While some mandates also exist, jurisdictions are often pressured to issue waivers when the incremental costs of dual‐plumbing are deemed to impair the economic viability of development projects. These types of challenges raise complex issues that are appropriately addressed jointly by water, energy and environmental policymakers.
• Increase recycled water incentives. Accelerating the development and use of recycled water supplies and infrastructure will require significant capital investments. Water and wastewater agencies should be compensated for these incremental investments on the same basis as other energy efficiency programs – i.e., through incentives equivalent to the avoided cost of energy. This will enable significantly leveraging water sector investments to produce and deliver more recycled water, faster. In addition, these incentives can be used to buy down the uneconomic costs of dual‐plumbing customers’ sites, thereby helping to overcome a significant barrier to recycled water use.
• Create streamlined approaches that expedite development of recycled water. Accelerated development of recycled water will significantly increase burdens on water managers already challenged with addressing urgent water supply shortages. It may therefore be beneficial for the state to form one or more joint powers authorities, special districts, or other types of organizations that can undertake implementation of a statewide “Recycled Water Blueprint” on behalf of participating California water agencies. Joint water recycling programs with regionally‐focused incentive programs and market mechanisms could reduce development risks, time and costs. In addition, it could enable access to financing options that might not be available to individual water agencies. Further, since recycled water can only be applied to certain authorized uses, there may be circumstances in which a wastewater agency that produces a high volume of recyclable wastewater does not have sufficient recycled water demand to justify developing its full potential. Shared development and use of recycled water could provide incentives for water and wastewater agencies to develop
5
and seek beneficial uses for all of their available recyclable water supplies.
2. The state could establish market‐based mechanisms that facilitate transfers of recycled water from agencies that may have but do not need, to those that need, to enable accessing the full statewide recycled water potential.
The energy industry has adopted the concept of “Green Tags” for trading the value of energy and environmental attributes associated with renewable energy, and “White TagsTM”2 to recognize the value of energy saved through energy efficiency. A similar market could be created for “Blue Tags”. On a statewide basis, or a sub‐regional basis within large water basins in the State, market mechanisms such as Blue Tags could provide economic compensation for the environmental attributes associated with development and use of recycled water. These values could then be used to help water and wastewater agencies and their customers offset the high costs of recycled water infrastructure and dual plumbing of end users’ facilities. As with pollution offsets and renewable energy credits, Blue Tags would encourage the most cost‐effective resource options to be implemented first, thereby accelerating the opportunity for recycled water to displace higher energy intensity water supplies.
3. This study focused on recycled water due to its anticipated high potential for significant energy and carbon benefits. A future phase should expand the Blueprint to include identification and evaluation of other low energy and carbon intensity water resource options to fully optimize the state’s water investments.
2 The term ʺwhite tagsʺ was trademarked in the U.S. by Sterling Planet, http://www.sterlingplanet.com/. The concept for ʺenergy efficiency creditsʺ originated in the United Kingdom, France and Italy.
6
INTRODUCTION California is at a critical juncture with respect to its water supplies. Inter‐basin water transfers to Southern California from the Colorado River and from Northern California are limited due to a lack of surplus water in the systems and to environmental constraints. Extended drought throughout the Western U.S. has resulted in drawing down Lake Mead and other dry year reserves to dangerously low levels. At the current rate of withdrawals, it will take many years of continuous high precipitation to refill Lake Mead. In the meantime, Colorado River water deliveries and even hydropower production may need to be curtailed. The threat at Lake Mead exemplifies the undeniable interdependencies among water, energy, and climate. There are others. Water is pumped from the Sacramento–San Joaquin Delta to the Bay Area and to the San Joaquin Valley and Southern California. The amounts allowed to be extracted from the Delta are being reduced substantially through court orders to protect listed species. The California Aqueduct was constructed to deliver this vital water supply, known as the State Water Project, to users in Central and Southern California. This important source of water is now being reduced by about 30 percent. Southern California water agencies are preparing to make substantial investments in water resources and infrastructure to make‐up for the reductions in traditional imported supplies from the Colorado River and the Delta. These activities provide a timely window of opportunity to integrate consideration of energy and carbon impacts into water resource decisions. Recycled water is available now in significant quantities. The state’s Recycled Water Task Force and the 2005 California Water Plan Update estimated that 800,000 to 1.4 million acre‐feet of recycled water is being discharged every year to the ocean and to natural waterways without being applied to beneficial uses. If all of this water could be applied to beneficial uses, recycled water could provide water supply reliability at far less energy than more energy‐intensive supply options such as seawater desalination. The concept of supply switching – i.e., encouraging use of lower energy intensity water supplies to displace higher energy intensity water supplies – was a strategy recommended by the Energy Commission in its 2005 report about “California’s Water‐Energy Relationship.”
Study Objectives The California Sustainability Alliance (Alliance) interviewed key water and energy stakeholders to identify options that reasonably could be done today, without a change to existing policies. These discussions resulted in the recommendation to integrate
7
energy values of various types of water supply resources into a water resource loading order that parallels that adopted by the Joint Agencies in the state’s Energy Action Plan3. The primary benefits anticipated by establishing a comparable water resource loading order are the ability to include consideration of energy and associated carbon impacts into water supply and infrastructure decisions, and the potential to optimize all three (water, energy and carbon) on a statewide basis. An expert panel – the Water‐Energy Committee – was assembled to guide the Alliance’s efforts. There was consensus among committee members that like energy efficiency, water conservation (i.e., avoiding use of water) is the most cost‐effective and environmentally preferred resource option. There was also general agreement that after conservation, recycled water likely had the lowest energy and carbon impacts. A number of fairly recent and comprehensive studies had also concluded that much more recycled water was available than is being beneficially used, further reinforcing the premise that recycled water has high potential for significantly reducing water‐related energy consumption and associated carbon emissions. With strong encouragement from key stakeholders, the Alliance embarked upon a study of the energy and carbon benefits that could be achieved by accelerating and increasing use of recycled water in water, energy and carbon‐stressed southern California. This study has three primary objectives: • To develop an approach for attributing energy and carbon values to recycled water; • To estimate the magnitude of energy and carbon values achievable by accelerating
and increasing use of recycled water in Southern California; and • To recommend remedies to primary barriers. In conducting this study, we relied upon work by others that addressed many of the opportunities and impediments associated with recycled water. Several studies and organizations were particularly important. • In 2002, the U.S. Bureau of Reclamation (USBR) completed a comprehensive, multi‐
year study on water recycling in Southern California, identifying the regional water recycling potential, short‐term projects, and barriers to implementation.4 Since
3 California’s three key energy agencies – the California Energy Commission (CEC), the California Power Authority (CPA), and the California Public Utilities Commission (CPUC) – adopted an “Energy Action Plan” (EAP) in 2003 that listed joint goals for California’s energy future and set forth a commitment to achieve these goals through specific actions. The EAP was updated in 2005 by the CEC and CPUC (CPA no longer exists). The EAP adopted an “energy resource loading order” that would determine the priority of actions for meeting the state’s energy requirements. That resource loading order specified energy efficiency, demand response and renewable energy as the state’s preferred resource options, in that order. 4 Southern California Water Reclamation and Reuse Study. http://www.usbr.gov/lc/socal/reports/sccwrrs/FinalReport.pdf
8
completion of this study, the Bureau of Reclamation shifted its efforts to project implementation by leading the Southern California Water Recycling Projects Initiative.5
• The Recycled Water Task Force, convened in 2002, identified 26 major issues facing
recycled water use across the State, and provided recommendations for overcoming these barriers. Of note, the Task Force recommended adoption of a statewide policy by the State Water Resources Control Board that is currently under review.
• Finally, California’s Water‐Energy Relationship, a report prepared by the California
Energy Commission in support of its 2005 Integrated Energy Policy Report, described recycled water as “the least energy‐intensive source in the State’s water supply”.6
The studies described above, in addition to research by the WateReuse Association and local agencies, have served as a valuable resource to state, regional, and local stakeholders. This report builds on these prior studies by quantifying the energy benefits and costs associated with recycled water for four water agencies in Southern California ‐ the Inland Empire Utilities Agency and the Cities of Ontario, San Diego, and Los Angeles. These agencies represent three of the four major reclamation districts identified by the USBR in its extensive studies.7 With the assistance of the WateReuse Association, the Department of Water Resources, the California Energy Commission, Southern California water and wastewater agencies, and other water and energy stakeholders, the California Sustainability Alliance embarked upon this study to estimate the energy and carbon benefits that could be achieved by accelerating and increasing development and use of recycled water in Southern California.
5 Regional Partnerships White Paper: http://www.usbr.gov/lc/socal/reports/PartnershipWhitePaper.pdf . Other project links: http://www.usbr.gov/lc/socal/planning.html . 6 http://www.energy.ca.gov/2005publications/CEC‐700‐2005‐011/CEC‐700‐2005‐011‐SF.PDF p. 28 7 The four reclamation regions studied by the USBR in its July 2002 ʺPhase II Southern California Comprehensive Water Reclamation and Reuse Studyʺ were Los Angeles Basin, Orange County, San Diego County, and Inland Empire.

9
SECTION 1 ‐ CALIFORNIA’S WATER SUPPLY CHALLENGES It is always difficult for California’s water managers to plan for any particular year ‐ they never know what kind of water year they are having until the year is well underway. Figure 1‐1 below indicates the significant variability of annual water supplies from surface runoff.
Figure 1‐1
Variations in California’s Annual Hydrology8
Additions to Water Supply from Runoff
15
329.6
187.7
139.2
0
50
100
150
200
250
300
350
400
1977 1998 2000 2001
Water Year
Millions of A
cre‐Feet
Not only can water managers not yet predict with sufficient confidence whether a year will be wet, dry or “normal” – they also do not know whether a dry year will be followed by a wet one, or whether there may be multiple sequential dry years (drought). Consequently, California’s water managers plan water supplies for multiple years, never knowing whether the current year will be the first year of an extended drought.
Figure 1‐2 Californiaʹs Multi‐Year Historical Dry Periods, 1850‐Present9
8 California Water Plan Update 2005, Department of Water Resources Bulletin 160‐05, Volume 3, p.1‐12 and California Department of Water Resources Website, Drought Preparedness Frequently Asked Questions, viewed February 21, 2008. http://watersupplyconditions.water.ca.gov/questions.cfm 9 California Department of Water Resources Website, Defining Drought, viewed February 21, 2008. http://watersupplyconditions.water.ca.gov/background.cfm
Water year 2000 was just about “normal” at 97% of average precipitation. The following year was dry, about 72% of normal. The difference in contributions to California’s water supply was 48.5 million acre‐feet, about 16 trillion gallons. In 1998, a 171% water year, precipitation added 107 trillion gallons to California’s water supply. The driest year on record within the past 100 years was 1977, a 21% water year, which contributed a scant 15 million acre‐feet, about 5 trillion gallons.
10
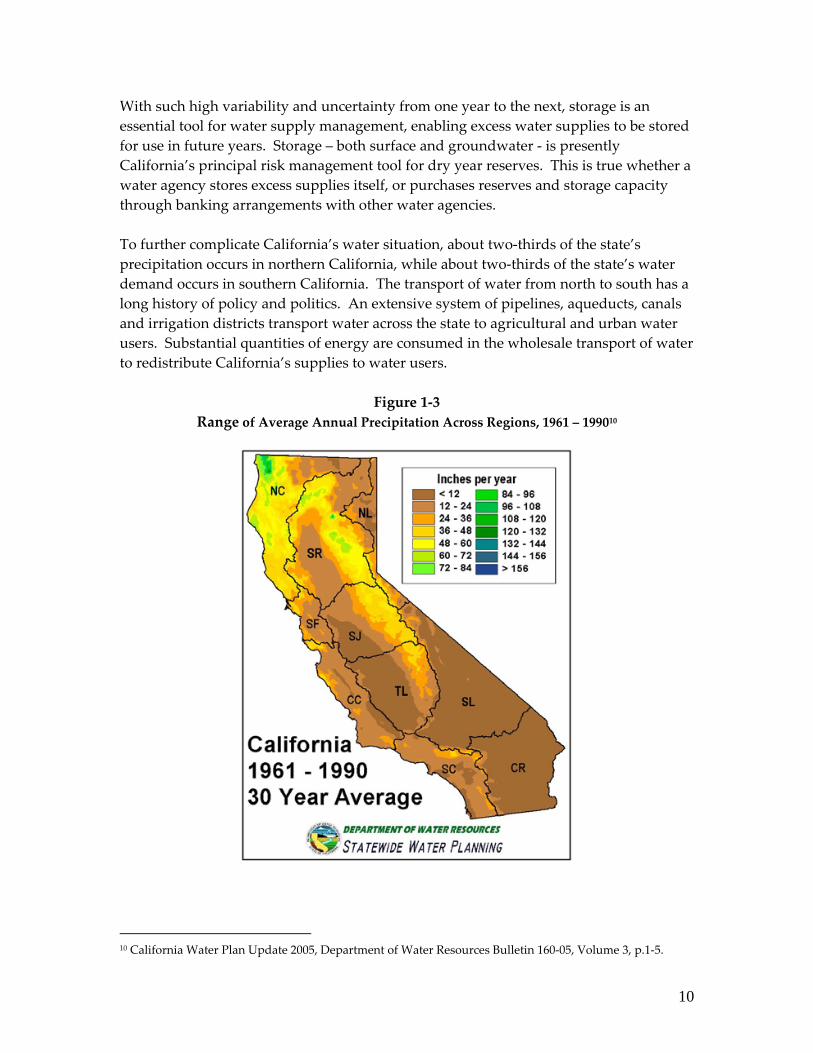
With such high variability and uncertainty from one year to the next, storage is an essential tool for water supply management, enabling excess water supplies to be stored for use in future years. Storage – both surface and groundwater ‐ is presently California’s principal risk management tool for dry year reserves. This is true whether a water agency stores excess supplies itself, or purchases reserves and storage capacity through banking arrangements with other water agencies. To further complicate California’s water situation, about two‐thirds of the state’s precipitation occurs in northern California, while about two‐thirds of the state’s water demand occurs in southern California. The transport of water from north to south has a long history of policy and politics. An extensive system of pipelines, aqueducts, canals and irrigation districts transport water across the state to agricultural and urban water users. Substantial quantities of energy are consumed in the wholesale transport of water to redistribute California’s supplies to water users.
Figure 1‐3 Range of Average Annual Precipitation Across Regions, 1961 – 199010
10 California Water Plan Update 2005, Department of Water Resources Bulletin 160‐05, Volume 3, p.1‐5.

11
The color contour map illustrates dramatically the geographic distribution of historical hydrology in California. Fourteen colors indicate ranges of precipitation from a low range less than 12 inches per year (predominantly in the southeastern part of the state) to more than 156 inches per year in some northern parts of the state. Californiaʹs water supply risk management strategies are based on recorded hydrology. Scientific studies indicate that prior to recorded hydrological history (about 100 years), it is likely California and the western U.S. experienced much longer periods of extended drought. The criteria for drought risk management varies among the agencies; but typically, California water managers plan dry year reserves sufficient to carry us through dry periods of 7‐10 years in duration. A single wet year is often not sufficient to restore our water supplies to full capacity. As shown with Lake Mead11, it will take many years of above normal precipitation to refill this valuable source of western water supplies to historical “average” levels. Adding to our water planning challenges, climate change is causing us to re‐evaluate all of our assumptions. We now anticipate changes in precipitation patterns and temperatures that could change the timing and amount of Sierra snowpack and the pattern of runoff, potentially impairing our ability to capture and store adequate water supplies. During 2007, drought and environmental impacts underscored the importance of efficient management of California’s natural resources. Drought affected most of the state, with Southern California receiving record low volumes of precipitation.12 In the Colorado River basin, drought conditions continued into an eighth year, dropping reservoir storage in both Lake Mead and Lake Powell to less than half of their total capacity.13 Compounding this, environmental issues severely restricted water deliveries from the Sacramento‐San Joaquin Delta.14 Policymakers and water managers are presently grappling with both emergency and long‐term measures to assure reliable water supplies. Short‐term measures focus heavily on water conservation (avoided or efficient use of water) and water transfers (exchanges of water supplies and/or rights to water supplies). Long‐term measures
11 Scripps Institution of Oceanography News Release dated February 12, 2008 citing paper “When will Lake Mead go dry?ʺ that was accepted for publication in the peer‐reviewed journal Water Resources Research, published by the American Geophysical Union. 12 Department of Water Resources Drought Preparedness website, viewed February 21, 2008. http://watersupplyconditions.water.ca.gov/index.cfm 13 U.S. Bureau of Reclamation website, Upper Colorado Region, viewed February 21, 2008. http://www.usbr.gov/uc/water/crsp/cs/gcd.html 14 Metropolitan Water District of Southern California press release dated August 21, 2007, “Metropolitan Board to Assess Water Management Options in 2008, After Judge Orders Historic Reductions in Supplies From Delta. Southern California loses up to 30 percent of its supplies from Delta next year and possibly longer.”

12
focus on more efficient management of wholesale water supplies (e.g., through groundwater banking and conjunctive use) and development of new local supplies. All of these measures have energy and greenhouse gas impacts – some positive, some negative. In its 2005 Water Plan Update, the California Department of Water Resources identified eight water resource options that were deemed to have a significant role in California’s future water supply portfolio.
Figure 1‐4 Range of Additional Annual Water for Eight Resource Management Choices15
As described in the next section, each of these water resource options has its own energy and greenhouse gas implications.
15 California Water Plan Update 2005, Department of Water Resources Bulletin 160‐05, Volume 2, p.1‐5.

13
SECTION 2 ‐ THE ENERGY INTENSITY OF WATER In its reports, “California’s Water‐Energy Relationship”16 and the 2005 Integrated Energy Policy Report17, the California Energy Commission adopted the concept that the energy value of various water resources can be represented by the amount of energy that was used to produce and deliver that water to end users. This value, the “energy intensity” of water, represents the amount of energy “embodied” in the water supply through upstream uses of energy. Comparing the energy intensity of water supply options enables comparison of the energy and associated greenhouse gas impacts to facilitate optimized decision making of water, energy and greenhouse gas impacts on a combined basis.
Professor Robert Wilkinson of the Donald Bren School of Environmental Science and Management at U.C. Santa Barbara developed the framework for evaluating the relative energy intensity of California’s water supply options, measuring the build up of energy used for water through segments of the water use cycle. The Energy Commission then conducted a study of the range of energy consumption for various types of water resources and systems along portions of the water use cycle. The following diagram is the result of that study.
16 “California’s Water‐Energy Relationship”, November 2005 [CEC‐700‐2005‐011‐SF]. 17 ʺ2005 Integrated Energy Policy Reportʺ, California Energy Commission, November 2005 [CEC‐100‐2005‐007CMF].
“Energy intensity is defined as the amount of energy consumed per unit of water to perform water management‐related actions such as desalting, pumping, pressurizing, groundwater extraction, conveyance, and treatment ‐ for example, the number of kilowatt‐hours consumed per million gallons (kWh/MG) of water. This concept is applied to water supplies, to components of the water use cycle, and to the total energy intensity of a unit of water throughout the entire water use cycle.” [Source: “California’s Water‐Energy Relationship,” November 2005 [CEC‐700‐2005‐011‐SF], p.4.]

14
Figure 2‐1 The Water Use Cycle with Range of Energy Intensity Estimates.18
Above ranges shown in kilowatt‐hours per acre‐foot (kWh/AF)
Recycled water is produced through the process of treating wastewater. The energy used to treat wastewater to the water quality required by regulation for safe disposal is considered “sunk” (e.g., it would be needed whether or not the wastewater effluent is eventually applied to a beneficial purpose as recycled water). Consequently, the energy intensity of recycled water is measured as the incremental amount of energy needed to treat wastewater effluent to standards higher than that required by regulators for safe discharge (e.g., if a higher quality is needed for application to the end use), plus the amount of incremental energy (if any) needed to deliver the recycled water to approved end uses. For Southern California, recycled water has less distance to be transported than imported supplies, and thus requires less energy for delivery. The following chart illustrates the relative energy intensities of the primary water supply options in Southern California.
18 This table is a compilation of “Figure 1. The water use cycle” and “Table 1. Range of energy intensities for water‐use cycle segments” from p.8 of the Energy Commission report, “Refining Estimates of Water‐Related Energy Use in California”, December 2006 [CEC‐500‐2006‐118]. This figure provides the estimated range of energy intensity experienced by water and wastewater systems and processes. Comparable information is not yet available for water end use.
Outside the retail meter
Water Conveyance
Water Treatment
End -Use AgriculturaResidentiaCommerciaIndustria
WaterDistribution
Wastewater Treatment
Wastewater Collection
Wastewater Discharge
Recycled WaterTreatment
Recycled Water
Distribution
Sourc
Source
Water Conveyance (0‐4,464)
Water Treatment (33‐5,216)
End -Use AgriculturalResidential Commercial Industrial
WaterDistribution (228‐390)
Wastewater Treatment
Wastewater Collection
Wastewater Discharge (0‐130)
Recycled WaterTreatment
Recycled Water
Distribution
Source
(359‐1,500)
(130‐390)
15
Figure 2‐2
0
1000
2000
3000
4000
5000
6000
kWh/
acre
foot
Energy Intensity of Selected Water Supply Sources in Southern California
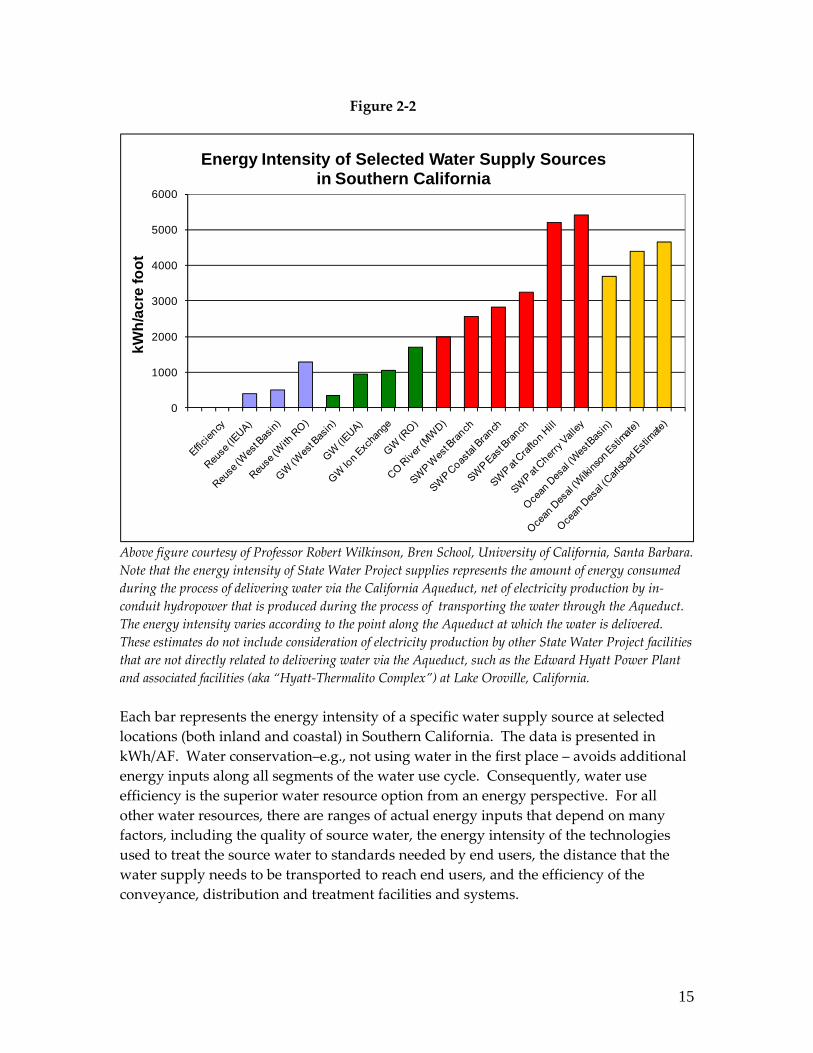
Above figure courtesy of Professor Robert Wilkinson, Bren School, University of California, Santa Barbara. Note that the energy intensity of State Water Project supplies represents the amount of energy consumed during the process of delivering water via the California Aqueduct, net of electricity production by in‐conduit hydropower that is produced during the process of transporting the water through the Aqueduct. The energy intensity varies according to the point along the Aqueduct at which the water is delivered. These estimates do not include consideration of electricity production by other State Water Project facilities that are not directly related to delivering water via the Aqueduct, such as the Edward Hyatt Power Plant and associated facilities (aka “Hyatt‐Thermalito Complex”) at Lake Oroville, California. Each bar represents the energy intensity of a specific water supply source at selected locations (both inland and coastal) in Southern California. The data is presented in kWh/AF. Water conservation–e.g., not using water in the first place – avoids additional energy inputs along all segments of the water use cycle. Consequently, water use efficiency is the superior water resource option from an energy perspective. For all other water resources, there are ranges of actual energy inputs that depend on many factors, including the quality of source water, the energy intensity of the technologies used to treat the source water to standards needed by end users, the distance that the water supply needs to be transported to reach end users, and the efficiency of the conveyance, distribution and treatment facilities and systems.

16
Next to water conservation, recycled water is a lower energy intensity choice than most other water resource options in many areas of California. Even with advanced treatment to deal with salts and other contaminants (the lavender and green bars), recycled water and groundwater usually requires far less energy than the untreated imported water (red bars) and seawater desalination (yellow bars). From an energy standpoint, greater reliance on water conservation, reuse and groundwater provides significant energy benefits. From a greenhouse gas emissions standpoint, these energy benefits provide significant potential emissions reduction benefits in direct relation to their energy savings. The next section presents the policy and planning issues that need to be considered in determining the cost effectiveness of the recycled water decision.
17
SECTION 3 – THE ROLE OF MARGINAL SUPPLIES IN DETERMINING AVOIDED ENERGY COSTS In 2006, the Energy Commission conducted a study, “Refining Estimates of Water‐Related Energy Use in California,”19 that delved into the key drivers of energy consumption that produce the ranges of energy intensity for various types of water resources.20 This study also introduced the concept that under traditional integrated resource planning applied by the energy and water sectors, the economic benefit of any resource decision is equivalent to the avoided cost of the marginal resource that will be displaced.
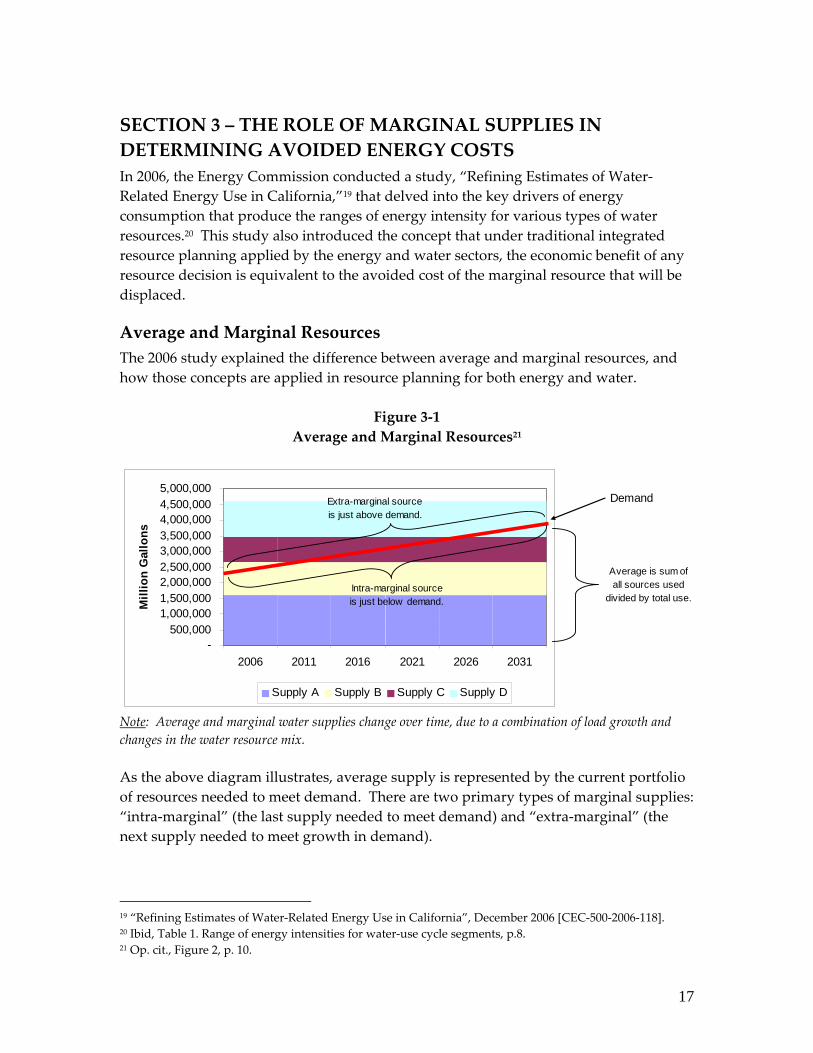
Average and Marginal Resources The 2006 study explained the difference between average and marginal resources, and how those concepts are applied in resource planning for both energy and water.
Figure 3‐1 Average and Marginal Resources21
-500,000
1,000,0001,500,0002,000,0002,500,0003,000,0003,500,0004,000,0004,500,0005,000,000
2006 2011 2016 2021 2026 2031
Mill
ion
Gal
lons
Supply A Supply B Supply C Supply D
Demand
Average is sum of all sources used
divided by total use.
Extra-marginal source is just above demand.
Intra-marginal source is just below demand.
Note: Average and marginal water supplies change over time, due to a combination of load growth and changes in the water resource mix. As the above diagram illustrates, average supply is represented by the current portfolio of resources needed to meet demand. There are two primary types of marginal supplies: “intra‐marginal” (the last supply needed to meet demand) and “extra‐marginal” (the next supply needed to meet growth in demand).
19 “Refining Estimates of Water‐Related Energy Use in California”, December 2006 [CEC‐500‐2006‐118]. 20 Ibid, Table 1. Range of energy intensities for water‐use cycle segments, p.8. 21 Op. cit., Figure 2, p. 10.
18
Prior studies of California’s water‐energy interdependencies have tended to focus on the energy intensity of the state’s short‐run intra‐marginal water supply. For Southern California, this was deemed to be the State Water Project. By contrast, California regulators use the avoided energy cost of long‐run extra‐marginal supplies as the basis for estimating the value of energy savings through efficiency. In circumstances where supplies and demands are largely static and in a state of equilibrium, valuing the impacts of decisions, programs or measures on changes to intra‐marginal resources (e.g., reallocations of existing resources) is appropriate. For California’s water and energy resources, however, where loads continue to grow, conventional supplies are diminishing, and new supplies are being proactively sought, extra‐marginal supplies – i.e., the next most likely units that will need to be developed or procured to meet demand – are more appropriate. These concepts are being reintroduced here, because they are fundamental to determining the avoided energy cost, or energy value, of the decision to accelerate and increase development and use of recycled water.
The Single Customer Perspective The premise of this study is that since recycled water is often a relatively low energy intensity water supply option, it seems likely that increasing the amount of recycled water in California’s water supply mix should produce statewide energy and greenhouse gas reduction benefits. This analysis is complicated by the fact that each water agency has its own unique mix of water resources, infrastructure, water rights, and transactions. As a consequence, when viewed from the perspective of individual water agencies, there are many different marginal water resources in Southern California, each with vastly different energy profiles. In a perfect world, integrated resource planning presumes that rational decisions will result in taking the most beneficial resources first, and the least beneficial (usually the most expensive) resources last. But we do not have “perfect” markets. Our lives are a combination of some choice with a lot of existing infrastructure, historic practices, rules, regulations, commitments, and obligations.
19
Figure 3‐2 ILLUSTRATIVE Factors Driving Supply Choices
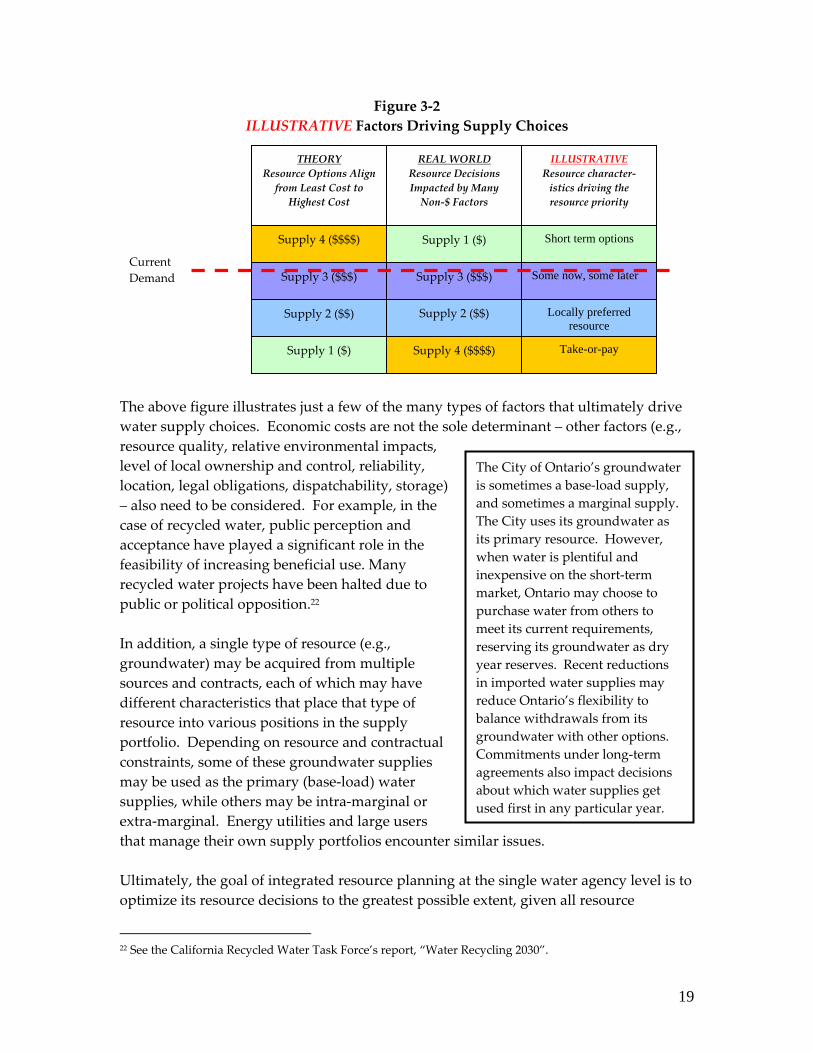
The above figure illustrates just a few of the many types of factors that ultimately drive water supply choices. Economic costs are not the sole determinant – other factors (e.g., resource quality, relative environmental impacts, level of local ownership and control, reliability, location, legal obligations, dispatchability, storage) – also need to be considered. For example, in the case of recycled water, public perception and acceptance have played a significant role in the feasibility of increasing beneficial use. Many recycled water projects have been halted due to public or political opposition.22 In addition, a single type of resource (e.g., groundwater) may be acquired from multiple sources and contracts, each of which may have different characteristics that place that type of resource into various positions in the supply portfolio. Depending on resource and contractual constraints, some of these groundwater supplies may be used as the primary (base‐load) water supplies, while others may be intra‐marginal or extra‐marginal. Energy utilities and large users that manage their own supply portfolios encounter similar issues. Ultimately, the goal of integrated resource planning at the single water agency level is to optimize its resource decisions to the greatest possible extent, given all resource
22 See the California Recycled Water Task Force’s report, “Water Recycling 2030”.
Current Demand
ILLUSTRATIVE Resource character‐istics driving the resource priority
Take-or-pay
Some now, some later
Locally preferred resource
Short term options
REAL WORLD Resource Decisions Impacted by Many Non‐$ Factors
THEORY Resource Options Align from Least Cost to Highest Cost
Supply 4 ($$$$)
Supply 3 ($$$)
Supply 2 ($$)
Supply 1 ($) Supply 4 ($$$$)
Supply 3 ($$$)
Supply 2 ($$)
Supply 1 ($)
The City of Ontario’s groundwater is sometimes a base‐load supply, and sometimes a marginal supply. The City uses its groundwater as its primary resource. However, when water is plentiful and inexpensive on the short‐term market, Ontario may choose to purchase water from others to meet its current requirements, reserving its groundwater as dry year reserves. Recent reductions in imported water supplies may reduce Ontario’s flexibility to balance withdrawals from its groundwater with other options. Commitments under long‐term agreements also impact decisions about which water supplies get used first in any particular year.

20
characteristics and constraints. To optimize these types of decisions from a statewide perspective, a broader framework is needed – not only from a water resource perspective, but also from an associated energy supply and environmental consequence perspective.
The Statewide Perspective The energy sector has grappled for many years with selection of appropriate benchmarks for valuing its energy resource decisions. With respect to energy efficiency, California has taken the position that each unit of energy saved has the effect of making a unit of energy available to meet growth in demand somewhere in California without needing to procure or produce an additional unit of energy. Consequently, energy efficiency is appropriately valued at the cost of the provision of that supply of energy that can be avoided (i.e., “avoided cost of energy”).23 The “avoided cost” concept is broadly applied to many types of managerial decisions. In the context of California energy resource planning, while the detailed computations and inputs have changed over time with changes in energy markets, resources and technologies, the avoided cost of energy is the sum of all costs – direct and indirect – that could conceptually be avoided by a particular decision. Direct costs include capital (cost of plant, including financing) and operations (labor, materials, supplies, taxes, etc.). In current competitive bulk power markets, the costs of electricity are represented by the forecasted market price of power. Indirect costs include a factor for “externalities” to cover the estimated non‐price environmental and societal impacts, especially greenhouse gas emissions, associated with each energy unit that can also be avoided.24
23 California Public Utilities Commission Energy Efficiency Policy Manual, version 1, October 2001, p. 24. 24 “The term ‘total avoided cost’ refers to the total cost avoided to society through reduction in energy demand, which can be either electricity or gas. E3 (an avoided‐cost calculator developed for the CPUC—added) computes these avoided costs from a societal perspective thus capturing the overall benefits to all energy consumers including both direct savings and externality values of unpriced emission (e.g., CO2).” “Methodology and Forecast of Long Term Avoided Costs for the Evaluation of California Energy Efficiency Programs” prepared by the California Public Utilities Commission by Energy and Environmental Economics, Inc.; October 25, 2004; p.29.
“Avoided cost refers to the incremental costs avoided by the investor‐owned utility when it purchases power from qualifying facilities (QFs), implements demand‐side management, such as energy efficiency or demand response programs, or otherwise defers or avoids generation from existing/new utility supply‐side investments or energy purchases in the market. Avoided costs also encompass the deferral or avoidance of transmission and distribution‐related costs.” [California Public Utilities Decision 06‐06‐063, p.2.]
21
Avoided costs provide a benchmark for evaluating the relative cost‐effectiveness of various energy decisions. At its simplest, if a proposed program or measure adds a unit of energy to available supplies, whether through energy savings or a new generation unit, the program or measure is deemed “cost‐effective” when the total cost of the program or measure is less than the projected avoided cost of energy, and not cost‐effective if it will exceed the cost of purchasing a comparable amount of energy from the competitive market. In 2004, the CPUC commenced a rulemaking to develop a consistent methodology for valuing the avoided cost of energy for both energy efficiency and renewable energy programs.25 These deliberations led to adoption of an avoided cost methodology in 200526 that was applied to evaluate the cost‐effectiveness of energy efficiency programs for the years 2006 through 2008.27 A wide variety of stakeholders participated in these deliberations and offered refinements to assumptions and values employed, but did not dispute these general principles: 1. The appropriate basis for valuing a unit of
energy saved is the avoided cost of procuring the next unit of energy needed to meet demand (i.e., the extra‐marginal resource).
2. The purpose of ascribing the value of the extra‐
marginal resource (often, but not always, the highest cost resource) to energy efficiency is to provide proper price signals for efficient investments.
The role of avoided costs in energy efficiency program management is to provide a rational basis for comparing the per‐unit costs of proposed energy efficiency programs and measures to the forecasted cost of procuring the next (extra‐marginal) unit of energy that it proposes to offset. This comparison provides a basis for determining cost‐effectiveness and for structuring incentives designed to provide proper price signals to competitive markets.
25 California Public Utilities Commission “Order Instituting Rulemaking 04‐04‐025 to Promote Consistency in Methodology and Input Assumptions in Commission Applications of Short‐Run and Long‐run Avoided Costs, Including Pricing for Qualifying Facilities”, opened April 2004. 26 California Public Utilities Commission Decision 05‐04‐024 issued April 7, 2005. 27 California Public Utilities Commission Decision 05‐09‐043, “Interim Opinion: 2006 Update of Avoided Costs and Related Issues Pertaining to Energy Efficiency Resources” issued June 29, 2006; pp.114‐115.
“The underlying theory of the interim avoided cost methodology is that long‐run marginal costs (LRMC) establish proper price signals in the market to elicit the most efficient investment of new capital. The methodology uses the all‐in costs of a combined cycle gas turbine (CCGT) as a proxy for this long‐run price signal based on evidence from the CEC, the Western Electricity Coordinating Council and the Energy Information Association that the majority of new resources being added in the Western Interconnect are gas‐fired combined cycle generators.” [California Public Utilities Commission, Decision 06‐06‐063, June 6, 2006, p.43]
22
There are several notable aspects of California’s approach to valuing energy efficiency. 1. Despite the most aggressive energy efficiency programs in the nation, California
expects its statewide energy requirements will continue to grow for the foreseeable future. Consequently, long‐run [extra‐]marginal costs are deemed appropriate for evaluating the cost‐effectiveness of the state’s energy efficiency programs.
2. Avoided cost is determined at the statewide level with the presumption that market
competition will develop economic options. 3. Since California is connected to the western electric grid and purchases its electric
requirements from power producers within California as well as in other states, the proxy for the long‐run avoided cost of energy was based on a new combined cycle gas turbine (CCGT) constructed somewhere in the grid‐connected western U.S.28
4. The computation of avoided costs includes an allowance for indirect costs, including
environmental adders. “… the cost‐effectiveness tests used to evaluate the performance basis … should utilize non‐price components of avoided costs, including environmental adders. These are real costs to all ratepayers that are avoided with the deployment of energy efficiency, and should not be ignored in the evaluation of resource benefits.”29
The Relationship of Avoided Energy Costs to Water The purpose of this study is to compute the energy value of recycled water. As discussed in the previous section, California policymakers have selected the long‐run extra‐marginal cost of energy as the basis for determining the cost effectiveness of energy resource options. Extensive studies indicated that the next likely unit of generation in California and the western U.S. was an efficient CCGT. Consequently, California adopted a unit of electricity produced by a CCGT as the state’s proxy for the long run avoided cost of energy. The primary significance of the avoided cost proxy is as a benchmark of cost‐effectiveness. For example: if a proposed program expects to achieve energy savings at an average cost of $0.05/kWh and the avoided cost of energy is $0.10/kWh, the energy efficiency program would be deemed cost effective. If, however, the program costs $0.11/kilowatt‐hour, it would not be competitive with the avoided cost of energy and would therefore not be considered cost‐effective. 28 California Public Utilities Commission Decision 06‐06‐063, “Interim Opinion: 2006 Update of Avoided Costs and Related Issues Pertaining to Energy Efficiency Resources”, June 29, 2006, p.43. 29 California Public Utilities Commission Decision 05‐04‐051, “Interim Opinion: Updated Policy Rules for Post‐2005 Energy Efficiency and Threshold Issues Related to Evaluation, Measurement and Verification of Energy Efficiency Programs”, April 21, 2005, p.6.
23
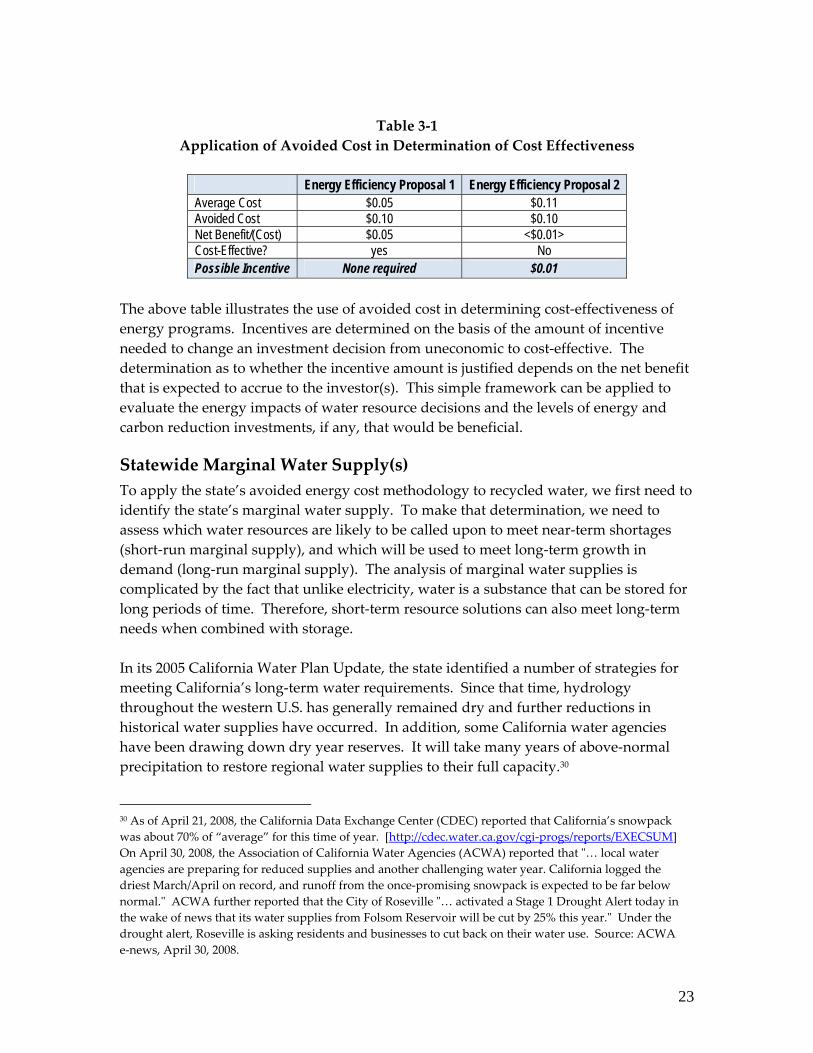
Table 3‐1
Application of Avoided Cost in Determination of Cost Effectiveness
Energy Efficiency Proposal 1 Energy Efficiency Proposal 2 Average Cost $0.05 $0.11 Avoided Cost $0.10 $0.10 Net Benefit/(Cost) $0.05 <$0.01> Cost-Effective? yes No Possible Incentive None required $0.01
The above table illustrates the use of avoided cost in determining cost‐effectiveness of energy programs. Incentives are determined on the basis of the amount of incentive needed to change an investment decision from uneconomic to cost‐effective. The determination as to whether the incentive amount is justified depends on the net benefit that is expected to accrue to the investor(s). This simple framework can be applied to evaluate the energy impacts of water resource decisions and the levels of energy and carbon reduction investments, if any, that would be beneficial.
Statewide Marginal Water Supply(s) To apply the state’s avoided energy cost methodology to recycled water, we first need to identify the state’s marginal water supply. To make that determination, we need to assess which water resources are likely to be called upon to meet near‐term shortages (short‐run marginal supply), and which will be used to meet long‐term growth in demand (long‐run marginal supply). The analysis of marginal water supplies is complicated by the fact that unlike electricity, water is a substance that can be stored for long periods of time. Therefore, short‐term resource solutions can also meet long‐term needs when combined with storage. In its 2005 California Water Plan Update, the state identified a number of strategies for meeting California’s long‐term water requirements. Since that time, hydrology throughout the western U.S. has generally remained dry and further reductions in historical water supplies have occurred. In addition, some California water agencies have been drawing down dry year reserves. It will take many years of above‐normal precipitation to restore regional water supplies to their full capacity.30
30 As of April 21, 2008, the California Data Exchange Center (CDEC) reported that California’s snowpack was about 70% of “average” for this time of year. [http://cdec.water.ca.gov/cgi‐progs/reports/EXECSUM] On April 30, 2008, the Association of California Water Agencies (ACWA) reported that ʺ… local water agencies are preparing for reduced supplies and another challenging water year. California logged the driest March/April on record, and runoff from the once‐promising snowpack is expected to be far below normal.ʺ ACWA further reported that the City of Roseville ʺ… activated a Stage 1 Drought Alert today in the wake of news that its water supplies from Folsom Reservoir will be cut by 25% this year.ʺ Under the drought alert, Roseville is asking residents and businesses to cut back on their water use. Source: ACWA e‐news, April 30, 2008.
24
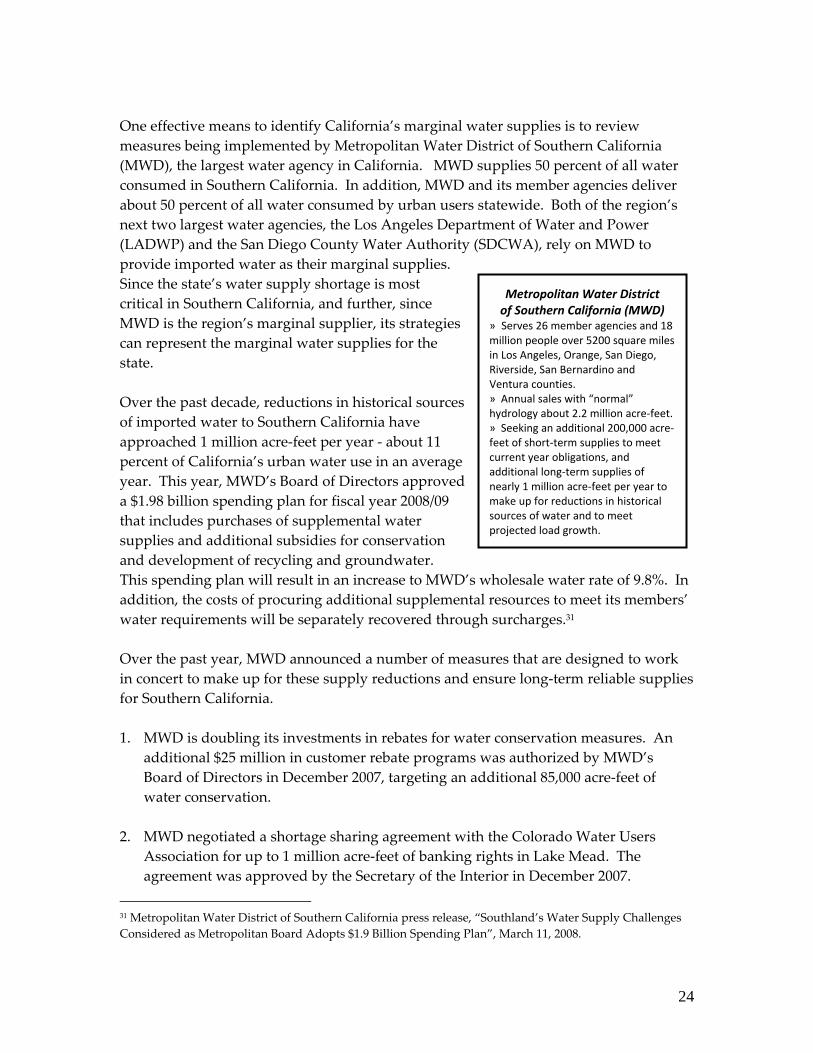
One effective means to identify California’s marginal water supplies is to review measures being implemented by Metropolitan Water District of Southern California (MWD), the largest water agency in California. MWD supplies 50 percent of all water consumed in Southern California. In addition, MWD and its member agencies deliver about 50 percent of all water consumed by urban users statewide. Both of the region’s next two largest water agencies, the Los Angeles Department of Water and Power (LADWP) and the San Diego County Water Authority (SDCWA), rely on MWD to provide imported water as their marginal supplies. Since the state’s water supply shortage is most critical in Southern California, and further, since MWD is the region’s marginal supplier, its strategies can represent the marginal water supplies for the state. Over the past decade, reductions in historical sources of imported water to Southern California have approached 1 million acre‐feet per year ‐ about 11 percent of California’s urban water use in an average year. This year, MWD’s Board of Directors approved a $1.98 billion spending plan for fiscal year 2008/09 that includes purchases of supplemental water supplies and additional subsidies for conservation and development of recycling and groundwater. This spending plan will result in an increase to MWD’s wholesale water rate of 9.8%. In addition, the costs of procuring additional supplemental resources to meet its members’ water requirements will be separately recovered through surcharges.31 Over the past year, MWD announced a number of measures that are designed to work in concert to make up for these supply reductions and ensure long‐term reliable supplies for Southern California. 1. MWD is doubling its investments in rebates for water conservation measures. An
additional $25 million in customer rebate programs was authorized by MWD’s Board of Directors in December 2007, targeting an additional 85,000 acre‐feet of water conservation.
2. MWD negotiated a shortage sharing agreement with the Colorado Water Users
Association for up to 1 million acre‐feet of banking rights in Lake Mead. The agreement was approved by the Secretary of the Interior in December 2007.
31 Metropolitan Water District of Southern California press release, “Southland’s Water Supply Challenges Considered as Metropolitan Board Adopts $1.9 Billion Spending Plan”, March 11, 2008.
Metropolitan Water Districtof Southern California (MWD)
» Serves 26 member agencies and 18 million people over 5200 square miles in Los Angeles, Orange, San Diego, Riverside, San Bernardino and Ventura counties. » Annual sales with “normal” hydrology about 2.2 million acre‐feet. » Seeking an additional 200,000 acre‐feet of short‐term supplies to meet current year obligations, and additional long‐term supplies of nearly 1 million acre‐feet per year to make up for reductions in historical sources of water and to meet projected load growth.
25
3. MWD’s Board of Directors authorized entering into short‐ and long‐term water
transfer agreements. On November 20, 2007, MWD’s Board of Directors authorized purchases of additional water supplies in 2008 through transfers with willing sellers in Yuba County and the Central Valley.32
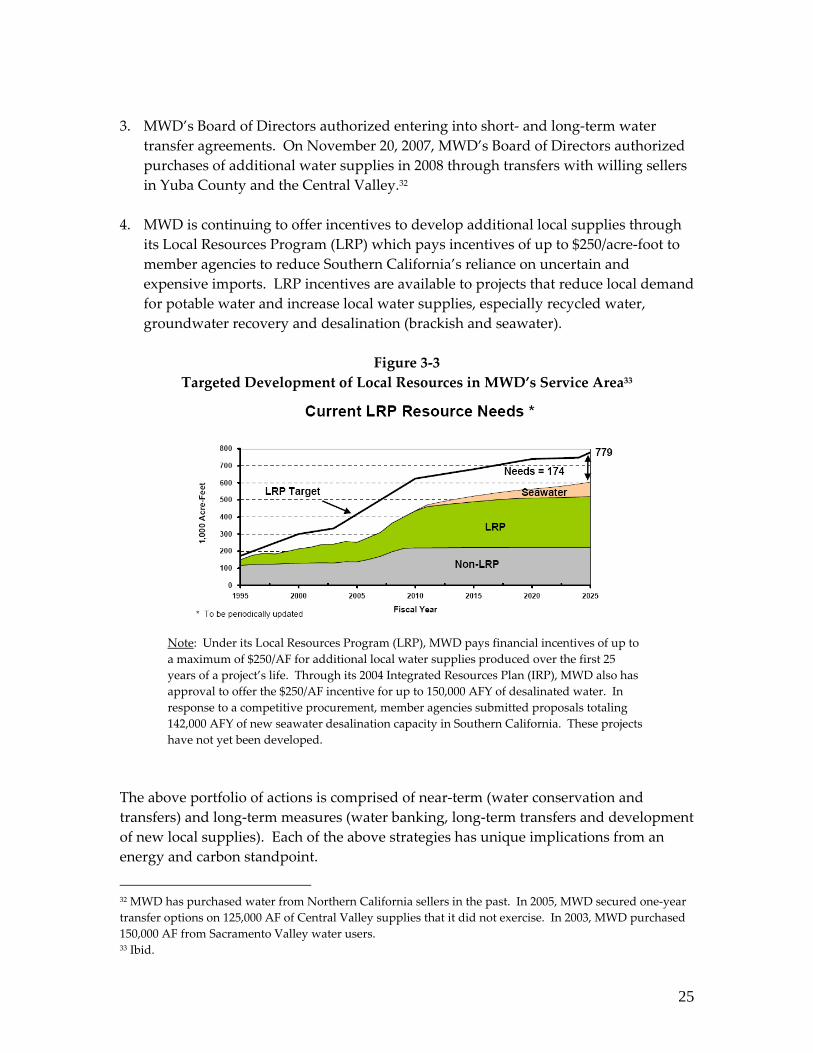
4. MWD is continuing to offer incentives to develop additional local supplies through
its Local Resources Program (LRP) which pays incentives of up to $250/acre‐foot to member agencies to reduce Southern California’s reliance on uncertain and expensive imports. LRP incentives are available to projects that reduce local demand for potable water and increase local water supplies, especially recycled water, groundwater recovery and desalination (brackish and seawater).
Figure 3‐3
Targeted Development of Local Resources in MWD’s Service Area33
Note: Under its Local Resources Program (LRP), MWD pays financial incentives of up to a maximum of $250/AF for additional local water supplies produced over the first 25 years of a project’s life. Through its 2004 Integrated Resources Plan (IRP), MWD also has approval to offer the $250/AF incentive for up to 150,000 AFY of desalinated water. In response to a competitive procurement, member agencies submitted proposals totaling 142,000 AFY of new seawater desalination capacity in Southern California. These projects have not yet been developed.
The above portfolio of actions is comprised of near‐term (water conservation and transfers) and long‐term measures (water banking, long‐term transfers and development of new local supplies). Each of the above strategies has unique implications from an energy and carbon standpoint.
32 MWD has purchased water from Northern California sellers in the past. In 2005, MWD secured one‐year transfer options on 125,000 AF of Central Valley supplies that it did not exercise. In 2003, MWD purchased 150,000 AF from Sacramento Valley water users. 33 Ibid.
26
1. Increased Water Conservation. As discussed in Section 2, like energy efficiency, water conservation (i.e., not using water in the first place) is the most beneficial resource option from both an energy and carbon perspective. Avoiding use of water creates additional water supply that can then be used to meet demand, displacing need to acquire another (potentially more expensive and energy consuming) water resource. This additional water supply is “created” without using energy or creating greenhouse gas emissions. Certain types of water savings measures may use energy to create the reductions in water use. To the extent that additional energy is needed, net benefits would have to be adjusted accordingly.
2. Increased Storage. Storage capacity does not, itself, create any energy or carbon
impacts. The long‐term energy and carbon impacts of storage capacity in Lake Mead will ultimately depend on how management of supplies stored in Lake Mead may change MWD’s water supply operations over time.
3. Water Transfers. While the State Water Project (SWP) is viewed by many water
agencies in Southern California as their marginal supply (see Section 4), reductions in SWP deliveries from the Delta will not necessarily result in energy reductions. The California Aqueduct (Aqueduct) is an important statewide water conveyance system that enables the transport of vital water supplies throughout the state. The current reductions in SWP deliveries will likely free up capacity that other agencies can use to redistribute water supplies from regions that have ample resources to regions that are short.
4. Development of Local Resources. One of the most important strategies being
deployed by MWD to develop long‐term water security for Southern California is to help its members reduce reliance on imports by developing additional local water supplies. The LRP employs a portfolio approach, offering incentives to members to develop recycled water, groundwater recovery and desalination (brackish and seawater). As discussed in Section 2 of this report, each of these types of water resources has its own unique energy characteristics and “intensity.”
As in the case of energy, many different types of water supplies are being developed by MWD and others in Southern California to meet load growth and to assure long‐term water reliability. Consistent with energy policy, the statewide long‐run extra‐marginal supply should establish the proxy for the avoided [energy] cost of water. The energy intensity of that avoided water supply would then establish a benchmark from which other water supply opportunities can be evaluated from an energy cost‐effectiveness perspective.

27
Seawater Desalination’s Role in California’s Water Supply Portfolio As described in Section 1, California’s hydrology fluctuates significantly from one year to the next. The worst circumstance from a water supply perspective is an extended multi‐year drought. However in any year, significant geographic differences in California’s hydrology cause water supplies to be redistributed to where they are most needed. The geographic redistribution of water resources does not increase the state’s water supplies. In fact, there are few ways to create new water supply. Water conservation reduces demand, conjunctive use increases efficiency of water supply management, and water reuse increases the efficiency of water consumption by using it as many times as it can be recycled. However, the most promising source of really new water supply for the State is seawater desalination. Seawater desalination has been viewed for many years as the ultimate drought hedge, enabling water purveyors to augment historical water supplies from the ocean, a virtually inexhaustible water source. In fact, seawater desalination is already an essential primary source of water in many countries throughout very dry regions such as the Middle East. It is also becoming an important resource in other countries throughout Asia, including Singapore and China, and Australia. • In 2006, Singapore completed a 36 MGD seawater reverse‐osmosis (SWRO) plant
capable of serving 10% of its national water demand.34 • As of 2006, more than 20 seawater desalination plants were operating in China.35 • In November 2006, Western Australia became the first state in the country to use
desalination as a major public water source.36 Many more plants are currently being developed in these countries and in the U.S. • On January 25, 2008, Tampa Bay Water announced that it had commenced full
operations of its 25 MGD desalination plant, presently the largest seawater
34 “Tuas Seawater Desalination Plant ‐ Seawater Reverse Osmosis (SWRO), Singapore”, water‐technology.net, http://www.water‐technology.net/projects/tuas/, viewed April 23, 2008. 35 “Seawater desalination to relieve water shortage in China”, China Economic Net, Feb. 28, 2006, http://en.ce.cn/Insight/200602/28/t20060228_6217706.shtml, viewed April 23, 2008. 36 “Perth Seawater Desalination Plant, Seawater Reverse Osmosis (SWRO), Kwinana, Australia”, water‐technology.net, http://www.water‐technology.net/projects/perth/, viewed April 23, 2008.
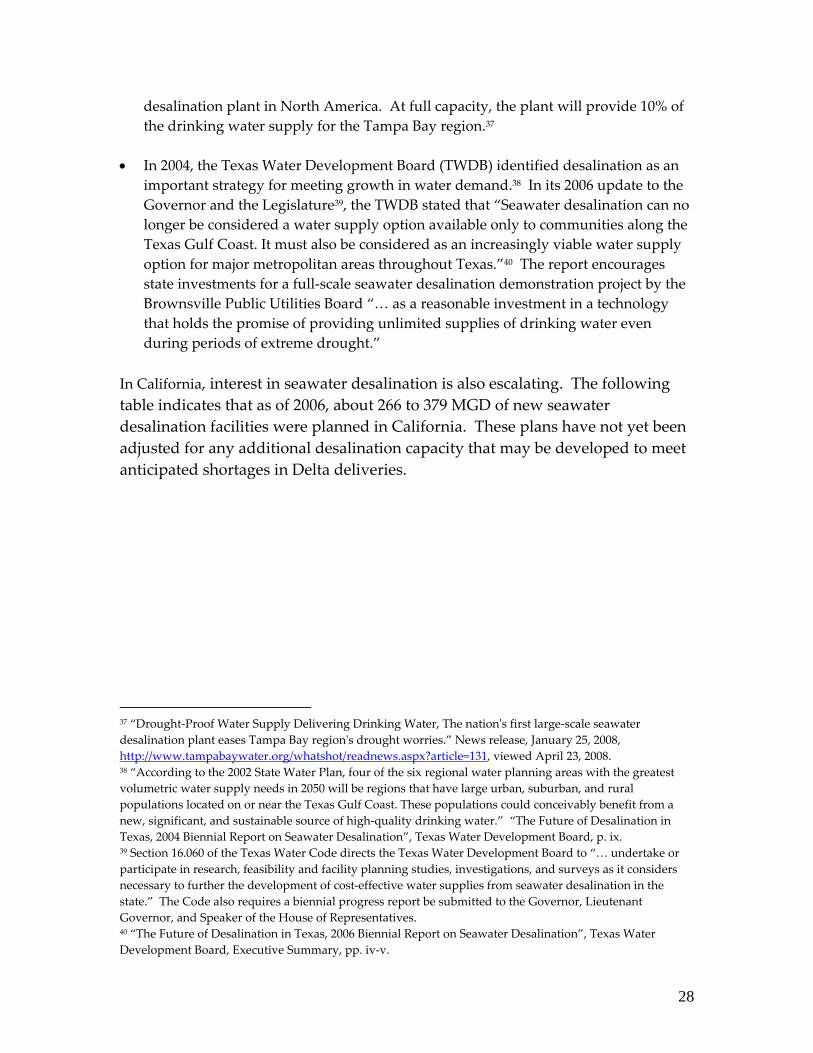
28
desalination plant in North America. At full capacity, the plant will provide 10% of the drinking water supply for the Tampa Bay region.37
• In 2004, the Texas Water Development Board (TWDB) identified desalination as an
important strategy for meeting growth in water demand.38 In its 2006 update to the Governor and the Legislature39, the TWDB stated that “Seawater desalination can no longer be considered a water supply option available only to communities along the Texas Gulf Coast. It must also be considered as an increasingly viable water supply option for major metropolitan areas throughout Texas.”40 The report encourages state investments for a full‐scale seawater desalination demonstration project by the Brownsville Public Utilities Board “… as a reasonable investment in a technology that holds the promise of providing unlimited supplies of drinking water even during periods of extreme drought.”
In California, interest in seawater desalination is also escalating. The following table indicates that as of 2006, about 266 to 379 MGD of new seawater desalination facilities were planned in California. These plans have not yet been adjusted for any additional desalination capacity that may be developed to meet anticipated shortages in Delta deliveries.
37 “Drought‐Proof Water Supply Delivering Drinking Water, The nationʹs first large‐scale seawater desalination plant eases Tampa Bay regionʹs drought worries.” News release, January 25, 2008, http://www.tampabaywater.org/whatshot/readnews.aspx?article=131, viewed April 23, 2008. 38 “According to the 2002 State Water Plan, four of the six regional water planning areas with the greatest volumetric water supply needs in 2050 will be regions that have large urban, suburban, and rural populations located on or near the Texas Gulf Coast. These populations could conceivably benefit from a new, significant, and sustainable source of high‐quality drinking water.” “The Future of Desalination in Texas, 2004 Biennial Report on Seawater Desalination”, Texas Water Development Board, p. ix. 39 Section 16.060 of the Texas Water Code directs the Texas Water Development Board to “… undertake or participate in research, feasibility and facility planning studies, investigations, and surveys as it considers necessary to further the development of cost‐effective water supplies from seawater desalination in the state.” The Code also requires a biennial progress report be submitted to the Governor, Lieutenant Governor, and Speaker of the House of Representatives. 40 “The Future of Desalination in Texas, 2006 Biennial Report on Seawater Desalination”, Texas Water Development Board, Executive Summary, pp. iv‐v.
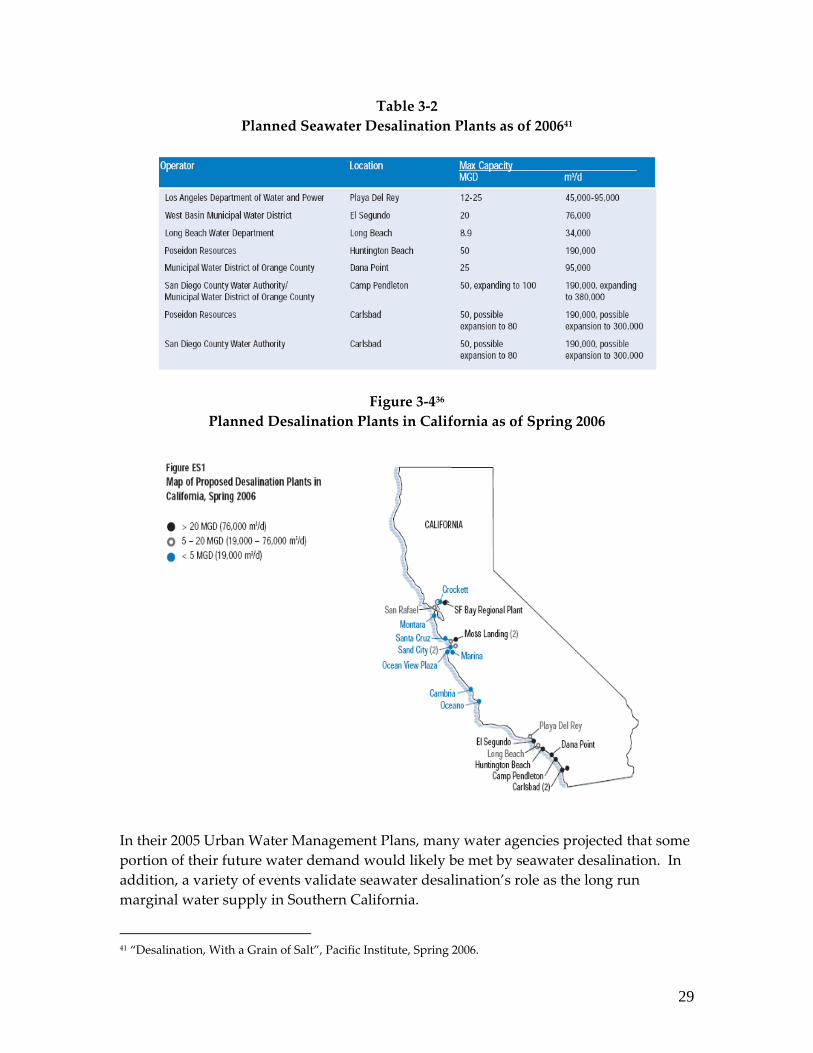
29
Table 3‐2 Planned Seawater Desalination Plants as of 200641
Figure 3‐436 Planned Desalination Plants in California as of Spring 2006
In their 2005 Urban Water Management Plans, many water agencies projected that some portion of their future water demand would likely be met by seawater desalination. In addition, a variety of events validate seawater desalination’s role as the long run marginal water supply in Southern California.
41 “Desalination, With a Grain of Salt”, Pacific Institute, Spring 2006.
30
• In 2002, MWD conducted a competitive solicitation for development of up to 150,000
acre‐feet per year of seawater desalination by its members. Under this solicitation, MWD offered to provide incentives of up to $250 per acre‐foot of desalinated seawater produced and used within its service area for up to 25 years. Five member agencies submitted proposals totaling 142,000 AFY.
• SDCWA is encouraging new seawater desalination capacity as an important
strategy to diversify its water supply portfolio. In its 2005 Urban Water Management Plan, SDCWA projected that 56,000 AF of water would be supplied by the desalination plant in Carlsbad that it proposed to construct with incentives from MWD.42 SDCWA included a projection of an additional 33,600 AF of desalinated water from an undefined project in its projected 2020 water supply mix. SDCWA’s 2003 Master Plan identified desalination as “the preferred alternative to assist in meeting future regional demands.”
• The City of San Diego supports SDCWA in its efforts to promote seawater
desalination as a viable technology in San Diego County. In its 2005 Urban Water Management Plan (published in 2007), the City stated its intent to investigate seawater desalination in the southern area of the City for the period 2010‐2030.43
• The City of Los Angeles is also investigating seawater desalination. On
December 7, 2007, the Los Angeles Department of Water and Power (LADWP) released a “DRAFT Preliminary Evaluation Report” about its proposed Scattergood Generation Station Seawater Desalination Pilot Project. On its website, LADWP states that it is in the initial stages of evaluating seawater desalination as a potential water resource option for the City of Los Angeles. The Scattergood pilot is structured to provide information to the City about the environmental impacts of seawater desalination so that it can make an informed decision about this important source of future water supplies. LADWP intends to pursue the $250/acre‐foot incentive from MWD to support this pilot project.44
• Most recently, on April 23, 2008, the Mayor of the City of San Clemente announced
support for the planned development of a seawater desalination plant by a joint powers authority that would be led by the Municipal Water District of Orange County (MWDOC). MWDOC is presently seeking commitments from local water agencies to participate in development of a 15 MGD facility to meet about half of the
42 The Carlsbad Desalination Plant was originally intended to be developed by SDCWA. However, SDCWA transferred its rights to an independent developer, Poseidon Corporation. Poseidon anticipates bringing the Carlsbad desalination facility on‐line by the end of 2010. 43 City of San Diego 2005 Urban Water Management Plan, published in 2007; pp. 2‐19 and 2‐20. 44 Los Angeles Department of Water (LADWP) website, http://www.ladwp.com/ladwp/cms/ladwp001350.jsp; viewed March 1, 2008.
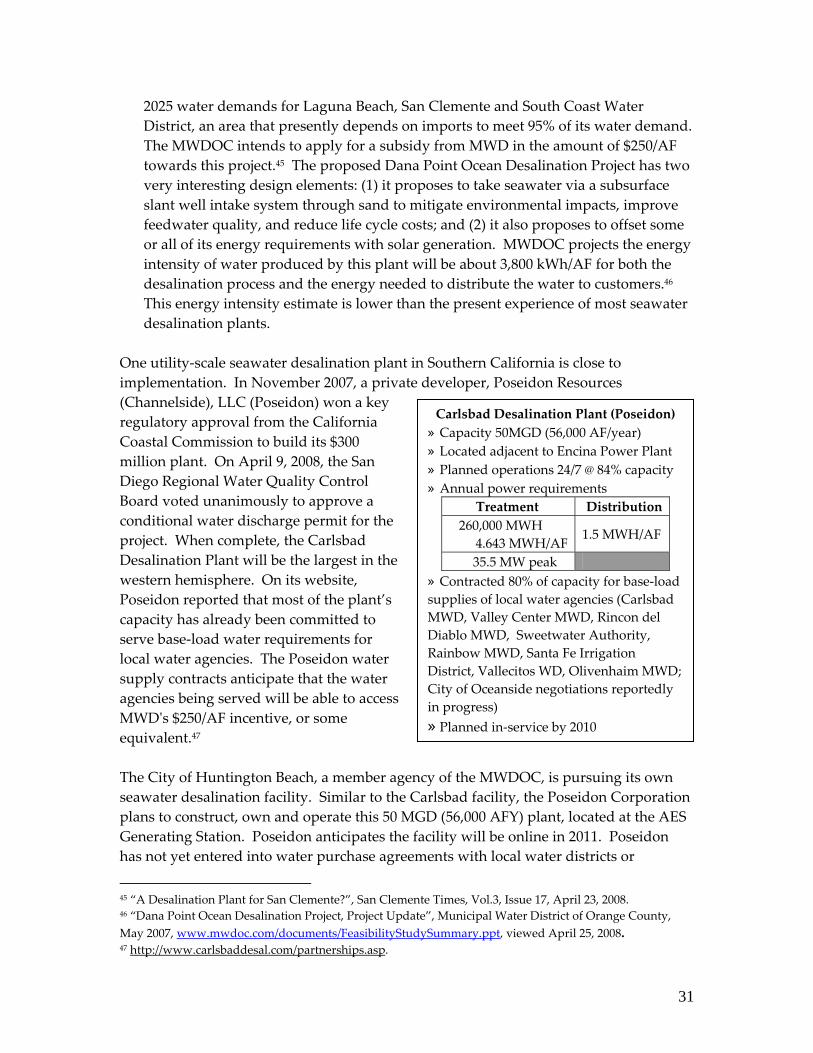
31
2025 water demands for Laguna Beach, San Clemente and South Coast Water District, an area that presently depends on imports to meet 95% of its water demand. The MWDOC intends to apply for a subsidy from MWD in the amount of $250/AF towards this project.45 The proposed Dana Point Ocean Desalination Project has two very interesting design elements: (1) it proposes to take seawater via a subsurface slant well intake system through sand to mitigate environmental impacts, improve feedwater quality, and reduce life cycle costs; and (2) it also proposes to offset some or all of its energy requirements with solar generation. MWDOC projects the energy intensity of water produced by this plant will be about 3,800 kWh/AF for both the desalination process and the energy needed to distribute the water to customers.46 This energy intensity estimate is lower than the present experience of most seawater desalination plants.
One utility‐scale seawater desalination plant in Southern California is close to implementation. In November 2007, a private developer, Poseidon Resources (Channelside), LLC (Poseidon) won a key regulatory approval from the California Coastal Commission to build its $300 million plant. On April 9, 2008, the San Diego Regional Water Quality Control Board voted unanimously to approve a conditional water discharge permit for the project. When complete, the Carlsbad Desalination Plant will be the largest in the western hemisphere. On its website, Poseidon reported that most of the plant’s capacity has already been committed to serve base‐load water requirements for local water agencies. The Poseidon water supply contracts anticipate that the water agencies being served will be able to access MWDʹs $250/AF incentive, or some equivalent.47 The City of Huntington Beach, a member agency of the MWDOC, is pursuing its own seawater desalination facility. Similar to the Carlsbad facility, the Poseidon Corporation plans to construct, own and operate this 50 MGD (56,000 AFY) plant, located at the AES Generating Station. Poseidon anticipates the facility will be online in 2011. Poseidon has not yet entered into water purchase agreements with local water districts or
45 “A Desalination Plant for San Clemente?”, San Clemente Times, Vol.3, Issue 17, April 23, 2008. 46 “Dana Point Ocean Desalination Project, Project Update”, Municipal Water District of Orange County, May 2007, www.mwdoc.com/documents/FeasibilityStudySummary.ppt, viewed April 25, 2008. 47 http://www.carlsbaddesal.com/partnerships.asp.
Carlsbad Desalination Plant (Poseidon)» Capacity 50MGD (56,000 AF/year) » Located adjacent to Encina Power Plant » Planned operations 24/7 @ 84% capacity » Annual power requirements
Treatment Distribution 260,000 MWH 4.643 MWH/AF
1.5 MWH/AF
35.5 MW peak » Contracted 80% of capacity for base‐load supplies of local water agencies (Carlsbad MWD, Valley Center MWD, Rincon del Diablo MWD, Sweetwater Authority, Rainbow MWD, Santa Fe Irrigation District, Vallecitos WD, Olivenhaim MWD; City of Oceanside negotiations reportedly in progress) » Planned in‐service by 2010
32
agencies. Once they do, these districts or agencies may be eligible for MWD’s financial incentives (through MWDOC). In December 2006, Global Water Intelligence (GWI) projected that the global desalination market would attract over $50 billion of new investment over the ten year period 2006‐2015 at a compound annual growth rate of about 13%. The total market value, including operating expenditures, was projected to exceed $126 billion by the end of 2015, with about half of the capital to be provided by private sector organizations.48 In the U.S., a National Research Council panel reported that desalination capacity grew by around 40 percent between 2000 and 2005, and plants now exist in every state.49 GWI identified the main driver for growth in global desalination markets as scarcity of an essential natural resource, exacerbated by population growth and the unpredictable impacts of climate change. In this context, “… desalination remains an expensive solution to scarcity, in comparison to most existing water resources. However, as cheaper alternatives to desalination become fully exploited, desalination is increasingly becoming the next cheapest solution to water scarcity.”50 It is clear that seawater desalination is an increasingly important resource option for meeting Southern California’s critical water supply challenges. While seawater desalination may be expensive relative to other water resource options, its superior characteristics as a drought‐proof supply is causing water agencies throughout California and the U.S. to include desalination in their long‐term water supply portfolios. The challenge from an energy standpoint is that seawater desalination is presently a high energy intensity water resource. In addition, since seawater desalination plants are presently designed to operate on a base‐loaded basis (i.e., 24 hours per day, all year), every unit of new desalination capacity becomes a base‐loaded resource. To the extent that water agencies displace lower energy intensity base load supplies with seawater desalination, the energy and carbon intensity of the state’s overall water supply portfolio will increase.51
48 Abstract from “Desalination Markets 2007: A Global Industry Forecast”, Global Water Intelligence, December 2006, http://www.the‐infoshop.com/study/gwi47246‐desalination.html, viewed April 23, 2008. 49 “Desalination: A National Perspective”, Committee on Advancing Desalination Technology, National Research Council, prepublication version, ISBN: 0‐309‐11924‐3, downloaded from http://www.nap.edu/catalog/12184.html on April 25, 2008. 50 Abstract from “Desalination Markets 2007: A Global Industry Forecast”, op. cit. 51 ʺPrecise Development Plan and Desalination Plant Projectʺ, Environmental Impact Report for the Proposed Carlsbad Desalination Plan, December 2005, Appendix B, Water Purchase Agreement Entered Into By and Between The Carlsbad Municipal Water District and Poseidon Resources (Channelside), LLC, September 28, 2004.

33
Many water agencies in California are participating in research projects to advance desalination technologies and processes. Primary goals include developing approaches to minimizing environmental impacts, reducing costs (e.g., increase the useful life of reverse osmosis filters), and reducing energy consumption. A nonprofit organization, the Affordable Desalination Collaboration (ADC, www.affordabledesal.com) is presently collaborating with state and federal agencies, and Southern California water agencies, to develop and test approaches and technologies for desalinating seawater that have potential to reduce costs and to reduce energy consumption. Participants include the U.S. Navy, U.S. Department of Energy, the California Energy Commission, and the West Basin Municipal Water District of Southern California. The next section of this report calculates the avoided energy and associated carbon benefits of the recycled water opportunity for the four water agencies studied.

34
SECTION 4 – THE RECYCLED WATER OPPORTUNITY Much more recycled water is presently produced in California than is beneficially used.52 As noted previously, the 2005 California Water Plan Update estimated that at least 800,000 AF53 of additional recycled water is available now that could be applied to beneficial uses, displacing use of limited potable water supplies for non‐potable purposes. In its 2005 Urban Water Management Plan, MWD stated that another 480,000 AF of new recycled water could be developed in its service area by the year 2025.54 This amount is approximately 10 percent of the current average water use in the Southern California, South Coast Region. In addition to increasing California’s water security, increased use of recycled water would provide substantial energy benefits. However, while California law requires water agencies to consider “cost effective” recycled water in their Urban Water Management Plans, they are not required to develop local recycled water supplies. A complex body of policies, rules and regulations govern the quality to which wastewater must be treated and the manner in which the effluent may be disposed or reused (see Appendix B). Table 4‐1 ‐ Approved Uses of Recycled Water on the following page illustrates the minimum level of treatment needed by regulation for various types of uses. The regulatory requirements governing wastewater treatment and disposal are determined by laws designed to protect public health, safety and the environment. For example, standards for discharge of wastewater effluent are typically determined by the level of risk to people, plants, animals and ecological balances. Discharges to inland natural waterways with downstream impacts are therefore usually required to be of a higher quality than discharges to the ocean.
52 ʺBeneficially usedʺ means productively employed to serve a purpose that would otherwise need to be met by other sources of water (e.g., environmental water to maintain ecological balances) or infrastructure (e.g., seawater intrusion barriers). 53 And perhaps as much as 1.4 million acre‐feet; see Figure 1‐4 ‐ Range of Additional Annual Water for Eight Resource Management Choices. 54 MWD’s 2005 Urban Water Management Plan, p. III‐28.
California treated about 5 million acre‐feet of municipal wastewater in 2002. About half of that amount was recoverable as recycled water, but only 10 percent of that potential was reused in water recycling projects. An additional 20% was applied to other beneficial purposes, such as providing environmental water and indirect reuse by downstream water agencies. Still, a significant portion (as much as 70%) is discharged without beneficial use to natural waterways and to the ocean every year, representing a viable, untapped resource – a lost opportunity. [Sources: “Water Recycling 2030,” Recycled Water Task Force, June 2003 and the U.S. Bureau of Reclamation.]

35
If a wastewater treatment plant is only required to treat to primary or secondary standards before discharge, additional treatment will be needed to apply the recycled water to approved uses that require higher water quality. Any energy associated with additional treatment needed to reuse the water should be allocated to the recycled water that is produced. The simple test for determining whether energy should be allocated between wastewater treatment and recycled water production is whether the additional treatment energy would have been needed for safe discharge of the water. If “yes,” then the energy should be allocated to treatment. If “no”, the energy should be allocated to the recycled water.
Table 4‐1 Approved Uses of Recycled Water55
55 Department of Water Resources ʺWater Factsʺ, No. 23, ʺWater Recyclingʺ, October 2004; http://www.owue.water.ca.gov/recycle/docs/WaterFact23.pdf
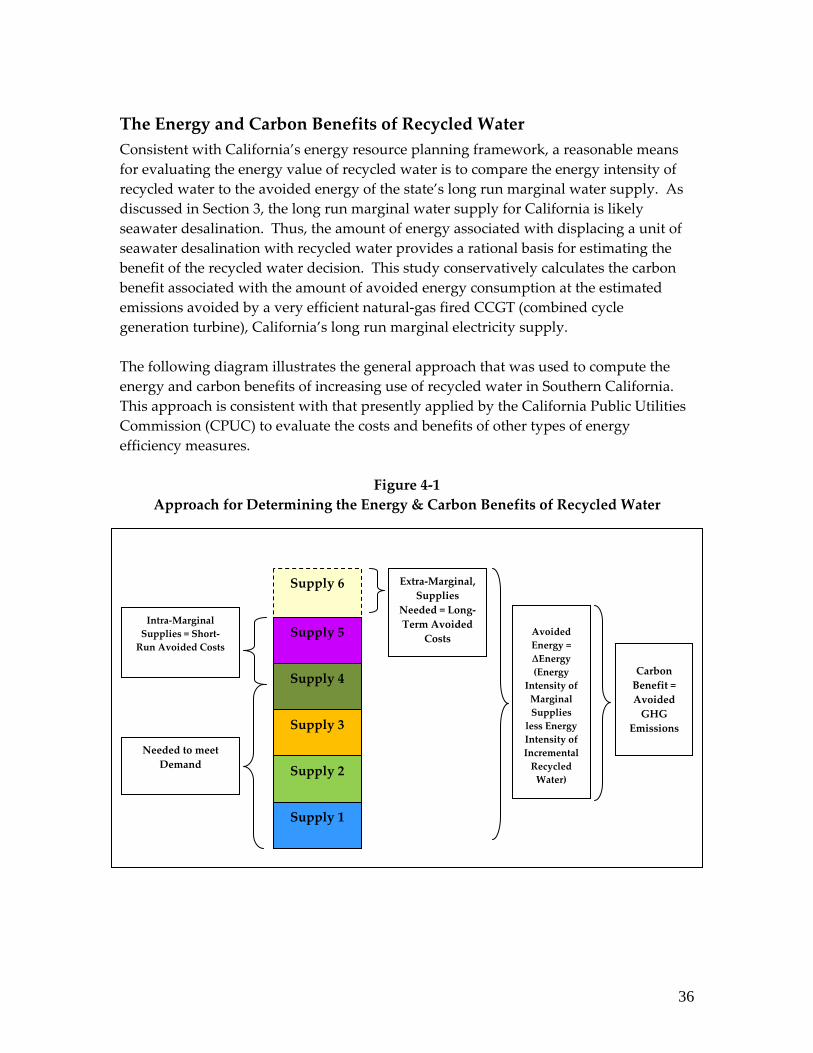
36
The Energy and Carbon Benefits of Recycled Water Consistent with California’s energy resource planning framework, a reasonable means for evaluating the energy value of recycled water is to compare the energy intensity of recycled water to the avoided energy of the state’s long run marginal water supply. As discussed in Section 3, the long run marginal water supply for California is likely seawater desalination. Thus, the amount of energy associated with displacing a unit of seawater desalination with recycled water provides a rational basis for estimating the benefit of the recycled water decision. This study conservatively calculates the carbon benefit associated with the amount of avoided energy consumption at the estimated emissions avoided by a very efficient natural‐gas fired CCGT (combined cycle generation turbine), California’s long run marginal electricity supply. The following diagram illustrates the general approach that was used to compute the energy and carbon benefits of increasing use of recycled water in Southern California. This approach is consistent with that presently applied by the California Public Utilities Commission (CPUC) to evaluate the costs and benefits of other types of energy efficiency measures.
Figure 4‐1 Approach for Determining the Energy & Carbon Benefits of Recycled Water
Extra‐Marginal, Supplies
Needed = Long‐Term Avoided
Costs
Needed to meet Demand
Intra‐Marginal Supplies = Short‐Run Avoided Costs
Supply 6
Supply 5
Supply 4
Supply 3
Supply 2
Supply 1
Avoided Energy = ∆Energy (Energy
Intensity of Marginal Supplies less Energy Intensity of Incremental Recycled Water)
Carbon Benefit = Avoided GHG
Emissions

37
The following tasks were performed to compute the energy and carbon benefits of recycled water. Tasks: 1. Determine the amount of incremental recycled water that could be developed and
used in Southern California. 2. Identify the water supplies likely to be displaced by incremental recycled water. 3. Estimate the energy and carbon values of displaced (i.e., “marginal”) water supplies. In conducting these tasks, we applied the following two concepts: • Recycled Water Demand. In the U.S., many non‐potable uses are served by potable
water that has been treated to safe drinking water standards established by the federal Environmental Protection Agency and state and local agencies charged with protecting public health and safety. Recycled water can be used to safely displace use of potable water for these types of non‐potable uses. For purposes of this study, the amount of recycled water demand was capped by the lesser of the amount of recyclable water available, and the maximum demand of qualified end uses of recycled water.
• Incremental Recycled Water ʺAvailable.ʺ The amount of incremental recycled
water ʺavailableʺ is deemed to be the amount of recycled water that is discharged “today” without being applied to any specific beneficial purposes. We determined this quantity by reviewing (a) water agencies’ plans that showed current and projected supplies and uses of recycled water; and (b) the capacity of existing infrastructure to deliver currently unused recyclable water to qualified end uses. For purposes of this assessment, the determination of adequacy of existing infrastructure was based on the capacity of existing recycled water pipelines to serve additional customers.
The specific work that was performed under each task is described more fully below. Step 1: Determine the amount of incremental recycled water that could be developed and used in Southern California. The first step in this analysis was to determine the amount of additional recyclable water that could be captured now and used for water supply but is presently being discharged to the ocean. The amount of incremental recycled water available was determined as the lesser of: • The amount of tertiary treated wastewater that is presently being discharged
without any beneficial use.
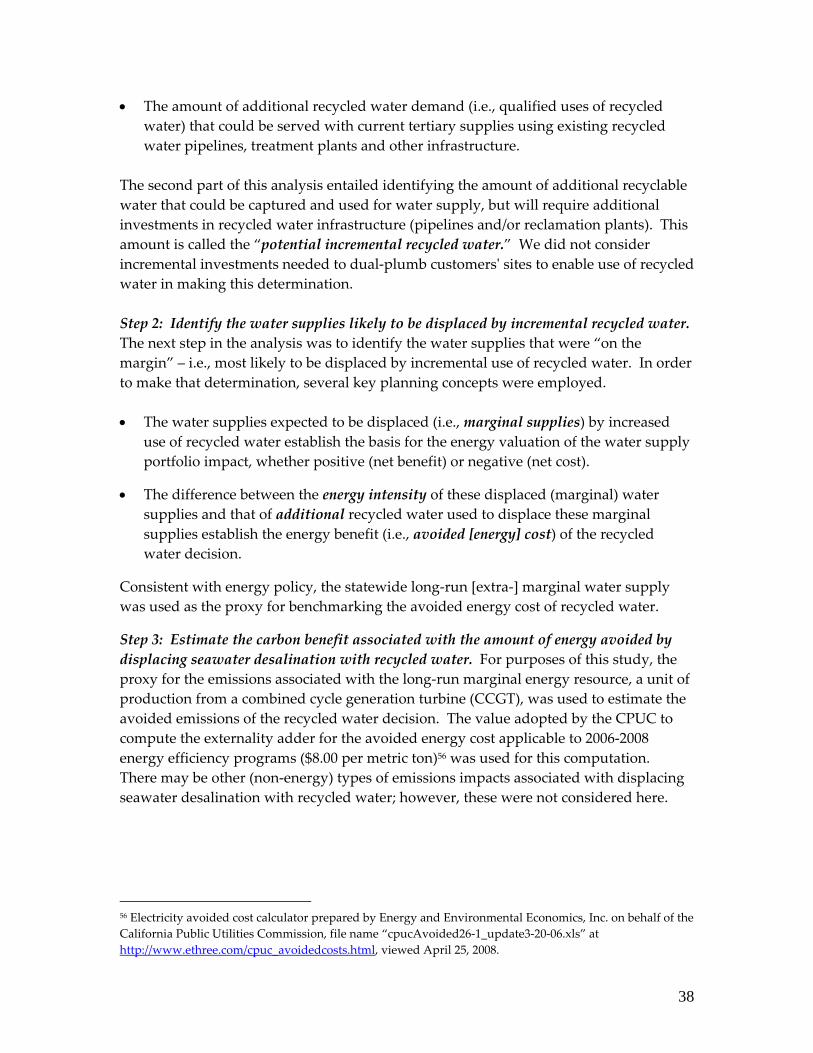
38
• The amount of additional recycled water demand (i.e., qualified uses of recycled water) that could be served with current tertiary supplies using existing recycled water pipelines, treatment plants and other infrastructure.
The second part of this analysis entailed identifying the amount of additional recyclable water that could be captured and used for water supply, but will require additional investments in recycled water infrastructure (pipelines and/or reclamation plants). This amount is called the “potential incremental recycled water.” We did not consider incremental investments needed to dual‐plumb customersʹ sites to enable use of recycled water in making this determination. Step 2: Identify the water supplies likely to be displaced by incremental recycled water. The next step in the analysis was to identify the water supplies that were “on the margin” – i.e., most likely to be displaced by incremental use of recycled water. In order to make that determination, several key planning concepts were employed. • The water supplies expected to be displaced (i.e., marginal supplies) by increased
use of recycled water establish the basis for the energy valuation of the water supply portfolio impact, whether positive (net benefit) or negative (net cost).
• The difference between the energy intensity of these displaced (marginal) water supplies and that of additional recycled water used to displace these marginal supplies establish the energy benefit (i.e., avoided [energy] cost) of the recycled water decision.
Consistent with energy policy, the statewide long‐run [extra‐] marginal water supply was used as the proxy for benchmarking the avoided energy cost of recycled water.
Step 3: Estimate the carbon benefit associated with the amount of energy avoided by displacing seawater desalination with recycled water. For purposes of this study, the proxy for the emissions associated with the long‐run marginal energy resource, a unit of production from a combined cycle generation turbine (CCGT), was used to estimate the avoided emissions of the recycled water decision. The value adopted by the CPUC to compute the externality adder for the avoided energy cost applicable to 2006‐2008 energy efficiency programs ($8.00 per metric ton)56 was used for this computation. There may be other (non‐energy) types of emissions impacts associated with displacing seawater desalination with recycled water; however, these were not considered here.
56 Electricity avoided cost calculator prepared by Energy and Environmental Economics, Inc. on behalf of the California Public Utilities Commission, file name “cpucAvoided26‐1_update3‐20‐06.xls” at http://www.ethree.com/cpuc_avoidedcosts.html, viewed April 25, 2008.

39
As the carbon market evolves, the actual price of carbon credits may be much higher than the CPUC’s $8.00 per metric ton allowance. The CPUC authorized rate‐recovery by Pacific Gas & Electric Company for the purchase of carbon emissions credits for its ClimateSmartTM program at $9.71/metric ton. Although prices on Chicago’s voluntary Climate Exchange peaked at $5.00/ton in April 2006, carbon credits traded at about €25.00 (approximately US$39.00) per metric ton on April 24, 2008 on the European Unionʹs carbon exchange. Industry experts anticipate similar price levels could be possible under a future U.S. carbon trading market developed around mandatory carbon caps.
The Stateʹs Recycled Water Potential The following primary studies were relied upon to establish a baseline understanding of the state’s recycled water potential.
• The California Recycled Water Task Force’s report, “Water Recycling 2030.”
• The U.S. Bureau of Reclamation’s (USBR) Report, “Southern California Comprehensive Water Reclamation and Reuse Study, Phase II.”
• The Department of Water Resources (DWR) Bulletin 160‐05 “2005 California Water Plan Update.”
For this study, we decided to focus on water, energy, and carbon stressed Southern California. With the assistance of water sector experts, the Alliance selected four agencies for detailed study: the Inland Empire Utilities Agency (IEUA); its customer, the City of Ontario; the Los Angeles Department of Water and Power (LADWP); and the City of San Diego. These organizations, representing three of the four water reclamation regions in Southern California covered by the USBR study57 collectively comprise a significant amount of the regionʹs recycled water potential. They also collectively represented a wide spectrum of water supply and system characteristics that was deemed representative of Southern California’s primary water supplies.
57 Orange County is the fourth. U.S. Bureau of Reclamation Report, “Southern California Comprehensive Water Reclamation and Reuse Study, Phase II”, July 2002.
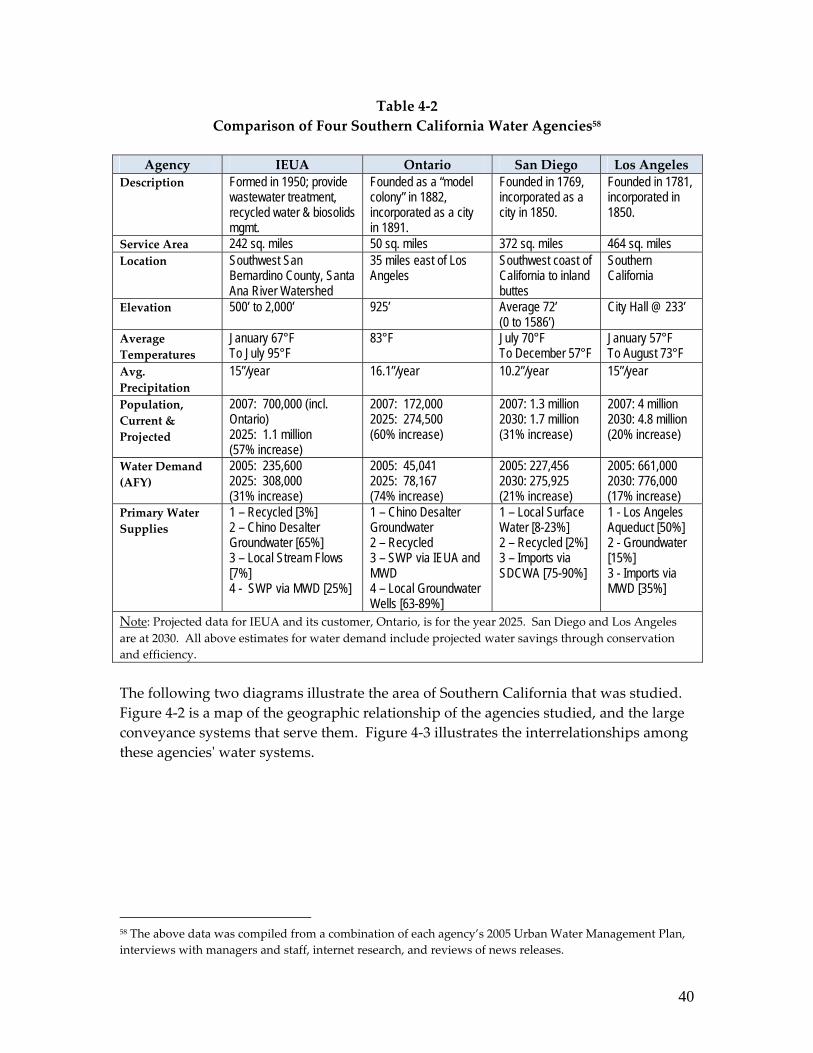
40
Table 4‐2 Comparison of Four Southern California Water Agencies58
Agency IEUA Ontario San Diego Los Angeles
Description Formed in 1950; provide wastewater treatment, recycled water & biosolids mgmt.
Founded as a “model colony” in 1882, incorporated as a city in 1891.
Founded in 1769, incorporated as a city in 1850.
Founded in 1781, incorporated in 1850.
Service Area 242 sq. miles 50 sq. miles 372 sq. miles 464 sq. miles Location Southwest San
Bernardino County, Santa Ana River Watershed
35 miles east of Los Angeles
Southwest coast of California to inland buttes
Southern California
Elevation 500’ to 2,000’ 925’ Average 72’ (0 to 1586’)
City Hall @ 233’
Average Temperatures
January 67°F To July 95°F
83°F
July 70°F To December 57°F
January 57°F To August 73°F
Avg. Precipitation
15”/year 16.1”/year 10.2”/year 15”/year
Population, Current & Projected
2007: 700,000 (incl. Ontario) 2025: 1.1 million (57% increase)
2007: 172,000 2025: 274,500 (60% increase)
2007: 1.3 million 2030: 1.7 million (31% increase)
2007: 4 million 2030: 4.8 million (20% increase)
Water Demand (AFY)
2005: 235,600 2025: 308,000 (31% increase)
2005: 45,041 2025: 78,167 (74% increase)
2005: 227,456 2030: 275,925 (21% increase)
2005: 661,000 2030: 776,000 (17% increase)
Primary Water Supplies
1 – Recycled [3%] 2 – Chino Desalter Groundwater [65%] 3 – Local Stream Flows [7%] 4 - SWP via MWD [25%]
1 – Chino Desalter Groundwater 2 – Recycled 3 – SWP via IEUA and MWD 4 – Local Groundwater Wells [63-89%]
1 – Local Surface Water [8-23%] 2 – Recycled [2%] 3 – Imports via SDCWA [75-90%]
1 - Los Angeles Aqueduct [50%] 2 - Groundwater [15%] 3 - Imports via MWD [35%]
Note: Projected data for IEUA and its customer, Ontario, is for the year 2025. San Diego and Los Angeles are at 2030. All above estimates for water demand include projected water savings through conservation and efficiency. The following two diagrams illustrate the area of Southern California that was studied. Figure 4‐2 is a map of the geographic relationship of the agencies studied, and the large conveyance systems that serve them. Figure 4‐3 illustrates the interrelationships among these agenciesʹ water systems.
58 The above data was compiled from a combination of each agency’s 2005 Urban Water Management Plan, interviews with managers and staff, internet research, and reviews of news releases.
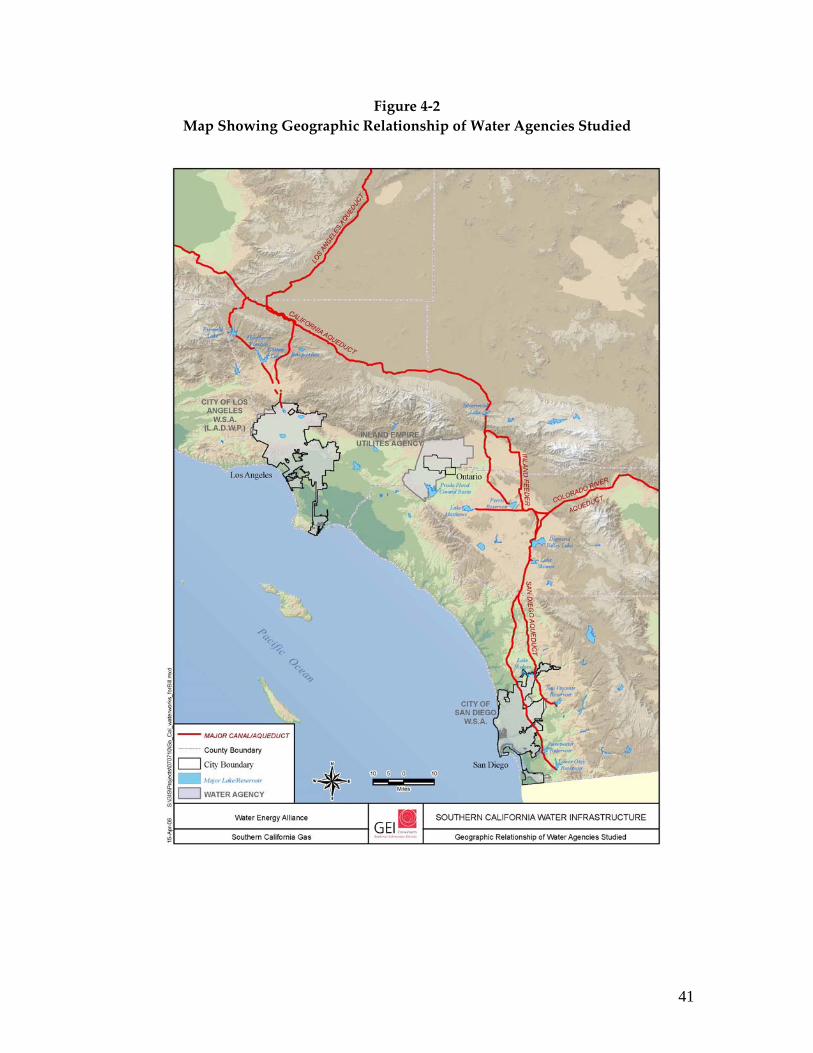
41
Figure 4‐2 Map Showing Geographic Relationship of Water Agencies Studied
42
Figure 4‐3 Relationship of the Water Systems Studied
HO Banks PSDosAmigos PSBuenaVista PS
Wind Gap PSAD Edmonston PS
Oso PS
Pearblossom PS
Royer-NesbitWTP
(CVWD)
Lloyd G.Michael WTP
(CVWD)
PS
Foothill Feeder PP
Jensen WTPStateW
ater Project
Centraland West BasinsWells
Weymouth WTP
Diemer WTP
Wheeler Ridge PS
City ofLosAngeles
Users
Alvarado WTP
Pt.LomaWWTP Dischargedto Ocean
SecondaryTertiary
Chino Desalter
Sacramento-San Joaquin Delta
Silverwood LakeCastaic Lake
Lake HavasuLake Matthews
Julia
nH
inds
PS
Eagl
eM
ount
ain
PS
Iron
Mou
ntai
n PS
Gene
PS
Whi
tset
t PS
Colorado River Aqueduct
OwensValley
LosAngelesReservoir
Los Angeles Aqueduct
RP4
RP5
CCWRF
PS
PS
PS
UpperLosAngelesRiver Area
Wells
Wastewater
Wastewater
RP1
Otay WTP
WRP
Local Runo�
IEUA(WholesalersforMember Citiesand Agencies)
City of San Diego Users
City ofOntario
EndUsers
North CityWRP
Secondary
Wastewater
NorthCity
Users
SouthBay
Users
Waste
Waste
Water Supply CycleCity of LosAngeles • Inland Empire Utilities Authority •City of Ontario • City of San Diego
Note: treated waste-water also dischargedto the Santa AnaRiver.
Note: Depending onthe treatment plant,treated wastewater isdischarged to the Los
AngelesRiver, LosAngeles Harbor, or to
Santa Monica Bay.
Mojave Siphon PPCastaic PP and PS
WEWarne PP Alamo PP
Reuse byFuture
Customers
Reuse byFuture
Customers
LosAngelesAqueductFiltration Plant
West Branch — State Water Project East Branch — State Water Project
GroundwaterWells
GroundwaterWells
Agua deLejosTP(WFA)
Devil Canyon PP
TertiarySouth Bay
WRP
Miramar WTP
Waste
Waste
43
Urban Water Management Plans for 2005 (UWMPs)59, recycled water plans, energy studies and data, capital programs and other relevant documents were reviewed for each of the four agencies. These data were compiled into tables to facilitate evaluation and comparison. The data presented in each Water Agency Profile in Appendices B through E were reviewed and accepted by official representatives of the respective organizations. In order to assess the incremental energy and carbon values that could be achieved by accelerating and increasing use of recycled water by each organization, the following information was obtained:
• The types, quantities and sources of water supplies currently in each agency’s water supply portfolio, and how these were expected to change over the UWMP forecast period (2005‐2025)60.
• The marginal water supply(s)61, both current and projected, that would likely be displaced by increasing recycled water supply and demand.
• The amount of recycled water available and used, or projected to be available and used, over the forecast period.
• The timing and magnitude of capital investments needed to build the additional recycled water infrastructure assumed in the UWMPs and/or recycled water plans.
• The amount of energy used by the organization and/or its primary water suppliers to meet its current and projected water demand.
If the marginal water supply(s) expected to be displaced by recycled water was purchased from a wholesaler, the marginal water supply of that wholesaler was evaluated. Once baseline conditions were established, the amount of energy and carbon that could be avoided by accelerating and increasing the use of recycled water was estimated.
59 California law requires that Urban Water Management Plans (UWMPs) be filed by all water purveyors with > 3,000 connections or supplies > 3,000 acre feet. UWMPs must be filed every 5 years. In 2005, 460 water suppliers were required to file UWMPs. DWR is responsible for assuring compliance and compiling the data for use in water supply planning for the state. 60 UWMPs are required to forecast changes in water resources and demand over a 20 year planning period to allow the state’s policymakers time to adjust water policies, plans and programs as may be needed to assure sufficient water supplies will be available to meet critical needs now and in the future. 61 The water supply source(s) that would need to be accessed to meet the next unit of water supply demand.
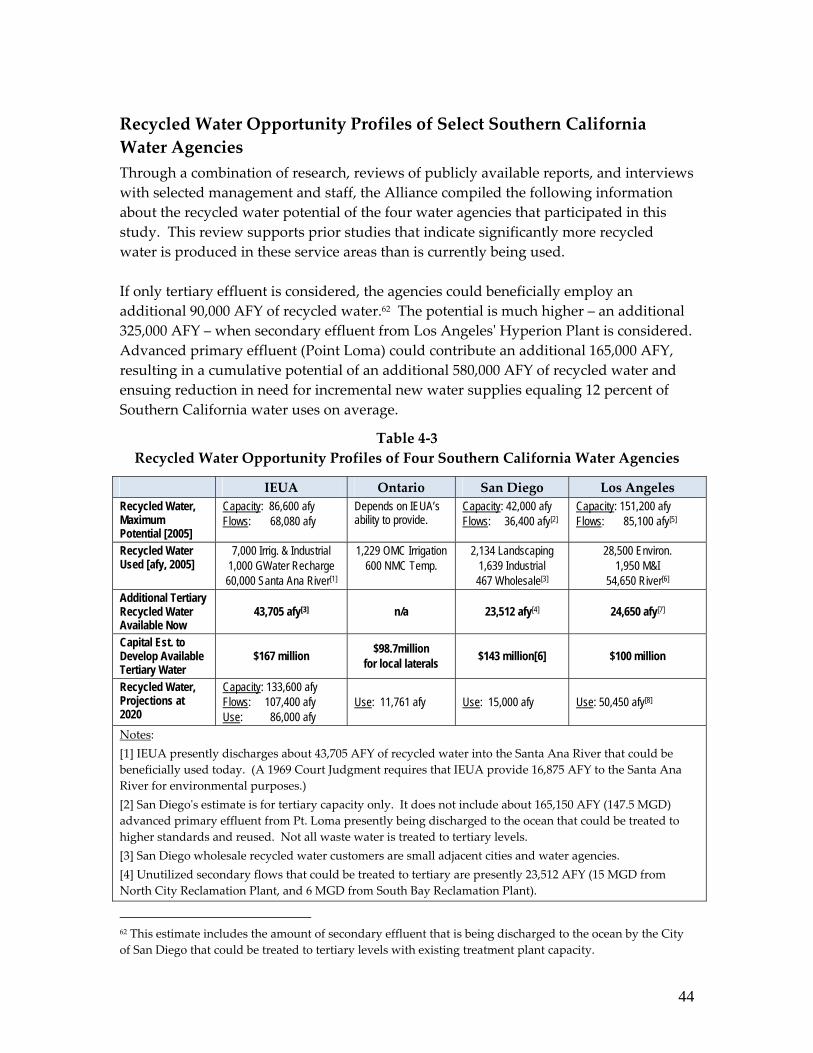
44
Recycled Water Opportunity Profiles of Select Southern California Water Agencies Through a combination of research, reviews of publicly available reports, and interviews with selected management and staff, the Alliance compiled the following information about the recycled water potential of the four water agencies that participated in this study. This review supports prior studies that indicate significantly more recycled water is produced in these service areas than is currently being used. If only tertiary effluent is considered, the agencies could beneficially employ an additional 90,000 AFY of recycled water.62 The potential is much higher – an additional 325,000 AFY – when secondary effluent from Los Angelesʹ Hyperion Plant is considered. Advanced primary effluent (Point Loma) could contribute an additional 165,000 AFY, resulting in a cumulative potential of an additional 580,000 AFY of recycled water and ensuing reduction in need for incremental new water supplies equaling 12 percent of Southern California water uses on average.
Table 4‐3 Recycled Water Opportunity Profiles of Four Southern California Water Agencies
IEUA Ontario San Diego Los Angeles Recycled Water, Maximum Potential [2005]
Capacity: 86,600 afy Flows: 68,080 afy
Depends on IEUA’s ability to provide.
Capacity: 42,000 afy Flows: 36,400 afy[2]
Capacity: 151,200 afy Flows: 85,100 afy[5]
Recycled Water Used [afy, 2005]
7,000 Irrig. & Industrial 1,000 GWater Recharge 60,000 Santa Ana River[1]
1,229 OMC Irrigation 600 NMC Temp.
2,134 Landscaping 1,639 Industrial 467 Wholesale[3]
28,500 Environ. 1,950 M&I
54,650 River[6] Additional Tertiary Recycled Water Available Now
43,705 afy[3] n/a 23,512 afy[4] 24,650 afy[7]
Capital Est. to Develop Available Tertiary Water
$167 million $98.7million for local laterals $143 million[6] $100 million
Recycled Water, Projections at 2020
Capacity: 133,600 afy Flows: 107,400 afy Use: 86,000 afy
Use: 11,761 afy Use: 15,000 afy Use: 50,450 afy[8]
Notes: [1] IEUA presently discharges about 43,705 AFY of recycled water into the Santa Ana River that could be beneficially used today. (A 1969 Court Judgment requires that IEUA provide 16,875 AFY to the Santa Ana River for environmental purposes.) [2] San Diegoʹs estimate is for tertiary capacity only. It does not include about 165,150 AFY (147.5 MGD) advanced primary effluent from Pt. Loma presently being discharged to the ocean that could be treated to higher standards and reused. Not all waste water is treated to tertiary levels. [3] San Diego wholesale recycled water customers are small adjacent cities and water agencies. [4] Unutilized secondary flows that could be treated to tertiary are presently 23,512 AFY (15 MGD from North City Reclamation Plant, and 6 MGD from South Bay Reclamation Plant).
62 This estimate includes the amount of secondary effluent that is being discharged to the ocean by the City of San Diego that could be treated to tertiary levels with existing treatment plant capacity.

45
[5] Los Angelesʹ estimate is for tertiary capacity only. It does not include secondary effluent from the Hyperion Plant (dry weather capacity 450 MGD, wet weather capacity 850 MGD; current average flow 340 MGD, about 380,675 AFY). About 50 MGD (56,000 AFY) of secondary effluent is recycled on‐site or transported to West Basin Municipal Water District Water Recycling Plant for use by local industries. The rest of Hyperionʹs effluent (324,675 AFY) is discharged into Santa Monica Bay through a five‐mile ocean outfall.63 [6] Los Angeles is required to discharge 27MGD (30,000 AFY) of recycled water from its Tillman Plant to support habitat in the Los Angeles River. [7] About 24,650 AFY of tertiary water are discharged by LADWP to the Los Angeles River in excess of the amount required for environmental support that could be beneficially used today for other purposes. [8] This estimate does not include secondary effluent provided to West Basin Municipal Water District. The recycled water profiles for each of the four water agencies studied are summarized below. Inland Empire Utilities Agency (IEUA). In 2005, IEUA had tertiary treatment capacity of 86,600 AFY. Actual flows were 68,080 AFY of which 7,400 AF (about 11 percent) was applied to direct uses. Another 1,000 AF (1.5 percent) was used for groundwater replenishment. A court order requires that IEUA discharge a minimum of 16,875 AFY into the Santa Ana River for environmental purposes. Consequently, 24,375 AF (about 36 percent of available recycled water) was deemed beneficially used. The excess 43,705 AF could have been used for other benefits, but was not needed and was discharged to the Santa Ana River.
Table 4‐4 IEUA Recycled Water Profile
2005 2010 2015 2020 2025 Source 1 Total Water Demand 244,189 284,600 302,000 321,900 341,400 2005 UWMP, Table 2-7 2 Targeted Conservation 8,600 26,260 28,700 31,490 33,400 2005 UWMP, Table 2-8 3 Net Water Demand 235,589 258,340 273,300 290,410 308,000 Line 1 – Line 2
4 Treatment Plant Capacity 86,600 94,500 115,740 133,640 -
5 Tertiary Flows 68,080 83,900 104,600 107,400 -
2005 UWMP Table 5-2
6 Connected R.W. Demand 7,530 50,000 49,000 58,000 69,000
7 Direct Uses of Recycled Water 7,400 33,800 44,000 53,300 60,500
8 GWater Replenishment from Recycled Water 1,000 17,500 25,000 28,000 35,000
2005 UWMP Table 3-13
9 Santa Ana Environmental Water 16,875 16,875 16,875 16,875 16,875 1969 Court Judgment
10 Excess R.W. Discharged 43,705 15,725 18,725 9,225 - Line 5 less sum of
Lines 7-9 Note: All above numbers are in AFY, unless otherwise noted.
63 City of Los Angeles Website, Hyperion Sewage Treatment Plant, viewed March 2, 2008; http://www.cityofla.org/SAN/wpd/Siteorg/general/hypern1.htm.
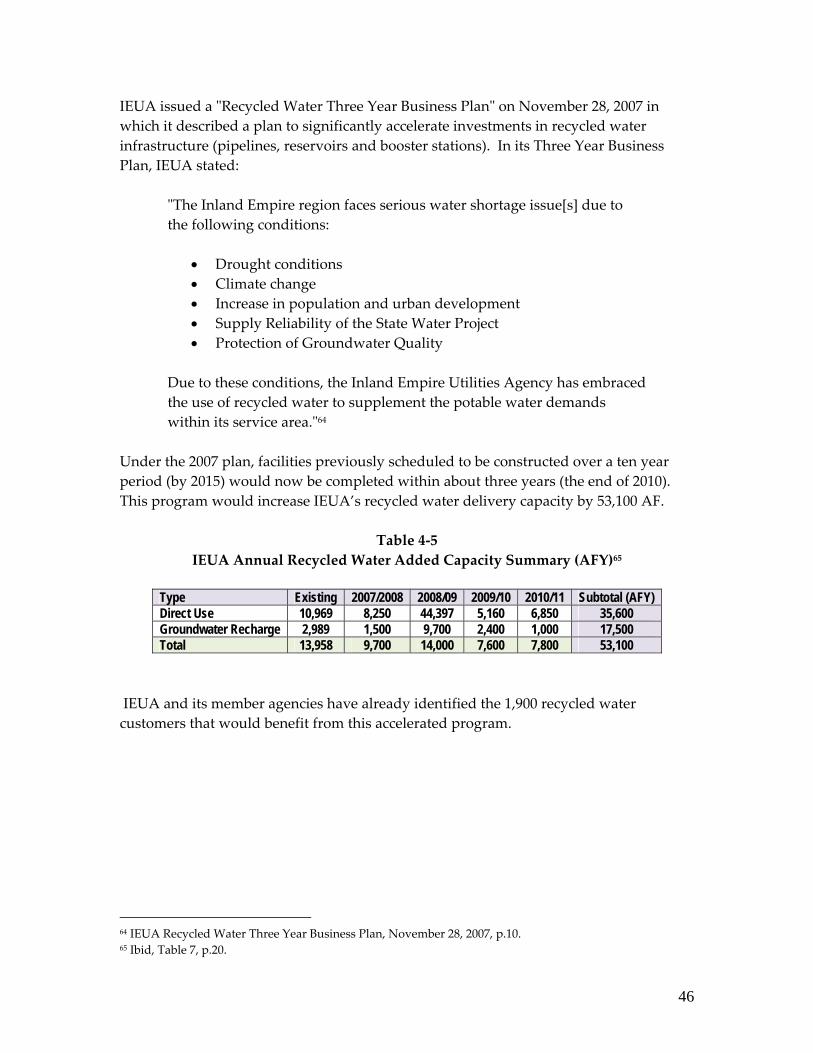
46
IEUA issued a ʺRecycled Water Three Year Business Planʺ on November 28, 2007 in which it described a plan to significantly accelerate investments in recycled water infrastructure (pipelines, reservoirs and booster stations). In its Three Year Business Plan, IEUA stated:
ʺThe Inland Empire region faces serious water shortage issue[s] due to the following conditions:
• Drought conditions • Climate change • Increase in population and urban development • Supply Reliability of the State Water Project • Protection of Groundwater Quality
Due to these conditions, the Inland Empire Utilities Agency has embraced the use of recycled water to supplement the potable water demands within its service area.ʺ64
Under the 2007 plan, facilities previously scheduled to be constructed over a ten year period (by 2015) would now be completed within about three years (the end of 2010). This program would increase IEUA’s recycled water delivery capacity by 53,100 AF.
Table 4‐5 IEUA Annual Recycled Water Added Capacity Summary (AFY)65
Type Existing 2007/2008 2008/09 2009/10 2010/11 Subtotal (AFY) Direct Use 10,969 8,250 44,397 5,160 6,850 35,600 Groundwater Recharge 2,989 1,500 9,700 2,400 1,000 17,500 Total 13,958 9,700 14,000 7,600 7,800 53,100
IEUA and its member agencies have already identified the 1,900 recycled water customers that would benefit from this accelerated program.
64 IEUA Recycled Water Three Year Business Plan, November 28, 2007, p.10. 65 Ibid, Table 7, p.20.
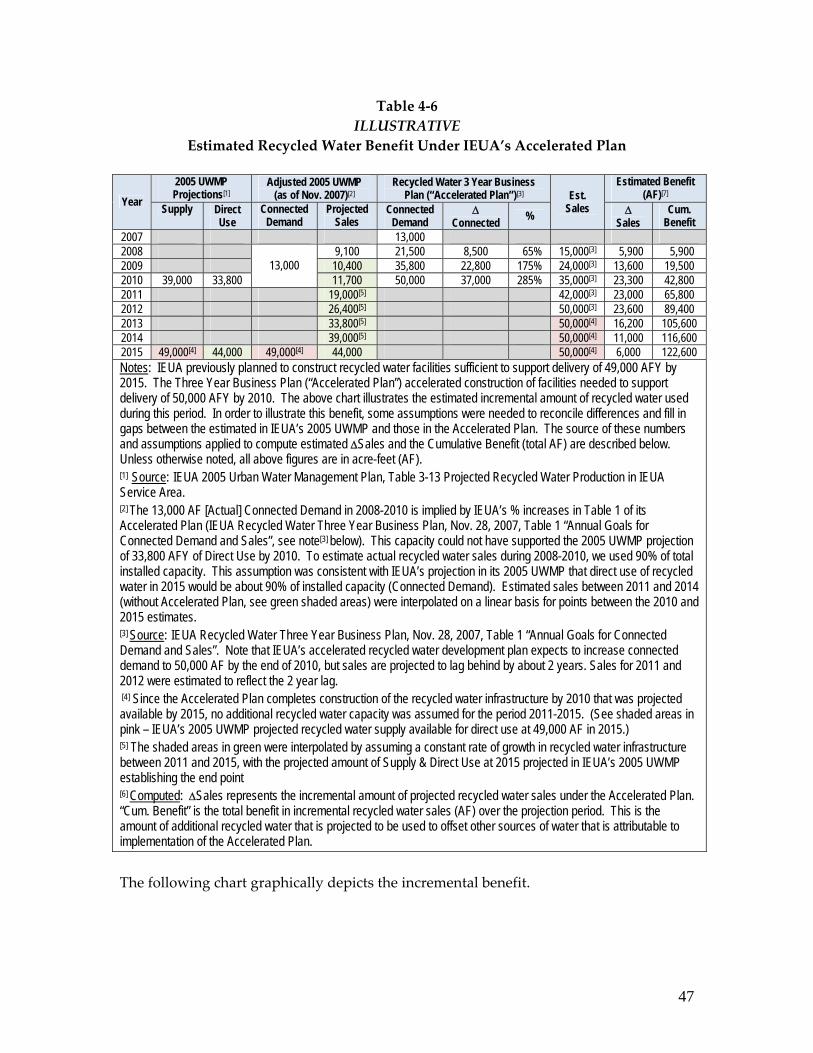
47
Table 4‐6 ILLUSTRATIVE
Estimated Recycled Water Benefit Under IEUA’s Accelerated Plan
2005 UWMP Projections[1]
Adjusted 2005 UWMP (as of Nov. 2007)[2]
Recycled Water 3 Year Business Plan (“Accelerated Plan”)[3]
Estimated Benefit (AF)[7] Year Supply Direct
Use Connected
Demand Projected
Sales Connected
Demand ∆
Connected %
Est. Sales ∆
Sales Cum.
Benefit 2007 13,000 2008 9,100 21,500 8,500 65% 15,000[3] 5,900 5,900 2009 10,400 35,800 22,800 175% 24,000[3] 13,600 19,500 2010 39,000 33,800
13,000 11,700 50,000 37,000 285% 35,000[3] 23,300 42,800
2011 19,000[5] 42,000[3] 23,000 65,800 2012 26,400[5] 50,000[3] 23,600 89,400 2013 33,800[5] 50,000[4] 16,200 105,600 2014 39,000[5] 50,000[4] 11,000 116,600 2015 49,000[4] 44,000 49,000[4] 44,000 50,000[4] 6,000 122,600 Notes: IEUA previously planned to construct recycled water facilities sufficient to support delivery of 49,000 AFY by 2015. The Three Year Business Plan (“Accelerated Plan”) accelerated construction of facilities needed to support delivery of 50,000 AFY by 2010. The above chart illustrates the estimated incremental amount of recycled water used during this period. In order to illustrate this benefit, some assumptions were needed to reconcile differences and fill in gaps between the estimated in IEUA’s 2005 UWMP and those in the Accelerated Plan. The source of these numbers and assumptions applied to compute estimated ∆Sales and the Cumulative Benefit (total AF) are described below. Unless otherwise noted, all above figures are in acre-feet (AF). [1] Source: IEUA 2005 Urban Water Management Plan, Table 3-13 Projected Recycled Water Production in IEUA Service Area. [2] The 13,000 AF [Actual] Connected Demand in 2008-2010 is implied by IEUA’s % increases in Table 1 of its Accelerated Plan (IEUA Recycled Water Three Year Business Plan, Nov. 28, 2007, Table 1 “Annual Goals for Connected Demand and Sales”, see note[3] below). This capacity could not have supported the 2005 UWMP projection of 33,800 AFY of Direct Use by 2010. To estimate actual recycled water sales during 2008-2010, we used 90% of total installed capacity. This assumption was consistent with IEUA’s projection in its 2005 UWMP that direct use of recycled water in 2015 would be about 90% of installed capacity (Connected Demand). Estimated sales between 2011 and 2014 (without Accelerated Plan, see green shaded areas) were interpolated on a linear basis for points between the 2010 and 2015 estimates. [3] Source: IEUA Recycled Water Three Year Business Plan, Nov. 28, 2007, Table 1 “Annual Goals for Connected Demand and Sales”. Note that IEUA’s accelerated recycled water development plan expects to increase connected demand to 50,000 AF by the end of 2010, but sales are projected to lag behind by about 2 years. Sales for 2011 and 2012 were estimated to reflect the 2 year lag. [4] Since the Accelerated Plan completes construction of the recycled water infrastructure by 2010 that was projected available by 2015, no additional recycled water capacity was assumed for the period 2011-2015. (See shaded areas in pink – IEUA’s 2005 UWMP projected recycled water supply available for direct use at 49,000 AF in 2015.) [5] The shaded areas in green were interpolated by assuming a constant rate of growth in recycled water infrastructure between 2011 and 2015, with the projected amount of Supply & Direct Use at 2015 projected in IEUA’s 2005 UWMP establishing the end point [6] Computed: ∆Sales represents the incremental amount of projected recycled water sales under the Accelerated Plan. “Cum. Benefit” is the total benefit in incremental recycled water sales (AF) over the projection period. This is the amount of additional recycled water that is projected to be used to offset other sources of water that is attributable to implementation of the Accelerated Plan. The following chart graphically depicts the incremental benefit.

48
0
10000
20000
30000
40000
50000
60000
70000
2005 2010 2015 2020 2025
Rec
ycle
d W
ater
Sup
ply (
AF)
Figure 4‐4Recycled Water Benefit Under IEUAʹs Accelerated Plan
Projected Accelerated
∆122,600 AF
IEUAʹs highest cost water is State Water Project water via MWD, of which it is a member. IEUA does not have any long term contracts or commitments with respect to SWP imports. The combination of highest cost and no firm commitment to take the water makes SWP the marginal supply for IEUA. In other words, increasing use of recycled water in IEUAʹs service area should displace need to purchase SWP water. Notably, IEUAʹs decision to accelerate development of the recycled water infrastructure needed to deliver all of its presently available tertiary flows is not, in itself, a definitive determinant of recycled water demand in its service area. In order to use the recycled water, IEUAʹs member agencies will need to construct the service laterals connecting IEUAʹs regional recycled water pipeline to retail water customers. In addition, retail water customers will need to retrofit their sites for dual‐plumbing as required by public health and safety regulations to keep potable water supplies separate from non‐potable sources. To significantly streamline and accelerate the recycled water decision, IEUA is assuming responsibility for developing and financing the service laterals on behalf of its member agencies. IEUA intends to apply for low interest State Revolving Fund (SRF) loans on behalf of its member agencies to finance construction of these laterals. Its member agencies will then assume responsibility for the debt service associated with the laterals. The high cost of retrofitting retail customer sites for dual plumbing, however, remains a significant barrier that has not been addressed by IEUAʹs accelerated development plan. Actual costs to retrofit a customerʹs site for dual plumbing depend on the complexity of the end userʹs water system. The following table, used by IEUA for internal planning purposes, illustrates the wide variability in customer costs that they have observed.

49
Table 4‐7 Costs of Retrofitting Customer Sites for Recycled Water
Type Subtype Site
Assessment/ As-built
Drawings
Engineer's Reports
Onsite Retrofit Construction
Cross Connection Testing (5)
Range of Dual-Plumbing
Costs per Site
Landscape Irrigation $0 - $5,000
$1,000 - $10,000 $5,000 - $15,000 $1,500 - $3,000
$7,500 - $33,000
Parks & Schools
$2,500 - $7,500
$ 2,000 - $25,000
$10,000 - $50,000 $3,000 - $6,000
$17,500 - $88,500
Irrigation
Golf Course $ 5,000 - $15,000
$15,000 - $50,000
$ 50,000 - $250,000
$ 3,000 - $10,000
$ 73,000 - $325,000
Cooling Towers
$ 5,000 - $20,000
$15,000 - $50,000
$ 5,000 - $250,000
$ 3,000 - $10,000
$ 28,000 - $330,000 Industrial
Industrial Process $75,000
$ 50,000 - $100,000
$ 50,000 - $500,000
$ 3,000 - $10,000
$178,000 - $685,000
Source: IEUA
IEUA, a wholesale water retailer, sells recycled water to its member agencies at $63/AF, 20 percent of the cost of imported potable water (Previously, the IEUA sold recycled water at 80 percent of the cost of potable water supplies, but this did not create a sufficient financial incentive.) IEUA funds the cost of the recycled water pipeline. Its wholesale customers decide whether to pay for the costs to connect retail water users to the recycled water system or whether it is a customer cost. Typically, the retail water customer pays all costs of re‐plumbing its own facilities (i.e., after meter delivery point to the perimeter of its premises). IEUA member agencies, in turn, add their costs and charge end users a higher rate (typically 50 to 70 percent of potable water costs), which varies from agency to agency depending on their individual financial situation (i.e., costs of distribution, operation, and maintenance, potable water costs, and other factors).66 IEUA has implemented several financial incentive and penalty programs. Most notably, large water customers that have the option to use recycled water but choose not to use it may be subject to a surcharge on the amount of potable water used of 50 percent of the highest wholesale potable water rate.67 Actual demand for recycled water will depend in large part on the economics of using recycled water. IEUA has stated that although many public entities with lean budgets
66 IEUA, 2005 Urban Water Management Plan, p. 5‐20. http://www.ieua.org/docs/Reports/2005%20UWMP/chapters/Chapter5.pdf 67 Ordinance #75, as of May 2002. Ordinance 75 states that various California laws require the beneficial use of water, and establishes that using potable water for irrigation and industrial uses, when recycled water is available, qualifies as a waste, not a beneficial use. Given this, IEUA and its contracting agencies agreed to maximize the use of recycled water for beneficial uses, through various financial penalties.
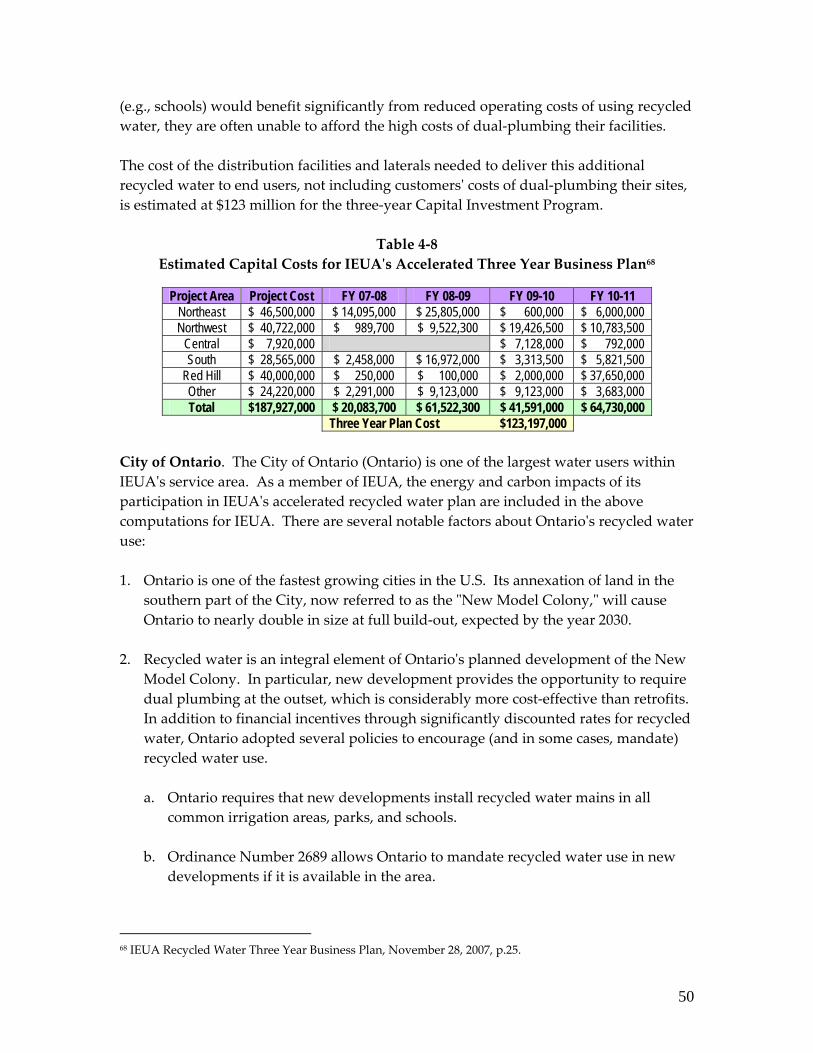
50
(e.g., schools) would benefit significantly from reduced operating costs of using recycled water, they are often unable to afford the high costs of dual‐plumbing their facilities. The cost of the distribution facilities and laterals needed to deliver this additional recycled water to end users, not including customersʹ costs of dual‐plumbing their sites, is estimated at $123 million for the three‐year Capital Investment Program.
Table 4‐8 Estimated Capital Costs for IEUAʹs Accelerated Three Year Business Plan68
Project Area Project Cost FY 07-08 FY 08-09 FY 09-10 FY 10-11
Northeast $ 46,500,000 $ 14,095,000 $ 25,805,000 $ 600,000 $ 6,000,000 Northwest $ 40,722,000 $ 989,700 $ 9,522,300 $ 19,426,500 $ 10,783,500
Central $ 7,920,000 $ 7,128,000 $ 792,000 South $ 28,565,000 $ 2,458,000 $ 16,972,000 $ 3,313,500 $ 5,821,500
Red Hill $ 40,000,000 $ 250,000 $ 100,000 $ 2,000,000 $ 37,650,000 Other $ 24,220,000 $ 2,291,000 $ 9,123,000 $ 9,123,000 $ 3,683,000 Total $187,927,000 $ 20,083,700 $ 61,522,300 $ 41,591,000 $ 64,730,000
Three Year Plan Cost $123,197,000 City of Ontario. The City of Ontario (Ontario) is one of the largest water users within IEUAʹs service area. As a member of IEUA, the energy and carbon impacts of its participation in IEUAʹs accelerated recycled water plan are included in the above computations for IEUA. There are several notable factors about Ontarioʹs recycled water use: 1. Ontario is one of the fastest growing cities in the U.S. Its annexation of land in the
southern part of the City, now referred to as the ʺNew Model Colony,ʺ will cause Ontario to nearly double in size at full build‐out, expected by the year 2030.
2. Recycled water is an integral element of Ontarioʹs planned development of the New
Model Colony. In particular, new development provides the opportunity to require dual plumbing at the outset, which is considerably more cost‐effective than retrofits. In addition to financial incentives through significantly discounted rates for recycled water, Ontario adopted several policies to encourage (and in some cases, mandate) recycled water use.
a. Ontario requires that new developments install recycled water mains in all
common irrigation areas, parks, and schools.
b. Ordinance Number 2689 allows Ontario to mandate recycled water use in new developments if it is available in the area.
68 IEUA Recycled Water Three Year Business Plan, November 28, 2007, p.25.
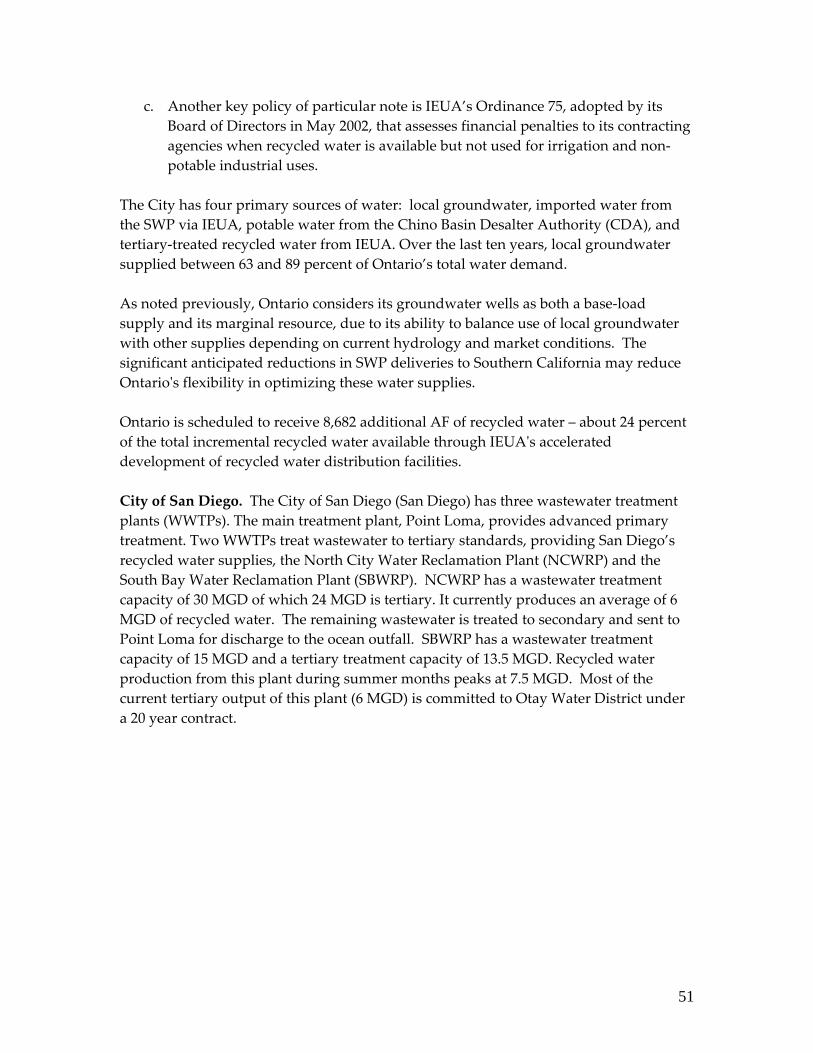
51
c. Another key policy of particular note is IEUA’s Ordinance 75, adopted by its Board of Directors in May 2002, that assesses financial penalties to its contracting agencies when recycled water is available but not used for irrigation and non‐potable industrial uses.
The City has four primary sources of water: local groundwater, imported water from the SWP via IEUA, potable water from the Chino Basin Desalter Authority (CDA), and tertiary‐treated recycled water from IEUA. Over the last ten years, local groundwater supplied between 63 and 89 percent of Ontario’s total water demand. As noted previously, Ontario considers its groundwater wells as both a base‐load supply and its marginal resource, due to its ability to balance use of local groundwater with other supplies depending on current hydrology and market conditions. The significant anticipated reductions in SWP deliveries to Southern California may reduce Ontarioʹs flexibility in optimizing these water supplies. Ontario is scheduled to receive 8,682 additional AF of recycled water – about 24 percent of the total incremental recycled water available through IEUAʹs accelerated development of recycled water distribution facilities. City of San Diego. The City of San Diego (San Diego) has three wastewater treatment plants (WWTPs). The main treatment plant, Point Loma, provides advanced primary treatment. Two WWTPs treat wastewater to tertiary standards, providing San Diego’s recycled water supplies, the North City Water Reclamation Plant (NCWRP) and the South Bay Water Reclamation Plant (SBWRP). NCWRP has a wastewater treatment capacity of 30 MGD of which 24 MGD is tertiary. It currently produces an average of 6 MGD of recycled water. The remaining wastewater is treated to secondary and sent to Point Loma for discharge to the ocean outfall. SBWRP has a wastewater treatment capacity of 15 MGD and a tertiary treatment capacity of 13.5 MGD. Recycled water production from this plant during summer months peaks at 7.5 MGD. Most of the current tertiary output of this plant (6 MGD) is committed to Otay Water District under a 20 year contract.
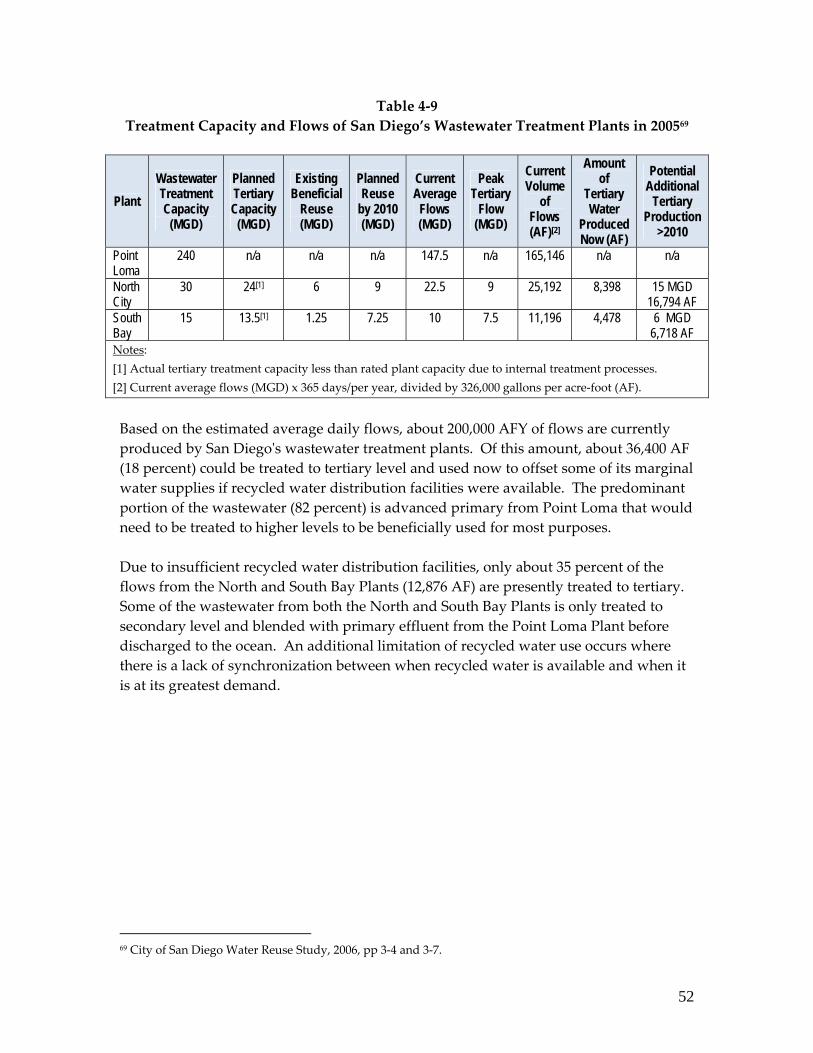
52
Table 4‐9 Treatment Capacity and Flows of San Diego’s Wastewater Treatment Plants in 200569
Plant Wastewater Treatment Capacity
(MGD)
Planned Tertiary Capacity
(MGD)
Existing Beneficial
Reuse (MGD)
Planned Reuse
by 2010 (MGD)
Current Average Flows (MGD)
Peak Tertiary
Flow (MGD)
Current Volume
of Flows (AF)[2]
Amount of
Tertiary Water
Produced Now (AF)
Potential Additional
Tertiary Production
>2010 Point Loma
240 n/a n/a n/a 147.5 n/a 165,146 n/a n/a
North City
30 24[1] 6 9 22.5 9 25,192 8,398 15 MGD 16,794 AF
South Bay
15 13.5[1] 1.25 7.25 10 7.5 11,196 4,478 6 MGD 6,718 AF
Notes: [1] Actual tertiary treatment capacity less than rated plant capacity due to internal treatment processes. [2] Current average flows (MGD) x 365 days/per year, divided by 326,000 gallons per acre‐foot (AF).
Based on the estimated average daily flows, about 200,000 AFY of flows are currently produced by San Diegoʹs wastewater treatment plants. Of this amount, about 36,400 AF (18 percent) could be treated to tertiary level and used now to offset some of its marginal water supplies if recycled water distribution facilities were available. The predominant portion of the wastewater (82 percent) is advanced primary from Point Loma that would need to be treated to higher levels to be beneficially used for most purposes. Due to insufficient recycled water distribution facilities, only about 35 percent of the flows from the North and South Bay Plants (12,876 AF) are presently treated to tertiary. Some of the wastewater from both the North and South Bay Plants is only treated to secondary level and blended with primary effluent from the Point Loma Plant before discharged to the ocean. An additional limitation of recycled water use occurs where there is a lack of synchronization between when recycled water is available and when it is at its greatest demand.
69 City of San Diego Water Reuse Study, 2006, pp 3‐4 and 3‐7.

53
Table 4‐10 City of San Diego Recycled Water Profile
2005 2010 2015 2020 2025 Source 1 Total Water Demand 227,456 239,426 246,378 256,460 266,438 2005 UWMP, Table 2-9
2 Wastewater Collected & Treated (AF) 247,048 271,753 298,928 328,821 361,703 2005UWMP, Table 5-2
3 Treatment Plant Capacity (Tertiary only) 37.5 MGD TBD Water Reuse Study 2006
4 Tertiary Flows 16.5 MGD TBD Water Reuse Study 2006
5 Projected Quantity of Wastewater Collected & Treated that Meets Reclaimed Water Standard
11,886 8,759 13,139 16,029 19,555 2007 UWMP, Table 5-2
6 Planned Reclaimed Water Production 4,294 8,525[1] 12,200[1] 15,200[1] 15,200[1] 2007 UIWMP, Table 2-2
7 Projected Recycled Water Demand:
7a Landscape (Tertiary) 9,441 8,025 8,325 8,378 2007 UWMP, Table 5-5 7b Industrial (Tertiary) 2,450 2,450 2,450 2,450 2007 UWMP, Table 5-5 7c Wholesale (Tertiary) 4,338 5,754 6,612 7,078 2007 UWMP, Table 5-5 7d Total Tertiary Direct Use
11,263[1] 16,229[1] 17,387[1] 17,906[1] 2007 UWMP, Table 5-5
8 Amount of Wastewater Projected to be Discharged to the Ocean (Primary or better)
251,068 232,273 253,178 268,369 281,787 2007 UWMP, Table 5-3
Note: All above numbers in AFY, unless otherwise noted. [1] Includes commitments to provide up to 6,718 AFY of tertiary‐treated recycled water to Otay Water District under a 20 year agreement. The City’s highest priority for increasing recycled water use is to connect new customers to existing distribution lines (“in‐fill” developments). In‐fill is especially applicable to the Northern Service Area since the City has made strategic infrastructure investments to move transmission facilities to areas of high water demand. In‐fill development is particularly important since new customer connections on existing distribution lines represent the quickest and best way to expand recycled water use. Customer retrofit costs, however, represent the primary impediment to full utilization of available recycled water. This challenge is not unique to the City. The SDCWA confirms that customer retrofit costs are the primary challenge to recycled water system expansion for most agencies. The City does not currently have funding to offset these customer retrofit costs and facilitate in‐fill development. The City of San Diego is currently evaluating costs and benefits of Indirect Potable Reuse (IPR). IPR is the practice of taking recycled water that meets all regulatory requirements for non‐potable use, treating it further with several advanced treatment processes to meet potable water standards, and adding it to an untreated potable water supply. The water body is typically a surface water reservoir or a groundwater aquifer. The term “indirect” refers to the distinction that highly treated recycled water is not
54
plumbed directly to the potable distribution system. During a long residence time, the highly treated recycled water blends with the source water, which is usually imported water and local runoff. In its March 2006 Water Reuse Study, San Diego outlined a number of strategies for accelerating use of its existing recycled water supplies.
Table 4‐11 San Diegoʹs Strategies for Development of Its Recycled Water Infrastructure
North City South Bay Strategy NC1 NC2 NC3 SB1 SB2 SB3 Incremental Demand 19,680[1] 18,040[1] 23,760[1] 13,040[2] 8,960[2] 12,660[2] % of Tertiary Flows Served 73% 69% 100% 86% 62% 96% Estimated Capital Cost[3] $284.7M $188.3M $237.6M $1.0M[4] $21.6M $96.1M Weighted Average $/AF[3] $1,960 $1,370 $1,230 $70[4] $1,330 $1,530 Description of Strategies: All below cites are from City of San Diego’s Water Reuse Study, 2006. NC1 ‐ Expansion of the non‐potable system to serve infill, Phase III Rancho Bernardo, the Central Service Area, and Rose Canyon wetlands (p.7‐6). NC2 ‐ Expansion of the non‐potable system to serve infill and Phase III Rancho Bernardo, followed by a small‐scale indirect potable reuse (IPR) project at Lake Hodges (7‐8). NC3 ‐ Expansion of the non‐potable system to serve infill, followed by a large‐scale San Vicente Reservoir IPR project sized to maximize available supplies (p.7‐10). SB1 ‐ Expansion of the non‐potable system to serve OWD and Sweetwater Authority (p.7‐16). SB2 ‐ Expansion of the non‐potable system to serve OWD, followed by a small‐scale IPR opportunity at Lower Otay Reservoir (p.7‐18). SB3 ‐ Expansion of the non‐potable system to serve OWD, followed by a large‐scale IPR opportunity at Lower Otay Reservoir (p.7‐20). Notes: [1] From Table 7‐1. Each strategy includes completing existing work that would enable serving 9,440 AFY of demand plus an additional 3,820 AFY of infill. [2] From Table 7‐2. [3] Does not include potential incentives from MWD and/or SDCWA. [4] The low cost of this option relative to others is due to the revenues paid by Otay Water District to access this water.
In the study, San Diego stated its commitment to completing Phases I and II expansions of the North City recycled water distribution system. In addition, San Diego stated its intent to pursue infill opportunities that would help meet the City’s Northern Service Area goal of beneficially using 12 MGD (13,400 AFY) by 2010. Other opportunities were more costly and/or could not be completed by 2010. San Diego views its marginal supply as imported water via the SDCWA that supplies more than 80 percent of its water.
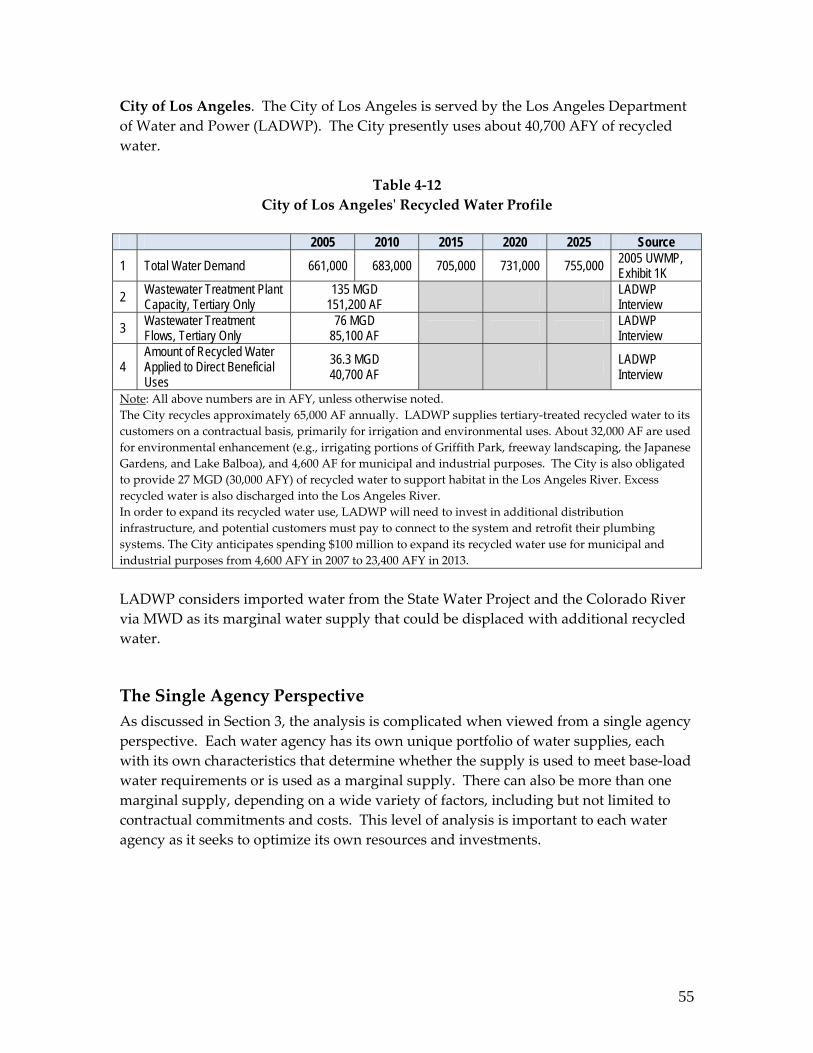
55
City of Los Angeles. The City of Los Angeles is served by the Los Angeles Department of Water and Power (LADWP). The City presently uses about 40,700 AFY of recycled water.
Table 4‐12 City of Los Angelesʹ Recycled Water Profile
2005 2010 2015 2020 2025 Source
1 Total Water Demand 661,000 683,000 705,000 731,000 755,000 2005 UWMP, Exhibit 1K
2 Wastewater Treatment Plant Capacity, Tertiary Only
135 MGD 151,200 AF LADWP
Interview
3 Wastewater Treatment Flows, Tertiary Only
76 MGD 85,100 AF LADWP
Interview
4 Amount of Recycled Water Applied to Direct Beneficial Uses
36.3 MGD 40,700 AF LADWP
Interview
Note: All above numbers are in AFY, unless otherwise noted. The City recycles approximately 65,000 AF annually. LADWP supplies tertiary‐treated recycled water to its customers on a contractual basis, primarily for irrigation and environmental uses. About 32,000 AF are used for environmental enhancement (e.g., irrigating portions of Griffith Park, freeway landscaping, the Japanese Gardens, and Lake Balboa), and 4,600 AF for municipal and industrial purposes. The City is also obligated to provide 27 MGD (30,000 AFY) of recycled water to support habitat in the Los Angeles River. Excess recycled water is also discharged into the Los Angeles River. In order to expand its recycled water use, LADWP will need to invest in additional distribution infrastructure, and potential customers must pay to connect to the system and retrofit their plumbing systems. The City anticipates spending $100 million to expand its recycled water use for municipal and industrial purposes from 4,600 AFY in 2007 to 23,400 AFY in 2013. LADWP considers imported water from the State Water Project and the Colorado River via MWD as its marginal water supply that could be displaced with additional recycled water.
The Single Agency Perspective As discussed in Section 3, the analysis is complicated when viewed from a single agency perspective. Each water agency has its own unique portfolio of water supplies, each with its own characteristics that determine whether the supply is used to meet base‐load water requirements or is used as a marginal supply. There can also be more than one marginal supply, depending on a wide variety of factors, including but not limited to contractual commitments and costs. This level of analysis is important to each water agency as it seeks to optimize its own resources and investments.
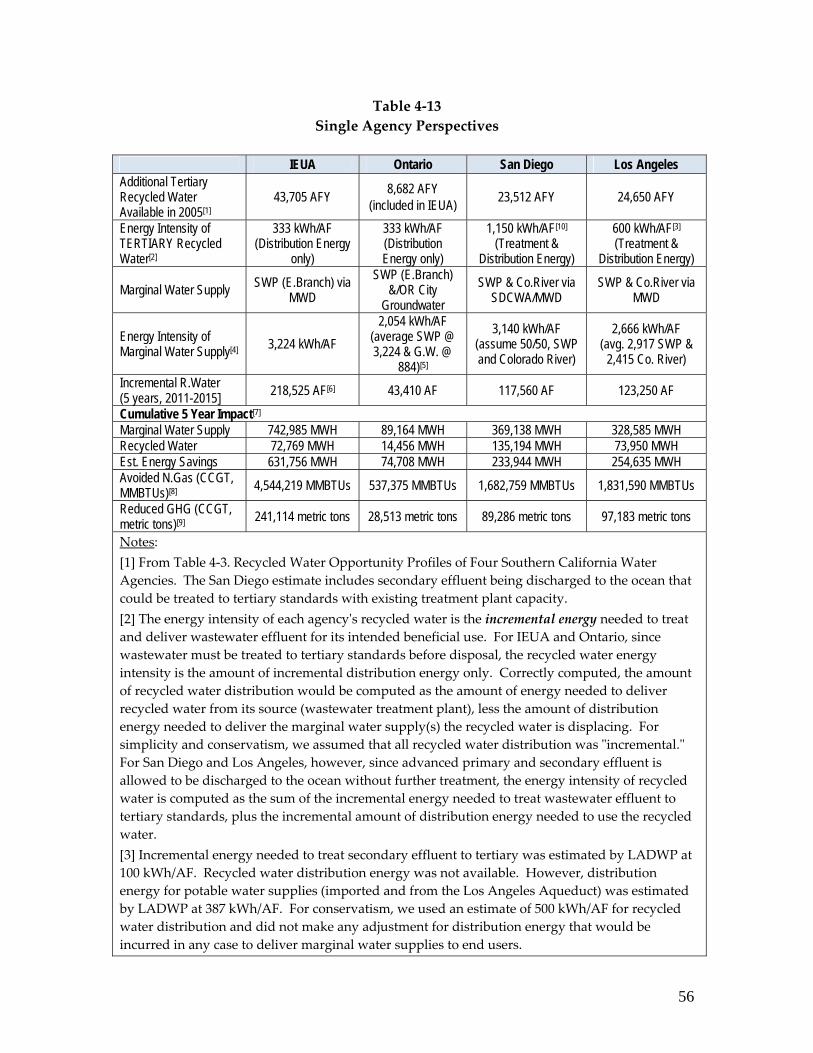
56
Table 4‐13 Single Agency Perspectives
IEUA Ontario San Diego Los Angeles Additional Tertiary Recycled Water Available in 2005[1]
43,705 AFY 8,682 AFY (included in IEUA) 23,512 AFY 24,650 AFY
Energy Intensity of TERTIARY Recycled Water[2]
333 kWh/AF (Distribution Energy
only)
333 kWh/AF (Distribution Energy only)
1,150 kWh/AF[10]
(Treatment & Distribution Energy)
600 kWh/AF[3] (Treatment &
Distribution Energy)
Marginal Water Supply SWP (E.Branch) via MWD
SWP (E.Branch) &/OR City
Groundwater SWP & Co.River via
SDCWA/MWD SWP & Co.River via
MWD
Energy Intensity of Marginal Water Supply[4] 3,224 kWh/AF
2,054 kWh/AF (average SWP @ 3,224 & G.W. @
884)[5]
3,140 kWh/AF (assume 50/50, SWP and Colorado River)
2,666 kWh/AF (avg. 2,917 SWP &
2,415 Co. River)
Incremental R.Water (5 years, 2011-2015] 218,525 AF[6] 43,410 AF 117,560 AF 123,250 AF
Cumulative 5 Year Impact[7] Marginal Water Supply 742,985 MWH 89,164 MWH 369,138 MWH 328,585 MWH Recycled Water 72,769 MWH 14,456 MWH 135,194 MWH 73,950 MWH Est. Energy Savings 631,756 MWH 74,708 MWH 233,944 MWH 254,635 MWH Avoided N.Gas (CCGT, MMBTUs)[8] 4,544,219 MMBTUs 537,375 MMBTUs 1,682,759 MMBTUs 1,831,590 MMBTUs
Reduced GHG (CCGT, metric tons)[9] 241,114 metric tons 28,513 metric tons 89,286 metric tons 97,183 metric tons
Notes: [1] From Table 4‐3. Recycled Water Opportunity Profiles of Four Southern California Water Agencies. The San Diego estimate includes secondary effluent being discharged to the ocean that could be treated to tertiary standards with existing treatment plant capacity. [2] The energy intensity of each agencyʹs recycled water is the incremental energy needed to treat and deliver wastewater effluent for its intended beneficial use. For IEUA and Ontario, since wastewater must be treated to tertiary standards before disposal, the recycled water energy intensity is the amount of incremental distribution energy only. Correctly computed, the amount of recycled water distribution would be computed as the amount of energy needed to deliver recycled water from its source (wastewater treatment plant), less the amount of distribution energy needed to deliver the marginal water supply(s) the recycled water is displacing. For simplicity and conservatism, we assumed that all recycled water distribution was ʺincremental.ʺ For San Diego and Los Angeles, however, since advanced primary and secondary effluent is allowed to be discharged to the ocean without further treatment, the energy intensity of recycled water is computed as the sum of the incremental energy needed to treat wastewater effluent to tertiary standards, plus the incremental amount of distribution energy needed to use the recycled water. [3] Incremental energy needed to treat secondary effluent to tertiary was estimated by LADWP at 100 kWh/AF. Recycled water distribution energy was not available. However, distribution energy for potable water supplies (imported and from the Los Angeles Aqueduct) was estimated by LADWP at 387 kWh/AF. For conservatism, we used an estimate of 500 kWh/AF for recycled water distribution and did not make any adjustment for distribution energy that would be incurred in any case to deliver marginal water supplies to end users.
57
[4] Recycled water treated to tertiary standards is ready for end use. Therefore, for appropriate comparison, the amount of energy needed to treat alternative supplies to the quality needed to enable end use needs to be included in the energy intensity of marginal supplies. For purposes of this computation, the energy intensity of marginal water supplies includes conveyance, treatment and distribution energy. [5] As noted previously, depending on hydrology, the City of Ontario regards its groundwater wells as both a base‐loaded and marginal supply. However, supplemental water provided by IEUA to make up for annual shortfalls in water supplies is the Chino Basinʹs marginal supply. The primary source of this supplemental water is from the East Branch of the State Water Project. For conservatism, the energy intensity of the City of Ontarioʹs marginal water supply was based on an average of local groundwater and E.Branch State Water Project. [6] Table 4‐6 Estimated Recycled Water Benefit Under IEUA’s Accelerated Plan shows incremental recycled water sales of 122,600 AF through 2015. This number does not include 80,850 AF of additional recycled water ‐ an estimated 41,300 AF that may not be applied to a direct use because of a 2 year lag between availability of recycled water and connected sales, and an additional 39,550 AF of recyclable water that exceeds the capacity of even the accelerated new infrastructure to deliver to approved direct uses. (The amount of recyclable water that exceeds the capacity of the accelerated new infrastructure was estimated at 50% of the incremental tertiary wastewater projected in 2015 vs. 2010.) [7] The purpose of computing the cumulative five year benefit is to represent the impact of accelerating development and use of unutilized tertiary recycled water. Where excess tertiary supplies are available, we assumed that development of recycled water infrastructure could be accelerated and constructed within 2‐3 years, presuming existing rights‐of‐way were available for this additional infrastructure. This would enable achieving the targeted level of recycled water demand in 2015 by the end of 2010. [8] For simplicity and consistency, we used Californiaʹs proxy for long‐run marginal cost of energy, an avoided unit of electricity from a CCGT in the western grid‐connected U.S. The long‐run marginal cost of avoided energy adopted by the CPUC (last updated in 2005) employs a heat rate of 7,193 BTUs/kWh that varies over time, depending on the assumed efficiency of the marginal CCGT in any particular year. [9] The amount of estimated CO2 emissions for an avoided unit of long‐run marginal CCGT energy was interpolated at 0.4207 tons/MWH (the CPUCʹs consultant estimated 0.365 tons/MWH for a unit of natural‐gas fired CCGT at an average heat rate of 6,240 BTUs/kWh). [10] Since the City of San Diego can discharge secondary effluent to the ocean, the energy intensity of the City’s recycled water is measured on the basis of incremental energy used to treat secondary effluent to tertiary, and any incremental energy needed to distribute tertiary water to qualified end uses. The 1,150 kWh/AF estimate for the City of San Diego is based on the weighted average of the North City and South Bay Plants and ancillary systems.
The Statewide Perspective The ʺrightʺ decision from the perspective of a single agency optimizing its own water supply portfolio may not be consistent with the best interests of the state overall. The optimization of all three high priority state goals ‐ water, energy and climate, on a

58
combined basis – requires elevating the policy perspective to a higher, statewide level. In other words, we need to identify the best outcomes for the state overall, and design our policies and programs to achieve those results. The figure below illustrates the recycled water benefits achievable by accelerating recycled water sales by building infrastructure planned to be constructed by the cities of San Diego and Los Angeles by 2015, to 2010. Increased use of recycled water achieves energy and associated carbon benefits by displacing higher energy intensity water resources.
Figure 4‐5 A New Water‐Energy‐Climate Paradigm70
0
10000
20000
30000
40000
50000
60000
70000
2005 2010 2015 2020 2025 2030
Year
Rec
ycle
dW
ater
Supp
ly(A
F)
San Diego Projected San Diego Accelerated Los Angeles Projected Los Angeles Accelerated
41,600 AF
135,000 AF
From a statewide perspective, accelerating and increasing the development and use of recycled water is a beneficial option from the perspectives of water, energy, and carbon. • Water – Recycled water is a local source of supply that is presently available in far
greater quantities than is currently being used. Recycled water can safely be applied to a wide variety of non‐potable and indirect‐potable uses. In addition, since recycled water is produced through the process of treating wastewater, it is a reliable source of local water supply that is close to water users. Any recycled water that is presently not being applied to a beneficial purpose could be used to displace a unit
70 DRAFT ʺWater‐Energy Five Year Strategic RD&D Plan and Roadmapʺ, California Energy Commissionʹs Public Interest Energy Research (PIER) division, 2007.
59
of potable water that is being applied to a non‐potable use, thereby increasing the stateʹs overall supply of water.71
• Energy – Recycled water is also a very beneficial source of supply from the context
of energy intensity. Recycled water is produced through the process of treating wastewater. The energy needed to treat the wastewater to levels required by regulation for safe disposal is ʺsunkʺ; i.e., that amount of energy would need to be used to treat the wastewater, whether or not the wastewater effluent is beneficially reused. Consequently, the energy intensity of recycled water is measured as:
» The additional amount of energy (if any) needed to treat the wastewater effluent
to a higher level if needed for the intended beneficial purposes, plus » The amount of energy (if any) needed to deliver recycled water to its end uses
that exceeds that amount that would have been needed to distribute other sources of water to the same end users.
In general, wastewater that is required to be treated to tertiary levels prior to discharge is ideal for use as recycled water since it will not need much, if any, additional treatment and the energy intensity of tertiary treated water is often lower than any water resources other than conservation (i.e., avoiding or reducing use of the water). Other types of wastewater (e.g., wastewater treated to secondary standards) can also be used as recycled water. However, since there are fewer approved uses for water of these lower qualities (see Table 4‐1. Approved Uses of Recycled Water), additional treatment may be needed to improve the water quality to the level required by regulation for safe beneficial use. Any such additional energy needed to treat the wastewater to higher levels before reuse would increase the energy intensity of that source of recycled water. From a statewide perspective, saving a unit of energy anywhere in California has the effect of reducing the stateʹs need to purchase a unit of energy. As discussed in Section 3, policymakers have adopted a CCGT as the statewide proxy for the avoided cost of energy. Consequently, the energy benefit of increasing use of recycled water is the amount of energy avoided (saved) by not needing to produce and deliver a comparable unit of the stateʹs marginal water supply, valued at the all‐in cost of a CCGT.72 The CPUC applied a levelized price of electricity (supply and
71 “Beneficial use” includes both direct (e.g., landscape irrigation, industrial processes) and indirect (e.g., environmental water) uses. Recycled water supply is deemed “lost” when discharges to natural waterways and the ocean exceed the amount needed for environmental and other purposes, even though some downstream users may benefit from the additional water (e.g., the additional upstream discharge reduces need for environmental water contributions by downstream users). 72 Note that additional energy benefits may accrue from avoided transmission and distribution related to the amount of avoided energy. For simplicity and conservatism, those impacts have not been quantified in this report.
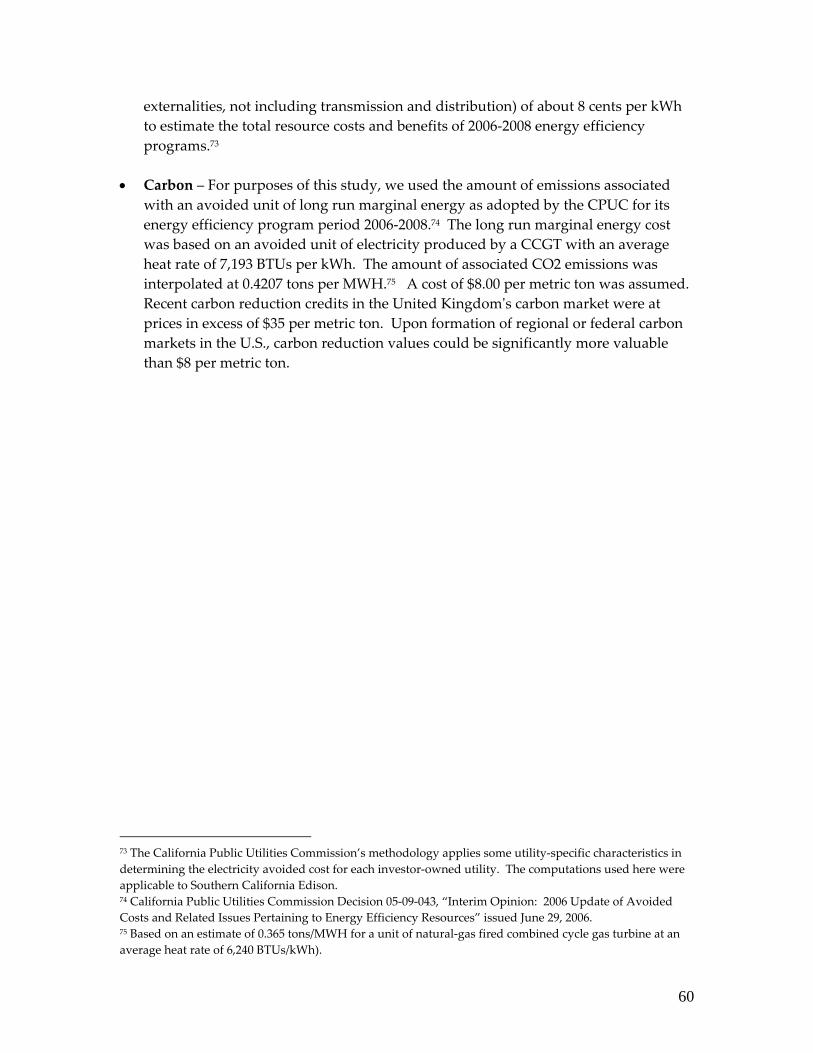
60
externalities, not including transmission and distribution) of about 8 cents per kWh to estimate the total resource costs and benefits of 2006‐2008 energy efficiency programs.73
• Carbon – For purposes of this study, we used the amount of emissions associated with an avoided unit of long run marginal energy as adopted by the CPUC for its energy efficiency program period 2006‐2008.74 The long run marginal energy cost was based on an avoided unit of electricity produced by a CCGT with an average heat rate of 7,193 BTUs per kWh. The amount of associated CO2 emissions was interpolated at 0.4207 tons per MWH.75 A cost of $8.00 per metric ton was assumed. Recent carbon reduction credits in the United Kingdomʹs carbon market were at prices in excess of $35 per metric ton. Upon formation of regional or federal carbon markets in the U.S., carbon reduction values could be significantly more valuable than $8 per metric ton.
73 The California Public Utilities Commission’s methodology applies some utility‐specific characteristics in determining the electricity avoided cost for each investor‐owned utility. The computations used here were applicable to Southern California Edison. 74 California Public Utilities Commission Decision 05‐09‐043, “Interim Opinion: 2006 Update of Avoided Costs and Related Issues Pertaining to Energy Efficiency Resources” issued June 29, 2006. 75 Based on an estimate of 0.365 tons/MWH for a unit of natural‐gas fired combined cycle gas turbine at an average heat rate of 6,240 BTUs/kWh).
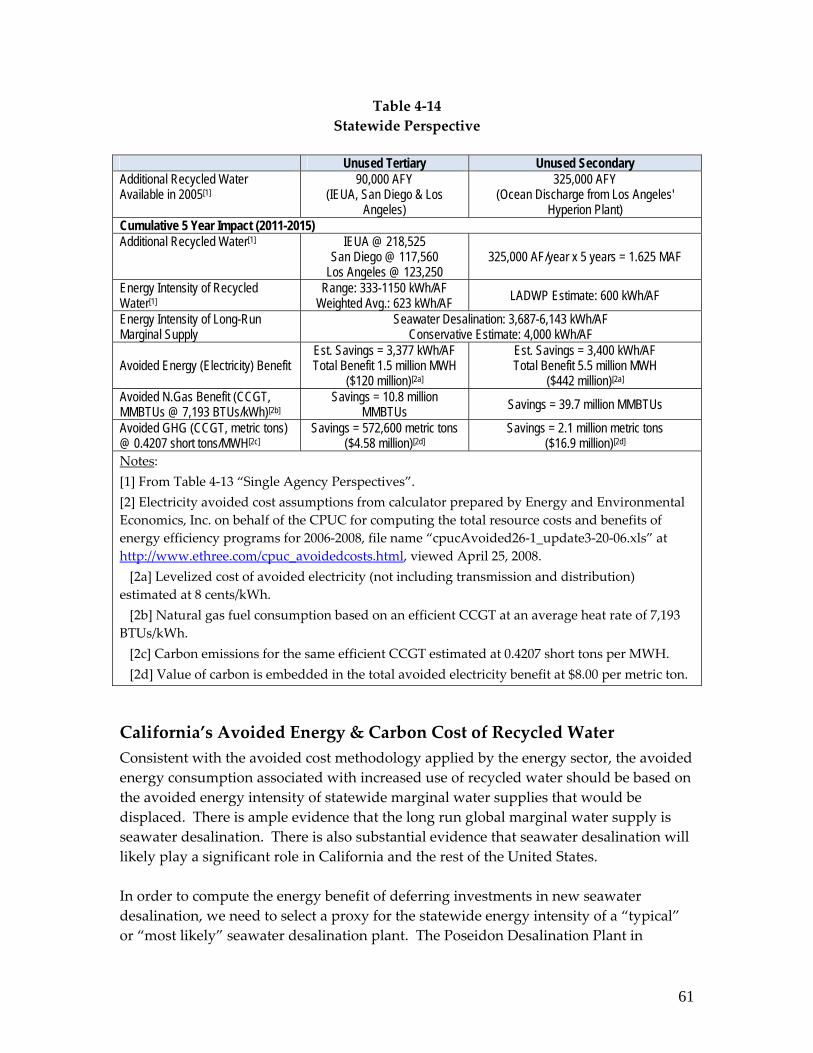
61
Table 4‐14 Statewide Perspective
Unused Tertiary Unused Secondary
Additional Recycled Water Available in 2005[1]
90,000 AFY (IEUA, San Diego & Los
Angeles)
325,000 AFY (Ocean Discharge from Los Angeles'
Hyperion Plant) Cumulative 5 Year Impact (2011-2015) Additional Recycled Water[1]
IEUA @ 218,525 San Diego @ 117,560
Los Angeles @ 123,250 325,000 AF/year x 5 years = 1.625 MAF
Energy Intensity of Recycled Water[1]
Range: 333-1150 kWh/AF Weighted Avg.: 623 kWh/AF LADWP Estimate: 600 kWh/AF
Energy Intensity of Long-Run Marginal Supply
Seawater Desalination: 3,687-6,143 kWh/AF Conservative Estimate: 4,000 kWh/AF
Avoided Energy (Electricity) Benefit Est. Savings = 3,377 kWh/AF Total Benefit 1.5 million MWH
($120 million)[2a]
Est. Savings = 3,400 kWh/AF Total Benefit 5.5 million MWH
($442 million)[2a] Avoided N.Gas Benefit (CCGT, MMBTUs @ 7,193 BTUs/kWh)[2b]
Savings = 10.8 million MMBTUs Savings = 39.7 million MMBTUs
Avoided GHG (CCGT, metric tons) @ 0.4207 short tons/MWH[2c]
Savings = 572,600 metric tons ($4.58 million)[2d]
Savings = 2.1 million metric tons ($16.9 million)[2d]
Notes: [1] From Table 4‐13 “Single Agency Perspectives”. [2] Electricity avoided cost assumptions from calculator prepared by Energy and Environmental Economics, Inc. on behalf of the CPUC for computing the total resource costs and benefits of energy efficiency programs for 2006‐2008, file name “cpucAvoided26‐1_update3‐20‐06.xls” at http://www.ethree.com/cpuc_avoidedcosts.html, viewed April 25, 2008. [2a] Levelized cost of avoided electricity (not including transmission and distribution) estimated at 8 cents/kWh. [2b] Natural gas fuel consumption based on an efficient CCGT at an average heat rate of 7,193 BTUs/kWh. [2c] Carbon emissions for the same efficient CCGT estimated at 0.4207 short tons per MWH. [2d] Value of carbon is embedded in the total avoided electricity benefit at $8.00 per metric ton.
California’s Avoided Energy & Carbon Cost of Recycled Water Consistent with the avoided cost methodology applied by the energy sector, the avoided energy consumption associated with increased use of recycled water should be based on the avoided energy intensity of statewide marginal water supplies that would be displaced. There is ample evidence that the long run global marginal water supply is seawater desalination. There is also substantial evidence that seawater desalination will likely play a significant role in California and the rest of the United States. In order to compute the energy benefit of deferring investments in new seawater desalination, we need to select a proxy for the statewide energy intensity of a “typical” or “most likely” seawater desalination plant. The Poseidon Desalination Plant in

62
Carlsbad is the first utility‐scale desalination plant expected in California. Poseidon estimates that its energy requirements will be about 4,643 kWh/AF. Peak electric demand is projected to be 35.5 megawatts. Poseidon estimated distribution energy at 1,500 kWh/AF. The Poseidon estimate of the projected energy intensity of its desalinated water supplies is about the mid‐point of estimates for other utility‐scale desalination plants. • West Basin estimated that the energy intensity of its seawater desalination plant,
when complete, would be about 3,687 kWh/AF. • The Pacific Institute, in its 2006 study “Desalination, with a Grain of Salt, A
California Perspective” noted that while there were variances, current seawater desalination technology indicates that a 50 MGD plant operating at a 90 percent capacity factor producing about 50,000 AFY would require about 33 megawatts of power. This would result in about 5,782 kilowatt‐hours per acre‐foot.76
• The Municipal Water District of Orange County (MWDOC) projects that the energy
intensity of water produced by its planned Dana Point Ocean Desalination Project will be about 3,800 kWh/AF for both the desalination process and the energy needed to distribute the water to customers.77
For planning purposes, we suggest using a conservative estimate of 4,000 kWh/AF of desalinated water inclusive of any incremental distribution energy needed to deliver desalinated seawater to end users. The energy value of the recycled water decision, then, would be computed as the amount of energy avoided by displacing desalinated seawater with recycled water. Given the consistency of energy intensity estimates observed for IEUA and the Cities of Los Angeles and San Diego78, we suggest using a proxy of 600 kWh/AF for recycled water. This estimate is based on the weighted average experience of IEUA and the Cities of Los Angeles and San Diego, and includes (1) incremental energy needed to treat secondary water to tertiary standards, and (2) an allowance for incremental distribution energy. Under these conservative assumptions, the energy value of increasing and accelerating recycled water in southern California is about 3,400 kWh/AF.
76 Desalination, with a Grain of Salt, A California Perspective”, Pacific Institute, June 2006, p.6‐5. 77 “Dana Point Ocean Desalination Project, Project Update”, Municipal Water District of Orange County, May 2007, www.mwdoc.com/documents/FeasibilityStudySummary.ppt, viewed April 25, 2008. 78 See Table 4‐14 Statewide Perspective.
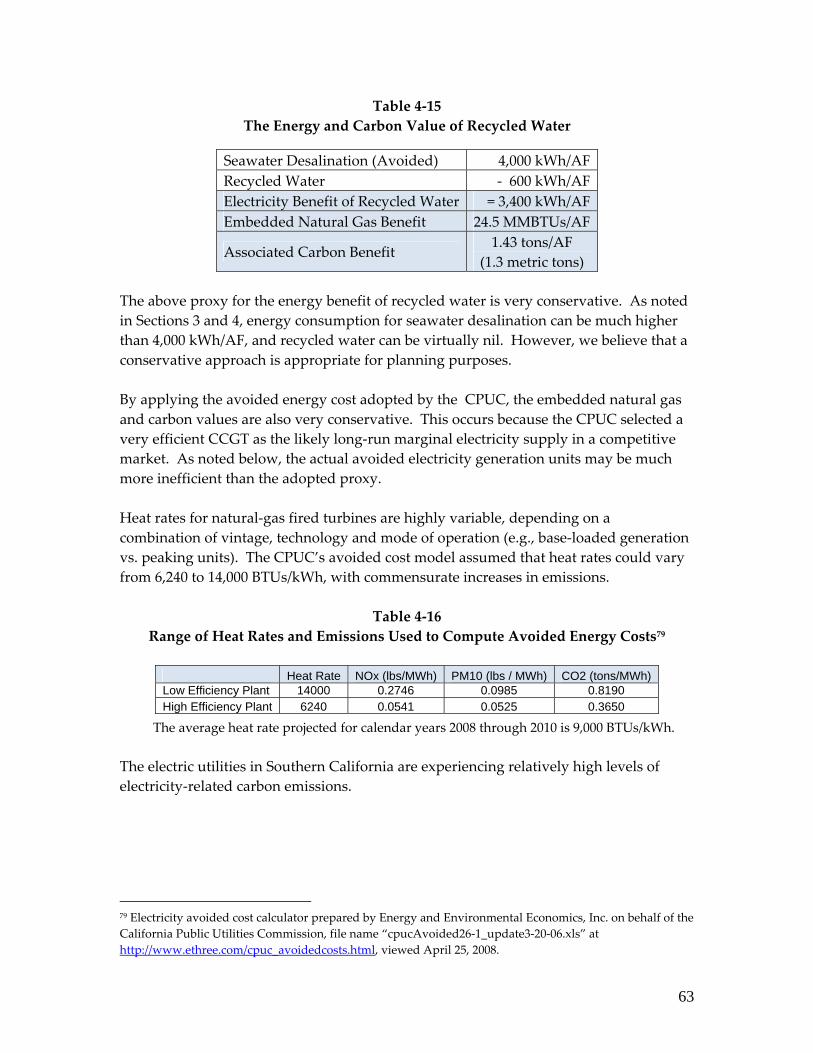
63
Table 4‐15 The Energy and Carbon Value of Recycled Water
Seawater Desalination (Avoided) 4,000 kWh/AF Recycled Water ‐ 600 kWh/AF Electricity Benefit of Recycled Water = 3,400 kWh/AF Embedded Natural Gas Benefit 24.5 MMBTUs/AF
Associated Carbon Benefit 1.43 tons/AF
(1.3 metric tons) The above proxy for the energy benefit of recycled water is very conservative. As noted in Sections 3 and 4, energy consumption for seawater desalination can be much higher than 4,000 kWh/AF, and recycled water can be virtually nil. However, we believe that a conservative approach is appropriate for planning purposes. By applying the avoided energy cost adopted by the CPUC, the embedded natural gas and carbon values are also very conservative. This occurs because the CPUC selected a very efficient CCGT as the likely long‐run marginal electricity supply in a competitive market. As noted below, the actual avoided electricity generation units may be much more inefficient than the adopted proxy. Heat rates for natural‐gas fired turbines are highly variable, depending on a combination of vintage, technology and mode of operation (e.g., base‐loaded generation vs. peaking units). The CPUC’s avoided cost model assumed that heat rates could vary from 6,240 to 14,000 BTUs/kWh, with commensurate increases in emissions.
Table 4‐16 Range of Heat Rates and Emissions Used to Compute Avoided Energy Costs79
Heat Rate NOx (lbs/MWh) PM10 (lbs / MWh) CO2 (tons/MWh) Low Efficiency Plant 14000 0.2746 0.0985 0.8190 High Efficiency Plant 6240 0.0541 0.0525 0.3650
The average heat rate projected for calendar years 2008 through 2010 is 9,000 BTUs/kWh. The electric utilities in Southern California are experiencing relatively high levels of electricity‐related carbon emissions.
79 Electricity avoided cost calculator prepared by Energy and Environmental Economics, Inc. on behalf of the California Public Utilities Commission, file name “cpucAvoided26‐1_update3‐20‐06.xls” at http://www.ethree.com/cpuc_avoidedcosts.html, viewed April 25, 2008.
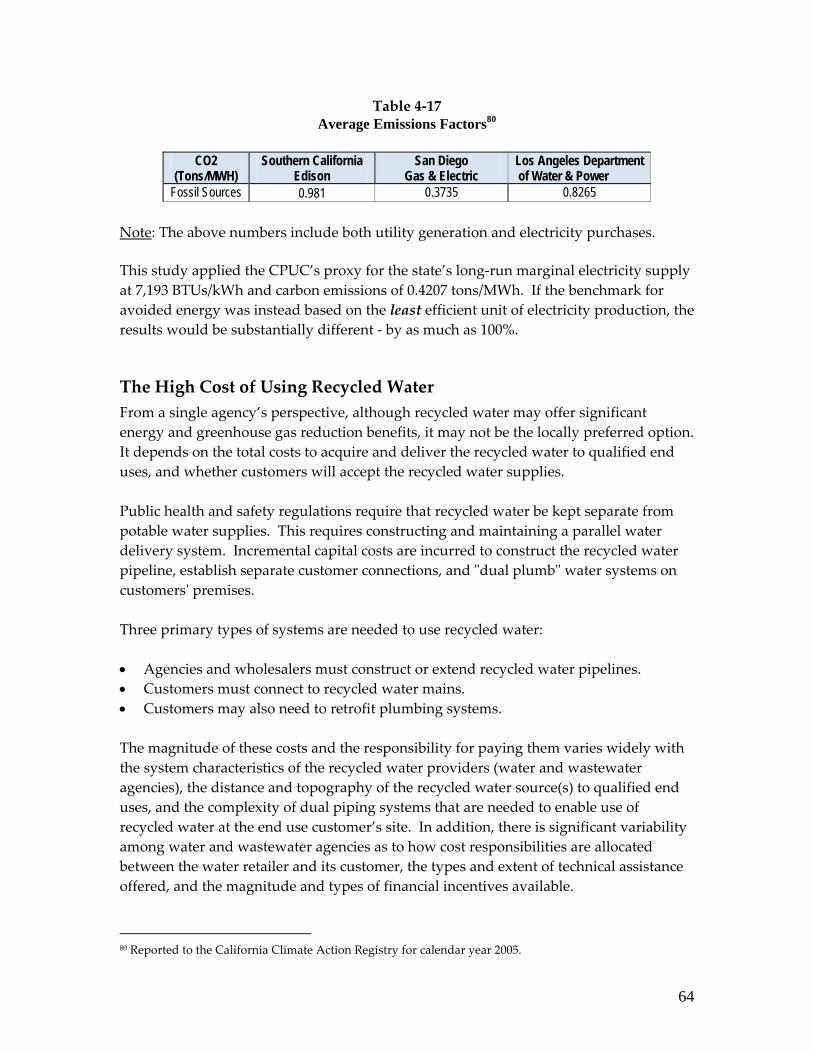
64
Table 4‐17 Average Emissions Factors80
CO2
(Tons/MWH) Southern California
Edison San Diego
Gas & Electric Los Angeles Department of Water & Power
Fossil Sources 0.981 0.3735 0.8265 Note: The above numbers include both utility generation and electricity purchases. This study applied the CPUC’s proxy for the state’s long‐run marginal electricity supply at 7,193 BTUs/kWh and carbon emissions of 0.4207 tons/MWh. If the benchmark for avoided energy was instead based on the least efficient unit of electricity production, the results would be substantially different ‐ by as much as 100%.
The High Cost of Using Recycled Water From a single agency’s perspective, although recycled water may offer significant energy and greenhouse gas reduction benefits, it may not be the locally preferred option. It depends on the total costs to acquire and deliver the recycled water to qualified end uses, and whether customers will accept the recycled water supplies. Public health and safety regulations require that recycled water be kept separate from potable water supplies. This requires constructing and maintaining a parallel water delivery system. Incremental capital costs are incurred to construct the recycled water pipeline, establish separate customer connections, and ʺdual plumbʺ water systems on customersʹ premises.
Three primary types of systems are needed to use recycled water: • Agencies and wholesalers must construct or extend recycled water pipelines. • Customers must connect to recycled water mains. • Customers may also need to retrofit plumbing systems. The magnitude of these costs and the responsibility for paying them varies widely with the system characteristics of the recycled water providers (water and wastewater agencies), the distance and topography of the recycled water source(s) to qualified end uses, and the complexity of dual piping systems that are needed to enable use of recycled water at the end use customer’s site. In addition, there is significant variability among water and wastewater agencies as to how cost responsibilities are allocated between the water retailer and its customer, the types and extent of technical assistance offered, and the magnitude and types of financial incentives available.
80 Reported to the California Climate Action Registry for calendar year 2005.
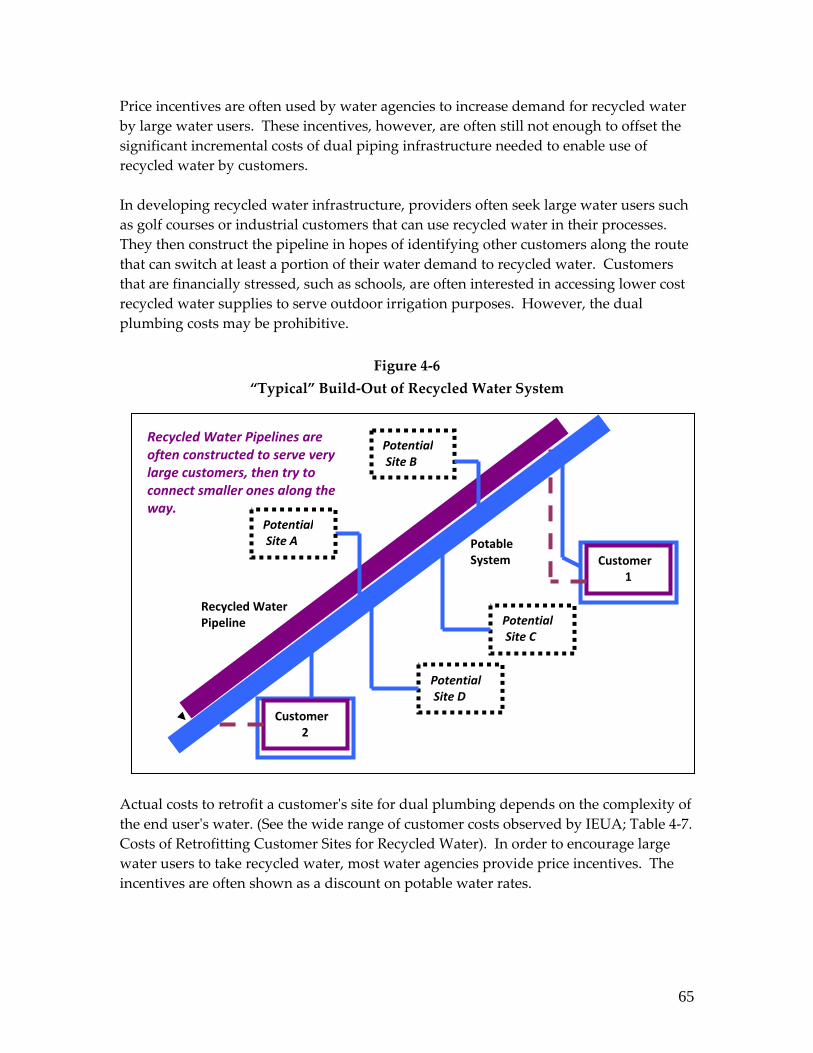
65
Price incentives are often used by water agencies to increase demand for recycled water by large water users. These incentives, however, are often still not enough to offset the significant incremental costs of dual piping infrastructure needed to enable use of recycled water by customers. In developing recycled water infrastructure, providers often seek large water users such as golf courses or industrial customers that can use recycled water in their processes. They then construct the pipeline in hopes of identifying other customers along the route that can switch at least a portion of their water demand to recycled water. Customers that are financially stressed, such as schools, are often interested in accessing lower cost recycled water supplies to serve outdoor irrigation purposes. However, the dual plumbing costs may be prohibitive.
Figure 4‐6
“Typical” Build‐Out of Recycled Water System
Actual costs to retrofit a customerʹs site for dual plumbing depends on the complexity of the end userʹs water. (See the wide range of customer costs observed by IEUA; Table 4‐7. Costs of Retrofitting Customer Sites for Recycled Water). In order to encourage large water users to take recycled water, most water agencies provide price incentives. The incentives are often shown as a discount on potable water rates.
Recycled Water Pipeline
Customer 1
Customer2
Potable System
Potential Site D
Potential Site C
Potential Site B
Recycled Water Pipelines are often constructed to serve very large customers, then try to connect smaller ones along the way.
Potential Site A
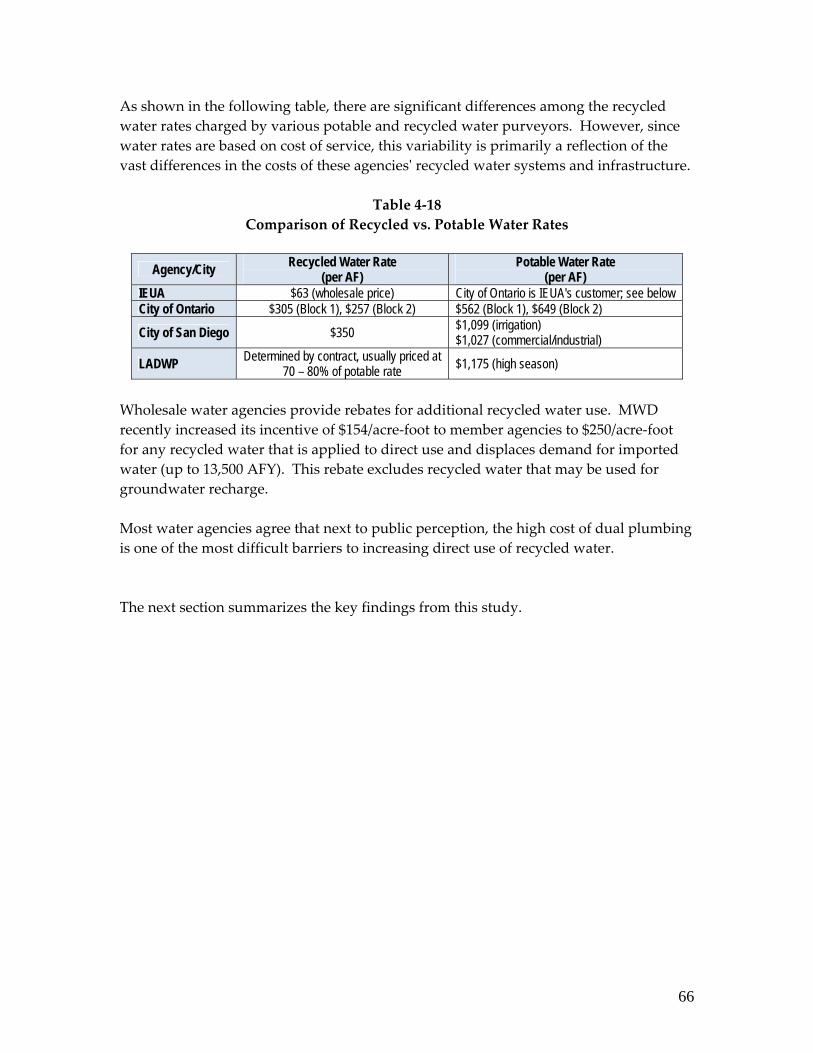
66
As shown in the following table, there are significant differences among the recycled water rates charged by various potable and recycled water purveyors. However, since water rates are based on cost of service, this variability is primarily a reflection of the vast differences in the costs of these agenciesʹ recycled water systems and infrastructure.
Table 4‐18 Comparison of Recycled vs. Potable Water Rates
Agency/City Recycled Water Rate (per AF)
Potable Water Rate (per AF)
IEUA $63 (wholesale price) City of Ontario is IEUA's customer; see below City of Ontario $305 (Block 1), $257 (Block 2) $562 (Block 1), $649 (Block 2)
City of San Diego $350 $1,099 (irrigation) $1,027 (commercial/industrial)
LADWP Determined by contract, usually priced at 70 – 80% of potable rate $1,175 (high season)
Wholesale water agencies provide rebates for additional recycled water use. MWD recently increased its incentive of $154/acre‐foot to member agencies to $250/acre‐foot for any recycled water that is applied to direct use and displaces demand for imported water (up to 13,500 AFY). This rebate excludes recycled water that may be used for groundwater recharge. Most water agencies agree that next to public perception, the high cost of dual plumbing is one of the most difficult barriers to increasing direct use of recycled water. The next section summarizes the key findings from this study.
67
SECTION 5 – SUMMARY OF FINDINGS Southern California water managers are presently facing reductions in historical water supplies of as much as 1,000,000 AFY. The western U.S. is concurrently recovering from an eight year drought that resulted in drawing down dry year reserves. Lake Mead and other important sources of water will require many years of above‐normal precipitation to refill. Short‐term strategies being deployed now include increasing investments in water conservation and efficiency, water recycling and groundwater recovery. In addition, water agencies are engaging in transactions to transfer short‐term water supplies to meet supply shortfalls. Seawater desalination is increasing in importance in Southern California as a long‐term viable and drought‐proof resource. Unfortunately, seawater desalination is also presently a high energy intensity resource. Many end uses do not require water to be potable; yet, in the U.S., we routinely pour drinking water on our lawns and landscaped industrial parks, use it in cooling towers, and use it to drive industrial processes. During summer months – Californiaʹs peak energy season – more than 50 percent of Southern Californiaʹs potable water supplies are used for landscape irrigation. Significant portions of that water are imported to the region for that purpose. The transport and treatment of water require significant quantities of energy. Recycled water is an important source of water supply. Since it is produced through the process of wastewater treatment, it tends to grow fairly proportionally with urban water demand. A rough rule‐of thumb is that about 50 percent of urban water use could be recaptured and used as recycled water. Applying recycled water to approved non‐potable uses would enable saving limited potable water supplies for potable purposes. The purpose of this study was to characterize and assess the role of recycled water in California’s energy efficiency and greenhouse gas reduction. The recycled water opportunities for four water agencies in water, energy and carbon‐stressed Southern California ‐ Inland Empire Utilities Agency and the Cities of Ontario, San Diego and Los Angeles – were reviewed. The agencies’ 2005 Urban Water Management Plans were relied upon to establish “baseline”. We then evaluated the amount of additional recycled water that could be produced and used if these agencies’ recycled water development plans could be accelerated by 5 years. The potential energy and carbon benefits that could be achieved were estimated by applying the avoided energy cost assumptions and values that were used by the CPUC to evaluate the cost‐effectiveness of its 2006‐2008 energy efficiency programs.

68
Following is a summary of the key findings from this study. 1. Significant volumes of recycled water are available. Four water agencies (Inland
Empire Utilities Agency and the Cities of Ontario, San Diego, and Los Angeles) collectively discharge about 580,000 AFY of recycled water to natural waterways (creeks, rivers and the ocean) or into primary wastewater effluent streams in Southern California that is not needed for environmental purposes. This highly reliable local source of water (available, but not presently being applied to end uses) could be applied to qualified non‐potable uses today, reserving potable water supplies to serve potable demand.
If only tertiary effluent is considered, the agencies could beneficially employ an additional 90,000 AFY of recycled water. The potential is much higher – an additional 325,000 AFY – when secondary effluent from Los Angelesʹ Hyperion Plant is considered. Advanced primary effluent81 from Point Loma, San Diego could contribute an additional 165,000 AFY. Recycled water from these four agencies alone could thus supply about 12% of Southern California’s water supply requirements, offsetting requirements for incremental new water supplies. Given the urgency of Southern California’s water supply challenges, recycled water is a significant resource that should be developed and used wherever cost‐effective and practicable. Seasonal availability may limit its utility in meeting month‐to‐month demand; but the magnitude of the recycled water potential is significant.
2. Recycled water is a relatively low energy intensity resource. Recycled water is
produced through the process of treating wastewater. The amount of energy needed to treat wastewater to levels required by regulators for safe discharge would be used whether or not the treated wastewater is reused. Tertiary wastewater can be applied to many non‐potable purposes with little or no further treatment. Therefore, the energy intensity of tertiary recycled water is limited to the incremental energy needed to deliver the recycled water to qualified end uses. Secondary wastewater effluent often requires treatment to tertiary standards or higher before being applied to direct uses. However, even with additional treatment, the total amount of energy needed to develop and use recycled water in Southern California is usually significantly less than most other water resources.
81 California regulations do not permit reuse or discharge of primary treated wastewater. Waivers are granted on a case‐by‐case basis. In most cases, advanced water treatment is needed to reuse primary treated wastewater.

69
0
1000
2000
3000
4000
5000
6000
7000
kWh/
acre
-foo
t
Figure 5-1Relative Energy Intensity of Water Resourcesfor Four Southern California Water Agencies
DistributionTreatmentConveyance
Note: Estimates of distribution energy were not available for all of the above water resources. 3. The stateʹs long run marginal water supply establishes a benchmark (i.e., “proxy”)
for evaluating the energy and carbon cost‐effectiveness of water resource and infrastructure decisions. Under a circumstance of long‐term growth in which demand is expected to exceed available supplies, the appropriate benchmark for “avoided cost” is the long‐run marginal resource that will need to be constructed or procured to meet future load growth. California’s energy sector adopted a very efficient CCGT as the stateʹs long run marginal cost of energy. The CCGT proxy is deemed to represent the next new unit of electricity production that will need to be constructed anywhere in the grid‐connected western U.S. that may be used to meet growth in California’s electric demand. California uses the avoided cost of its long run marginal cost of energy as the basis for determining the cost‐effectiveness of its energy efficiency, renewable energy, and other energy resources and programs.
Similarly, California presently projects that water demand will exceed available supplies for the foreseeable future. California’s long run marginal water supply is likely seawater desalination, a comparatively high energy and carbon intensity water resource.
70
4. The long run marginal supply may be different when viewed from a single agency vs. statewide perspective. Although many water agencies in Southern California consider their marginal water supply to be imports from the State Water Project and/or the Colorado River (single agency perspective), these water supplies do not define the statewide marginal supply. The California and Colorado River Aqueducts are very important water delivery systems. Although deliveries may be reduced from the Delta, water agencies in northern and central California are using the delivery capacity to transfer other water supplies to southern California. Consequently, there may be little or no change in the energy intensity of water supply imports in Southern California for the foreseeable future.
5. Seawater desalination is increasingly being viewed as an essential element of
California’s diversified water supply portfolio. Since the ocean is a virtually unlimited resource, seawater desalination is viewed as a very important way to increase water supply reliably and mitigate drought risk. Seawater desalination may therefore play a very important role in California’s long term water security. However, despite significant efficiency improvements over the past 20 years, seawater desalination is also still a relatively high energy intensity technology.
6. Seawater desalination has a tendency to move from “marginal supply” to “base‐
load”. Because seawater desalination is most efficiently operated as a base‐loaded resource, high energy intensity desalinated seawater will likely displace other base‐loaded resources, shifting present base‐loaded resources to peak or other intermittent supply roles. To the extent that the energy intensity of desalinated seawater included in base load may be higher than the resources being displaced, the average energy intensity of the stateʹs water supply portfolio will increase.
7. The difference between the energy intensity of recycled water and seawater
desalination provides a rational basis for evaluating the energy and carbon benefits of recycled water. The value of increasing the amount of recycled water in the stateʹs water supply portfolio is equivalent to the difference between the energy intensity of recycled water and the energy intensity of the long run marginal water supply(s) it would likely displace. The actual energy intensity of these and other types of water supply options vary with the unique characteristics of each agency’s service area, water system and resource characteristics, topography, geology, hydrology, climate and infrastructure. On a statewide basis, however, “typical” experiences can be relied upon to create a proxy for evaluating the energy and carbon impacts of water resource and infrastructure decisions. Consistent with state energy policy, the energy and associated carbon benefits attributable to increasing recycled water can be measured as the difference between the energy intensity of recycled water and the state’s long run marginal supply, seawater desalination. Based on the range of energy intensity estimates developed for four water agencies studied and a review of
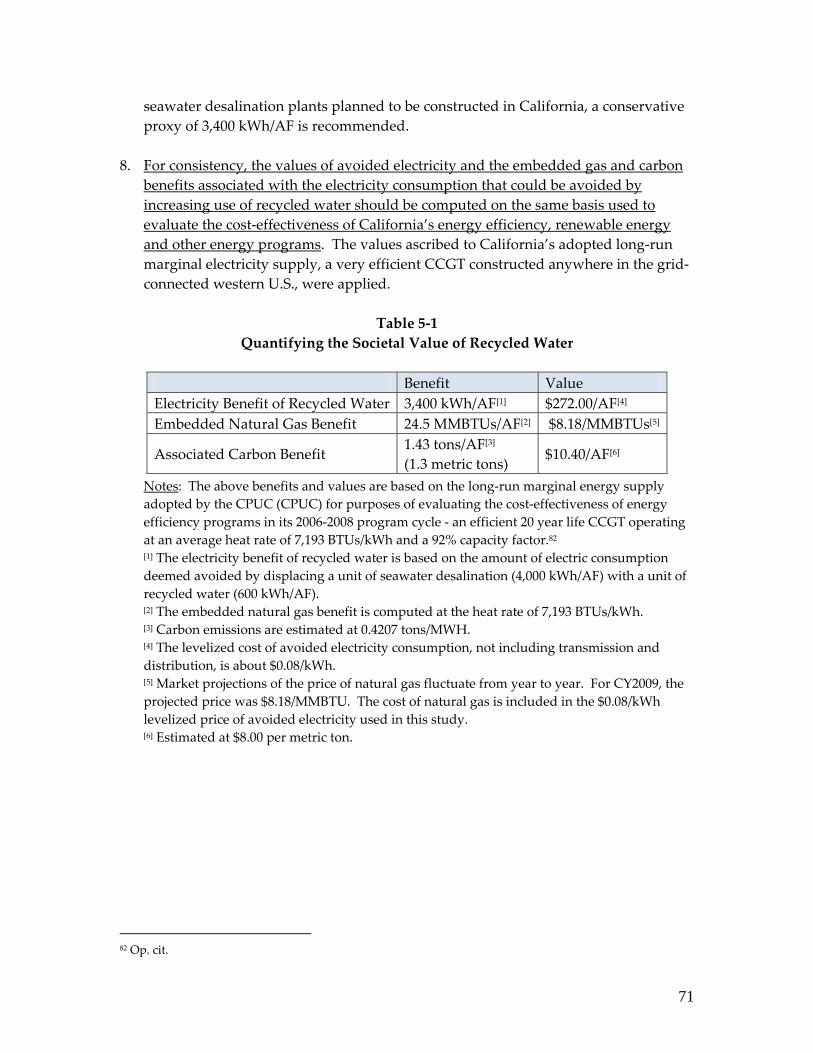
71
seawater desalination plants planned to be constructed in California, a conservative proxy of 3,400 kWh/AF is recommended.
8. For consistency, the values of avoided electricity and the embedded gas and carbon
benefits associated with the electricity consumption that could be avoided by increasing use of recycled water should be computed on the same basis used to evaluate the cost‐effectiveness of California’s energy efficiency, renewable energy and other energy programs. The values ascribed to California’s adopted long‐run marginal electricity supply, a very efficient CCGT constructed anywhere in the grid‐connected western U.S., were applied.
Table 5‐1
Quantifying the Societal Value of Recycled Water
Benefit Value Electricity Benefit of Recycled Water 3,400 kWh/AF[1] $272.00/AF[4] Embedded Natural Gas Benefit 24.5 MMBTUs/AF[2] $8.18/MMBTUs[5]
Associated Carbon Benefit 1.43 tons/AF[3] (1.3 metric tons)
$10.40/AF[6]
Notes: The above benefits and values are based on the long‐run marginal energy supply adopted by the CPUC (CPUC) for purposes of evaluating the cost‐effectiveness of energy efficiency programs in its 2006‐2008 program cycle ‐ an efficient 20 year life CCGT operating at an average heat rate of 7,193 BTUs/kWh and a 92% capacity factor.82 [1] The electricity benefit of recycled water is based on the amount of electric consumption deemed avoided by displacing a unit of seawater desalination (4,000 kWh/AF) with a unit of recycled water (600 kWh/AF). [2] The embedded natural gas benefit is computed at the heat rate of 7,193 BTUs/kWh. [3] Carbon emissions are estimated at 0.4207 tons/MWH. [4] The levelized cost of avoided electricity consumption, not including transmission and distribution, is about $0.08/kWh. [5] Market projections of the price of natural gas fluctuate from year to year. For CY2009, the projected price was $8.18/MMBTU. The cost of natural gas is included in the $0.08/kWh levelized price of avoided electricity used in this study. [6] Estimated at $8.00 per metric ton.
82 Op. cit.
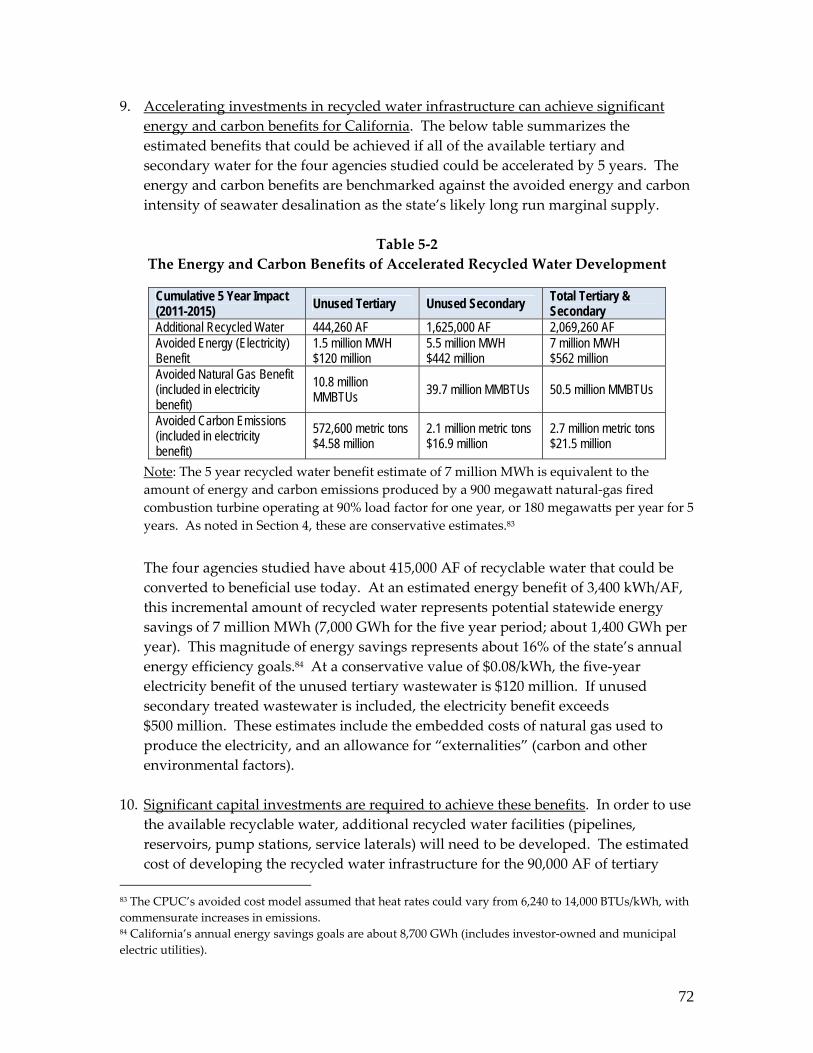
72
9. Accelerating investments in recycled water infrastructure can achieve significant energy and carbon benefits for California. The below table summarizes the estimated benefits that could be achieved if all of the available tertiary and secondary water for the four agencies studied could be accelerated by 5 years. The energy and carbon benefits are benchmarked against the avoided energy and carbon intensity of seawater desalination as the state’s likely long run marginal supply.
Table 5‐2
The Energy and Carbon Benefits of Accelerated Recycled Water Development
Cumulative 5 Year Impact (2011-2015) Unused Tertiary Unused Secondary Total Tertiary &
Secondary Additional Recycled Water 444,260 AF 1,625,000 AF 2,069,260 AF Avoided Energy (Electricity) Benefit
1.5 million MWH $120 million
5.5 million MWH $442 million
7 million MWH $562 million
Avoided Natural Gas Benefit (included in electricity benefit)
10.8 million MMBTUs 39.7 million MMBTUs 50.5 million MMBTUs
Avoided Carbon Emissions (included in electricity benefit)
572,600 metric tons $4.58 million
2.1 million metric tons $16.9 million
2.7 million metric tons $21.5 million
Note: The 5 year recycled water benefit estimate of 7 million MWh is equivalent to the amount of energy and carbon emissions produced by a 900 megawatt natural‐gas fired combustion turbine operating at 90% load factor for one year, or 180 megawatts per year for 5 years. As noted in Section 4, these are conservative estimates.83 The four agencies studied have about 415,000 AF of recyclable water that could be converted to beneficial use today. At an estimated energy benefit of 3,400 kWh/AF, this incremental amount of recycled water represents potential statewide energy savings of 7 million MWh (7,000 GWh for the five year period; about 1,400 GWh per year). This magnitude of energy savings represents about 16% of the state’s annual energy efficiency goals.84 At a conservative value of $0.08/kWh, the five‐year electricity benefit of the unused tertiary wastewater is $120 million. If unused secondary treated wastewater is included, the electricity benefit exceeds $500 million. These estimates include the embedded costs of natural gas used to produce the electricity, and an allowance for “externalities” (carbon and other environmental factors).
10. Significant capital investments are required to achieve these benefits. In order to use
the available recyclable water, additional recycled water facilities (pipelines, reservoirs, pump stations, service laterals) will need to be developed. The estimated cost of developing the recycled water infrastructure for the 90,000 AF of tertiary
83 The CPUC’s avoided cost model assumed that heat rates could vary from 6,240 to 14,000 BTUs/kWh, with commensurate increases in emissions. 84 California’s annual energy savings goals are about 8,700 GWh (includes investor‐owned and municipal electric utilities).
73
water alone is expected to exceed $500 million. This estimate does not include the high costs of retrofitting customersʹ sites with dual plumbing to enable use of recycled water, a significant barrier to increasing use of recycled water.
11. The primary barriers to accelerating and increasing development and use of recycled
water are public perception and high costs of dual‐plumbing. More education is needed to inform the public about water quality and public health issues, and the important role of recycled water in the state’s long term water supply reliability. However, even when customers are willing to use recycled water, the high costs of dual plumbing their sites – a requirement for using recycled water – is often prohibitive. In particular, mature public facilities such as schools are often unable to afford the expensive plumbing retrofits.
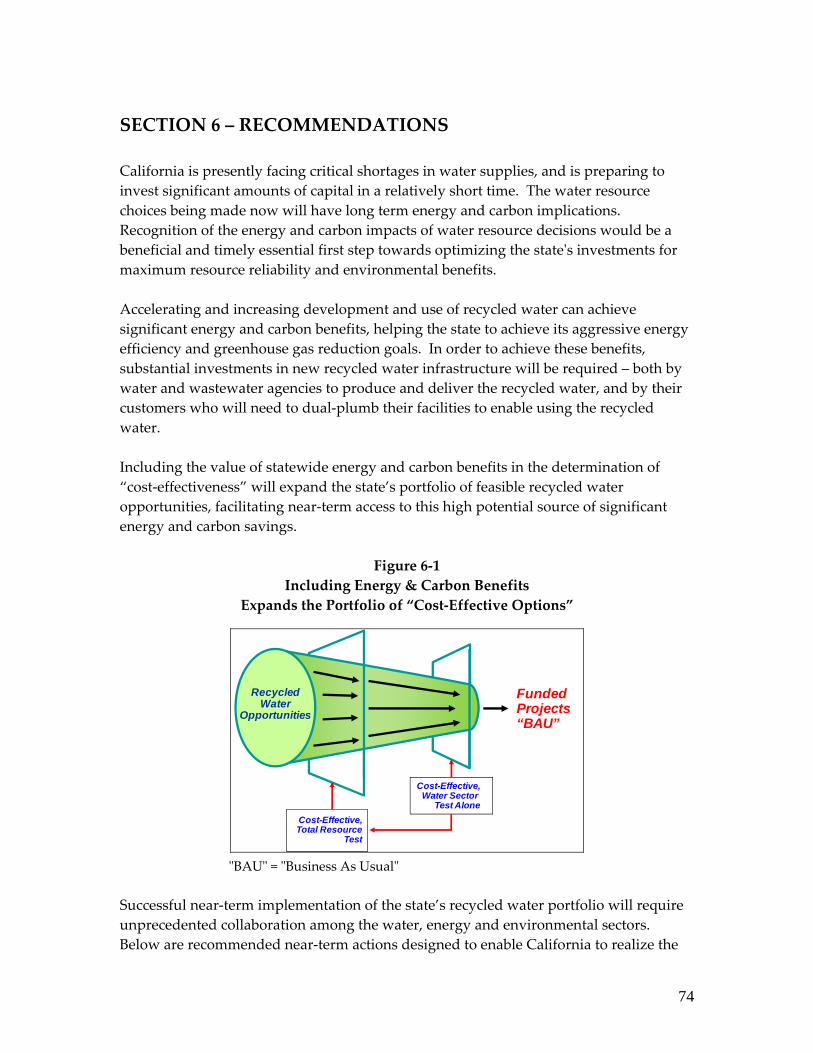
74
SECTION 6 – RECOMMENDATIONS California is presently facing critical shortages in water supplies, and is preparing to invest significant amounts of capital in a relatively short time. The water resource choices being made now will have long term energy and carbon implications. Recognition of the energy and carbon impacts of water resource decisions would be a beneficial and timely essential first step towards optimizing the stateʹs investments for maximum resource reliability and environmental benefits. Accelerating and increasing development and use of recycled water can achieve significant energy and carbon benefits, helping the state to achieve its aggressive energy efficiency and greenhouse gas reduction goals. In order to achieve these benefits, substantial investments in new recycled water infrastructure will be required – both by water and wastewater agencies to produce and deliver the recycled water, and by their customers who will need to dual‐plumb their facilities to enable using the recycled water. Including the value of statewide energy and carbon benefits in the determination of “cost‐effectiveness” will expand the state’s portfolio of feasible recycled water opportunities, facilitating near‐term access to this high potential source of significant energy and carbon savings.
Figure 6‐1
Including Energy & Carbon Benefits Expands the Portfolio of “Cost‐Effective Options”
Funded Projects“BAU”
Cost-Effective,Water Sector
Test AloneCost-Effective,Total Resource
Test
Recycled Water
Opportunities
ʺBAUʺ = ʺBusiness As Usualʺ Successful near‐term implementation of the state’s recycled water portfolio will require unprecedented collaboration among the water, energy and environmental sectors. Below are recommended near‐term actions designed to enable California to realize the

75
energy and carbon benefits of currently available recyclable water over the next 3‐5 years.
Recommendation Adopt an interim proxy for the energy & carbon benefits of recycled water to minimize lost opportunities while detailed studies are conducted in parallel to refine the methodology and the estimates
Every AF of recycled water discharged to the ocean or other natural waterway that could have offset use of potable water represents a significant lost opportunity for California. • The value of energy and carbon benefits of recycled water
should be measured on a basis equivalent with other energy efficiency programs in California.
• A conservative value of 3,400 kWh/AF and 1.43 CO2 tons/AF could be used for this purpose.
• The avoided cost of energy, assuming a levelized price of $0.08/kWh, is $272/AF.
Develop a “California Recycled Water Blueprint” that prioritizes investments in recycled water projects statewide to maximize near-term energy and carbon savings
• This study focused on 4 water agencies in water, energy and carbon-stressed Southern California. Additional work should be conducted to assess the statewide recycled water potential by region to enable effective allocation of the state’s investments in water resources and infrastructure.
• A comprehensive ranked inventory of recycled water programs and projects would help to identify high priority recycled water projects that could (a) beneficially utilize a significant portion of tertiary &/or secondary wastewater that is presently being discharged without being applied to beneficial uses, and (b) be constructed within the next 3-5 years.
• Criteria for ranking opportunities should include “best fit” within regional water supply portfolios, and Total (statewide) Resource Costs/Benefits (i.e., including energy, water, carbon & other environmental impacts).
• An action-oriented “California Recycled Water Blueprint” should identify high priority projects, the key stakeholders needed to effectively implement them, and financing and development options.
Convene a cross-cutting policy leadership group to develop & expedite remedies to significant recycled water barriers
Increased use of recycled water affects all sectors, and all sectors should be involved in helping to access its energy and carbon benefits. Below are examples of activities that would significantly benefit from policy level participation. • Establish statewide planning and building codes and
ordinances mandating dual plumbing in all new development. (It is much more costly to retrofit existing facilities than to install dual plumbing in new construction.)
• Require recycled water for irrigating all golf courses, parks, industrial complexes and large campuses.
• Increase public education about the benefits of recycled water and its important role in the long term water security of the state, including environmental education programs targeting grades K-12.
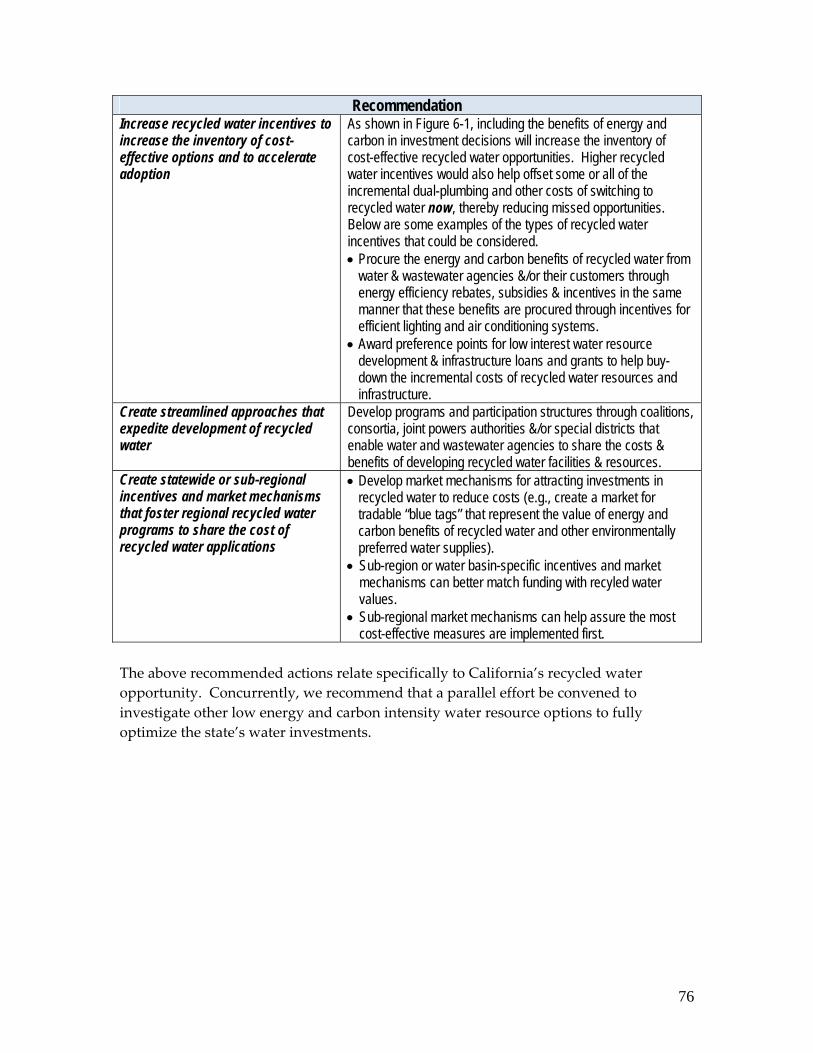
76
Recommendation Increase recycled water incentives to increase the inventory of cost-effective options and to accelerate adoption
As shown in Figure 6-1, including the benefits of energy and carbon in investment decisions will increase the inventory of cost-effective recycled water opportunities. Higher recycled water incentives would also help offset some or all of the incremental dual-plumbing and other costs of switching to recycled water now, thereby reducing missed opportunities. Below are some examples of the types of recycled water incentives that could be considered. • Procure the energy and carbon benefits of recycled water from
water & wastewater agencies &/or their customers through energy efficiency rebates, subsidies & incentives in the same manner that these benefits are procured through incentives for efficient lighting and air conditioning systems.
• Award preference points for low interest water resource development & infrastructure loans and grants to help buy-down the incremental costs of recycled water resources and infrastructure.
Create streamlined approaches that expedite development of recycled water
Develop programs and participation structures through coalitions, consortia, joint powers authorities &/or special districts that enable water and wastewater agencies to share the costs & benefits of developing recycled water facilities & resources.
Create statewide or sub-regional incentives and market mechanisms that foster regional recycled water programs to share the cost of recycled water applications
• Develop market mechanisms for attracting investments in recycled water to reduce costs (e.g., create a market for tradable “blue tags” that represent the value of energy and carbon benefits of recycled water and other environmentally preferred water supplies).
• Sub-region or water basin-specific incentives and market mechanisms can better match funding with recyled water values.
• Sub-regional market mechanisms can help assure the most cost-effective measures are implemented first.
The above recommended actions relate specifically to California’s recycled water opportunity. Concurrently, we recommend that a parallel effort be convened to investigate other low energy and carbon intensity water resource options to fully optimize the state’s water investments.