the role of self-efficacy in employee commitment · 2017-03-10 · declaration student number:...
TRANSCRIPT

THE ROLE OF SELF-EFFICACY IN EMPLOYEE COMMITMENT
by
NELIA HURTER
submitted in part fulfillment of the requirements
for the degree of
MASTER OF COMMERCE
In the subject
INDUSTRIAL PSYCHOLOGY
at the
UNIVERSITY OF SOUTH AFRICA
SUPERVISOR: PROF JPR JOUBERT
JOINT SUPERVISOR: PROF M DE BEER
JULY 2008

ii
ACKNOWLEDGEMENTS
My sincere gratitude is expressed to the following individuals for their support and
assistance in making the completion of this dissertation a reality:
• Professor Pierre Joubert my research supervisor, for this guidance, advice,
motivation, input, patience and encouragement.
• Lourette Weyers and Lizana Stark editorial specialists, for their assistance with
the technical and language editing.
• Charmaine Boshoff, my manager, for her support and guidance.
• Reshigan Govender and the Information Technology team, for enabling the
collection of research data
• My family, (Tobie, Bets and Lené) for their encouragement, motivation and
endless support throughout this research.
• My Lord and Saviour, without Him none of this would be possible.

DECLARATION
Student number: 3200-075-8
I declare that THE ROLE OF SELF-EFFICACY IN EMPLOYEE COMMITMENT is
my own work and that all the sources that I have used or quoted have been
indicated and acknowledged by means of complete references.
.................................................... ...................................................
SIGNATURE DATE (MS N HURTER)

iv
TABLE OF CONTENTS Page no.
ACKNOWLEDGEMENTS ii
DECLARATION iii
LIST OF TABLES vii
LIST OF FIGURES viii
SUMMARY x
CHAPTER 1: SCIENTIFIC OVERVIEW OF THE RESEARCH 1
1.1 INTRODUCTION 1
1.2 BACKGROUND AND MOTIVATION FOR THE RESEARCH 1
1.3 PROBLEM STATEMENT 4
1.4 AIMS OF THE RESEARCH 6
1.4.1 Specific Aims 6
1.5 PARADIGM RESPECTIVE 7
1.6 RELEVANT PSYCHOLOGICAL PARADIGMS 7
1.7 RESEARCH DESIGN 10
1.8 RESEARCH METHOD 10
1.8.1 Phase One: Literature Review 10
1.8.2. Phase Two: Empirical Study 10
1.9 CHAPTER DIVISION 12
1.10 CHAPTER SUMMARY 13
CHAPTER 2: EMPLOYEE COMMITMENT 14
2.1 INTRODUCTION 14
2.2 HISTORY OF COMMITMENT 15
2.3 CONVERSION MODEL 17
2.4 DEFINITION OF WORK AND COMPANY COMMITMENT 19
2.5 PROFESSIONAL COMMITMENT 21
2.6 CHAPTER SUMMARY 22
CHAPTER 3: SELF-EFFICACY 23
3.1 INTRODUCTION 23
3.2 SELF-EFFICACY AND OTHER TYPES OF SELF-BELIEFS 24
3.2.1 Expectancy Related Construct 24
3.2.1.1 Self-Concept 24
3.2.1.2 Self Esteem 24

v
3.2.1.3 Outcome Expectations 25
3.2.1.4 Perceived Control 25
3.3 SPECIFIC AND GENERAL SELF-EFFICACY 25
3.4 SOURCES OF SELF-EFFICACY 27
3.4.1 Mastery Experience 27
3.4.2 Vicarious Experiences 27
3.4.3 Social Persuasion 28
3.4.4 Physical/ Affective Status 28
3.5 SELF-EFFICACY AND PERFORMANCE 29
3.6 RELATION OF SELF-EFFICACY TO MOTIVATION 29
3.7 CHAPTER SUMMARY 30
CHAPTER 4: EMPIRICAL STUDY 31
4.1 THE POPULATION AND SAMPLE 31
4.2 THE MEASURING INSTRUMENTS 31
4.2.1 Conversion Model Employee Commitment 32
4.2.1.1 Administration 34
4.2.1.2 Interpretation 34
4.2.1.3 Reliability 35
4.2.1.4 Validity 35
4.2.1.5 Justification for inclusion 36
4.2.2 The General Self-Efficacy Scale (GSE) 36
4.2.2.1 Administration 37
4.2.2.2 Interpretation 37
4.2.2.3 Reliability 37
4.2.2.4 Validity 38
4.2.2.5 Justification for inclusion 38
4.2.3 Demographic Section 39
4.3 DATA COLLECTION 39
4.4 DATA PROCESSING 39
4.4.1 Descriptive Statistics 39
4.4.2 Reliability of Instruments 40
4.4.3 Discriminant Analysis 40
4.4.4 Regression Analysis 40
4.4.5 Statistical test of difference 41

vi
4.5 CHAPTER SUMMARY 42
CHAPTER 5: RESULTS OF THE EMPIRICAL STUDY 43
5.1 DESCRIPTIVE STATISTICS OF MEASUREMENT 43
5.1.1 Demographic Variables 43
5.1.2 Descriptive statistics of Commitment Model measuring instrument 48
5.1.3 Descriptive statistics of Self-Efficacy measuring instrument 59
5.2 RELIABILITY OF SELF-EFFICACY SCALE 62
5.2.1 Analysis of Conversion Model segment by Self-Efficacy score 63
5.2.1.1 Box and Whiskers analysis of CM segment on Self-Efficacy by
Demographics 67
5.2.2 ANOVA one way analysis 76
5.3 DISCRIMINANT ANALYSIS 78
5.3.1 Stepwise Discriminant Analysis 80
5.4 CHAPTER SUMMARY 80
CHAPTER 6: CONCLUSIONS, LIMITATIONS AND
RECOMMENDATIONS 81
6.1 INTRODUCTION 81
6.2 CONCLUSIONS 81
6.2.1 Literature Review 81
6.2.2 Empirical Study 83
6.3 LIMITATIONS OF THE RESEARCH 84
6.4 RECOMMENDATIONS 85
6.5 CHAPTER SUMMARY 87
REFERENCES 88
APPENDIX 1 EMPLOYEE COMMITMENT QUESTIONNAIRE 103
APPENDIX 2 CROSS TABS BY DEMOGRAPHICS 110
APPENDIX 3 STEPWISE ANALYSIS 148

vii
LIST OF TABLES
PAGE
Table 1. Frequency Analysis of Biographical
variables
44
Table 2. CM Employee Commitment 48
Table 3. The General Self-Efficacy Scale (GSE) 60/61
Table 4. Self-Efficacy quartiles per commitment
segment
64
Table 5. Self-Efficacy differences between
Conversion Model groups
66
Table 6. Chi-Square Test 66
Table 7. Chi-Square: Age 68
Table 8. Chi-Square: Gender 69
Table 9. Chi-Square: Population Group 71
Table 10. Chi-Square: Household Income 72/73
Table 11. Chi-Square: Tenure 74
Table 12. Chi-Square: Qualification 75/76
Table 13. Total self-Efficacy Score 77
Table 14. Test of Homogeneity of Variances 77
Table 15. ANOVA one way analysis of variance 78
Table 16. Test of Equality of Group Means 79

viii
LIST OF FIGURES PAGE Figure 1. Employee Commitment Matrix 18
Figure 2. Demographic Profile: Age Distribution 45
Figure 3. Profile: Qualification Distribution 45
Figure 4. Demographic Profile: Gender Distribution 46
Figure 5. Demographic Profile: Population
Distribution
46
Figure 6. Demographic Profile: Household Income
Distribution
47
Figure 7. Demographic Profile: Tenure Distribution 47
Figure 8. “Remuneration Package” 49
Figure 9. “Relationship with Supervisor” 50
Figure 10. “Proud of work achievements” 50
Figure 11. “Content with recognition” 51
Figure 12. “Work is valued” 51
Figure 13. “Happy with responsibilities” 52
Figure 14. “Satisfied with chances of promotion” 52
Figure 15. “Happy with the image of the company” 53
Figure 16. “Satisfied with working conditions” 53
Figure 17. Company rating 54
Figure 18. Company comparison 55
Figure 19. Wanting to work at company 55
Figure 20. Reasons to work for company 56
Figure 21. Work rating 56
Figure 22. Work comparison 57
Figure 23. Wanting to do work 57
Figure 24. Reasons to do work 58
Figure 25. Motivational factors 58
Figure 26. Total Self-efficacy Score Distribution 62
Figure 27. Box and Whisker: Total Self-efficacy Score 65
Figure 28. Box and Whisker: Age 67
Figure 29. Box and Whisker: Gender 69

ix
Figure 30. Box and Whisker: Population Group
(combined)
70
Figure 31. Box and Whisker: Monthly Household
Income
72
Figure 32. Box and Whisker : Tenure 73
Figure 33. Box and Whisker: Qualification 75

SUMMARY
THE ROLE OF SELF-EFFICACY IN EMPLOYEE COMMITMENT
by
NELIA HURTER
SUPERVISOR : PROF JPR JOUBERT DEPARTMENT : INDUSTRIAL AND ORGANISATIONAL PSYCHOLOGY DEGREE : MCOM (Industrial/ Organisational Psychology) Committed employees are increasingly becoming a valued asset in organisations.
For the purpose of this study employee commitment is viewed as commitment to
the organisation as well as employees’ commitment to their occupations. The
purpose of the research was to determine whether there is a correlation between
perceived self-efficacy and employee commitment in a South African sugar
manufacturing company. Self-efficacy, a social cognition construct, which refers
to a person’s self-beliefs in his/her ability to perform specific tasks, has been
shown to be a reliable predictor of both motivation and task performance and to
influence personal goal setting. Despite this, little attention has been given to its
organisational implications. The General Self-Efficacy Questionnaire (GSE), and
an Employee Commitment (CM) questionnaire based on the Conversion Model
were used as measuring tools.
The results of this study indicate that there is a positive correlation between self-
efficacy and employee commitment (Ambassador, Career oriented, Company
oriented). Uncommitted employees show a lower level of self-efficacy. The
implications of these results are discussed.

xi
Further research from a predictive validity perspective is suggested in order to
substantiate the findings and to improve the generalisability thereof.
Key terms: Self-efficacy, employee commitment, commitment to organisation, commitment to occupation.

1
CHAPTER 1
SCIENTIFIC OVERVIEW OF THE RESEARCH 1 1.1 INTRODUCTION
This study deals with the role of self-efficacy in the commitment of employees. In
this study employee commitment is conceptualised and operationalised as
consisting of commitment to the company worked for and commitment to the
occupation, or the work done at the company. The study includes investigating
the construct commitment, investigating the impact of self-efficacy on employee
commitment and the possible interventions required to enhance perceived self-
efficacy. The study was conducted within a South African sugar manufacturing
company.
In Chapter 1 the background of and motivation for the research is described. In
this regard the problem statement, the aims of the research as well as the
paradigm perspective are presented. Thereafter the research design, research
method and the chapter divisions are discussed.
Employee commitment, as operationalised by Hofmeyr and Rice (2000), will be
used as dependent variable and self-efficacy as the independent variable. The
Self-Efficacy Scale developed by Sherer and Maddux (as cited in Coetzee &
Cilliers 2001) will be used to indicate generalized self-efficacy beliefs.
1.2 BACKGROUND AND MOTIVATION FOR THE RESEARCH
Employee commitment has become increasingly important in many organisations.
The construct ‘employee commitment’ is however complex and commitment
cannot be seen as a single, homogeneous entity, which means the same to all
employees. It is multi-faceted and can impact on an organisation in a number of
ways. It changes over time as employee circumstances and needs change. Dodd
(2002) defines commitment as purely psychological – it is a measure of the extent

2
to which an employee has formed a strong psychological attachment to an
organisation. According to Hofmeyr and Rice (2000), the concept of commitment
is four folded, it accounts for an employee’s personal involvement in the decision,
the attraction of alternative options, the degree of ambivalence – as well as
employee satisfaction.
Measuring commitment enables an understanding of why an organisation may be
losing satisfied employees whilst keeping the complainers, as well as why an
organisation may keep employees despite clearly better offers from competitors.
There is a growing body of evidence that human accomplishments and positive
well-being require an optimistic sense of personal efficacy. Self-efficacy refers to
the belief in one’s capabilities to organise and execute the sources of action
required to manage prospective situations (Bandura, 1986). Self-efficacy
expectations determine what activities people engage in, how much effort they will
expend and how long they will persevere in the face of adversity.
Victor Frankl remarked that human beings are naturally inclined to seek meaning,
and that happiness, a much-desired state in modern society, is simply a by-
product in the process of attaining meaning in life (Frankl, 1969). Increasingly,
research has been conducted into existential meaning, and empirical research
strongly supports the association between meaning in life and positive psychology
(De Klerk, Boshoff, & van Wyk, 2004; Giesbrecht, 1997; O’Connor & Chamberlain,
1996; Reker & Wong, 1988).
The concept of meaning has been studied in great detail both as a single and
composite variable. The key message of the Personal Construction Theory is that
the world is 'perceived' by a person in terms of whatever 'meaning' that person
applies to it, and the person has the freedom to choose a different 'meaning' of
whatever he or she wants (Kelly, 1955). Kelly (1955, p.175) states:
he is not the victim of the pie, but of his notions of etiquette under which the
pie cutting has been subsumed… Man, to the extent that he is able to
construe his circumstances, can find for himself freedom from their

3
domination... Man can also enslave himself with his own ideas and then win
his freedom by reconstruing his life. Ultimately a man sets the measure of
his own freedom and his own bondage by the level at which he chooses to
establish his convictions.
Self-efficacy is one of the most prominent of these variables. According to
Bandura (1994) a strong sense of efficacy enhances human accomplishment and
personal well-being in many ways. People with high assurance in their capabilities
approach difficult tasks as challenges to be mastered, rather than as threats to be
avoided. Such an efficacious outlook fosters intrinsic interest and deep
engrossment in activities. Bandura (1994) believes people with high levels of self-
efficacy set themselves challenging goals and maintain strong commitment to
them. They heighten and sustain their efforts in the face of failure. The recovery
of their sense of efficacy after failures or setbacks are quicker and they attribute
failure to insufficient effort or deficient knowledge and skills which are acquirable.
They approach threatening situations with assurance that they can exercise
control over them. Such an efficacious outlook produces personal
accomplishments; affect life choices, level of motivation, quality of functioning,
resilience to adversity and vulnerability to stress and depression.
Committed employees are one of the greatest assets any company can have.
Each year organisations invest substantial amounts of money in training and
developing their work force only to see talented and productive employees
applying for other jobs, potentially to join the competition. Employee commitment
plays a major role in overall business efficiency and profitability. Jamieson and
Richards (1996) argue that greater levels of employee commitment lead to
organisational benefits such as a continuous flow of improvements, cost and
efficiency improvements and active employee participation. Committed
employees are believed to enhance an organisation as they feel secure in their
jobs, are well trained, feel part of a team and are proud of and enjoy doing their
jobs.
Employee commitment also has important implications for recruitment. By
examining the key drivers of commitment, organisations can establish a list of

4
attributes they should be looking for in attempting to recruit or develop a more
committed workforce (Jamieson & Richards, 1996).
From a training perspective, the levels of commitment can also be compared after
interventions and training to determine whether current training schemes are
working. If it is found that self-efficacy impacts on employee commitment, specific
and more targeted interventions to improve self-efficacy levels should be
implemented.
This research could also be of value at a conceptual theoretical level by
developing the construct of commitment into the realm of theoretical models from
being purely a mechanistic construct. This investigates Bandura’s (1994)
suggestion that people with high levels of self-efficacy remain committed to
choices such as occupation and employers. At an operational level the value that
this study can add is to grow and strengthen the high organisational/ high work
commitment segment through training and developing.
The purpose of this study is to investigate the role of self-efficacy in employee
commitment. Hofmeyr and Rice (2000) developed an employee commitment
model based on an organisational- and a work commitment dimension. The
resulting employee quadrant groups can be described as follows:
• High organisational / high work commitment (Ambassador)
• High organisational / low work commitment (Organisation oriented)
• Low organisational / high work commitment (Career Oriented)
• Low organisational / low work commitment (Uncommitted)
1.3 PROBLEM STATEMENT Looking at the world of work in the 21st century and the challenges it brings, it is
clear that not all employees are equally committed to their work and; therefore,
managers must be aware of the individual and situational factors that build
employee commitment.

5
One of the major problems confronting early efforts to understand commitment is
the belief that commitment is a unitary construct. Research efforts were directed
at finding an underlying single term and explanation, despite a variety of
conceptualizations and measures that have fundamental differences (Angle &
Lawson, 1993). These conceptualisations were derived primarily from either a
behavioural or psychological perspective.
Hofmeyr and Rice (2000) provide a relatively new and innovative
conceptualisation of the commitment construct. They propose that commitment
involves more than habitual behaviour and includes feeling (affect) and thinking
(cognition) as well. This perspective uses four dimensions of commitment namely:
• satisfaction,
• involvement or ambivalence in category,
• attractiveness or perception of alternatives, and
• importance.
Given this perspective, commitment can also be viewed as attitudinal loyalty.
According to Bandura (1986) people's beliefs in their efficacy are developed by
four main sources of influence. They include mastery experiences, seeing people
similar to oneself manage task demands successfully, social persuasion that one
has the capabilities to succeed in given activities, and inferences from somatic and
emotional states indicative of personal strengths and vulnerabilities. Ordinary
realities are strewn with impediments, adversities, setbacks, frustrations and
inequities. People must, therefore, have a very strong sense of efficacy to sustain
the perseverant effort needed to succeed.
Career choice and development is an example of the power of self-efficacy beliefs
to affect the course of life paths through choice related processes. The higher the
level of individuals’ perceived self-efficacy, the greater the interest in a certain
career and the better they prepare themselves for it (Bandura, 1994).

6
Considering the above, in this dissertation the researcher intends to investigate
the relationship between self-efficacy, work-, and company commitment. The
outcome of this understanding could inter alia result in the development of
programmes that attempt to inspire higher levels of perceived self-efficacy, in
order to enhance employee commitment.
The following research questions arise on the basis of the description of the
research problem:
• Is there a statistically significant positive relationship between perceived self-
efficacy and employee commitment?
• Do commitment levels differ significantly between different demographic
groups (age, gender, population group, tenure and household income)?
• What is the predictive nature of self-efficacy on employee commitment?
1.4 AIMS OF THE RESEARCH The general aim of this research was to investigate the influence of psychological
wellbeing (self-efficacy) on work and employee commitment.
1.4.1 Specific Aims
The specific aims are to:
• Determine the correlation between perceived self-efficacy and employee
commitment.
• Determine the statistical significance of measured self-efficacy levels between
different demographic groups (age, gender, population group, tenure and
household income)?
• Investigate the impact of motivational influences on employee commitment.
• Investigate the predictive nature of self-efficacy on employee commitment.
• Formulate recommendations towards more effective organisational behaviour
and future research.

7
The research aims were formulated regarding the potential interrelationship
between employee commitment and self-efficacy. The influence of certain
demographic variables (age, gender, population group, household income, tenure
and highest qualification) on these constructs will also be investigated. Certain
motivators (hygiene factors and true motivators) could influence employee
commitment.
1.5 PARADIGM RESPECTIVE According to Mouton and Marais (1994), paradigms refer to the intellectual climate
or variety of meta-theoretical values or beliefs and assumptions underlying the
theories and models that form the definitive context of the research.
1.6 RELEVANT PSYCHOLOGICAL PARADIGMS The Positive Psychology paradigm served as an overall perspective in terms of
which this research was conducted.
The present research is underpinned by the positive psychology paradigm. This
paradigm is defined as the scientific study of ordinary, positive, subjective human
strengths, virtues, experience and functioning (Seligman & Csikszentmihalyi,
2000; Sheldon & King, 2001).
The particular paradigm proposes an alternative orientation to a discipline that has
focused mainly on the study, classification and treatment of pathology.
Increasingly, the focus in the health professions is on developing interests in
wellness as well as in illness, in prevention as well as treatment, in healing as well
as curing.
Like Frankl (1963), positive psychologists reject the idea that people’s goals and
values arise solely from basic drives such as hunger and sex, or from defence
mechanisms such as sublimation and reaction formation. Human beings choose
goals and values that promote higher purposes, such as those of creativity,
morality, and spirituality. Yet in contrast to Frankl’s theory, today’s emerging

8
positive psychology movement does not assume that survival through
psychological adaptation needs to be the ultimate desired direction of human life.
The aim of positive psychology is to understand and enhance those factors that
allow individuals, communities, and societies to flourish. Various individual
constructs become the study of positive psychology, such as: (1) individual
strengths, for example emotional intelligence, locus of control and self-efficacy
(Lopez & Snyder, 2003), (2) emotional experiences in the present such as
happiness (Seligman & Csikszentmihalyi, 2000), creativity, courage and gratitude
(Lopez & Snyder, 2003), (3) constructive cognitions about the future such as hope
and optimism (Peterson, 2000; Schneider, 2001) and (4) specific coping
approaches such as meaning (Baumeister, 1991, Wong, 1998), positive coping
(Somerfield & McCrae, 2000) and spirituality (Richards & Bergin, 2005).
Positive psychology also encompasses the salutogenic (origin of health) paradigm
that was developed by Antonovsky (1979). The fortigenic paradigm developed by
Strumpfer (1990) extends health psychology and envisages psychological
strengths. Wissing and Van Eeden (1997) labelled the scientific study of
psychological wellness as psychofortology (the science of psychological
strengths). Psychofortology focuses not only on the source of psychological
strengths, as implied by the names salutogenesis and fortigenesis, but also on the
nature and dynamics, of these strengths.
Wissing (2000) notes that the emergence of the wellness paradigm focuses not
only on the understanding and enhancement of psychological well-being and
strengths, but also on a more holistic approach to health and wellness. The
purpose of wellness is to increase the likelihood of healthier personal growth and
to decrease the probability of mental illness, physical illness, or both (Palombi,
1992). The wellness construct is defined as a lifetime process with no definite end
or beginning. According to Myers, Sweeney and Witmer (2000), wellness is
defined as a way of life orientated toward optimal health and well-being and is
manifested by the integration of body, mind and spirit by the individual. This is
done in order to live more optimally within the human and natural community.

9
The tendency to focus on strengths, wellness and health rather than illness and
pathology is not restricted only to psychology and is becoming an interdisciplinary
domain. Wissing (2000) argues that wellness is construed as the upper end of a
continuum of holistic well-being in important life domains, including cognitive,
emotional, spiritual, physical, social, occupational and ecological components.
The definitions of psychological well-being/ wellness include constructs such as
satisfaction with life (Diener, 2000), peak experiences/ optimal personality
functioning (Maslow, 1965, 1971) and such dispositions like; sense of coherence
(Antonovsky, 1987), locus of control (Scheepers, 1995), self-efficacy (Bandura,
1982) and hardiness (Kobasa, 1979).
In South Africa, extensive research has been done in the Industrial and
Organisational Psychology field, on positive psychology/ psychofortology
(Rothmann, 2001; Rothman & Malan, 2003; Strumpfer, 1990, 1995; Viviers &
Cilliers, 1999; Wissing & Van Eeden, 2002). The positive psychology domain
directs the present study in the sense that the research is done in order to improve
or develop interventions to drive retention programs by improving motivation,
innovation and productivity. If it is found that self-efficacy is a key issue impacting
on employee commitment, specific and more targeted interventions to improve
self-efficacy levels should be implemented. The focus is on the optimisation of
employees and not on pathology.
Mouton and Marais (1994) states that positivism involves the scientific exploration
and objective collection and judgment of facts in order to arrive at a “positive”
truth. The present empirical study was conducted within the guidelines provided
by the positivistic paradigm. According to Mouton and Marais (1994) positivism
includes the practice and culture of experiment, control, objective observation,
meticulous recording, and precise definitions of behaviour and statistical analysis
of results. It is by means of logical positivism that psychology has adopted the
assumption of realism which has characterised the discipline.

10
1.7 RESEARCH DESIGN
A quantitative survey design with a focus on correlation analysis was used to
achieve the research objectives and to test the research hypotheses. In a survey
research design, the relationships that occur between two or more variables at
one time are examined (Wellman & Kruger, 2001). Survey research is usually a
quantitative method that requires standardised information in order to define or
describe variables or to study the relationship between variables (Wellman &
Kruger, 2001). The survey design was also used to assess interrelationships
among variables within the population. According to Wellman and Kruger (2001)
this design is ideally suited to the descriptive and predictive functions associated
with correlational research. The present research strategy is exploratory and
explanatory in the sense that it has the purpose to investigate and describe the
correlation between the variables.
1.8 RESEARCH METHOD The research method consisted of two phases, namely a literature review and an
empirical study.
1.8.1 Phase One: Literature Review The literature review was undertaken to conceptualise employee commitment and
perceived self-efficacy as well as to examine the theoretical relevance of the 2
concepts.
1.8.2 Phase Two: Empirical Study Phase two consisted of the following steps:
Step 1: The Selection of the Research Participants
Stratified sampling methods were used to select employees of the given company
to form the sample group in this study. The sample therefore consisted of level

11
four and higher employees (n=113) at a South African sugar manufacturing
company.
Step 2: The Selection of the Measuring Instruments
The measurement instruments consisted of the Conversion Model Questionnaire
(Hofmeyr & Rice, 2000) and the GSE (General Self-Efficacy) Questionnaire as
developed by Sherer and Maddux (as cited in Coetzee & Cilliers 2001).
To determine the reliability of the measuring instruments Cronbach Alpha
coefficients and inter-item correlation coefficients were used. Descriptive statistics
were used and the study had as aim to explore whether a relationship between the
two variables exist. It is expected that employees who are committed to their work
and the organisation they work for, have higher levels of self-efficacy than those
who are not committed. The possible influence of demographic variables will also
be investigated
Step 3: Data Gathering
The questionnaires were provided electronically to respondents via the
Organisation’s Intranet. A letter requesting voluntary participation and explaining
the rationale for the research, as well as confidentiality undertakings were
included. Ethical concerns were also taken into consideration, by adhering to the
ethical code specified by the Psychological Society of South Africa (1998). This
included ensuring that participation was voluntary, and that anonymity was
retained. Feedback on an individual basis was available upon request as a means
of empowerment.
Step 4: Data Analysis
Descriptive statistics (means, standard deviations and measures of skewness),
were utilised to describe the data. Cronbach Alpha coefficients and inter-item
correlation coefficients were computed to assess the reliability of the measuring

12
instruments. T-tests for independent groups were computed to compare means
obtained from different groups on selected biographical variables.
Discriminant analysis was used to investigate the extent of how well self-efficacy
statements discriminate between highly and uncommitted employees. The
SPSS, version 15 (Statistical Package for the Social Sciences, 2007) programme
was used to analyse the data. The Commitment data were analysed by The
Customer Equity Company, developers of the Conversion Model.
Step 5: Report and Discussion of the Results of the Empirical Study
After the research hypothesis was tested and the results were reported by means
of figures and tables, and interpreted.
Step 6: Conclusions, Limitations and Recommendations
The last step in the empirical study consisted of drawing conclusions based on the
research questions that were presented. The limitations of the study were also
highlighted. Recommendations for the implementation of results were formulated
in terms of the promotion of knowledge within the field of Industrial and
Organisational Psychology as well as of future research.
1.9 CHAPTER DIVISION The chapter divisions of the research study are discussed next.
Chapter 2: Employee commitment
Chapter 2 provides a theoretical overview of commitment. Specific attention was
given to the organisational and employee commitment, the history and
background, definition, development, research on, and application of these
constructs.

13
Chapter 3: Self-Efficacy
The purpose of Chapter 3 is to provide a theoretical overview of self-efficacy.
Specific attention was given to the history and background, definition,
development, research on, and application of this construct.
Chapter 4: Empirical Study
This chapter describes the empirical procedure in terms of the sample, measuring
instruments, data collection and processing as well as the research hypothesis.
Chapter 5: Results
This chapter encompasses the reporting and interpretation of the results.
Chapter 6: Conclusions, Limitations and Recommendations
Conclusions were drawn regarding the specific aims of the research; the
limitations were formulated in terms of the literature and the empirical study and
recommendations were offered. These are presented in Chapter 6.
1.10 CHAPTER SUMMARY In this chapter, the problem statement of and motivation for the research, research
aims, paradigm perspectives, research design, research method and the division
of chapters were discussed. Chapter 2 and 3 will focus on a literature review and
on conceptualising employee commitment and self-efficacy and their relationship.

14
CHAPTER 2
EMPLOYEE COMMITMENT
2 EMPLOYEE COMMITMENT
2.1 INTRODUCTION
In today’s competitive world each employee has to be committed to the
organisation’s objectives for the organisation to perform at peak levels.
Employees have to think and act as entrepreneurs and prove their worth.
Organisational commitment (Meyer & Allen, 1997) has been shown to be an
attitude of great importance for organisations, as it refers to the attachment of
individuals to an organisation. Commitment leads to several attitudes and
behaviours that are beneficial to the organisation, like organisational citizenship
behaviour, and reduced absenteeism or turnover (Watson & Papamarcos, 2002).
The new world of work brings new challenges to modern organisations. Changes
in every aspect of life - genetics, reality, society, truth and sovereignty
(globalization) have deeply challenged our world. One of these challenges
involves maintaining employee commitment in the business environment.
According to Miner (2003) employees are facing more ambiguity in their daily
activities and decreased job security. Employees’ needs and expectations
changed as they no longer have the assurance of continued employment. The
importance of work-life balance, a safe working environment, pleasant working
conditions and access to training and development are examples of the change in
employees’ needs. Demographic trends suggest that the situation might become
worse. Research suggests that the age profile of the population as a whole is
getting older and young people entering into employment are exhibiting a much
more critical attitude towards the traditional notion of work. This is also
increasingly becoming the case in the South African work force.

15
The importance of employee commitment is quite evident if one considers prior
research into the relationship between commitment and performance (Lok &
Crawford, 1999). Organisations that can successfully foster the commitment of
their employees enjoy several distinct competitive advantages. They are able to
execute their business strategies more successfully and are more flexible and
adaptive to changing market conditions. They have an enhanced reputation in the
market place and hence can attract and retain the best talent. They produce
superior shareholder value through lower operating costs and higher profits. Their
employees demonstrate higher levels of motivation, integrity and loyalty.
According to Edwards (2005) in high commitment organisations, employees
deliver value in three distinct ways:
• Persistence – longer tenure, reduced absence, improved punctuality, reduced
stress
• Citizenship – more ethical behaviours, spontaneous ambassadorship, more
proactive support for others, increased discretionary effort
• Performance – greater productivity, enhanced customer service, improved
quality, higher outputs.
2.2 HISTORY OF COMMITMENT Work and employee commitment was being researched as early as the 1950s in
terms of a single and a multidimensional perspective (Suliman & lIes, 2000).
The most prominent single-dimensional approach to employee commitment is
the attitudinal approach of Mowday, Steers and Porter (1979), which views
commitment largely as an employee attitude or a set of behavioral intentions.
Becker’s theory (as cited in Powell & Meyer, 2004), also known as the side-bet
theory, has also been widely used to explain commitment from a behavioral
perspective. He describes side-bets as consequences to other interests and
activities that result from a particular line of action. In life's routines, individuals
stake value on continuing a consistent line of behavior. Together, this line of

16
action may come to represent a series of side-bets that an individual is unwilling
to lose (Powell & Meyer, 2004). According to Suliman and lIes (2000) the most
popular multi-dimensional approach to organisational commitment is that of
Meyer and Allen who in 1991, basing their argument on Becker’s theory,
introduced the dimension of continuance commitment to the already existing
dimension of affective commitment. They later added a third, normative
commitment component.
Exchange theory has permeated the literature on commitment and represents a
widely used variation of the behavioral approach to the determination of
commitment. According to exchange theory, an employee who perceives a
favorable exchange and greater rewards is more likely to be a committed
employee (Emerson, 1976). In research on attitudes towards work,
organisational commitment has been shown in factor analytic studies to be
distinguishable from job satisfaction, job involvement, career resilience,
occupational commitment, turnover intention and the Protestant work ethic
(Meyer & Allen, 1997; Mueller, Wallace, & Price; 1992). Thus an employee may
not experience job satisfaction or high job involvement and yet be satisfied with
the organisation and therefore continue working for it.
The behavioral perspective on commitment, as defined by Johnson (as cited in
Powell & Meyer, 2004, p.138), imply “those consequences of the initial pursuit of
a line of action which constrain the actor to continue that line of action”. This
perspective differs from Mowday, Steers, and Porter (1979), who refers to these
commitment-related behaviors as representing "sunk costs where individuals
forgo alternative courses”.
Meyer and Allen (1991) proposed that organisational commitment is a
psychological state linking employees to the organisation, which is multifaceted
in both, form (affective, continuance, normative) and focus (organisational, work
team, top management team leader).
In contrast to the behavioral approach, the psychological interpretation describes
commitment as a more active and positive orientation (Morris & Sherman, 1981),

17
and stresses bonding, linkage, and attachment. Kanter (1968, p.96) in her study
of how commitment develops in communities in Utopia, defines commitment as
"the process through which individual interests become attached to the carrying
out of socially organised patterns of behavior which are seen as fulfilling those
interests, as expressing the nature and needs of the person". The most
commonly used organisational application of the psychological framework,
developed by Porter, Crampton and Smith (1976) defines employee commitment
as "the relative strength of an individual's identification with, and involvement in
a particular organisation". In accordance with this definition, organisational
commitment has three major components: a strong belief in, and acceptance of
the organisation's goals, a willingness to exert considerable effort on behalf of
the organisation, and a definite desire to maintain organisational membership
(Porter, Steers, Mowday & Boulian, 1974). The lack of consensus about what
commitment is and the resulting measurement of different constructs have made
it difficult to generalize findings and to develop a clear understanding of the
processes that precipitate work or employee commitment. Researchers have
also realised that although neither the behavioral nor the psychological
perspective is wrong in its identification of commitment factors, both are
incomplete.
There has been no indication in the literature of how the various types of
commitment impact on one another, or whether there is one single most important
type of commitment which managers need to focus on to improve organisational
effectiveness. A number of theorists and researchers have begun to distinguish
among foci and bases of commitment. Foci refer to the individuals and groups to
whom an employee is attached, while bases of commitment are the motives
engendering attachment (O’Reilly & Chatman, 1986). For the sake of this
research the focus will be on employee commitment as a whole, and the impact, if
any, self-efficacy has on employee commitment.
2.3 CONVERSION MODEL In the industrial era, employee satisfaction was not considered important to the
success of business, but this notion has now gained almost universal acceptance.

18
Employee satisfaction is indeed important to business success, but if it were the
only factor, satisfied employees would never leave the company, while dissatisfied
employees would always do so. The theory of commitment was developed to
answer questions such as why satisfied employees leave, and dissatisfied
employees stay (Hofmeyr & Rice, 2000). Commitment often occurs in situations
where personal needs and values are being violated. The Conversion Model
(Hofmeyr & Rice, 2000) has four aims, namely to identify what drives commitment
in employees, to determine what makes employees highly committed and to drive
retention programs by improving motivation, innovation and productivity. The
fourfold classification gives rise to the Employee Commitment Matrix. This is
reflected in Figure1.
COMMITMENT TO TYPE OF WORK HIGH
Career Oriented
• Employees more focused
on their career development.
• They may be highly productive, but also at risk of being head-hunted.
Managers should explore ways to increase company commitment.
Ambassador • Employees who speak
well of the Company and are enthusiastic about their work.
These employees are assets and Managers should use them and their Departments as models for others.
COMMITMENT TO TYPE OF WORK
LOW
Uncommitted • Employees who are not
enthusiastic about their work or the Company they work for.
• In the extreme, uncommitted employees can cause dissent in the workplace.
Managers should find and fix issues resulting in low commitment.
Company Oriented
• Employees promote the
Company but are dissatisfied with or don’t care about the work they’re doing.
• This may impact on their
performance.
These employees may be happier and more committed in another position.
LOW COMMITMENT TO THE COMPANY
HIGH COMMITMENT TO THE COMPANY
Figure 1. Employee commitment matrix (Jamieson & Richards, 1996)

19
2.4 DEFINITION OF WORK AND COMPANY COMMITMENT Company Commitment has been defined in many ways. Mowday, Porter and
Steers (1982) defined organisational commitment as an individual’s identification
with and involvement in a particular organisation, that can be characterised by a
strong belief in and acceptance of the organisation’s goals and values. Committed
employees demonstrate a willingness to exert considerable effort on behalf of the
organisation, and exhibit a strong desire to maintain membership in the company
(Mowday, et al; 1982).
Meyer and Allen (1991) defined organisational commitment as reflecting three
broad themes: affective, continuance, and normative. Thus commitment is viewed
as reflecting an affective orientation toward the organisation, recognition of the
costs associated with leaving the organisation, and a moral obligation to remain
with the organisation.
Affective commitment refers to an employee's emotional attachment to an
organisation (Meyer & Allen, 1991). Employees with strong affective commitment
to an organisation are committed because they share values with the organisation
and its members (Meyer, Allen & Smith 1993; Somers & Birnbaum, 1998). A
number of studies have supported a link between affective commitment and
organisational citizenship behaviors (Mathieu & Zajac, 1990; Meyer et al., 1993).
In fact, previous research shows that of all three organisational commitment
facets, affective commitment is the most strongly related to organisational
citizenship (Meyer et al., 1993).
Continuance commitment refers to an employee's awareness of the costs of
leaving an organisation (Meyer & Allen, 1991). It is based on Becker's notion of
"side bets" that result in increased hidden costs in an organisation where
employees may feel the need to remain in their job because of financial
obligations, health benefits, and pensions (Somers & Birnbaum, 1998).
Previous research on continuance commitment has revealed no relationship or a
negative relationship with on-the-job behaviours. For instance, some studies
found continuance commitment to have no significant relationship with

20
organisational citizenship behaviors while other studies (e.g., Mathieu & Zajac,
1990) have reported a negative relationship. Unlike employees high on affective
commitment, which are less sensitive to cues that potentially limit extra-role
behavior, individuals high on continuance commitment tend to be more sensitive
to conditions that define what is expected of them (Meyer & Herscovitch, 2001).
Consequently, they may exhibit fewer citizenship behaviors because they are
pursuing activities to avoid costs rather than realize individual or organisational
gains (Brown 1996; Meyer & Herscovitch, 2001). This may be particularly true
of employees who have been socialized, in part, by professional norms (Brown,
1996).
Normative commitment refers to an employee's sense of obligation to an
organisation. Employees high in normative commitment believe they should stay
with an organisation out of moral obligation, even if they do not want or need to
stay (Meyer & Allen, 1991). For instance, an employee may feel that she has
made an implicit promise to stay through a new product launch. Yet, the
employee may not enjoy the organisation (and co-workers) and feel no emotional
attachment. Previous research suggests that normative commitment is positively
related to both affective commitment and to various on-the-job behaviors,
including organisational citizenship behaviors (Meyer, Allen & Smith, 1993;
Somers & Birnbaum, 1998).
Subsequently, many definitions have been proposed for the commitment concept,
but a recurring strand seems to be the idea of a psychological bond - an intrinsic
attachment or identification of a person with something outside of oneself
(Firestone & Pennell, 1993).
Chow (1994) defined company commitment as the degree to which employees
identify with their organisation and the managerial goals, and show a willingness
to invest effort, participate in decision-making and internalise organisational
values. Organisational commitment is also defined as the extent to which an
individual identifies with an organisation and is committed to its goals (Kreitner &
Kinicki, 1995). According to Meyer and Herscovitch (2001) organisational
commitment can be conceived as a binding force that is experienced as a mind-

21
set or as a psychological state that leads an individual toward a particular course
of action, while according to Zangaro (2001), employees are regarded as
committed to an organisation if they willingly continue their association with the
organisation and devote considerable effort to achieving organisational goals.
Meyer and Allen (1991) noted that common to the various definitions of
organisational commitment is the view that commitment is a psychological state
that (a) characterises the employee’s relationship with the organisation, and (b)
has implications for the decision to continue membership in the organisation.
Thus, regardless of the definition, “committed” employees are more likely to
remain with the organisation than are uncommitted employees.
There are also various entities within the world of work to which employees might
become committed, including the organisation, job, profession/ occupation,
manager/ supervisor, team and union. According to Reichers (cited in Meyer &
Allen, 1997) organisational commitment can best be understood as a collection of
multiple commitments.
The current research focuses on measuring organisational commitment as the
entity of commitment. Several authors have suggested that commitment is
different from motivation or general attitudes (Brown, 1996; Scholl, 1981); they
established that commitment influences behavior independently of other motives
and attitudes and, in fact, might lead to persistence in a course of action even in
the face of conflicting motives or attitudes.
2.5 PROFESSIONAL COMMITMENT Increasingly, researchers have also begun to examine occupational and
professional commitment (Blau, 1989; Meyer et al., 1993; Vandenberg &
Scarpello, 1994; Wallace, 1995). Both types of commitment are conceptualized
similarly in that they involve groups of people across employing organisations who
have mastery over specific occupational tasks (Blau, 1989). However, knowledge
workers who exhibit strong levels of autonomy, expertise, and self-regulation are
viewed as professionals (Blau, 1989). In short, professionals are perceived as a
subset of occupational communities (Wallace, 1995).

22
The limited research on occupational and professional commitment suggests that
it is related to a number of on-the-job behaviors. Meyer, et al. (1993) found that
aspects of occupational commitment were positively related to organisational
citizenship behaviors and negatively related to tardiness. Similarly, a number of
studies involving accountants (Aranya & Ferris, 1983; Kline, 1998; Miceli & Mulvy,
2000) and other professionals have shown a positive relationship between
occupational and professional commitment and various performance and
citizenship measures. Professional commitment is likely to be positively related to
self-efficacy because employees perceive extra-role activities like peer mentoring
as an effort to build or extend the profession and themselves. 2.6 CHAPTER SUMMARY
In this chapter the researcher reflected on the history of commitment.
Occupational and organisational commitment was defined and the construct of
employee commitment was conceptualised. From the literature, employee
commitment can be seen from a behavioural as well as a psychological
perspective. For the purpose of this study the focus is on employee commitment
as a two-dimensional construct. Commitment to the organisation, as well as
commitment to the type of work will be investigated, as well as the impact that self-
efficacy has on commitment.
In Chapter 3 self-efficacy will be discussed, with specific reference to the source
thereof and the implications it holds for organisations.
23
CHAPTER 3
SELF-EFFICACY 3 SELF-EFFICACY 3.1 INTRODUCTION
Perceived self-efficacy is defined as people's beliefs about their capabilities to
produce designated levels of performance that exercise influence over events that
affect their lives (Bandura, 1994). The construct of self-efficacy represents one
core aspect of Bandura’s social-cognitive theory (Bandura, 1994). Bandura (1994)
postulates that these expectations determine whether or not a certain behaviour or
performance will be attempted, the amount of effort the individual will contribute to
the behaviour, and how long the behaviour will be sustained when obstacles are
encountered. Self-efficacy beliefs determine how people feel, think, motivate
themselves and behave. Such beliefs produce these diverse effects through four
major processes, namely cognitive, motivational, affective and selection
processes.
Personal well-being and human accomplishment are enhanced by a strong sense
of efficacy in many ways. People with high assurance in their capabilities
approach difficult tasks as challenges to be mastered rather than as threats to be
avoided (Bandura, 1994). It can be regarded as an optimistic and self-confident
view of one’s capability to deal with certain life stressors. Such an efficacious
outlook fosters intrinsic interest and deep engrossment in activities. People, with
high self-efficacy set themselves challenging goals and maintain strong
commitment to them while they also heighten and sustain their efforts in the face
of failure. After failures, they quickly recover their sense of efficacy. They
attribute failure to insufficient effort or deficient knowledge and skills which are
acquirable, therefore approaching threatening situations with assurance that they
can exercise control over them.
In contrast, when individuals doubt their capabilities, they shy away from difficult
tasks which they view as personal threats. They easily fall victim to stress and

24
depression. In terms of feeling, a low sense of self-efficacy is associated with
depression, anxiety and helplessness. Persons with low self-efficacy also tend to
have low self-esteem, and they harbour pessimistic thoughts about their
accomplishments and personal development according to Schwarzer (1992).
3.2 SELF-EFFICACY AND OTHER TYPES OF SELF-BELIEFS 3.2.1 Expectancy Related Construct Concepts such as self-concept, self-esteem, outcome expectations and locus of
control are often confused with self-efficacy. Although these terms are often
mistakenly used interchangeably, they represent quite distinct constructs.
3.2.1.1 Self-Concept Self-concept refers to a generalized self-assessment incorporating a variety of
self-reactions and beliefs such as feelings of self-worth and general beliefs of
competence. In contrast, self-efficacy beliefs are context-specific judgements of
personal capability to organise and execute a course of action to attain a set goal.
Self-efficacy focuses more specifically on the tasks or activities that an individual
feels capable of performing, rather than a more global assessment of ”how good
you are at something” as provided in assessments of self-concept (Zimmerman &
Cleary, 2006).
3.2.1.2 Self Esteem
Self-esteem can be defined as a type of belief involving judgements of self-worth.
It is an affective reaction indicating how a person feels about him/herself. Self-
efficacy perceptions, involves cognitive judgements of personal capability (Pintrich
& Schunk, 2002). Bandura (1997) argues that perceptions of worth or self-esteem
may develop from a person’s global self-perception (self-concept), as well as from
a variety of other sources, such as altruism and empathy.
25
3.2.1.3 Outcome Expectations
Research (Schunk & Miller, 2002) shows that self-efficacy beliefs are usually
better predictors of behaviour than outcome expectations. Outcome expectations
refer to general behaviour in terms of certain situations. These outcome
expectations are distinctive and important for understanding behaviour (Bandura,
1997) but self-efficacy beliefs accounts for a bigger part.
3.2.1.4 Perceived Control
The construct of perceived control comes from earlier research on locus of control
(Rotter, as cited in Zimmerman & Cleary, 2006), and is concerned with general
expectancies, that outcomes are controlled by either one’s behaviour or by
external events. This dualistic view of control suggests that an internal locus of
control promotes self-directed behaviour, whereas external locus of control inhibits
one’s self-directed abilities.
Self-efficacious individuals and those with an internal locus of control will exhibit
more self-directed behaviour than will low self-efficacious individuals or those with
an external locus of control.
3.3 SPECIFIC AND GENERAL SELF-EFFICACY
Gardner and Pierce (1998) and Judge, Locke, Durham, and Kluger (1998) state
that self-efficacy can be viewed from both a specific and a general angle. An
example of a specific angle would be task-specific self-efficacy, which can be seen
as an expectation or judgement about the likelihood that a task will be successfully
performed. It is a powerful motivator of behaviour, as efficacy expectations
determine the initial decision to perform a task, the effort that gets expended and
the level of persistence that emerges in the face of adversity. Self-efficacy can
also be viewed as a general, stable cognition or trait that individuals hold with
them that reflects the expectation that they possess the ability to perform a task
successfully in a variety of situations, according to Eden and Zuk (1995).

26
According to Gardner and Pierce (1998), self-efficacy gradually emerges through
the experiences that the individual accumulates. Frequent situation-specific
experiences of personal success across time and situations give rise to
generalised self-efficacy. Judge et al. (1998) state that it could be expected that
generalised self-efficacy would load on the same factor as self-esteem, because
self-efficacy and self-worth are the core components of self-esteem. Repeated
success at a specific task, the accumulation of successful experiences across a
variety of tasks and positive feedback from the work environment are likely to lead
to higher generalised self-efficacy. Self-efficacy can impede or enhance
motivation. People with high self-efficacy choose to repeatedly perform more
challenging tasks (Bandura, 1997).
General self-efficacy has been hypothesized to be a strong determinant of specific
self-efficacy (Eden, 1988). Sadri and Robertson (1993) argue that enhanced task
performance is the major consequence of high levels of specific self-efficacy
perceptions. Although research on the possible effects of self-efficacy on
employee attitude and commitment is limited, it seems plausible that the higher
one’s level of self-efficacy in some task, the higher one’s positive affect associated
with it (Lee & Bobko, 1994; Schwoerer & May, 1996). Wood and Bandura (1989)
suggested that inefficacious thoughts could cause stress and depression, which
could lead to reduced levels of satisfaction. According to Bandura (1989)
employees with a low level of self-efficacy shy away from difficult tasks, doubt their
own capability and are not very committed to the goals and aspirations they set for
themselves.
Bandura (1977a) suggested that efficacy expectations also influence the choice of
the environment. For example, if all other factors are being controlled, an
employee with high self-efficacy might choose to apply for an advertised vacancy
that offers more challenge and pay, while an employee with low self-efficacy might
choose to remain in a dead-end position (Gist, 1987).

27
3.4 SOURCES OF SELF-EFFICACY
Bandura (1977) identifies four ways in which self-efficacy is learned and self-
efficacy expectations are acquired, mastery experiences, vicarious experiences,
social persuasion and physical/ affective status.
3.4.1 Mastery Experience
The most effective way of creating a strong sense of self-efficacy is through
mastery experiences. Enactive mastery, defined as repeated performance
accomplishments (Bandura, 1982) has been shown to enhance self-efficacy more
than the other kinds of cues. The manner in which accomplishments are received
has an influence on an individual’s self-efficacy expectations and actions.
Successes build a strong belief in one’s personal efficacy, while failures
undermine it. Further, while positive mastery experiences increase self-efficacy,
negative ones (failures) tend to decrease self-efficacy according to Gist (1987).
When people experience only easy successes, they come to expect quick results.
Failure discourages them; therefore some setbacks serve a useful purpose in
teaching that success usually requires sustained effort. Once individuals’ become
convinced they “have what it takes”, they persevere and quickly rebound from
setbacks or failures. This builds self-efficacy and they emerge stronger from
setbacks.
3.4.2 Vicarious Experiences Beliefs are often acquired through observation and interpretation. In observing the
modelling behaviours of others, the learner is able to reflect on past experiences
with such behaviour and make meaning of its relevance in a new situation
(Bandura, 1977). The impact of modelling on perceived self-efficacy is strongly
influenced by perceived similarity to the models. Modelling is more effective when
the models succeed after overcoming difficulty than when they exhibit initially
facile performances (Bandura, Adams, Hardy & Howells, 1980). Through their
behaviour and expressed ways of thinking, competent models transmit knowledge

28
and teach observers effective skills and strategies for managing environmental
demands. Its effects also are enhanced when the modelled behaviour produces
clear results or consequences and when there is similarity between the subject
and the model in terms of age, capability, and other personal characteristics
(Bandura, 1977a).
Self-modelling is a special type of vicarious experience often involving videotaped
feedback in which the individual’s mistakes are edited out. This promotes the idea
of perfection as the individual can see herself/ himself performing the task
correctly. Gonzales and Dowrick (as cited in Gist, 1987) confirmed that self-
modelling led to improved performance by enhancing self-belief.
3.4.3 Social Persuasion People’s beliefs about self are influenced by the messages conveyed by others.
Encouragement supports self-efficacy, criticism hampers it. Verbal persuasion is
believed to influence efficacy perceptions in some situations, but it is viewed as
less effective than modelling or enactive mastery (Bandura, 1982). People, who
are verbally persuaded that they possess the skills and capabilities to master a
given activity, are likely to show more determination and sustain it. Verbal
persuasion, promote people to develop skills and lead them to try harder to
succeed. According to Bandura (1977a), individuals who have been persuaded
that they lack capabilities, tend to avoid challenging activities that cultivate
potential and give up quickly in the face of adversity.
3.4.4 Physical/ Affective Status Stress and anxiety have a negative effect on self-efficacy. Bandura and Adams
(1977) found that in anxiety-producing situations, modelling yielded higher self-
efficacy and performance than psychological desensitisation. Some people
interpret their stress reaction and tension as signs of vulnerability to poor
performance. Bandura (1977a) states that mood also affects people’s judgements
of their personal efficacy. By reducing stress reactions and altering people’s

29
negative emotional proclivities of their physical state, self-efficacy beliefs can be
modified.
3.5 SELF-EFFICACY AND PERFORMANCE Many studies have reported significant correlations between self-efficacy and
subsequent task performance (Bandura, 1982; Bandura & Adams, 1977; Bandura,
Adams & Beyer, 1977; Chambliss & Murray, 1979; Feltz, 1982; Locke, Frederick,
Lee & Bobko, 1984). Efficacy perceptions still predict subsequent performance,
even in studies where efficacy perceptions have been altered. Bandura (1977a)
notes that although active mastery yields the greatest increase in self-efficacy,
correlations between self-efficacy and performance remain high for non-enactive
modes such as modelling.
Several studies have found self-efficacy to be a better predictor of subsequent
performances than past behaviour (Bandura, 1977a; Bandura, 1982; Bandura &
Adams, 1977; Bandura et al., 1977; Bandura et al., 1980; Chambliss & Murray,
1979). However, other studies contradicted this, for example Gist (1987). Studies
conducted by Feltz (1982) provided some evidence that as experience with a task
increases, past performance becomes more predictive than self-efficacy. It needs
to be noted that Feltz’s study involved a task in which subjects were unable to
observe their performance and no feedback was provided (Gist, 1987). Under
these circumstances self-efficacy may have lacked veridicality. Locke et al. (1984)
found that when past performance was controlled, self-efficacy was a significant
predictor of subsequent performance. The correlation between self-efficacy and
past performance was however higher, than the correlation between self-efficacy
and future performance.
3.6 RELATION OF SELF-EFFICACY TO MOTIVATION
Bandura (1997) and Schunk (1995) confirm the contention that efficacy beliefs
mediate the effect of skills or other self-beliefs on subsequent performance
attainments. Researchers have also demonstrated that self-efficacy beliefs

30
influence these attainments by influencing effort, persistence and perseverance
(Bandura & Schunk, 1981; Bouffard-Bouchard, 1990; Schunk & Hanson, 1985).
Motivation has been defined by social cognitive researchers as a process in which
goal directed behaviour is instigated and sustained (Pintrich & Schunk, 2002).
Motivation can manifest itself in various forms such as effort, persistence, and
choice of activities.
In terms of effort, two measures have typically been employed in research; rate of
performance and expenditure of energy (Zimmerman, 1995). There is supporting
evidence for the association between self-efficacy and both indexes.
Zimmerman’s model of self-regulation incorporates various motivational processes
such as self-efficacy, outcome expectations, and task interest or valuing. The
model predicts that self-efficacy, being the key motivational element, will be
related to the other motivational processes.
Pajare (1996) states that there is ample reason believe that self-efficacy is a
powerful motivation construct that works well to predict self-beliefs and
performances at varying levels. This study will investigate the possible link
between commitment and self-efficacy, as it is believed that self-efficacy predicts
commitment levels.
3.7 CHAPTER SUMMARY In this chapter emphasis was placed on the concept of perceived self-efficacy and
the different ways that self-efficacy expectations are acquired. Reference was
made to the correlation between self-efficacy, performance and motivation. The
literature review indicated that self-efficacy might influence a variety of factors.
For the purpose of this study we will investigate the possible influence that self-
efficacy has on employee commitment.
Chapter 4 focuses on the empirical part of the research project.

31
CHAPTER 4
EMPIRICAL STUDY 4 EMPIRICAL STUDY The second phase of the research entailed an empirical study. In this chapter the
sample, the research questions, the measuring instruments, data collection and
data analysis are discussed.
4.1 THE POPULATION AND SAMPLE The research was performed in a South African sugar manufacturing company.
The population of this study consisted of all the employees who have Intranet
access (n=400) as reflected on the personnel list obtained from the Human
Resource department of the organisation.
The achieved sample consisted of hundred and thirteen (113) people, which
resulted in a response rate of 28%. Analysis of studies that have used both mail
and e-mail for surveys indicate that e-mail has not consistently outperformed
postal mail: some e-mail surveys did better than mail surveys when it comes to
response rates, some did worse, and some the same (e.g. Opperman, 1995;
Schaefer & Dillman, 1998). A review by Sheehan (2001) of electronic surveys
conducted between 1986 and 2000 found that the year in which the study was
conducted strongly predicts response rates. The novelty of electronic survey
diminished over time, affecting the response rate negatively. The average
response rate found during 2000 was 34% (Sheehan, 2001).
The demographic profile of the sample is discussed in Chapter 5.
4.2 THE MEASURING INSTRUMENTS The measuring instruments consisted of items reflecting 3 different variables.
These were contained in a single questionnaire distributed via the company
intranet. The first section covers questions related to the Conversion Model (CM),
32
(Hofmeyr, 1998). The second section contains the General Self-Efficacy Scale
(GSE) (Schwarzer & Jerusalem, 1995), and the third, demographic questions.
This questionnaire is appended as Appendix 1.
4.2.1 Conversion Model Employee Commitment
Individuals bring a complex range of needs, desires and values to every decision
they make – whether they are choosing a job, motor or clothes (Hofmeyr & Rice,
2000). They tend to become attached to what works for them, and the longer
something satisfies their needs, the more committed they become. In Conversion
Model terminology this is referred to as needs-value fit. Needs-value fit is the
extent to which any choice satisfies all the goals, motivations, needs and values a
person has regarding that choice.
Traditional employee surveys measure the needs-value fit as overall job
satisfaction and also tends to ask multiple satisfaction questions for various
attributes. In terms of needs-value fit, people may differ from each other in what
they need; people in different industries may also have different needs, and finally
needs change over time. Despite the diversity of needs, the employee
commitment questionnaire aims to determine the extent of employee happiness.
Satisfaction is not enough to predict behaviour. We must also take into account
the degree to which people care about each of the choices they make. In
Conversion Model terminology this is referred to as involvement.
The important factor is the extent to which employees care about their jobs. For
an employee who converts from committed to uncommitted, it is an emotional
event. The employee goes from working on the relationship with the employer to
being overtly angry and resistant to working on the relationship. The situation is
often irreversible and the employee often becomes the missionary working against
the organisation. Uncommitted employees, on the other hand, may move quietly
from one job to another (Hofmeyr & Rice, 2000).

33
Traditional employee satisfaction surveys commonly refer to employee loyalty.
Satisfied employees are however not always the most loyal employees. A
satisfied employee could for example be attracted by monetary incentives. In
Conversion Model terminology this is referred to as, the attraction to alternatives.
It is clear that when we measure commitment amongst employees, we must
measure both commitment to the company, and commitment to the type of work.
Employee Commitment measures commitment to both company and type of work
and places employees in four categories: ambassadors, company oriented, career
oriented, and uncommitted.
• Ambassadors: Committed to both company and type of work. These
employees are highly motivated and are very unlikely to move companies.
• Company Oriented: Committed to the company, but not the type of work.
They may show less than optimal productivity. Increased training,
responsibility, or lateral movements to other departments may be in order.
These employees are probably not going to move.
• Career Oriented: Not committed to the company, but are committed to the
type of work. These employees may be highly productive, but are at risk of
moving to other companies. Training makes them even more attractive to
head-hunters.
• Uncommitted: Uncommitted to both company and type of work. Exit barriers
prevent these employees from leaving the company. They could negatively
affect the company, both internally and externally.
Nine statements, which measure the possible motivational influence on employee
commitment, were included in the questionnaire.
The administration, interpretation, reliability and validity of the work commitment
measuring instrument are now discussed.

34
4.2.1.1 Administration
In this study CM Employee Commitment questionnaire was administered utilizing
Computer Aided Web Interviewing (CAWI). All employees who have access to the
Intranet were included in the sample frame.
CAWI is best used when employees have access to an Intranet or Internet
connection. The Intranet has several advantages over both pencil-and-paper and
Computer Aided Telephone Interviewing (CATI) administration.
• “Real-Time” data collection.
• CAWI programming reduces error and allows for complex filtering.
• CAWI allows for unique employee codes which can be linked to back-end data
and reduces the need for some demographics.
• CAWI removes the possibility of interviewer error.
• CAWI allows for employees to complete the questionnaire when it is most
convenient for them.
• Confidentiality may be less problematic as the completion of the questionnaire
is done completely anonymously.
4.2.1.2 Interpretation
The Conversion Model question responses were entered into an algorithm to
create the employee commitment segments. Once the data has been exported
and run through the algorithm, three new variables are added to the original data
file.
• Commitment to Company: 4-point ordinal scale variable (1=high commitment,
4=low commitment)
• Commitment to Type of Work: 4-point ordinal scale variable (1=high
commitment, 4=low commitment)
• Matrix: 4-point categorical variable (1=ambassadors, 2=company oriented,
3=career oriented, 4=uncommitted)

35
4.2.1.3 Reliability The CM has been used on over 3800 projects, in over 200 product and service
categories, as well as in diverse field applications such as politics, social studies
and employee studies (Global Employee Commitment Report, 2002). The
reliability of the Conversion Model section of the measuring instrument will be
determined by means of an internal consistency statistic (Cronbach Alpha
coefficient).
4.2.1.4 Validity The problem of validation in the social sciences is very different to the natural
sciences. In contrast to the natural sciences, the social sciences attempt to
measure behaviour, which is in essence variable.
Criterion-related predictive validation, the ideal which applies in the natural
sciences, is difficult to achieve in the social sciences. Carmines and Zeller (1979)
argue that this is because social science concepts are frequently so abstract that
no obvious criterion variable presents itself. They suggest therefore that the most
general method applicable in the social sciences is construct validation.
Perceptual mapping and ideal point positioning from a case study in the banking
sector were used to provide evidence for the construct validity of the Conversion
Model Employee Commitment measuring instrument (Hofmeyr, 1989; Rice and
Hofmeyr, 1990).
The results shown in these early banking studies have been repeated with
impressive consistency across a number of different studies (Hofmeyr, 1990). This
includes research done at the brand and category levels in the fast-moving
consumer goods sectors (consumable beverages e.g. fruit juices, carbonated soft
drinks, alcoholic beverages and motor manufacturers).

36
4.2.1.5 Justification for inclusion The CM was selected as an instrument in this research owing to the fact that the
Conversion Model is a leading measure of commitment and focuses on more than
merely traditional loyalty or satisfaction. Taylor Nelson Sofres and the Customer
Equity Company (Ltd) commissioned a worldwide Global Employee Commitment
Report to provide a global database of commitment norms for Employee Scores.
19 840 full-time employees were surveyed in 33 countries. Therefore, this
research could provide valuable information regarding the construct of employee
commitment in a South African sample. The reliability and validity information that
was reported in other research studies (Global Employee Commitment Report,
2002) makes the Conversion Model a sound instrument to use in research into
organisational commitment.
4.2.2 The General Self-Efficacy Scale (GSE)
The General Self-Efficacy Scale (GSE) aims at a broad and stable sense of
personal competence to deal efficiently with a variety of stressful situations. The
scale was designed to assess self-efficacy (i.e., the belief that ones’ actions are
responsible for successful outcomes). The German version of this scale was
originally developed by Matthias Jerusalem and Ralf Schwarzer in 1981, first as a
20-item version and later as a reduced 10-item version (Jerusalem, & Schwarzer,
1986, 1992; Schwarzer, & Jerusalem, 1995).
The Sherer and Maddux scale (Sherer, Maddux, Mercabante, Prentice-Dunn,
Jacobs & Rogers, 1982) used in this study consist of 27 items. It comprises
statements about how one assesses one’s self-efficacy in different situations. The
GSE scaled score for each question ranges from 1 to 7, where 1 indicates a
strong agreement with a positive self-efficacious item and 7 strong disagreement.
Higher total scores therefore indicate lower belief in self-efficacy. Nine of the items
are negatively worded to counteract response styles. The items 1, 2, 9, 10, 11,
12, 23, 26 and 27 are reversely scored. By confirmatory factor analyses it was
found that the scale was uni-dimensional in all sub-samples.

37
The administration, interpretation, reliability and validity of the self-efficacy
measuring instrument are now discussed.
4.2.2.1 Administration
The GSE is a self-completion questionnaire and takes 15-20 minutes to complete.
No time limit is set but respondents are requested to work quickly and give their
first impressions. The GSE can be administered individually or in groups. The
corresponding score on the seven-point scale is selected and recorded. After
reverse scoring negatively phrased questions, adding up the item values on the
seven- point scale gives a total score on GSE, the GSE: T score.
4.2.2.2 Interpretation
According to Bandura (1989) the stronger the sense of self-efficacy, the bolder the
behaviour of the individual will be. An individual who is strong in self-efficacy is
more likely than someone with a weak perception of self-efficacy to (Bandura,
1989):
• Be motivated to do things competently
• Be spurred on to great efforts in the face of adversity
• Withstand failures by viewing tasks as challenges
• Deploy attention and effort to the demands of the situation.
Being a uni-dimensional scale, the overall score reflects the general level of self-
efficacy. A high score indicates a low sense of self-efficacy, whereas a low score
represents a high degree of self-efficacy.
4.2.2.3 Reliability Rimm and Jerusalem (1999) and Luszczynska, Schunk and Schwarzer (2005)
reported Cronbach Alpha ranges varying between 0.75 and 0.94 across a number
of different language versions. High reliability and stability was found (Leganger,

38
Kraft & Roysamb, 2000; Schwarzer, Mueller, & Greenglass, 1999). The Maddux
and Sherer measurement obtained Cronbach alphas of between 0.71 and 0.86
which compare favourable to an alpha value of 0,7 recommended by Nunnally
(1978) for scales used in basic research (Sherer & Maddux, 1982).
4.2.2.4 Validity Studies have shown that the GSE has high construct validity (Leganger et al.
2000, Schwarzer, Mueller, & Greenglass, 1999). The scale was found to be
configurally equivalent across 28 nations and it forms only one global dimension
(Leganger et al., 2000). Relations between the GSE and other social cognitive
variables (intention, implementation of intentions, outcome expectations, and self-
regulation) are high and confirm the validity of the scale (Luszczynska et al, 2005).
This scale showed good construct validity, with six personality measures, and
good criterion validity with measures of vocational, education and military career
success (Sherer & Maddux, 1982).
4.2.2.5 Justification for inclusion Self-efficacy has been established to be one of the indicators of psychological
well-being and provides reliable results across multicultural contexts (Rimm &
Jerusalem, 1999; Luszczynska et al, 2005). Individuals often do not behave
optimally even though they know what to do. The rationale of the self-efficacy
questionnaire is that it measures an individual’s expectations of how that person is
likely to perform in a wide variety of situations (Tipton & Worthington, 1984). A
person who expects to be successful in a variety of situations will score low on the
questionnaire, because in terms of the scoring of this questionnaire, the lower the
score, the higher the level of self-efficacy. The reliability and validity information
reported above also make the GSE a sound research instrument.

39
4.2.3 Demographic Section
A demographic section was constructed to gather information on the biographical
variables of gender, age, population group, household income, tenure and highest
qualification.
4.3 DATA COLLECTION The following procedure was used in gathering the data.
A letter requesting voluntary participation and containing the rationale for the
research, as well as confidentiality undertakings, was sent to all employees
(n=400) who had access to the intranet and 113 responses were returned. The
instruments were provided to respondents in questionnaire form via the Intranet.
Respondents were requested to complete the questionnaire within a 1-month time
frame. An electronic reminder to complete the survey was sent out to employees
via the internal electronic mail system.
4.4 DATA PROCESSING The Statistical Package for the Social Sciences (version 15) (SPSS 15.0 for
Windows, 2007) programme was used for the statistical analysis. The Conversion
Model data were sent to the Customer Equity Company (Cape Town) for the
running of algorithms and subsequent processing of the Conversion Model
segments. The statistical analysis was computed and is reflected in Chapter 5.
4.4.1 Descriptive Statistics Descriptive statistics portray the characteristics of the sample and summarises the
responses to items measuring CM Employee Commitment and General Self-
Efficacy. The descriptive statistics used were frequencies, means and standard
deviations.

40
4.4.2 Reliability of Instruments
The reliability of an instrument can be defined in terms of when a test measures
the same thing more than once and results in the same outcome (Salkind, 2001).
The present study calculated the Cronbach Alpha coefficient as a measure of the
internal consistency of each of the scales. Cronbach’s Alpha reflects how well a
set of items (or variables) measures a single uni-dimensional latent construct.
When data exhibit a multidimensional structure, Cronbach’s Alpha will usually be
low.
The alpha coefficient ranges in value from 0 to 1 and may be used to describe the
reliability of factors extracted from dichotomous and/or multi-point formatted
questionnaires or scales (Lemke & Wiersma, 1976). The higher the alpha
coefficient, the more reliable the test. There is no universally agreed cut-off figure,
but a Cronbach Alpha of 0.7 and above is usually acceptable (Nunnally &
Bernstein, 1994).
4.4.3 Discriminant Analysis
Discriminant analysis is used to model the value of a dependent categorical
variable based on its relationship to one or more independent variables predictors.
Given a set of independent variables, discriminant analysis attempts to find linear
combinations of those variables that best separate groups of cases.
4.4.4 Regression Analysis
A stepwise multiple regression analysis was conducted to determine the
percentage of variance in the dependant variable (total employee commitment
score - ungrouped) that was predicted by the independent variable (self-efficacy).
It was decided to conduct a separate regression analysis for each of the three
employee commitment sub-scales (company, work and total employee
commitment) owing to the diverse nature of these sub-scales. A stepwise
regression procedure was used on all the data, with the sub-scales of the General
Self-Efficacy as independent variables.
41
4.4.5 Statistical test of difference
The appropriate inferential test when comparing two means obtained from two
different groups of subjects is a t-test for independent groups. The t-test for
independent groups is defined as the difference between the sample means
divided by the standard error of the mean difference. According to Shaughnessy,
Zechmeister and Zechmeister (2003) the p-level reported with a t-test represents
the probability of error involved in accepting a research hypothesis concerning the
existence of a difference. The null hypothesis is that of no difference between the
two categories of observations (corresponding to the groups).
Some researchers (Shaughnessy et al., 2003) suggest that if the difference is in
the predicted direction, one can consider only one half (one “tail”) of the probability
distribution and thus divide the standard p-level reported with a t-test (a “two-
tailed” probability) by two. Others, however, suggest that one should always
report the standard, two-tailed t-test probability.
As the two-tailed p-values in the current study are all highly significant (below
0.01) it was not considered necessary to divide them even though the differences
are in the expected direction.
In this research differences between the mean SE score for each of the four
commitment segments (ambassador, committed to work, committed to
organisation, uncommitted) were investigated. This analysis involves four groups
and an ANOVA was therefore applied.
In statistics, analysis of variance (ANOVA) is a collection of statistical models, and
their associated procedures, in which the observed variance is partitioned into
components due to different explanatory variables.
In general, the purpose of an ANOVA is to test for significant differences between
means. If we are only comparing two means, then ANOVA will give the same
results as the t test for independent samples (if we are comparing two different

42
groups of cases or observations), or the t test for dependent samples (if we are
comparing two variables in one set of cases or observations).
4.5 CHAPTER SUMMARY
In Chapter 4 the second phase of this research design was addressed. The
objectives of the research were stated, the measuring battery discussed, the
selection and compilation of the sample described, the empirical methodology
considered and the research aims stated.
In Chapter 5 the results of the empirical study are reported and discussed.

43
CHAPTER 5
RESULTS OF THE EMPIRICAL STUDY
5 RESULTS OF THE EMPIRICAL STUDY In this chapter the results of the empirical study are reported and discussed. The
first section discusses the descriptive statistics of the various questionnaires’ items
used in the study. The next section examines the psychometric properties of the
CM Employee Commitment and General Self-Efficacy scales.
The general aim of this research was to investigate the influence of one aspect of
psychological wellbeing (self-efficacy) on work and employee commitment. The
specific aims are to:
• Determine the correlation between perceived self-efficacy and employee
commitment.
• Determine the statistical significance of differences of measured self-efficacy
levels between different demographic groups (age, gender, population group,
tenure and household income)?
• Investigate the impact of motivational variables on employee commitment.
• Investigate the predictive nature of self-efficacy on employee commitment.
• Formulate recommendations towards more effective organisational behaviour
and future research.
5.1 DESCRIPTIVE STATISTICS OF MEASUREMENT
The descriptive statistics for each of the instruments in the measuring battery and
the demographic variables of the sample are now discussed.
5.1.1 Demographic Variables
The demographic variables obtained for each respondent included: age, gender,
population group, monthly household income, tenure and highest qualification.
The demographical characteristics of the participants are listed in Table 1 below.

44
TABLE 1. FREQUENCY ANALYSIS OF BIOGRAPHICAL VARIABLES
n = 113 Count Column N % <20 1 .9%20-29 11 9.7%30-39 24 21.2%40-49 35 31.0%50-59 37 32.7%
Age
60+ 5 4.4%Male 81 71.7%Gender Female 32 28.3%Asian 2 1.8%Black 10 8.8%Coloured 0 .0%
Population Group
White 101 89.4%<10 17 15.0%10-25 29 25.7%25-40 33 29.2%
Monthly HH Income
40+ 34 30.1%<1 22 19.5%1-3 14 12.4%4-6 7 6.2%7-10 5 4.4%11-15 31 27.4%16-20 24 21.2%21-25 4 3.5%
Tenure
26+ 6 5.3%Matric 12 10.6%Post Matric 39 34.5%Degree 33 29.2%Hons 13 11.5%
Qualification
Masters/Doc 16 14.2%
The majority of the sample are older than 40 (68%), male (72%) and white (89%).
90% of the sample hold a post matric qualification, while 85% earn more than
R10 000 per month. Approximately 60% of the respondents have been employed
by the company for longer than 10 years.
Figures 2 to 7 graphically reflect the demographic profile of the sample.

45
0.9
9.7
21.2
31.032.7
4.4
0.0
5.0
10.0
15.0
20.0
25.0
30.0
35.0
<20 20-29 30-39 40-49 50-59 60+
Age in Years
Freq
uenc
y %
Figure 2. Demographic Profile: Age Distribution
The sample reflects an older profile with 68% older than 40.
71.7
28.3
0.0
10.0
20.0
30.0
40.0
50.0
60.0
70.0
80.0
Male Female
Gender
Freq
uenc
y %
Figure 3. Demographic Profile: Gender Distribution

46
Figure 3 indicates a male skew in the sample.
1.88.8
89.4
0.0
10.0
20.0
30.0
40.0
50.0
60.0
70.0
80.0
90.0
100.0
Asian Black White
Population Group
Freq
uenc
y %
Figure 4. Demographic Profile: Population Group Distribution
The majority of the sample is white, with only 11% from other population groups.
10.6
34.5
29.2
11.514.2
0.0
5.0
10.0
15.0
20.0
25.0
30.0
35.0
40.0
Matric Post Matric Degree Hons Masters/Doc
Education Level
Freq
uenc
y %
Figure 5. Demographic Profile: Qualification Distribution
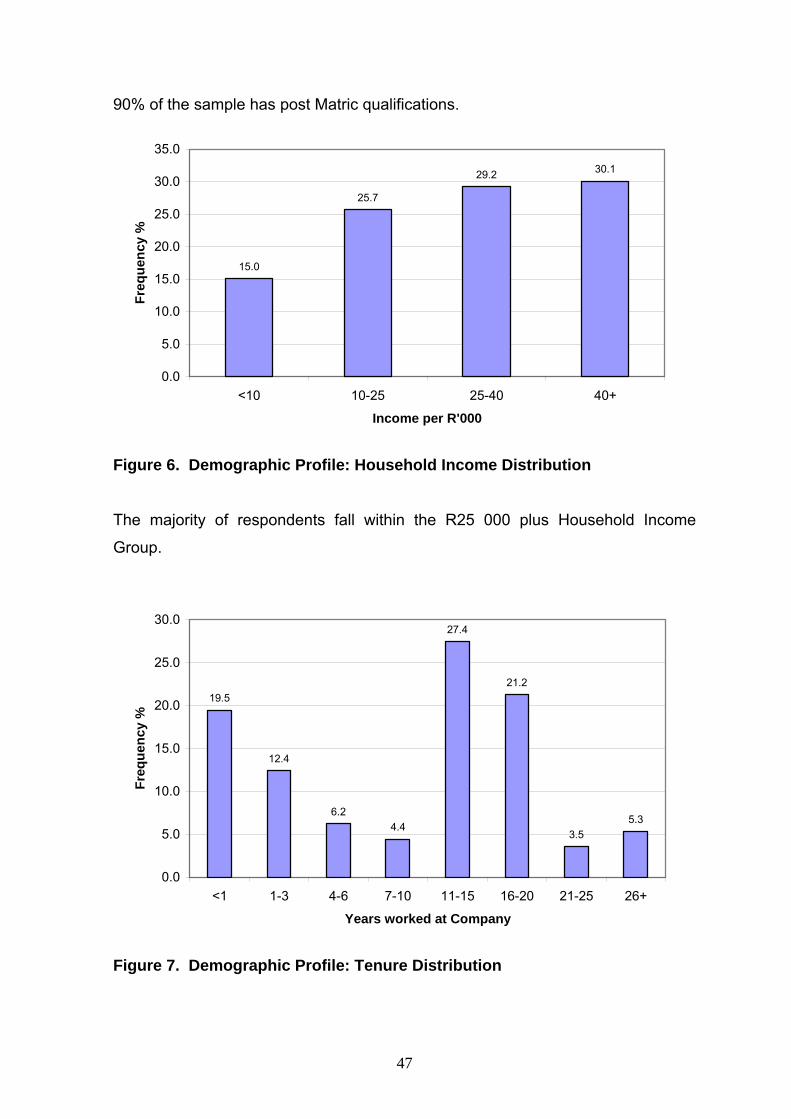
47
90% of the sample has post Matric qualifications.
15.0
25.7
29.2 30.1
0.0
5.0
10.0
15.0
20.0
25.0
30.0
35.0
<10 10-25 25-40 40+
Income per R'000
Freq
uenc
y %
Figure 6. Demographic Profile: Household Income Distribution
The majority of respondents fall within the R25 000 plus Household Income
Group.
19.5
12.4
6.24.4
27.4
21.2
3.55.3
0.0
5.0
10.0
15.0
20.0
25.0
30.0
<1 1-3 4-6 7-10 11-15 16-20 21-25 26+
Years worked at Company
Freq
uenc
y %
Figure 7. Demographic Profile: Tenure Distribution

48
It is clear from Figure 7 that employees who have been with the company for 10 or
more years tend to remain employed by the organisation.
The descriptive statistics for each of the items and sub-scales of the battery of
measuring instruments, consisting of the Conversion Model Employee
Commitment questionnaire and the General Self-Efficacy Scale (GSE), are
provided in the sections to follow.
5.1.2 Descriptive statistics of Commitment Model measuring instrument
Table 2 reflects the minimum and maximum score, mean and standard deviation
by CM employee commitment item (Section A of questionnaire).
Table 2. CM EMPLOYEE COMMITMENT
N Minimum Maximum Mean Std. Deviation Company rating 113 1 10 7.28 1.436 Company comparison 113 1 2 1.28 .453 Wanting to work at company 113 1 4 1.75 .675
Reasons to work for company 113 1 3 1.56 .550
Work rating 113 3 10 7.73 1.345 Work comparison 113 1 3 1.29 .494 Wanting to do work 113 1 4 1.78 .741 Reasons to do work 113 1 3 1.52 .519 Remuneration package 113 1 5 3.35 .915 Relationship with Supervisor/ Manager 113 1 5 4.34 .988
Proud about work achievements 113 1 5 4.29 .636
Content with the recognition 113 1 5 3.56 .855
Work is valued 113 1 5 3.65 .990 Happy with responsibilities 113 1 5 3.88 .769
Satisfied chances on promotion 113 1 5 3.32 1.029
Happy with the image of company 113 1 5 3.93 .799
Satisfied with working conditions 113 1 5 3.86 .833
Comm_comp 113 1 4 1.87 .891 Comm_work 113 1 4 1.68 .869 Matrix 113 1 4 1.71 1.066 Valid N (list wise) 113

49
This instrument requires respondents to rate both their commitment to the
company and their occupation. In addition, questions relating to the following
motivational influences, were included.
• Remuneration package
• Relationship with Supervisor/ Manager
• Proud about work achievements
• Content with the recognition
• Work is valued
• Happy with responsibilities
• Satisfied with chances on promotion
• Happy with the image of company
• Satisfied with working conditions
Figures 8 to 16 graphically display the motivational influences.
5.3
12.4
25.7
54.9
1.8
0.0
10.0
20.0
30.0
40.0
50.0
60.0
Disagree 2 3 4 Agree
Level of Agreement
Freq
uenc
y %
Figure 8. “Remuneration Package” From Figure 8 it is clear that 57% of the sample is content with their remuneration
package.

50
3.5 2.7
8.0
28.3
57.5
0.0
10.0
20.0
30.0
40.0
50.0
60.0
70.0
Disagree 2 3 4 Agree
Level of Agreement
Freq
uenc
y %
Figure 9. “Relationship with Supervisor”
Figure 9 displays that 86% of employees have a solid relationship with their
supervisors.
0.9 0.9 1.8
61.1
35.4
0.0
10.0
20.0
30.0
40.0
50.0
60.0
70.0
Disagree 2 3 4 Agree
Level of Agreement
Freq
uenc
y %
Figure 10. “Proud of work achievements”

51
3.5
6.2
28.3
54.9
7.1
0.0
10.0
20.0
30.0
40.0
50.0
60.0
Disagree 2 3 4 Agree
Level of Agreement
Freq
uenc
y %
Figure 11. “Content with recognition”
A minority of 38% are not content with the recognition they receive.
4.46.2
27.4
44.2
17.7
0.0
5.0
10.0
15.0
20.0
25.0
30.0
35.0
40.0
45.0
50.0
Disagree 2 3 4 Agree
Level of Agreement
Freq
uenc
y %
Figure 12. “Work is valued”

52
1.8
5.3
9.7
69.9
13.3
0.0
10.0
20.0
30.0
40.0
50.0
60.0
70.0
80.0
Disagree 2 3 4 Agree
Level of Agreement
Freq
uenc
y %
Figure 13. “Happy with responsibilities”
83% of the sample are happy with their responsibilities while more than 50% are
satisfied with their chances on promotion.
5.3
18.6
22.1
46.9
7.1
0.0
5.0
10.0
15.0
20.0
25.0
30.0
35.0
40.0
45.0
50.0
Disagree 2 3 4 Agree
Level of Agreement
Freq
uenc
y %
Figure 14. “Satisfied with chances of promotion”

53
2.7 1.8
14.2
62.8
18.6
0.0
10.0
20.0
30.0
40.0
50.0
60.0
70.0
Disagree 2 3 4 Agree
Level of Agreement
Freq
uenc
y %
Figure 15. “Happy with the image of the company”
Figure 15 displays that the majority of the employees are happy with the
company’s image.
2.7
5.3
10.6
66.4
15.0
0.0
10.0
20.0
30.0
40.0
50.0
60.0
70.0
Disagree 2 3 4 Agree
Level of Agreement
Freq
uenc
y %
Figure 16. “Satisfied with working conditions”

54
From the figures above it is evident that the majority of the sample have a positive
response regarding the motivational influences.
The questionnaire is appended as Appendix 1. The questionnaire consists of
Section A which entails the Standard Employee Commitment Questionnaire and
Section B, the General Self-Efficacy questionnaire. Section C is the demographic
variables.
The following graphs illustrate the distribution of responses by Standard Employee
Commitment item (Figures 17 to 25).
0.92.7
8.0
12.4
23.9
38.1
10.6
3.5
0.0
5.0
10.0
15.0
20.0
25.0
30.0
35.0
40.0
Terrible 4 5 6 7 8 9 Perfect
Level of Agreement
Freq
uenc
y %
Figure 17. Company rating
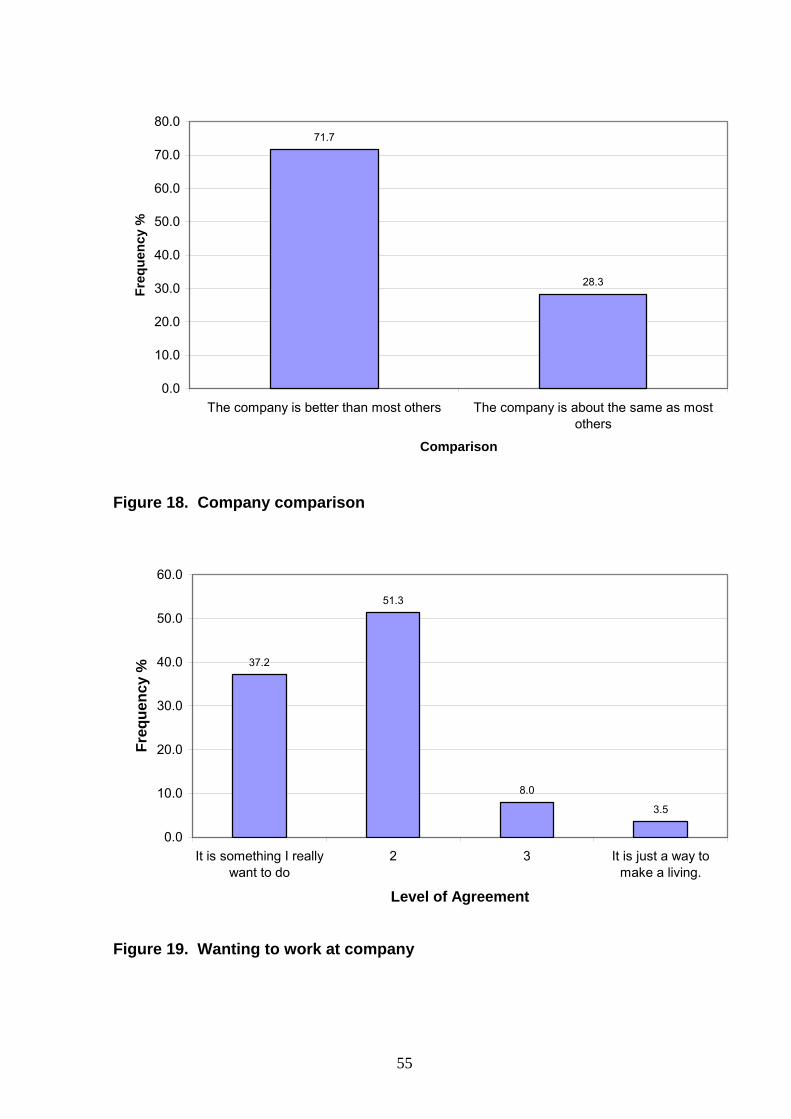
55
71.7
28.3
0.0
10.0
20.0
30.0
40.0
50.0
60.0
70.0
80.0
The company is better than most others The company is about the same as mostothers
Comparison
Freq
uenc
y %
Figure 18. Company comparison
37.2
51.3
8.0
3.5
0.0
10.0
20.0
30.0
40.0
50.0
60.0
It is something I reallywant to do
2 3 It is just a way tomake a living.
Level of Agreement
Freq
uenc
y %
Figure 19. Wanting to work at company

56
46.950.4
2.7
0.0
10.0
20.0
30.0
40.0
50.0
60.0
I can think of many good reasons forcontinuing to work at the company, andno good reasons to work somewhere
else.
I can think of many good reasons forcontinuing to work at the company butthere are also many good reasons to
work somewhere else
I can think of few good reasons tocontinue working at the company, andthere are many good reasons to work
somewhere else
Level of Agreement
Freq
uenc
y %
Figure 20. Reasons to work for company
1.8 2.70.9
10.6 11.5
50.4
16.8
5.3
0.0
10.0
20.0
30.0
40.0
50.0
60.0
3 4 5 6 7 8 9 Perfect
Rating of Work
Freq
uenc
y %
Figure 21. Work rating
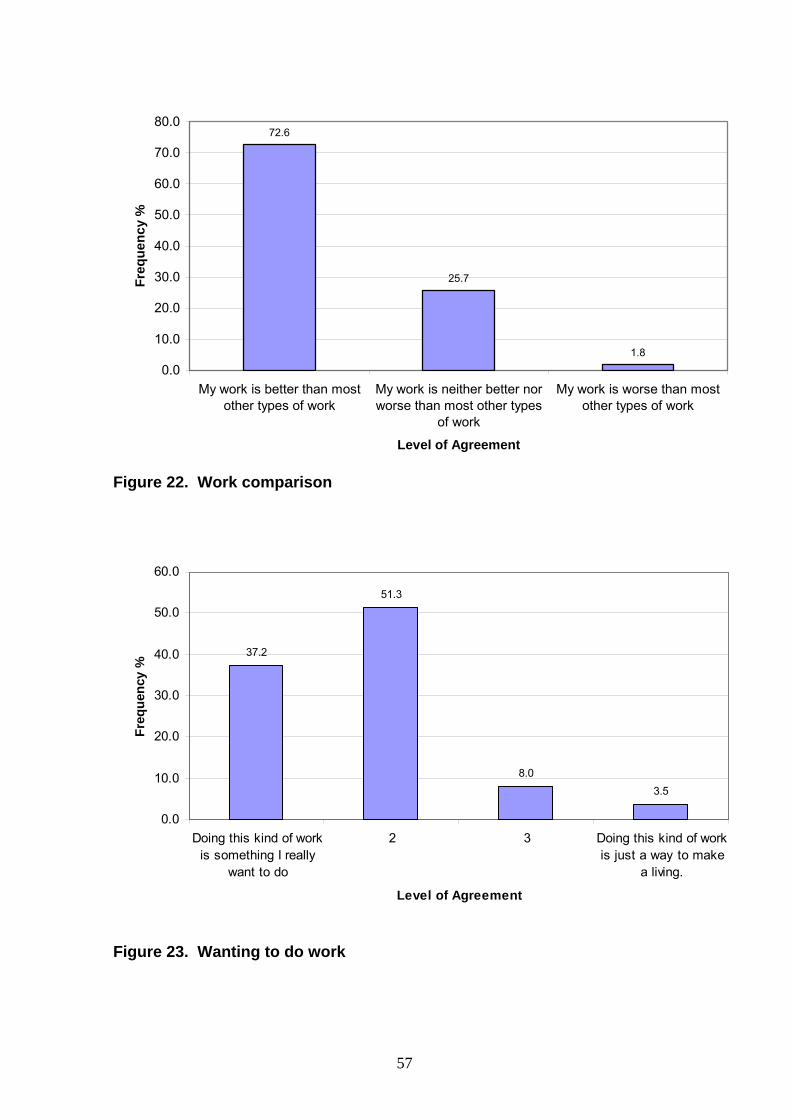
57
72.6
25.7
1.8
0.0
10.0
20.0
30.0
40.0
50.0
60.0
70.0
80.0
My work is better than mostother types of work
My work is neither better norworse than most other types
of work
My work is worse than mostother types of work
Level of Agreement
Freq
uenc
y %
Figure 22. Work comparison
37.2
51.3
8.03.5
0.0
10.0
20.0
30.0
40.0
50.0
60.0
Doing this kind of workis something I really
want to do
2 3 Doing this kind of workis just a way to make
a living.
Level of Agreement
Freq
uenc
y %
Figure 23. Wanting to do work

58
48.7 50.4
0.90.0
10.0
20.0
30.0
40.0
50.0
60.0
I can think of many goodreasons to continue doing the
same kind of work
I can think of many goodreasons to continue doing the
same kind of work, but there arealso many good reasons to
change
I can think of few good reasonsto continue doing the same kind
of work
Level of Agreement
Freq
uenc
y %
Figure 24. Reasons to do work
0.00
0.50
1.00
1.50
2.00
2.50
3.00
3.50
4.00
4.50
5.00
relati
onsh
ip with
Superv
isor/ M
anag
er
proud
abou
t work
achie
vemen
ts
happ
y with
the i
mage o
f com
pany
happ
y with
resp
onsib
ilities
satis
fied w
ith w
orking
cond
itions
work is
value
d
conte
nt with
the r
ecog
nition
remun
eratio
n pac
kage
satis
fied c
hanc
es on
prom
otion
Agr
eem
ent
Figure 25. Motivational factors

59
From Table 2 and Figures 17 to 25 it is clear that respondents rate both their work
and the company highly. With regard to comparing the company to other
companies and their kind of work to other work, respondents rate the company
and the work better than most others, with little difference in variation.
Respondents displayed a high level of desire to work at both the company and do
the kind of work they do. They indicated many good reasons to remain in the
company and continue with their current work.
Figure 25 indicates that respondents show high agreement on all the measured,
possible effects on commitment. All nine questions were rated at an average level
of higher than 3.2 which is regarded as an acceptable level of agreement (Maurer
& Pierce, 1998). This measure confirms the positive responses obtained by the
Conversion Model items.
“Relationship with supervisor” and “proud about work achievements” display the
highest level of agreement. Respondents feeling towards their remuneration
package and the chances on promotion display higher levels of variance which
indicate lower levels of agreement.
5.1.3 Descriptive statistics of the Self-Efficacy measuring instrument
The following Table (Table 3) reflects the minimum and maximum score, mean,
standard deviation and variance by General Self-Efficacy item (Section B of the
questionnaire).

60
TABLE 3. THE GENERAL SELF-EFFICACY SCALE (GSE)
N Minimum Maximum Mean Std. Deviation Variance I find it extremely unpleasant to be afraid 113 1 7 4.03 1.790 3.205
I sometimes avoid difficult tasks 113 1 7 2.40 1.264 1.599
I am a very determined person. 113 1 7 1.96 1.113 1.239
I set my mind to a task almost nothing can stop me.
113 1 7 1.95 .822 .676
I have a lot of self-confidence 113 1 7 2.42 1.124 1.264
I am at my best when I am really challenged 113 1 7 2.01 .921 .848
I believe that it is shameful to give up something I started
113 1 7 2.60 1.430 2.045
I have more than the average amount of self-determination
113 1 7 2.10 .855 .732
Sometimes things just don't seem worth the effort.
113 1 7 3.14 1.563 2.444
I would rather not try something that I'm not good at.
113 1 6 2.96 1.356 1.838
I have more fears than most people. 113 1 7 2.19 1.141 1.301
I find it difficult to take risks. 113 1 6 2.62 1.277 1.631
People have a lot of problems but none they will not eventually be able to solve
113 1 7 2.62 1.358 1.845
I can succeed in almost any endeavour to which I set my mind.
113 1 7 2.58 1.108 1.229
Nothing is impossible if I really put my mind to it 113 1 7 1.84 .727 .528
I feel I am better off to rely on myself for a solution when things are looking bad
113 1 7 3.12 1.341 1.799
When put to the test I would remain true to my ideas.
113 1 7 2.01 .818 .670
If a person believes in himself, he/she can make it in the world.
113 1 7 1.77 .856 .732
I feel that chances are very good that I can achieve my goals in life.
113 1 7 1.95 .800 .640

61
N Minimum Maximum Mean Std. Deviation Variance In general I agree that "if first I do not succeed, I'll try again".
113 1 7 1.91 .797 .635
When I have difficulty getting what I want, I try harder
113 1 7 1.89 .772 .596
I excel at few things. 113 1 7 4.35 1.585 2.514I have often burned the midnight oil to finish a task before the deadline
113 1 7 2.14 1.469 2.158
I have more willpower than most people 113 1 7 2.18 .879 .772
I become frustrated when I experience physical discomfort
113 1 7 4.72 1.405 1.973
Nothing is worth subjecting myself to pain for, if I can avoid it.
113 1 7 4.55 1.427 2.036
I would endure physical discomfort to complete a task because I just don't like to give up.
113 1 7 2.27 1.128 1.272
Total Self-efficacy Score 113 47 111 77.01 10.264 105.348Valid N (list wise) 113
Table 3 indicates that respondents generally strongly agree that “nothing is
impossible if they set their minds to it” (Item 15) and “when they have difficulty
getting what they want, they try harder” (Item 21). These items also display the
lowest level of variance.
The lowest level of agreement is Item 25, “I become frustrated when I experience
physical discomfort” and Item 26, “nothing is worth subjecting myself to pain for, if
I can avoid it”.
The following four items (1, 22, 25 and 26) display a high degree of variance:
• I find it extremely unpleasant to be afraid
• I excel at few things
• I become frustrated when I experience physical discomfort
• Nothing is worth subjecting myself to pain for, if I can avoid it
High variance levels could be a reason for low agreeability on items 25 and 26 and
could also be the result of the clarity (understandability) of the statement.
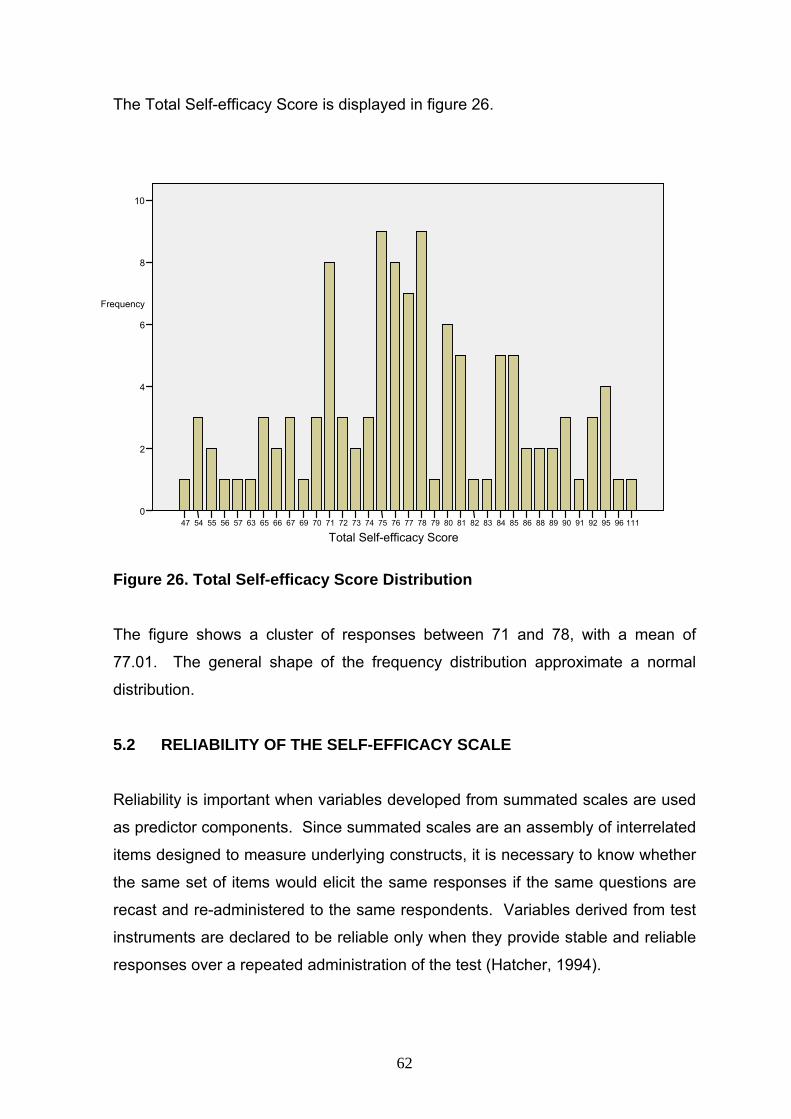
62
Total Self-efficacy Score11196959291908988868584838281807978777675747372717069676665635756555447
Frequency
10
8
6
4
2
0
The Total Self-efficacy Score is displayed in figure 26.
Figure 26. Total Self-efficacy Score Distribution
The figure shows a cluster of responses between 71 and 78, with a mean of
77.01. The general shape of the frequency distribution approximate a normal
distribution.
5.2 RELIABILITY OF THE SELF-EFFICACY SCALE
Reliability is important when variables developed from summated scales are used
as predictor components. Since summated scales are an assembly of interrelated
items designed to measure underlying constructs, it is necessary to know whether
the same set of items would elicit the same responses if the same questions are
recast and re-administered to the same respondents. Variables derived from test
instruments are declared to be reliable only when they provide stable and reliable
responses over a repeated administration of the test (Hatcher, 1994).

63
The reliability option in SPSS (SPSS 15.0 for Windows, 2007) provides an
effective tool for computing Cronbach's Alpha, which is a numerical coefficient of
reliability.
Cronbach's Alpha is an index of reliability associated with the variation accounted
for by the true score of the "underlying construct”. The construct is the
hypothetical variable that is being measured (Hatcher, 1994).
Alpha coefficient ranges in value from 0 to 1 and may be used to describe the
reliability of multi-point formatted questionnaires or scales (i.e., rating scale:
1 = agree, 7 = disagree). The higher the alpha coefficient, the more reliable the
generated scale. Nunnaly (1978) has indicated 0.7 to be an acceptable reliability
coefficient but lower thresholds are sometimes used in the literature.
The attained Cronbach Alpha of 0.86 is higher than 0.70 which indicates an
acceptable reliability level.
Correlation analysis is often used to identify if a relationship between one or more
variables exist, or internal consistency of the questionnaire. It furthermore
provides insight into the underlying constructs of items measuring a particular
variable. Items 2, 9, 13 and 16 display inter-item correlations lower than 0.3 on all
other items. The inter-item correlation matrix is appended as Appendix 2.
5.2.1 Analysis of Conversion Model segment by Self-Efficacy score
In this two-way analysis the Total Self-Efficacy score was binned into four
quartiles. Quartile 1 contains the most efficacious 25% of respondents, while
Quartile 4 contains the least efficacious 25%.
The number of respondents by self-efficacy quartile per commitment segment is
reflected in Table 4.
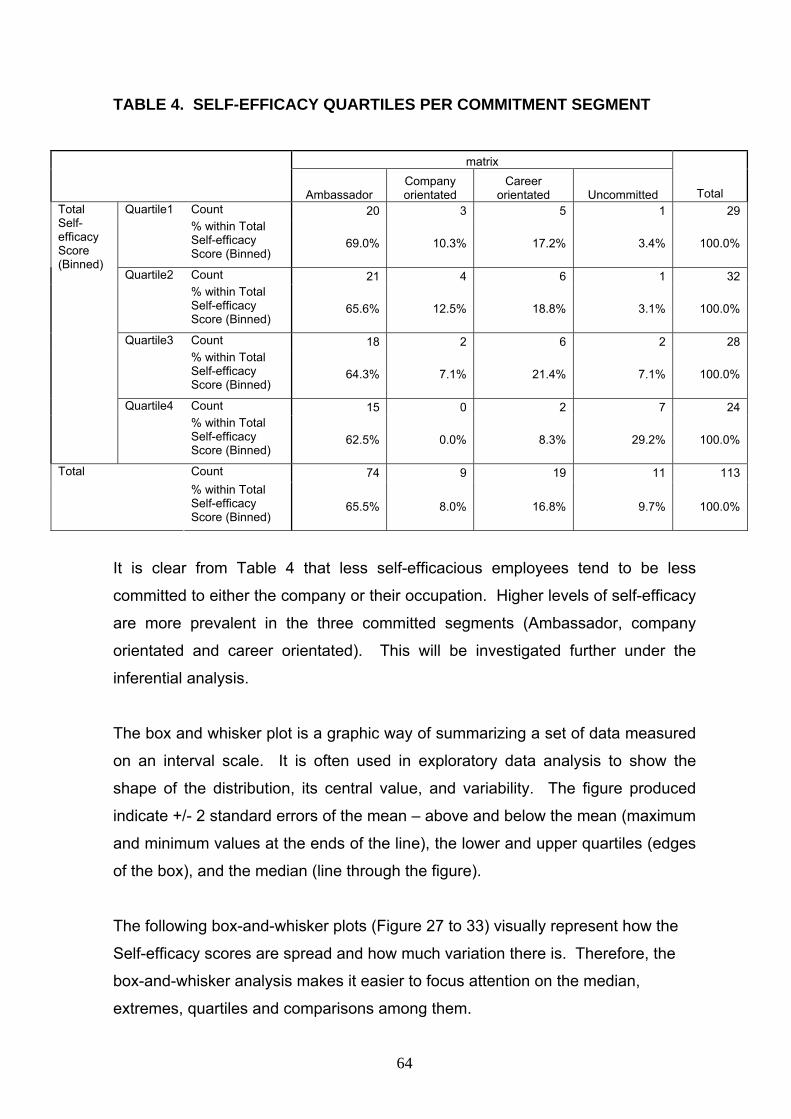
64
TABLE 4. SELF-EFFICACY QUARTILES PER COMMITMENT SEGMENT
matrix
Ambassador Company orientated
Career orientated Uncommitted Total
Count 20 3 5 1 29 Quartile1 % within Total Self-efficacy Score (Binned)
69.0% 10.3% 17.2% 3.4% 100.0%
Count 21 4 6 1 32 Quartile2 % within Total Self-efficacy Score (Binned)
65.6% 12.5% 18.8% 3.1% 100.0%
Count 18 2 6 2 28 Quartile3 % within Total Self-efficacy Score (Binned)
64.3% 7.1% 21.4% 7.1% 100.0%
Count 15 0 2 7 24
Total Self-efficacy Score (Binned)
Quartile4 % within Total Self-efficacy Score (Binned)
62.5% 0.0% 8.3% 29.2% 100.0%
Count 74 9 19 11 113 Total % within Total Self-efficacy Score (Binned)
65.5% 8.0% 16.8% 9.7% 100.0%
It is clear from Table 4 that less self-efficacious employees tend to be less
committed to either the company or their occupation. Higher levels of self-efficacy
are more prevalent in the three committed segments (Ambassador, company
orientated and career orientated). This will be investigated further under the
inferential analysis.
The box and whisker plot is a graphic way of summarizing a set of data measured
on an interval scale. It is often used in exploratory data analysis to show the
shape of the distribution, its central value, and variability. The figure produced
indicate +/- 2 standard errors of the mean – above and below the mean (maximum
and minimum values at the ends of the line), the lower and upper quartiles (edges
of the box), and the median (line through the figure).
The following box-and-whisker plots (Figure 27 to 33) visually represent how the
Self-efficacy scores are spread and how much variation there is. Therefore, the
box-and-whisker analysis makes it easier to focus attention on the median,
extremes, quartiles and comparisons among them.

65
matrixUncommitedCareer orientatedCompany orientatedAmbassador
Tota
l Sel
f Effi
cacy
Sco
re120
100
80
60
40
20
0
Figure 27. Box and Whisker: Total Self-efficacy Score
From Figure 27, there is an indication that the ambassador, company orientated
and career orientated scores can be grouped together and compared with the
uncommitted scores on self-efficacy. The uncommitted scores indicate a lower
level of commitment, whilst the ambassadors, company orientated and career
orientated scores all indicate some higher level of commitment measurement.
High scores on the self-efficacy scale indicate low levels of self-efficacy. The
uncommitted group therefore has the lowest level of self-efficacy. The
ambassadors, company orientated and career orientated scores indicate a higher
level of self-efficacy measurement.

66
TABLE 5. SELF-EFFICACY DIFFERENCES BETWEEN CONVERSION MODEL GROUPS Values
Mean SE score
Ambassador
76.5 Company orientated
72.7 Career orientated
75.2 Uncommitted
87.1 Ambassador
t value
p value
1.14
0.26
0.54
0.59
3.33
0.00*
Company orientated
t value
p value
0.64
0.53
3.26
0.00*
Career orientated
t value
p value
3.04
0.01*
Uncommitted
p≤0.05*
Table 5 displays the t-values which are an indicator of the significance of
differences. The t-value for ambassador is 3.33, company orientated is 3.26 and
career orientated is 3.04. When the means are compared, Table 5 indicates a
significant difference between the means of the uncommitted group (87.1) and the
“committed group” (ambassador (76.5), company orientated (72.7), career
orientated (75.2)).
This finding was further investigated by computing a Chi-Square test (Table 6)
TABLE 6. CHI-SQUARE TEST
Value df Asymp. Sig. (2-
sided) Pearson Chi-Square 16.632 9 0.05
From Table 6 a significant (p≤0,05) association is indicated. Clear differences are
evident from these associations.

67
5.2.1.1 Box and Whiskers analysis of Conversion Model segments on Self-efficacy by demographics Appendix 2 (Cross Tabs by demographic) contains two-way tables reflecting
binned self-efficacy scores within each demographic and commitment segment.
Box plots of the mean SE score by demographic are displayed in Figures 28 to 33.
Figure 28. Box and Whisker: Age
An inspection of Figure 28 indicates little difference between the age groups. Chi-
square tests by specific age group are reflected in the following table.

68
TABLE 7. CHI SQUARE: AGE
Age Value df Asymp. Sig. (2-
sided) Pearson Chi-Square
<20
N of Valid Cases 1 Pearson Chi-Square 18.229 9 0.033
Likelihood Ratio 13.915 9 0.125 Linear-by-Linear Association 5.541 1 0.019
20-29
N of Valid Cases 11 Pearson Chi-Square 8.282 9 0.506
Likelihood Ratio 9.508 9 0.392 Linear-by-Linear Association 0.165 1 0.685
30-39
N of Valid Cases 24 Pearson Chi-Square 8.009 9 0.533
Likelihood Ratio 7.548 9 0.580 Linear-by-Linear Association 2.959 1 0.085
40-49
N of Valid Cases 35 Pearson Chi-Square 25.379 9 0.003
Likelihood Ratio 25.325 9 0.003 Linear-by-Linear Association 0.012 1 0.912
50-59
N of Valid Cases 37 Pearson Chi-Square
60+
N of Valid Cases 5
Significant associations were found in the age groups 20-29 and 50-59.
Employees displaying higher levels of self-efficacy in these age groups were more
likely to fall within the committed segment.

69
Figure 29. Box and Whisker: Gender An inspection of Figure 29 indicates little difference between males and females.
Chi-square tests by gender are reflected in the following table.
TABLE 8. CHI-SQUARE: GENDER
Chi-Square Tests
Gender Value df Asymp. Sig. (2-
sided) Pearson Chi-Square 14.365 9 0.110
Likelihood Ratio 13.899 9 0.126 Linear-by-Linear Association 1.300 1 0.254
male
N of Valid Cases 81 Pearson Chi-Square 14.934 9 0.093
Likelihood Ratio 15.468 9 0.079 Linear-by-Linear Association 1.898 1 0.168
female
N of Valid Cases 32
Chi-square tests indicate no significant association between self-efficacy and
commitment by gender.

70
Figure 30. Box and Whisker: Population Group (combined) Table 9 displays the association between self-efficacy and commitment by
population group.

71
TABLE 9. CHI-SQUARE: POPULATION GROUP
Population Group Value df Asymp. Sig. (2-
sided) Exact Sig. (2-
sided) Exact Sig. (1-
sided) Pearson Chi-Square 2.000 1 0.157
Continuity Correction 0.000 1 1.000
Likelihood Ratio 2.773 1 0.096 Fisher's Exact Test 1.000 0.500
Linear-by-Linear Association 1.000 1 0.317
Asian
N of Valid Cases 2 Pearson Chi-Square 3.750 1 0.053
Continuity Correction(a) 1.276 1 0.259
Likelihood Ratio 4.463 1 0.035 Fisher's Exact Test 0.133 0.133
Linear-by-Linear Association 3.375 1 0.066
Black
N of Valid Cases
10
Pearson Chi-Square 12.728 9 0.175
Likelihood Ratio 13.608 9 0.137 Linear-by-Linear Association 0.752 1 0.386
White
N of Valid Cases 101
Chi-square tests indicate no significant association between self-efficacy and
commitment by population group.

72
Figure 31. Box and Whisker: Monthly Household Income An inspection of Figure 31 indicates little difference between income groups. Chi-
square tests by monthly household income group are reflected in the following
table.
TABLE 10. CHI-SQUARE: HOUSEHOLD INCOME
Monthly HH Income Value df
Asymp. Sig. (2-sided)
Pearson Chi-Square 19.747 9 0.020
Likelihood Ratio 15.425 9 0.080 Linear-by-Linear Association 2.004 1 0.157
<10
N of Valid Cases 17 Pearson Chi-Square 11.534 9 0.241
Likelihood Ratio 14.535 9 0.105 Linear-by-Linear Association 0.218 1 0.641
10-25
N of Valid Cases 29 Pearson Chi-Square 9.174 9 0.421
Likelihood Ratio 10.085 9 0.344 Linear-by-Linear Association 0.369 1 0.543
25-40
N of Valid Cases 33

73
Monthly HH Income Value df
Asymp. Sig. (2-sided)
Pearson Chi-Square 11.333 9 0.254
Likelihood Ratio 13.781 9 0.130 Linear-by-Linear Association 1.048 1 0.306
40+
N of Valid Cases 34
It is evident from Table 10 that employees with a household income of less than
R10 000 display an association between self-efficacy and employee commitment.
Figure 32. Box and Whisker: Tenure An inspection of Figure 32 indicates differences between tenure groups. Chi-
square tests by tenure group are reflected in the following table.
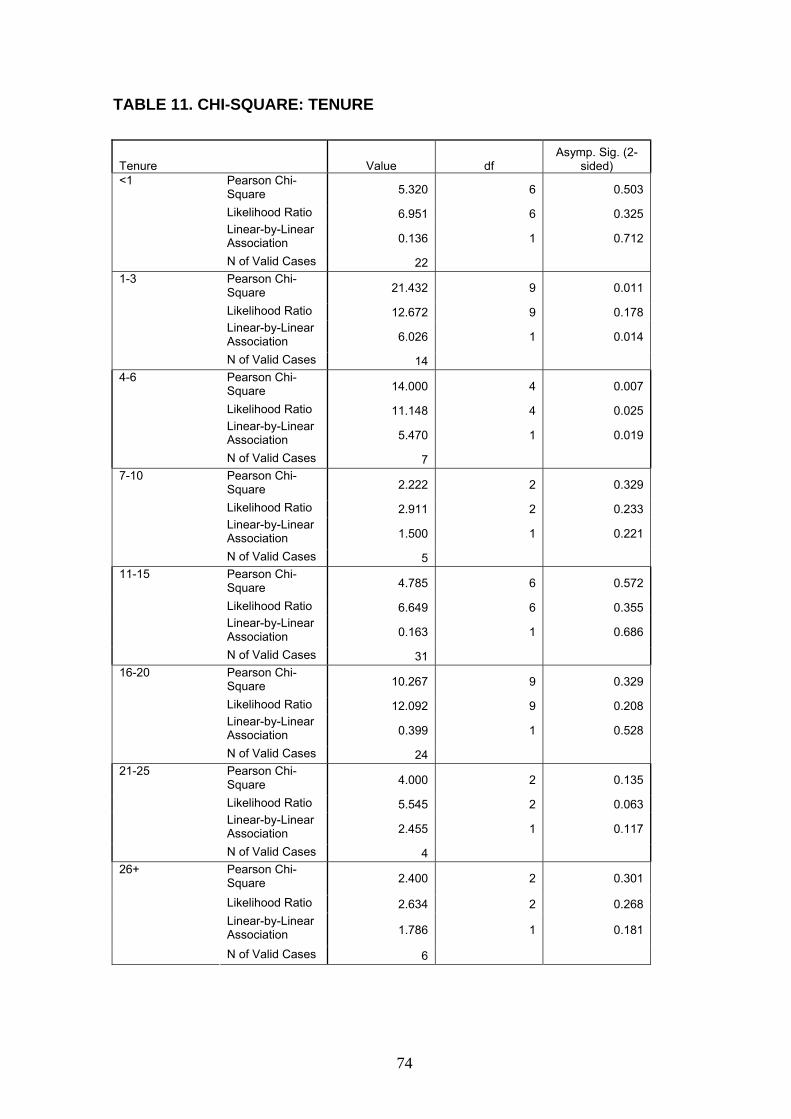
74
TABLE 11. CHI-SQUARE: TENURE
Tenure Value df Asymp. Sig. (2-
sided) Pearson Chi-Square 5.320 6 0.503
Likelihood Ratio 6.951 6 0.325 Linear-by-Linear Association 0.136 1 0.712
<1
N of Valid Cases 22 Pearson Chi-Square 21.432 9 0.011
Likelihood Ratio 12.672 9 0.178 Linear-by-Linear Association 6.026 1 0.014
1-3
N of Valid Cases 14 Pearson Chi-Square 14.000 4 0.007
Likelihood Ratio 11.148 4 0.025 Linear-by-Linear Association 5.470 1 0.019
4-6
N of Valid Cases 7 Pearson Chi-Square 2.222 2 0.329
Likelihood Ratio 2.911 2 0.233 Linear-by-Linear Association 1.500 1 0.221
7-10
N of Valid Cases 5 Pearson Chi-Square 4.785 6 0.572
Likelihood Ratio 6.649 6 0.355 Linear-by-Linear Association 0.163 1 0.686
11-15
N of Valid Cases 31 Pearson Chi-Square 10.267 9 0.329
Likelihood Ratio 12.092 9 0.208 Linear-by-Linear Association 0.399 1 0.528
16-20
N of Valid Cases 24 Pearson Chi-Square 4.000 2 0.135
Likelihood Ratio 5.545 2 0.063 Linear-by-Linear Association 2.455 1 0.117
21-25
N of Valid Cases 4 Pearson Chi-Square 2.400 2 0.301
Likelihood Ratio 2.634 2 0.268 Linear-by-Linear Association 1.786 1 0.181
26+
N of Valid Cases 6

75
A significant association between self-efficacy and commitment were found
amongst 1 to 6 year tenure groups.
Figure 33. Box and Whisker: Qualification An inspection of Figure 33 indicates little difference between qualification groups.
Chi-square tests by qualification group are reflected in the following table.
TABLE 12. CHI-SQUARE: QUALIFICATION
Qualification Value df Asymp. Sig. (2-
sided) Pearson Chi-Square 16.000 9 0.067
Likelihood Ratio 18.729 9 0.028 Linear-by-Linear Association 6.607 1 0.010
Matric
N of Valid Cases 12 Pearson Chi-Square 8.417 9 0.493
Likelihood Ratio 10.072 9 0.345 Linear-by-Linear Association 0.869 1 0.351
Post Matric
N of Valid Cases 39

76
Qualification Value df Asymp. Sig. (2-
sided) Pearson Chi-Square 7.065 6 0.315
Likelihood Ratio 6.888 6 0.331 Linear-by-Linear Association 0.574 1 0.449
Degree
N of Valid Cases 33 Pearson Chi-Square 5.915 6 0.433
Likelihood Ratio 6.636 6 0.356 Linear-by-Linear Association 0.028 1 0.867
Hons
N of Valid Cases 13 Pearson Chi-Square 9.697 9 0.376
Likelihood Ratio 11.052 9 0.272 Linear-by-Linear Association 5.010 1 0.025
Masters/Doc
N of Valid Cases 16 According to the analysis reflected in Table 12 no significant association were
indicated.
Figures 28 to 33 indicate that 20-29 and 60+ age groups display higher levels of
variance compared to the other age groups. Asian, Coloured and Black
combined, also display more variance in SE responses.
In order to investigate the magnitude of the mean differences displayed in the
above analysis, ANOVA one way analysis was used.
5.2.2 ANOVA one way analysis
In general, the purpose of analysis of variance (ANOVA) is to test for significant
differences between means. The assumption with a t-test or ANOVA, is that the
distribution of the sample means is normally distributed. The ANOVA is based on
the fact that two independent estimates of the population variance can be
obtained from the sample data. A ratio is formed for the two estimates, where:
One is sensitive to treatment and error between groups estimate, and the other to
error within group estimate.

77
For the purpose of this study the one-way ANOVA analysis are used, as there is a
single independent variable (employee commitment) with several levels and
multiple observations at each level.
Table 13 reflects the self-efficacy mean scores by employee commitment group.
TABLE 13.: TOTAL SELF-EFFICACY SCORE
95% Confidence Interval for
Mean
N Mean Std.
Deviation Std. Error
Lower Bound
Upper Bound Minimum Maximum
Ambassador 74 76.51 9.684 1.126 74.27 78.76 47 95Company orientated 9 72.67 8.515 2.838 66.12 79.21 56 84Career orientated 19 75.16 10.106 2.319 70.29 80.03 54 95Uncommitted 11 87.09 10.784 3.251 79.85 94.34 70 111Total 113 77.01 10.264 0.966 75.10 78.92 47 111
Levene's test is an inferential statistic used to assess the equality of variance in
different samples. Some common statistical procedures assume that variances of
the populations from which different samples are drawn, are equal. Levene's test
assesses this assumption. It tests the null hypothesis that the population
variances are equal. If the resulting p-value of Levene's test is less than some
critical value (typically .05), the obtained differences in sample variances are
unlikely to have occurred based on random sampling. Thus, the null hypothesis of
equal variances is rejected and it is concluded that there is a difference between
the variances in the population. Levene’s Statistic is reflected in Table 14.
TABLE 14. TEST OF HOMOGENEITY OF VARIANCES Total Self-efficacy Score
Levene Statistic df1 df2 Sig. 0.020 3 109 0.996
Levene’s statistic confirms no significant difference between the variances of
scores of the ambassador, company orientated, career orientated and
uncommitted employees, with a 0.996 probability. Based on this finding and the t-
tests reported on in the previous section, it was decided to collapse the three

78
“committed segments” (ambassador, company oriented and career oriented). This
collapsed group, together with the uncommitted group were then subjected to a
one-way analysis of variance.
The following table indicate the results of the one way analysis of variance.
TABLE 15. ANOVA ONE WAY ANALYSIS OF VARIANCE
Sum of
Squares df Mean Square F Sig. Between Groups 1,371.069 3 457.023 4.777 0.004Within Groups 10,427.922 109 95.669 Total 11,798.991 112
The significance of the F value (4.777) indicates that the average self-efficacy
across the groups is different. From Table 15 the indication is clear that
uncommitted employees have a lower level of self-efficacy.
5.3 DISCRIMINANT ANALYSIS
Discriminant analysis is used to model the value of a categorical dependent
variable based on its relationship to one or more predictors. Given a set of
independent variables, discriminant analysis attempts to find linear combinations
of those variables that best separate the groups of cases.
In Table 16 the independent or predictor variables are displayed and their
significance in discriminating between the committed and uncommitted dependant
groups.

79
TABLE 16. TEST OF EQUALITY OF GROUP MEANS
Wilks'
Lambda F df1 df2 Sig. I find it extremely unpleasant to be afraid 0.987 1.419 1 111 0.236I sometimes avoid difficult tasks 0.999 0.119 1 111 0.731I am a very determined person. 0.959 4.707 1 111 0.032I set my mind to a task almost nothing can stop me.
0.878 15.458 1 111 0.000
I have a lot of self-confidence 0.938 7.321 1 111 0.008I am at my best when I am really challenged 0.963 4.258 1 111 0.041I believe that it is shameful to give up something I started
0.969 3.537 1 111 0.063
I have more than the average amount of self-determination 0.879 15.308 1 111 0.000
Sometimes things just don't seem worth the effort. 0.974 2.989 1 111 0.087
I would rather not try something that I'm not good at. 1.000 0.008 1 111 0.928
I have more fears than most people. 0.997 0.353 1 111 0.554I find it difficult to take risks. 0.994 0.625 1 111 0.431People have a lot of problems but none they will not eventually be able to solve 0.998 0.259 1 111 0.612
I can succeed in almost any endeavour to which I set my mind. 0.945 6.466 1 111 0.012
Nothing is impossible if I really put my mind to it 0.898 12.657 1 111 0.001I feel I am better off to rely on myself for a solution when things are looking bad 0.998 0.167 1 111 0.683
When put to the test I would remain true to my ideas. 0.953 5.449 1 111 0.021
If a person believes in himself, he/she can make it in the world. 0.930 8.309 1 111 0.005
I feel that chances are very good that I can achieve my goals in life. 0.939 7.199 1 111 0.008
In general I agree that "if first I do not succeed, I'll try again". 0.886 14.287 1 111 0.000
When I have difficulty getting what I want, I try harder 0.899 12.430 1 111 0.001
I excel at few things. 1.000 0.025 1 111 0.874I have often burned the midnight oil to finish a task before the deadline 0.977 2.622 1 111 0.108
I have more willpower than most people 0.942 6.828 1 111 0.010 I become frustrated when I experience physical discomfort
0.996 0.493 1 111 0.484
Nothing is worth subjecting myself to pain for, if I can avoid it. 0.998 0.204 1 111 0.653
I would endure physical discomfort to complete a task because I just don't like to give up. 0.966 3.961 1 111 0.049
The test of equality of group means measure each independent variable’s
potential. Each test displays the result of a one-way ANOVA for the independent
variable (self-efficacy) using the group variable as the factor. The higher the F
score, the bigger the difference between the groups. Table 16 concludes that the

80
following items indicate a level of significance in discriminating between the
groups:
• If I set my mind to a task almost nothing can stop me.
• I have more than the average amount of self-determination
• Nothing is impossible if I really put my mind to it
• In general I agree that "if first I do not succeed, I'll try again".
• When I have difficulty getting what I want, I try harder
5.3.1 Stepwise Discriminant Analysis The most common application of discriminant function analysis is to include many
measures in the study, in order to determine the ones that best discriminate
between groups. The stepwise method is often useful, as it selects the most
predictive variables to use. It starts with a model that does not include any of the
predictor variables. At each step the predictor with the highest F value that
exceeds the entry criteria is added. The variables left out of the analysis at the
last step all have F values smaller than 3.84.
The stepwise analysis is appended as Appendix 3. From the F values, the
following items could be identified as important items for discrimination:
• If I set my mind to a task almost nothing can stop me
• I have more than the average amount of self-determination
• In general I agree that "if first I do not succeed, I'll try again".
5.4 CHAPTER SUMMARY
In this chapter the results of the empirical study were reported. The research aims
as formulated in Chapter 3 were investigated according to the results of the
empirical study. The results of and considerations regarding the empirical study
were also considered. In Chapter 6 the conclusions of the research will be
discussed, after which recommendations will be made.

81
CHAPTER 6
CONCLUSIONS, LIMITATIONS AND RECOMMENDATIONS
6 CONCLUSIONS, LIMITATIONS AND RECOMMENDATIONS 6.1 INTRODUCTION
To be able to address the general objective of the study, namely, to investigate
the influence of self-efficacy on employee commitment, a literature review was
conducted and reported regarding an overview of employee commitment and its
measurement, as well as self-efficacy and its measurement. This was discussed
in chapters two and three. In chapter four the empirical part of the research
process was outlined, focusing on the gathering of the data and the statistical
techniques that were used to analyse the data. The statistical results were
reported in chapter five. Chapter 6 aims to present conclusions. Reference will
be made to the limitations of the research, and to offer recommendations
regarding additional research.
6.2 CONCLUSIONS
This dissertation focused on the possible relationship between self-efficacy and
employee commitment. Conclusions are now formulated regarding the
theoretical and the empirical objectives.
6.2.1 Literature Review
The conclusions below can be stated regarding the theoretical aims of the
research:
The first aim, namely to conceptualise employee (work and organisational)
commitment and self-efficacy was achieved in Chapter 2 and 3.

82
In terms of this conceptualisation it was identified that commitment is not a uni-
dimensional construct. Satisfaction or loyalty is not sufficient in predicting
commitment. Psychological commitment should also be taken in account.
Hofmeyr and Rice (2000) indicate the concept of commitment is four folded:
• It accounts for an employee’s personal involvement in a specific decision,
• The attraction of alternative options,
• The degree of ambivalence and
• Employee satisfaction.
Commitment changes over time as the needs and circumstances of the
employees change. When measuring commitment in employees, it is important
to measure both how committed employees are to the job they do as well as how
committed they are to the organisation that they work for. Maintaining employee
commitment in the business environment is probably one of the most important
challenges the new world of work brings.
Positive well-being requires an optimistic sense of personal self-efficacy.
Perceived self-efficacy can be defined as a person’s beliefs about his/her
capabilities to organise or execute the necessary actions required to manage
prospective situations (Bandura, 1986). There are four ways that self-efficacy
can be learned, namely mastery experience, vicarious experiences, social
persuasion and physical/ affective status. Efficacious people choose to
repeatedly perform more challenging tasks.
From the literature it was demonstrated that the self-efficacy construct is a way of
conceptualising one of the personal qualities of individuals who seem particularly
effective at responding to the demands of life. It displays a positive outlook,
strong belief in one’s capabilities and commitment to the goals and aspirations
one sets for oneself. Self-efficacy stresses the importance of being a participant
in shaping one’s own destiny and one’s daily experience. It represents a

83
motivational element regarding the areas of life that make cognitive and
emotional sense.
The literature study reflected that a theoretical relationship exists between self-
efficacy and employee commitment. Self-efficacy is a construct that exhibits
positive organisational characteristics like orientation to work, job satisfaction and
personal commitment.
6.2.2 Empirical Study
The first empirical aim, namely to measure and investigate a possible
relationship between self-efficacy and employee commitment, was achieved in
Chapter 4 and 5. Biographical variables, as well as certain motivators (hygiene
factors and true motivators) do play a role in employee commitment.
Measured against the results published in other research studies, the employees
in this study reflect a high level of self-efficacy and high levels of employee
commitment.
The correlations carried out showed that employees with high levels of self-
efficacy possess higher levels of employee commitment. However a significant
correlation could not be established amongst all commitment subgroups.
Collapsing the tree commitment subgroups (ambassador, career oriented and
company oriented) did however result in a significant correlation.
The results of the study confirmed that employee commitment is a multifaceted
concept, and that its components display some significant relationships with the
self-efficacy constructs. The practically significant relationships are those
between the ambassadors, company and organisational orientated employees
versus uncommitted employees.

84
According to the demographic analysis there is a significant association between
the different age groups, population groups and income groups. Employees with
a less than 6 year tenure do not indicate a relationship between involvement and
commitment. Results indicate that the White population group tend to have
higher self-efficacy levels than the combined group (Asian and Blacks).
With regard to the predictive value of self-efficacy on employee commitment, the
results of this study partly support the stated predictions that self-efficacy
displays predictive value concerning employee commitment. An individual who
has a high level of self-efficacy, is more likely than someone with a low level of
self-efficacy, to be motivated, to be spurred on to great efforts, to continue in his/
her efforts in the face of adversity. Such a person, who is committed in himself,
is more likely to be committed to the organisation.
6.3 LIMITATIONS OF THE RESEARCH
This research project is not without limitations. With regard to the literature
review, limited literature seems to exist on the relationship between self-efficacy
and employee commitment. This lack of information limited the determination of
a theoretical relationship.
Due to the relatively small sample size, limited conclusions are possible. The
sample size also appears to be rather homogenous. Thus in terms of the South
African context the sample group was not very diverse. Insofar as biographical
type variables influence people’s commitment to the organisation, their self-
efficacy, the present study’s results were inadequate.
Only self-report measures were used, which may affect the validity of the results.
There are, however, indications of both statistical and practical significance of
results. The findings of this project are consistent with those of other similar

85
research projects based on larger sample sizes (Global Employee Commitment
Report, 2005).
The results in this project are from one single organisation and can therefore not
be generalised for other organisations. The normality of the data was tested and
could not be confirmed as a normal distribution of data. This might be due to the
fact that 18% of the sample group falls within Top Management.
The survey was handed out to Top Management as part of a wellness program
and Top Management might have manipulated data to improve their perception
of psychological wellness.
Another limitation affecting the findings is the time of year that the survey was
conducted. It was done in December 2006 when most employees are either on
leave or getting ready to go on leave. December is also the month in which most
employees receive their annual bonus and remuneration issues might be at a
lower level compared to other months.
6.4 RECOMMENDATIONS
This study generated several application-oriented suggestions as well as
suggestions for further research. The following recommendations based on the
results of this study can be formulated for the sugar manufacturing organisation:
• It could recruit and select individuals who display a high level of self-efficacy
as potential employees. However, before the Company begins selecting
potential employees only on the basis of these characteristics, more research
is required.

86
• It can use employees’ profiles on the Employee Commitment Matrix to
discuss the breadth and levels of self-efficacy as to gain a broader
perspective of available options for improvement.
• It can contribute to the development of its employees’ employee commitment
by providing training on the self-efficacy dimensions that exhibit a significant
correlation with employee commitment.
This is also relevant to the application of leadership development, with its current
focus on coaching and mentoring.
The following recommendations for further research can be made, based on the
empirical results of this study:
• Perceived levels of self-efficacy may be regarded as a health-related variable
falling within the view of positive psychology, and as such deserve to be
explored further in future research so as to add to this relatively new body of
research.
• Self-efficacy is key to achieving the fortuitous ends envisioned by the positive
psychology movement such as authentic happiness, commitment, self-worth,
and creativity. The relationship between self-efficacy and other positive
psychology variables should be researched in order to determine such
relationships.
It is recommended that the other psycho-fortological constructs, namely: sense of
coherence, locus of control, hardiness, potency and learned resourcefulness
should also be considered, to determine the degree to which this information can
contribute towards compiling a more holistic approach toward employee
commitment.

87
Additional research is required to examine the relationships between self-efficacy
and employee commitment. By enhancing the size of the sample group, more
convincing results may be obtained.
Future research should focus on qualitative research so as to provide more
information on the nature of self-efficacy. Thus richer and more diverse material
for analysis will be obtained. This can be done by administering an open-ended
questionnaire to subjects in order to gather statements on the possible sources
of a positive level of self-efficacy. These statements can then be analysed
according to their content to arrive at additional sources of perceived high self-
efficacy levels.
The multi-faceted employee commitment construct should be further analysed
and studied so as to put an end to the domination of the attitudinal approach to
studying employee commitment. From this study it is clear that loyalty,
satisfaction and commitment are three separate constructs.
To enhance external validity, future research efforts should focus on obtaining a
larger and more representative sample.
Future research might also explore the possibility of the existence self-efficacy
profiles within different occupational groups or professions. For example, does
the profile of an engineer differ from that of a training consultant or an executive?
6.5 CHAPTER SUMMARY Within this final chapter, conclusions were reached in terms of both the literature
review and the empirical study, followed by a consideration of the limitations to
the research. This chapter ended with a few recommendations, derived from this
investigation.

88
REFERENCES
Angle, H. L. & Lawson, M. (1993). Changes in affective and continuance
commitment in times of relocation. Journal of Business Research, 26, 3-15.
Antonovsky, A. (1979). Health, stress, and coping: new perspectives on mental
and physical well-being. San Francisco: Jossey-Bass.
Antonovsky, A. (1987). Unraveling the mystery of health: how people manage
stress and stay well. San Francisco: Jossey-Bass.
Aranya, N., & Ferris, K. R. (1983). Organizational-professional conflict among
U.S. and Israeli professional accountants. Journal of Social Psychology, 119,
153-161.
Bandura, A. (1977). Self-efficacy: Toward a unifying theory of behavioral change, Psychological Review, 84, 191-215.
Bandura, A. (1977a). Self-efficacy: Toward a unifying theory of behavioral
change. Psychological Review, 84, 191-215.
Bandura, A. (1982). Self-efficacy mechanism in human agency. American
Psychologist, 37(2), 122-147.
Bandura, A. (1986). Self-efficacy beliefs in human functioning form Social
Foundations of Thought and Action, retrieved from world wide web on 24
September 2005: http://www.des.emory.edu/mfp/effpassages.html
Bandura, A. (1989). Social Cognitive Theory. In R. Vasta (Ed). Annals of child
development. Vol 6. Six theories of child development (pp.1-60). Greenwich,
CT: JAI Press.

89
Bandura, A. (1994). Self-efficacy. In V.S. Ramachaudran (Ed.), Encyclopedia
of human behaviour (Vol. 4, pp. 71-81). New York: Academic Press. (Reprinted
in H. Friedman [Ed.], (1998). Encyclopedia of mental health. San Diego:
Academic Press
Bandura, A. (1997). Self-efficacy: The exercise of self-control. New York: W.H.
Freeman and Company.
Bandura, A. (1997a). Self-efficacy in changing societies. New York: Cambridge
University Press.
Bandura , A., & Adams , N. E. (1977 ). Analysis of self-efficacy theory of
behavioral change. Cognitive Therapy and Research, 1, 287-308.
Bandura, A., Adams, N.E. & Beyer, J. (1977). Cognitive Processes mediating
change. Journal of Personality and Social Psychology, 35(3), 125-39.
Bandura, A., Adams, N.E., Hardy, A. B., & Howells, G.N. (1980). Test of the
generality of self-efficacy theory. Cognitive Therapy and Research, 4, 39-66.
Bandura, A. & Schunk, D.H. (1981). Cultivating competence, self-efficacy, and
intrinsic interest through proximal self-motivation. Journal of Personality and
Social Psychology, 41, 586-598.
Baumeister, R.F. (1991). Meaning of Life. New York: The Guildford Press.
Blau, G. (1989). Testing the generalizability of a career commitment measure
and its impact on employee turnover. Journal of Vocational Behavior, 35, 88-
103.

90
Bouffard-Bouchard, T. (1990). Influence of self-efficacy on performance in a
cognitive task. Journal of Social Psychology, 130, 353-363.
Brown, S. (1996). A meta-analysis and review of organizational research on job
involvement. Psychological Bulletin, 120 (2), 235-255.
Carmines E.G. & Zeller, R.A. (1979). Reliability and validity assessment,
Newbury Park CA.: Sage.
Chambliss, C.A. & Murray, E.J. (1979). Efficacy attribution, locus of control, and
weight loss. Cognitive therapy research, 3(4), 349-353.
Chow, l.H. (1994). Organisational commitment and career development of
Chinese managers in Hong Kong and Taiwan. International Journal of Career
Management, 16 (4), 3-9.
Coetzee, S. & Cilliers, F. (2001). Psychofortology: Explaining Coping Behaviour
in Organisations, Society for Industrial and Organisational Psychology Inc.
Retrieved from the world wide web on 19 September 2005:
http://www.siop.org/TIP/backissues/TipApr01/08Coetzee.html
De Klerk, J.J., Boshoff, A.B. & van Wyk, R. (2004). Workwellness—does
workplace spirituality have a role to play? Paper presented at the 2 South African
Work Wellness Conference, Potchefstroom, South Africa.
Diener, E. (2000). Subjective Well-Being: The science of happiness and a
proposal for a national index. American Psychologist, 55 (1), 34-43.
Dodd, J. (2002). Loyalty and Commitment – Not such a subtle difference. New
Zealand Direct Marketing Association Inc., 87-97.

91
Eden , D. (1988). Pygmalion, goal setting, and expectancy: Compatible ways to
raise productivity. Academy of Management Review, 13, 652-666.
Eden , D. & Zuk , Y. ( 1995 ). Seasickness as a self-fulfilling prophecy: Raising
self-efficacy to boost performance at sea. Journal of Applied Psychology, 80,
628-635.
Edwards, M.R. (2005) Organizational identification: A conceptual and
operational review. International Journal of Management Reviews 7(4), 207–
230.
Emerson, R. M. (1976). Social Exchange Theory. Annual Review of Sociology,
2, 335-362.
Ethical Rules of Conduct for Practitioners registered under the Health
Professions Act, 1998 (Act. No. 56 of 1974).
Feltz, D.L. (1982). The Effects of Age and Number of Demonstrations on
Modeling of Form and Performance. Research Quarterly for Exercise and Sport,
53 (4) 291-296.
Firestone, W.A. & Pennell, J.R. (1993). Teacher commitment, working
conditions, and differential incentive policies. Review of Educational Research,
63, 489.
Frankl, V.E. (1963). Man’s search for meaning. New York: Pocket Books.
Frankl, V.E. (1969). The will to meaning. New York: New American Library.
Gardner, D.G. & Pierce, J.L. (1998). Self-Esteem and Self-Efficacy within the
Organizational Context. Group & Organization Management, 23, (1), 48-70.

92
Gist, M. E. (1987). Self-efficacy: Implications for organizational behavior and
human resource management. Academy of Management Review, 12, 472-485.
Giesbrecht, H.A. (1997). Meaning as a predictor of work stress and job
satisfaction. Unpublished Masters thesis, Trinity Western University, Langley,
BC.
Global Employee Commitment Report [Electronic presentation]. (2002).
London: Taylor Nelson Sofres.
Hatcher, L. (1994). A Step-by-Step Approach to Using the SAS System for
Factor Analysis and Structural Equation Modeling. SAS Publishing.
Hofmeyr, J. (1989). Mobilising Values to Slice up the Market, ESOMAR
congress, Vienna, 107-129.
Hofmeyr, J. (1990). The Conversion Model - A New Foundation for Strategic
Planning in Marketing, ESOMAR congress, Athens.
Hofmeyr, J. (1998). The Conversion Model – A new foundation for strategic
planning in marketing. Retrieved from the word wide web on 19 August 2006:
http://www.conversionmodel.html
Hofmeyr, J & Rice, B. (2000). Commitment-led marketing. West Sussex: John
Wiley & Sons.
Jamieson, D. & Richards, T. (1996). Committed Employees – The Key Focus in
Strategic Development. MRS Conference, United Kingdom.

93
Jerusalem, M. & Schwarzer, R. (1986). Anxiety and self-concept as
antecedents of stress and coping: A longitudinal study with German and Turkish
adolescents. Personality-and-Individual-Differences, 10(7), 785-792.
Jerusalem, M., & Schwarzer, R. (1992). Self-efficacy as a resource factor in
stress appraisal processes. In R. Schwarzer (Ed.), Self-efficacy: Thought control
of action (pp.195-213). Washington, DC: Hemisphere.
Judge , T.A., Locke, E.A., Durham, C.C., & Kluger, A.N. (1998). Dispositional
effects on job and life satisfaction: The role of core evaluations. Journal of
Applied Psychology, 83, 17-34.
Kanter, R.M. (1968). Commitment and Social Organisation: A study of
commitment mechanisms in Utopian communities, American Sociological
Review, [ASR] 33, 499-517.
Kelly, G.A. (1955). Principles of Personal Construct Psychology. New York:
Norton.
Kline, R. B. (1998). Principles and practices of structural equation modeling.
New York: Guilford Press.
Kobasa, S. C. (1979). Personality and resistance to illness. American Journal
of Community Psychology, 7, 413-423.
Kreitner, R. & Kinicki, A. (1995). Organisational Behavior (3rd ed.). Chicago:
Irwin.
Lee, C., & Bobko, E (1994). Self-efficacy beliefs: Comparison of five measures.
Journal of Applied Psychology, 79, 364-369.

94
Leganger, A., Kraft, P., Røysamb, E. (2000). Perceived self-efficacy in health
behaviour research: Conceptualisation, measurement and correlates.
Psychology & Health, 15(1), 51-69.
Lemke, E. & Wiersma, W. (1976). Principles of psychological measurement.
Chicago: Rand McNally College Publishing Company.
Locke, E, A., Frederick, E., Lee, C., & Bobko, P. (1984). Effect of self- efficacy,
goals, and task strategies on task performance. Journal of Applied Psychology,
69, 241-251.
Lok, P. & Crawford, J. (1999). The relationship between commitment and
organizational culture, subculture, leadership style and job satisfaction in
organizational change and development. Leadership & Organization
Development Journal, 7, 365-374.
Lopez, S.J. & Snyder, C.R. (2003). Positive psychology assessment: a
handbook of models and measures. Washington: APA.
Luszcszynska, A., Schunk, D. H., Schwarzer, R. (2005). The General Self-
efficacy Scale: Multicultural validation studies. The Journal of Psychology, 139,
439-457.
Maslow, A.H. (1965). Motivation and Personality. New York: Harper.
Maslow, A.H. (1971). The farther reaches of human nature. New York: Viking.
Mathieu, J.E. & Zajac, D.M. (1990). A review and meta-analysis of the
antecedents, correlates, and consequences of organizational commitment.
Psychological Bulletin, 108 (2), 171-194.

95
Maurer, T.J. & Pierce, H.R. (1998). A comparison of Likert scale and traditional
measures of self-efficacy. Journal of Applied Psychology, 83 (22), 324-329.
Meyer, J.P. & Allen, N.J. (1991). A three-component conceptualisation of
organizational cornrnitrnent. Human Resource Management Review, 1, 61-89.
Meyer, J.P., & Allen, N.J. (1997). Commitment in the workplace: Theory,
research and application. Newbury Park, CA: Sage.
Meyer, J.P., Allen, N.J., & Smith, C.A. (1993). Commitment to organisations and
occupations: Extention and test of a three-component conceptualisation.
Journal of Applied Psychology, 78, 538-551.
Meyer, J.P. & Herscovitch, L. (2001). Commitment in the workplace: Toward a
general rnodel. Human Resources Review, 11, 299-326.
Miceli, M. P., & Mulvey, P. W. (2000). Consequences of satisfaction with pay
systems: Two field studies. Industrial Relations, 39, 62-87.
Miner, J.B. (2003). Organisational behaviour theories: A quantitative review.
Acadamy of Management Learning and Education, 2, 250-268.
Morris, J.H. & Sherman, J. (1981). Generalizability of an organisational
commitment model. Academy of Management Review, 8(3), 486-500.
Mouton, J. & Marais, H.C. (1994). Basic concepts in the methodology of the
social sciences. Pretoria: HSRC Publishers.
Mowday, R.T., Porter, LW. & Steers, R.M. (1982). Employee organizational
linkages. New York: Academic Press.

96
Mowday, R.T., Steers, R.M. & Porter, L.W. (1979). The measurement of
organizational commitment. Journal of Vocational Behavior, 14, 224-247.
Mueller, C.W., Wallace, J.E. & Price, J.L. (1992). Employee comrnitrnent:
Resolving some issues. Work and Occupations, 19, 2 11-236.
Myers, J.E., Sweeney, T.J. & Witmer, J.M. (2000). The wheel of wellness
counseling for wellness: A holistic model for treatment planning. Journal of
Counseling and Development, 78, 25 1-266.
Nunnally, J.C. (1978). Psychometric Theory. McGraw-Hill: New York
Nunnally, J.C. & Bernstein, l.H. (1994). Psychometric theory(3rd ed.). New York:
McGraw-Hill.
O’Connor, K. & Chamberlain, K. (1996). Dimensions of life meaning: A
qualitative investigation at mid-life. British Journal of Psychology, 87, 461-477.
Opperman, M. (1995). E-mail surveys, potentials and pitfalls. Marketing
Research. 7(3), 29-33.
O’Reilly, C.A., & Chatman, J. (1986). Organisational commitment and
psychological attachment: The effects of compliance, identification, and
internalisation on prosocial behaviour. Journal of Applied Psychology, 71, 492-
499.
Pajare, F. (1996). Self-efficacy beliefs in academic settings. Review of
Educational Research, 66, 543-578.
Palombi, B.J. (1992). Psychometric properties of wellness instruments. Journal
of Counsellng and Development, 71, 221-226.

97
Peterson, C. (2000). The future of optimism. American Psychologist, 55 (1), 44-
55.
Pintrich, P. R. & Schunk, D. H. (2002). Motivation in education: Theory,
research, and Applications (2nd ed.). Upper Saddle, NJ: Prentice-Hall, Inc.
Porter, L.W., Crampton, W.J., & Smith, F.J. (1976). Organisational commitment
and managerial turnover: A longitudinal study. Organisational Behavior and
Human Performance, 15, 87-98.
Porter, L.W., Steers, R., Mowday, R. & Boulian, P. (1974). Organisational
commitment, job satisfaction and turnover among psychiatric technicians.
Journal of applied Psychology, 59, 603-609.
Powell, D.M., & Meyer, J.P. (2004). Side-bet theory and the three-component
model of organisational commitment. Journal of Vocational Behaviour, 65, 157-
177.
Reker, G.T. & Wong, P.T.P. (1988). Aging as an individual process: Toward a
theory of personal meaning. In J.E. Birren & V.L. Bengston (Eds), Emergent
theories of aging (pp. 214-246). New York: Springer.
Rice, J. & Hofmeyr, J. (1990). Applying Conversion Theory to Marketing,
ESOMAR congress, Amsterdam, 51-69.
Richards, P.S. & Bergin A.E. (2005). A sptitual strategy for counseling and
psychotherapy. Washington DC: American Psychological Association.
Rimm, H. & Jerusalem, M. (1999). Adaptation and validation of an estonian
version of the general self-efficacy scale (ESES), Anxiety, Stress & Coping, 12
(3), 329 – 345.

98
Rothmann, S. (2001). Sense of coherence, locus of control, self-efficacy and job
satisfaction. Journal of Economic and Management Sciences, 5(1), 41-65.
Rothmann, S. & Malan, H. (2003). Sense of Coherence, self-efficacy, locus of
control and burnout amongst social workers. SA Journal of Industrial
Psychology, 29 (4), 43-51.
Sadri, G., & Robertson, I.T. (1993). Self-efficacy and work-related behaviour: a
review and meta-analysis. Applied psychology, 42, (2), 139-152.
Salkind. N.J. (2001). Exploring Research. (4th ed.). Upper Saddle River:
Prentice Hall.
Schaefer, D. R., & Dillman, D. A. (1998). Development of a standard e-mail
methodology: Results of an experiment. Public Opinion Quarterly, 3 (62), 378-
390.
Scheepers, J.M. (1995). Die Iokus van beheer vraelys: Konstruksie en
evaluering van ‘n meetinstrument. Johannesburg: RAU.
Schneider, S.L. (2001). In search of realistic optimism. American Psychologist,
56 (3), 250-263.
Scholl, R.W. (1981). Differentiating commitment from expectancy as a
motivating force. Academy of Management Review, 6, 589-599.
Schunk, D. H. ( 1995 ). Self-efficacy and education and instruction. In J. Maddux
(Ed.), Self-efficacy, adaptation, and adjustment: Theory, research, and
application (pp. 281-303). New York: Plenum Press.
Schunk, D.H. & Hanson, A.R. (1985). Peer models: Influence on children’s self-
efficacy and achievement. Journal of Educational Psychology, 79, 54-61.

99
Schunk, D. H., & Miller, S. D. (2002). Self-efficacy and adolescents’ motivation.
In F. Pajares & T. Urdan (Eds.), Academic motivation of adolescents (pp. 29-52).
Greenwich, CT: Information Age.
Schwarzer, R. (ed.). (1992). Self-efficacy: Thought control of action.
Washington DC: Hemisphere.
Schwarzer, R. & Jerusalem, M. (Eds.). (1995). Generalised Self-Efficacy scale.
In J. Weinman, S. Wright, & M. Johnston (eds.), Measures in health psychology:
A user’s portfolio. Causal and control beliefs (pp. 35-37). Windsor, UK: NFER-
NELSON.
Schwarzer, R., Mueller, J., & Greenglass, E. (1999). Assessment of perceived
general self-efficacy on the internet: data collection in cyberspace. Anxiety,
stress and Coping, 12, 145–161.
Schwoerer, C.E. & May, D.R. (1996). Age and work outcomes: The moderating
effects of self - efficacy and tool design effectiveness. Journal of Organizational
Behavior, 17, 469-487.
Seligman, M.E.P. & Csikszentmihalyi, M. (2000). Positive Psychology: An
introduction. American Psychologist, 55 (1), 5-14.
Shaughnessy J.J., Zechmeister, E.B. & Zechmeister, J.S. (2003). Research
methods in Psychology. (6th ed.). New York McGraw-Hill.
Sheehan, K. (2001). E-mail Survey Response Rates: A Review.
Journal of the Market Research Society, 4 (37), 429-440
Sheldon, K.M. & King, L. (2001). Why positive psychology is necessary.
American Psychologist, 56 (3), 216-217.

100
Sherer, M., Maddux, J.E., Mercabante, B. Prentice-Dunn, S., Jacobs, B. &
Rogers, R.W. (1982). Self-efficacy Scale Construction and Validation.
Psychological Reports, 51, 663-671.
Somerfield, M.R. & McCrae, R.R. (2000). Stress and coping research. American
Psychologist, 55(6), 620-625.
Somers, M.J. & Birnbaum, D. (1998). Work-related commitment and job
performance: It’s also the nature of the performance that counts. Journal of
Organisational Behaviour, 19, 621-634.
Statistical Package for the Social Sciences, version 15 for Windows, 2007.
Strumpfer, D.J.W. (1990). Salutogenesis: A new paradigm. South African
Journal of Psychology, 20 (4), 265-276.
Strumpfer, D.J.W. (1995). The origins of health and strength: From
‘salutogenesis’ to ‘fortigenesis’. South African Journal of Psychology, 25 (2), 81-
89.
Suliman, A.M. & lIes, P.A. (2000). Is continuance commitment beneficial to
organizations? Commitment in performance relationship: A new look. Journal of
Managerial Psychology, 15(5), 407-426.
Tipton, R.M., & Worthington, E.L. (1984). The Measurement of Generalized
Self-Efficacy: A Study of Construct Validity, Journal of Personality Assessment,
48 (5), 545-548.
Vandenberg, R. J., & Scarpello, V. (1994). A longitudinal assessment of the
determinant relationship between employee commitment to the occupation and
the organization. Journal of Organizational Behavior, 15, 553-547.
101
Viviers, A.M. & Cilliers F. (1999). The relationship between salutogenisis and
work orientation. Journal of Industrial Psychology, 25(1), 27-32.
Wallace, J. E. (1995). Organizational and professional commitment in
professional and nonprofessional organizations. Administrative Science
Quarterly, 40, 228-255.
Watson, G. & Papmarcos, S. (2002). Value Reframing and Enactment: Coping
with Cognitive Challenge. Presented at the International Conference of the
Global Business and Technology Association, Rome.
Wellman J.C. & Kruger, S.J. (2001). Research Methodology. Oxford University
Press: Southern Africa.
Wissing, M.P. (2000, May). Wellness: Construct clarification and a framework for
future research and practice. Paper presented at the First South African National
Wellness Conference. Port Elizabeth, South Africa.
Wissing, M.P. & Van Eeden, C. (1997). Psychological well-being: A
fortigenic conceptualization and empirical clarification. Paper presented at the
Annual Congress of the Psychological Society of South Africa. Durban. South
Africa.
Wissing, M.P. &Van Eeden, C. (2002). Empirical clarification of the nature of
psychological well-being. South African Journal of Psychology, 32(1), 32-44.
Wong, P.T.P. (1998). Implicit theories of meaningful life and the development of
the personal meaning profile. In P.T.P. Wong & P. 5. Fry (Eds), The human
quest for meaning: A handbook of psychological research and clinical
applications (pp. 111-140). Mahwah: Lawrence Erlbaum Associates.

102
Wood, R. E., & Bandura, A. (1989). Impact of conceptions of ability on self-
regulatory mechanisms and complex decision making. Journal of Personality
and Social Psychology, 56, 407-415.
Zangaro, GA. (2001). Organisational commitment - A concept analysis. Nursing
Forum, 36(2), 14-23.
Zimmerman, B.J. (1995). Self-efficacy and educational development. In A.
Bandura (ed.), Self-efficacy in changing societies (pp. 202-231). New-York:
Cambridge University Press.
Zimmerman, B. & Cleary, T. (2006). Adolescents’ Development of Personal
Agency. In Pajares, F. & Urdan, T. (Eds), Self-Efficacy Beliefs of Adolescents
(pp. 45-69). Greenwich, Connecticut : Information Age Publishing.

103
APPENDIX 1 EMPLOYEE COMMITMENT QUESTIONNAIRE
EMPLOYEE COMMITMENT QUESTIONNAIRE
Dear respondent,
Thank you for your time and willlingness to participate in this research project. Your cooperation in completing this questionnaire is highly appreciated! This project aims to investigate your dedication or loyalty to what you do and to the company you work for and how you see your self in this relationship. Please answer all the questions as honestly as possible. You should be able to complete the questionnaire in approximately 20 minutes. The questionnaire is completed anonymously, thereby providing full confidentiality. Please complete ALL the questions.
FOR OFFICE USE Respondent number 1 3
SECTION A: EMPLOYEE COMMITMENT
The following questions are about THE COMPANY (Tsb Sugar) YOU WORK FOR. We are doing research on how committed people are to their work and the company. We know that the two are not the same… a person can be committed to the kind of work they do, but not to the company they work for. Or they can be committed to the company they work for and not committed to the kind of work they do. 1. Imagine an ideal company. Now think about Tsb Sugar. When you take into account
everything that you look for in a company, how would you rate Tsb Sugar - on a scale
from ‘1’ to ‘10’ - where ‘1’ means it is terrible and ‘10’ means it is perfect?
Terrible Perfect Company 1 2 3 4 5 6 7 8 9 10
4-5
2. When you think of other companies you could work for, how do you rate Tsb Sugar in comparison to them?
Tsb Sugar is better than most others 1 Tsb Sugar is about the same as most others 2
6

104
Tsb Sugar is worse than most others 3 3. People can work at a company because it’s just a way to make a living. Or people can work at a company because you really want to. Using a scale from ‘1’ to ‘4’ – where ‘1’ means it’s something I really want to do; and ‘4’ is it’s just a way to make a living. – how would you rate working at Tsb Sugar?
It is something I really want to do. 1 2 3 It is just a way to make a living. 4
7
4. Please indicate which of these three statements best describes your feelings about Tsb Sugar:
I can think of many good reasons for continuing to work at Tsb Sugar, and no good reasons to work somewhere else.
1
I can think of many good reasons for continuing to work at Tsb Sugar but there are also many good reasons to work somewhere else.
2
I can think of few good reasons to continue working at Tsb Sugar, and there are many good reasons to work somewhere else.
3
8
The following questions are about the TYPE OF WORK YOU DO. 5. Now let’s think about the work you do. When you think about everything that you look for in a job, how would you rate the work you do, again on a scale from ‘1’ to ‘10’ – where ‘1’ means it’s terrible and ‘10’ means it’s perfect?
Terrible Perfect Job 1 2 3 4 5 6 7 8 9 10
9-10
6. Now think about others kinds of work you could do, how do you rate the work that you’re doing at the moment compared to the other kinds of work you could do?
My work is better than most other types of work 1 My work is neither better nor worse than most other types of work 2 My work is worse than most other types of work 3
11
7. Is the kind of work you do at the moment just away to make a living – or is it something that you really want to do? Using a scale of ‘1’ to ‘4’ – where ‘1’ means the work you do is something you really want to do, but ‘4’ means it’s just a way to make a living, how would you rate the work you are doing at the moment?
Doing this kind of work is something I really want to do. 1 2 3 Doing this kind of work is just a way to make a living. 4
12
8. Please indicate which of these three statements best describes your feelings about the work you do:

105
I can think of many good reasons to continue doing the same kind of work. 1 I can think of many good reasons to continue doing the same kind of work, but there are also many good reasons to change to something else.
2
I can think of few good reasons to continue doing the same kind of work. 3
13
9. We’d like to find out how you feel after reading the following work related statements. We will use a scale from 1 to 5, where “1” equals strongly disagree and 5 “strongly agree”.
Disagree Agree
I am satisfied with my remuneration package 1 2 3 4 5 14
I have a satisfactory relationship with my Supervisor/ Manager 1 2 3 4 5 15
I feel proud about my work achievements 1 2 3 4 5 16
I am content with the recognition I receive 1 2 3 4 5 17
I feel the work I do at Tsb Sugar is valued 1 2 3 4 5 18
I am happy with my responsibilities at work 1 2 3 4 5 19
I am satisfied with my chances on promotion 1 2 3 4 5 20
I am happy with the image of Tsb Sugar 1 2 3 4 5 21
I am satisfied with my working conditions 1 2 3 4 5 22
SECTION B: SELF VALUE
INSTRUCTIONS:
The following statements concerns attitudes or feelings you might have about yourself and your performance on a
variety of tasks. Please indicate the extent to which you agree or disagree with each of these statements by making a
cross (X) in the space at one end of the scale, or the other if you completely agree or completely disagree. Place a
cross (X) in the space second from the end if you somewhat agree or somewhat disagree and place a cross (X) in the
space third from the end if you only slightly agree or slightly disagree. Place your cross (X) in the middle of the scale
if you neither agree nor disagree. Most important: work quickly and give your first impression.

106
10. I find it extremely unpleasant to be afraid.
Strongly agree 1
2
3
4
5
6
7
Strongly disagree
23 11. I sometimes avoid difficult tasks.
Strongly agree
1
2
3
4
5
6
7
Strongly disagree
24 12. I am a very determined person.
Strongly agree
1
2
3
4
5
6
7
Strongly disagree
25
13. Once I set my mind to a task almost nothing can stop me.
Strongly agree 1
2
3
4
5
6
7
Strongly disagree
26 14. I have a lot of self-confidence.
Strongly agree
1
2
3
4
5
6
7
Strongly disagree
27 15. I am at my best when I am really challenged.
Strongly agree
1
2
3
4
5
6
7
Strongly disagree
28 16. I believe that it is shameful to give up something I started.
Strongly agree
1
2
3
4
5
6
7
Strongly disagree
29
17. I have more than the average amount of self-determination.
Strongly agree 1
2
3
4
5
6
7
Strongly disagree
30 18. Sometimes things just don’t seem worth the effort.
Strongly agree
1
2
3
4
5
6
7
Strongly disagree
31 19. I would rather not try something that I’m not good at.
Strongly agree
1
2
3
4
5
6
7
Strongly disagree
32 20. I have more fears than most people.
Strongly agree
1
2
3
4
5
6
7
Strongly disagree
33
21. I find it difficult to take risks.
Strongly agree 1
2
3
4
5
6
7
Strongly disagree
34 22. People have a lot of problems but none they will not eventually be able to solve.
Strongly agree
1
2
3
4
5
6
7
Strongly disagree
35

107
23. I can succeed in almost any endeavour to which I set my mind.
Strongly agree 1
2
3
4
5
6
7
Strongly disagree
36 24. Nothing is impossible if I really put my mind to it.
Strongly agree
1
2
3
4
5
6
7
Strongly disagree
37 25. I feel I am better off to rely on myself for a solution when things are looking bad.
Strongly agree
1
2
3
4
5
6
7
Strongly disagree
38 26. When put to the test I would remain true to my ideas.
Strongly agree
1
2
3
4
5
6
7
Strongly disagree
39 27. If a person believes in himself, he/she can make it in the world.
Strongly agree
1
2
3
4
5
6
7
Strongly disagree
40 28. I feel that chances are very good that I can achieve my goals in life.
Strongly agree
1
2
3
4
5
6
7
Strongly disagree
41 29. In general I agree that “if first I do not succeed, I’ll try again”.
Strongly agree
1
2
3
4
5
6
7
Strongly disagree
42 30. When I have difficulty getting what I want, I try harder.
Strongly agree
1
2
3
4
5
6
7
Strongly disagree
43 31. I excel at few things.
Strongly agree
1
2
3
4
5
6
7
Strongly disagree
44 32. I have often burned the midnight oil to finish a task before the deadline.
Strongly agree
1
2
3
4
5
6
7
Strongly disagree
45 33. I have more willpower than most people.
Strongly agree
1
2
3
4
5
6
7
Strongly disagree
46 34. I become frustrated when I experience physical discomfort.
Strongly agree
1
2
3
4
5
6
7
Strongly disagree
47 35. Nothing is worth subjecting myself to pain for, if I can avoid it.

108
Strongly agree
1
2
3
4
5
6
7
Strongly disagree
48 36. I would endure physical discomfort to complete a task because I just don’t like to give up.
Strongly agree
1
2
3
4
5
6
7
Strongly disagree
49
SECTION C: DEMOGRAPHIC INFORMATION
Please complete all the following questions by indicating your answer with a cross (“X”) in the relevant block. .
37.Your Age
Under 20 20-29 30-39 40-49 50-59 60+ 50
38.Gender Male Female 51
39.Marital Status
Single Married Divorced Widowed Separated Living with a partner
52
40.Population Group
Asian Black/African Coloured White 53
41. Divisions
Malelane Mill
Komati Mill
Quality Sugars
Cane Supply
Cane Production
Tsb International
RSSC GFC 54
Monthly Household Income refers to the total income before any deductions (tax, transport, housing, etc.). This income
refers to the total income generated by any Household member. A Household member is a person who shares the
dining room table on a permanent basis.

109
42.Monthly Household Income
<R10,000
R10,001 – R25,000 R25,001 – R40,000
R40 000+ 55
< 1 year
1 year – 3 years 4 years – 6 years
7 years – 10 years 43.How many years have you een employed by TSB Sugar?
11 years – 15 years
16 years – 20 years
21 years – 25 years
26 years +
56
44.Highest Qualification
Matric or equivalent
Non degree: Post Matric
Qualification
Degree Honours Degree
Masters/ Doctors Degree
57
THANK YOU VERY MUCH FOR YOUR TIME AND EFFORT!!

110
APPENDIX 2
CROSS TABS BY DEMOGRAPHIC

111
AmbassadorCompany orientated Career orientated Uncommited
Count 20 3 5 1 29% within Total Self Efficacy Score (Binned)
69.0% 10.3% 17.2% 3.4% 100.0%
Count 21 4 6 1 32% within Total Self Efficacy Score (Binned)
65.6% 12.5% 18.8% 3.1% 100.0%
Count 18 2 6 2 28% within Total Self Efficacy Score (Binned)
64.3% 7.1% 21.4% 7.1% 100.0%
Count 15 0 2 7 24% within Total Self Efficacy Score (Binned)
62.5% 0.0% 8.3% 29.2% 100.0%
Count 74 9 19 11 113% within Total Self Efficacy Score (Binned)
65.5% 8.0% 16.8% 9.7% 100.0%
Total
Total Self Efficacy Score (Binned) Quartile1
Quartile2
Quartile3
Quartile4
Total Self Efficacy Score (Binned) * matrix Crosstabulation
matrix
Total
Value dfAsymp. Sig. (2-
sided)Pearson Chi-Square 16.632(a) 9 0.055N of Valid Cases 113
Value Asymp. Std. Error Approx. T Approx. Sig.Interval by Interval Pearson's R 0.159 0.098 1.696 0.093Ordinal by Ordinal Spearman Correlation 0.110 0.098 1.167 0.246
113N of Valid Cases
Chi-Square Tests
Symmetric Measures

112
AmbassadorCompany orientated
Career orientated Uncommited
Quartile4 Count 1 1% within Total Self Efficacy Score (Binned)
100.0% 100.0%
Count 1 1% within Total Self Efficacy Score (Binned)
100.0% 100.0%
Count 4 1 0 0 5% within Total Self Efficacy Score (Binned)
80.0% 20.0% 0.0% 0.0% 100.0%
Count 2 0 0 0 2% within Total Self Efficacy Score (Binned)
100.0% 0.0% 0.0% 0.0% 100.0%
Count 1 0 2 0 3% within Total Self Efficacy Score (Binned)
33.3% 0.0% 66.7% 0.0% 100.0%
Count 0 0 0 1 1% within Total Self Efficacy Score (Binned)
0.0% 0.0% 0.0% 100.0% 100.0%
Count 7 1 2 1 11% within Total Self Efficacy Score (Binned)
63.6% 9.1% 18.2% 9.1% 100.0%
Count 6 0 1 0 7% within Total Self Efficacy Score (Binned)
85.7% 0.0% 14.3% 0.0% 100.0%
Count 4 1 2 0 7% within Total Self Efficacy Score (Binned)
57.1% 14.3% 28.6% 0.0% 100.0%
Count 2 1 1 0 4% within Total Self Efficacy Score (Binned)
50.0% 25.0% 25.0% 0.0% 100.0%
Count 5 0 0 1 6% within Total Self Efficacy Score (Binned)
83.3% 0.0% 0.0% 16.7% 100.0%
Count 17 2 4 1 24% within Total Self Efficacy Score (Binned)
70.8% 8.3% 16.7% 4.2% 100.0%
30-39 Total Self Efficacy Score (Binned) Quartile1
Quartile2
Quartile3
Quartile4
Total
20-29 Total Self Efficacy Score (Binned) Quartile1
Quartile2
Quartile3
Quartile4
Total
Total Self Efficacy Score (Binned) * matrix * Age Crosstabulation
Age
matrix
Total<20 Total Self Efficacy Score (Binned)
Total

113
AmbassadorCompany orientated
Career orientated Uncommited
Count 8 0 2 1 11% within Total Self Efficacy Score (Binned)
72.7% 0.0% 18.2% 9.1% 100.0%
Count 5 0 4 1 10% within Total Self Efficacy Score (Binned)
50.0% 0.0% 40.0% 10.0% 100.0%
Count 3 1 3 2 9% within Total Self Efficacy Score (Binned)
33.3% 11.1% 33.3% 22.2% 100.0%
Count 2 0 1 2 5% within Total Self Efficacy Score (Binned)
40.0% 0.0% 20.0% 40.0% 100.0%
Count 18 1 10 6 35% within Total Self Efficacy Score (Binned)
51.4% 2.9% 28.6% 17.1% 100.0%
Count 1 2 2 0 5% within Total Self Efficacy Score (Binned)
20.0% 40.0% 40.0% 0.0% 100.0%
Count 9 3 0 0 12% within Total Self Efficacy Score (Binned)
75.0% 25.0% 0.0% 0.0% 100.0%
Count 12 0 0 0 12% within Total Self Efficacy Score (Binned)
100.0% 0.0% 0.0% 0.0% 100.0%
Count 5 0 1 2 8% within Total Self Efficacy Score (Binned)
62.5% 0.0% 12.5% 25.0% 100.0%
Count 27 5 3 2 37% within Total Self Efficacy Score (Binned)
73.0% 13.5% 8.1% 5.4% 100.0%
Count 1 1% within Total Self Efficacy Score (Binned)
100.0% 100.0%
Count 1 1% within Total Self Efficacy Score (Binned)
100.0% 100.0%
Count 3 3% within Total Self Efficacy Score (Binned)
100.0% 100.0%
Count 5 5% within Total Self Efficacy Score (Binned)
100.0% 100.0%
60+ Total Self Efficacy Score (Binned) Quartile1
Quartile2
Quartile4
Total
50-59 Total Self Efficacy Score (Binned) Quartile1
Quartile2
Quartile3
Quartile4
Total
40-49 Total Self Efficacy Score (Binned) Quartile1
Quartile2
Quartile3
Quartile4
Total
TotalAge
matrix
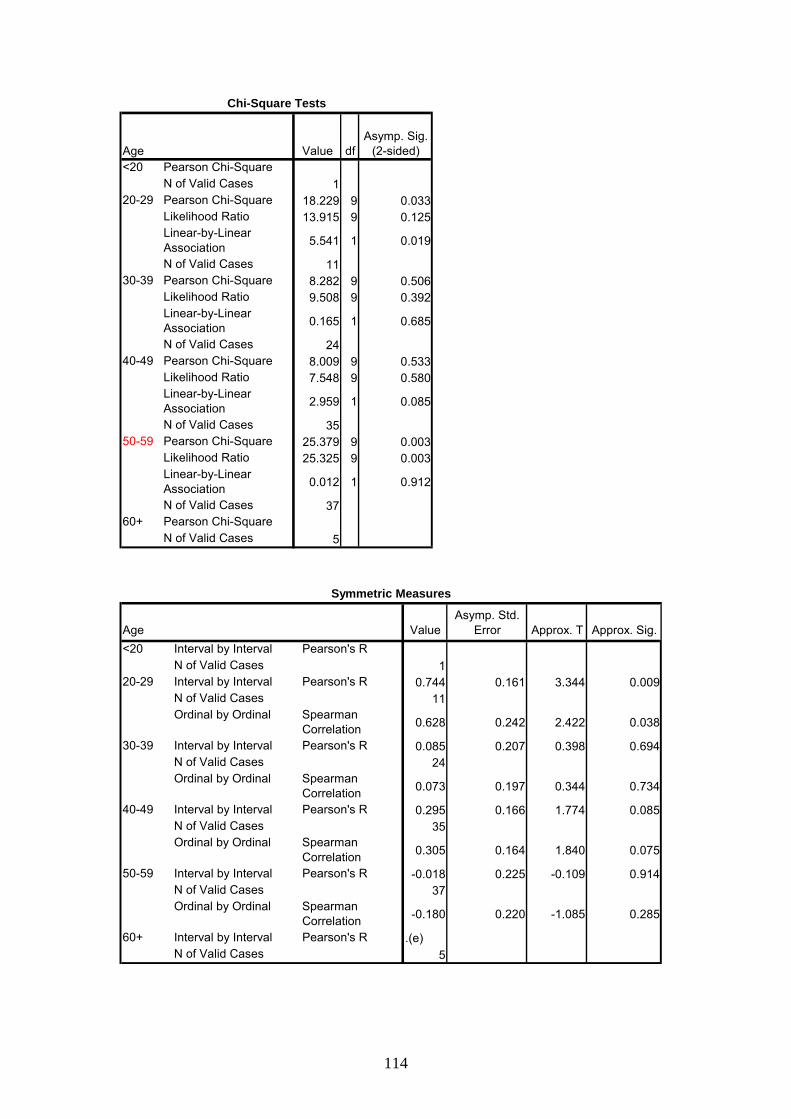
114
Age Value dfAsymp. Sig.
(2-sided)Pearson Chi-SquareN of Valid Cases 1Pearson Chi-Square 18.229 9 0.033Likelihood Ratio 13.915 9 0.125Linear-by-Linear Association 5.541 1 0.019
N of Valid Cases 11Pearson Chi-Square 8.282 9 0.506Likelihood Ratio 9.508 9 0.392Linear-by-Linear Association 0.165 1 0.685
N of Valid Cases 24Pearson Chi-Square 8.009 9 0.533Likelihood Ratio 7.548 9 0.580Linear-by-Linear Association 2.959 1 0.085
N of Valid Cases 35Pearson Chi-Square 25.379 9 0.003Likelihood Ratio 25.325 9 0.003Linear-by-Linear Association 0.012 1 0.912
N of Valid Cases 37Pearson Chi-SquareN of Valid Cases 5
40-49
50-59
60+
Chi-Square Tests
<20
20-29
30-39
Age ValueAsymp. Std.
Error Approx. T Approx. Sig.Interval by Interval Pearson's R
1Interval by Interval Pearson's R 0.744 0.161 3.344 0.009
11Ordinal by Ordinal Spearman
Correlation 0.628 0.242 2.422 0.038
Interval by Interval Pearson's R 0.085 0.207 0.398 0.69424
Ordinal by Ordinal Spearman Correlation 0.073 0.197 0.344 0.734
Interval by Interval Pearson's R 0.295 0.166 1.774 0.08535
Ordinal by Ordinal Spearman Correlation 0.305 0.164 1.840 0.075
Interval by Interval Pearson's R -0.018 0.225 -0.109 0.91437
Ordinal by Ordinal Spearman Correlation -0.180 0.220 -1.085 0.285
Interval by Interval Pearson's R .(e)5
Symmetric Measures
<20
N of Valid Cases20-29
N of Valid Cases
30-39N of Valid Cases
40-49N of Valid Cases
50-59N of Valid Cases
60+N of Valid Cases
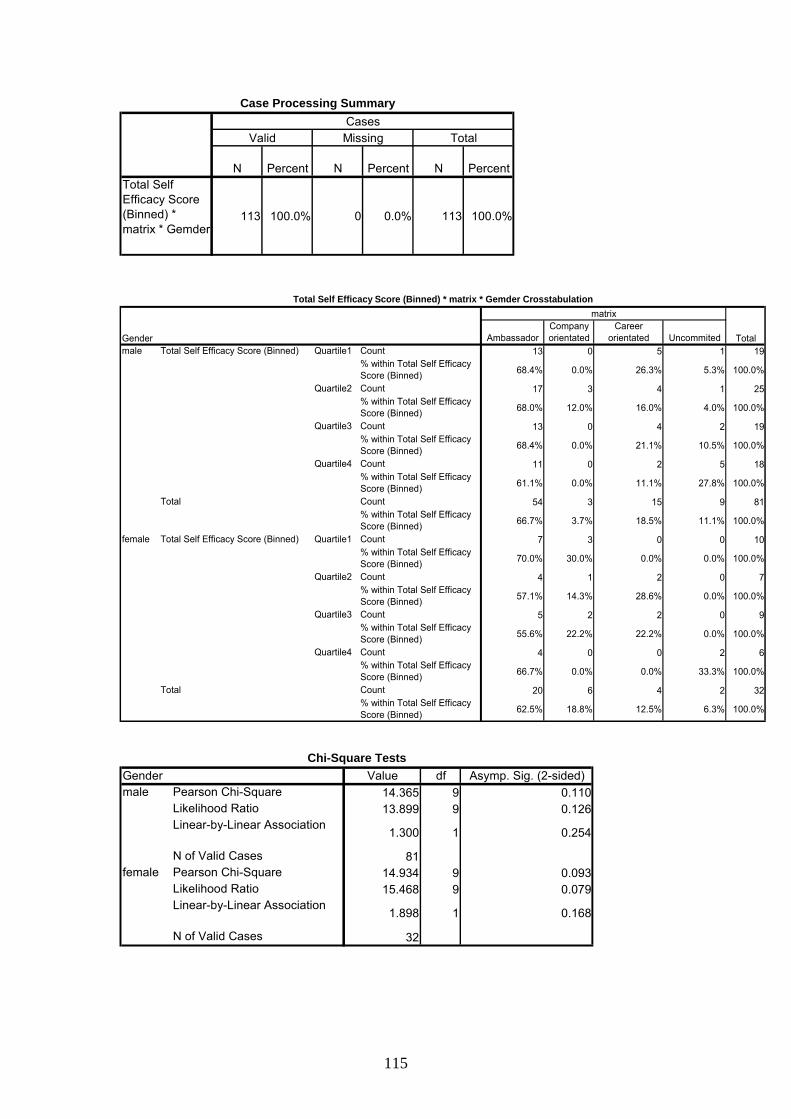
115
N Percent N Percent N PercentTotal Self Efficacy Score (Binned) * matrix * Gemder
113 100.0% 0 0.0% 113 100.0%
Case Processing Summary
CasesValid Missing Total
AmbassadorCompany orientated
Career orientated Uncommited
Count 13 0 5 1 19% within Total Self Efficacy Score (Binned) 68.4% 0.0% 26.3% 5.3% 100.0%
Count 17 3 4 1 25% within Total Self Efficacy Score (Binned) 68.0% 12.0% 16.0% 4.0% 100.0%
Count 13 0 4 2 19% within Total Self Efficacy Score (Binned) 68.4% 0.0% 21.1% 10.5% 100.0%
Count 11 0 2 5 18% within Total Self Efficacy Score (Binned) 61.1% 0.0% 11.1% 27.8% 100.0%
Count 54 3 15 9 81% within Total Self Efficacy Score (Binned) 66.7% 3.7% 18.5% 11.1% 100.0%
Count 7 3 0 0 10% within Total Self Efficacy Score (Binned) 70.0% 30.0% 0.0% 0.0% 100.0%
Count 4 1 2 0 7% within Total Self Efficacy Score (Binned) 57.1% 14.3% 28.6% 0.0% 100.0%
Count 5 2 2 0 9% within Total Self Efficacy Score (Binned) 55.6% 22.2% 22.2% 0.0% 100.0%
Count 4 0 0 2 6% within Total Self Efficacy Score (Binned) 66.7% 0.0% 0.0% 33.3% 100.0%
Count 20 6 4 2 32% within Total Self Efficacy Score (Binned) 62.5% 18.8% 12.5% 6.3% 100.0%
Total Self Efficacy Score (Binned) * matrix * Gemder Crosstabulation
Gender
matrix
Totalmale Total Self Efficacy Score (Binned) Quartile1
Quartile2
Quartile3
Quartile4
Total
female Total Self Efficacy Score (Binned) Quartile1
Quartile2
Quartile3
Quartile4
Total
Gender Value df Asymp. Sig. (2-sided)Pearson Chi-Square 14.365 9 0.110Likelihood Ratio 13.899 9 0.126Linear-by-Linear Association
1.300 1 0.254
N of Valid Cases 81Pearson Chi-Square 14.934 9 0.093Likelihood Ratio 15.468 9 0.079Linear-by-Linear Association
1.898 1 0.168
N of Valid Cases 32
Chi-Square Tests
male
female

116
Gender Value Asymp. Std. Error Approx. T Approx. Sig.Interval by Interval Pearson's R 0.127 0.117 1.142 0.257Ordinal by Ordinal Spearman
Correlation 0.098 0.117 0.871 0.386
81Interval by Interval Pearson's R 0.247 0.169 1.399 0.172Ordinal by Ordinal Spearman
Correlation 0.147 0.178 0.816 0.421
32
male
N of Valid Casesfemale
N of Valid Cases
Symmetric Measures
AmbassadorCompany orientated
Career orientated Uncommited
Quartile2 Count 1 0 1% within Total Self Efficacy Score (Binned)
100.0% 0.0% 100.0%
Quartile4 Count 0 1 1% within Total Self Efficacy Score (Binned)
0.0% 100.0% 100.0%
Count 1 1 2% within Total Self Efficacy Score (Binned)
50.0% 50.0% 100.0%
Count 6 0 6% within Total Self Efficacy Score (Binned)
100.0% 0.0% 100.0%
Count 2 2 4% within Total Self Efficacy Score (Binned)
50.0% 50.0% 100.0%
Count 8 2 10% within Total Self Efficacy Score (Binned)
80.0% 20.0% 100.0%
Count 14 3 5 1 23% within Total Self Efficacy Score (Binned)
60.9% 13.0% 21.7% 4.3% 100.0%
Count 20 4 6 1 31% within Total Self Efficacy Score (Binned)
64.5% 12.9% 19.4% 3.2% 100.0%
Count 16 2 4 2 24% within Total Self Efficacy Score (Binned)
66.7% 8.3% 16.7% 8.3% 100.0%
Count 15 0 2 6 23% within Total Self Efficacy Score (Binned)
65.2% 0.0% 8.7% 26.1% 100.0%
Count 65 9 17 10 101% within Total Self Efficacy Score (Binned)
64.4% 8.9% 16.8% 9.9% 100.0%
Total Self Efficacy Score (Binned) * matrix * Population Group Crosstabulation
Population Group
matrix
Totalasian Total Self Efficacy Score (Binned)
Total
black Total Self Efficacy Score (Binned) Quartile1
Quartile3
Total
white Total Self Efficacy Score (Binned) Quartile1
Quartile2
Quartile3
Quartile4
Total

117
Population Group Value df
Asymp. Sig. (2-sided)
Exact Sig. (2-sided)
Exact Sig. (1-sided)
Pearson Chi-Square 2.000 1 0.157Continuity Correction 0.000 1 1.000Likelihood Ratio 2.773 1 0.096Fisher's Exact Test 1.000 0.500Linear-by-Linear Association 1.000 1 0.317
N of Valid Cases 2Pearson Chi-Square 3.750 1 0.053Continuity Correction(a)
1.276 1 0.259
Likelihood Ratio 4.463 1 0.035Fisher's Exact Test 0.133 0.133Linear-by-Linear Association 3.375 1 0.066
N of Valid Cases 10Pearson Chi-Square 12.728 9 0.175Likelihood Ratio 13.608 9 0.137Linear-by-Linear Association 0.752 1 0.386
N of Valid Cases 101
Chi-Square Tests
asian
black
white
Population Group Value
Asymp. Std. Error(a) Approx. T(b) Approx. Sig.
Interval by Interval Pearson's R 1.000 0.000Ordinal by Ordinal Spearman
Correlation 1.000 0.000
2Interval by Interval Pearson's R 0.612 0.198 2.191 0.060Ordinal by Ordinal Spearman
Correlation 0.612 0.198 2.191 0.060
10Interval by Interval Pearson's R 0.087 0.106 0.866 0.389Ordinal by Ordinal Spearman
Correlation 0.032 0.105 0.321 0.749
101
Symmetric Measures
asian
N of Valid Casesblack
N of Valid Caseswhite
N of Valid Cases

118
AmbassadorCompany orientated
Career orientated Uncommited
Count 9 2 2 1 14% within Total Self Efficacy Score (Binned)
64.3% 14.3% 14.3% 7.1% 100.0%
Count 8 3 2 1 14% within Total Self Efficacy Score (Binned)
57.1% 21.4% 14.3% 7.1% 100.0%
Count 6 1 1 0 8% within Total Self Efficacy Score (Binned)
75.0% 12.5% 12.5% 0.0% 100.0%
Count 10 0 2 5 17% within Total Self Efficacy Score (Binned) 58.8% 0.0% 11.8% 29.4% 100.0%
Count 33 6 7 7 53% within Total Self Efficacy Score (Binned) 62.3% 11.3% 13.2% 13.2% 100.0%
Count 1 0 0 1% within Total Self Efficacy Score (Binned)
100.0% 0.0% 0.0% 100.0%
Count 3 2 1 6% within Total Self Efficacy Score (Binned)
50.0% 33.3% 16.7% 100.0%
Count 4 2 1 7% within Total Self Efficacy Score (Binned)
57.1% 28.6% 14.3% 100.0%
Count 1 0 1% within Total Self Efficacy Score (Binned)
100.0% 0.0% 100.0%
Count 2 1 3% within Total Self Efficacy Score (Binned)
66.7% 33.3% 100.0%
Count 0 1 1% within Total Self Efficacy Score (Binned) 0.0% 100.0% 100.0%
Count 3 2 5% within Total Self Efficacy Score (Binned) 60.0% 40.0% 100.0%
Count 2 1 3% within Total Self Efficacy Score (Binned)
66.7% 33.3% 100.0%
Count 2 0 2% within Total Self Efficacy Score (Binned)
100.0% 0.0% 100.0%
Count 1 0 1% within Total Self Efficacy Score (Binned)
100.0% 0.0% 100.0%
Count 5 1 6% within Total Self Efficacy Score (Binned)
83.3% 16.7% 100.0%
Count 1 1% within Total Self Efficacy Score (Binned)
100.0% 100.0%
Count 1 1% within Total Self Efficacy Score (Binned) 100.0% 100.0%
c prod Total Self Efficacy Score (Binned)
Quartile1
Total
c Sup Total Self Efficacy Score (Binned)
Quartile1
Quartile2
Quartile3
Total
QS Total Self Efficacy Score (Binned)
Quartile1
Quartile2
Quartile3
Total
k mill Total Self Efficacy Score (Binned)
Quartile1
Quartile3
Total
Quartile2
Quartile3
Quartile4
Total
matrixTotal Self Efficacy Score (Binned) * matrix * Division Crosstabulation
TotalDivision m mill Total Self Efficacy
Score (Binned)Quartile1

119
AmbassadorCompany orientated
Career orientated Uncommited
Count 1 1 2% within Total Self Efficacy Score (Binned) 50.0% 50.0% 100.0%
Count 3 0 3% within Total Self Efficacy Score (Binned) 100.0% 0.0% 100.0%
Count 4 0 4% within Total Self Efficacy Score (Binned) 100.0% 0.0% 100.0%
Count 8 1 9% within Total Self Efficacy Score (Binned) 88.9% 11.1% 100.0%
Count 3 2 0 5% within Total Self Efficacy Score (Binned) 60.0% 40.0% 0.0% 100.0%
Count 5 4 0 9% within Total Self Efficacy Score (Binned) 55.6% 44.4% 0.0% 100.0%
Count 3 2 1 6% within Total Self Efficacy Score (Binned) 50.0% 33.3% 16.7% 100.0%
Count 1 0 2 3% within Total Self Efficacy Score (Binned) 33.3% 0.0% 66.7% 100.0%
Count 12 8 3 23% within Total Self Efficacy Score (Binned) 52.2% 34.8% 13.0% 100.0%
Quartile3 Count 3 1 4% within Total Self Efficacy Score (Binned) 75.0% 25.0% 100.0%
Count 3 1 4% within Total Self Efficacy Score (Binned) 75.0% 25.0% 100.0%
Count 2 2% within Total Self Efficacy Score (Binned) 100.0% 100.0%
Count 1 1% within Total Self Efficacy Score (Binned) 100.0% 100.0%
Count 2 2% within Total Self Efficacy Score (Binned) 100.0% 100.0%
Count 5 5% within Total Self Efficacy Score (Binned) 100.0% 100.0%
GFC Total Self Efficacy Score (Binned)
Total
GS Total Self Efficacy Score (Binned)
Quartile1
Quartile2
Quartile3
Total
RSSC Total Self Efficacy Score (Binned)
Quartile1
Quartile2
Quartile3
Quartile4
Total
Tsb Int Total Self Efficacy Score (Binned)
Quartile1
Quartile2
Quartile4
Total
TotalDivision
matrix

120
AmbassadorCompany orientated
Career orientated Uncommited
Count 4 0 2 0 6% within Total Self Efficacy Score (Binned)
66.7% 0.0% 33.3% 0.0% 100.0%
Count 2 0 0 0 2% within Total Self Efficacy Score (Binned) 100.0% 0.0% 0.0% 0.0% 100.0%
Count 5 1 1 0 7% within Total Self Efficacy Score (Binned)
71.4% 14.3% 14.3% 0.0% 100.0%
Count 0 0 0 2 2% within Total Self Efficacy Score (Binned)
0.0% 0.0% 0.0% 100.0% 100.0%
Count 11 1 3 2 17% within Total Self Efficacy Score (Binned)
64.7% 5.9% 17.6% 11.8% 100.0%
Count 6 3 0 0 9% within Total Self Efficacy Score (Binned)
66.7% 33.3% 0.0% 0.0% 100.0%
Count 2 1 2 1 6% within Total Self Efficacy Score (Binned) 33.3% 16.7% 33.3% 16.7% 100.0%
Count 2 0 1 0 3% within Total Self Efficacy Score (Binned)
66.7% 0.0% 33.3% 0.0% 100.0%
Count 8 0 1 2 11% within Total Self Efficacy Score (Binned)
72.7% 0.0% 9.1% 18.2% 100.0%
Count 18 4 4 3 29% within Total Self Efficacy Score (Binned)
62.1% 13.8% 13.8% 10.3% 100.0%
Count 4 0 0 1 5% within Total Self Efficacy Score (Binned)
80.0% 0.0% 0.0% 20.0% 100.0%
Count 8 2 4 0 14% within Total Self Efficacy Score (Binned)
57.1% 14.3% 28.6% 0.0% 100.0%
Count 8 1 2 1 12% within Total Self Efficacy Score (Binned)
66.7% 8.3% 16.7% 8.3% 100.0%
Count 1 0 0 1 2% within Total Self Efficacy Score (Binned)
50.0% 0.0% 0.0% 50.0% 100.0%
Count 21 3 6 3 33% within Total Self Efficacy Score (Binned)
63.6% 9.1% 18.2% 9.1% 100.0%
Count 6 0 3 0 9% within Total Self Efficacy Score (Binned)
66.7% 0.0% 33.3% 0.0% 100.0%
Count 9 1 0 0 10% within Total Self Efficacy Score (Binned)
90.0% 10.0% 0.0% 0.0% 100.0%
Count 3 0 2 1 6% within Total Self Efficacy Score (Binned)
50.0% 0.0% 33.3% 16.7% 100.0%
Count 6 0 1 2 9% within Total Self Efficacy Score (Binned)
66.7% 0.0% 11.1% 22.2% 100.0%
Count 24 1 6 3 34% within Total Self Efficacy Score (Binned)
70.6% 2.9% 17.6% 8.8% 100.0%
Total Self Efficacy Score (Binned) * matrix * Monthly HH Income Crosstabulation
Monthly HH Income
matrix
Total<10 Total Self Efficacy
Score (Binned)Quartile1
Quartile2
Quartile3
Quartile4
Total
10-25 Total Self Efficacy Score (Binned)
Quartile1
Quartile2
Quartile3
Quartile4
Total
25-40 Total Self Efficacy Score (Binned)
Quartile1
Quartile2
Quartile3
Quartile4
Total
40+ Total Self Efficacy Score (Binned)
Quartile1
Quartile2
Quartile3
Quartile4
Total

121
Monthly HH Income Value df
Asymp. Sig. (2-sided)
Pearson Chi-Square 19.747 9 0.020Likelihood Ratio 15.425 9 0.080Linear-by-Linear Association 2.004 1 0.157
N of Valid Cases 17Pearson Chi-Square 11.534 9 0.241Likelihood Ratio 14.535 9 0.105Linear-by-Linear Association 0.218 1 0.641
N of Valid Cases 29Pearson Chi-Square 9.174 9 0.421Likelihood Ratio 10.085 9 0.344Linear-by-Linear Association 0.369 1 0.543
N of Valid Cases 33Pearson Chi-Square 11.333 9 0.254Likelihood Ratio 13.781 9 0.130Linear-by-Linear Association 1.048 1 0.306
N of Valid Cases 34
40+
Chi-Square Tests
<10
10-25
25-40
Monthly HH Income Value
Asymp. Std. Error Approx. T Approx. Sig.
Interval by Interval Pearson's R 0.354 0.249 1.465 0.163Ordinal by Ordinal Spearman
Correlation 0.341 0.277 1.406 0.180
17Interval by Interval Pearson's R 0.088 0.168 0.460 0.649Ordinal by Ordinal Spearman
Correlation 0.011 0.183 0.060 0.953
29Interval by Interval Pearson's R 0.107 0.209 0.602 0.552Ordinal by Ordinal Spearman
Correlation 0.078 0.188 0.437 0.665
33Interval by Interval Pearson's R 0.178 0.174 1.024 0.313Ordinal by Ordinal Spearman
Correlation 0.133 0.182 0.760 0.453
34
40+
N of Valid Cases
10-25
N of Valid Cases25-40
N of Valid Cases
Symmetric Measures
<10
N of Valid Cases
N Percent N Percent N PercentTotal Self Efficacy Score (Binned) * matrix * Tenure 113 100.0% 0 0.0% 113 100.0%
Case Processing Summary
CasesValid Missing Total

122
AmbassadorCompany orientated
Career orientated Uncommited
Count 4 1 0 5% within Total Self Efficacy Score (Binned) 80.0% 20.0% 0.0% 100.0%
Count 2 1 0 3% within Total Self Efficacy Score (Binned) 66.7% 33.3% 0.0% 100.0%
Count 4 1 0 5% within Total Self Efficacy Score (Binned) 80.0% 20.0% 0.0% 100.0%
Count 7 0 2 9% within Total Self Efficacy Score (Binned) 77.8% 0.0% 22.2% 100.0%
Count 17 3 2 22% within Total Self Efficacy Score (Binned) 77.3% 13.6% 9.1% 100.0%
Count 2 1 0 0 3% within Total Self Efficacy Score (Binned) 66.7% 33.3% 0.0% 0.0% 100.0%
Count 7 1 1 0 9% within Total Self Efficacy Score (Binned) 77.8% 11.1% 11.1% 0.0% 100.0%
Count 0 0 1 0 1% within Total Self Efficacy Score (Binned) 0.0% 0.0% 100.0% 0.0% 100.0%
Count 0 0 0 1 1% within Total Self Efficacy Score (Binned) 0.0% 0.0% 0.0% 100.0% 100.0%
Count 9 2 2 1 14% within Total Self Efficacy Score (Binned) 64.3% 14.3% 14.3% 7.1% 100.0%
Count 5 0 0 5% within Total Self Efficacy Score (Binned) 100.0% 0.0% 0.0% 100.0%
Count 0 1 0 1% within Total Self Efficacy Score (Binned) 0.0% 100.0% 0.0% 100.0%
Count 0 0 1 1% within Total Self Efficacy Score (Binned) 0.0% 0.0% 100.0% 100.0%
Count 5 1 1 7% within Total Self Efficacy Score (Binned) 71.4% 14.3% 14.3% 100.0%
Count 0 0 2 2% within Total Self Efficacy Score (Binned) 0.0% 0.0% 100.0% 100.0%
Count 1 1 1 3% within Total Self Efficacy Score (Binned) 33.3% 33.3% 33.3% 100.0%
Count 1 1 3 5% within Total Self Efficacy Score (Binned) 20.0% 20.0% 60.0% 100.0%
7-10 Total Self Efficacy Score (Binned) Quartile1
Quartile3
Total
4-6 Total Self Efficacy Score (Binned) Quartile1
Quartile3
Quartile4
Total
Total
1-3 Total Self Efficacy Score (Binned) Quartile1
Quartile2
Quartile3
Quartile4
Total
Total Self Efficacy Score (Binned) Quartile1
Quartile2
Quartile3
Quartile4
Total Self Efficacy Score (Binned) * matrix * Tenure Crosstabulation
Tenure
matrix
Total<1

123
AmbassadorCompany orientated
Career orientated Uncommited
11-15 Total Self Efficacy Score (Binned) Count 3 0 1 4% within Total Self Efficacy Score (Binned) 75.0% 0.0% 25.0% 100.0%
Count 6 3 0 9% within Total Self Efficacy Score (Binned) 66.7% 33.3% 0.0% 100.0%
Count 5 3 1 9% within Total Self Efficacy Score (Binned) 55.6% 33.3% 11.1% 100.0%
Count 6 1 2 9% within Total Self Efficacy Score (Binned) 66.7% 11.1% 22.2% 100.0%
Count 20 7 4 31% within Total Self Efficacy Score (Binned) 64.5% 22.6% 12.9% 100.0%
Count 4 2 0 0 6% within Total Self Efficacy Score (Binned) 66.7% 33.3% 0.0% 0.0% 100.0%
Count 3 3 1 1 8% within Total Self Efficacy Score (Binned) 37.5% 37.5% 12.5% 12.5% 100.0%
Count 7 0 0 1 8% within Total Self Efficacy Score (Binned) 87.5% 0.0% 0.0% 12.5% 100.0%
Count 1 0 0 1 2% within Total Self Efficacy Score (Binned) 50.0% 0.0% 0.0% 50.0% 100.0%
Count 15 5 1 3 24% within Total Self Efficacy Score (Binned) 62.5% 20.8% 4.2% 12.5% 100.0%
Count 0 2 2% within Total Self Efficacy Score (Binned) 0.0% 100.0% 100.0%
Count 1 0 1% within Total Self Efficacy Score (Binned) 100.0% 0.0% 100.0%
Count 1 0 1% within Total Self Efficacy Score (Binned) 100.0% 0.0% 100.0%
Count 2 2 4% within Total Self Efficacy Score (Binned) 50.0% 50.0% 100.0%
Count 2 0 2% within Total Self Efficacy Score (Binned) 100.0% 0.0% 100.0%
Count 2 0 2% within Total Self Efficacy Score (Binned) 100.0% 0.0% 100.0%
Count 1 1 2% within Total Self Efficacy Score (Binned) 50.0% 50.0% 100.0%
Count 5 1 6% within Total Self Efficacy Score (Binned) 83.3% 16.7% 100.0%
26+ Total Self Efficacy Score (Binned) Quartile1
Quartile2
Quartile4
Total
21-25 Total Self Efficacy Score (Binned) Quartile1
Quartile2
Quartile3
Total
Total
Tenure
16-20 Total Self Efficacy Score (Binned) Quartile1
Quartile2
Quartile3
Quartile4
Total
Quartile1
Quartile2
Quartile3
Quartile4
matrix
Total

124
Tenure Value dfAsymp. Sig.
(2-sided)Pearson Chi-Square 5.320 6 0.503Likelihood Ratio 6.951 6 0.325Linear-by-Linear Association 0.136 1 0.712N of Valid Cases 22Pearson Chi-Square 21.432 9 0.011Likelihood Ratio 12.672 9 0.178Linear-by-Linear Association 6.026 1 0.014N of Valid Cases 14Pearson Chi-Square 14.000 4 0.007Likelihood Ratio 11.148 4 0.025Linear-by-Linear Association 5.470 1 0.019N of Valid Cases 7Pearson Chi-Square 2.222 2 0.329Likelihood Ratio 2.911 2 0.233Linear-by-Linear Association 1.500 1 0.221N of Valid Cases 5Pearson Chi-Square 4.785 6 0.572Likelihood Ratio 6.649 6 0.355Linear-by-Linear Association 0.163 1 0.686N of Valid Cases 31Pearson Chi-Square 10.267 9 0.329Likelihood Ratio 12.092 9 0.208Linear-by-Linear Association 0.399 1 0.528N of Valid Cases 24Pearson Chi-Square 4.000 2 0.135Likelihood Ratio 5.545 2 0.063Linear-by-Linear Association 2.455 1 0.117N of Valid Cases 4Pearson Chi-Square 2.400 2 0.301Likelihood Ratio 2.634 2 0.268Linear-by-Linear Association 1.786 1 0.181N of Valid Cases 6
Chi-Square Tests
<1
1-3
4-6
26+
7-10
11-15
16-20
21-25
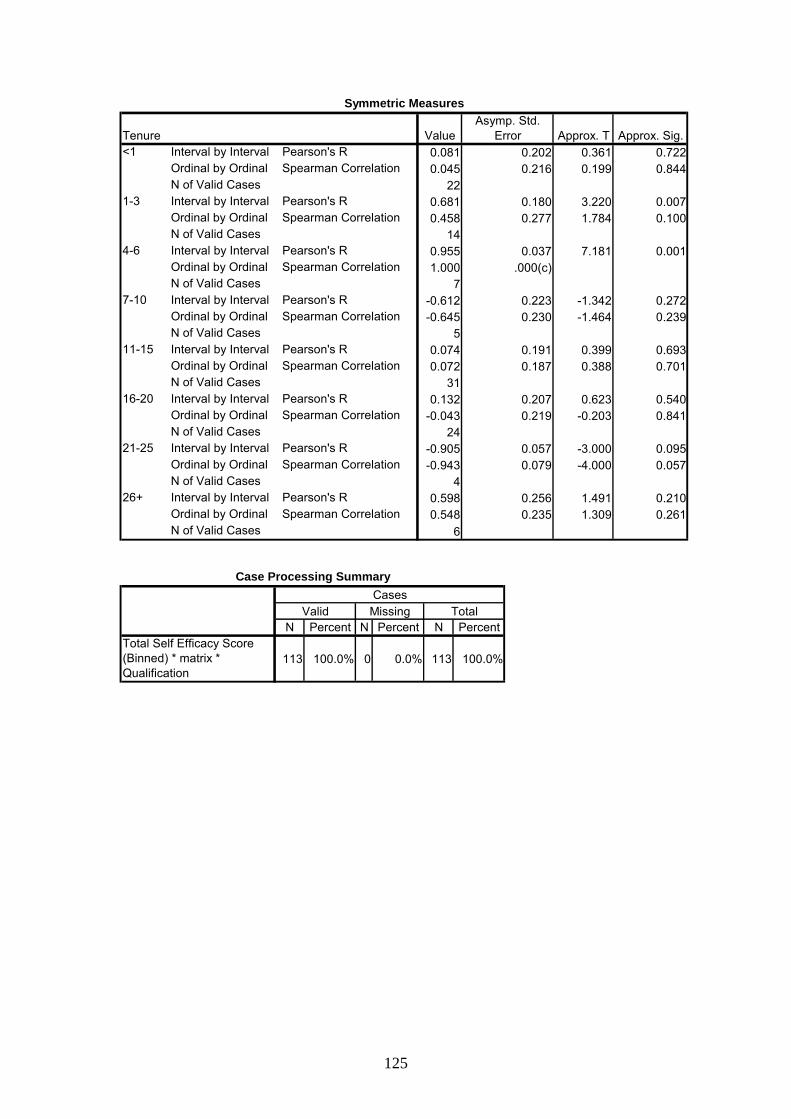
125
Tenure ValueAsymp. Std.
Error Approx. T Approx. Sig.Interval by Interval Pearson's R 0.081 0.202 0.361 0.722Ordinal by Ordinal Spearman Correlation 0.045 0.216 0.199 0.844
22Interval by Interval Pearson's R 0.681 0.180 3.220 0.007Ordinal by Ordinal Spearman Correlation 0.458 0.277 1.784 0.100
14Interval by Interval Pearson's R 0.955 0.037 7.181 0.001Ordinal by Ordinal Spearman Correlation 1.000 .000(c)
7Interval by Interval Pearson's R -0.612 0.223 -1.342 0.272Ordinal by Ordinal Spearman Correlation -0.645 0.230 -1.464 0.239
5Interval by Interval Pearson's R 0.074 0.191 0.399 0.693Ordinal by Ordinal Spearman Correlation 0.072 0.187 0.388 0.701
31Interval by Interval Pearson's R 0.132 0.207 0.623 0.540Ordinal by Ordinal Spearman Correlation -0.043 0.219 -0.203 0.841
24Interval by Interval Pearson's R -0.905 0.057 -3.000 0.095Ordinal by Ordinal Spearman Correlation -0.943 0.079 -4.000 0.057
4Interval by Interval Pearson's R 0.598 0.256 1.491 0.210Ordinal by Ordinal Spearman Correlation 0.548 0.235 1.309 0.261
6
26+
N of Valid Cases
16-20
N of Valid Cases21-25
N of Valid Cases
7-10
N of Valid Cases11-15
N of Valid Cases
1-3
N of Valid Cases4-6
N of Valid Cases
Symmetric Measures
<1
N of Valid Cases
N Percent N Percent N PercentTotal Self Efficacy Score (Binned) * matrix * Qualification
113 100.0% 0 0.0% 113 100.0%
Case Processing Summary
CasesValid Missing Total

126
AmbassadorCompany orientated
Career orientated Uncommited
Count 2 0 0 0 2% within Total Self Efficacy Score (Binned) 100.0% 0.0% 0.0% 0.0% 100.0%
Count 2 1 1 0 4% within Total Self Efficacy Score (Binned) 50.0% 25.0% 25.0% 0.0% 100.0%
Count 2 0 0 0 2% within Total Self Efficacy Score (Binned) 100.0% 0.0% 0.0% 0.0% 100.0%
Count 0 0 0 4 4% within Total Self Efficacy Score (Binned) 0.0% 0.0% 0.0% 100.0% 100.0%
Count 6 1 1 4 12% within Total Self Efficacy Score (Binned) 50.0% 8.3% 8.3% 33.3% 100.0%
Count 3 3 3 0 9% within Total Self Efficacy Score (Binned) 33.3% 33.3% 33.3% 0.0% 100.0%
Count 4 2 1 1 8% within Total Self Efficacy Score (Binned) 50.0% 25.0% 12.5% 12.5% 100.0%
Count 8 1 3 1 13% within Total Self Efficacy Score (Binned) 61.5% 7.7% 23.1% 7.7% 100.0%
Count 7 0 1 1 9% within Total Self Efficacy Score (Binned) 77.8% 0.0% 11.1% 11.1% 100.0%
Count 22 6 8 3 39% within Total Self Efficacy Score (Binned) 56.4% 15.4% 20.5% 7.7% 100.0%
Count 8 0 2 10% within Total Self Efficacy Score (Binned) 80.0% 0.0% 20.0% 100.0%
Count 8 0 4 12% within Total Self Efficacy Score (Binned) 66.7% 0.0% 33.3% 100.0%
Count 4 1 1 6% within Total Self Efficacy Score (Binned) 66.7% 16.7% 16.7% 100.0%
Count 5 0 0 5% within Total Self Efficacy Score (Binned) 100.0% 0.0% 0.0% 100.0%
Count 25 1 7 33% within Total Self Efficacy Score (Binned) 75.8% 3.0% 21.2% 100.0%
Count 3 0 1 4% within Total Self Efficacy Score (Binned) 75.0% 0.0% 25.0% 100.0%
Count 3 0 0 3% within Total Self Efficacy Score (Binned) 100.0% 0.0% 0.0% 100.0%
Count 3 2 0 5% within Total Self Efficacy Score (Binned) 60.0% 40.0% 0.0% 100.0%
Count 1 0 0 1% within Total Self Efficacy Score (Binned) 100.0% 0.0% 0.0% 100.0%
Count 10 2 1 13% within Total Self Efficacy Score (Binned) 76.9% 15.4% 7.7% 100.0%
Count 4 0 0 0 4% within Total Self Efficacy Score (Binned) 100.0% 0.0% 0.0% 0.0% 100.0%
Count 4 1 0 0 5% within Total Self Efficacy Score (Binned) 80.0% 20.0% 0.0% 0.0% 100.0%
Count 1 0 0 1 2% within Total Self Efficacy Score (Binned) 50.0% 0.0% 0.0% 50.0% 100.0%
Count 2 0 1 2 5% within Total Self Efficacy Score (Binned) 40.0% 0.0% 20.0% 40.0% 100.0%
Count 11 1 1 3 16% within Total Self Efficacy Score (Binned) 68.8% 6.3% 6.3% 18.8% 100.0%
masters/doc Total Self Efficacy Score (Binned)
Quartile1
Quartile2
Quartile3
Quartile4
Total
hons Total Self Efficacy Score (Binned)
Quartile1
Quartile2
Quartile3
Quartile4
Total
degree Total Self Efficacy Score (Binned)
Quartile1
Quartile2
Quartile3
Quartile4
Total
post matric Total Self Efficacy Score (Binned)
Quartile1
Quartile2
Quartile3
Quartile4
Total
matric Total Self Efficacy Score (Binned)
Quartile1
Quartile2
Quartile3
Quartile4
Total
Total Self Efficacy Score (Binned) * matrix * Qualification Crosstabulation
Qualification
matrix
Total

127
Qualification Value dfAsymp. Sig. (2-
sided)Pearson Chi-Square 16.000 9 0.067Likelihood Ratio 18.729 9 0.028Linear-by-Linear Association 6.607 1 0.010
N of Valid Cases 12Pearson Chi-Square 8.417 9 0.493Likelihood Ratio 10.072 9 0.345Linear-by-Linear Association 0.869 1 0.351
N of Valid Cases 39Pearson Chi-Square 7.065 6 0.315Likelihood Ratio 6.888 6 0.331Linear-by-Linear Association 0.574 1 0.449
N of Valid Cases 33Pearson Chi-Square 5.915 6 0.433Likelihood Ratio 6.636 6 0.356Linear-by-Linear Association 0.028 1 0.867
N of Valid Cases 13Pearson Chi-Square 9.697 9 0.376Likelihood Ratio 11.052 9 0.272Linear-by-Linear Association 5.010 1 0.025
N of Valid Cases 16
hons
masters/doc
Chi-Square Tests
matric
post matric
degree
Qualification ValueAsymp. Std.
Error Approx. T Approx. Sig.Interval by Interval Pearson's R 0.775 0.109 3.878 0.003Ordinal by Ordinal Spearman
Correlation 0.761 0.163 3.712 0.004
12Interval by Interval Pearson's R -0.151 0.155 -0.931 0.358Ordinal by Ordinal Spearman
Correlation -0.219 0.157 -1.367 0.180
39Interval by Interval Pearson's R -0.134 0.130 -0.753 0.457Ordinal by Ordinal Spearman
Correlation -0.080 0.150 -0.445 0.660
33Interval by Interval Pearson's R -0.048 0.290 -0.160 0.876Ordinal by Ordinal Spearman
Correlation 0.018 0.303 0.058 0.954
13Interval by Interval Pearson's R 0.578 0.157 2.650 0.019Ordinal by Ordinal Spearman
Correlation 0.547 0.163 2.445 0.028
16
hons
N of Valid Casesmasters/doc
N of Valid Cases
post matric
N of Valid Casesdegree
N of Valid Cases
Symmetric Measures
matric
N of Valid Cases
N Percent N Percent N PercentTotal Self Efficacy Score (Binned) * Age * Qualification 113 100.0% 0 0.0% 113 100.0%
Case Processing Summary
CasesValid Missing Total

128
<20 20-29 30-39 40-49 50-59 60+Count 0 0 1 1 2% within Total Self Efficacy Score (Binned) 0.0% 0.0% 50.0% 50.0% 100.0%
Count 0 0 2 2 4% within Total Self Efficacy Score (Binned) 0.0% 0.0% 50.0% 50.0% 100.0%
Count 0 0 0 2 2% within Total Self Efficacy Score (Binned) 0.0% 0.0% 0.0% 100.0% 100.0%
Count 1 1 1 1 4% within Total Self Efficacy Score (Binned) 25.0% 25.0% 25.0% 25.0% 100.0%
Count 1 1 4 6 12% within Total Self Efficacy Score (Binned) 8.3% 8.3% 33.3% 50.0% 100.0%
Count 2 1 1 4 1 9% within Total Self Efficacy Score (Binned) 22.2% 11.1% 11.1% 44.4% 11.1% 100.0%
Count 0 1 2 4 1 8% within Total Self Efficacy Score (Binned) 0.0% 12.5% 25.0% 50.0% 12.5% 100.0%
Count 0 2 4 7 0 13% within Total Self Efficacy Score (Binned) 0.0% 15.4% 30.8% 53.8% 0.0% 100.0%
Count 0 1 0 7 1 9% within Total Self Efficacy Score (Binned) 0.0% 11.1% 0.0% 77.8% 11.1% 100.0%
Count 2 5 7 22 3 39% within Total Self Efficacy Score (Binned) 5.1% 12.8% 17.9% 56.4% 7.7% 100.0%
Count 2 1 7 0 0 10% within Total Self Efficacy Score (Binned) 20.0% 10.0% 70.0% 0.0% 0.0% 100.0%
Count 1 2 3 6 0 12% within Total Self Efficacy Score (Binned) 8.3% 16.7% 25.0% 50.0% 0.0% 100.0%
Count 2 1 2 1 0 6% within Total Self Efficacy Score (Binned) 33.3% 16.7% 33.3% 16.7% 0.0% 100.0%
Count 0 1 2 0 2 5% within Total Self Efficacy Score (Binned) 0.0% 20.0% 40.0% 0.0% 40.0% 100.0%
Count 5 5 14 7 2 33% within Total Self Efficacy Score (Binned) 15.2% 15.2% 42.4% 21.2% 6.1% 100.0%
Count 0 3 1 0 4% within Total Self Efficacy Score (Binned) 0.0% 75.0% 25.0% 0.0% 100.0%
Count 0 2 0 1 3% within Total Self Efficacy Score (Binned) 0.0% 66.7% 0.0% 33.3% 100.0%
Count 1 1 0 3 5% within Total Self Efficacy Score (Binned) 20.0% 20.0% 0.0% 60.0% 100.0%
Count 0 1 0 0 1% within Total Self Efficacy Score (Binned) 0.0% 100.0% 0.0% 0.0% 100.0%
Count 1 7 1 4 13% within Total Self Efficacy Score (Binned) 7.7% 53.8% 7.7% 30.8% 100.0%
Count 1 1 1 1 4% within Total Self Efficacy Score (Binned) 25.0% 25.0% 25.0% 25.0% 100.0%
Count 1 0 3 1 5% within Total Self Efficacy Score (Binned) 20.0% 0.0% 60.0% 20.0% 100.0%
Count 0 0 1 1 2% within Total Self Efficacy Score (Binned) 0.0% 0.0% 50.0% 50.0% 100.0%
Count 0 2 2 1 5% within Total Self Efficacy Score (Binned) 0.0% 40.0% 40.0% 20.0% 100.0%
Count 2 3 7 4 16% within Total Self Efficacy Score (Binned) 12.5% 18.8% 43.8% 25.0% 100.0%
Total Self Efficacy Score (Binned) * Age * Qualification Crosstabulation
Qualification Age
Totalmatric Total Self Efficacy
Score (Binned)Quartile1
Quartile2
Quartile3
Quartile4
Total
post matric Total Self Efficacy Score (Binned)
Quartile1
Quartile2
Quartile3
Quartile4
Total
degree Total Self Efficacy Score (Binned)
Quartile1
Quartile2
Quartile3
Quartile4
Total
hons Total Self Efficacy Score (Binned)
Quartile1
Quartile2
Quartile3
Quartile4
Total
masters/doc Total Self Efficacy Score (Binned)
Quartile1
Quartile2
Quartile3
Quartile4
Total

129
Qualification Value dfAsymp. Sig.
(2-sided)Pearson Chi-Square 6.750 9 0.663Likelihood Ratio 7.638 9 0.571Linear-by-Linear Association
1.829 1 0.176
N of Valid Cases 12Pearson Chi-Square 12.581 12 0.400Likelihood Ratio 14.065 12 0.297Linear-by-Linear Association
1.903 1 0.168
N of Valid Cases 39Pearson Chi-Square 24.774 12 0.016Likelihood Ratio 23.358 12 0.025Linear-by-Linear Association 1.385 1 0.239
N of Valid Cases 33Pearson Chi-Square 8.667 9 0.469Likelihood Ratio 10.535 9 0.309Linear-by-Linear Association
0.346 1 0.556
N of Valid Cases 13Pearson Chi-Square 5.457 9 0.793Likelihood Ratio 7.111 9 0.626Linear-by-Linear Association
0.295 1 0.587
N of Valid Cases 16
hons
masters/doc
Chi-Square Tests
matric
post matric
degree
Qualification ValueAsymp. Std.
Error Approx. T Approx. Sig.Interval by Interval Pearson's R -0.408 0.216 -1.412 0.188Ordinal by Ordinal Spearman
Correlation -0.309 0.290 -1.028 0.328
12Interval by Interval Pearson's R 0.224 0.169 1.397 0.171Ordinal by Ordinal Spearman
Correlation 0.182 0.169 1.126 0.267
39Interval by Interval Pearson's R 0.208 0.169 1.184 0.245Ordinal by Ordinal Spearman
Correlation 0.175 0.170 0.989 0.330
33Interval by Interval Pearson's R 0.170 0.229 0.571 0.579Ordinal by Ordinal Spearman
Correlation 0.140 0.262 0.470 0.648
13Interval by Interval Pearson's R 0.140 0.239 0.530 0.604Ordinal by Ordinal Spearman
Correlation 0.101 0.263 0.380 0.710
16
Symmetric Measures
matric
N of Valid Casespost matric
N of Valid Cases
masters/doc
N of Valid Cases
degree
N of Valid Caseshons
N of Valid Cases
N Percent N Percent N PercentTotal Self Efficacy Score (Binned) * Gender * Qualification 113 100.0% 0 0.0% 113 100.0%
Case Processing Summary
CasesValid Missing Total

130
male femaleCount 0 2 2% within Total Self Efficacy Score (Binned)
0.0% 100.0% 100.0%
Count 0 4 4% within Total Self Efficacy Score (Binned)
0.0% 100.0% 100.0%
Count 0 2 2% within Total Self Efficacy Score (Binned)
0.0% 100.0% 100.0%
Count 2 2 4% within Total Self Efficacy Score (Binned)
50.0% 50.0% 100.0%
Count 2 10 12% within Total Self Efficacy Score (Binned)
16.7% 83.3% 100.0%
Count 6 3 9% within Total Self Efficacy Score (Binned)
66.7% 33.3% 100.0%
Count 7 1 8% within Total Self Efficacy Score (Binned)
87.5% 12.5% 100.0%
Count 10 3 13% within Total Self Efficacy Score (Binned)
76.9% 23.1% 100.0%
Count 8 1 9% within Total Self Efficacy Score (Binned)
88.9% 11.1% 100.0%
Count 31 8 39% within Total Self Efficacy Score (Binned)
79.5% 20.5% 100.0%
degree Total Self Efficacy Score (Binned)
Count9 1 10
% within Total Self Efficacy Score (Binned)
90.0% 10.0% 100.0%
Count 11 1 12% within Total Self Efficacy Score (Binned)
91.7% 8.3% 100.0%
Count 4 2 6% within Total Self Efficacy Score (Binned)
66.7% 33.3% 100.0%
Total Self Efficacy Score (Binned) * Gemder * Qualification Crosstabulation
Qualification Gender
Totalmatric Total Self Efficacy
Score (Binned)Quartile1
Quartile2
Quartile3
Quartile4
Total
post matric Total Self Efficacy Score (Binned)
Quartile1
Quartile2
Quartile3
Quartile4
Total
Quartile1
Quartile2
Quartile3

131
male femaleCount 4 1 5% within Total Self Efficacy Score (Binned)
80.0% 20.0% 100.0%
Count 28 5 33% within Total Self Efficacy Score (Binned)
84.8% 15.2% 100.0%
Count 1 3 4% within Total Self Efficacy Score (Binned)
25.0% 75.0% 100.0%
Count 3 0 3% within Total Self Efficacy Score (Binned)
100.0% 0.0% 100.0%
Count 3 2 5% within Total Self Efficacy Score (Binned)
60.0% 40.0% 100.0%
Count 0 1 1% within Total Self Efficacy Score (Binned)
0.0% 100.0% 100.0%
Count 7 6 13% within Total Self Efficacy Score (Binned)
53.8% 46.2% 100.0%
Count 3 1 4% within Total Self Efficacy Score (Binned)
75.0% 25.0% 100.0%
Count 4 1 5% within Total Self Efficacy Score (Binned)
80.0% 20.0% 100.0%
Count 2 0 2% within Total Self Efficacy Score (Binned)
100.0% 0.0% 100.0%
Count 4 1 5% within Total Self Efficacy Score (Binned)
80.0% 20.0% 100.0%
Count 13 3 16% within Total Self Efficacy Score (Binned)
81.3% 18.8% 100.0%
Total
Quartile4
Total
Quartile1
Quartile2
Quartile3
Quartile4
Total
masters/doc Total Self Efficacy Score (Binned)
Quartile1
Quartile2
Quartile3
Quartile4
Total
hons Total Self Efficacy Score (Binned)
Qualification Gender

132
Qualification Value dfAsymp. Sig.
(2-sided)Pearson Chi-Square 4.800 3 0.187Likelihood Ratio 5.268 3 0.153Linear-by-Linear Association 3.200 1 0.074
N of Valid Cases 12Pearson Chi-Square 1.763 3 0.623Likelihood Ratio 1.770 3 0.622Linear-by-Linear Association 0.828 1 0.363
N of Valid Cases 39Pearson Chi-Square 2.275 3 0.517Likelihood Ratio 2.044 3 0.563Linear-by-Linear Association 0.945 1 0.331
N of Valid Cases 33Pearson Chi-Square 5.154 3 0.161Likelihood Ratio 6.716 3 0.082Linear-by-Linear Association 0.045 1 0.833
N of Valid Cases 13Pearson Chi-Square 0.574 3 0.902Likelihood Ratio 0.936 3 0.817Linear-by-Linear Association 0.070 1 0.791
N of Valid Cases 16
hons
masters/doc
Chi-Square Tests
matric
post matric
degree
Qualification ValueAsymp. Std.
Error Approx. T Approx. Sig.Interval by Interval Pearson's R -0.539 0.165 -2.025 0.070Ordinal by Ordinal Spearman
Correlation -0.539 0.164 -2.025 0.070
12Interval by Interval Pearson's R -0.148 0.160 -0.908 0.370Ordinal by Ordinal Spearman
Correlation -0.143 0.158 -0.881 0.384
39Interval by Interval Pearson's R 0.172 0.175 0.971 0.339Ordinal by Ordinal Spearman
Correlation 0.176 0.174 0.997 0.326
33Interval by Interval Pearson's R -0.061 0.289 -0.203 0.843Ordinal by Ordinal Spearman
Correlation -0.065 0.312 -0.216 0.833
13Interval by Interval Pearson's R -0.068 0.263 -0.256 0.802Ordinal by Ordinal Spearman
Correlation -0.072 0.264 -0.271 0.790
16
Symmetric Measures
matric
N of Valid Casespost matric
N of Valid Cases
masters/doc
N of Valid Cases
degree
N of Valid Caseshons
N of Valid Cases
N Percent N Percent N PercentTotal Self Efficacy Score (Binned) * Population Group * Qualification 113 100.0% 0 0.0% 113 100.0%
Case Processing Summary
CasesValid Missing Total

133
asian black whiteCount 0 2 2% within Total Self Efficacy Score (Binned)
0.0% 100.0% 100.0%
Count 0 4 4% within Total Self Efficacy Score (Binned)
0.0% 100.0% 100.0%
Count 0 2 2% within Total Self Efficacy Score (Binned)
0.0% 100.0% 100.0%
Count 1 3 4% within Total Self Efficacy Score (Binned)
25.0% 75.0% 100.0%
Count 1 11 12% within Total Self Efficacy Score (Binned)
8.3% 91.7% 100.0%
Count 0 0 9 9% within Total Self Efficacy Score (Binned)
0.0% 0.0% 100.0% 100.0%
Count 1 0 7 8% within Total Self Efficacy Score (Binned)
12.5% 0.0% 87.5% 100.0%
Count 0 1 12 13% within Total Self Efficacy Score (Binned)
0.0% 7.7% 92.3% 100.0%
Count 0 0 9 9% within Total Self Efficacy Score (Binned)
0.0% 0.0% 100.0% 100.0%
Count 1 1 37 39% within Total Self Efficacy Score (Binned)
2.6% 2.6% 94.9% 100.0%
degree Total Self Efficacy Score (Binned)
Count5 5 10
% within Total Self Efficacy Score (Binned)
50.0% 50.0% 100.0%
Count 0 12 12% within Total Self Efficacy Score (Binned)
0.0% 100.0% 100.0%
Count 2 4 6% within Total Self Efficacy Score (Binned)
33.3% 66.7% 100.0%
Total Self Efficacy Score (Binned) * Population Group * Qualification Crosstabulation
Qualification Population Group
Totalmatric Total Self Efficacy
Score (Binned)Quartile1
Quartile2
Quartile3
Quartile4
Total
post matric Total Self Efficacy Score (Binned)
Quartile1
Quartile2
Quartile3
Quartile4
Total
Quartile1
Quartile2
Quartile3

134
asian black whiteCount 0 5 5% within Total Self Efficacy Score (Binned)
0.0% 100.0% 100.0%
Count 7 26 33% within Total Self Efficacy Score (Binned)
21.2% 78.8% 100.0%
Count 0 4 4% within Total Self Efficacy Score (Binned)
0.0% 100.0% 100.0%
Count 0 3 3% within Total Self Efficacy Score (Binned)
0.0% 100.0% 100.0%
Count 1 4 5% within Total Self Efficacy Score (Binned)
20.0% 80.0% 100.0%
Count 0 1 1% within Total Self Efficacy Score (Binned)
0.0% 100.0% 100.0%
Count 1 12 13% within Total Self Efficacy Score (Binned)
7.7% 92.3% 100.0%
Count 1 3 4% within Total Self Efficacy Score (Binned)
25.0% 75.0% 100.0%
Count 0 5 5% within Total Self Efficacy Score (Binned)
0.0% 100.0% 100.0%
Count 0 2 2% within Total Self Efficacy Score (Binned)
0.0% 100.0% 100.0%
Count 0 5 5% within Total Self Efficacy Score (Binned)
0.0% 100.0% 100.0%
Count 1 15 16% within Total Self Efficacy Score (Binned)
6.3% 93.8% 100.0%
Total
Quartile4
hons Total Self Efficacy Score (Binned)
Quartile1
Quartile2
Quartile3
Quartile4
Total
masters/doc Total Self Efficacy Score (Binned)
Quartile1
Quartile2
Quartile3
Quartile4
Total
Population GroupTotalQualification

135
Qualification Value dfAsymp. Sig.
(2-sided)Pearson Chi-Square 2.182 3 0.536Likelihood Ratio 2.385 3 0.496Linear-by-Linear Association 1.455 1 0.228
N of Valid Cases 12Pearson Chi-Square 5.980 6 0.425Likelihood Ratio 5.471 6 0.485Linear-by-Linear Association 0.045 1 0.831
N of Valid Cases 39Pearson Chi-Square 10.063 3 0.018Likelihood Ratio 12.605 3 0.006Linear-by-Linear Association 3.034 1 0.082
N of Valid Cases 33Pearson Chi-Square 1.733 3 0.630Likelihood Ratio 2.047 3 0.563Linear-by-Linear Association 0.625 1 0.429
N of Valid Cases 13Pearson Chi-Square 3.200 3 0.362Likelihood Ratio 2.983 3 0.394Linear-by-Linear Association 1.636 1 0.201
N of Valid Cases 16
hons
masters/doc
Chi-Square Tests
matric
post matric
degree
Qualification ValueAsymp. Std.
Error Approx. T Approx. Sig.Interval by Interval Pearson's R -0.364 0.173 -1.234 0.245Ordinal by Ordinal Spearman
Correlation -0.364 0.172 -1.234 0.245
12Interval by Interval Pearson's R 0.035 0.078 0.210 0.835Ordinal by Ordinal Spearman
Correlation 0.030 0.089 0.180 0.858
39Interval by Interval Pearson's R 0.308 0.151 1.802 0.081Ordinal by Ordinal Spearman
Correlation 0.330 0.176 1.943 0.061
33Interval by Interval Pearson's R -0.228 0.134 -0.777 0.453Ordinal by Ordinal Spearman
Correlation -0.243 0.141 -0.831 0.424
13Interval by Interval Pearson's R 0.330 0.155 1.309 0.212Ordinal by Ordinal Spearman
Correlation 0.349 0.164 1.395 0.185
16
Symmetric Measures
matric
N of Valid Casespost matric
N of Valid Cases
masters/doc
N of Valid Cases
degree
N of Valid Caseshons
N of Valid Cases
N Percent N Percent N PercentTotal Self Efficacy Score (Binned) * Division * Qualification 113 100.0% 0 0.0% 113 100.0%
Case Processing Summary
CasesValid Missing Total

136
Qualification Value dfAsymp. Sig.
(2-sided)Pearson Chi-Square 4.833 6 0.565Likelihood Ratio 5.545 6 0.476Linear-by-Linear Association 0.140 1 0.709
N of Valid Cases 12Pearson Chi-Square 33.546 21 0.041Likelihood Ratio 37.960 21 0.013Linear-by-Linear Association 0.009 1 0.925
N of Valid Cases 39Pearson Chi-Square 20.143 18 0.325Likelihood Ratio 22.456 18 0.212Linear-by-Linear Association 1.525 1 0.217
N of Valid Cases 33Pearson Chi-Square 22.533 18 0.209Likelihood Ratio 22.502 18 0.210Linear-by-Linear Association 3.143 1 0.076
N of Valid Cases 13Pearson Chi-Square 16.800 15 0.331Likelihood Ratio 16.671 15 0.339Linear-by-Linear Association 0.690 1 0.406
N of Valid Cases 16
hons
masters/doc
Chi-Square Tests
matric
post matric
degree
Qualification ValueAsymp. Std.
Error Approx. T Approx. Sig.Interval by Interval Pearson's R -0.113 0.365 -0.359 0.727Ordinal by Ordinal Spearman
Correlation -0.158 0.340 -0.506 0.624
12Interval by Interval Pearson's R 0.015 0.128 0.092 0.927Ordinal by Ordinal Spearman
Correlation -0.050 0.158 -0.303 0.764
39Interval by Interval Pearson's R -0.218 0.164 -1.246 0.222Ordinal by Ordinal Spearman
Correlation -0.251 0.162 -1.445 0.158
33Interval by Interval Pearson's R 0.512 0.180 1.976 0.074Ordinal by Ordinal Spearman
Correlation 0.544 0.208 2.151 0.055
13Interval by Interval Pearson's R -0.214 0.230 -0.822 0.425Ordinal by Ordinal Spearman
Correlation -0.179 0.242 -0.681 0.507
16
hons
N of Valid Casesmasters/doc
N of Valid Cases
post matric
N of Valid Casesdegree
N of Valid Cases
Symmetric Measures
matric
N of Valid Cases
N Percent N Percent N PercentTotal Self Efficacy Score (Binned) * Monthly HH Income * Qualification 113 100.0% 0 0.0% 113 100.0%
Case Processing Summary
CasesValid Missing Total

137
<10 10-25 25-40 40+Count 2 0 0 0 2% within Total Self Efficacy Score (Binned)
100.0% 0.0% 0.0% 0.0% 100.0%
Count 0 2 2 0 4% within Total Self Efficacy Score (Binned)
0.0% 50.0% 50.0% 0.0% 100.0%
Count 2 0 0 0 2% within Total Self Efficacy Score (Binned)
100.0% 0.0% 0.0% 0.0% 100.0%
Count 2 1 0 1 4% within Total Self Efficacy Score (Binned)
50.0% 25.0% 0.0% 25.0% 100.0%
Count 6 3 2 1 12% within Total Self Efficacy Score (Binned)
50.0% 25.0% 16.7% 8.3% 100.0%
Count 2 5 1 1 9% within Total Self Efficacy Score (Binned)
22.2% 55.6% 11.1% 11.1% 100.0%
Count 1 2 3 2 8% within Total Self Efficacy Score (Binned)
12.5% 25.0% 37.5% 25.0% 100.0%
Count 1 3 7 2 13% within Total Self Efficacy Score (Binned)
7.7% 23.1% 53.8% 15.4% 100.0%
Count 0 7 0 2 9% within Total Self Efficacy Score (Binned)
0.0% 77.8% 0.0% 22.2% 100.0%
Count 4 17 11 7 39% within Total Self Efficacy Score (Binned)
10.3% 43.6% 28.2% 17.9% 100.0%
degree Total Self Efficacy Score (Binned)
Count2 3 0 5 10
% within Total Self Efficacy Score (Binned)
20.0% 30.0% 0.0% 50.0% 100.0%
Count 1 1 7 3 12% within Total Self Efficacy Score (Binned)
8.3% 8.3% 58.3% 25.0% 100.0%
Count 4 0 1 1 6% within Total Self Efficacy Score (Binned)
66.7% 0.0% 16.7% 16.7% 100.0%
Quartile1
Quartile2
Quartile3
post matric Total Self Efficacy Score (Binned)
Quartile1
Quartile2
Quartile3
Quartile4
Total
matric Total Self Efficacy Score (Binned)
Quartile1
Quartile2
Quartile3
Quartile4
Total
Total Self Efficacy Score (Binned) * Monthly HH Income * Qualification Crosstabulation
Qualification Monthly HH Income
Total

138
<10 10-25 25-40 40+Count 0 1 0 4 5% within Total Self Efficacy Score (Binned)
0.0% 20.0% 0.0% 80.0% 100.0%
Count 7 5 8 13 33% within Total Self Efficacy Score (Binned)
21.2% 15.2% 24.2% 39.4% 100.0%
Count 0 4 0 4% within Total Self Efficacy Score (Binned)
0.0% 100.0% 0.0% 100.0%
Count 0 2 1 3% within Total Self Efficacy Score (Binned)
0.0% 66.7% 33.3% 100.0%
Count 0 3 2 5% within Total Self Efficacy Score (Binned)
0.0% 60.0% 40.0% 100.0%
Count 1 0 0 1% within Total Self Efficacy Score (Binned)
100.0% 0.0% 0.0% 100.0%
Count 1 9 3 13% within Total Self Efficacy Score (Binned)
7.7% 69.2% 23.1% 100.0%
Count 1 0 3 4% within Total Self Efficacy Score (Binned)
25.0% 0.0% 75.0% 100.0%
Count 1 0 4 5% within Total Self Efficacy Score (Binned)
20.0% 0.0% 80.0% 100.0%
Count 0 1 1 2% within Total Self Efficacy Score (Binned)
0.0% 50.0% 50.0% 100.0%
Count 1 2 2 5% within Total Self Efficacy Score (Binned)
20.0% 40.0% 40.0% 100.0%
Count 3 3 10 16% within Total Self Efficacy Score (Binned)
18.8% 18.8% 62.5% 100.0%
masters/doc Total Self Efficacy Score (Binned)
Quartile1
Quartile2
Quartile3
Quartile4
Total
Total
hons Total Self Efficacy Score (Binned)
Quartile1
Quartile2
Quartile3
Quartile4
Total
Quartile4
Monthly HH IncomeTotalQualification

139
Qualification Value dfAsymp. Sig.
(2-sided)Pearson Chi-Square 12.000 9 0.213Likelihood Ratio 14.909 9 0.093Linear-by-Linear Association 0.114 1 0.735
N of Valid Cases 12Pearson Chi-Square 14.242 9 0.114Likelihood Ratio 16.908 9 0.050Linear-by-Linear Association 0.699 1 0.403
N of Valid Cases 39Pearson Chi-Square 23.987 9 0.004Likelihood Ratio 25.661 9 0.002Linear-by-Linear Association 0.089 1 0.765
N of Valid Cases 33Pearson Chi-Square 15.215 6 0.019Likelihood Ratio 9.998 6 0.125Linear-by-Linear Association 0.056 1 0.813
N of Valid Cases 13Pearson Chi-Square 5.200 6 0.518Likelihood Ratio 6.663 6 0.353Linear-by-Linear Association 0.429 1 0.513
N of Valid Cases 16
hons
masters/doc
Chi-Square Tests
matric
post matric
degree
Qualification ValueAsymp. Std.
Error Approx. T Approx. Sig.Interval by Interval Pearson's R 0.102 0.289 0.324 0.753Ordinal by Ordinal Spearman
Correlation 0.047 0.318 0.149 0.884
12Interval by Interval Pearson's R 0.136 0.156 0.832 0.411Ordinal by Ordinal Spearman
Correlation 0.107 0.163 0.654 0.517
39Interval by Interval Pearson's R 0.053 0.181 0.294 0.770Ordinal by Ordinal Spearman
Correlation 0.023 0.195 0.128 0.899
33Interval by Interval Pearson's R -0.068 0.327 -0.228 0.824Ordinal by Ordinal Spearman
Correlation 0.000 0.354 0.000 1.000
13Interval by Interval Pearson's R -0.169 0.261 -0.642 0.531Ordinal by Ordinal Spearman
Correlation -0.232 0.262 -0.892 0.387
16
hons
N of Valid Casesmasters/doc
N of Valid Cases
post matric
N of Valid Casesdegree
N of Valid Cases
Symmetric Measures
matric
N of Valid Cases
N Percent N Percent N PercentTotal Self Efficacy Score (Binned) * Tenure * Qualification 113 100.0% 0 0.0% 113 100.0%
Case Processing Summary
CasesValid Missing Total

140
<1 1-3 4-6 7-10 11-15 16-20 21-25 26+Count 1 1 0 0 2% within Total Self Efficacy Score (Binned)
50.0% 50.0% 0.0% 0.0% 100.0%
Count 0 4 0 0 4% within Total Self Efficacy Score (Binned)
0.0% 100.0% 0.0% 0.0% 100.0%
Count 0 0 0 2 2% within Total Self Efficacy Score (Binned)
0.0% 0.0% 0.0% 100.0% 100.0%
Count 2 1 1 0 4% within Total Self Efficacy Score (Binned)
50.0% 25.0% 25.0% 0.0% 100.0%
Count 3 6 1 2 12% within Total Self Efficacy Score (Binned)
25.0% 50.0% 8.3% 16.7% 100.0%
Count 1 1 1 0 1 2 2 1 9% within Total Self Efficacy Score (Binned)
11.1% 11.1% 11.1% 0.0% 11.1% 22.2% 22.2% 11.1% 100.0%
Count 1 1 0 0 1 3 1 1 8% within Total Self Efficacy Score (Binned)
12.5% 12.5% 0.0% 0.0% 12.5% 37.5% 12.5% 12.5% 100.0%
Count 2 0 0 1 4 6 0 0 13% within Total Self Efficacy Score (Binned)
15.4% 0.0% 0.0% 7.7% 30.8% 46.2% 0.0% 0.0% 100.0%
Count 5 0 0 0 1 1 0 2 9% within Total Self Efficacy Score (Binned)
55.6% 0.0% 0.0% 0.0% 11.1% 11.1% 0.0% 22.2% 100.0%
Count 9 2 1 1 7 12 3 4 39% within Total Self Efficacy Score (Binned)
23.1% 5.1% 2.6% 2.6% 17.9% 30.8% 7.7% 10.3% 100.0%
Count 2 0 1 2 2 3 0 10% within Total Self Efficacy Score (Binned)
20.0% 0.0% 10.0% 20.0% 20.0% 30.0% 0.0% 100.0%
Count 1 2 0 0 4 4 1 12% within Total Self Efficacy Score (Binned)
8.3% 16.7% 0.0% 0.0% 33.3% 33.3% 8.3% 100.0%
Count 3 0 1 0 2 0 0 6% within Total Self Efficacy Score (Binned)
50.0% 0.0% 16.7% 0.0% 33.3% 0.0% 0.0% 100.0%
Count 0 0 0 0 4 1 0 5% within Total Self Efficacy Score (Binned)
0.0% 0.0% 0.0% 0.0% 80.0% 20.0% 0.0% 100.0%
Count 6 2 2 2 12 8 1 33% within Total Self Efficacy Score (Binned)
18.2% 6.1% 6.1% 6.1% 36.4% 24.2% 3.0% 100.0%
hons Total Self Efficacy Score (Binned)
Count0 0 3 0 1 0 4
% within Total Self Efficacy Score (Binned)
0.0% 0.0% 75.0% 0.0% 25.0% 0.0% 100.0%
Count 0 1 0 0 2 0 3% within Total Self Efficacy Score (Binned)
0.0% 33.3% 0.0% 0.0% 66.7% 0.0% 100.0%
Quartile1
Quartile2
degree Total Self Efficacy Score (Binned)
Quartile1
Quartile2
Quartile3
Quartile4
Total
Total
post matric Total Self Efficacy Score (Binned)
Quartile1
Quartile2
Quartile3
Quartile4
Total
Total Self Efficacy Score (Binned)
Quartile1
Quartile2
Quartile3
Quartile4
Total Self Efficacy Score (Binned) * Tenure * Qualification Crosstabulation
Qualification Tenure
Totalmatric

141
<1 1-3 4-6 7-10 11-15 16-20 21-25 26+Count 0 1 0 2 1 1 5% within Total Self Efficacy Score (Binned)
0.0% 20.0% 0.0% 40.0% 20.0% 20.0% 100.0%
Count 1 0 0 0 0 0 1% within Total Self Efficacy Score (Binned)
100.0% 0.0% 0.0% 0.0% 0.0% 0.0% 100.0%
Count 1 2 3 2 4 1 13% within Total Self Efficacy Score (Binned)
7.7% 15.4% 23.1% 15.4% 30.8% 7.7% 100.0%
Count 1 1 0 1 1 4% within Total Self Efficacy Score (Binned)
25.0% 25.0% 0.0% 25.0% 25.0% 100.0%
Count 1 1 2 1 0 5% within Total Self Efficacy Score (Binned)
20.0% 20.0% 40.0% 20.0% 0.0% 100.0%
Count 0 0 2 0 0 2% within Total Self Efficacy Score (Binned)
0.0% 0.0% 100.0% 0.0% 0.0% 100.0%
Count 1 0 4 0 0 5% within Total Self Efficacy Score (Binned)
20.0% 0.0% 80.0% 0.0% 0.0% 100.0%
Count 3 2 8 2 1 16% within Total Self Efficacy Score (Binned)
18.8% 12.5% 50.0% 12.5% 6.3% 100.0%
Total
Qualification
masters/doc Total Self Efficacy Score (Binned)
Quartile1
Quartile2
Quartile3
Quartile4
Total
Quartile3
Quartile4
Tenure
Total
Qualification Value dfAsymp. Sig.
(2-sided)Pearson Chi-Square 18.500 9 0.030Likelihood Ratio 17.682 9 0.039Linear-by-Linear Association 0.205 1 0.651
N of Valid Cases 12Pearson Chi-Square 24.623 21 0.264Likelihood Ratio 26.181 21 0.200Linear-by-Linear Association 1.589 1 0.207
N of Valid Cases 39Pearson Chi-Square 22.596 18 0.207Likelihood Ratio 25.074 18 0.123Linear-by-Linear Association 0.018 1 0.893
N of Valid Cases 33Pearson Chi-Square 26.812 15 0.030Likelihood Ratio 21.822 15 0.113Linear-by-Linear Association 0.052 1 0.820
N of Valid Cases 13Pearson Chi-Square 10.667 12 0.558Likelihood Ratio 13.899 12 0.307Linear-by-Linear Association 0.023 1 0.879
N of Valid Cases 16
hons
masters/doc
Chi-Square Tests
matric
post matric
degree

142
Qualification ValueAsymp. Std.
Error Approx. T Approx. Sig.Interval by Interval Pearson's R 0.136 0.188 0.435 0.673Ordinal by Ordinal Spearman
Correlation 0.082 0.342 0.261 0.799
12Interval by Interval Pearson's R -0.205 0.173 -1.271 0.212Ordinal by Ordinal Spearman
Correlation -0.233 0.177 -1.460 0.153
39Interval by Interval Pearson's R 0.024 0.143 0.132 0.896Ordinal by Ordinal Spearman
Correlation -0.023 0.166 -0.127 0.899
33Interval by Interval Pearson's R -0.066 0.304 -0.218 0.831Ordinal by Ordinal Spearman
Correlation -0.055 0.324 -0.181 0.859
13Interval by Interval Pearson's R 0.039 0.273 0.147 0.885Ordinal by Ordinal Spearman
Correlation -0.079 0.304 -0.296 0.772
16
Symmetric Measures
matric
N of Valid Casespost matric
N of Valid Cases
masters/doc
N of Valid Cases
degree
N of Valid Caseshons
N of Valid Cases
N Percent N Percent N Percentmatrix * Age 113 100.0% 0 0.0% 113 100.0%
Case Processing Summary
CasesValid Missing Total
<20 20-29 30-39 40-49 50-59 60+Count 0 7 17 18 27 5 74% within matrix 0.0% 9.5% 23.0% 24.3% 36.5% 6.8% 100.0%Count 0 1 2 1 5 0 9% within matrix 0.0% 11.1% 22.2% 11.1% 55.6% 0.0% 100.0%Count 0 2 4 10 3 0 19% within matrix 0.0% 10.5% 21.1% 52.6% 15.8% 0.0% 100.0%Count 1 1 1 6 2 0 11% within matrix 9.1% 9.1% 9.1% 54.5% 18.2% 0.0% 100.0%Count 1 11 24 35 37 5 113% within matrix 0.9% 9.7% 21.2% 31.0% 32.7% 4.4% 100.0%
matrix * Age Crosstabulation
Age
Total
Total
matrix Ambassador
Company orientated
Career orientated
Uncommited
Value dfAsymp. Sig.
(2-sided)Pearson Chi-Square 24.002 15 0.065Likelihood Ratio 21.061 15 0.135Linear-by-Linear Association 2.518 1 0.113
N of Valid Cases 113
Chi-Square Tests

143
ValueAsymp. Std.
Error Approx. T Approx. Sig.Interval by Interval Pearson's R -0.150 0.090 -1.598 0.113Ordinal by Ordinal Spearman
Correlation -0.137 0.088 -1.456 0.148
113N of Valid Cases
Symmetric Measures
N Percent N Percent N Percentmatrix * Gemder 113 100.0% 0 0.0% 113 100.0%
Case Processing Summary
CasesValid Missing Total
male femaleCount 54 20 74% within matrix 73.0% 27.0% 100.0%Count 3 6 9% within matrix 33.3% 66.7% 100.0%Count 15 4 19% within matrix 78.9% 21.1% 100.0%Count 9 2 11% within matrix 81.8% 18.2% 100.0%Count 81 32 113% within matrix 71.7% 28.3% 100.0%
matrix * Gemder Crosstabulation
Gemder
Total
Total
matrix Ambassador
Company orientated
Career orientated
Uncommited
Value dfAsymp. Sig.
(2-sided)Pearson Chi-Square 7.632 3 0.054Likelihood Ratio 6.875 3 0.076Linear-by-Linear Association 0.270 1 0.603
N of Valid Cases 113
Chi-Square Tests
ValueAsymp. Std.
Error Approx. T Approx. Sig.Interval by Interval
Pearson's R-0.049 0.087 -0.518 0.605
Ordinal by Ordinal
Spearman Correlation -0.009 0.091 -0.090 0.928
113N of Valid Cases
Symmetric Measures
N Percent N Percent N Percentmatrix * Population Group 113 100.0% 0 0.0% 113 100.0%
Case Processing Summary
CasesValid Missing Total

144
asian black whiteCount 1 8 65 74% within matrix 1.4% 10.8% 87.8% 100.0%Count 0 0 9 9% within matrix 0.0% 0.0% 100.0% 100.0%Count 0 2 17 19% within matrix 0.0% 10.5% 89.5% 100.0%Count 1 0 10 11% within matrix 9.1% 0.0% 90.9% 100.0%Count 2 10 101 113% within matrix 1.8% 8.8% 89.4% 100.0%
matrix * Population Group Crosstabulation
Population Group
Total
Total
matrix Ambassador
Company orientated
Career orientated
Uncommited
Value dfAsymp. Sig.
(2-sided)Pearson Chi-Square 6.188 6 0.402Likelihood Ratio 6.762 6 0.343Linear-by-Linear Association 0.033 1 0.855
N of Valid Cases 113
Chi-Square Tests
ValueAsymp. Std.
Error Approx. T Approx. Sig.Interval by Interval Pearson's R 0.017 0.106 0.182 0.856Ordinal by Ordinal Spearman
Correlation 0.050 0.093 0.530 0.597
113N of Valid Cases
Symmetric Measures
N Percent N Percent N Percentmatrix * Division 113 100.0% 0 0.0% 113 100.0%
Case Processing Summary
CasesValid Missing Total
Value dfAsymp. Sig.
(2-sided)Pearson Chi-Square 27.239 24 0.293Likelihood Ratio 32.074 24 0.125Linear-by-Linear Association 0.286 1 0.593
N of Valid Cases 113
Chi-Square Tests
ValueAsymp.
Std. Error Approx. T Approx. Sig.Interval by Interval
Pearson's R-0.051 0.094 -0.533 0.595
Ordinal by Ordinal
Spearman Correlation -0.058 0.095 -0.607 0.545
113
Symmetric Measures
N of Valid Cases
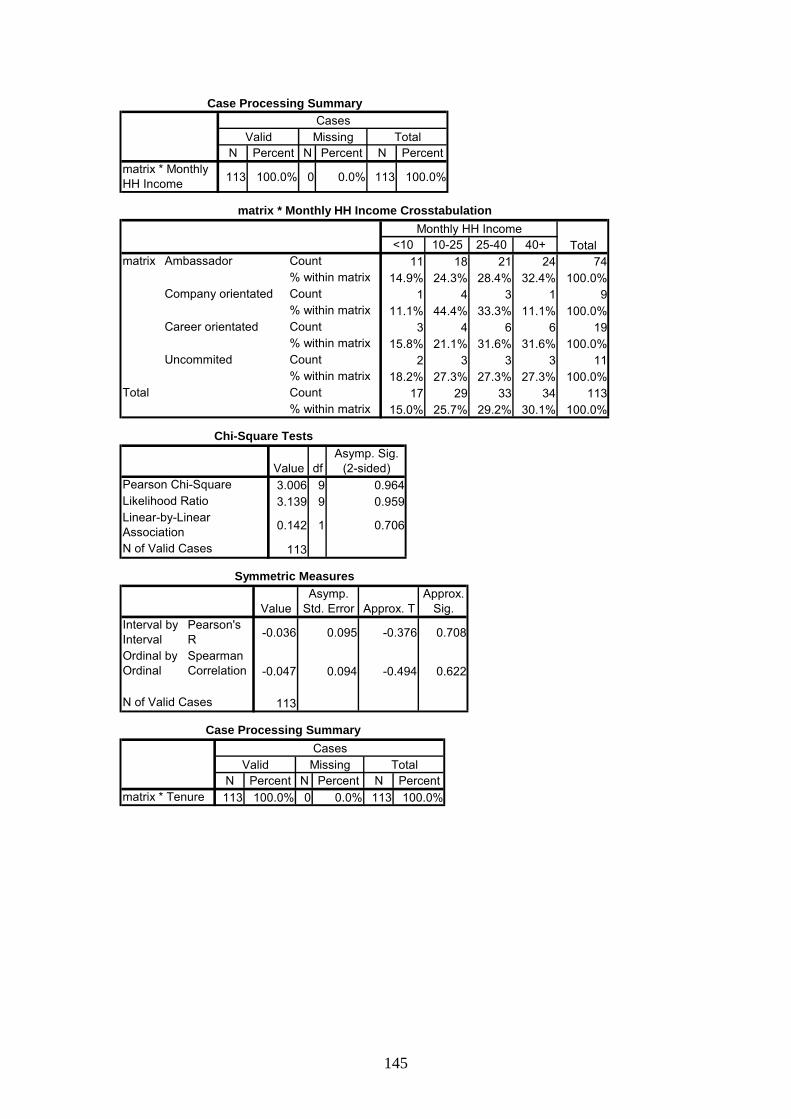
145
N Percent N Percent N Percentmatrix * Monthly HH Income 113 100.0% 0 0.0% 113 100.0%
Case Processing Summary
CasesValid Missing Total
<10 10-25 25-40 40+Count 11 18 21 24 74% within matrix 14.9% 24.3% 28.4% 32.4% 100.0%Count 1 4 3 1 9% within matrix 11.1% 44.4% 33.3% 11.1% 100.0%Count 3 4 6 6 19% within matrix 15.8% 21.1% 31.6% 31.6% 100.0%Count 2 3 3 3 11% within matrix 18.2% 27.3% 27.3% 27.3% 100.0%Count 17 29 33 34 113% within matrix 15.0% 25.7% 29.2% 30.1% 100.0%
Total
matrix Ambassador
Company orientated
Career orientated
Uncommited
matrix * Monthly HH Income Crosstabulation
Monthly HH Income
Total
Value dfAsymp. Sig.
(2-sided)Pearson Chi-Square 3.006 9 0.964Likelihood Ratio 3.139 9 0.959Linear-by-Linear Association 0.142 1 0.706
N of Valid Cases 113
Chi-Square Tests
ValueAsymp.
Std. Error Approx. T Approx.
Sig.Interval by Interval
Pearson's R -0.036 0.095 -0.376 0.708
Ordinal by Ordinal
Spearman Correlation -0.047 0.094 -0.494 0.622
113
Symmetric Measures
N of Valid Cases
N Percent N Percent N Percentmatrix * Tenure 113 100.0% 0 0.0% 113 100.0%
Case Processing Summary
CasesValid Missing Total

146
<1 1-3 4-6 7-10 11-15 16-20 21-25 26+Count 17 9 5 1 20 15 2 5 74% within matrix 23.0% 12.2% 6.8% 1.4% 27.0% 20.3% 2.7% 6.8% 100.0%Count 0 2 1 1 0 5 0 0 9% within matrix 0.0% 22.2% 11.1% 11.1% 0.0% 55.6% 0.0% 0.0% 100.0%Count 3 2 0 3 7 1 2 1 19% within matrix 15.8% 10.5% 0.0% 15.8% 36.8% 5.3% 10.5% 5.3% 100.0%Count 2 1 1 0 4 3 0 0 11% within matrix 18.2% 9.1% 9.1% 0.0% 36.4% 27.3% 0.0% 0.0% 100.0%Count 22 14 7 5 31 24 4 6 113% within matrix 19.5% 12.4% 6.2% 4.4% 27.4% 21.2% 3.5% 5.3% 100.0%
Total
matrix Ambassador
Company orientated
Career orientated
Uncommited
matrix * Tenure Crosstabulation
Tenure
Total
Value dfAsymp. Sig.
(2-sided)Pearson Chi-Square 29.181 21 0.110Likelihood Ratio 33.118 21 0.045Linear-by-Linear Association 0.173 1 0.678
N of Valid Cases 113
Chi-Square Tests
ValueAsymp. Std.
Error Approx. T Approx. Sig.Interval by Interval Pearson's R 0.039 0.089 0.414 0.680Ordinal by Ordinal Spearman
Correlation 0.040 0.091 0.420 0.676
113
Symmetric Measures
N of Valid Cases
N Percent N Percent N Percentmatrix * Qualification 113 100.0% 0 0.0% 113 100.0%
Case Processing Summary
CasesValid Missing Total
matric post matric degree hons masters/docCount 6 22 25 10 11 74% within matrix 8.1% 29.7% 33.8% 13.5% 14.9% 100.0%Count 1 6 1 0 1 9% within matrix 11.1% 66.7% 11.1% 0.0% 11.1% 100.0%Count 1 8 7 2 1 19% within matrix 5.3% 42.1% 36.8% 10.5% 5.3% 100.0%Count 4 3 0 1 3 11% within matrix 36.4% 27.3% 0.0% 9.1% 27.3% 100.0%Count 12 39 33 13 16 113% within matrix 10.6% 34.5% 29.2% 11.5% 14.2% 100.0%
Total
matrix Ambassador
Company orientated
Career orientated
Uncommited
matrix * Qualification Crosstabulation
Qualification
Total
Value dfAsymp. Sig. (2-
sided)Pearson Chi-Square 20.473 12 0.059Likelihood Ratio 21.936 12 0.038Linear-by-Linear Association 1.625 1 0.202N of Valid Cases 113
Chi-Square Tests
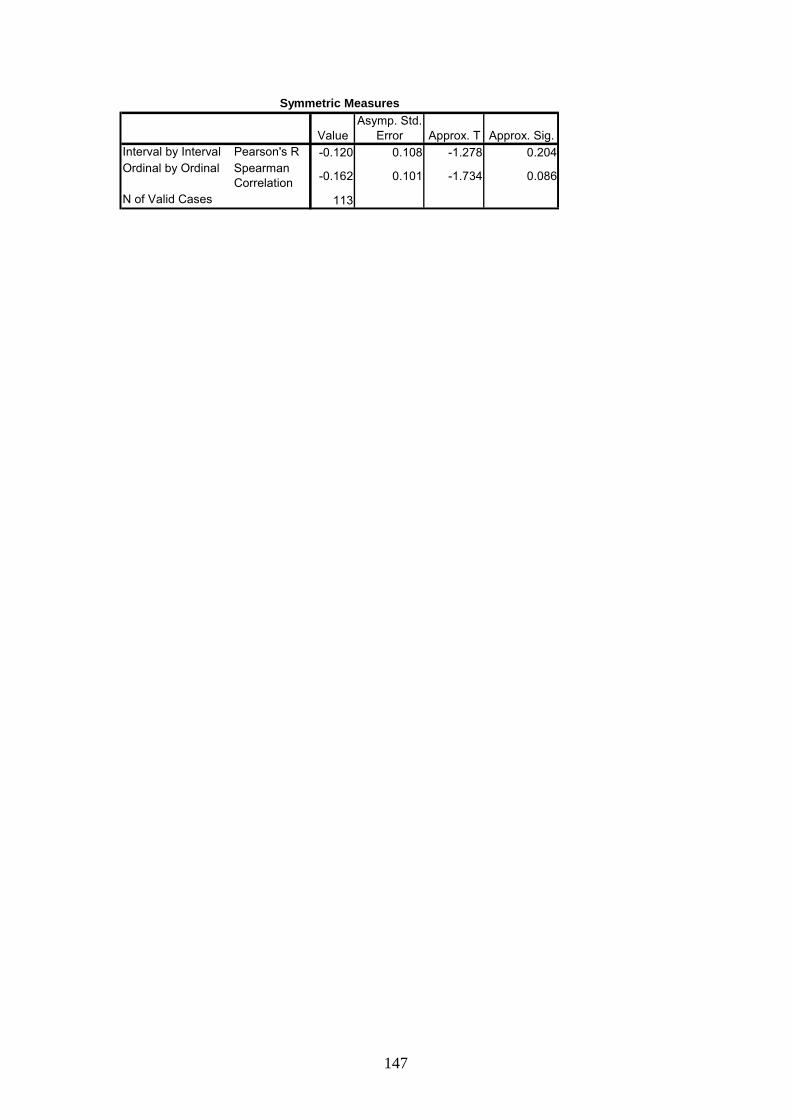
147
ValueAsymp. Std.
Error Approx. T Approx. Sig.Interval by Interval Pearson's R -0.120 0.108 -1.278 0.204Ordinal by Ordinal Spearman
Correlation -0.162 0.101 -1.734 0.086
113N of Valid Cases
Symmetric Measures

148
APPENDIX 3 STEPWISE ANALYSIS

149
Stepwise Statistics
Statistic df1 df2 Sig. Statistic df1 df2 Sig.1
I set my mind to a task almost nothing can stop me. 0.840 1 3 109.000 6.941 3 109.000 0.000
2 I have often burned the midnight oil to finish a task before the deadline 0.735 2 3 109.000 6.003 6 216.000 0.000
3 I feel I am better off to rely on myself for a solution when things are looking bad 0.658 3 3 109.000 5.423 9 260.560 0.000
4When I have difficulty getting what I want, I try harder 0.604 4 3 109.000 4.904 12 280.741 0.000
5Sometimes things just don't seem worth the effort. 0.558 5 3 109.000 4.552 15 290.260 0.000
6 I sometimes avoid difficult tasks 0.514 6 3 109.000 4.345 18 294.642 0.000
c. Minimum significance of F to remove is .10.
df1
At each step, the variable that minimizes the overall Wilks' Lambda is entered.a. Maximum number of steps is 54.b. Maximum significance of F to enter is .05.
Step Entered
Wilks' Lambda
Statisticdf2 df3Exact F Approximate F

150
Step Tolerance Sig. of F to Remove Wilks' Lambda1 I set my mind to a task almost nothing can stop me.
1.000 0.000
I set my mind to a task almost nothing can stop me.0.844 0.000 0.907
I have often burned the midnight oil to finish a task before the deadline 0.844 0.002 0.840
I set my mind to a task almost nothing can stop me. 0.778 0.000 0.852
I have often burned the midnight oil to finish a task before the deadline 0.813 0.001 0.776
I feel I am better off to rely on myself for a solution when things are looking bad 0.915 0.008 0.735
I set my mind to a task almost nothing can stop me. 0.571 0.002 0.692
I have often burned the midnight oil to finish a task before the deadline 0.767 0.000 0.726
I feel I am better off to rely on myself for a solution when things are looking bad 0.914 0.008 0.675
When I have difficulty getting what I want, I try harder 0.589 0.028 0.658
I set my mind to a task almost nothing can stop me. 0.552 0.001 0.653
I have often burned the midnight oil to finish a task before the deadline 0.766 0.000 0.670
I feel I am better off to rely on myself for a solution when things are looking bad 0.890 0.014 0.617
When I have difficulty getting what I want, I try harder0.587 0.027 0.609
Sometimes things just don't seem worth the effort. 0.923 0.038 0.604I set my mind to a task almost nothing can stop me. 0.509 0.002 0.591
I have often burned the midnight oil to finish a task before the deadline 0.764 0.000 0.616
I feel I am better off to rely on myself for a solution when things are looking bad 0.889 0.027 0.561
When I have difficulty getting what I want, I try harder 0.544 0.013 0.570
Sometimes things just don't seem worth the effort. 0.837 0.016 0.567I sometimes avoid difficult tasks 0.837 0.035 0.558
3
4
5
6
Variables in the Analysis
2

151
Step ToleranceMin.
ToleranceSig. of F to
EnterWilks'
LambdaI find it extremely unpleasant to be afraid 1.000 1.000 0.418 0.974I sometimes avoid difficult tasks 1.000 1.000 0.027 0.919I am a very determined person. 1.000 1.000 0.039 0.926I set my mind to a task almost nothing can stop me. 1.000 1.000 0.000 0.840
I have a lot of self-confidence 1.000 1.000 0.002 0.872I am at my best when I am really challenged 1.000 1.000 0.037 0.925
I believe that it is shameful to give up something I started 1.000 1.000 0.053 0.932
I have more than the average amount of self-determination 1.000 1.000 0.001 0.862
Sometimes things just don't seem worth the effort. 1.000 1.000 0.106 0.946
I would rather not try something that I'm not good at. 1.000 1.000 0.506 0.979
I have more fears than most people. 1.000 1.000 0.843 0.992I find it difficult to take risks. 1.000 1.000 0.502 0.979People have a lot of problems but none they will not eventually be able to solve 1.000 1.000 0.335 0.969
I can succeed in almost any endeavour to which I set my mind. 1.000 1.000 0.095 0.944
Nothing is impossible if I really put my mind to it 1.000 1.000 0.001 0.861
I feel I am better off to rely on myself for a solution when things are looking bad 1.000 1.000 0.104 0.945
When put to the test I would remain true to my ideas. 1.000 1.000 0.071 0.938
If a person believes in himself, he/she can make it in the world. 1.000 1.000 0.010 0.902
I feel that chances are very good that I can achieve my goals in life. 1.000 1.000 0.046 0.930
In general I agree that "if first I do not succeed, I'll try again". 1.000 1.000 0.000 0.850
When I have difficulty getting what I want, I try harder 1.000 1.000 0.001 0.862
I excel at few things. 1.000 1.000 0.486 0.978I have often burned the midnight oil to finish a task before the deadline 1.000 1.000 0.014 0.907
I have more willpower than most people 1.000 1.000 0.041 0.928 I become frustrated when I experience physical discomfort 1.000 1.000 0.864 0.993
Nothing is worth subjecting myself to pain for, if I can avoid it. 1.000 1.000 0.444 0.976
I would endure physical discomfort to complete a task because I just don't like to give up.
1.000 1.000 0.036 0.925
1 I find it extremely unpleasant to be afraid 0.922 0.922 0.140 0.798I sometimes avoid difficult tasks 0.990 0.990 0.040 0.778I am a very determined person. 0.810 0.810 0.579 0.825I have a lot of self-confidence 0.661 0.661 0.090 0.791I am at my best when I am really challenged 0.695 0.695 0.305 0.812
I believe that it is shameful to give up something I started 0.832 0.832 0.449 0.819
I have more than the average amount of self-determination 0.599 0.599 0.245 0.808
Sometimes things just don't seem worth the effort. 0.957 0.957 0.024 0.770
Variables Not in the Analysis
0

152
Step ToleranceMin.
ToleranceSig. of F to
EnterWilks'
LambdaI would rather not try something that I'm not good at. 0.999 0.999 0.495 0.821
I have more fears than most people. 0.996 0.996 0.758 0.831I find it difficult to take risks. 0.996 0.996 0.645 0.827People have a lot of problems but none they will not eventually be able to solve 0.997 0.997 0.390 0.817
I can succeed in almost any endeavour to which I set my mind. 0.837 0.837 0.661 0.827
Nothing is impossible if I really put my mind to it 0.607 0.607 0.182 0.803
I feel I am better off to rely on myself for a solution when things are looking bad 0.950 0.950 0.036 0.776
When put to the test I would remain true to my ideas. 0.770 0.770 0.068 0.786
If a person believes in himself, he/she can make it in the world. 0.753 0.753 0.541 0.823
I feel that chances are very good that I can achieve my goals in life. 0.740 0.740 0.343 0.814
In general I agree that "if first I do not succeed, I'll try again". 0.742 0.742 0.129 0.797
When I have difficulty getting what I want, I try harder 0.624 0.624 0.067 0.786
I excel at few things. 0.948 0.948 0.611 0.826I have often burned the midnight oil to finish a task before the deadline 0.844 0.844 0.002 0.735
I have more willpower than most people 0.674 0.674 0.748 0.830 I become frustrated when I experience physical discomfort 0.947 0.947 0.408 0.817
Nothing is worth subjecting myself to pain for, if I can avoid it. 0.929 0.929 0.611 0.826
I would endure physical discomfort to complete a task because I just don't like to give up.
0.677 0.677 0.659 0.827
2 I find it extremely unpleasant to be afraid 0.911 0.769 0.159 0.700I sometimes avoid difficult tasks 0.990 0.837 0.055 0.684I am a very determined person. 0.736 0.736 0.124 0.696I have a lot of self-confidence 0.647 0.616 0.042 0.681I am at my best when I am really challenged
0.634 0.634 0.070 0.688
I believe that it is shameful to give up something I started 0.821 0.743 0.306 0.710
I have more than the average amount of self-determination 0.580 0.570 0.323 0.711
Sometimes things just don't seem worth the effort. 0.950 0.801 0.022 0.672
I would rather not try something that I'm not good at. 0.967 0.816 0.227 0.706
I have more fears than most people. 0.994 0.842 0.817 0.728I find it difficult to take risks. 0.990 0.838 0.535 0.720People have a lot of problems but none they will not eventually be able to solve 0.960 0.812 0.175 0.701
I can succeed in almost any endeavour to which I set my mind. 0.818 0.752 0.823 0.728
Nothing is impossible if I really put my mind to it 0.598 0.569 0.123 0.696
I feel I am better off to rely on myself for a solution when things are looking bad 0.915 0.778 0.008 0.658
When put to the test I would remain true to my ideas. 0.732 0.715 0.239 0.706

153
Step ToleranceMin.
ToleranceSig. of F to
EnterWilks'
LambdaIf a person believes in himself, he/she can make it in the world. 0.734 0.692 0.338 0.712
I feel that chances are very good that I can achieve my goals in life. 0.738 0.639 0.316 0.711
In general I agree that "if first I do not succeed, I'll try again". 0.724 0.682 0.071 0.688
When I have difficulty getting what I want, I try harder 0.590 0.590 0.029 0.675
I excel at few things. 0.948 0.806 0.632 0.723I have more willpower than most people 0.633 0.633 0.512 0.719 I become frustrated when I experience physical discomfort 0.942 0.796 0.357 0.713
Nothing is worth subjecting myself to pain for, if I can avoid it. 0.928 0.787 0.627 0.723
I would endure physical discomfort to complete a task because I just don't like to give up.
0.677 0.604 0.666 0.724
I find it extremely unpleasant to be afraid 0.823 0.741 0.079 0.618I sometimes avoid difficult tasks 0.980 0.768 0.136 0.625I am a very determined person. 0.725 0.686 0.253 0.634I have a lot of self-confidence 0.643 0.569 0.066 0.615I am at my best when I am really challenged
0.630 0.613 0.099 0.621
I believe that it is shameful to give up something I started 0.821 0.688 0.352 0.639
I have more than the average amount of self-determination 0.575 0.524 0.336 0.638
Sometimes things just don't seem worth the effort. 0.926 0.754 0.039 0.609
I would rather not try something that I'm not good at. 0.966 0.770 0.239 0.633
I have more fears than most people. 0.992 0.777 0.858 0.654I find it difficult to take risks. 0.974 0.775 0.714 0.650People have a lot of problems but none they will not eventually be able to solve 0.918 0.777 0.300 0.636
I can succeed in almost any endeavour to which I set my mind. 0.753 0.656 0.547 0.645
Nothing is impossible if I really put my mind to it 0.598 0.538 0.133 0.625
When put to the test I would remain true to my ideas. 0.717 0.683 0.422 0.641
If a person believes in himself, he/she can make it in the world. 0.734 0.643 0.396 0.640
I feel that chances are very good that I can achieve my goals in life. 0.737 0.596 0.308 0.637
In general I agree that "if first I do not succeed, I'll try again". 0.724 0.643 0.071 0.616
When I have difficulty getting what I want, I try harder 0.589 0.571 0.028 0.604
I excel at few things. 0.943 0.751 0.560 0.646I have more willpower than most people 0.633 0.603 0.531 0.645 I become frustrated when I experience physical discomfort 0.935 0.727 0.287 0.636
Nothing is worth subjecting myself to pain for, if I can avoid it. 0.908 0.742 0.503 0.644
I would endure physical discomfort to complete a task because I just don't like to give up.
0.657 0.589 0.417 0.641
4 I find it extremely unpleasant to be afraid 0.819 0.542 0.098 0.569I sometimes avoid difficult tasks 0.923 0.542 0.080 0.567
3

154
Step ToleranceMin.
ToleranceSig. of F to
EnterWilks'
LambdaI am a very determined person. 0.709 0.540 0.447 0.589I have a lot of self-confidence 0.614 0.485 0.232 0.580I am at my best when I am really challenged
0.589 0.517 0.300 0.584
I believe that it is shameful to give up something I started 0.812 0.535 0.531 0.592
I have more than the average amount of self-determination 0.493 0.480 0.143 0.574
Sometimes things just don't seem worth the effort. 0.923 0.552 0.038 0.558
I would rather not try something that I'm not good at. 0.934 0.552 0.256 0.582
I have more fears than most people. 0.990 0.569 0.905 0.601I find it difficult to take risks. 0.953 0.570 0.913 0.601People have a lot of problems but none they will not eventually be able to solve 0.918 0.570 0.359 0.586
I can succeed in almost any endeavour to which I set my mind. 0.670 0.524 0.336 0.585
Nothing is impossible if I really put my mind to it 0.454 0.447 0.789 0.598
When put to the test I would remain true to my ideas. 0.381 0.313 0.125 0.572
If a person believes in himself, he/she can make it in the world. 0.494 0.396 0.847 0.600
I feel that chances are very good that I can achieve my goals in life. 0.482 0.385 0.232 0.580
In general I agree that "if first I do not succeed, I'll try again". 0.407 0.331 0.342 0.586
I excel at few things. 0.941 0.551 0.597 0.594I have more willpower than most people 0.547 0.508 0.969 0.603 I become frustrated when I experience physical discomfort 0.932 0.537 0.353 0.586
Nothing is worth subjecting myself to pain for, if I can avoid it. 0.907 0.548 0.547 0.592
I would endure physical discomfort to complete a task because I just don't like to give up.
0.655 0.471 0.399 0.588
5 I find it extremely unpleasant to be afraid 0.690 0.537 0.116 0.527I sometimes avoid difficult tasks 0.837 0.509 0.035 0.514I am a very determined person. 0.694 0.516 0.393 0.542I have a lot of self-confidence 0.602 0.462 0.176 0.532I am at my best when I am really challenged
0.579 0.508 0.415 0.543
I believe that it is shameful to give up something I started 0.752 0.529 0.510 0.546
I have more than the average amount of self-determination 0.492 0.470 0.131 0.529
I would rather not try something that I'm not good at. 0.919 0.538 0.293 0.539
I have more fears than most people. 0.952 0.548 0.710 0.551I find it difficult to take risks. 0.952 0.552 0.912 0.555People have a lot of problems but none they will not eventually be able to solve 0.908 0.551 0.294 0.539
I can succeed in almost any endeavour to which I set my mind. 0.666 0.523 0.371 0.542
Nothing is impossible if I really put my mind to it 0.453 0.445 0.777 0.552
When put to the test I would remain true to my ideas. 0.379 0.310 0.132 0.529

155
Step ToleranceMin.
ToleranceSig. of F to
EnterWilks'
LambdaIf a person believes in himself, he/she can make it in the world. 0.486 0.396 0.926 0.556
I feel that chances are very good that I can achieve my goals in life. 0.467 0.383 0.180 0.533
In general I agree that "if first I do not succeed, I'll try again". 0.405 0.331 0.465 0.545
I excel at few things. 0.932 0.537 0.576 0.548I have more willpower than most people 0.546 0.507 0.968 0.557 I become frustrated when I experience physical discomfort 0.886 0.529 0.517 0.546
Nothing is worth subjecting myself to pain for, if I can avoid it. 0.906 0.530 0.567 0.547
I would endure physical discomfort to complete a task because I just don't like to give up.
0.646 0.450 0.450 0.544
I find it extremely unpleasant to be afraid 0.690 0.497 0.134 0.487I am a very determined person. 0.624 0.494 0.811 0.509I have a lot of self-confidence 0.594 0.441 0.299 0.496I am at my best when I am really challenged
0.559 0.482 0.685 0.506
I believe that it is shameful to give up something I started 0.740 0.494 0.631 0.505
I have more than the average amount of self-determination 0.492 0.437 0.153 0.488
I would rather not try something that I'm not good at. 0.803 0.474 0.606 0.505
I have more fears than most people. 0.948 0.507 0.724 0.507I find it difficult to take risks. 0.938 0.507 0.966 0.512People have a lot of problems but none they will not eventually be able to solve 0.906 0.507 0.270 0.495
I can succeed in almost any endeavour to which I set my mind. 0.648 0.474 0.193 0.491
Nothing is impossible if I really put my mind to it 0.451 0.427 0.737 0.508
When put to the test I would remain true to my ideas. 0.379 0.295 0.132 0.487
If a person believes in himself, he/she can make it in the world. 0.485 0.372 0.943 0.512
I feel that chances are very good that I can achieve my goals in life. 0.467 0.366 0.212 0.492
In general I agree that "if first I do not succeed, I'll try again". 0.397 0.326 0.412 0.500
I excel at few things. 0.930 0.494 0.556 0.504I have more willpower than most people 0.538 0.463 0.872 0.510 I become frustrated when I experience physical discomfort 0.876 0.494 0.432 0.500
Nothing is worth subjecting myself to pain for, if I can avoid it. 0.899 0.494 0.617 0.505
I would endure physical discomfort to complete a task because I just don't like to give up.
0.646 0.421 0.478 0.502
6

156
df1 df2 Sig. Statistic df1 df2 Sig. Statistic1 1 0.840 1 3 109 6.941 3 109.000 0.0002 2 0.735 2 3 109 6.003 6 216.000 0.0003 3 0.658 3 3 109 5.423 9 260.560 0.0004 4 0.604 4 3 109 4.904 12 280.741 0.0005 5 0.558 5 3 109 4.552 15 290.260 0.0006 6 0.514 6 3 109 4.345 18 294.642 0.000
Summary of Canonical Discriminant Functions
Function Eigenvalue % of Variance Cumulative % Canonical Correlation1 .457(a) 59.1 59.1 0.5602 .233(a) 30.2 89.3 0.4353 .083(a) 10.7 100.0 0.276
Test of Function(s) Wilks' Lambda Chi-square df Sig.1 through 3 0.514 71.253 18 0.000 `2 through 3 0.749 30.948 10 0.0013 0.924 8.498 4 0.075
Exact F Approximate F
Eigenvalues
a. First 3 canonical discriminant functions were used in the analysis.
Wilks' Lambda
Wilks' Lambda
Step Number of Variables Lambda df1 df2 df3

157
1 2 3 I can succeed in almost any endeavour to which I set my mind.(a) .393(*) 0.210 0.210I sometimes avoid difficult tasks .380(*) -0.210 -0.368I am a very determined person.(a) .269(*) 0.263 0.125 I become frustrated when I experience physical discomfort(a) -.176(*) 0.061 -0.020I find it difficult to take risks.(a) .139(*) -0.004 0.080I set my mind to a task almost nothing can stop me. 0.482 .593(*) 0.189I have often burned the midnight oil to finish a task before the deadline -0.289 .513(*) 0.178I have more willpower than most people(a) -0.228 -.430(*) -0.382Sometimes things just don't seem worth the effort. 0.123 .422(*) -0.328I would endure physical discomfort to complete a task because I just don't like to give up.(a) -0.227 -.401(*) -0.167
I have a lot of self-confidence(a) 0.350 .380(*) 0.206I have more than the average amount of self-determination(a) 0.347 .376(*) 0.357People have a lot of problems but none they will not eventually be able to solve(a) -0.038 -.148(*) 0.060
Nothing is worth subjecting myself to pain for, if I can avoid it.(a) -0.101 -.141(*) -0.063I have more fears than most people.(a) 0.027 .137(*) -0.065I excel at few things.(a) -0.034 -.105(*) -0.061When I have difficulty getting what I want, I try harder 0.403 0.378 .796(*)When put to the test I would remain true to my ideas.(a) 0.231 0.287 .660(*)In general I agree that "if first I do not succeed, I'll try again".(a) 0.301 0.380 .589(*)If a person believes in himself, he/she can make it in the world.(a) 0.346 0.339 .485(*) I feel that chances are very good that I can achieve my goals in life.(a) 0.447 0.329 .472(*)Nothing is impossible if I really put my mind to it(a) 0.339 0.391 .459(*)I feel I am better off to rely on myself for a solution when things are looking bad -0.292 0.167 .385(*)I am at my best when I am really challenged(a) 0.257 0.261 .300(*)I believe that it is shameful to give up something I started(a) 0.173 0.077 .227(*)I find it extremely unpleasant to be afraid(a) 0.045 0.039 -.208(*)I would rather not try something that I'm not good at.(a) 0.066 -0.065 .116(*)
*. Largest absolute correlation between each variable and any discriminant functiona. This variable not used in the analysis.
Structure Matrix
Function
g p g Variables ordered by absolute size of correlation within function.
1 2 3Ambassador 0.141 -0.294 0.088Company orientated -2.172 0.361 0.150Career orientated 0.057 0.265 -0.608Uncommited 0.730 1.226 0.333
Functions at Group Centroids
matrixFunction
evaluated at group means

158
Classification Statistics
Weighted UnweightedAmbassador 0.250 74 74.000Company orientated 0.250 9 9.000Career orientated 0.250 19 19.000Uncommited 0.250 11 11.000Total 1.000 113 113.000
Prior Probabilities for Groups
matrix PriorCases Used in Analysis
AmbassadorCompany orientated
Career orientated Uncommited
Ambassador 46 8 16 4 74Company orientated 1 7 0 1 9Career orientated 4 1 10 4 19Uncommited 4 2 1 4 11Ambassador 62.2 10.8 21.6 5.4 100.0Company orientated 11.1 77.8 0.0 11.1 100.0Career orientated 21.1 5.3 52.6 21.1 100.0Uncommited 36.4 18.2 9.1 36.4 100.0
Original Count
%
a. 59.3% of original grouped cases correctly classified.
Classification Results(a)
matrix
Predicted Group Membership
Total