the role of structural modeling on the seismic …the evaluation of the seismic performance has been...
TRANSCRIPT

1
THE ROLE OF STRUCTURAL MODELING ON THE SEISMIC ASSESSMENT OF EXISTING RC BUILDINGS ACCORDING
TO EUROCODE 8
M. De Stefano1, A. La Brusco
2, V. Mariani
3, M. Tanganelli
4, S. Viti
5
ABSTRACT
In these years, due to the construction peak in the past decades and to the unfavorable economic
situation, the choice to rehabilitate, restore and retrofit existing buildings is preferred to their
reconstruction whenever it is possible. The seismic assessment of existing buildings, therefore, is an essential issue of the current Technical Codes.
This work is focused on the evaluation of the seismic performance of existing RC buildings, and
more precisely, with the role of their modeling on such evaluation. The work is made on a case-study, that is a real, RC hospital building. An accurate knowledge of the building has been achieved, as a
result of a collaboration between the University of Florence and the Regional Government. All the
main information about material, soil, design and architectural features have been collected. Two
different analytical procedures provided by the Eurocode 8, integrated to the Italian Technical Code (NTC 2008) have been applied and compared. The analysis has shown the scatter in seismic
assessment referring to the possible modeling choices.
INTRODUCTION
The evaluation of the seismic performance of existing buildings is a crucial issue of the seismic
engineering. In fact, due to the current economic crisis and to the intense construction activity of the
last decades, the current building heritage includes many buildings that do not comply with the technical requirements provided by the Codes in force.
In many cases, demolition and successive reconstruction would be the easier and more logical
choice, since existing buildings, mostly done in the 60s and 70s, are inadequate under different aspects beyond structural safety. In most cases, however, the lack of money prevents this choice. Retrofitting
and rehabilitation, in these cases, would be the most feasible solution. Nevertheless, it is important to
quantify the eventual inadequacy of the structure, in order to evaluate the potential success of the
rehabilitation, and to properly predict the required investment. Due to its intrinsic complexity, the evaluation of seismic performance is affected by many
uncertain factors, whose precise definition is very hard to achieve, like the intrinsic variability of the
quantities involved in the seismic response of the building (material, soil, acting loads) and the analytical procedure adopted in analysis. The current Technical Codes, in fact, let the designer to
1 Full Professor, Department of Architecture (DiDA), University of Florence, [email protected] 2 PhD, Department of Architecture (DiDA), University of Florence, [email protected] 3 PhD, Department of Architecture (DiDA), University of Florence, [email protected] 4 Researcher, Department of Architecture (DiDA), University of Florence, [email protected] 5 Researcher, Department of Architecture (DiDA), University of Florence, [email protected]
2
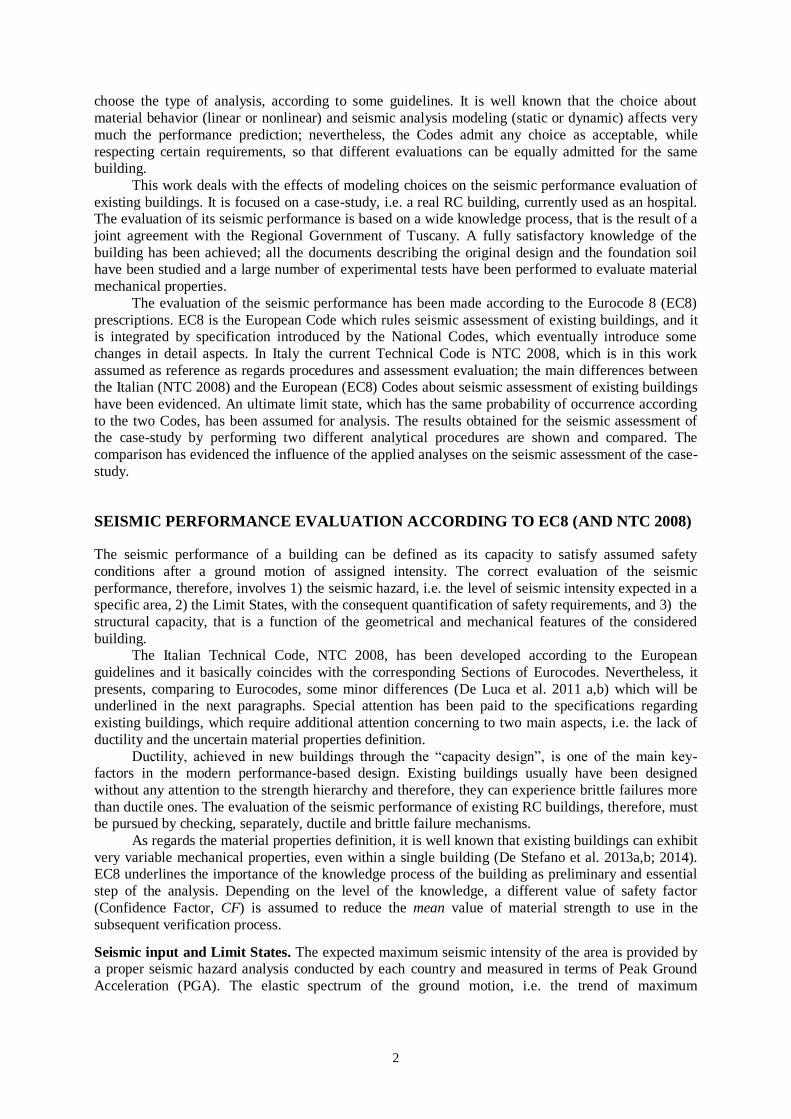
choose the type of analysis, according to some guidelines. It is well known that the choice about
material behavior (linear or nonlinear) and seismic analysis modeling (static or dynamic) affects very
much the performance prediction; nevertheless, the Codes admit any choice as acceptable, while
respecting certain requirements, so that different evaluations can be equally admitted for the same building.
This work deals with the effects of modeling choices on the seismic performance evaluation of
existing buildings. It is focused on a case-study, i.e. a real RC building, currently used as an hospital. The evaluation of its seismic performance is based on a wide knowledge process, that is the result of a
joint agreement with the Regional Government of Tuscany. A fully satisfactory knowledge of the
building has been achieved; all the documents describing the original design and the foundation soil have been studied and a large number of experimental tests have been performed to evaluate material
mechanical properties.
The evaluation of the seismic performance has been made according to the Eurocode 8 (EC8)
prescriptions. EC8 is the European Code which rules seismic assessment of existing buildings, and it is integrated by specification introduced by the National Codes, which eventually introduce some
changes in detail aspects. In Italy the current Technical Code is NTC 2008, which is in this work
assumed as reference as regards procedures and assessment evaluation; the main differences between the Italian (NTC 2008) and the European (EC8) Codes about seismic assessment of existing buildings
have been evidenced. An ultimate limit state, which has the same probability of occurrence according
to the two Codes, has been assumed for analysis. The results obtained for the seismic assessment of the case-study by performing two different analytical procedures are shown and compared. The
comparison has evidenced the influence of the applied analyses on the seismic assessment of the case-
study.
SEISMIC PERFORMANCE EVALUATION ACCORDING TO EC8 (AND NTC 2008)
The seismic performance of a building can be defined as its capacity to satisfy assumed safety
conditions after a ground motion of assigned intensity. The correct evaluation of the seismic
performance, therefore, involves 1) the seismic hazard, i.e. the level of seismic intensity expected in a specific area, 2) the Limit States, with the consequent quantification of safety requirements, and 3) the
structural capacity, that is a function of the geometrical and mechanical features of the considered
building. The Italian Technical Code, NTC 2008, has been developed according to the European
guidelines and it basically coincides with the corresponding Sections of Eurocodes. Nevertheless, it
presents, comparing to Eurocodes, some minor differences (De Luca et al. 2011 a,b) which will be underlined in the next paragraphs. Special attention has been paid to the specifications regarding
existing buildings, which require additional attention concerning to two main aspects, i.e. the lack of
ductility and the uncertain material properties definition.
Ductility, achieved in new buildings through the “capacity design”, is one of the main key-factors in the modern performance-based design. Existing buildings usually have been designed
without any attention to the strength hierarchy and therefore, they can experience brittle failures more
than ductile ones. The evaluation of the seismic performance of existing RC buildings, therefore, must be pursued by checking, separately, ductile and brittle failure mechanisms.
As regards the material properties definition, it is well known that existing buildings can exhibit
very variable mechanical properties, even within a single building (De Stefano et al. 2013a,b; 2014). EC8 underlines the importance of the knowledge process of the building as preliminary and essential
step of the analysis. Depending on the level of the knowledge, a different value of safety factor
(Confidence Factor, CF) is assumed to reduce the mean value of material strength to use in the
subsequent verification process.
Seismic input and Limit States. The expected maximum seismic intensity of the area is provided by a proper seismic hazard analysis conducted by each country and measured in terms of Peak Ground
Acceleration (PGA). The elastic spectrum of the ground motion, i.e. the trend of maximum

M. De Stefano, A. La Brusco, V. Mariani, M. Tanganelli and S. Viti 3
acceleration as a function of the vibrational period of the structure, can be defined – as a function of
the building and soil properties – for each considered local seismic hazard and limit state.
EC8 and NTC 2008 define similar, but not identical, limit states. The probabilities of occurrence
of the seismic event in a 50-years reference period related to each limit state, for the two Codes, are listed in Table 1. As can be seen, only the less severe Ultimate Limit State (SLV according to NTC
2008, and SD according to EC8) coincides for the two Codes.
Table 1. Probability of exceedance related to each Limit State
EC8 NTC 2008
Limit State Prob. of exceedance Limit State Prob. of exceedance
- - Operational 81% in 50 years
Damage Limitation 20% in 50 years Damage Limitation 63% in 50 years
Significant Damage 10% in 50 years Life Safety 10% in 50 years
Near Collapse 2% in 50 years Collapse Prevention 5% in 50 years
Another difference between EC8 and NTC 2008 concerns the elastic spectrum definition. In fact, while in EC8 the elastic spectra of the same building for the different limit states can be simply
scaled, NTC 2008 provides (slight) different shapes of the spectra for each limit state. In the Italian
Technical Code, indeed, even the period at the beginning of the constant-velocity branch is related,
together to the peak ground acceleration and the amplification factor, to the building geographical site.
Seismic response. The seismic response can be found by performing a structural analysis, whose
reliability can largely vary depending on the hypothesis concerning the material behavior (elastic or
inelastic) and the type of analysis (static or dynamic) performed on a finite element model of the structural system. According to both EC8 and NTC 2008, the mean value of concrete strength must be
used in analysis, while a reduced (until 50%) value of the Young modulus, to take into account the
possible viscous phenomena, can be assumed.
Structural capacity. In existing buildings ductile and brittle members and mechanisms must be
distinguished and checked separately. The ductile mechanisms are related to the flexural behavior and
they are checked in terms of bending moment in case of elastic analysis, and chord rotation in case of
inelastic analysis. The limit values provided by the Code for the chord rotation are fixed for each limit state (see Table 2). The brittle mechanisms are related to shear failure. Verification, made in terms of
force, must be done for ultimate limit state only and it involves each structural element, including the
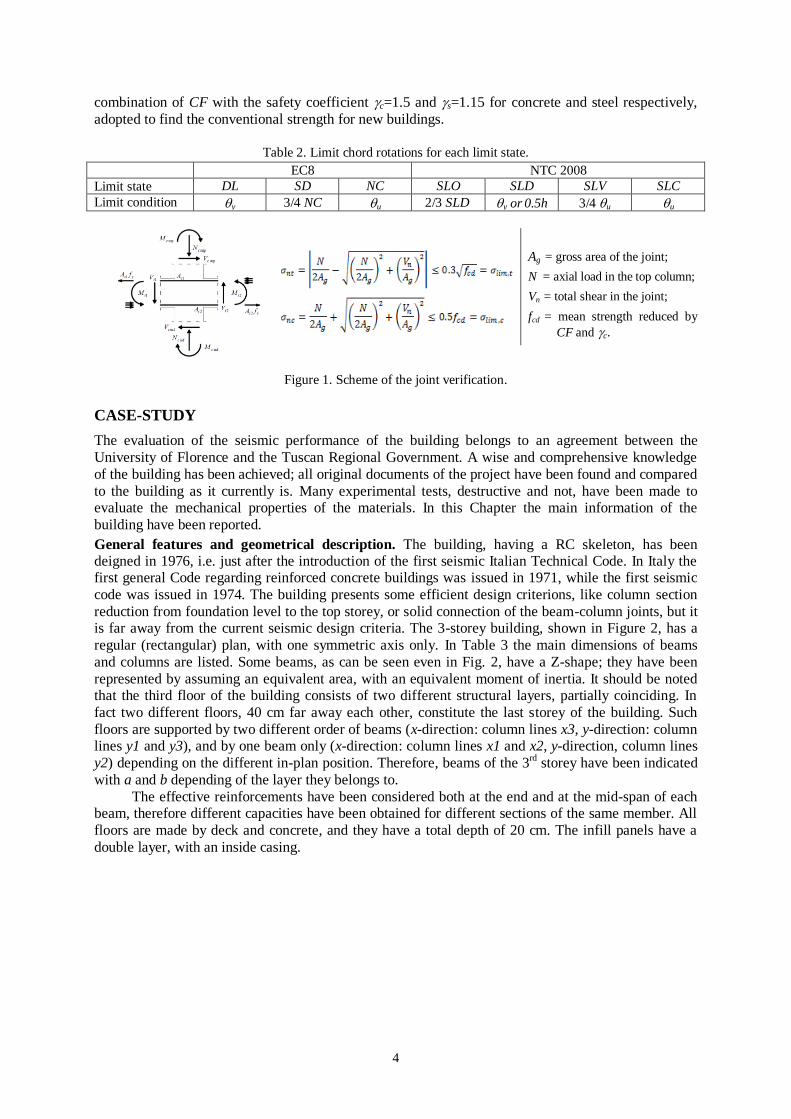
joints. The joint verification, in particular, is a crucial issue, since it must be performed for all not-confined joints. The tensile and compressive capacity of the joint can be determined (see Fig. 1)
according to eq. 8.7.2.2 and 8.7.2.3 (Circ. No. 617, Section C.8.7.2.5), as a function of the joint
geometry, the amount of axial load in the top column, the total shear in the joint and the stress level of
the longitudinal reinforcement of the beams adjacent to the joint. While EC8 lets the designer to choose the ultimate limit state to be checked (between Life
Safety and Collapse Prevention), NTC 2008 defines the SLV as the mandatory ultimate limit state to
be verified. Both Codes indicates a verification procedure to be used in the joints based on the equilibrium between the forces of the structural elements converging in the joint. The structural
capacity of each member is evaluated by assuming, for concrete and steel strength, a conventional
(reduced) value, in general not coincident to the mean value coming from the in-situ experimental tests. EC8 (and NTC 2008), in fact, gives a central role to the knowledge process of the building. All
information concerning its construction, including documents, architectural and structural design,
eventual changes made during the building life, must be considered and integrated by direct
observation and experimental tests on structural materials. Depending on the achieved Knowledge Level (KL) of the building, a different value must be assumed for the safety factor (Confidence Factor,
CF) to reduce the mean strength value coming from the in situ tests. When an exhaustive knowledge
level (KL=3) is achieved, a CF=1.00 can be assumed, and therefore the mean strength value can be adopted. When KL=2 (good knowledge), CF is assumed equal to 1.20, while for a moderate
knowledge (KL=1) a CF=1.35 must be assumed. Depending on the type of verification (brittle or
ductile mechanisms), the strength value must be reduced by the Confidence Factor only, or by the
4
combination of CF with the safety coefficient c=1.5 and s=1.15 for concrete and steel respectively,
adopted to find the conventional strength for new buildings.
Table 2. Limit chord rotations for each limit state.
EC8 NTC 2008
Limit state DL SD NC SLO SLD SLV SLC
Limit condition y 3/4 NC u 2/3 SLD y or 0.5h 3/4 u u
Ag = gross area of the joint;
N = axial load in the top column;
Vn = total shear in the joint;
fcd = mean strength reduced by
CF and c.
Figure 1. Scheme of the joint verification.
CASE-STUDY
The evaluation of the seismic performance of the building belongs to an agreement between the
University of Florence and the Tuscan Regional Government. A wise and comprehensive knowledge
of the building has been achieved; all original documents of the project have been found and compared
to the building as it currently is. Many experimental tests, destructive and not, have been made to evaluate the mechanical properties of the materials. In this Chapter the main information of the
building have been reported.
General features and geometrical description. The building, having a RC skeleton, has been deigned in 1976, i.e. just after the introduction of the first seismic Italian Technical Code. In Italy the first general Code regarding reinforced concrete buildings was issued in 1971, while the first seismic
code was issued in 1974. The building presents some efficient design criterions, like column section
reduction from foundation level to the top storey, or solid connection of the beam-column joints, but it is far away from the current seismic design criteria. The 3-storey building, shown in Figure 2, has a
regular (rectangular) plan, with one symmetric axis only. In Table 3 the main dimensions of beams
and columns are listed. Some beams, as can be seen even in Fig. 2, have a Z-shape; they have been
represented by assuming an equivalent area, with an equivalent moment of inertia. It should be noted that the third floor of the building consists of two different structural layers, partially coinciding. In
fact two different floors, 40 cm far away each other, constitute the last storey of the building. Such
floors are supported by two different order of beams (x-direction: column lines x3, y-direction: column lines y1 and y3), and by one beam only (x-direction: column lines x1 and x2, y-direction, column lines
y2) depending on the different in-plan position. Therefore, beams of the 3rd storey have been indicated
with a and b depending of the layer they belongs to.
The effective reinforcements have been considered both at the end and at the mid-span of each beam, therefore different capacities have been obtained for different sections of the same member. All
floors are made by deck and concrete, and they have a total depth of 20 cm. The infill panels have a
double layer, with an inside casing.

M. De Stefano, A. La Brusco, V. Mariani, M. Tanganelli and S. Viti 5
Figure 2. Plan and sections.
Table 3. Columns and beams dimensions.
COLUMNS
BEAMS
X1 X2 X3 Y1 Y2 Y3
1st st. 30x50 30x60 30x60 Z-shape Z-shape 30x60 Z-shape
2nd st. 30x40 30x60 30x60 30x60 Z-shape 30x60 Z-shape
3rd st. 30x35 30x80 30x80 a) 30x60 30x60
30x80 30x60
b) 30x20 30x20 30x20
Materials. It is well known that existing buildings can exhibit material with very different mechanical
properties with respect to those assumed in the original project (Cristofaro 2009, 2012, De Stefano et
al. 2013a, b, 2014). Mechanical properties of structural materials, i.e. concrete and steel, have been
determined through destructive and not-destructive tests, according to the Code provisions (see Circ. n. 617 del 02-02-2009 – Tab. C8A.1.3).
Concerning the concrete characterization, 3 destructive tests have been performed on the
columns, which have been integrated by other SonReb (sclerometric + ultrasonic methods) tests (see Tab. 4), which have been extended even to the beams, in order to obtain an overall evaluation of the
concrete strength. Even the structural details have been properly investigated, since 11 destructive and
10 not destructive tests (see Tab. 4) have been carried out. Results of the experimental tests have been
separately found for SonReb (R.Giacchetti e L.Lacquaniti,1980; J.Gasparik, 1984; A.Di Leo e G.Pascale, 1994) and destructive (BS 1881 Part.120, 1983; Concrete Society, 1976; Cestelli-Guidi e
Morelli 1981, Masi,2005) tests. The final compressive strength has been found by combining both
destructive and Sonreb results, by adopting an ad hoc expression (Cristofaro, 2009) based on formulation (Masi, 2008), i.e. a non-linear regression which has provided a final cylindrical strength,
fc,mean equal to 10.2 MPa. The global knowledge level achieved for the concrete structural elements has
been conservatively evaluated as KL2 (CF=1.20), according to EC8 standard, so that a design (reduced) value of strength, fcd, equal to 8.5 MPa has been found (see Tab. 4). The elastic modulus
assumed in analysis has been found by the eq. 11.2.5 (NTC2008, Section 11.2.10.3), based on the
value of fc,mean. The reinforcement steel, according to the structural design, belongs to the FeB32K
class, having a yield stress over 32 MPa and a ultimate stress over 50 MPa. By a visual inspection, two different types of steel have been used, respectively ribbed and not. Three destructive tests, one for
each storey, have been done on the rebars, according to the standard procedure (UNI EN ISO 6892-1,
2009), returning a mean value, fs,mean, equal to 10.2 MPa. For the steel, a Klowledge Level KL1 has been assumed, with a consequent Confidence Factor equal to 1.35. Information about the steel tests are
listed in Tab. 5.
Table 4. Number of visual inspections and testings for concrete.
storey OBSERVATION
nondestructive test (SonReb)
destructive test stress value (KN/mm2)
columns beams nodes columns Beams columns beams test fc, mean KL fc,d
1st st. 2 4 2 2 2 1 - 11.5
10.2 KL2 8.5 2nd st. 2 5 3 2 2 1 - 64.2
3rd st. 2 6 6 2 - 1 - 7.6
6
Table 5. Number of visual inspections and tests for steel.
storey Yield load
(KN)
Ultimate load
(KN)
Yield stress
(KN/mm2)
mean yield stress
(KN/mm2) KL
Design stress
(KN/mm2)
1st st. 571 857 391.23
385.72 KL1 285.72 2nd
st. 806 1158 392.91
3rd st. 765 1071 373.02
The soil. Ground behavior has been determined through a geophysical site investigation. In order to gain an accurate estimate of the subsoil structure, seismic refraction and down hole techniques have
been carried out. The results, processed using both Generalized Reciprocal Method (Palmer, 1981) and
Tomographic one, have provided detailed information on the distribution and thicknesses of subsurface layers, rock dynamics and geo-mechanical properties, seismic P and S waves velocity
profiles and the consequential value of the average shear wave velocity Vs,30 (Sirles and Viksne, 1990),
which is equal to 390 m/s. Therefore the soil has been assumed as B-type.
The structural model. The analyses have been performed by using the computer code SAP2000
(http://www.csi-italia.eu/software/sap2000/). The two floors of the third levels have been modeled
according to the real geometry as regards the stiffness and strength distribution, while the mass (both
translational and rotational) of the storey has been considered applied at the center of the storey package. The two levels are named 3a and 3b in the following. The effect of the joint stiffness has
been considered by introducing a rigid offset at each element end. A reduced value of the Young
modulus of the concrete Ec, i.e. Ec,red = 0.5 Ec, has been assumed, as suggested by NTC 2008. The floor stiffness has been introduced by assigning the diaphragm constraint to all nodes belonging to the
same floor. Each member as an elastic element with terminal plastic hinges, whose properties have
been defined by assigning a simplified (bi-linear) moment-rotation relationship, defined by the yield and the ultimate points. Limit values of bending moment and rotation (eq. C8.7.2.1.a and eq. C8A.6.1
in Circ. No 716) have been made according to the Code prescriptions.
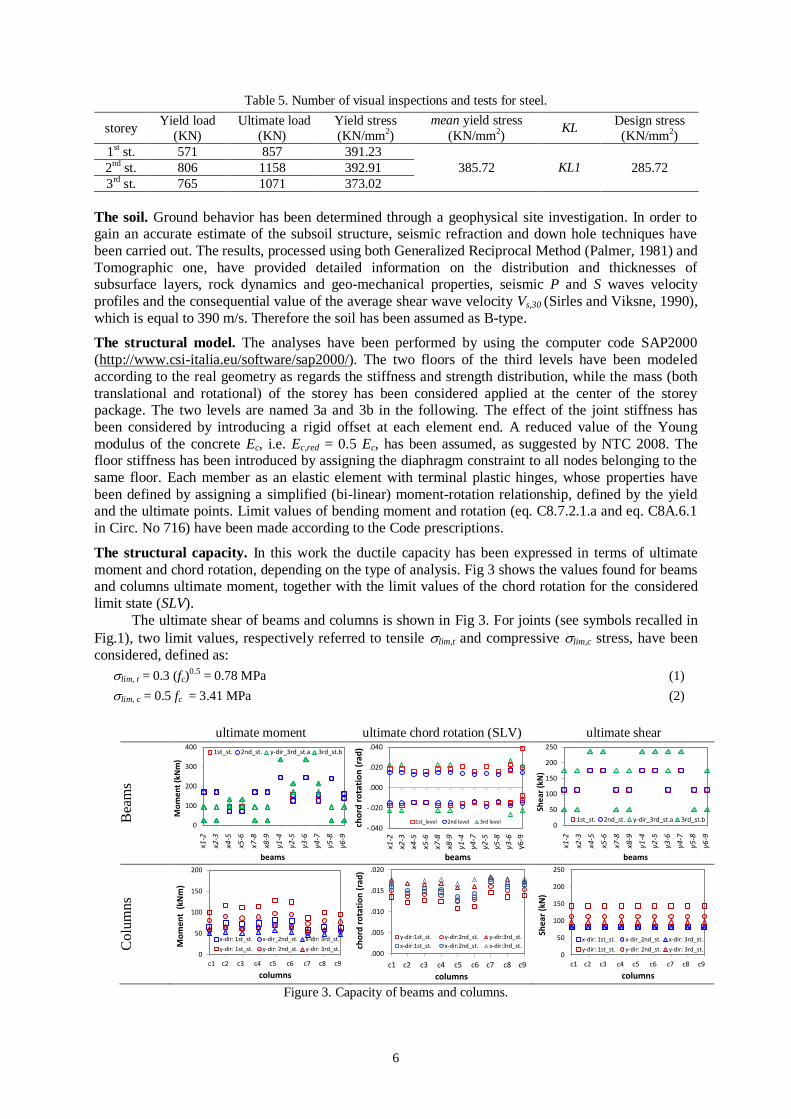
The structural capacity. In this work the ductile capacity has been expressed in terms of ultimate
moment and chord rotation, depending on the type of analysis. Fig 3 shows the values found for beams and columns ultimate moment, together with the limit values of the chord rotation for the considered
limit state (SLV).
The ultimate shear of beams and columns is shown in Fig 3. For joints (see symbols recalled in
Fig.1), two limit values, respectively referred to tensile lim,t and compressive lim,c stress, have been
considered, defined as:
lim, t = 0.3 (fc)0.5 = 0.78 MPa (1)
lim, c = 0.5 fc = 3.41 MPa (2)
ultimate moment ultimate chord rotation (SLV) ultimate shear
Bea
ms
0
100
200
300
400
1 2 3 4 5 6 7 8 9 10 11 12
Mo
me
nt
(kN
m)
beams
1st_st. 2nd_st. y-dir_3rd_st.a 3rd_st.b
x1-2
x2-3
x4-5
x5-6
x7-8
x8-9
y1-4
y2-5
y3-6
y4-7
y5-8
y6-9
-.040
-.020
.000
.020
.040
1 2 3 4 5 6 7 8 9 10 11 12
cho
rd r
ota
tio
n (
rad
)
beams
1st_level 2nd level 3rd level
x1-2
x2-3
x4-5
x5-6
x7-8
x8-9
y1-4
y4-7
y2-5
y5-8
y3-6
y6-9
0
50
100
150
200
250
1 2 3 4 5 6 7 8 9 10 11 12
She
ar (
kN)
beams
1st_st. 2nd_st. y-dir_3rd_st.a 3rd_st.b
x1-2
x2-3
x4-5
x5-6
x7-8
x8-9
y1-4
y2-5
y3-6
y4-7
y5-8
y6-9
Co
lum
ns
0
50
100
150
200
1 2 3 4 5 6 7 8 9
Mo
me
nt
(kN
m)
columns
x-dir: 1st_st. x-dir_2nd_st. x-dir: 3rd_st.
y-dir: 1st_st. y-dir: 2nd_st. y-dir: 3rd_st.
c1 c2 c3 c4 c5 c6 c7 c8 c9
.000
.005
.010
.015
.020
1 2 3 4 5 6 7 8 9
cho
rd r
ota
tio
n (
rad
)
columns
y-dir:1st_st. y-dir:2nd_st. y-dir:3rd_st.
x-dir:1st_st. x-dir:2nd_st. x-dir:3rd_st.
c1 c2 c3 c4 c5 c6 c7 c8 c9
0
50
100
150
200
250
1 2 3 4 5 6 7 8 9
She
ar (
kN)
columns
x-dir: 1st_st. x-dir_2nd_st. x-dir: 3rd_st.
y-dir: 1st_st. y-dir: 2nd_st. y-dir: 3rd_st.
c1 c2 c3 c4 c5 c6 c7 c8 c9
Figure 3. Capacity of beams and columns.

M. De Stefano, A. La Brusco, V. Mariani, M. Tanganelli and S. Viti 7
The seismic input. The seismic input has been defined according to the site seismic
classification (NTC 2008, All. B). The parameters assumed to find the elastic spectrum refer to the
soil-type B. In this work only the spectrum representing the SLV limit state has been considered. Both
the elastic spectrum and the scaled one have been considered. For the scaled spectrum two different q-factors have been used, for ductile (q=3.0) and brittle (q=1.5) mechanisms.
SEISMIC PERFORMANCE OF THE CASE-STUDY
The seismic performance has been assessed, with reference to the LS (i.e. SVL) limit state, as the ratio
between the capacity (C) of each component (beams, column and joints) of the case-study and the
corresponding demand (D). Both ductile and brittle mechanisms have been considered, according to
the Code prescriptions. The demand has been quantified by performing two different analyses, respectively elastic (“pseudo-dynamic” elastic) and inelastic (nonlinear static analysis). Both the x and
y directions have been considered in analysis. In the pseudo-dynamic analysis, the effects induced by
the seismic action in the considered direction have been combined to 30% of the one coming from the other direction.
A preliminary modal analysis has been performed to determine the dynamic properties of the
structure. In Table 6 the main information related to the first 5 modes are listed.
Table 6. Dynamic properties of the considered
mode Period (sec) Participant Mass x-direction (%) Participant Mass y-direction (%)
1 0.628 0 87.20
2 0.494 80.72 0
3 0.380 0.18 0.51
4 0.226 0 9.45
5 0.182 11.05 0
1+2+3+4+5 92.95 97.18
The pseudo-dynamic linear analysis. The seismic response of the case-study has been evaluated by considering the values of the spectral acceleration for the five periods coming from the modal analysis,
and then combining the consequent effects according to their participation factors.
The acceptance conditions of the linear analysis have been checked both by considering the
elastic and the reduced spectrum; it has been found that such conditions are satisfied only for reduced spectra, which have, therefore, selected for analysis; a q-factor equal to 3.0 has been used for ductile
mechanisms, while a q-value equal to 1.5 has been used for brittle ones. The seismic performance of
the case-study has been found by comparing the maximum value of force achieved in each member to the corresponding capacity. The shear values have been used to find the maximum tensile and
compressive stress in the joints. The ductile mechanisms, i.e. the flexural ones, have been checked in
terms of bending moment.
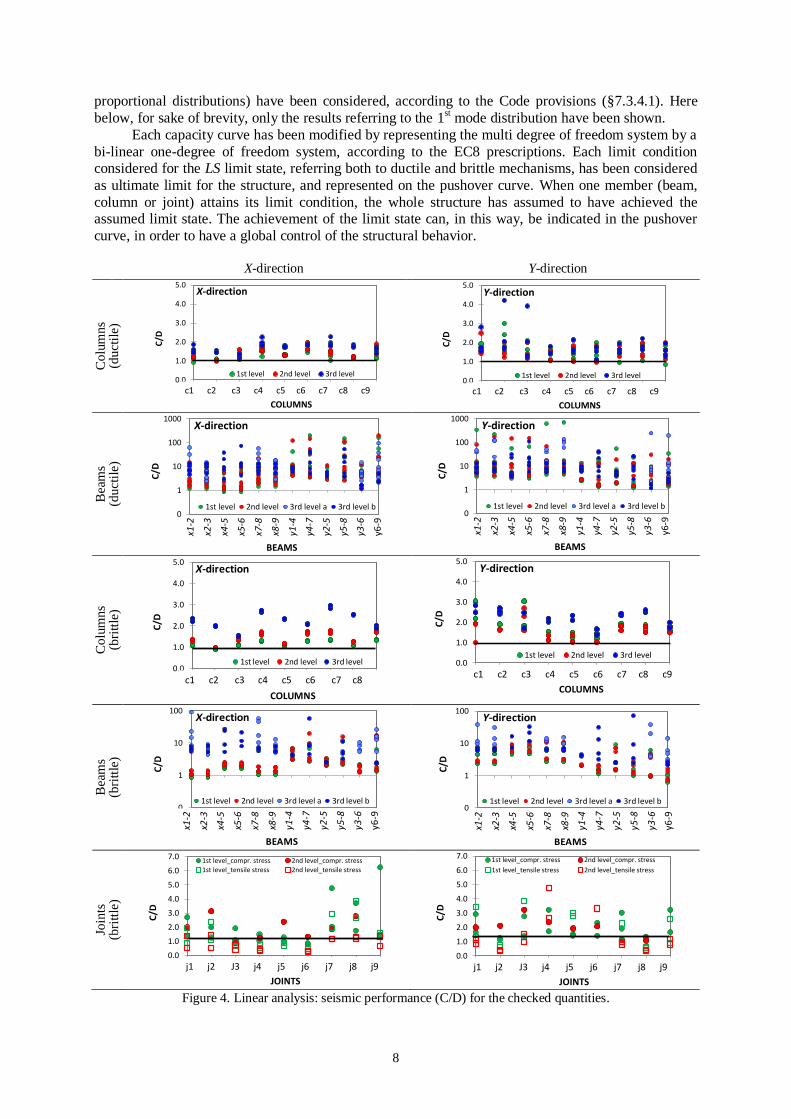
Figure 4 shows, both for x and y direction, the comparison between capacity and demand of the checked parameters, i.e. bending moment (ductile mechanism) and shear (brittle mechanism) for
beams and columns. The joints have been verified by comparing the maximum tensile and
compressive stress with the corresponding resistances. In all cases the verification is satisfied when the ratio D/C is over the unity.
When the brittle mechanisms are considered in beams and columns, the structure is almost
verified in all cases. Moreover the capacity, in some cases, exceeds so much the corresponding demand that for the D/C ratio a logarithmic scale has been chosen.
The joint verification, instead, evidences different results. The joint capacity, in fact, is much
lower than the corresponding demand in many cases. All joints of the case-study have been considered
as not-confined. In fact, most part of them were side joints, and even in the internal one (Joint 5) the required geometrical conditions are not verified.
Nonlinear static analysis. The nonlinear static analysis has been performed by intersecting the capacity curve to the design spectra. Two different height-wise patterns, respectively proportional to
the first vibration mode and to mass distribution along the building height (1st mode and mass
8
proportional distributions) have been considered, according to the Code provisions (§7.3.4.1). Here
below, for sake of brevity, only the results referring to the 1st mode distribution have been shown.
Each capacity curve has been modified by representing the multi degree of freedom system by a
bi-linear one-degree of freedom system, according to the EC8 prescriptions. Each limit condition considered for the LS limit state, referring both to ductile and brittle mechanisms, has been considered
as ultimate limit for the structure, and represented on the pushover curve. When one member (beam,
column or joint) attains its limit condition, the whole structure has assumed to have achieved the assumed limit state. The achievement of the limit state can, in this way, be indicated in the pushover
curve, in order to have a global control of the structural behavior.
X-direction Y-direction
Colu
mns
(d
uct
ile)
0.0
1.0
2.0
3.0
4.0
5.0
1 2 3 4 5 6 7 8 9
C/D
COLUMNS
X-direction
1st level 2nd level 3rd level
c1 c2 c3 c4 c5 c6 c7 c8 c9
0.0
1.0
2.0
3.0
4.0
5.0
1 2 3 4 5 6 7 8 9
C/D
COLUMNS
Y-direction
1st level 2nd level 3rd level
c1 c2 c3 c4 c5 c6 c7 c8 c9
Bea
ms
(d
uct
ile)
0
1
10
100
1000
1 2 3 4 5 6 7 8 9 10 11 12
C/D
BEAMS
X-direction
1st level 2nd level 3rd level a 3rd level b
x1-2
x2-3
x4-5
x5-6
x7-8
x8-9
y1-4
y4-7
y2-5
y5-8
y3-6
y6-9
0
1
10
100
1000
1 2 3 4 5 6 7 8 9 10 11 12
C/D
BEAMS
Y-direction
1st level 2nd level 3rd level a 3rd level b
x1-2
x2-3
x4-5
x5-6
x7-8
x8-9
y1-4
y4-7
y2-5
y5-8
y3-6
y6-9
Co
lum
ns
(b
ritt
le)
0.0
1.0
2.0
3.0
4.0
5.0
1 2 3 4 5 6 7 8 9
C/D
COLUMNS
X-direction
1st level 2nd level 3rd level
c1 c2 c3 c4 c5 c6 c7 c8
0.0
1.0
2.0
3.0
4.0
5.0
1 2 3 4 5 6 7 8 9
C/D
COLUMNS
Y-direction
1st level 2nd level 3rd level
c1 c2 c3 c4 c5 c6 c7 c8 c9
Bea
ms
(bri
ttle
)
0
1
10
100
1 2 3 4 5 6 7 8 9 10 11 12
C/D
BEAMS
X-direction
1st level 2nd level 3rd level a 3rd level b
x1-2
x2-3
x4-5
x5-6
x7-8
x8-9
y1-4
y4-7
y2-5
y5-8
y3-6
y6-9
0
1
10
100
1 2 3 4 5 6 7 8 9 10 11 12
C/D
BEAMS
Y-direction
1st level 2nd level 3rd level a 3rd level b
x1-2
x2-3
x4-5
x5-6
x7-8
x8-9
y1-4
y4-7
y2-5
y5-8
y3-6
y6-9
Join
ts
(bri
ttle
)
0.0
1.0
2.0
3.0
4.0
5.0
6.0
7.0
1 2 3 4 5 6 7 8 9
C/D
JOINTS
1st level_compr. stress 2nd level_compr. stress
1st level_tensile stress 2nd level_tensile stress
j1 j2 J3 j4 j5 j6 j7 j8 j9
0.0
1.0
2.0
3.0
4.0
5.0
6.0
7.0
1 2 3 4 5 6 7 8 9
C/D
JOINTS
1st level_compr. stress 2nd level_compr. stress
1st level_tensile stress 2nd level_tensile stress
j1 j2 J3 j4 j5 j6 j7 j8 j9
Figure 4. Linear analysis: seismic performance (C/D) for the checked quantities.

M. De Stefano, A. La Brusco, V. Mariani, M. Tanganelli and S. Viti 9
Fig 5 shows the capacity curves of the case-study along the two directions, intersected to the
SLV spectrum. On the capacity curves, the steps corresponding to the attainment of each limit
condition have been evidenced.
X-direction Y-direction
0.00
0.20
0.40
0.60
0.80
1.00
0.00 0.02 0.04 0.06 0.08 0.10 0.12 0.14
Spe
ctra
l Acc
ele
rati
on
(g)
Spectral Displacement (m)
Spectral demand (SLV)
Spectral capacity
Ultimate chord rotation
Spectral response
Ultimate Joint capacity
Ultimate shear
0.00
0.20
0.40
0.60
0.80
1.00
0.00 0.02 0.04 0.06 0.08 0.10 0.12 0.14
Spe
ctra
l Acc
ele
rati
on
(g)
Spectral Displacement (m)
Spectral demand (SLV)
Spectral capacity
Ultimate chord rotation
Spectral response
Ultimate shear
Ultimate joint capacity
Figure 5. Capacity curves and seismic response for the LS limit state.
X-direction Y-direction
Co
lum
ns
cho
rd r
ota
tion
(du
ctil
e)
0
1
2
3
4
5
6
7
1 2 3 4 5 6 7 8 9
C/D
COLUMNS
1st level 2nd level 3rd level
c1 c2 c3 c4 c5 c6 c7 c8 c9
0
1
2
3
4
5
6
7
1 2 3 4 5 6 7 8 9
C/D
COLUMNS
1st level 2nd level 3rd level
c1 c2 c3 c4 c5 c6 c7 c8 c9
Co
lum
ns
shea
r
(bri
ttle
)
0
1
2
3
4
5
6
7
1 2 3 4 5 6 7 8 9
C/D
columns
1st level 2nd level 3rd level
c1 c2 c3 c4 c5 c6 c7 c8 c9
0
1
2
3
4
5
6
7
1 2 3 4 5 6 7 8 9
C/D
columns
1st level 2nd level 3rd level
c1 c2 c3 c4 c5 c6 c7 c8 c9
Bea
ms
shea
r
(bri
ttle
)
0
1
10
100
1 2 3 4 5 6 7 8 9 10 11 12
C/D
BEAMS
1st level 2nd level 3rd level a 3rd level b
x1-2
x2-3
x4-5
x5-6
x7-8
x8-9
y1-4
y2-5
y3-6
y4-7
y5-8
y6-9
0
1
10
100
1 2 3 4 5 6 7 8 9 10 11 12
C/D
BEAMS
1st level 2nd level 3rd level a 3rd level b
x1-2
x2-3
x4-5
x5-6
x7-8
x8-9
y1-4
y2-5
y3-6
y4-7
y5-8
y6-9
x1-2
x2-3
x4-5
x5-6
x7-8
x8-9
y1-4
y2-5
y3-6
y4-7
y5-8
y6-9
x1-2
x2-3
x4-5
x5-6
x7-8
x8-9
y1-4
y2-5
y3-6
y4-7
y5-8
y6-9
Join
ts
(bri
ttle
)
0.0
1.0
2.0
3.0
4.0
5.0
1 2 3 4 5 6 7 8 9
C/D
JOINTS
1st level_compr. stress 2nd level_compr. stress
1st level_tensile stress 2nd level_tensile stress
j1 j2 J3 j4 j5 j6 j7 j8 j9
0.0
1.0
2.0
3.0
4.0
5.0
1 2 3 4 5 6 7 8 9
C/D
JOINTS
1st level_compr. stress 2nd level_compr. stress
1st level_tensile stress 2nd level_tensile stress
j1 j2 J3 j4 j5 j6 j7 j8 j9
Figure 6. Non-linear analysis: seismic performance (C/D) for the checked quantities.

10
The structural response is given by the abscissa of the intersecting point between capacity curve
and design spectrum. In the example shown in Fig. 5, the structural capacity satisfies the demand with
regards to the ductile mechanisms, while it does not, for what concerns the joints verification.
Concerning the shear capacity, the brittle mechanism is verified in the x-direction, while it is not verified in the y-direction. It should be noted that the joints limit condition occurs much earlier than
the other ones. The limit conditions imposed to the joints, in fact, are extremely more severe than the
ones referring to beams and columns. Figure 6 shows the seismic performance, expressed in terms of the ratio of capacity over
demand (C/D) found for ductile and brittle mechanisms. The ductile mechanisms have been checked
in terms of chord rotation. The seismic performance, therefore, has been expressed as the ratio between the maximum chord rotation attained in the member and the corresponding limit value, as
defined for the LS limit state. It should be noted that different scale of representation have been used
for the C/D values in the different diagrams, since the clearness of the representation has been
preferred to the scale uniformity. As regards the brittle mechanisms, the maximum amount of shear in beams and columns has
been shown. Verification of members results to be satisfied in almost all cases; only some beams
experience values of shear lightly over the corresponding limit, for the analysis in the y- direction. Even in this case, as in the results obtained from the linear analysis, the maximum stress found
in the joints largely exceeds the corresponding limit. The found C/D values, in fact, are largely below
the unity in many cases. It should be noted that the tensile stress, in the joints, exceeds the limit condition much more than the compression one.
Figure 7 shows the comparison between the minimum C/D ratios found by elastic and pushover
analyses in each considered collapse mechanism. Higher values of C/D evidence a more conservative
estimation of the seismic performance. As can be observed in Fig. 7, both brittle and ductile mechanisms in columns are largely affected by the type of analysis. As regards the final evaluation of
the seismic assessment of the case-study, anyway, the type of analysis does not plays a fundamental
role. In fact the seismic assessment is mostly conditioned by the joints verification, which provides similar results when performed by the two analyses.
The pseudo-dynamic linear analysis, anyway, has resulted to be more conservative than the
nonlinear static analysis in the evaluation of the seismic performance. Especially for columns and
joints. The difference, expressed in not-dimensional terms, between the minimum C/D values provided by the nonlinear and the linear analyses is shown in Figure 8.
0
1
2
3
4
5
1st 2nd 3rd
C/D
storeys
columns(ductile mechanism)
0
1
2
3
4
5
1st 2nd 3rd
C/D
storeys
beams(brittle mechanism)
0
1
2
3
4
5
1st 2nd 3rd
C/D
storeys
columns(brittle mechanism)
0
1
2
3
4
5
1st 2nd 3rd
C/D
storeys
joints(brittle mechanism)
-1135
1st 2nd 3rdC/D
storeysbeams(brittle mechanism)
Linear, X-direction Pushover, X-direction Linear, Y-direction Pushover, Y-direction
Figure 7. Comparison between the seismic performance found by the two performed analyses.
-50%
0%
50%
100%
1st 2nd 3rd
Dif
f. in
C/D
storeys
COLUMNS -ductile-
-50%
0%
50%
100%
1st 2nd 3rd
Dif
f. in
C/D
storeys
BEAMS -brittle-
-50%
0%
50%
100%
1st 2nd 3rd
Dif
f. in
C/D
storeys
COLUMNS -brittle-
-50%
0%
50%
100%
1st 2nd 3rd
Dif
f. in
C/D
storeys
JOINTS -brittle-
-50%0%50%100%
1st 2nd 3rd
Dif
f. in
C/D storeysCOLUMNS -ductile-
X-direction Y-direction
Figure 8. Not-dimensional difference (DIFF in C/D) between the C/D values found with the two analyses.
M. De Stefano, A. La Brusco, V. Mariani, M. Tanganelli and S. Viti 11
CONCLUSIVE REMARKS
In this work the seismic assessment of an existing RC case-study building has been carried out, by
performing two different analyses, both admitted by the current European Technical Code (EC8): the pseudo-dynamic elastic analysis and the static non-linear analysis. The case-study is a real RC existing
building, currently used as an hospital. An exhaustive knowledge process has been performed on the
case-study; all documents regarding the original project have been collected and a survey on material, including a large number of tests (destructive and not) has been done. The Knowledge Level of the
case-study has been assumed, conservatively, equal to 1 for reinforcement and equal to 2 for the
concrete.
The Life Safety (LS) limit state has been considered in the seismic assessment, and the structural capacity has been consequently found for each member, both referring to ductile and brittle
mechanisms, according to EC8 prescriptions. The seismic input has been represented thorough the LS
spectrum, on the base of the seismicity of the area and assuming a soil-type B. The seismic response of the case-study has been found by performing the two selected analyses.
The demand in each member has been compared to the corresponding capacity and therefore the
seismic performance, expressed in terms of capacity over demand (C/D), has been found for each member, both for ductile and brittle mechanisms.
The obtained results have shown two main evidences: i) the limit conditions regarding the not-
confined joints proved to be more strict than the ones imposed to the members, and ii) the pseudo-
dynamic linear analysis is more conservative than the pushover analysis, especially as regards the seismic performance of columns and joints.
As regards the seismic verification of the case-study, very similar C/D values have been found
for ductile and brittle mechanisms, both for beams and columns. Values of C/D found for joints, instead, are at least one order of magnitude lower than the ones found for beams and columns. From
the results obtained on the case-study, the limit conditions imposed to joints, therefore, are more
severe than the ones assumed for beams and columns.
As regards the role played by the type of analysis on the evaluation of the seismic assessment, the two analytical approaches have provided the same evaluation, i.e. the building to be not respectful
of the safety conditions as provided by the Code. Nevertheless, the difference in C/D values provided
by the two analyses is not negligible, resulting on the order of 50% in columns (brittle and ductile mechanisms) and in joints.
Further analyses should be needed to achieve more general results about the relationship
between the safety conditions of the joints compared to the ones of the other structural members. Besides, since the selected analytical procedure proved to largely affect the seismic assessment of the
case-study, a more comprehensive investigation should be done, to include the nonlinear dynamic
analysis in the comparison, and to consider different case-studies in the evaluation.
ACKNOWLEDGMENTS
This work has been supported by the project DPC-ReLUIS 2010/2013 Task 1.1.2. “Strutture in cemento
armato ordinarie e prefabbricate”. The Authors also wish to thank the Government of Regione Toscana for providing the building database.
REFERENCES
BS 1881, (1983). Testing Concrete. Method for determination of the compressive strength of concrete cores,
British Standard. Circolare n. 617 del 2 febbraio 2009, Istruzioni per l’Applicazione Nuove Norme Tecniche Costruzioni di cui al
Decreto Ministeriale 14 gennaio 2008, Roma.
Concrete Society (1976). Concrete core testing for strength. Concrete Society, Technical report n.11. London.
Cristofaro, M.T. (2009). Metodi di valutazione della resistenza a compressione del calcestruzzo di strutture in
c.a. esistenti, tesi di dottorato, Università degli Studi di Firenze (in Italian).
12
Cristofaro, M.T., D’Ambrisi, A., De Stefano, M., Pucinotti, R., Tanganelli, M., (2012). Studio sulla dispersione
dei valori di resistenza a compressione del calcestruzzo di edifici esistenti. Il giornale delle prove non
distruttive, monitoraggio, diagnostica., vol. 2/2012, pp. 32-39, ISSN: 1721-7075 (in Italian).
De Luca F., Verderame G.M., Manfredi G. 2011a. La verifica di edifici esistenti in cemento armato: criticità
dell’attuale approccio normativo italiano. 26° convegno nazionale AICAP, Padova 19-21 May, 2011 (in
Italian).
De Luca, F., Verderame, G.M. 2011b. A practice-oriented approach for the assessment of brittle failures in
existing reinforced concrete elements, Engineering Structures 48, 373-388.
De Stefano, M., Tanganelli, M., Viti, S. (2013a). On the variability of concrete strength as a source of
irregularity in elevation for existing RC buildings: a case study. Bulletin of Earthquake Engineering, vol.
11 Issue 5, p. 1711-1726, ISSN: 1573-1456, doi: 10.1007/s10518-013-9463-2. De Stefano, M., Tanganelli, M., Viti, S. (2013b). Effect of the variability in plan of concrete mechanical
properties on the seismic response of existing RC framed structures. Bulletin of Earthquake Engineering,
vol. 11 Issue 4, p. 1049-1060, ISSN: 1573-1456, doi: 10.1007/s10518-012-9412-5.
De Stefano, M., Tanganelli, M. Viti, S. (2104). Variability in concrete mechanical properties as a source of in-
plan irregularity for existing RC framed structures. Engineering Structures Volume 59, February 2014,
Pages 161–172.
Di Leo, A., Pascale, G. (1994). Prove non distruttive sulle costruzioni in cemento armato, in atti Convegno
Sistema Qualità e Prove non Distruttive per l’affidabilità e la sicurezza delle strutture civili, Bologna
SAIE, ottobre, Italia (in Italian).
EC 8-3 (2005). Design of structures for earthquake resistence, part 3: strengthening and repair of buildings,
European standard EN 1998-3. European Committee for Standardization (CEN), Brussels. Gašparik, J.(1992) Prove non distruttive nell’edilizia, Quaderno didattico A.I.P.N.D., Brescia, Italia (in Italian).
Giacchetti, R., Lacquaniti, L. (1980). Controlli non distruttivi su impalcati da ponte in calcestruzzo armato, Nota
tecnica 04, Università degli Studi di Ancona, Facoltà di Ingegneria, Istituto di Scienza e Tecnica delle
Costruzioni, Italia (in Italian).
Cestelli Guidi, M., G. Morelli, (1981). Valutazione della resistenza dei calcestruzzi sulle strutture finite.
L’Industria Italiana del Cemento, 3/1981 (in Italian).
Masi, A. (2005). La stima della resistenza del calcestruzzo in situ mediante prove distruttive e non distruttive, Il
Giornale delle Prove Non Distruttive, Monitoraggio (in Italian).
Masi, A.(2008). Analisi di dati sperimentali per la stima degli effetti dell’estrazione sulla resistenza di carote
prelevate da strutture in c.a. Proc. Reluis2Rm08 Valutazione e riduzione della vulnerabilità sismica di
edifici esistenti in c.a., Roma, E. Cosenza, G. Manfredi, G. Monti Eds., Polimetrica International
Scientific Publisher, ISBN 978-88-7699-129-5 (in Italian). NTC 2008. Norme tecniche per le costruzioni. D.M. Ministero Infrastrutture e Trasporti 14 gennaio 2008,
G.U.R.I. 4 Febbraio 2008, Roma.
Palmer, D. 1981. An Introduction to the generalized reciprocal method of seismic refraction
interpretation.”GEOPHYSICS, 46(11), 1508–1518.
SAP2000 Advanced 14.0.0, Structural analysis program. Analysis reference manual. Computer and Structures,
Inc. Berkley, California, USA; 2009.
Sirles, C. and Viksne, A. 1990. Site-specific shear wave velocity determinations for geotechnical engineering
applications S.H. Ward (Ed.), Geotechnical and Environmental Geophysics, Volume III. Soc. Expl.
Geophys. (1990), pp. 121–131.
UNI EN ISO 6892-1. 2009. Materiali metallici - Prova di trazione - Parte 1: Metodo di prova a temperatura
ambiente.