the role of the teacher in advanced … · conclusion ... recommendation for future study ......
TRANSCRIPT

THE ROLE OF THE TEACHER IN ADVANCED PLACEMENT (AP) ACCESS
Justin Christopher Mason B.A., California State University, Chico, 1995
M.A., National University, 1999
DISSERTATION
Submitted in partial fulfillment of the requirements for the degree of
DOCTOR OF EDUCATION
In
EDUCATIONAL LEADERSHIP
at
CALIFORNIA STATE UNIVERSITY, SACRAMENTO
SPRING 2010

Copyright © 2010 Justin Christopher Mason
All rights reserved
11

THE ROLE OF THE TEACHER IN ADVANCED PLACEMENT (AP) ACCESS
A Dissertation
by
Justin Christopher Mason
Approved by Dissertation Committee:
Robert Pritchard, Ph.D., Chair
Jana Noel, Ph.D.
Susan O'Hara, Ph.D.
SPRING 2010
111

THE ROLE OF THE TEACHER IN ADVANCED PLACEMENT (AP) ACCESS
Student: Justin Christopher Mason
I certify that this student has met the requirements for format contained in the University
format manual, and that this dissertation is suitable for shelving in the library and credit is
to be awarded for the dissertation.
-----------------------, Graduate Coordinator Carlos Nevarez, Ed.D Date
IV

ACKNOWLEDGEMENTS
I would like to thank all of the members of my dissertation committee for their
commitment to this work, their expert guidance and thoughtful comments. A special
thank you is necessary for my dissertation committee chair Dr. Robert Pritchard who was
the constant professional and continued to expand my thinking while supporting and
challenging me to achieve this goal.
I would like to thank my wife, Jolynn, for her unconditional love. Thank you for
the constant support, staying up late to transcribe interview recordings, always agreeing
to another proof reading, and taking care of our boys Luke and Aaron during my many
trips to the library. Without your support this long journey would not have been possible.
v

CURRICULUM VITAE
Education
Professional Employment
Publications
Fields of Study
VI

Abstract
of
THE ROLE OF THE TEACHER IN ADVANCED PLACEMENT (AP) ACCESS
by
Justin Christopher Mason
The purpose of this study was to investigate the role of the teacher in Advanced
Placenlent (AP) access for high school students. There are many benefits to students who
participate in the AP program including access to a rigorous curriculum, college course
credit or placement for successful completion of an AP exam, and an advantage when
applying to competitive colleges and universities. Access to AP courses remains an
unlikely opportunity for many low-income students who attend schools that offer few AP
courses, and African-American and Latino students are underrepresented in AP
participation.
This study uses a mixed methods design with both quantitative and qualitative
methods. The first phase of the study was an online survey of AP teachers in three school
districts in Northern California. The second phase of the study used follow-up interviews
to collect additional data from selected Advanced Placement teachers. The online survey
and follow-up interviews were designed to collect data on the perceptions and practices
of AP teachers in the pre-screening of AP students, the promoting of AP courses to
students, and in determining AP course offerings.
Vll

This study indicates that the AP teacher plays an important role in determining
both student access to AP courses as well as in the decision making process of
determining whether their school will offer a specific AP course. AP teachers reported
students should be pre-screened before enrolling in an AP course at higher rates in larger
schools (F=3.749, p=.033) and in schools with higher API scores (F=4.478, p=.018).
Additionally, responses from the follow-up interviews indicate that teachers are making
the decision to pre-screen students or to allow open access without following any state,
district, or site policies. While an overwhelming majority of AP teachers report that it is
part of their role to promote their AP course to students, only a small percentage are
actively promoting their AP course to minority students and to students who are not
already in an honors or AP track. This study indicates that the AP teacher can be a
powerful factor in providing a more equitable access to AP courses as well as in closing
the AP participation gap for historically underrepresented students.
VI11

TABLE OF CONTENTS Page
Acknowledgements ....................................................................................................... v
Curriculum Vitae ......................................................................................................... vi
List of Tables ................................................................................................................ x
Chapter
1. INTRODUCTION .................................................................................................. 1
Statement of the Problem ................................................................................. , 4
Nature of the Study ........................................................................................... 5
Theoretical Framework ..................................................................................... 6
Assumptions and Limitations ........................................................................... 7
Significance of the Study .................................................................................. 7
Definition of Terms .......................................................................................... 8
Conclusion ........................................................................................................ 8
2. REVIEW OF RELATED LITERATURE ............................................................ 11
Advanced Placement Background .................................................................. 11
Advanced Placement Benefits ........................................................................ 16
Issues of Access .............................................................................................. 21
Advanced Placement Teachers ....................................................................... 28
Summary ......................................................................................................... 32
3. METHODOLOGY ............................................................................................... 34
Introduction ..................................................................................................... 34
Research Design ............................................................................................. 35
Population ....................................................................................................... 36
Data Collection ............................................................................................... 36
Analysis of Data ............................................................................................. 38
Conclusion ...................................................................................................... 41
IX

4. ANALYSIS OF THE DATA ................................................................................ 42
Introduction ..................................................................................................... 42
Study Participants ........................................................................................... 42
Data Analysis .................................................................................................. 43
Summary ......................................................................................................... 65
5. SUMMARY AND CONCLUSIONS ................................................................... 67
Introduction ..................................................................................................... 67
Overview of the Study .................................................................................... 68
Discussion of Findings ................................................................................... 69
Implications .................................................................................................... 81
Recommendation for Future Study ................................................................. 82
Conclusions .................................................................................................... , 84
6. APPENDICES ...................................................................................................... 86
Appendix A AP Course Offerings: State Mandates ...................................... 87
Appendix B Research Questions and Corresponding Survey Items ............. 90
Appendix C Interview Protocol ..................................................................... 92
Appendix D Online Survey Consent Form .................................................... 93
Appendix E Tables: Responses by Teacher Factors ...................................... 94
Appendix F Interview Informed Consent Form .......................................... 108
REFERENCES ......................................................................................................... 109
x

LIST OF TABLES
Table Page
1. Advanced Placement Courses and Exams.. . .. . .. .. . . . . . .. . . . . . . . . . . . .. . . . .. ... .... 13
2. Survey items la-Ie: Screening prospective AP students .......................... 44
3. Survey items Id-If: Method of screening prospective AP students ............. 45
4. Survey item Ig: Influence of AP exams scores on perception of teaching .... 46
5. Survey items 2a-2c: Promoting AP courses to students .......................... 47
6. Survey items 3a and 3b: The role of the AP teacher in determining course
offerings ....................................................................................... 48
7. ANOV A Results: Comparisons with number of students ........................ 50
8. ANOV A Results: Comparisons with API score ................................... 50
9. ANOVA Results: Comparisons with API score ................................... 52
10. ANOV A Results: Comparisons with race / ethnicity ............................ 54
11. ANOV A Results: Comparisons with API score ................................. 55
12. ANOV A Results: Comparisons with Percent of Students Qualifying for Free
and Reduced Lunch ......................................................................... 56
Xl
Chapter 1
INTRODUCTION
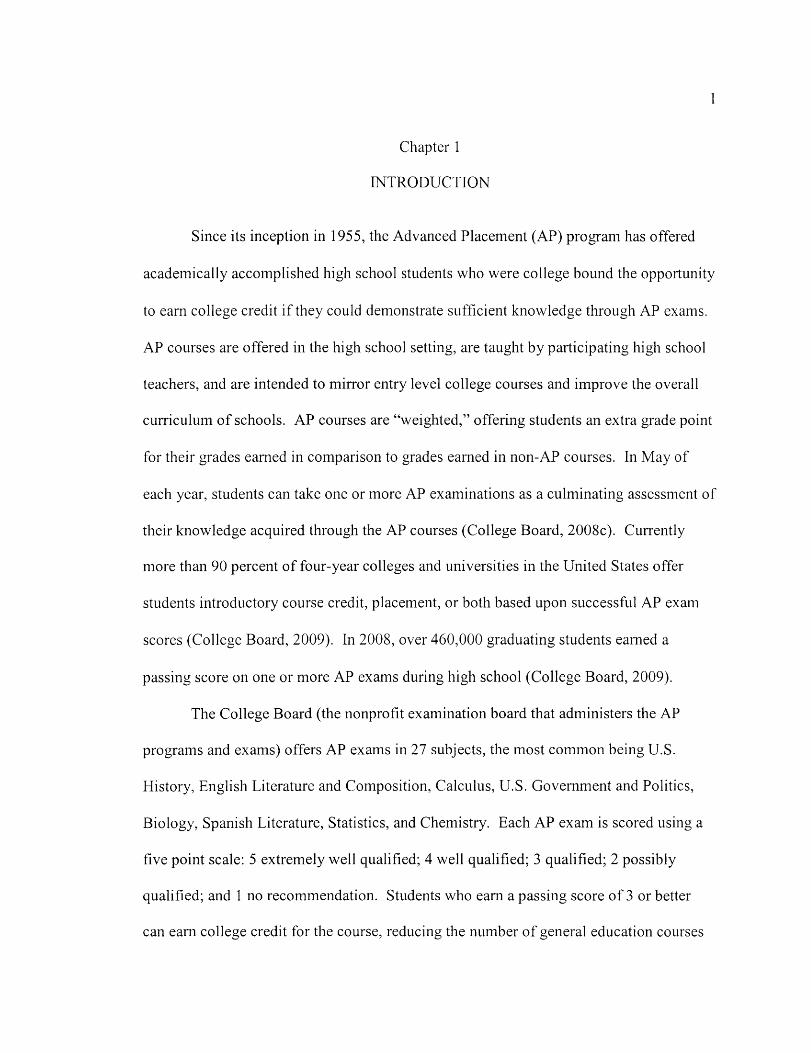
Since its inception in 1955, the Advanced Placement (AP) program has offered
academically accomplished high school students who were college bound the opportunity
to earn college credit if they could demonstrate sufficient knowledge through AP exams.
AP courses are offered in the high school setting, are taught by participating high school
teachers, and are intended to mirror entry level college courses and improve the overall
curriculum of schools. AP courses are "weighted," offering students an extra grade point
for their grades earned in comparison to grades earned in non-AP courses. In May of
each year, students can take one or more AP examinations as a culminating assessment of
their knowledge acquired through the AP courses (College Board, 2008c). Currently
more than 90 percent of four-year colleges and universities in the United States offer
students introductory course credit, placement, or both based upon successful AP exan1
scores (College Board, 2009). In 2008, over 460,000 graduating students earned a
passing score on one or more AP exams during high school (College Board, 2009).
The College Board (the nonprofit examination board that administers the AP
progranls and exams) offers AP exams in 27 subjects, the most common being U.S.
History, English Literature and Composition, Calculus, U.S. Government and Politics,
Biology, Spanish Literature, Statistics, and Chemistry. Each AP exam is scored using a
five point scale: 5 extremely well qualified; 4 well qualified; 3 qualified; 2 possibly
qualified; and 1 no recommendation. Students who earn a passing score of 3 or better
can earn college credit for the course, reducing the number of general education courses

2
required and potentially lowering the costs of attending college. The current costs
associated with each additional year of attending a college or university is estimated to be
up to $19,000, and students in private colleges and universities can expect to pay $26,197
for each additional year (College Board, 2008a).
A study at the University of California at Berkeley found that AP students who
earn a 3 or higher on an AP exam earn higher college grades and graduate from college at
a higher rate than otherwise similar peers in control groups (Geiser & Santelices, 2004).
Additionally, the vast majority of students that enroll in AP courses in high school persist
to complete a bachelor's degree, including first generation college students (Tierney,
Colyar, & Corwin, 2003). Hargrove et al. (2008) found that even for students who failed
the AP exam, enrollment in an AP class exposed students to college-level standards,
leading to greater college success.
Even though more than 90% of California high schools offer Advanced
Placement (AP) courses, many students across all ethnicities and socio-economic lines
have limited access to AP classes (Brownell & Beasley, 1999). Currently, AP teachers
view the democratization of AP courses differently, with some offering open enrollment
to all students regardless of their academic background, while others prefer to screen
potential students for academic qualifications based upon grade point average or other
pre-set criteria (Sawchuk, 2009). Access to AP courses remains an unlikely opportunity
for many low-income and rural students who attend schools that offer few AP courses
(Zarate & Pachon, 2006). Nationwide the African American and Latino students are
particularly underrepresented in AP test taking as the schools that traditionally have

provided the greater number of AP courses have been located in more affluent, suburban
areas (Furry & Hecsh, 2001).
3
In California, many colleges use the "weighted" grades of AP students when
considering admission. For example, in 1998, UC Berkeley rejected 8,000 applicants
whose grade point averages were 4.0 or higher, choosing rather to accept students with
higher grade point averages due to their enrollment in AP courses (ACLU, 1999). The
California Department of Education and the College Board encourage teachers and
school administrators to make equitable access a guiding principle of all schools' AP
progranls (College Board, 2008b). However, students who attend high schools that fail to
offer or offer a limited number of AP courses may not have the opportunity to earn a
grade point average high enough to qualify for admittance into California's highly
competitive universities. In 1999, the American Civil Liberties Union (ACLU) filed a
class action lawsuit against the state of California (Daniel v. California) charging that
African American, Latino, and needy students who attended high schools with few A.P.
course offerings are at a disadvantage in applying to colleges (including the University of
California) that consider AP classes when deciding whether to admit students (Carnevale,
1999). While many states have taken measures to make AP more accessible, schools
serving traditionally underrepresented students continue to offer AP courses at a
disproportionate rate compared to high performing schools (Tierney, Colyar, & Corwin,
2003).

4
Statement of the Problem
There have been numerous studies illustrating the positive effects of an AP
curriculum on students' success in college admittance and completion. Many selective
colleges and universities consider grade point averages and AP enrollment when
considering applicants. Barriers to AP access currently exist due to school demographics,
funding, and university admission policies. African American and Latino students
particularly are underrepresented in AP participation. Hoffman (2003) highlighted the
need for continued research that addresses equity of access:
Even though underrepresented students are taking greater advantage of
postsecondary options while enrolled in high school, these benefits remain
unevenly distributed. Many underrepresented students are shut out of participation
in such programs by the lack of rigorous curricula at the high schools they attend,
lack of information about the many options for earning college credit that are
currently available, and by substantial fees for participation in some states. We
need to know far more systematically than we now do what the barriers are for
these students, and how they can be overcome. (p. 48)
AP participation numbers and current research reveal that barriers to AP access and
participation exist for many students. In 2009 African American students made up 14.50/0
of the graduating students nationwide, but were only 3.7% of the successful AP exam
population. In California, Latino students were 40.1 % of the state's graduates in 2009,
but were only 31.7% of the states successful AP exam population (College Board, 2010).

5
One barrier about which the data is particularly limited is the role of teachers in
AP access and barriers to access. This study was designed to fill a gap in the existing
educational literature on the role of the AP teacher in AP course access for students. The
study examined the decision making process of high school teachers in determining
student access and assignment to Advanced Placement courses and in determining
Advanced Placement course offerings in high schools.
Nature of the Study
This study was designed to collect data on the perceptions and practices of AP
teachers. The data for this study was collected in two phases, an online survey of current
AP teachers, followed by interviews of selected AP teachers from the survey. The survey
and interview protocol were designed to collect data on the following research questions:
Research Question # 1 : What are the perceptions and behaviors of Advanced
Placement teachers regarding course enrollment criteria for students?
Research Question #2: What is the role of the Advanced Placement teacher in
encouraging participation in Advanced Placement courses for underrepresented students?
Research Question #3: What is the role of the Advanced Placement teacher in
determining Advanced Placement course offerings?
Research Question #4: What is the relationship between school factors and
Advanced Placement teacher factors as measured by the survey?
The data that was collected in the first phase was analyzed to determine any
correlations between AP teacher perceptions and practices to school and teacher factors.
The data was analyzed by using both descriptive statistics and multiple regression

analyses. The data was then used to select AP teachers for the second phase of the study
to collect qualitative data to aid in the understanding of the research questions.
Theoretical Framework
6
The focus of the study is on the role of the teacher in determining AP access for
students. There are many advantages for students who complete and AP course and who
pass an AP exam. Limiting participation in the AP program can limit a student's ability
to compete for admission into selective colleges as well as potentially limit college
success. Due to the importance of AP courses in competing for admission into selective
colleges and universities, the theoretical framework that was used as a guide for the study
was that of operational citizenship.
Operational Citizenship
Operational citizenship is the ability to exercise citizenship and participate in
governance. It includes the ability to access the rights and benefits of participation with
equal opportunity and equal access. The idea of operational citizenship is derived from
the civic participation literature and ideology where each individual has the right to act in
society. All citizens are believed to have a voice through an equal vote or at least by
establishing an environment of self determination where citizens are freely able to access
education, employment, and other opportunities (Hall & Held, 1990). Operational
citizenship is often a challenge for minority groups as they have historically faced
additional challenges to accessing opportunities for advancement and achievement (Day,
2003). As a result, programs and policies should be viewed in the context of providing
equal access to opportunities (information, tools, and awareness) that are necessary for

7
self determination and making decisions for themselves, rather than by others (Hall &
Held, 1990). For students to be able to determine their own educational future, they must
have equal access to all educational programs and opportunities that are necessary for
college admittance and success.
Assumptions and Limitations
This study focuses on the perceptions of Advanced Placement teachers in public
high schools. Specifically, the study will examine the decision making process of
teachers in AP course offerings and course prerequisites. The study examined issues of
access but was limited to current teachers of AP courses. Several assumptions underlie
the study:
1. Participants will teach at least one Advanced Placement course.
2. Participants are computer-knowledgeable.
3. Participants will self-report on the web-based survey.
4. Participants will respond in good faith, honestly, and in a timely manner.
5. Participants will understand the survey questions.
Additionally, the AP teachers participating in the study were all employed within
three school districts in Northern California. The perceptions and practices of the AP
teachers in the study may not be applicable to other geographic area.
Significance of the Study
This study will add to existing educational literature on Advanced Placement and
issues of student access. More specifically, the study is intended to add to the limited
research that exists on the role of the teacher in determining student access and

8
assignment to Advanced Placement courses and in determining the Advanced Placement
course offerings in high schools. In addition, by examining the results through the lens of
operational citizenship, the researcher will provide recommendations for educational
leaders on the policy and practice of providing students access to AP courses.
Definition of Terms
Advanced Placement (AP) course - a college-level course taught in the high
school setting using a standardized course syllabus aligned with the Advanced Placement
examination (College Board, 2008c).
College Board - a non-profit organization that since 1955 has continued to
develop and maintain the Advanced Placement program, support high schools, colleges
and universities, and coordinate the administration of annual AP examinations (College
Board, 2008c).
Latino - a term used to describe a person of Hispanic, especially Latin-American,
descent.
Low-income student - a student who is eligible for free or reduced-price lunches
under the National School Lunch Act.
Weighted course - a high school course that provides an extra grade point,
allowing student to earn a grade point average above the traditional perfect average of
4.0.
Conclusion
Tierney, Colyar, and Corwin (2003) cite three factors highlighting the importance
of AP course access. First, college enrollment and persistence to graduation are higher

9
among students in college preparatory classes such as AP courses. Second, preparation
through rigorous academic curriculum is important to the college enrollment decisions of
low-income students. Third, schools that fail to provide a rigorous curriculum can
undermine the college preparation of those students who are most in need of assistance.
Due to various policies and practices, AP participation has been limited for many
students, especially for students from traditionally underserved populations. This study
will examine the role of the teacher in determining AP course offerings and student
access to AP courses.
Chapter Two provides a detailed review of the literature on the Advanced
Placement program and issues of student access to AP courses. The chapter provides a
review of the background and growth of the AP program followed by an examination of
contrasting points of view on the benefits of AP for students participating in the AP
program. The review of the literature will also include examining issues of access for
historically underrepresented backgrounds and will examine the existing literature on AP
teachers.
Chapter Three explains the methods used in conducting a mixed quantitative and
qualitative study to determine the decision making processes of teachers for determining
course offerings, student access, and assignment to Advanced Placement courses. This
chapter is also an explanation of how the data were collected and the methods used for
analysis.

10
Chapter Four provides an account of the research tools used for data collection,
the findings from the online survey and follow-up interviews, and an overall analysis of
the data.
Chapter Five examines and discusses the themes that emerged from the data
regarding the influence of the teacher in determining Advanced Placement offerings,
student access, and student enrollment. This chapter includes an interpretation of the
findings as well as recommendations for action and for further study.

11
Chapter 2
REVIEW OF RELATED LITERATURE
This review of the literature summarizes the history and growth of the Advanced
Placement program and explains the existing program and its criticisms. The summary is
followed by a discussion of the research into the benefits of the AP program for students
and schools. The review will also examine issues of access to AP courses for students in
various school settings and for students from traditionally underserved populations. The
theoretical framework of operational citizenship views equal access as a crucial
component for self determination (Hall & Held, 1990). Current data reveal that barriers
to AP access and participation exist for many students.
Advanced Placement Background
History and Growth
After World War II, the Ford Foundation sought to improve American schools by
forming the Fund for the Advancement of Education (F AE) in 1951, which created a
program for early admission to college for high school seniors (Nugent & Kames, 2002).
Over the next four years, representatives of Harvard, Princeton, and Yale, and the
preparatory schools affiliated with them recommended allowing high school seniors to
take college-level courses and achievement exams that would allow them to earn college
credit. Along with a number of eastern colleges, the president of Kenyon College in
1953 established course descriptions for freshman college courses that could be accepted
by colleges even if taught in high schools (Nugent & Kames, 2002). The first Advanced
Placement examinations began in May of 1954 and the program was taken over by the

College Board in 1955 with the Educational Testing Service (ETS) becoming the
supervising agency for the examination readings (Rothschild, 1999).
12
The College Board is a not-for-profit membership organization founded in 1900.
The association is currently comprised of more than 5,400 schools, colleges, and
universities and provides services in college admissions, guidance, assessment, financial
aid, enrollment, and teaching and learning. Among the best known College Board
programs are the SAT's, the PSATINMSQT's, and the Advanced Placement program
(College Board, 2008c).
Initially, AP examinations were administered to around 100 high schools and
1,200 students who took 2,200 examinations. The AP program grew continually into the
1980's and then grew dramatically in the 1990's with the number of students
participating and the number of examinations administered tripling (College Board,
2004). In 2004, over one million AP students took nearly two million AP examinations
(College Board, 2005). In 2008, 15.2 percent of students (more than 460,000) who
graduated from public schools in the United States earned an AP exam score of at least 3
(passing score) on one or more AP exams. This was an increase from 14.4 percent in
2007 and 12.2 percent in 2003 (College Board, 2009). Currently, more than 90 percent
of four-year colleges and universities in the United States grant students credit and or
placement on the basis of qualifying AP exam scores (College Board, 2009). The large
growth of the AP program in the 1990's has been primarily sustained by ongoing national
reforms in K-12 education, by existing college admission procedures, and by attention in
the popular media (Fithian, 2003).

13
Advanced Placement Courses and Examinations
The purpose of AP courses is to mirror entry level college courses and improve
the overall curriculum of schools (Callahan, 2003). Currently, the AP program offers 27
courses and exams to more than 17,000 schools worldwide. Table 1 shows the courses
and exams offered by the College Board (College Board, 2008c).
Table I
Advanced Placement Courses alld Exallls
Arts
Art History
Music Theory
Studio Art: Drawing Portfolio
Studio Art: 2-D Design Portfolio
Studio Art: 3-D Design Portfolio
English
English Language and Composition
Engl ish Literature and Composition
Social Sciences
Comparative Government and Politics
European History
Human Geography
Macroeconomics
Microeconomics
Psychology
United States Government and Politics
United States History
World History
Mathematics Sciences
Calculus AB Biology
Calculus BC Chemistry
Computer Environmental Science A Science
Computer Physics B Science AS
Physics C: Statistics Electricity and
Magnetism
Physics C: Mechanics
World Language
Chinese Language and Culture
French Language
French Literature
German Language
Ital ian Language and Culture
Japanese Language and Culture
Latin Literature
Latm: Vergil
Spanish Language and Spanish Literature
Each year the AP exams are given in May with each exam divided into a multiple
choice section and a free-response written section. The scores of the two sections are

14
combined to form a total score that is converted into a five-point scale. 5 = extren1ely
well qualified; 4 = well qualified; 3 = qualified; 2 = possibly qualified, and 1 = no
recomn1endation. Individual colleges and universities, not the College Board, set their
own policies for granting introductory level course credit and placement. Most colleges
and universities consider a score of 3 sufficient for introductory level course credit, with
many states such as Kentucky mandating all public state universities to give introductory
level credit for a score of 3 or higher on AP exams (Johnson, 2005). Some exclusive
colleges and universities such as Stanford will only accept a perfect score of a 5 to grant
test credit for introductory courses (Stanford University, 2009).
Students are allowed to take as many AP exams as they wish. Enrolling and
passing an AP course is not required to take an AP exam. Students who are
homeschooled or students who attend a school that does not offer AP courses can still
take AP exams by arranging to test at a participating school. Students with documented
disabilities may receive accommodations on the AP exams including extended time,
large-type exams, and Braille exams. The fee for each AP exam is currently $86
although the College Board provides a $22 reduction for qualifying students with
financial needs. Most states have established additional fee reduction programs to
increase availability and participation in AP courses for low income students (College
Board, 2008c). In California, Assembly Bill 2216 created a grant program for
economically disadvantaged students to cover the costs of advanced placement exam
fees. The grant program permits eligible low-income students to pay $5 for each AP

examination fee with the remainder of the costs being paid with federal grants in
conjunction with state funds (Cal Ed. Code § 52240).
15
AP exams are generally from two to three hours and contain both multiple-choice
and free-response questions. The AP exams in French, German, Italian, Spanish
Language and Music Theory include a listening portion from recorded CDs. The
multiple choice portion of the exam is computer scored and the free-response portion is
evaluated in June by "readers" who are made up of AP teachers and college professors.
AP scores are reported to student designated colleges in July and then sent to students
and high schools in mid July (College Board, 2008d)
Advanced Placement Criticism
While the AP program has grown significantly in the last two decades, there have
been concerns that the AP program can at times have a negative effect on schools and the
overall curriculum. Critics argue that AP courses and exams cover too much information
even for students with a strong academic background (Klopfenstein, 2003a). AP courses
are designed to cover a substantial amount of material in a short period of time to prepare
for the AP exam (Klopfenstein & Thomas, 2005). The National Research Council (2002)
has stated that too much course content may limit long-term student achievement by
forcing the instructor to limit any in-depth study of the content. Additionally, teachers
and students have reported frustration at the rigidity of AP courses, and students in a
focus group have suggested that there was only a limited amount of room for a diversity
of teaching styles in AP courses (Kyburg et aI., 2007).

16
Even though the program continues to grow nationally, some high schools have
begun to discontinue their AP programs to improve the overall curriculum of the school.
Some schools have chosen to focus on designing their own curriculum to meet the needs
of their students, rather than using a standardized curriculum (Matthews, 2005; Santo Ii,
2002). Smaller schools and rural schools have found it more difficult to provide their
students with a comprehensive AP program due to limited resources in comparison to
larger schools and districts. In a rural Pennsylvania study, Gardner (2003) found a
diffusion of higher academic standards and larger class sizes for students not enrolled in
AP courses when scheduling was done to accommodate for AP courses and students.
Larger schools and districts had more funds and scheduling flexibility to offer more
classes for non AP students. Rural schools and districts usually lack the funds and the
qualified teachers that are available to large schools and districts (Dounay, 2006).
Advanced Placement Benefits
Since the early 1980's the College Board has sponsored considerable research on
the Advanced Placement Program. Initial research by Casserly (1986) concluded that AP
students who had passed the AP exam and were given credit for an introductory college
course were more successful in advanced college courses than students who had not
participated in the AP program and had been required to take introductory college
courses. In 1986, Willingham and Morris published a highly publicized longitudinal
study comparing almost 5,000 AP and non-AP students from over 700 high schools. The
researchers found that AP students outperformed their non-AP counterparts academically
and hinted that an "AP advantage" existed for many non-AP students. Students who

17
attended high schools with large AP programs experienced more success in college than
was expected when examining their grades and test scores (Santoli, 2002). Casement
(2003) has criticized the College Board for its conflict of interest in continually offering
positive research in favor of the AP program, which nets the College Board over 20
million dollars per year. Existing research indicates that many of the academic benefits
of AP courses after college admission are due to exposing students to the academic rigor,
expectations, and autonomy that is associated with a college level curriculum (Harris &
Galitsis, 1980).
College Admission
Even though the AP program was not originally intended to give students an
advantage in the college admissions process, today AP courses and tests have become a
popular tool for increasing students' chances for admission into competitive colleges and
universities (Tai, 2008). The way in which colleges and universities award credit to AP
students varies from institution to institution (Geiser & Santelinces, 2004). However, AP
courses and test scores can signal a student's exposure to a challenging curriculum and in
some colleges and universities can be a ticket to more-advanced courses (Oxtoby, 2007).
The California Postsecondary Education Commission (2005) recognizes that
successfully completing Advanced Placement courses will improve a student's chance for
college admission as AP courses are weighted heavier than non-AP courses, giving the
AP student an additional grade point when calculating the student's grade point average.
The majority of colleges and universities recalculate students' high school grade point

averages after eliminating courses viewed as unnecessary and giving preference to
courses deemed to be academically advanced (Hawkins & Clinedinst, 2006).
18
In a 2002 study, college admissions personnel ranked AP course enrollment above
SAT II scores in importance for college admissions (Breeland, et aI., 2002). Institutions
such as the University of California consider the number of Advanced Placement courses
that a student completes and the grades that were earned as independent criteria for
admission (Geiser & Santelices, 2004). Under systems like the University of California,
students who do not take AP courses are at a disadvantage in admissions, regardless of
their academic achievement.
College Success
One of the first systematic analyses of the perfonnance of AP students in college
was conducted by Burham and Hewitt (1967) with students at Yale University. The
study reported that in English and mathematics courses, AP students outperfonned their
non-AP peers. Subsequent studies reported that AP students were more sufficiently
prepared prior to college entry to enroll in upper-level courses and AP students were
more likely to specialize in majors with tougher grading standards and to double major
(Simms, 1982; Willingham & Morris, 1986). In a study of more than 3,000 AP students
in the University of California system, Morgan and Crone (1993) found that AP students
continued to pursue knowledge in the subject area of their exam at greater rates than
other students as well as earned grades that were higher than non-AP students.
In 1992, the State Council of Higher Education reported that academically
prepared high school students were not only more successful in college but were also

19
more self-confident, had higher aspirations, and felt that they "fit-in" more easily into
college. Santoli (2002) revealed that AP courses made a difference in how students
prepared and how they felt for college, and found that AP students had a better four-year
college perfonnance than non-AP students. In a study at Syracuse University, first year
students who entered the university with AP credit maintained a first-year retention rate
of 96% compared to the existing national average of 79% (Miller, 1994). In a
longitudinal study, Hargrove (2008) recognized that there was a trend of students who
had successfully participated in one or more AP courses significantly outperfonning
similar non-AP students. Additionally, students who were given introductory course
credit for passing an AP test had greater success in advanced college courses than non
AP students. A study of 182 college sophomores focused on those who had taken AP
English courses in high school and those who had only taken a first-year writing
composition class. Those students who had taken both the AP English course and the
first-year writing composition class significantly outperfonned students who had just
taken one or the other (Hansen et aI., 2006). A similar study of nearly 5,000 students in
science classes reported that AP students who had received introductory level credit for
science classes perfonned better in advanced science classes than students who had taken
the introductory science course before taking the advanced course (Richards, 2006).
Multiple studies have suggested that even students who do poorly on AP tests by not
scoring a 3 or higher are still more likely to go to college and graduate from college than
non-AP students (Callahan, 2003; Matthews, 2005; Santoli, 2002).
20
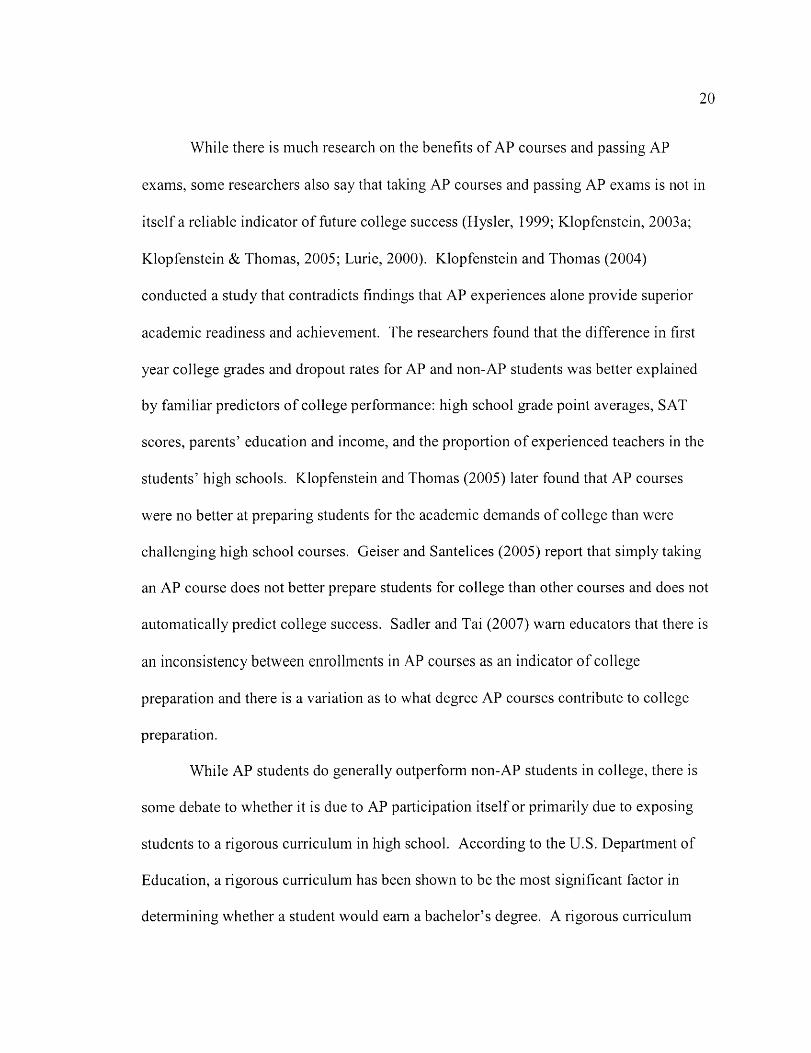
While there is much research on the benefits of AP courses and passing AP
exams, some researchers also say that taking AP courses and passing AP exams is not in
itself a reliable indicator of future college success (Hysler, 1999; Klopfenstein, 2003a;
Klopfenstein & Thomas, 2005; Lurie, 2000). Klopfenstein and Thomas (2004)
conducted a study that contradicts findings that AP experiences alone provide superior
academic readiness and achievement. The researchers found that the difference in first
year college grades and dropout rates for AP and non-AP students was better explained
by familiar predictors of college performance: high school grade point averages, SAT
scores, parents' education and income, and the proportion of experienced teachers in the
students' high schools. Klopfenstein and Thomas (2005) later found that AP courses
were no better at preparing students for the academic demands of college than were
challenging high school courses. Geiser and Santelices (2005) report that simply taking
an AP course does not better prepare students for college than other courses and does not
automatically predict college success. Sadler and Tai (2007) warn educators that there is
an inconsistency between enrollments in AP courses as an indicator of college
preparation and there is a variation as to what degree AP courses contribute to college
preparation.
While AP students do generally outperform non-AP students in college, there is
some debate to whether it is due to AP participation itself or primarily due to exposing
students to a rigorous curriculum in high school. According to the U.S. Department of
Education, a rigorous curriculum has been shown to be the most significant factor in
determining whether a student would earn a bachelor's degree. A rigorous curriculum

21
was more significant than traditional benchmarks such as a student's grade point average
or class rank in determining college success (Weiss, 2001).
Issues of Access
Over the last decade there has been increasing concern about the availability of
AP courses for all students, especially those in rural areas and students from historically
underserved populations. The predominance of AP courses are offered in more affluent,
suburban areas with African American and Latino students underrepresented in AP
participation (Furry & Hecsh, 2001). Klopfenstein (2004) suggested that the availability
of AP courses depended upon three main factors: college expectations, school size, and
school resources. Students who had high expectations for attending college tend to
request and demand more AP programs from their high schools. Schools with large
proportions of low-income and English Leamer (EL) students tend to offer fewer AP
courses due to low expectations about attending college. African American and Latino
students tend to reject high-level mathematics courses despite a demonstrated relationship
between a strong math background and college success and personal economic success
(Klopfenstein, 2004; Rose & Betts, 2001). Secondly, large schools tended to provide
more AP courses since the scheduling and cost of AP programs were easier to
accomn10date than in smaller schools. Third, schools with limited resources found it
difficult to fund a comprehensive AP program that may only be utilized by a limited
portion of the student population.
Regardless of the number of AP courses offered at a student's high school, many
students continually face limited access to AP participation as many schools use grades,

22
teacher recommendation, and other criteria to determine AP course placement. The terms
"barrier" and "gatekeeper" have been used to describe teachers and counselors who make
decisions about AP design, placement, and recommendations (Barber, 1995; Lazarin,
2001; Lee, 2001). According to Oakes (1990), course placement in most high schools
requires teacher appraisal of student ability through grades and recommendations.
Practices of early tracking or grouping students together based upon their similar
abilities, also impacts the AP participation for many students. Beginning as early as sixth
grade, many students are advised to take courses that are not college preparatory,
providing a distinct disadvantage when compared to students who are tracked into more
rigorous courses (Oakes, 1995). Teacher recommendation or permission to enroll in an
AP course has had a significantly large impact on minority students' participation
(Escalante, 1990). In her 1995 study, Oakes found a racial bias in teachers who were
more likely to recommend and place white and Asian students in college preparatory
courses, even when minority students had similar test scores.
Historically Underserved Populations
AP courses have been criticized for failing to provide an equal opportunity for
minority students around the country (Klopfenstein & Thomas, 2005; Lichten, 2000;
Santoli, 2002). AP courses have been traditionally found in communities with resources.
The likelihood of the availability of AP courses is greater for students of middle class and
wealthy communities (Hacsi, 2004). In a Texas study, Klopfenstein (2003a) found that
African American students participated at half the rate of white students in AP courses,
and poverty was a factor that reduced AP participation by 40 percent.
23
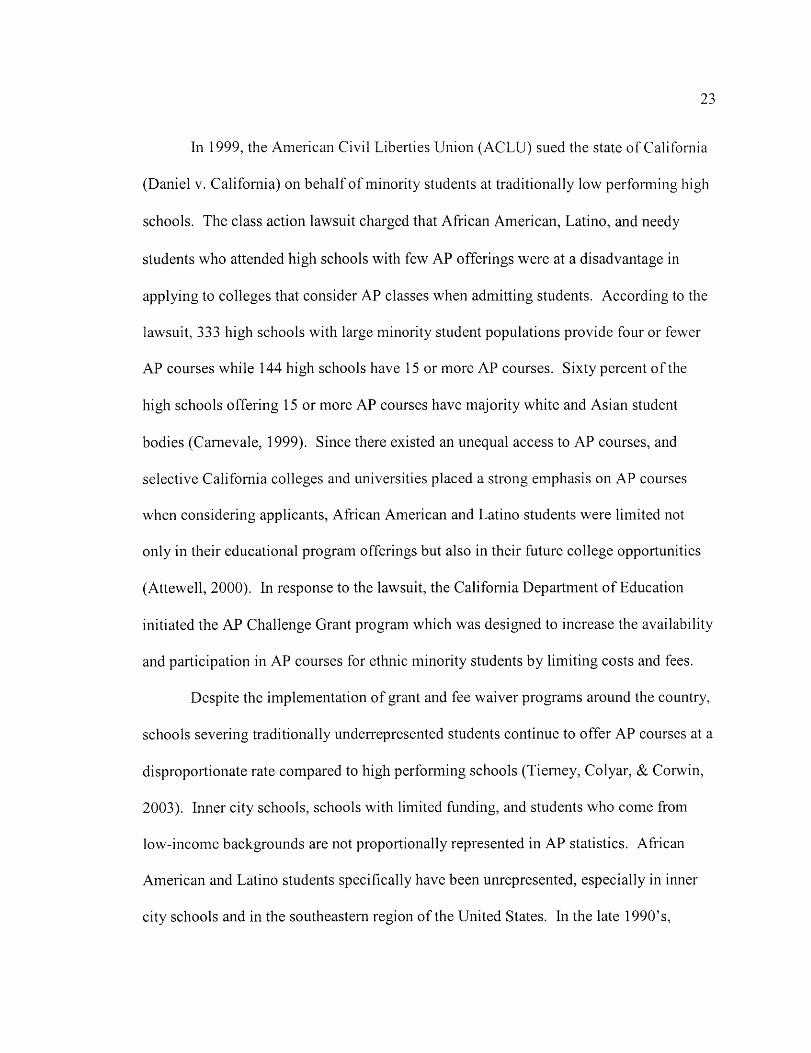
In 1999, the American Civil Liberties Union (ACLU) sued the state of California
(Daniel v. California) on behalf of minority students at traditionally low performing high
schools. The class action lawsuit charged that African American, Latino, and needy
students who attended high schools with few AP offerings were at a disadvantage in
applying to colleges that consider AP classes when admitting students. According to the
lawsuit, 333 high schools with large minority student populations provide four or fewer
AP courses while 144 high schools have 15 or more AP courses. Sixty percent of the
high schools offering 15 or more AP courses have majority white and Asian student
bodies (Carnevale, 1999). Since there existed an unequal access to AP courses, and
selective California colleges and universities placed a strong emphasis on AP courses
when considering applicants, African American and Latino students were limited not
only in their educational program offerings but also in their future college opportunities
(Attewell, 2000). In response to the lawsuit, the California Department of Education
initiated the AP Challenge Grant program which was designed to increase the availability
and participation in AP courses for ethnic minority students by limiting costs and fees.
Despite the implementation of grant and fee waiver programs around the country,
schools severing traditionally underrepresented students continue to offer AP courses at a
disproportionate rate compared to high performing schools (Tierney, Colyar, & Corwin,
2003). Inner city schools, schools with limited funding, and students who come from
low-income backgrounds are not proportionally represented in AP statistics. African
American and Latino students specifically have been unrepresented, especially in inner
city schools and in the southeastern region of the United States. In the late 1990's,

24
minority students had a passage rate on AP exams at half the majority rate (Lichten,
2000). Klopfenstein (2003b) found that magnet schools in Texas tended to promote AP
participation among white students but did not equally promote participation among
African American students.
Equity Gap
An equity gap exists when traditionally underserved students, such as African
American and Latino students, make up a smaller percentage of the group of students
participating in AP than the percentage these students represent in the overall student
body. In Michigan, white students make up 75 percent of the school population and 85
percent of the students in AP English, AP calculus, and AP biology. African American
students in Michigan make up 20 percent of the school population but less than five
percent of the AP students (Education Trust, 2002).
According to the College Board (2009), eighteen states have closed the equity gap
(Alabmna, Alaska, Arkansas, District of Columbia, Florida, Georgia, Kentucky,
Louisiana, Maine, Maryland, Mississippi, Missouri, Ohio, South Carolina, Tennessee,
Vermont, Virginia, and West Virginia) but no state has closed the gap for African
American students alone. Alabama has seen the largest five-year increase in the
percentage of its successful AP students who are African American. African American
students made up 31. 7 percent of the state's student population in 2008 and were 7.1
percent of the state's successful AP student population, up from 4.5 percent in 2003
(College Board, 2009).

25
Klopfenstein (2003b) discovered in her study that low income was the single most
important factor behind the minority AP participation gap. Low-income students were
n10re likely to be pressured to work or take on family responsibilities while attending
school, and low-income students typically had limited access to a culture of learning that
leads students to pursue a rigorous high school curriculum. Her study revealed that low
income limited AP participation for all races, and in Texas specifically, African
American and Latino students were three times more likely to be low-income as white
students.
Federal and State Policies
In response to concerns of student equity and access to AP, federal and state
governments implemented incentive programs that primarily target traditionally
underserved students. Some states have required all high schools to offer a minimum
number of AP courses, or for small rural school districts, to provide an online AP course
option for students (see appendix A).
Originally passed in 1965, the Elementary and Secondary Education Act (ESEA),
reauthorized as the No Child Left Behind Act (NCLB) of 2002, is the main federal law
affecting K-12 education. NCLB created the "Access to High Standards Act" which
includes section 1704, the Advanced Placement Test Fee Program, and section 1705, the
Advanced Placement Incentive Program Grants program. The Advanced Placement Test
Fee Program offers grants to states to reimburse qualified low-income students for part of
or all of the costs of AP test fees. For the year 2009, the U.S. Department of Education
appropriated $14,703,549 in grants to states to pay the Advanced Placement test fees for

26
low-income students (U.S. Department of Education, 2009a). The Advanced Placen1ent
Incentive Program Grants awards 3 year grants on a competitive basis to educational
entities for teacher training, pre-advanced placement course development, books and
supplies, and other activities and resources (NCLB, 2002). For the 2008 fiscal year, the
U.S. Department of Education appropriated $31,539,834 to 64 educational entities (U.S.
Department of Education, 2009b).
Section 51228( a) of the California Education Code requires all school districts to
offer to all of their qualified high school students a curriculum that meets the
requirelnents and prerequisites for admission to California's post secondary institutions.
Additionally, the California Education Code also states that "standardized tests" are a
major factor in the admission of students in post secondary education, and it defines
"standardized tests" to include "Advanced Placement tests" (Cal Ed. Code §99151).
The California Education Code section 200 (a) states, "it is the policy of the State
of California to afford all persons ... equal rights and opportunities in the educational
institutions of the state." Additionally, "No person shall be subjected to discrimination
on the basis of disability, gender, nationality, race or ethnicity, religion, sexual
orientation, or any other characteristic ... or any program or activity conducted by an
educational institution that receives, or benefits from, state financial assistance or enrolls
pupils who receive state student financial aid" (Cal Ed. Code § 220). Section 66204 (a)
requires the State Superintendent of Public Instruction to assist all school districts in
ensuring that all public high school students have access to a curriculum that meets the

admission requirements of the University of California and the California State
University.
Suggested Reforms
27
In addressing the concerns of inequity of student access and the
underrepresentation of students participating in AP from traditionally underserved
backgrounds, researchers have suggested some reforms. Solorzano and Omedas (2004)
call for a comprehensive restructuring of school culture to influence minority students to
take rigorous courses leading up to high school and culminating in AP courses. They
also suggest a reform of university admissions policies that consider AP course
enrollment alone as a criterion for admissions. Instead, the researchers call for an index
that considers the number of AP courses offered by the student's high school as well as
the number of courses taken. This would eliminate the advantage that a student has if
they attend a high school that offers significantly more AP courses than other high
schools. The Geiser and Santelices (2004) study identified disparities created by the
current college and university system of admissions, and attributed much of the blame for
low representations of minority students in AP programs to schools' tracking low-income
and underrepresented minority students into non-college preparatory courses. The
restructuring of the school culture to promote a supportive, rigorous curriculum was
supported by a Texas study that found that gifted children in urban areas, of any
ethnicity, will succeed if they have the support from their community, school
administrators, and their teachers (Kyburg, Hertberg-Davis, & Callahan, 2007).

28
Klopfenstein (2004) encourages school districts to increase the personalization of
education by creating smaller school settings that have the ability to direct the curriculum
towards the individual needs of the students, rather than focusing on a standardized
curriculum regardless of the needs of the students and school community. Additionally,
Klopfenstein (2003b) recognized that students who received individual mentoring and
had positive role models had enrolled in AP courses at higher rates and that AP incentive
programs have the potential to dramatically increase minority student participation.
Minority students had fewer resources available in terms of parental support and
institutional knowledge in navigating the educational system, and mentoring at the school
site could help students understand the importance and benefits of a rigorous high school
curriculum.
Klopfenstein and Thomas (2005) cite the importance of giving teachers the
flexibility to design AP courses that provide the greatest value for their individual
students. They argue that more resources should be allocated for ongoing professional
development to aide teachers and administrators in promoting and implementing AP
programs that give all students the tools necessary to succeed in college.
Advanced Placement Teachers
AP courses are taught at an accelerated pace and are intended to mirror a college
level introductory course. AP courses generally require more of teachers in their
knowledge base and their preparation for their classes (Oberjuerge, 1999). Historically,
successful teachers are those that can use a broad range of instructional strategies in
response to the specific needs of their students (Darling-Hammond, 2000). Because the

29
AP cuniculum covers many topics with high expectations of mastery, developing
successful strategies for all students can be a challenge for AP teachers. Research has
shown that some teachers are hesitant to teach an AP course as many AP teachers feel
scrutinized by the annual public reporting of student test scores (Bodenhausen, 1989;
Oberjuerge, 1999). A study of the characteristics of teachers revealed that AP teachers
traditionally have more experience teaching and have on average a higher graduate
school background than non-AP teachers (Milewski & Gillie, 2002). According to 2009
Farkas Duffett Research Group survey, AP teachers were generally satisfied with the
program's quality at their school site. More than three in four (770/0) rated the AP
program as "good" or "excellent." Of the over 1,000 teachers surveyed, 59% said that
the level of difficulty and complexity of the material covered in their AP courses had
stayed about the same over the last five years, 270/0 said it had gotten more difficult, and
only 13% said that the material had gotten easier. Almost two thirds (65%) believed that
many of the other teachers at their schools did not want to teach AP courses due to the
demanding work load (Duffett & Farkas, 2009).
Teaching Experience
Teacher training and expertise have been found to have a significant effect on the
quality of teachers' practices (Darling-Hammond, 2000; Ferguson & Womack, 1993).
Researchers Darling-Hammond (2001) and Murnane and Phillips (1991) found a positive
relationship between teachers' effectiveness and their years of teaching. Overall,
teachers who had taught for less than three years tended to be less effective than teachers
with more experience. Teaching experience also has an effect on the personal goals and

30
priorities of AP teachers for their class and for their students. AP teachers with an
average of four years of teaching AP reported their least important goal (on a rating scale
of one to five) was that their students earn a passing score of 3 or higher on the AP exam
(Burton, et aI., 2002). In contrast, a study of new AP teachers revealed that a passing
grade on the AP exam was the highest priority for new AP Biology and AP U.S. History
teachers (Burton, et aI., n.d.). To the more experienced teachers, the most important
goals were that the students experience college-level work, build their confidence in the
subject, and build their confidence regarding success in college (Burton, et aI., 2002).
AP Teacher Screening of Students
Research has demonstrated that students' preparation prior to taking AP courses
has been significantly related to how well students performed on AP exams (Camara,
1997; Camara and Millsap, 1998). As more schools have pushed for open access to AP
courses, teachers report concerns of struggling students and difficulties maintaining the
rigor of the program (Winebrenner, 2006). Even though most teachers report that AP
course quality and student achievement on AP exams have remained the same over the
last five years, many teachers also report that the overall ability of their students has
lowered, with many students struggling in their AP courses (Duffett & Farkas, 2009). In
a study of three California high schools, Oakes (1995) found that many educators
assumed that minority students were not prepared for Advanced Placement courses due to
a perceived poor educational and economically disadvantaged background. Minority
students were continually enrolled in classes based upon the cultural assumptions of
teachers, the structure of the school, and the ability of parents and students in

31
communicating their academic needs. Eworo-Enfumo (2004) examined the role of the
perceptions of teachers and guidance counselors and their impact on minority
underachievement in AP courses. The study reported that institutional barriers of policy
implementation were contributing to enrollment disparities in AP courses for African
American and Latino students. Many teachers and guidance counselors subjectively
decided to implement policies for parents that knew "what buttons to push". The study
noted that "white, middle class parents were successful in advocating for their students to
have high school grades changed and raised, and for their children to receive specific
teachers and gain admittance into specific courses" (p. 57).
In 2002, the College Board reported that in a study of 31 ,811 AP teachers, 49% of
AP teachers used previous course grades, 58.8% used teacher recommendations, and
53.3% used prerequisite course requirements before admitting students into their AP
course. The 2009 Farkas Duffett Research Group survey reported that 52 percent of
teachers favored screening students based upon a pre-set criterion such as grade point
average or teacher approval before allowing a student to enroll in an AP course. Only 38
percent of the teachers surveyed reported that AP courses should be open to all interested
students. Overall, 63 percent of all teachers surveyed reported that they supported some
fonn of screening to ensure that students who enroll in an AP course are prepared
appropriately (Sawchuk, 2009).
Teacher Recruitment of Students
There are many benefits to a diverse learning environment for students and
teachers. Pettigrew and Tropp (2005) conducted a meta-analysis that analyzed 515

32
studies and indicated that racial diversity in the classroom promotes higher student
achievement and that increased contact of different student groups reduces prejudice and
stereotypes. A study by Burton, Whitman, Yepes-Baraya, Cline, and Myung-in Kim
(2002) reported that only half of the school principals in the study made any effort to
recruit minority students into AP courses. Even fewer teachers reported recruiting
students into AP courses, mainly due to the belief that it was not part of their job or role.
In 2002, most schools (88(%) did not have any specific policies for increasing minority
student participation in AP. Additionally, only 8.4% of all AP teachers reported
recruiting minority students into their AP course (College Board, 2002). A Milewski and
Gillie (2002) study reported that, similar to the underrepresentation of African American
and Latino students in AP participation, there also existed an underrepresentation of
African American and Latino AP teachers as well.
Summary
Since its beginning in 1955, the Advanced Placement program has undergone
tremendous growth. Currently the College Board offers 27 AP courses and exams to
more than 17,000 schools worldwide. Multiple studies have demonstrated many positive
effects of AP participation for students, including advantages when competing for college
admissions and superior academic performance in comparison to non-AP students. Some
research has pointed to the importance of a rigorous curriculum, not AP participation in
itself, as more of factor when comparing student academic performance. Although the
growth of AP has included greater participation of students from historically underserved
populations, an equity gap continues to exist where African American and Latino

33
students represent a larger proportion of the student population than they do in AP
participation. Federal and many state polices encourage schools and districts to promote
AP participation and to remove any barriers to access for underrepresented students.
Research has revealed that some barriers to AP access exist due to high school funding
and scheduling issues as well as AP teacher policies and practices. In surveys of AP
teachers, most prefer to screen prospective AP students to ensure they are academically
prepared for a rigorous curriculum. Even though there are benefits of a diverse student
body, AP teachers have not actively promoted AP participation to historically
underrepresented students such as African American and Latino students.

Chapter 3
METHODOLOGY
Introduction
34
There have been numerous studies illustrating the positive effects of an Advanced
Placement (AP) curriculum on students' success in college admittance and completion.
According to the research, many selective colleges and universities consider grade point
averages and AP enrollment when considering applicants. Barriers to AP access
currently exist due to school demographics, funding, and the disparity of AP course
offerings. African American and Latino students particularly are underrepresented in AP
participation. This study was designed to examine the perceptions and practices of high
school AP teachers in determining student access and assignment to Advanced Placement
courses and in determining Advanced Placement course offerings in high schools. The
data collection and analysis for this study was guided by the following four research
questions:
Research Question # 1 : What are the perceptions and behaviors of
Advanced Placement teachers regarding course enrollment criteria for students?
Research Question #2: What is the role of the Advanced Placement teacher
in encouraging participation in Advanced Placement courses for underrepresented
students?
Research Question #3: What is the role of the Advanced Placement teacher
in determining Advanced Placement course offerings?

35
Research Question #4: What is the relationship between school factors and
Advanced Placement teacher factors as measured by the survey?
Research Design
This study uses a mixed methods design with both quantitative and qualitative
methods. Using both quantitative and qualitative methods has typically become the
major approach to research in the social and human sciences (Creswell, 2008). Using
mixed Inethod research highlights the strengths of both quantitative and qualitative
research methods, and helps alleviate the weakness of each (Stange, Crabtree, & Miller,
2006). The first phase of the study was a voluntary sampling of Advanced Placement
teachers through the use of an online survey. The second phase of the study used follow
up interviews to collect additional data from selected Advanced Placement teachers.
The instrument used in phase I of the study was a survey developed by the
researcher to measure the perceptions of Advanced Placement teachers about teacher
behavior and student access. The items on the survey were designed to gather data on the
four research questions. The surveys contained an introductory section to obtain
demographic information that was considered in evaluating the results of the study. This
information included the participant's age, gender, ethnicity, years of teaching, and years
of teaching AP courses. The research questions and the corresponding survey items are
listed in Appendix B. The questions on the survey were in the form of a five point Likert
Scale of: strongly agree (l), agree (2), neutral (3), disagree (4), and strongly disagree
(5).

The instrument used in phase II of the study was an interview protocol that was
developed by the researcher to collect additional data on key areas of selected AP
teachers' perceptions and behaviors. The items on the interview protocol are listed in
Appendix C.
Population
The population of the study consisted of Advanced Placement teachers within
three school districts in northern California. In each school district the criterion for
participation was that the subjects were currently teaching at least one Advanced
Placement course. Once the criteria had been selected, potential school districts in
California were identified and contacted by the researcher. Formal research requests
were submitted and approved at each school district, and the researcher contacted each
school site in each district to collect the contact information on the schools' Advanced
Placement teachers. The researcher was granted permission to contact 100 Advanced
Placement teachers within the three school districts.
Data Collection
36
The researcher obtained the approval of the Committee for the Protection of
Human Subjects of California State University, Sacramento to conduct the study. The
three school districts granted permission to contact their Advanced Placement (AP)
teachers for the survey and to interview selected AP teachers. The AP teachers were
contacted by their email addresses and were informed of the study and encouraged to
participate in the online survey. The AP teachers initially contacted were contacted again
after the first week to remind and encourage them to participate in the online survey.
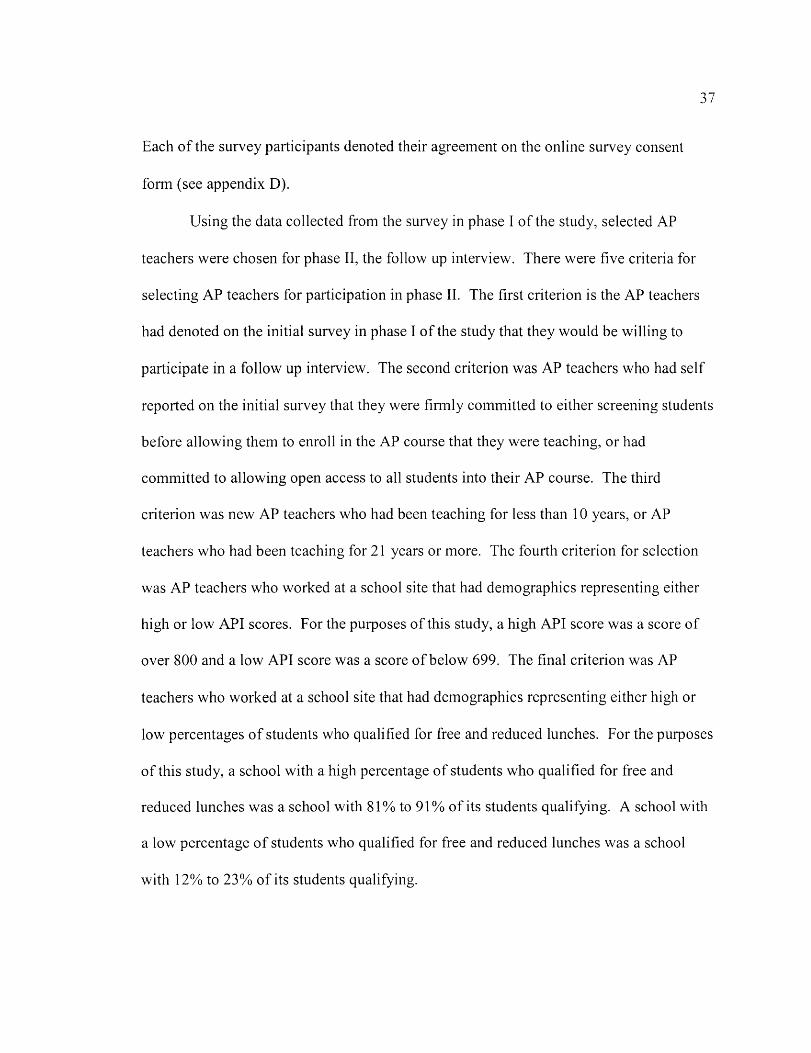
Each of the survey participants denoted their agreement on the online survey consent
form (see appendix D).
37
Using the data collected from the survey in phase I of the study, selected AP
teachers were chosen for phase II, the follow up interview. There were five criteria for
selecting AP teachers for participation in phase II. The first criterion is the AP teachers
had denoted on the initial survey in phase I of the study that they would be willing to
participate in a follow up interview. The second criterion was AP teachers who had self
reported on the initial survey that they were firmly committed to either screening students
before allowing them to enroll in the AP course that they were teaching, or had
committed to allowing open access to all students into their AP course. The third
criterion was new AP teachers who had been teaching for less than 10 years, or AP
teachers who had been teaching for 21 years or more. The fourth criterion for selection
was AP teachers who worked at a school site that had demographics representing either
high or low API scores. For the purposes of this study, a high API score was a score of
over 800 and a low API score was a score of below 699. The final criterion was AP
teachers who worked at a school site that had demographics representing either high or
low percentages of students who qualified for free and reduced lunches. For the purposes
of this study, a school with a high percentage of students who qualified for free and
reduced lunches was a school with 81 % to 91 % of its students qualifying. A school with
a low percentage of students who qualified for free and reduced lunches was a school
with 120/0 to 230/0 of its students qualifying.

38
The process of identifying AP teachers to be interviewed involved the researcher
creating a matrix of survey respondents who had responded that they would be willing to
participate in the follow-up interview. Additionally, tables were created by the researcher
to show the percentages of responses of the survey participants by years of teaching,
years of teaching AP courses, teacher age, gender, and race / ethnicity. The tables
created of responses by teacher factors are listed in Appendix E. Using the data from the
matrix and tables, the researcher determined which of the AP teachers met the various
aspects of the interview criteria. Each of the interview participants agreed to and signed
the online survey consent form (see appendix F).
Analysis of Data
The goal of the study was to determine Advanced Placement teachers'
perceptions and behaviors regarding issues of student access to their schools' AP courses.
Using the four research questions to guide the study, data was collected from AP teachers
in two phases: an online survey and a follow-up interview. The AP teachers were
currently teaching at least one AP course in a public high school.
Phase I
The questions on the survey were in the form of a five point Likert Scale of:
strongly agree (1), agree (2), neutral (3), disagree (4), and strongly disagree (5). Survey
data with the highest number indicated the highest level of disagreement, and the lowest
score represented the highest level of agreement. The data was analyzed by scoring the
returned surveys using SPSS, a statistical software program designed to tabulate data for
analysis.

39
The dependent variables for the study were AP teacher perceptions and AP
teacher practices. There are two categories of independent variables that were used to
test each of the dependent variables. The first category was AP teacher factors, including
AP teacher age, gender, race/ethnicity, years of teaching, and years of teaching AP
courses. The second category was school factors, where the AP teachers were employed,
number of students, number of AP courses offered school wide, percent of students who
qualified for free or reduced lunch, and school academic performance index (API) scores.
The Likert Scale survey questions were aimed at ascertaining both teacher
perceptions and teacher practices. The first phase of the data analysis was a two-pronged
approach. The first prong used descriptive statistics and frequency charts to descriptively
describe the quantitative findings from the survey. Second, the items targeting teacher
perceptions were summed to arrive at a teacher perception score. The same was true for
teacher practices. Separate multiple regression analyses were conducted to look at the
relationship of school and teacher factors (independent variables) with the two outcome
measures: teacher perceptions and teacher practices (dependent variables). The school
factors were grouped into three categories for analysis of high, mid, and low. A high API
score was a score over 800, a mid API score was a score between 700 and 799, and a low
API score was a score between 600 and 699. A school with a high number of students
was a school with over 2000 students, a mid number of students was a school with
between 1000 and 1999 students, and a low number of students was a school with less
than 1000 students. A school with a high number of AP courses offered was a school
with between 30 and 36 AP courses, a mid number of AP courses was a school with

40
between 13 and 17 AP courses, and a school with a low number of AP courses was a
school with less than 9 AP courses. A school with a high percent of students who
qualified for free and reduced lunch was a school with between 81 % and 91 % of the
students qualifying, a mid percent of the students qualifying was between 400/0 and 620/0,
and a low percent of students qualifying was a school with between 120/0 and 230/0.
Phase II
Each of the selected AP teachers were contacted through their work email address
and were scheduled to be interviewed. The researcher interviewed all eight AP teachers
at their work site. All of the interview subjects agreed to and signed the required
interview consent form. All of the interviews were recorded by the researcher.
The recorded interviews were transcribed verbatim by the researcher. The
responses of the subjects were analyzed by the researcher in an effort to detennine
patterns or themes in the data. In the first level of analysis of the interview responses, the
researcher looked for common themes by interview question. This was done by coding
the prinlary responses given by the interview respondent for each questions, as well as
the main sentiment or rationale given to explain their primary response. In the initial
analysis, several themes emerged related to responses to the interview questions. The
second level of analysis of the interview responses was done to look for themes or
patterns outside of the interview questions.

41
Conclusion
These procedures were designed to collect data concerning AP teachers and issues
of student access to AP courses. The analysis of those data and the results they yielded
are discussed in the following chapter.

Chapter 4
ANALYSIS OF THE DATA
Introduction
42
This study was designed to examine the perceptions and practices of high school
AP teachers in determining student access and assignment to Advanced Placement
courses and in determining Advanced Placement course offerings in high schools. This
study utilized a mixed methods research design to examine the impact of teachers'
perceptions and practices on the enrollment of students in Advanced Placement (AP)
courses. In phase one of the study, an online survey with Likert survey questions was
used to collect quantitative data. Phase two of the study used interviews to collect
qualitative data. The chapter contains an overview of the study participants and an
analysis of the data in each phase of the study.
Study Participants
The participants in this study were forty-one Advanced Placement (AP) teachers
from three school districts in northern California. Twenty-seven percent of the
respondents were from an urban school district (n=II), 630/0 were from a suburban school
district (n=26), and 10% were from a rural school district (n=4). Forty-four percent of
the participants were female (n= 18), and 560/0 were male (n=23). Thirty-nine percent of
the respondents were between the ages of 56 years and over (n=16), 240/0 were between
the ages of 46 and 55 (n=10), 170/0 were between the ages of 36 and 45 (n=7), 150/0 were
between the ages of26 and 35 (n=6), and 3% were between the ages of 18 and 25 (n=l).
Of the respondents there were no AP teachers who self identified their race or ethnicity as

43
African American, Latino - Hispanic, or Native American. Ten percent self identified
their race or ethnicity as Asian-Pacific Islander (n=4), 76% self identified as white
(n=31), 120/0 self identified as "other" (n=5), and 20/0 skipped the survey question (n= I).
Forty-six percent of the respondents had been a teacher for 21 years or more (n=19), 10%
had been teaching from 16 to 20 years (n=4), 22% had been teaching from 11 to 15 years
(n=9), 170/0 had been teaching from 6 to 10 years (n=7), and 50/0 had been teaching from
o to 5 years (n=2). In contrast, only five percent of the respondents had been teaching
Advanced Placement courses for 21 years or more (n=2), 50/0 had been teaching AP
courses for 16 to 20 years (n=2), 15% had been teaching AP courses for 11 to 15 years
(n=6), 27% had been teaching AP courses for 6 to 10 years (n=11), and 49% had been
teaching AP courses from 0 to 5 years (n=20).
Data Analysis
Phase I
The Likert scale survey questions were aimed at ascertaining both teacher
perceptions and teacher practices. Descriptive statistics and frequency charts were used
to describe the quantitative findings from the survey. Separate multiple regression
analyses were conducted to look at the relationship of school and teacher factors
(independent variables) with the two outcome measures: teacher perceptions and teacher
practices (dependent variables). The data from the survey was analyzed by scoring the
returned surveys using SPSS, a statistical software program designed to tabulate data for
analysis.

44
Research Question One - What are the perceptions and behaviors of Advanced
Placement teachers regarding course enrollment criteria for students?
The survey items for research question one (l a-I g) were analyzed using
descriptive statistics. Survey item 1 a (All students should be allowed to take an AP
course), survey item 1 b (Prospective AP students should be pre-screened to determine if
they are prepared to take an AP course), and survey item 1 c (I currently use some sort of
pre-set criteria for students to enroll in my AP course) were designed to collect data on
the perceptions and current behaviors of AP teachers regarding student enrollment in the
AP course that they teach.
Table 2
Survey items 1 a-I c: Screening prospective AP students
la Ib lc
Strongly Agree
32% 15% 15%
Agree
44% 56% 44%
Neutral
12% 5% 12%
Disagree
10% 17% 15%
Strongly Disagree
2% 5% 15%
Even though 76% of the respondents reported that they strongly agreed or agreed
that all students should be allowed to take an AP course, 61 % of these respondents also
reported that they also strongly agreed or agreed that prospective students should be pre-
screened to determine if they are prepared to take an AP course. Additionally, 61 % also
strongly agreed or agreed that they currently use some sort of pre-set criteria for students
to enroll in their AP course. The responses indicate that even though many teachers
believe that all students should be allowed to take an AP course, the same teachers also

45
believe that students need to be screened to determine if they are prepared, and are
actively screening students with some sort of pre-set criteria.
Survey item 1d (I currently use students' grade point average (GPA) as a
screening criterion for AP course enrollment), survey item 1 e (I currently use teacher
recomlllendation as a screening criterion for AP course enrollment), and survey item 1 f (I
currently use grades earned in previous courses as a screening criterion for AP course
enrollment) were designed to collect data on the method of screening that AP teachers
use before allowing students to take the AP course that they teach.
Table 3
Survey items 1 d-l f: Method of screening prospective AP students
Id Ie If
Strongly Agree
2% 15% 22%
Agree
15% 29% 39%
Neutral
22% 15% 20%
Disagree
34% 22% 7%
Strongly Disagree
27% 20% 12%
Of the survey respondents who reported that they "strongly agree" or "agree" with
survey items 1 d, 1 e, and 1 f, 61 % reported using grades earned in previous courses as a
screening tool, 44%) reported using teacher recommendation to screen students, and only
170/0 reported using overall GPA as a screening tool to determine student enrollment
eligibility. The greater use of grades earned in previous courses may reflect AP teachers
preferring grades earned in similar, lower level courses. AP calculus teachers may find
grades earned in previbus math courses a better indicator of preparedness than the
students overall grade point average.

46
Survey Item 1 g (The student scores on the AP exam influence how my teaching is
perceived at my school) was designed to determine if there was a relationship between
teachers screening prospective students and how the AP exam scores were perceived at
the school site.
Table 4
Survey item 1 g: Influence of AP exams scores on perception of teaching
S trongl y Agree Agree Neutral Disagree Strongly Disagree
Ig 41% 240/0
Of the survey respondents who reported that they "strongly agree" or "agree" with
survey item 1 g, 72% also reported using some sort of pre-set criteria for students to enroll
in their AP course (n=18). Similarly, of the survey respondents who reported that they
"disagree" or "strongly disagree" with survey item 19, 63% reported not using any pre
set criteria for students to enroll in their AP course (n=5). The higher rate of the use of a
pre-set screening criteria for enrollment by AP teachers who perceive that the student
scores reflect directly on how their instruction is perceived may be due to AP teachers
limiting access to certain students for fear that they will not perform well on the AP exam
and in return lower the perception of the quality of instruction.
Research Question Two - What is the role of the Advanced Placement teacher in
encouraging participation in Advanced Placement courses for underrepresented
students?

47
The survey items for research question two (2a-2c) were analyzed using
descriptive statistics. Survey item 2a (It is part of my role as an AP teacher to promote
my AP course to students), survey item 2b (It is part of my role as an AP teacher to
promote AP course taking to traditionally underserved students such as African American
and Latino students), and survey item 2c (I actively promote AP courses to traditionally
underrepresented students such as African American and Latino students) were designed
to collect data on the perceptions and current behaviors of AP teachers regarding
promoting their AP course to all students and to historically underrepresented students in
AP participation such as African American and Latino students.
Table 5
Survey items 2a-2c: Promoting AP courses to students
2a 2b 2c
Strongly Agree
590/0 44% 27%
Agree
320/0 29% 290/0
Neutral
7% 190/0 34%
Disagree
2%
5% 5%
Strongly Disagree
0% 2%
50/0
While 90.20/0 of the survey respondents strongly agreed or agreed that it is part of
their role as an AP teacher to promote their AP course to students, 73% reported that it
was part of their role to promote their AP course to historically underrepresented students
such as African American and Latino students, and only 560/0 reported that they actively
are promoting their AP course to traditionally underrepresented students. While most AP
teachers feel it is part of their job to promote their course to students, a significant

48
number of AP teachers are not promoting their course to African American and Latino
students.
Research Question Three - What is the role of the Advanced Placement teacher in
determining Advanced Placement course offerings?
The survey items for research question three (3a & 3b) were analyzed using
descriptive statistics. Survey item 3a (I have a significant role in determining whether
my school offers the AP course that 1 currently teach), and survey item 3b (Teacher
interest is the primary factor in determining whether my school offers an AP course) were
designed to collect data on the perception of AP teachers on the role that the teacher plays
when schools decide whether to offer an AP course.
Table 6
Survey items 3a and 3b: The role of the AP teacher in determining course offerings
3a 3b
Strongly Agree
370/0 22%
Agree
370/0 190/0
Neutral Disagree
50/0 320/0
Strongly Disagree
7% 50/0
While 73%) of the survey respondents strongly agreed or agree with survey item
3a, 41 % reported that that teacher interest was the primary factor in determining whether
to offer an AP course and 37% disagreed or strongly disagreed. While teachers play an
important part in determining whether to offer an AP course, teachers are not
overwhelmingly the primary factor. Other factors may include the role of the school's
administration, counselors, or student population.

49
Research Question Four - What is the relationship between school factors and Advanced
Placement teacher factors as measured by the survey?
The AP teachers' survey responses were analyzed by both school factors and
teacher factors. The school factors were the number of students enrolled, API score, and
percent of students qualifying for free and reduced lunch. The teacher factors were
teacher ethnicity, gender, the number of years of teaching and the number of years
teaching AP courses. The school factors and teacher factors were analyzed using
multiple regression analysis.
The results of the data analysis for survey items 1 a (all students should be allowed
to take an AP course), Id (I currently use student's grade point average (GPA) as a
screening criterion for AP course enrollment), 1 f (I currently use grades earned in
previous courses as a screening criterion for AP course enrollment), 2b (It is part of my
role as an AP teacher to promote AP course taking to traditionally underserved students
such as African American and Latino students), and 3b (Teacher interest is the primary
factor in determining whether my school offers an AP course) showed no statistically
significant difference by number of students, API score, percent of students qualifying for
free and reduced lunches, teacher ethnicity, teacher gender, years of teaching, or by years
of teaching an AP course.
Survey item 1 b (prospective AP students should be pre-screened to determine if
they are prepared to take an AP course) showed a statistically significant difference by
number of students and by the school's API score. The number of students (F=3.749,
p=.033) with the post hoc test (Tukey's Honestly Significant Difference) showed the

50
difference was between <1000 and 1000-1999. The school's API score (F=4.47S,
p=.OlS) with the post hoc test (Tukey's HSD) showed the difference was between 600-
699 and over SOO. There was no statistically significant difference by percent of students
qualifying for free and reduced lunches, teacher ethnicity, teacher gender, years of
teaching, or by years of teaching AP courses.
Table 7
ANOYA Results: Comparisons with number of students
Sum of Squares df Mean Square F Sig.
Between Groups 8.021 2 4.011 3.749 .033
Within Groups 39.579 37 1.070
Total 47.600 39
Table 8
ANOYA Results: Comparisons with API score
Sum of Squares df Mean Square F Sig.
Between Groups 9.276 2 4.638 4.478 .018
Within Groups 38.324 37 1.036
Total 47.600 39

51
AP teachers who worked in schools where the number of students was between
1000 and 1999 reported that students should be pre-screened at a higher rate (760/0) than
AP teachers who worked at a schools where there were less than 1000 students enrolled
(400/0). The higher rate of screening in larger schools may be due to fact that schools
with more students enrolled have more students who are interested in taking an AP
course.
AP teachers who worked in schools where the API scores were over 800 reported
that students should be pre-screened at a higher rate (760/0) than AP teachers who worked
in schools with API scores between 600 and 699 (33%). Schools with higher API scores
may also have a greater student demand for AP courses, requiring teachers to limit
enrollment.
Survey item 1 c (I currently use some sort of pre-set criteria for students to enroll
in my AP course) showed a statistically significant difference by API score. The API
score (F=5.424, p=.008) with the post hoc test (Tukey's HSD) showed the difference was
between over 800 and both other groups of 600-699 and 700-799. There was no
statistically significant difference by number of students, percent of students qualifying
for free and reduced lunch, teacher ethnicity, teacher gender, years of teaching, or years
of teaching AP courses.

52
Table 9
ANOYA Results: Comparisons with API score
Sum of Squares df Mean Square F Sig.
Between Groups 15.210 2 7.605 5.424 .008
Within 1.402 Groups 53.278 38
Total 68.488 40
Seventy-six percent of the survey respondents who worked in schools with an API
score of 800 or higher reported that they currently used some sort of pre-set enrollment
criteria for students to enroll in their AP course. In contrast, 55% of the survey
respondents who worked in schools with API scores between 700 and 799 reported using
a pre-set enrollment criteria for enrollment in their AP course, and only 33% of the
survey respondents from schools with an API score from 600 to 699 reported using a pre-
set enrollment criteria. The higher rate of the use of enrollment criteria in schools with
higher API scores may be due to a greater student demand for AP course enrollment in
schools with higher API scores. Schools with lower API scores may have fewer students
vying for AP courses and thus may not feel the necessity to screen out interested students,
regardless of their previous academic history.
Survey item 1 e (I currently use teacher recommendation as a screening criterion
for AP course enrollment) showed a statistically significant difference by percent of
students who qualify for free and reduced lunches. The percent of students qualifying for

53
free and reduced lunch (F=5.098, p=.Oll) with the post hoc test (Tukey's HSD) showed
the difference was between 40%-620/0 and 120/0-230/0. There was no statistically
significant difference by number of students, API score, teacher ethnicity, teacher gender,
years of teaching, or years of teaching AP courses.
In schools with a low percent of students who qualify for free and reduced lunch
(12-23%), only 260/0 of the AP teachers reported that they currently use teacher
recommendation as a screening criterion for students, while 660/0 of AP teachers in
schools with a moderate percent of students who qualify for free and reduced lunch (40-
62%) reported currently using teacher recommendation as a screening criterion. AP
teachers in schools with a higher percentage of students qualifying for free and reduced
lunch may use previous teachers' recommendations at a higher rate due to a more
socioeconomically diverse student body with more diverse levels of academic
achievement.
Survey item 2a (It is part of my role as an AP teacher to promote my AP course to
students) showed a statistically significant difference by teacher ethnicity. Teacher
ethnicity (4.658, p=.016) with the post hoc test (Tukey's HSD) showed the difference
was between "white" and "other." There was no statistically significant difference by
API score, number of students, percent of students qualifying for free and reduced lunch,
teacher gender, years of teaching, or years of teaching AP courses.
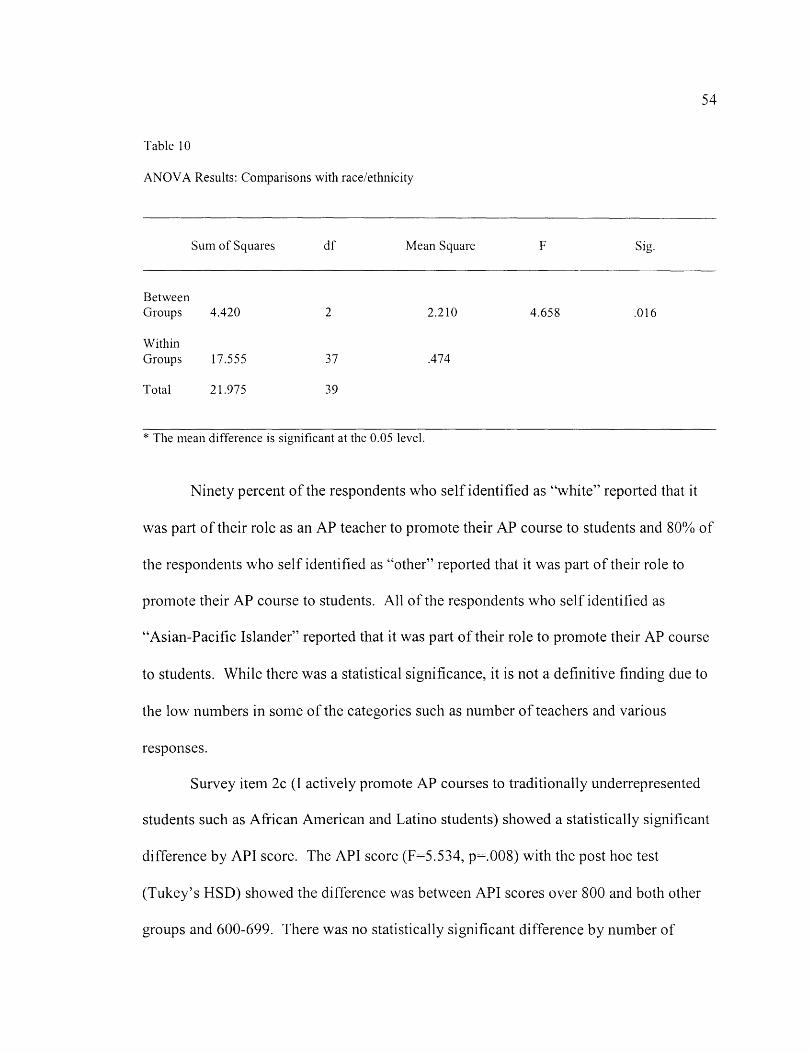
Table 10
ANOV A Results: Comparisons with race/ethnicity
Sum of Squares df Mean Square
Between Groups 4.420
Within Groups
Total
17.555
21.975
2
37
39
* The mean difference is significant at the 0.05 level.
2.210
.474
F Sig.
4.658 .016
Ninety percent of the respondents who self identified as "white" reported that it
54
was part of their role as an AP teacher to promote their AP course to students and 80% of
the respondents who self identified as "other" reported that it was part of their role to
promote their AP course to students. All of the respondents who self identified as
"Asian-Pacific Islander" reported that it was part of their role to promote their AP course
to students. While there was a statistical significance, it is not a definitive finding due to
the low numbers in some of the categories such as number of teachers and various
responses.
Survey item 2c (I actively promote AP courses to traditionally underrepresented
students such as African American and Latino students) showed a statistically significant
difference by API score. The API score (F=5.534, p=.008) with the post hoc test
(Tukey's HSD) showed the difference was between API scores over 800 and both other
groups and 600-699. There was no statistically significant difference by number of

55
students, percent of students qualifying for free and reduced lunch, teacher ethnicity,
teacher gender, years of teaching, or years of teaching AP courses.
Table 11
ANOV A Results: Comparisons with API score
Sum of Squares df Mean Square F Sig.
Between Groups 10.574 2 5.287 5.534 .006
Within 38 Groups 36.304 .955
40 Total 46.878
Of the respondents from schools with low API scores (600-699),100% reported
that they promote their AP course to traditionally underrepresented students. Of the
respondents from schools with moderate API scores (700-799), 780/0 reported promoting
their AP course to underrepresented students, and in schools with high API scores (over
800), only 29% reported that they promote their AP course to traditionally
underrepresented students. AP teachers at schools with lower and moderate API scores
promote their AP courses to underrepresented students at significantly higher rates than
AP teachers at schools with high API scores.
Survey item 3a (I have a significant role in determining whether my school offers
the AP course that I currently teach) showed a statistically significant difference by
percent of students who qualify free and reduced lunch. The percent of students who
qualify for free and reduced lunch (F=4.027, p=.026) with the post hoc test (Tukey's

56
HSD) showed the difference was between 40%-62% and 12% -23%. There was no
statistically significant difference by number of students, API score, teacher ethnicity,
teacher gender, years of teaching, or years of teaching AP courses.
Table 12
ANOV A Results: Comparisons with percent of students qualifying for free and reduced lunch
Sum of Squares df Mean Square F Sig.
I have a Between significant Groups 9.725 2 4.863 4.027 .026 role in determining Within whether my Groups 45.885 38 1.207 school offers the Total 55.610 40 AP course that I teach.
* The mean difference is significant at the 0.05 level.
In schools where the percent of students who qualify for free and reduced lunch is
low (12-23%),87% of AP teachers reported that they have a significant role in
detennining whether their school offers the AP course they teach. In schools with a
moderate percentage of students who qualify for free and reduced lunch, 53% of AP
teachers reported that they have a significant role in detennining whether their school
offers the AP course they teach. The higher rate of teachers reporting that they playa
significant role in the detennination of course offerings at schools with a low percent of
students who qualify for free and reduced lunch may indicate a larger administrative or
counselor role in detennining course offerings at schools with a lower percentage of
students qualifying.

57
Phase II
Participants for the follow-up interview were selected using five criteria. The first
was the AP teacher had denoted on the initial survey in phase I of the study that they
would be willing to participate in a follow up interview. The second criterion was the AP
teacher had self reported on the initial survey that they were finnly committed to either
screening students before allowing them to enroll in the AP course that they were
teaching or they had committed to allowing open access to all students into their AP
course. The third criterion was teachers who were either new AP teachers who had been
teaching for less than 10 years or more veteran AP teachers who had been teaching for 21
years or more. The fourth criterion for selection was AP teachers who worked at a school
site that had demographics representing either high or low API scores. For the purposes
of this study, a high API score was a score of over 800 and a low API score was a score
of below 699. The final criterion was AP teachers who worked at a school site that had
demographics representing either high or low percentages of students who qualified for
free and reduced lunches. For the purposes of this study, a school with a high percentage
of students who qualified for free and reduced lunches was a school with 81 % or more of
its students qualifying. A school with a low percentage of students who qualified for free
and reduced lunches was a school with 230/0 or fewer of its students qualifying. Based
upon the criteria, eight AP teachers from within three school districts were chosen.
Of the teachers selected for the follow-up interview, 50%) were female (n=4) and
50% were male (n=4). Fifty percent of the teachers interviewed reported on the online
survey that they currently use some sort of pre-set criteria to detennine if students could

58
enroll in their AP course (n=4), and 50% of the teachers interviewed reported that they
did not use any pre-set criteria to determine student enrollment into their AP course
(n=4). Sixty-three percent of the teachers interviewed had reported on the survey that
they had been teaching for over 21 years (n=5), 130/0 reported having been teaching from
11 to 15 years (n= 1), 13 % reported having been teaching from 6 to 10 years (n= 1), and
13% reported having been teaching for 0 to 5 years (n=1). Fifty percent of the teachers
interviewed were employed in high schools with low API scores (n=4), 380/0 of the
teachers were employed in high schools with high API scores (n=3), and 13% of the
teachers were employed in a high school with a medium API score (n=l). For the
purposes of the study, a low API score was a score from 600 to 699, a medium API score
was a score from 700 to 799, and a high API score was a score over 800. Thirty-eight
percent of the teachers interviewed work in a high school with a high percentage of
students who qualified for free and reduced lunches (n=3), 250/0 of the teachers worked in
a high school with a medium percentage of students who qualified for free and reduced
lunches (n=2), and 38% of the teachers worked in a high school with a low percentage of
students qualifying for free and reduced lunches (n=3). For the purposes of the study, a
high school with a high percentage of students qualifying for free and reduced lunches
was a school with 81 % to 91 % of the student body qualifying. A high school with a
medium percentage of students qualifying for free and reduced lunches was a school with
40% to 620/0 of the student body qualifying. A high school with a low percentage of
students qualifying for free and reduced lunches was a school with 120/0 to 23% of the
student body qualifying.

59
The responses of the AP teachers interviewed were analyzed by the researcher to
detennine patterns or themes in the data. The first level of analysis was to look for
common themes or categories by interview question. This was done by listing the
primary response given by the interview respondent for each question, as well as the
main sentiment or rationale given to explain their primary response. In the initial
analysis, several themes emerged related to responses to the interview questions. The
second level of analysis of the interview responses was done to look for themes or
patterns outside of the interview questions. Several themes from the second level of
analysis were also revealed in the data.
Research Question One - What are the perceptions and behaviors of Advanced
Placement teachers regarding course enrollment criteria for students?
Theme One - No existing state, district, or school policies regarding student
enrollment in AP courses.
Interview item 7 asked AP teachers if their department, school, or district had any
policies regarding student enrollment in AP courses. Of the interview respondents, 62.5
percent responded that there were no policies (n=5), 25% responded that there were
existing policies but that they did not know what the policies were (n=2), and 12.50/0
responded that they did not know (n=l). Most of the AP teachers responded that there
were no policies or guidelines regarding student enrollment into AP courses and each
individual teacher established their own screening policy.
"There are no policies. Different teachers have different philosophies on that. I
know some teachers who think it should only be the A and B kids."

60
"I'm really allowed to set it up myself. I have complete autonomy."
"Official policies? No, not really. Different teachers traditionally have their own
ways, not a uniform practice."
"I don't know. There could be something in the books ... our enrollment is so low
that I will literally take any kid that wants to try."
Research Question Two - What is the role of the Advanced Placement teacher in
encouraging participation in Advanced Placement courses for underrepresented
students?
Theme One - Teachers promote AP courses primarily to existing honors and AP
students.
Interview item 10 asked AP teachers if they promoted AP participation to
students. Of the interview respondents, 75 percent responded that their methods of
promoting AP participation was directed primarily to students in lower level AP or
honors courses to take their AP course (n=6), 250/0 responded that they did promote AP
participation to students but did not give any example of how they promoted their AP
course (n=2).
"Now we do have an AP world history, so that kind of feeds my program. I
always go down and talk to them. So I would say that usually, probably 700/0 of my class
comes out of that. The other 300/0 are kids that teachers recommend or they hear it's a
good class, and they show up."
Theme Two- Teachers do not actively promote AP courses to historically
underrepresented students.
61
Interview item lOa asked AP teachers if they promoted AP participation to
historically underrepresented students such as African American or Latino students. Of
the interview respondents, 50 percent responded that they did not promote their AP
course to historically underrepresented students (n=4), 25% responded that they did
promote their AP course to historically underrepresented students (n=2), 12.5%)
responded that they promoted their course to Latino students only (n=l), and 12.5%
responded that their school did not have a significant population of African American or
Latino students (n= 1).
"I don't go out of my way. I really try to be color blind and live that way. So I
promote it to everybody. Now with that said, my class is underrepresented in African
Americans. Typically has been. It's been a struggle to get African Americans to step up
and take the challenge. Maybe that's something 1 need to work a little harder on ... it's
tough because it's true in my feeder program too."
"I do not specifically. But everybody in general. 1 don't know how to target
them, if 1 could, 1 would consider it."
Research Question Three - What is the role of the Advanced Placement teacher in
determining Advanced Placement course offerings?
Theme One - AP teachers course offerings are primarily driven by teacher
interest.
Interview item 3 asked AP teachers how they had begun teaching an AP course.
Of the interview respondents, 37.5 percent responded that they had taken over the AP
course from another teacher at the bequest of the teacher or department (n=3), 250/0

responded that they had begun the course themselves (n=2), and 37.50/0 responded that
they were asked to by a school administrator (n=3).
62
Interview item 6 asked AP teachers how their school or department decided to
offer an AP course. Of the interview respondents, 62.50/0 responded that the decision was
teacher driven at their school site (n=5), 12.5% responded that the school administration
wanted to offer certain AP courses and solicited participation from existing teachers at
the school site (n= 1), and 250/0 responded that they did not know how the decision was
made at their school site (n=2).
"Up to this point, it really has been more teacher driven, it's been teachers who
are interested in doing it, go get trained and then we offer it and the numbers are there."
"It usually comes from the teachers, that if we have enough kids to justify
enrollment in it, our administration will usually find a way to make it happen."
"This one was the principal's thing; he really wanted an AP course. Usually it is
the department, they decide they want one and then they will ask the administration."
Other Themes
Theme One- No single school factor or teacher factor was responsible for the
decision to screen or not screen students.
The interview participants equally represented both decisions to either screen or
not screen students, as well as a diversity of both school factors (API scores, number of
students, number of courses, percent of students qualifying for free and reduced lunch)
and teacher factors (gender, age, years of teaching, years of teaching AP courses,
ethnicity). Teachers in schools with similar factors as well as teachers at the same school

63
reported unique and differing policies regarding whether to screen or not screen students.
Teachers from schools with low API scores and a high percentage of students qualifying
for free and reduced lunch reported both screening students before enrollment and having
a policy of open access.
"I'm sure all teachers are very different, but if a kid wants to take the class, then
I'n1 all for it because you just never know. You really don't. Usually, to be honest, most
of the kids that do well are the kids that aren't like the regular honors kids, who aren't on
this track and they just try it, and they end up loving it and are totally engaged."
"We have some sort of a screening process for honors and AP. We don't want to
deny kids an opportunity, but you also don't want to get slackers, put people in over their
head ... seems to me some kids don't have the work habits; really, really don't have the
smarts, 70 to 750/0 of the kids minimum can't do it."
Additionally, teachers from schools with high API scores and a low percentage of
students qualifying for free and reduced lunch also reported both screening and open
access.
"If you're willing to try, then we're willing to work with you and see if you can
get there. And I like that. I can't image saying to a kid, oh you're not capable of this,
don't even try it."
"Some AP courses you have to have an A or B in a previous course ... calculus, as
long as they got a C or above in pre-calculus I'll take them."
Theme Two- Teachers primarily enjoy teaching AP courses due to the nature of
the students.

64
Interview item 4 asked AP teachers what they liked about teaching an AP course.
Of the interview respondents, 62.5 percent responded that they liked teaching the type of
students who took their AP course (n=5), 250/0 responded that they liked being stimulated
by the material and the students (n=2), and 12.50/0 responded that they like the challenge
of teaching an AP course (n=I).
"Number one, the caliber student of the course is one that would expect to be
challenged, and they're pushing me to know my stuff and pushing and generating the
energy in class instead of me generating it for a change."
"I like that the kids are willing to challenge themselves ... they come in ready and
willing, and they are the scholars of the bunch. They are willing to work. They're fun to
work with."
"I love being mentally stimulated and the kids are wonderful, I absolutely love the
kids."
Theme Three - AP Teachers dislike the additional teacher workload of an AP
course, and some dislike the AP test design.
Interview item 5 asked AP teachers what they disliked about teaching an AP
course. Of the interview respondents, 37.5 percent responded that they disliked the
additional teacher work load required to teach an AP course (n=3), 250/0 responded that
they disliked the AP test design of how and what questions were asked (n=2), 12.5%
responded that they disliked the fast pace required to cover all of the material (n= I),
12.50/0 responded that they disliked the lack of ongoing teacher training provided (n= 1),

65
and 12.50/0 responded that there was nothing that they disliked about teaching an AP
course (n=l).
"It's a lot of work. Maybe I don't like spending five hours on Sunday grading
papers, which usually, to go through a stack, takes that long."
"It takes hours to grade the tests because I look at every single step, I don't just
look at the answers. So, my worst was 5 am, I was up until 5 am because I want to grade
it right away. And I do tutoring because the kids are really dedicated and they will come
. " In.
"After the test happens each year, I always get a chance to get an idea of what's
on the test when they get sent back. And sometimes it's very frustrating because it's like,
'Did you really need to ask that?' Really, there are some that I don't think are fair. .. you
could have asked that in a different way or you didn't have to be so miniscule on a
particular act."
Summary
In summary, this chapter presented the data analysis and findings from multiple
data collection methods to address the research questions. Data analyses from the online
survey were detailed in descriptive statistics. Analyses and results from the follow up
interview were also presented. The results served to provide insight into the perceptions
and practices of Advanced Placement teachers regarding student enrollment and access to
AP courses.
Chapter V summarizes the study and provides conclusions drawn from the
findings. The discussion of the findings includes screening prospective AP students, AP

enrollment policies, promoting AP courses to students, and AP course offerings. The
chapter concludes with implications for stakeholders and recommendations for further
study.
66

67
Chapter 5
SUMMARY AND CONCLUSIONS
Introduction
Numerous studies have illustrated the positive effects of an Advanced Placement
(AP) curriculum on students' success in college admittance and completion. Many
selective colleges and universities consider grade point averages and AP enrollment when
considering applicants. Barriers to AP access currently exist due to school demographics,
funding, and university admission policies. African American and Latino students
particularly are underrepresented in AP participation. In 2009 African American students
made up 14.50/0 of the graduating students nationwide and only 3.7% of the nationwide
successful AP exam population (College Board, 2010).
The purpose of the study was to fill a gap in the existing educational literature on
the role of the AP teacher in AP course access for students. This study was designed to
examine the perceptions and practices of high school AP teachers in determining student
access and assignment to Advanced Placement courses and in determining Advanced
Placement course offerings in high schools. The data collection and analysis for this
study was guided by the following four research questions:
Research Question #1: What are the perceptions and behaviors of
Advanced Placement teachers regarding course enrollment criteria for students?
Research Question #2: What is the role of the Advanced Placement teacher
in encouraging participation in Advanced Placement courses for underrepresented
students?

68
Research Question #3: What is the role of the Advanced Placement teacher
in determining Advanced Placement course offerings?
Research Question #4: What is the relationship between school factors and
Advanced Placement teacher factors as measured by the survey?
This chapter presents a discussion of the findings of the study, the implications of
the findings, and recommendations for further research.
Overview of the Study
This study examined the decision making process of high school AP teachers in
determining student access and assignment to AP courses and in determining AP course
offerings in high schools. This mixed methods research study was conducted during the
200912010 school year. The first phase of the study was an online survey used to collect
qualitative data on AP teachers' perceptions and practices. The second phase of the study
followed up the online survey with interviews of selected AP teachers to collect
qualitative data. One hundred AP teachers in three school districts in Northern California
were contacted through their work email addresses that were provided by their school
districts. Forty-one AP teachers from the three school districts participated in the study.
The 17 items on the online survey were in the form of a five point Likert Scale of:
strongly agree (1), agree (2), neutral (3), disagree (4), and strongly disagree (5).
From the forty-one survey participants, eight Advanced Placement teachers
representing the three school districts were selected for a follow-up interview. The
selection was based upon five criteria, established primarily to select AP teachers

representing the school and teacher factors that were reported statistically significant in
phase I of the study. The criterion for selection is discussed in chapter four.
69
The data from phases I and II of the study provided findings regarding the four
research questions. Quantitative analyses of responses from the online survey were
conducted using an ANOV A and descriptive statistics to analyze each factor for
significance. The school factors examined in the study were schools' Acadelnic
Performance Index (API) scores, the number of students enrolled, the number of AP
courses offered, and the percentage of students who qualify for free and reduced lunches.
The teacher factors examined in the study were a teacher's age, gender, race or ethnicity,
years of teaching and years of teaching AP courses. The data collected in the follow-up
interviews of phase II was used to collect qualitative data in response to the first three
research questions. The responses from the AP teachers interviewed were analyzed
within interview questions as well as across interview questions to look for themes or
patterns.
Discussion of Findings
From the analysis of the data from phase one and two of the study, four primary
themes emerged relating to the perceptions and practices of AP teachers. The primary
themes involved the role of the AP teacher in screening students, current enrollment
policies, the promoting of AP courses to students, and the role of the teacher in AP course
offerings. Additional findings unrelated to the research questions also emerged from the
data. These themes emerged from either phase I or phase II of the study and in many
cases from both the quantitative and qualitative data.

70
Screening Students
The responses from the online survey indicate that even though many teachers
reported that all students should be allowed to take an AP course (76%), they also believe
that students should be pre-screened to determine if they are prepared for the accelerated
curriculum (61 %). Sixty-one percent of the teachers surveyed also reported that they are
currently using some sort of pre-set criteria for students to enroll in their AP course. The
findings were similar to a Farkas Duffett Research Group survey (2009), where 63% of
AP teachers reported that they supported some form of screening to ensure that students
who enroll in AP courses were prepared appropriately. While this study did not directly
address the issue of why teachers made the decision to use some sort of pre-set screening
criteria before allowing students to enroll, the AP teachers interviewed who offered a
reason for screening reported that their main intent was to determine if the student had
the ability to handle the rigor and the faster pace of an AP course.
The analysis of the survey responses showed a significant difference in whether
AP teachers believed that AP students should be pre-screened to determine if they are
prepared to take an AP course by the number of students enrolled in a high school
(F=3.749, p=.033), and by the API score of the school (F=4.47S, p=.OlS). In schools
with a smaller student population (below 1000), AP teachers reported that students
should be screened at a lower rate than AP teachers reported in schools with larger
student populations. The higher rate of AP teachers reporting that students should be pre
screened in schools with a larger number of students may be due to larger schools having
more students interested in AP courses as well as the larger schools having a more
71
established AP program and schedule of courses. Klopfenstein (2004) suggested that the
availability of AP courses depended upon three main factors: college expectations, school
size, and school resources. Large schools tended to provide more AP courses since the
scheduling and cost of AP programs were easier to accommodate in larger schools than in
smaller schools. Additionally, schools with limited resources found it difficult to fund a
comprehensive AP program that was only being utilized by a limited portion of the
student population. The decreased rate of screening in smaller schools may reflect the
attempt to enroll more students into the school's AP program, regardless of their
academic background, where larger schools may have the luxury of a larger pool of
students interested in taking AP courses.
In schools with higher API scores (over 800), AP teachers reported that students
should be pre-screened at higher rates than in schools with lower API scores (600 - 799).
Additionally, AP teachers reported currently using some sort of pre-set screening criteria
for student enrollment at higher rates in schools with higher API scores over 800
(F=5.424, p=.008). The higher rates of AP teachers reporting that students should be
screened and that they are currently screening indicates that students may encounter more
established AP course entry prerequisites in the academically higher performing schools.
Schools with lower API scores may have fewer students vying for AP courses and thus
may not feel the necessity to screen out interested students, regardless of their previous
academic history. In the study, AP teachers who worked in schools where the API scores
were over 800 reported that students should be pre-screened at a higher rate (760/0) than
AP teachers who worked in schools with API scores between 600 and 699 (330/0).

72
Methods of Screening
Of the survey respondents who reported that they pre-screened students, 61 0/0
reported using grades earned in previous courses, 44% reported using "teacher
recommendation," and 17 % reported using overall grade point average (GPA) as a
screening tool. The greater use of grades earned in previous courses may reflect AP
teachers preferring grades earned in similar, lower level courses, due to the similar
academic content. In the follow-up interviews, two AP teachers (an AP physics teacher
and an AP calculus teacher) reported that in their perception, grades earned in previous
math courses were a better indicator of preparedness than the students' overall grade
point average.
AP teachers at schools with a moderate percent of students who qualify for free and
reduced lunch reported using "teacher recommendation" to pre screen students at a higher
rate (66%) than AP teachers at schools with a lower percentage of students who qualify
for free and reduced lunches (260/0). The free and reduced lunch percentage has been the
best indicator of the socio-economic background of a school's student population. The
increased rate of the use of "teacher recommendation" to screen AP students in schools
with a higher percentage of students from lower socio-economic backgrounds may be due
to working with a more diverse student body with diverse levels of academic
achievement. Garnering other teachers' input on a student's strengths and weaknesses
may be a better indicator of a student's academic ability than relying on overall GPA and
grades in previous courses.

73
While 440/0 of the teachers who pre-screen students reported using "teacher
recommendation," this method of screening has been criticized in the past due to the
subjective nature of teachers from previous courses in previous school years making a
decision on whether a student would be successful in an AP course. According to
Escalante (1990), teacher recommendation or permission to enroll in an AP course has
had a significantly large impact on minority students' AP participation. In 1995, Oakes
found a racial bias in the teachers in her study who were more likely to recommend and
place white and Asian students in college preparatory courses, even when minority
students had similar test scores. Her study indicated that many educators assumed that
minority students were not prepared for AP courses due to a perceived poor educational
and economically disadvantaged background. The use of "teacher recommendation" as a
screening method may inadvertently eliminate students who had not been successful in
previous courses, or who had a personal conflict with a previous teacher, from being able
to enroll in an AP course later in their high school career.
Advance Placement (AP) Enrollment Policies
Of the AP teachers participating in the follow-up interview, 50% reported that
they were currently using some sort of pre-set enrollment criteria as a screening tool, and
500/0 reported that they offered open access to all students. One of the themes that
emerged from the AP teacher interviews was that regardless of the teacher's policy
towards AP access, none of the teachers were following any school, district, or state
policy. Sixty-two percent of the AP teachers interviewed reported that there were no
existing AP enrollment polices, 250/0 reported that there were existing policies but that

74
they did not know what those policies were, and 12% reported that they did not know if
there were any AP enrollment policies.
The decision to screen or to not screen students was clearly not based upon any
existing policy, but was implemented by individual teachers at their own discretion.
"There are no policies. Different teachers have different philosophies on that. I
know some teachers who think it should only be the A and B kids." (AP teacher)
While some states have implemented policies on how many AP courses a
comprehensive high school must offer, there do not appear to be any policies regarding
pre-screening methods before enrolling students into AP courses. The California
education code (section 66204 a) requires the State Superintendent of Public Instruction
to assist all school districts in ensuring that all public high school students have access to
a curriculum that meets the admission requirements of the University of California and
the California State University. However, this section of the California education code
has not been used to require that all students have equal access to AP courses.
According to the AP teachers interviewed, teachers are implementing student
enrollment policies with little or no uniformity or guidance, even within the same subject
areas. One AP teacher may allow open access to all interested students in taking AP U.S.
History, and another teacher in the same district may require all students to have a 3.5
overall GP A, an "A" in world history, and a teacher recommendation before being
allowed to take the course. While there may be legitimate reasons to pre-screen students
to ensure that they are prepared for an accelerated course, without the assistance of

guidelines or polices, teachers may inadvertently or purposely end up creating
disproportionate levels of access to certain students.
Promoting AP Courses to Students
75
An overwhelming majority (90%) of the AP teachers responding to the online
survey reported that it was part of their role as an AP teacher to promote their course to
students. The AP teachers felt that it was part of their role and were actively promoting
their course to students. In the follow-up interviews, 75% of the AP teachers reported
that the primary method of promotion they used was to encourage students in lower level
AP courses or honors classes to take their AP course. None of the AP teachers
interviewed reported promoting their course to students who were not already in an
accelerated academic program or enrolled in college preparatory courses such as AVID, a
course with a built in support structure for students.
While an overwhelming majority of AP teachers do promote their AP course to
students annually, there exists a pattern to target the promotion to existing "AP type"
students. Students who were not involved early in the honors or AP track were
essentially left out of any encouragement to participate in AP courses regardless of their
grades or test scores.
Promoting AP Courses to Traditionally Underrepresented Students
While 90% of the AP teachers surveyed in this study reported that they believe that it
is part of their job to promote their course to students, only 560/0 reported that they are
currently promoting their AP course to African-American and Latino students. Of the AP
teachers interviewed who had reported promoting their course to underrepresented

students on the online survey; none were able to offer any examples of how they
specifically promoted their course to African -American and Latino students.
76
The analysis of the survey responses showed that AP teachers at schools with higher
API scores reported promoting their AP course to traditionally underrepresented students
at higher rates than AP teachers in schools with lower API scores (F=5.534, p=.008). In
schools with low API scores (600-699), all of the teachers reported promoting their AP
course, while only 29% of teachers from schools with API scores over 800 reported
promoting their course to traditionally underrepresented students. One factor
contributing to the higher rate of promoting AP course participation to historically
underrepresented students at schools with lower and moderate API scores may be due to
the schools having a higher percentage of African-American and Latino students. When
asked if they promote AP participation to African-American and Latino students, an AP
teacher at a school with a low API score responded:
"Absolutely, you can't help not to here."
The response indicated that while they are promoting their course to historically
underrepresented students, it was not due to implementing any unique method but was
simply a result of the student demographics of the school. Another AP teacher at a
school with a low API score responded:
"I don't go out of my way. I really try to be color blind and live that way. So I
promote it to everybody. Now with that said, my class is underrepresented in African
Americans. "
An AP teacher at a school with a moderate API score responded:

77
"I do not specifically. But everybody in general. I don't know how to target them, if
I could, I would consider it."
Over the last 1 0 years AP courses have been criticized for failing to provide an
equal opportunity for minority students around the country (Klopfenstein & Thomas,
2005; Lichten, 2000; Santoli, 2002). In 2009, African American students made up 14.5%
of the graduating students nationwide, but were only 3.70/0 of the successful AP exatn
population. This study indicates that schools are not adequately addressing the
ethnic/racial gap in AP participation. Schools with mid and high API scores specifically
are promoting AP participation at lower rates, even though there are reported benefits to
having a diverse learning environment for both students and teachers. In a meta-analysis
of 515 studies, Pettigrew and Tropp (2005) indicated that racial diversity in the classroom
promotes higher student achievement and that the increased contact of different student
groups reduces prejudice and stereotypes. While not specifically addressed in the study,
there is an indication that many AP teachers are aware of the underrepresentation of
African American and Latino students, but are unaware of any useful strategies to
prOlnote their participation.
Advanced Placement course offerings
Tierney, Colyar, & Corwin (2003) report that schools serving traditionally
underrepresented students continue to offer AP courses at a disproportionate rate
compared to high performing schools. The schools with comprehensive AP programs are
predominantly in more affluent, suburban areas where African American and Latino
students continue to be underrepresented in AP participation (Furry & Hecsh, 2001). In

78
schools where there are a limited number of AP courses offered, students are at a
disadvantage in not only having access to a challenging college preparatory curriculUlTI,
but also at a disadvantage in college admission since many colleges use the "weighted"
grades of students, and take into consideration the number of AP courses a student has
taken in high school. While some states have mandated schools to offer a minimum
number of AP courses (Appendix A), schools continue to offer a disproportionate amount
of AP courses to students in high and low performing schools.
The finding from the survey and interviews indicate that the AP teacher does
play an important role in determining whether a school chooses to offer an AP course.
While only 390/0 of the survey respondents reported that teacher interest was the
"primary" factor in determining AP course offerings, 73% reported that teachers do play
a significant role in determining AP course offerings. When responding to how their
school or department decides to offer an AP course, 62.5% of the interview respondents
reported that the decision was primarily if not totally driven by the teacher. The analysis
of the survey data showed a statistical significance in responses by AP teachers in schools
with mid and low percentages of students who qualify for free and reduced lunch
(F=4.027, p=.026). In schools with a low percentage of students qualifying for free and
reduced lunch (12-230/0), teachers reported having a significant role in determining
whether their school offered the AP course that they teach at higher rates than teachers in
schools with a higher percent of students qualifying for free and reduced lunch (40-620/0).
The higher rates may indicate a larger administrative or counselor role in determining

course offerings at schools with a lower percentage of students qualifying for free and
reduced lunch.
79
In her 2004 study, Klopfenstein reported that students who had high expectations
for attending college tended to request and demand more AP programs, and schools with
large proportions of low-income and English Learner (EL) students tended to offer fewer
AP courses due to low expectations about attending college. While there appear to be
multiple factors that influence the decision whether to offer certain AP courses (students,
parents, administrators, and counselors), the involvement of the teacher also plays a
significant and important role. In order for schools to offer more AP courses to give their
students a greater opportunity to be competitive in enrolling in competitive universities, it
is important to have the support and interest of the teachers at the school site. Even
though teachers at traditionally low performing schools may have reservations about
offering an AP course to students that have not been previously exposed to an accelerated
curriculum or who have not been academically successful in the past, offering students
the option to challenge themselves may produce surprising results. Hargrove et al.
(2008) found that even for students who failed the AP exam, enrollment in an AP class
exposed students to college-level standards, leading to greater college success.
Additional Findings
In the course of the study some additional findings that were unrelated to the
research questions were found in the data.

80
AP Course: Teacher Satisfaction
In the follow-up interviews the AP teachers were asked to respond to what they
liked about teaching an AP course and to what they did not like about teaching an AP
course. Overwhelmingly teachers reported that what they liked about teaching AP
courses was the nature of the students. AP teachers reported that the students in AP
courses were more motivated and willing to go more in depth with the material. An AP
U.S. History teacher responded:
"I only have one course with them and I enjoy it every 2nd period because I know that
we'll be able to go farther and I'll be able to discuss why and when more so than 'this is
what happened. '"
Although some of the AP teachers interviewed responded that they disliked the
AP test design, the primary aspect that AP teachers disliked the most about teaching an
AP course was the additional workload required of the teacher.
Decision to screen or not screen students
While this study did not focus on why teachers had decided to screen or not
screen students, the AP teachers who participated in the follow-up interviews indicated
that it was primarily a personal decision, not based upon school or teacher factors.
Teachers in schools with similar factors as well as teachers at the same school reported
unique and differing policies regarding whether to screen or not screen students.
Teachers from schools with low API scores and a high percentage of students qualifying
for free and reduced lunch reported both screening students before enrollment and having
a policy of open access.

Implications
Implications for educational leadership
81
This study indicates that teachers playa significant role in determining student
access to AP courses, as well as an important role in determining what AP courses a
school offers. Teachers are implementing student enrollment policies to their AP courses
without any uniformity or following any district guidelines. Currently, AP teachers are
primarily promoting their AP course to traditional "AP type" students and are not
promoting their course to historically underrepresented students.
Educational leaders interested in addressing the existing gap in AP participation
should focus on the teacher as an important factor in determining AP participation.
Course screening methods and the methods of promoting AP participation can have an
important impact on student access. Districts and school sites can implement policies
and guidelines for AP teachers that promote AP participation to all students, including
students historically underrepresented in AP participation. In schools with a high
percentage of low-income students it is increasingly important for educational leaders to
offer and promote a challenging curriculum for students to gain the exposure needed to
be successful in college. The restructuring of the school culture to promote a supportive,
rigorous curriculum was supported by a Texas study that found that gifted children in
urban areas, of any ethnicity, will succeed if they have the support from their community,
school administrators, and their teachers (Kyburg, Hertberg-Davis, & Callahan, 2007).
82
Implications for policy makers
Under systems like the University of California, students who do not take AP
courses are at a disadvantage in admissions, regardless of their academic achievement.
This study has illustrated the importance of reiterating the reforms suggested by
Solorzano and Omedas in their 2004 study where they call for a restructuring of schools
to influence minority students to take rigorous courses and AP courses. They also
suggest a reform of university admissions policies that consider AP course enrollment
alone as a criterion for admissions. An index considering the number of AP courses that
a school offers would eliminate the advantage that a student has if they attend a high
school that offers significantly more AP courses than other high schools.
Additionally, school districts should establish policies that ensure a minimum
number of AP courses will be available to all students and that schools will continually
offer and encourage teachers in schools with significant populations of traditionally
underrepresented students to offer access to a challenging AP curriculum for all
interested students.
Recommendations for Future Study
This study was an attempt to understand the role of the teacher in Advanced
Placement enrollment and course offerings. Upon completion of the study, several areas
for future study become apparent.
Pre-screening AP Students
A primary focus of the study was to determine whether AP teachers were
currently pre-screening their prospective students before allowing them to enroll in an AP

83
course. The study did not address the question of "why" teachers had chosen to either
pre-screen or had chosen to allow open access to students. There was some indication in
the follow-up interviews that teachers who were screening were doing so because that
was the way it had been done previously by other teachers, but the question was not
thoroughly examined. Of the survey respondents who reported that it was their
perception that the AP exam scores of their students was a reflection of how their
teaching was perceived at the school, 720/0 were also committed to prescreening students
before allowing enrollment. Of the survey respondents who reported that AP exam
scores were not considered an indicator of how their teaching was perceived at their
school site, 630/0 reported that they prescreened students before allowing enrollment.
While one screening factor may be due to AP teachers limiting access to certain students
for fear that they will not perform well on the AP exam, the decision to screen or to not
screen students does not appear to be primarily due to the perception that the student
scores impact the perception of the quality of instruction. A further examination into
why AP teachers have decided to pre-screen or to allow open access to students is
recomnlended to determine the teacher rational for their enrollment policy.
Additionally, during this study the researcher began to see some evidence that
some subject areas may pre-screen students at a higher rate than other subject areas.
Additional research examining the frequency of screening by subject area would help
policy Inakers in determining any guidelines of policies for screening. For example, do
teachers of AP calculus need a certain level of screening to ensure a student is prepared
that AP English teachers do not need?

84
Promoting AP Courses to Students
Another primary focus of the study was to determine the role of the teacher in AP
course offerings at their school sites. Survey item 2a (It is part of my role as an AP
teacher to promote my AP course to students) showed a significant difference by teacher
ethnicity (4.658, p=.016). While there was a statistical significance between responses of
teachers who had self identified as "white" and "other," because of the low numbers in
some of the categories (number of teachers and various responses), it was not a definitive
finding. The findings suggest that a possible area for future research would be to
examine AP course promotion by AP teacher ethnicity.
Conclusions
Advanced Placement courses offer high school students a variety of benefits
including exposing students to a rigorous curriculum, giving students an advantage when
applying to competitive colleges, and providing the opportunity for students to earn
college credit which can reduce the overall cost of earning a college degree.
Additionally, students who pass an AP exam earn higher college grades and graduate
from college at higher rates than their non-AP peers (Geiser & Santelices, 2004). Where
AP courses have been criticized is for failing to provide an equal opportunity for minority
students around the country (Klopfenstein & Thomas, 2005; Lichten, 2000; Santoli,
2002). This study indicates that the AP teacher plays an important role in determining
both student access to AP courses as well as in the decision making process of
determining whether their school will offer a specific AP course. Currently, AP teachers
are the primary "gatekeeper" to the AP course that they teach. Some teachers provide a

85
course with open access to all students who are interested while most prefer to screen
potential students for academic qualifications based upon a pre-set criteria such as grades
or teacher recommendation. An overwhelming majority of AP teachers report that it is
part of their role to promote their AP course to students, yet only a small percentage are
actively promoting their AP course to minority students and students who are not already
in an honors or AP track. The AP teacher is an important factor in determining AP
access for all students. The AP teacher can be a powerful factor in providing a more
equitable access to AP courses as well as in closing the AP participation gap for
historically underrepresented students.

86
APPENDICES

Arkansas
Idaho
Illinois
Indiana
87
Appendix A
AP Course Offerings: State Mandates
State mandates AP course offerings
Yes. Beginning with the 2008-2009 school year, all high schools must offer at least 4 AP courses, adding at least 1 core course each year. In addition, beginning with the 2008-2009 school year, all districts must offer 1 AP course in each of 4 areas: English, math, science and social studies. These offerings must be phased in over a 4-year period beginning in the 2005-2006 school year. Unlike districts, however, high schools are not required to offer courses in specific subject areas.
Districts must also offer pre-AP courses. "In order to prepare students for the rigor inherent in AP courses, it is recommended to begin with the 2004-2005 school year by offering Pre-AP courses to prepare students for the demands of AP coursework. Aligned with the four (4) required AP courses, the Pre-AP courses will be fully operational by the 2008-2009 school year." A district pre-AP program must follow a clearly recognizable sequence, i.e., 6th, 7th, 8th, 9th, 10th grade pre-AP English, 11th grade AP English Language and Composition, 12th grade English Literature and Composition.
Statute exempts any high school offering the International Baccalaureate (IB) Diploma Program from the requirement to offer AP and pre-AP courses. However, in practice in the state, high schools offering IB are also expected to meet the AP offering mandates of non-IB high schools.
No, although effective with the 2007-2008 school year, all high schools must either offer "advanced opportunities," (defined as AP courses, dual credit courses, Tech Prep, or IB programs), "or provide opportunities for students to take courses at the postsecondary campus."
No. However, the state board must "encourage" districts to offer rigorous courses in grades 6-11 to prepare students for AP coursework. In addition, 2005 legislation directs the state board to "seek federal funding through the Advanced Placement Incentive Program and the Math-Science Partnership Program ... and to support the implementation of an integrated instructional program for students in grades 6 through 12 in reading, writing, and mathematics that prepares all students for enrollment and success in Advanced Placement courses and in college."
Yes. Each high school must provide at least two AP courses to qualified students. In addition, each district must provide science and math AP courses.

88
Kentucky No, although each high school is mandated to "offer a core curriculum of advanced placement, International Baccalaureate, dual enrollment, or dual credit courses, using either or both on-site instruction or electronic instruction through the Kentucky Virtual High School or other on-line alternatives. "
Yes. Beginning with the 2007-2008 school year, all public high schools must offer at least 1 AP course in each of the core areas of English, math, science and social studies. Statute notes, however, that use of the state's online "Advanced Placement Instructional Program is an appropriate
Mississippi alternative for the delivery of' AP courses. A public high school offering the International Baccalaureate Diploma Program is exempt from this requirement.
Ohio
Oregon
South Carolina
Tennessee
Vermont
Virginia
In addition, all districts may offer pre-AP courses.
No. However, all districts are required to offer at least one "dual enrollment" program, which may include Advanced Placement courses, the postsecondary enrollment options program, or "any similar program established pursuant to an agreement between" a district and an institution of higher education.
No, although all districts must offer the Expanded Options Program, which provides opportunities for 11 th- and 12th-graders to earn postsecondary credit through dual credit technical preparation programs, such as two-plustwo programs, AP and International Baccalaureate.
Yes, although contingent on school size. "Each school district shall provide advanced placement courses in all secondary schools of the district which enroll an adequate number of academically talented students to support the course." The state board is mandated to determine what constitutes an adequate number of students for an AP course. However, state board policy indicates, "All secondary schools whose organizational structure includes grade 11 or 12 shall offer an Advanced Placement course(s)."
No. However, if a district offers AP courses, it must annually approve a list of AP courses and must "ensure that approved courses substantially incorporate the learning objectives and course descriptions as defined by the College Board[.]"
No. State does not require AP in all high schools but does require high schools to offer students the opportunity to take advanced course work such as college level courses and AP.
No, although all schools must provide either three AP courses, dual enrollment courses, International Baccalaureate courses, Cambridge courses, or any combination thereof.

89
West No, although all districts must offer AP courses. Effective with the 2008-Virginia 2009 school year, all high schools must offer a minimum of four AP courses
or the International Baccalaureate program.
Source: Advanced Placement Database (2006). Education Commission of the States.
Retrieved from:
http://www.ecs.org/htmllIssueSection.asp?issueid= 1 08&subissueid= 161 &ssID=O&s=Wh
at+States

90
Appendix B
Research Questions and Corresponding Survey Items
Research Question #1: What are the perceptions and behaviors of Advanced
Placement teachers regarding course enrollment criteria for students?
Survey Item 1 a: All students should be allowed to take an AP course.
Survey Item 1 b: Prospective AP students should be pre-screened to determine if
they are prepared to take an AP course.
Survey Item 1 c: I currently use some sort of pre-set criteria for students to enroll
in my AP course.
Survey Item Id: I currently use student's grade point average (GPA) as a
screening criterion for AP course enrollment.
Survey Item 1 e: I currently use "teacher recommendation" as a screening
criterion for AP course enrollment.
Survey Item 1 f: I currently use grades earned in previous courses as a screening
criterion for AP course enrollment.
Survey Item Ig: The student scores on the AP exam influence how my teaching
is perceived at my school.
Research Question #2: What is the role of the Advanced Placement teacher in
encouraging participation in Advanced Placement courses for underrepresented
students?
Survey Item 2a: It is part of my role as an AP teacher to promote my AP course
to students.

Survey Item 2b: It is part of my role as an AP teacher to promote AP course
taking to traditionally underserved students such as African American and Latino
students.
91
Survey Item 2c: I actively promote AP courses to traditionally underrepresented
students such as African American and Latino students.
Research Question #3: What is the role of the Advanced Placement teacher in
determining Advanced Placement course offerings?
Survey Item 3a: I have a significant role in determining whether my school offers
the AP course that I currently teach.
Survey Item 3b: Teacher interest is the primary factor in determining whether nly
school offers an AP course.
Research Question #4: What is the relationship between school factors and
Advanced Placement teacher factors as measured by the survey?
Survey Item 4a: What is your age?
Survey Item 4b: What is your gender?
Survey Item 4c: What is your race or ethnicity?
Survey Item 4d: How many years have you been teaching?
Survey Item 4e: How many years have you been teaching at least one AP course?

Appendix C
Interview Protocol
1. How long have you been a teacher?
2. Why did you decide to go into teaching?
3. How did you begin teaching an AP course?
4. What do you like about teaching an AP course?
5. What do you dislike about teaching an AP course?
6. How does your school or department decide to offer an AP course?
7. Does your department, school, or district have any policies regarding student
enrollment into an AP course?
92
8. What led you to currently screen or not screen students before they can take your
AP course?
a. How did you decide to use your current method of screening?
9. Would you feel different about screening prospective AP students if you taught at
a different school site or taught in a different community?
10. Do you promote AP participation to students?
a. Do you promote AP participation to historically underrepresented students
such as African American or Latino students?
11. Do you have any questions for me?

93
Appendix D
Online Survey Consent Form
You are being asked to participate in research which will be conducted by Justin Mason, a doctoral student in the Independent Education Doctoral Program at California State University, Sacramento. This study was designed to examine the perceptions and practices of high school Advanced Placement teachers in determining student access and assignment to Advanced Placement courses and in determining Advanced Placement course offerings in high schools.
You will be asked 19 questions about yourself and your perceptions and practices regarding student access to Advanced Placement courses. The online survey was designed to take 10 minutes or less to complete. If you agree to be contacted, you may also be asked later to participate in a follow-up interview. The follow-up interview was designed to take less than 30 minutes to complete.
Some of the questions may seem personal, but you do not have to answer any questions you do not want to. You may gain additional insight into factors that affect student access to Advanced Placement courses or you may not personally benefit from participating in this research.
All participants in the study will remain anonymous to the public along with the researcher using pseudonyms in place of school and school district names. However, you might be identifiable from the answers you provide on the survey. The researcher will have access to your identity and responses solely to select participants for the follow-up interview. Your responses will be kept confidential to the degree permitted by the technology used. However, no absolute guarantees can be given for the confidentiality of electronic data.
You will not receive any compensation for participating in this research.
Your participation in this research is entirely voluntary. By completing this survey, you are agreeing to participate in the research:
o I agree
o I do not agree

94
Appendix E
Tables: Responses by Teacher Factors
YEARS TEACHING
All Students should be allowed to take an AP course.
Strongly A Agree Neutral Disagree Strongly D 0-5 50 50 0 0 0 6-10 28 42 28 0 0 11-15 33 44 22 0 0 16-20 0 50 25 25 0 21-More 37 42 0 16 5
Prospecti ve AP students should be pre-screened to determine if they are prepared to take an AP course.
Strongly A Agree Neutral Disagree Strongly D 0-5 50 50 0 0 0 6-10 0 57 0 28 14 11-15 22 66 11 0 0 16-20 0 50 25 25 0 21-More 22 56 0 22 0
I currently use some sort of pre-set criteria for students to enroll in my AP course. Strongly A Agree Neutral Disagree Strongly D
0-5 50 0 0 0 50 6-10 0 28 14 28 28 11-15 11 66 0 0 22 16-20 0 75 25 0 0 21-More 21 37 16 21 5
I currently use student's grade point average (GP A) as a screening criterion for AP course enrollment.
Strongly A Agree Neutral Disagree Strongly D 0-5 0 0 0 50 50 6-10 0 0 28 14 57 11-15 11 11 22 33 22 16-20 0 0 50 50 0 21-More 0 26 16 37 21

I currently use "teacher recommendation" as a screening criterion for AP course enro llment.
Strongly A Agree Neutral Disagree Strongly D 0-5 0 0 0 0 100 6-10 14 14 14 28 28 11-15 22 44 22 0 11 16-20 0 25 50 25 0 21-More 16 32 5 32 16
I currently use grades earned in previous courses as a screening criterion for AP course enrollment.
Strongly A Agree Neutral Disagree Strongly D 0-5 50 0 0 0 50 6-10 0 42 28 14 14 11-15 22 55 11 0 11 16-20 0 50 50 0 0 21-More 32 32 16 10 10
It is part of my role as an AP teacher to promote my AP course to students. Strongly A Agree Neutral Disagree Strongly D
0-5 100 0 0 0 0 6-10 71 0 28 0 0 11-15 55 33 11 0 0 16-20 50 50 0 0 0 21-More 53 42 5 0 0
It is part of my role as an AP teacher to promote AP course taking to traditionally underserved students such as African American and Latino students.
Strongly A Agree Neutral Disagree Strongly D 0-5 50 0 0 0 50 6-10 71 0 28 0 0 11-15 55 22 22 0 0 16-20 25 25 25 25 0 21-More 32 47 16 5 0
95

96
I actively promote AP courses to traditionally underrepresented students such as African American and Latino students.
Strongly A Agree Neutral Disagree Strongly D 0-5 0 0 50 0 50 6-10 57 14 28 0 0 11-15 44 11 33 0 11 16-20 25 25 25 25 0 21-More 11 47 37 5 0
I have as significant role in determining whether my school offers the AP course that I currentl y teach.
Strongly A Agree Neutral Disagree Strongly D 0-5 50 0 0 0 50 6-10 42 14 28 0 14 11-15 44 33 0 11 11 16-20 0 50 50 0 0 21-More 37 47 11 5 0
Teacher interest is the primary factor in determining whether my school offers an AP course.
Strongly A Agree Neutral Disagree Strongly D 0-5 0 0 0 50 50 6-10 28 28 28 14 0 11-15 44 22 11 22 0 16-20 0 0 50 50 0 21-More 16 21 21 37 5
The student scores on the AP exam influence how my teaching is perceived at my school. Strongly A Agree Neutral Disagree Strongly D
0-5 100 0 0 0 0 6-10 0 28 42 14 14 11-15 12 50 25 12 0 16-20 25 50 25 0 0 21-More 5 47 21 21 5

97
YEARS TEACHING AP COURSES
All Students should be allowed to take an AP course.
Strongly A Agree Neutral Disagree Strongly D 0-5 30 40 20 10 0 6-10 27 55 9 9 0 11-15 33 33 0 17 17 16-20 100 0 0 0 0 21-More 0 100 0 0 0
Prospective AP students should be pre-screened to determine if they are prepared to take an AP course.
Strongly A Agree Neutral Disagree Strongly D 0-5 10 63 5 10 10 6-10 9 64 0 27 0 11-15 17 50 17 17 0 16-20 50 0 0 50 0 21-More 50 50 0 0 0
I currently use some sort of pre-set criteria for students to enroll in my AP course. Strongly A Agree Neutral Disagree Strongly D
0-5 15 35 5 20 25 6-10 9 55 27 9 0 11-15 0 67 17 17 0 16-20 50 50 0 0 0 21-More 50 0 0 0 50
I currently use student's grade point average (GPA) as a screening criterion for AP course enrollment.
Strongly A Agree Neutral Disagree Strongly D 0-5 0 10 20 35 35 6-10 9 18 36 27 9 11-15 0 17 17 50 17 16-20 0 50 0 0 50 21-More 0 0 0 50 50
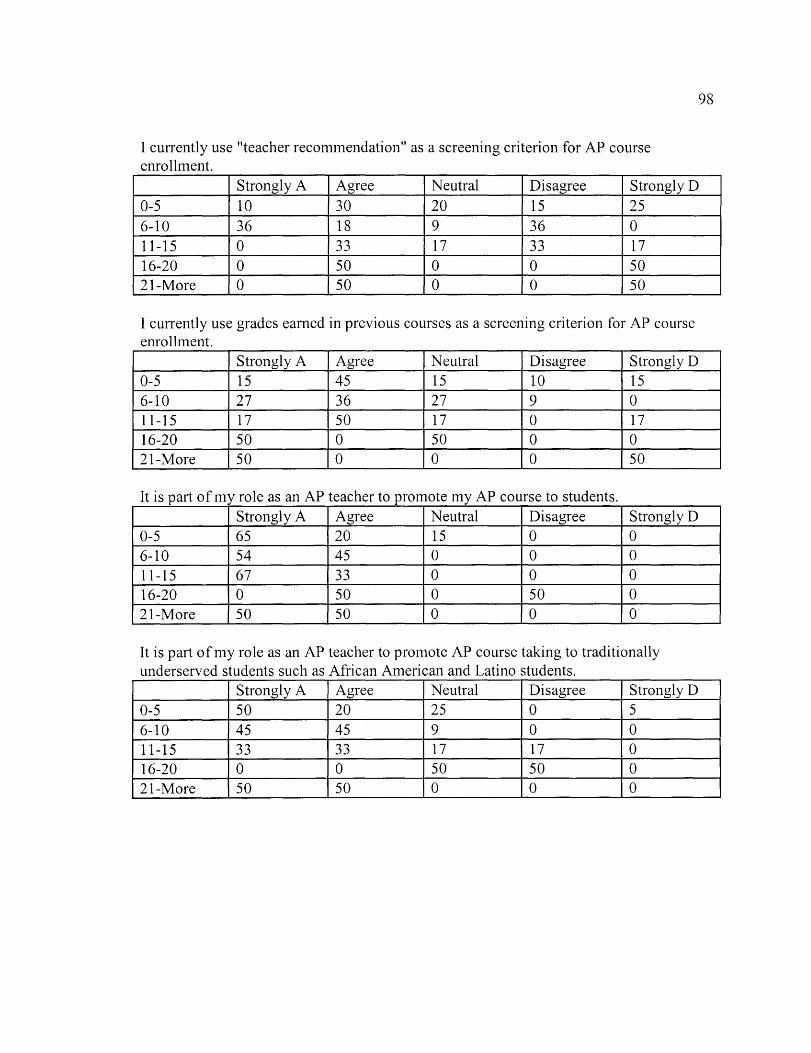
98
I currently use "teacher recommendation" as a screening criterion for AP course enrollment.
Strongly A Agree Neutral Disagree Strongly D 0-5 10 30 20 15 25 6-10 36 18 9 36 0 11-15 0 33 17 33 17 16-20 0 50 0 0 50 21-More 0 50 0 0 50
I currently use grades earned in previous courses as a screening criterion for AP course enrollment.
Strongly A Agree Neutral Disagree Strongly D 0-5 15 45 15 10 15 6-10 27 36 27 9 0 11-15 17 50 17 0 17 16-20 50 0 50 0 0 21-More 50 0 0 0 50
It is part of my role as an AP teacher to promote my AP course to students. Strongly A Agree Neutral Disagree Strongly D
0-5 65 20 15 0 0 6-10 54 45 0 0 0 11-15 67 33 0 0 0 16-20 0 50 0 50 0 21-More 50 50 0 0 0
It is part of my role as an AP teacher to promote AP course taking to traditionally underserved students such as African American and Latino students.
Strongly A Agree Neutral Disagree Strongly D 0-5 50 20 25 0 5 6-10 45 45 9 0 0 11-15 33 33 17 17 0 16-20 0 0 50 50 0 21-More 50 50 0 0 0

99
I actively promote AP courses to traditionally underrepresented students such as African American and Latino students.
Strongly A Agree Neutral Disagree Strongly D 0-5 30 20 40 0 10 6-10 27 36 36 0 0 11-15 17 50 17 17 0 16-20 0 0 50 50 0 21-More 50 50 0 0 0
I have as significant role in determining whether my school offers the AP course that I currentl y teach.
Strongly A Agree Neutral Disagree Strongly D 0-5 50 20 10 10 10 6-10 18 45 27 0 9 11-15 17 67 17 0 0 16-20 50 50 0 0 0 21-More 50 50 0 0 0
Teacher interest is the primary factor in determining whether my school offers an AP course.
Strongly A Agree Neutral Disagree Strongly D 0-5 35 15 20 25 5 6-10 0 27 36 36 0 11-15 17 33 0 33 17 16-20 50 0 50 0 0 21-More 0 0 0 100 00
The student scores on the AP exam influence how my teaching is perceived at my school. Strongly A Agree Neutral Disagree Strongly D
0-5 15 35 30 15 5 6-10 10 50 20 20 0 11-15 17 50 33 0 0 16-20 0 50 0 0 50 21-More 0 50 0 50 0

100
AGE OF TEACHER
All Students should be allowed to take an AP course.
Strongly A Agree Neutral Disagree Strongly D 18-25 0 100 0 0 0 26-35 50 33 17 0 0 36-45 14 42 28 14 0 46-55 40 60 0 0 0 56-Over 31 31 12 19 6
Prospective AP students should be pre-screened to determine if they are prepared to take an AP course.
Strongly A Agree Neutral Disagree Strongly D 18-25 0 100 0 0 0 26-35 17 17 0 33 33 36-45 14 71 0 14 0 46-55 11 44 11 33 0 56-Over 19 75 0 6 0
I currently use some sort of pre-set criteria for students to enroll in my AP course. Strongly A Agree Neutral Disagree Strongly D
18-25 100 0 0 0 0 26-35 17 17 0 17 50 36-45 0 57 14 14 14 46-55 10 50 20 20 0 56-Over 19 44 12 12 12
I currently use student's grade point average (GP A) as a screening criterion for AP course enrolln1ent.
Strongly A Agree Neutral Disagree Strongly D 18-25 0 0 0 100 0 26-35 0 0 17 0 83 36-45 14 0 14 57 14 46-55 0 10 20 60 10 56-Over 0 31 25 19 25

101
I currently use "teacher recommendation" as a screening criterion for AP course enrollment.
Strongly A Agree Neutral Disagree Strongly D 18-25 0 0 0 0 100 26-35 17 0 17 17 50 36-45 14 42 14 28 0 46-55 10 40 10 40 0 56-Over 19 31 12 12 25
I currently use grades earned in previous courses as a screening criterion for AP course enrollment.
Strongly A Agree Neutral Disagree Strongly D 18-25 100 0 0 0 0 26-35 17 33 17 0 33 36-45 14 71 14 0 46-55 40 30 10 20 0 56-Over 12 37 31 0 19
It is part of my role as an AP teacher to promote my AP course to students. Strongly A Agree Neutral Disagree Strongly D
18-25 100 0 0 0 0 26-35 67 17 17 0 0 36-45 57 28 14 0 0 46-55 90 10 0 0 0 56-Over 31 56 6 6 0
It is part of my role as an AP teacher to promote AP course taking to traditionally underserved students such as African American and Latino students.
Strongly A Agree Neutral Disagree Strongly D 18-25 0 0 0 0 100 26-35 67 17 17 0 0 36-45 42 28 28 0 0 46-55 70 20 10 0 0 56-Over 25 44 25 6 0
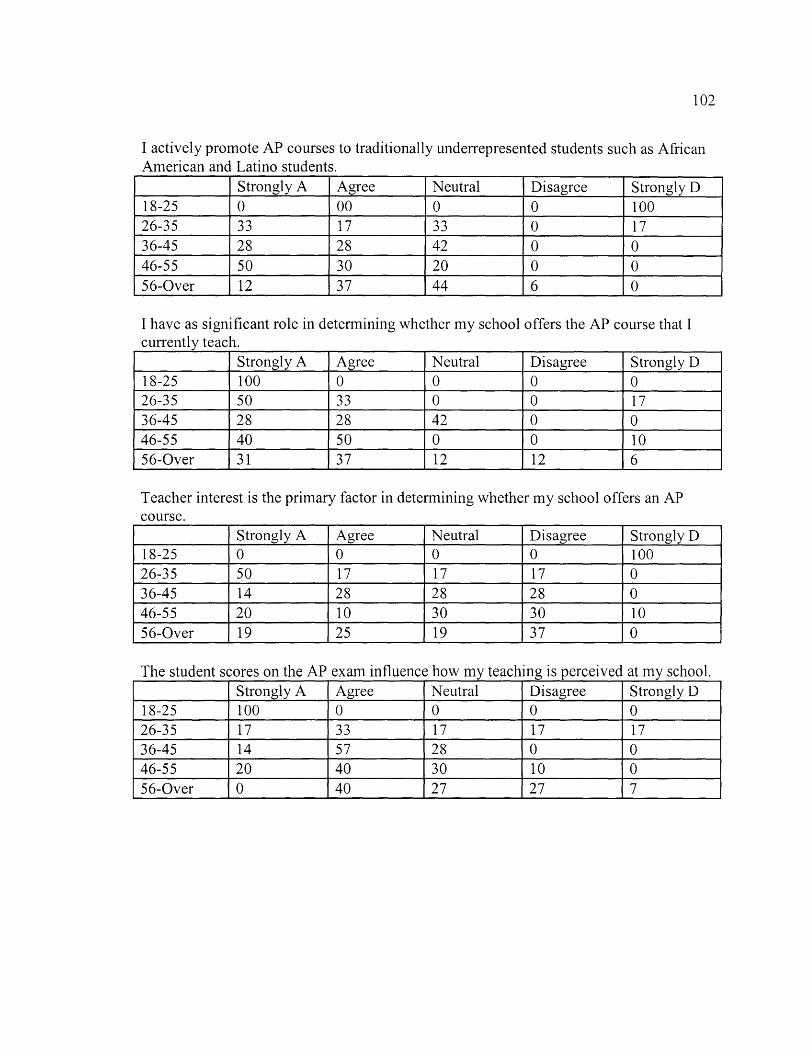
102
I actively promote AP courses to traditionally underrepresented students such as African American and Latino students.
Strongly A Agree Neutral Disagree Strongly D 18-25 0 00 0 0 100 26-35 33 17 33 0 17 36-45 28 28 42 0 0 46-55 50 30 20 0 0 56-Over 12 37 44 6 0
I have as significant role in determining whether my school offers the AP course that I current! y teach.
Strongly A Agree Neutral Disagree Strongly D 18-25 100 0 0 0 0 26-35 50 33 0 0 17 36-45 28 28 42 0 0 46-55 40 50 0 0 10 56-Over 31 37 12 12 6
Teacher interest is the primary factor in determining whether my school offers an AP course.
Strongly A Agree Neutral Disagree Strongly D 18-25 0 0 0 0 100 26-35 50 17 17 17 0 36-45 14 28 28 28 0 46-55 20 10 30 30 10 56-Over 19 25 19 37 0
The student scores on the AP exam influence how my teaching is perceived at my school. Strongly A Agree Neutral Disagree Strongly D
18-25 100 0 0 0 0 26-35 17 33 17 17 17 36-45 14 57 28 0 0 46-55 20 40 30 10 0 56-Over 0 40 27 27 7

103
GENDER
All Students should be allowed to take an AP course.
Strongly A Agree Neutral Disagree Strongly D Male 36 45 9 5 5 Female 28 39 17 17 0
Prospective AP students should be pre-screened to determine if they are prepared to take an AP course.
Strongly A Agree Neutral Disagree Strongly D Male 19 52 5 19 5 Female 11 61 5 17 5
I currently use some sort of pre-set criteria for students to enroll in my AP course. Strongly A Agree Neutral Disagree Strongly D
Male 14 36 14 27 9 Female 17 50 11 0 22
I currently use student's grade point average (GP A) as a screening criterion for AP course enrollment.
Strongly A Agree Neutral Disagree Strongly D Male 5 5 23 41 27 Female 0 22 22 28 28
I currently use "teacher recommendation" as a screening criterion for AP course enro 11m en t.
Strongly A Agree Neutral Disagree Strongly D Male 18 23 9 27 23 Female 5 39 22 17 17
I currently use grades earned in previous courses as a screening criterion for AP course enrollment.
Strongly A Agree Neutral Disagree Strongly D Male 23 32 18 14 14 Female 17 50 22 0 11
It is part of my role as an AP teacher to promote my AP course to students. Strongly A Agree Neutral Disagree Strongly D
Male 68 27 0 5 0 Female 50 33 17 0 0

104
It is part of my role as an AP teacher to promote AP course taking to traditionally underserved students such as African American and Latino students.
Strongly A Agree Neutral Disagree Strongly D Male 50 23 18 5 5 Female 39 33 22 5 0
I actively promote AP courses to traditionally underrepresented students such as African American and Latino students.
Strongly A Agree Neutral Disagree Strongly D Male 18 27 45 5 5 Female 39 28 22 5 5
I have as significant role in determining whether my school offers the AP course that I currentl y teach.
Strongly A Agree Neutral Disagree Strongly D Male 36 45 14 0 5 Female 39 22 17 11 11
Teacher interest is the primary factor in determining whether my school offers an AP course.
Strongly A Agree Neutral Disagree Strongly D Male 9 27 27 27 9 Female 39 11 17 33 0
The student scores on the AP exam influence how my teaching is perceived at my school.
Strongly A Agree Neutral Disagree Strongly D Male 18 50 18 14 0 Female 6 35 29 18 12
RACE / ETHNICITY All Students should be allowed to take an AP course.
Strongly A Agree Neutral Disagree Strongly D African-Amer. 0 0 0 0 0 Asian /Pacific 50 50 0 0 0 Latino/Hispanic 0 0 0 0 0 Native Amer. 0 0 0 0 0 White 32 42 13 13 0 Other 20 60 0 0 20

105
Prospective AP students should be pre-screened to determine if they are prepared to take an AP course.
Strongly A Agree Neutral Disagree Strongly D African-Amer. 0 0 0 0 0 Asian /Pacific 25 50 0 0 25 Latino/Hispanic 0 0 0 0 0 Native Amer. 0 0 0 0 0 White 10 57 7 23 3 Other 40 60 0 0 0
I currently use some sort of pre-set criteria for students to enroll in my AP course. Strongly A Agree Neutral Disagree Strongly D
African-Amer. 0 0 0 0 0 Asian /Pacific 25 50 0 0 25 Latino/Hispanic 0 0 0 0 0 N ati ve Amer. 0 0 0 0 0 White 13 42 13 16 16 Other 20 40 20 20 0
I currently use student's grade point average (GPA) as a screening criterion for AP course enrollment.
Strongly A Agree Neutral Disagree Strongly D African-Amer. 0 0 0 0 0 Asian /Pacific 0 25 0 50 25 Latino/Hispanic 0 0 0 0 0 Native Amer. 0 0 0 0 0 White 3 13 19 39 26 Other 0 20 40 0 40
I currently use "teacher recommendation" as a screening criterion for AP course enrollment.
Strongly A Agree Neutral Disagree Strongly D African-Amer. 0 0 0 0 0 Asian /Pacific 0 75 0 0 25 Latino/Hispanic 0 0 0 0 0 Native Amer. 0 0 0 0 0 White 10 29 16 29 16 Other 60 0 0 0 40

106
I currently use grades earned in previous courses as a screening criterion for AP course enrollment.
Strongly A Agree Neutral Disagree Strongly D African-Amer. 0 0 0 0 0 Asian /Pacific 25 50 0 25 Latino/Hispanic 0 0 0 0 0 Native Amer. 0 0 0 0 0 White 26 39 16 10 10 Other 0 40 40 0 20
It is part of my role as an AP teacher to promote my AP course to students. Strongly A Agree Neutral Disagree Strongly D
African-Amer. 0 0 0 0 0 Asian /Pacific 50 50 0 0 0 Latino/Hispanic 0 0 0 0 0 Native Amer. 0 0 0 0 0 White 71 19 10 0 0 Other 0 80 0 20 0
It is part of my role as an AP teacher to promote AP course taking to traditionally underserved students such as African American and Latino students.
Strongly A Agree Neutral Disagree Strongly D African-Amer. 0 0 0 0 0 Asian /Pacific 50 25 25 0 0 Latino/Hispanic 0 0 0 0 0 Native Amer. 0 0 0 0 0 White 48 26 19 3 3 Other 20 60 0 20 0
I actively promote AP courses to traditionally underrepresented students such as African American and Latino students.
Strongly A Agree Neutral Disagree Strongly D African-Amer. 0 0 0 0 0 Asian /Pacific 25 25 50 0 0 Latino/Hispanic 0 0 0 0 0 Native Amer. 0 0 0 0 0 White 29 29 32 3 6 Other 20 40 20 20 0

I have as significant role in determining whether my school offers the AP course that I currently teach.
107
Strongly A Agree Neutral Disagree Strongly D African-Amer. 0 0 0 0 0 Asian /Pacific 50 25 0 0 25 Latino/Hispanic 0 0 0 0 0 Native Amer. 0 0 0 0 0 White 42 35 13 3 6 Other 0 40 40 20 0
Teacher interest is the primary factor in determining whether my school offers an AP course.
Strongly A Agree Neutral Disagree Strongly D African-Amer. 0 0 0 0 0 Asian /Pacific 25 0 25 50 0 Latino/Hispanic 0 0 0 0 0 Native Amer. 0 0 0 0 0 White 26 23 16 29 6 Other 0 20 40 40 0
The student scores on the AP exam influence how my teaching is perceived at my school. Strongly A Agree Neutral Disagree Strongly D
African-Amer. 0 0 0 0 0 Asian /Pacific 25 50 25 0 0 Latino/Hispanic 0 0 0 0 0 Native Amer. 0 0 0 0 0 White 13 42 20 17 7 Other 0 40 40 20 0

108
Appendix F
Interview Informed Consent Form
You are being asked to participate in research which will be conducted by Justin Mason, a doctoral student in the Independent Education Doctoral Program at California State University, Sacramento. This study was designed to examine the perceptions and practices of high school Advanced Placement teachers in determining student access and assignment to Advanced Placement courses and in determining Advanced Placement course offerings in high schools.
You will be asked 11 interview questions about yourself and your perceptions and practices regarding student access to Advanced Placement courses. The interview protocol was designed to take less than 30 minutes to complete. The interview will be audio recorded and later will be transcribed verbatim. The audio recordings will be temporarily stored in the researcher's home office and will be destroyed as soon as they have been transcribed. The responses of the subjects in all of the interviews will be analyzed by the researcher in an effort to determine patterns or themes in the data.
Some of the questions may seem personal, but you do not have to answer any questions you do not want to. You may also discontinue the interview at any time. You may gain additional insight into factors that affect student access to Advanced Placement courses or you may not personally benefit from participating in this research.
Your identity will be kept confidential along with the researcher using pseudonyms in place of school district names. You will not receive any compensation for participating in this research.
Your participation in this research is entirely voluntary. Your signature below indicates that you have read this page and agree to participate in the research.
Signature of Participant Date

REFERENCES
ACLU (1999). In Class-Action Lawsuit, ACLU Says CA Students Are Denied Equal
Access to Advanced Placement Courses. Press Release. Retrieved from:
http://www.aclu.orgiracialjustice/aaJ15822prs 19990727 .html
Attewell, P. (2000). Mirage of meritocracy. American Prospect, 11, 16, 12-14.
Barber, E. (1995). Getting the grade: An analysis of an AP program. Hofstra
University: dissertation
Bodenhausen, 1. (1989). Teacher credentials and student outcomes. College Board
Review, 153, 48-55.
Breeland, H., Maxey, 1., Gernand, R., Cumming, T., & Trapani, C. (2002). Trends in
college admission 2000: A report of a national survey of undergraduate
admissions policies, practices, and procedures. Retrieved from:
www.airweb.orglimages/trendsreport.pdf
109
Brownell, N., Furry, W., & Beasley, J. (1999). The Advanced Placement Program
California's 1997-1998 Experience. Institute for Education Reform: Sacramento.
Burham, P., & Hewitt, B. (1967). Study of advanced placement examination
scores of the college entrance examination board. New Haven, CN: Yale
University.
Burton, N., Edelstein, K., Kindig, L., Bruschi, B., & Cline, F. (In preparation).
Evaluation of Advanced Placement Summer Institutes. Princeton NJ: Educational
Testing Service.

110
Burton, N., Whitman, N., Yepes-Baraya, M., Cline, F., & Myung-in Kim, R. (2002).
Minority student success: The role of teachers in Advanced Placement courses.
Advanced Research Committee. The College Entrance Examination Board.
Retrieved from:
apcentral.collegeboard.com/apc/public/repository/ap02 _ minority ~op _11805 .pdf
Callahan, C. M. (2003). Advanced Placement courses/exams. In J. W. Guthrie (Ed.),
Encyclopedia of education (2nd ed., Vol. 1, pp. 56-58). New York: MacMillan
Reference USA.
CalifoTIlia Constitution
CalifoTIlia Postsecondary Education Commission (2005). University preparedness of
public high school graduates. Sacramento: California Postsecondary Education
Commission. (ERIC Document Reproduction Service No. ED 450 669).
Callahan, C. M. (2003). Advanced Placement courses/exams. In J. W. Guthrie (Ed.),
Encyclopedia of education (2nd ed., Vol. 1, pp. 56-58). New York: MacMillan
Reference USA.
Camara, W. (1997). The relationship of PSATINMSQT scores and AP Examination
grades. New York, NY: The College Entrance Examination Board.
Camara, W., & Millsap, R. (1998). Using the PSATINMSQT and course grades in
predicting success in the Advanced Placement Program. College Board Rep. No.
98-4. New York, NY: The College Entrance Examination Board.

III
Carnevale, D. (1999). ACLU Sues California Over Unequal Access to Advanced
Placement Courses. Chronicle of Higher Education, 00095982, 8/6/99, Vol. 45,
Issue 48
Casement, W. (2003). Declining quality for the AP program. Academic Questions, Fall
2003.
Casserly, P. L. (1986). Advanced Placement revisited. College Board Report 86-6.
New York: College Entrance Examination Board.
College Board. (2002). Opening classroom doors: Strategies for expanding access to
AP. Retrieved from:
http://www.collegeboard.com/prod_downloads/ipeAPC/ap04_openingdoors_3560
9.pdf
College Board. (2005). Advanced Placement report to the nation 2005. Princeton, NJ:
College Board.
College Board. (2008a). Trends in College Pricing. Retrieved from:
http://professionals.collegeboard.com/k-
12/assessmentiap?affiliated=APCB&bannerld=ccost09
College Board. (2008b) Achieving Equity. Retrieved from:
http://professionals.collegeboard.com/k -121 assessment/apl equi ty
College Board. (2008c). Bulletin for AP Students and Parents. Retrieved from:
http://professionals.collegeboard.com/profdownload/ap-bulletin-students
parents.pdf

112
College Board. (2008d). Bulletin for AP Students and Parents: California Supplement.
Retrieved from:
http://professionals.collegeboard.com/profdownload/ap-bulletin-students-parents
california-supplement.pdf
College Board. (2009). Advanced Placement report to the nation 2009. Princeton~
NJ: College Board.
College Board. (2010). Advanced Placement report to the nation 2010. Princeton,
NJ: College Board.
Creswell, J. (2008). Research design: Qualitative, quantitative, and mixed methods
approaches. London: Sage.
Darling-Hammond, L. (2000). Teacher quality and student achievement: A review of
state policy evidence. Education Policy Analysis Archives, 8(1).
Darling-Hammond, L. (2001). Doing what matters most: Investing in quality teaching.
New York, NY: National Commission on Teaching & America's Future.
Day, P. (2003). A new history o/social welfare. (4th ed). Boston, Massachusetts: Allyn
and Bacon.
Dounay, J. (2006). Advanced Placement. Education Commission of the States Policy
Brief. Retrieved from: http://www.ecs.org/clearinghouse/67 /44/67 44.pdf
Duffett, A., & Farkas, S. (2009). Growing Pains in the Advanced Placement Program:
Do Tough Trade-offs Lie Ahead? Thomas B. Fordham Institute. ERIC ED
505527

113
Education Trust. (2002). Education Watch: Michigan. Key education facts and figures.
Education Trust. ERIC ED 478550.
Escalante, J. (1990). The Jaime Escalante math program. Journal of Negro Education,
59,5-16.
Eworo-Enfumo, K. (2004). Teacher and guidance counselor perceptions of classroom
diversity: Are institutional barriers discouraging classroom diversity in advanced
courses? University of Maryland, College Park: dissertation.
Ferguson, P., & Womack, S. (1993). The impact of subject matter and education
coursework on teaching performance. Journal of Teacher Education, 44(1), 55-
63.
Fithian, E. (2003). Rate of Advanced Placement (AP) exam taking among AP-enrolled
students: A study of New Jersey high schools. College of William and Mary:
dissertation.
Furry, W., & Hecsh, 1. (2001). Characteristics and Performance of Advanced Placement
Classes in California. Institute for Education Reform: Sacramento.
Gardner, R. S. 2003. Advanced Placement courses in a small rural high school:
Allocation of educational resources and perceptions of maj or stakeholders
(Doctoral dissertation, Temple University, 2003). Dissertation Abstracts
International, 64, 100.
Geiser, S., & Santelices, V. (2004). The Role of Advanced Placement and Honors
Courses in College Admissions. Center for Studies in Higher Education,
University of California, Berkeley.

114
Geiser, S., & Santelices, V. (2005). AP courses as predictors of college success.
Recruitment & Retention in Higher Education, 19(2),5.
Hall, S., & Held D. (1990). Citizens and Citizenship. In S. Hall, & M. Jacques (Eds.),
New Times. Lawrence & Wishart
Hargrove, Linda. (2008). AP students significantly outperfonn peers according to two
landmark studies by University of Texas at Austin researchers. Office of Public
Affairs.
Hargrove, L., Godin, D., & Dodd, B. (2008). College Outcomes Comparisons by AP
and Non-AP High School Experiences. The College Board, New York.
Hansen, K., Gonzalez, 1., Hatch, G. L., Reeve, S. (2006). Are Advanced Placement
English and first-year college composition equivalent? A comparison of outcOlnes
in the writing of three groups of sophomore college students. Research in the
Teaching of English, 40(4), 461-50l.
Harris, S., & Galitsis, A. (1980). A comparison of the achievement of college
students, advanced placement students, and first-year chemistry secondary school
students. Journal of Chemical Education, 57(7),494-495.
Hasci, T. A. (2004). Document-based question: What is the historical significance of the
Advanced Placement test? Journal of American History, 90, 4, 1392-1400.
Hawkins, D., & Clinedinst, M. (2006). State of College Admission. National
Association for College Admission Counseling: Alexandria, VA.
Hoffman, N. (2003). College Credit in High School: Increasing College Attainment
Rates for Underrepresented Students. Change v. 35 no 4, p. 42-8.

115
Hyser, R. M. (1999). Is a 3 a c? The reliability of the Advanced Placement United States
history test for college credit. The History Teacher, 32(2), 223-235.
Johnson, L. (2005). Why is it important to take challenging classes? Davidson Institute
for Talent Development. Retrieved from:
http://www.davidsongifted.org/db/ Articles _id _1 0330.aspx
Klopfenstein, K. (2003a). Recommendations for maintaining the quality of Advanced
Placement programs. American Secondary Education, 32( 1), 39-48.
Klopfenstein, K. (2003b). Advanced placement: Do minorities have equal opportunity?
Economics of Education Review, 23,115-131
Klopfenstein, K. (2004). The Advanced Placement Expansion of the 1990s: How Did
Traditionally Underserved Students Fair? Education Policy Analysis Archives,
Vol. 12, Number 68.
Klopfenstein, K. & Thomas, K.M. (2005). The link between advanced placement
experience and early college success. http://www.utdallas.edu/research/tsp.pdf
Kyburg, R. M., Hertberg-Davis, H., & Callahan, C. M. (2007). Advanced Placement and
international baccalaureate programs: Optimal learning environments for talented
minorities? Journal of Advanced Academics, 18(2), 172-215.
Lazarin, M. (2001). Advancement for whom? The advanced placement program in
Texas. The University of Texas, Austin: unpublished master's thesis
Lee, R. (2001). Expanding Access: Increasing enrollment in Advanced Placement
courses in a racially diverse school. University of California, Los Angeles,
dissertation

Lichten, W. (2000). Whither Advanced Placement? Educational Policy Archives, 29,
Retrieved June 20,2009, from http://epaa.asu.edu/epaa/v8n29.html
116
Lurie, M. N. (2000). AP U.S. History: Beneficial or problematic? History Teacher, 33(4),
521-525.
Matthews, J. (2005). How to build a better high school. Newsweek, 145(20),52-57.
Milewski, G. B. & Gillie, J. M. (2002). What are the characteristics of Advanced
Placement teachers? An examination of survey research. New York: College
Entrance Examination Board.
Miller, Lorraine. (1994). Effects of racial and socioeconomic factors on advanced
placement programs. Dissertation. (UMI No. 9606827)
Morgan, R. & Crone, C. (1993). Advanced Placement examinees at the University of
California: An examination of the freshman year courses and grades of examinees
in biology, calculus, and chemistry. (Statistical Report 93-210). Princeton, NJ:
Educational Testing Service.
Murnane, R., & Phillips, B. (1991). Learning by doing, vintage, and selection: Three
pieces of the puzzle relating teaching experience and teaching performance.
Economics of Education Review, 1 (4), 453-65.
No Child Left Behind Act. (2002). Sections 1701-1707. Retrieved from:
http://www.ed.gov/print/policy/elsec/leg/esea02/pgI4.html

117
National Research Council. (2002). Learning and understanding: Improving advanced
study of mathematics and science in U.S. High schools. In Center for Education
Division of Behavioral and Social Sciences and Education (Ed.). Washington,
D.C.: National Academy Press.
Nugent, S.A. & Kames, F.A. (2002). The Advanced Placement Program and the
International Baccalaureate Programme: a history and update. Gifted Child
Today, 25, 1, 30-39.
Oakes, 1. (1990). Multiplying inequalities: The effects of race, social class, and tracking
on opportunities to learn mathematics and science. Santo Monica, CA: Rand.
Oakes, 1. (1995). Two cities' tracking and within school segregation. Teachers College
Record, 96 (4), 681-690.
Oberjuerge, M. (1999). Raising the bar: historically disadvantaged students can meet the
AP challenge. The History Teacher, 32, 2, 263-67.
Oxtoby, D. (2007). The rush to take more AP courses hurts students, high schools, and
colleges. Chronicle of Higher Education, v53 n34 p22.
Pettigrew, T., & Tropp, L. (2005). Relationships between intergroup contact and
prejudice among minority & majority status groups. Psychological Science,
December, 16(12),951-957.
Richards, 1. H. 2006. College-level learning in high school: Academic achievement
comparisons between CLLHS-accelerated and non-accelerated peers in college
classes (Doctoral dissertation, The University of Kansas, 2006). Dissertation
Abstracts International, 67, 172.

118
Rose, H. & Betts, J. R. (2001). Math matters: The links between high school curriculum,
college graduation, and earnings. San Francisco: Public Policy Institute of
California.
Rothschild, E. (1999). Four decades of the Advanced Placement Program. The History
Teacher, 32, 2, 175-206.
Sadler, P. & Tai, R. (2007). Weighting for recognition: Accounting for advanced
placement and honors courses when calculating high school grade point
average. NASSP Bulletin, Vol. 91, No.1, March 2007 5-32.
Santoli, S. (2002). Is there an advanced placement advantage? American Secondary
Education, 30(3), 23.
Sawchuk, S. (2009). AP teachers divided over push to open classes to all. Education
Week. Vol. 28 Issue 31, p8
Simms, D. (1982). Comparison of academic performance between AP and non-AP
students at the University of Michigan. Unpublished manuscript.
Solorzano, D. G. & Omedas, A. (2004). A critical race analysis of Latinalo and African
American Advanced Placement enrollment in public high schools. High School
Journal, 87, 3, 15-26.
Stanford University. (2009). College Board Advanced Placement (AP) Chart 2009-10.
Retrieved from: http://registrar.stanford.edu/pdf/AP_Chart_2009-1 O.pdf
Stange, C., Crabtree, F., & Miller, L. (2006). Publishing multimethod research. Annuals
of Family Medicine, 4(4), 292-294.

119
State Council of Higher Education. (1992). Response to House Joint Resolution No., 211,
Appropriations Act Item 151, and House Joint Resolution No. 142. Virginia:
Author.
Tai, R. (2008). Posing tougher questions about the advanced placement program.
Liberal Education. Summer. Retrieved from:
http://www.aacu.org/liberaleducationile-su08/documents/LE-SU08_Tai.pdf
Tierney, W., Colyar, J.E., & Corwin, Z.B. (2003). Preparing for college: Building
expectations, changing realities. Center for Higher Education Policy Analysis,
Rossier School of Education, University of Southern California. Retrieved from
http:www. usc/ dept/ chepa.
U. S. Department of Education. (2009a). Advanced Placement Test Fee Program.
Retrieved from: http://www.ed.gov/programs/apfee/funding.html
U. S. Department of Education. (2009b). Advanced Placement Incentive Program
Grants. Retrieved from: http://www.ed.gov/programs/apincent/funding.html
Weiss, Suzanne, ed. (2001). High school curriculum. Progress of Education Reform
1999-2001. v3, n1 Aug-Sep 2001.
Willingham, W. W. & Morris, M. (1986). Four years later: A longitudinal study of
Advanced Placement students in college. New York: College Entrance
Examination Board.

Winebrenner, S. (2006). Effective teaching strategies for open enrollment honors and
AP classes. The Journal of Secondary Gifted Education, 17, 3, 159-177.
Zarate, M., & Pachon, H. (2006). Gaining or Losing Ground? Equity in Offering
Advanced Placement Courses in California High Schools 1997-2003. Tomas
Rivera Policy Institute. p. 28
120