the role of women in agriculture
TRANSCRIPT
The role of women in agriculture
Prepared by the SOFA Team and Cheryl Doss
ESA Working Paper No. 11-02
March 2011
Agricultural Development Economics Division
The Food and Agriculture Organization of the United Nations
www.fao.org/economic/esa
1
The Role of Women in Agriculture1
Prepared by the SOFA Team
2
and Cheryl Doss
Abstract: Agriculture can be an important engine of growth and poverty reduction. But the sector is underperforming in many countries in part because women, who are often a crucial resource in agriculture and the rural economy, face constraints that reduce their productivity. In this paper we draw on the available empirical evidence to study in which areas and to what degree women participate in agriculture. Aggregate data shows that women comprise about 43 percent of the agricultural labour force globally and in developing countries. But this figure masks considerable variation across regions and within countries according to age and social class. Time use surveys, which are more comprehensive but typically not nationally representative, add further insight into the substantial heterogeneity among countries and within countries in women’s contribution to agriculture. They show that female time-use in agriculture varies also by crop, production cycle, age and ethnic group. A few time-use surveys have data by activity and these show that in general weeding and harvesting were predominantly female activities. Overall the labour burden of rural women exceeds that of men, and includes a higher proportion of unpaid household responsibilities related to preparing food and collecting fuel and water. The contribution of women to agricultural and food production is significant but it is impossible to verify empirically the share produced by women. Women’s participation in rural labour markets varies considerably across regions, but invariably women are over represented in unpaid, seasonal and part-time work, and the available evidence suggests that women are often paid less than men, for the same work. Available data on rural and agricultural feminization shows that this is not a general trend but mainly a sub-Saharan Africa phenomena, as well as observed in some sectors such as unskilled labour in the fruit, vegetable and cut-flower export sector. This paper re-affirms that women make essential contributions to agriculture and rural enterprises across the developing world. But there is much diversity in women’s roles and over-generalization undermines policy relevance and planning. The context is important and policies must be based on sound data and gender analysis. Key words: Women, gender, agriculture, labour force, employment, production, time-use, demographics, market access. JEL: J11,J21, J22, J24, J43, Q10 Acknowledgements: We are grateful for comments and advice received from Patricia Biermayr-Jenzano, Marcus Goldstein, Isatou Jallow, Annina Lubbock, Ruth Meinzen-Dick, Jemima Njuki, Thelma Paris, Eja Pehu, Agnes Quisumbing, Patrick Webb, Manfred Zeller, Kostas Stamoulis, Maria Hartl, Marcela Villarreal, Martha Osorio, Yianna Lambrou, Hafez Ghanem, Jennie DeyDePryck, Frank Mischler, Eve Crowley, Kieth Wiebe, Peter Wobst, Cathy Farnworth, Soline de Villard, Zoraida Garcia, Chris Coles, John Curry, Priya Deshingkar, Andrew Dillon, Caroline Dookie, Diana Fletschner, Nicola Jones, Yasmeen Khwaja, Frauke Kramer, Jan Lundius, Ani McLeod, Faith Nilsson, Christine Okali, Lucia Palombi, Amber Peterman, Holger Seebens and Marcella Vigneri. We also acknowledge the valuable contribution made by Diana Templeman, Paola Termine and Amy Heyman. The analysis and conclusions are those of the authors and do not indicate concurrence by FAO. ESA Working Papers represent work in progress and are circulated for discussion and comment. Views and opinions expressed here are those of the authors, and do not represent official positions of the Food and Agriculture Organization of the United Nations (FAO). The designations employed and the presentation of material in this information product do not imply the expression of any opinion whatsoever on the part of FAO concerning the legal status of any country, territory, city or area or of its authorities, or concerning the delimitation of its frontiers or boundaries.
1 This paper is based on background research in support of the preparation of FAO’s The State of Food and Agriculture 2010-11: Women in agriculture: Closing the gender gap for development. The forthcoming report aims to increase understanding of the diversity of women’s roles in agriculture, the constraints women face as farmers and rural labourers, the costs of these constraints in terms of agricultural productivity and broader measures of social welfare, and the effectiveness of innovative policies and interventions aimed at promoting the productivity of women in agricultural and rural activities. The report is to be released on March 7 2011 and will be available at http://www.fao.org/publications/sofa/en/. 2 The Sofa team was lead by Terri Raney and included Gustavo Anríquez, Andre Croppenstedt, Stefano Gerosa, Sarah Lowder, Ira Matuscke and Jakob Skoet

2
Introduction
The international development community has recognized that agriculture is an engine of
growth and poverty reduction in countries where it is the main occupation of the poor.3
Women make essential contributions to the agricultural and rural economies in all developing
countries. Their roles vary considerably between and within regions and are changing rapidly
in many parts of the world, where economic and social forces are transforming the
agricultural sector. Rural women often manage complex households and pursue multiple
livelihood strategies. Their activities typically include producing agricultural crops, tending
animals, processing and preparing food, working for wages in agricultural or other rural
enterprises, collecting fuel and water, engaging in trade and marketing, caring for family
members and maintaining their homes. Many of these activities are not defined as
“economically active employment” in national accounts but they are essential to the well-
being of rural households. This paper contributes to the gender debate in agriculture by
assessing the empirical evidence in three areas that has received much attention in the
literature:
But
the agricultural sector in many developing countries is underperforming, in part because
women, who represent a crucial resource in agriculture and the rural economy through their
roles as farmers, labourers and entrepreneurs, almost everywhere face more severe constraints
than men in access to productive resources. Efforts by national governments and the
international community to achieve their goals for agricultural development, economic growth
and food security will be strengthened and accelerated if they build on the contributions that
women make and take steps to alleviate these constraints.
• How much of the agricultural labour in the developing world is performed by women?
• What share of the world’s food is produced by women?
• Do women face discrimination in rural labour markets?
What women do in agriculture and rural employment
Women make important contributions to the agricultural and rural economies of all regions of
the world. However, the exact contribution both in terms of magnitude and of its nature is 3 The 2008 World Development Report presented compelling empirical evidence from a wide range of countries that supports this finding (World Bank, 2007).

3
often difficult to assess and shows a high degree of variation across countries and regions.
This paper presents an overview of the evidence on the roles of women in agriculture and in
rural labour markets. It also looks at demographic trends in rural areas with regard to the
gender composition of rural populations.
Women in the agricultural labour force4
Two types of data can contribute to measuring the contribution of women in the agricultural
labour force: statistics on the share of women in the economically active population in
agriculture and time use surveys, which document the time spent by men and women in
different activities.
Economically active population in agriculture
Data on the economically active population in agriculture are available for many countries,
and provide the most comprehensive measure of the participation of women in agriculture. In
this measure, an individual is reported as being in the agricultural labour force if he or she
reports that agriculture is his or her main economic activity. However, these data may
underestimate female participation in agriculture for reasons discussed below, and caution is
advised in interpreting changes over time because improvements in data collection may be
responsible for some of the observed changes.
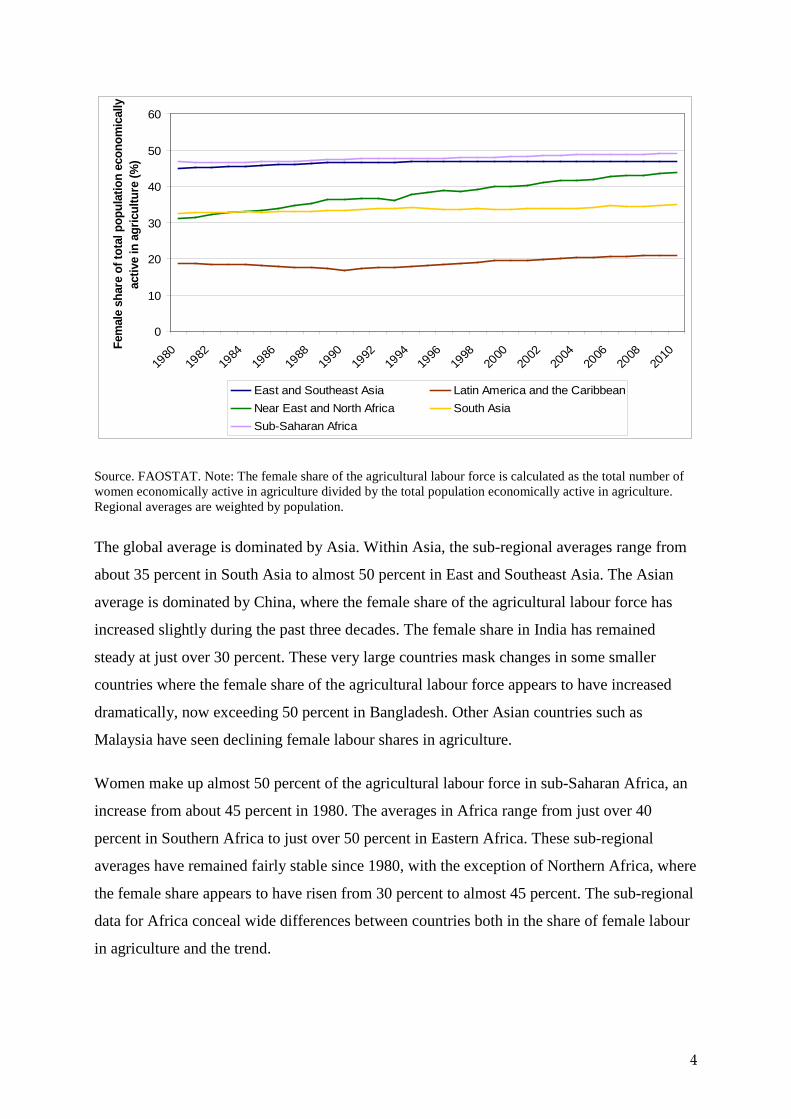
Figure 1 reports weighted averages for the share of women in the agricultural labour force (or
economically active in agriculture) in 5 major regions of the world. According to these data,
women comprise just over 40 percent of the agricultural labour force in the developing world,
a figure that has risen slightly since 1980 and ranges from about 20 percent in the Americas to
almost 50 percent in Africa. Even considering these data as lower bounds for the participation
of women in the agricultural labour force, they do not support estimates above 60 percent
except for a few countries.
Figure 1 Female share of the agricultural labour force
4 The terms “economically active in agriculture” and “agricultural labour force” are identical concepts. This concept is broader than employment in agriculture because it includes those unemployed but looking for work in the sector.
4
0
10
20
30
40
50
60
1980
1982
1984
1986
1988
1990
1992
1994
1996
1998
2000
2002
2004
2006
2008
2010
Fem
ale
shar
e of
tota
l pop
ulat
ion
econ
omic
ally
ac
tive
in a
gric
ultu
re (%
)
East and Southeast Asia Latin America and the CaribbeanNear East and North Africa South AsiaSub-Saharan Africa
Source. FAOSTAT. Note: The female share of the agricultural labour force is calculated as the total number of women economically active in agriculture divided by the total population economically active in agriculture. Regional averages are weighted by population.
The global average is dominated by Asia. Within Asia, the sub-regional averages range from
about 35 percent in South Asia to almost 50 percent in East and Southeast Asia. The Asian
average is dominated by China, where the female share of the agricultural labour force has
increased slightly during the past three decades. The female share in India has remained
steady at just over 30 percent. These very large countries mask changes in some smaller
countries where the female share of the agricultural labour force appears to have increased
dramatically, now exceeding 50 percent in Bangladesh. Other Asian countries such as
Malaysia have seen declining female labour shares in agriculture.
Women make up almost 50 percent of the agricultural labour force in sub-Saharan Africa, an
increase from about 45 percent in 1980. The averages in Africa range from just over 40
percent in Southern Africa to just over 50 percent in Eastern Africa. These sub-regional
averages have remained fairly stable since 1980, with the exception of Northern Africa, where
the female share appears to have risen from 30 percent to almost 45 percent. The sub-regional
data for Africa conceal wide differences between countries both in the share of female labour
in agriculture and the trend.

5
The developing countries of the Americas have much lower average female agricultural
labour shares than the other developing country regions at just over 20 percent in 2010,
slightly higher than in 1980. The South American countries of Bolivia, Brazil, Colombia,
Ecuador and Peru dominate the average and are responsible for most of the rising trend.
--------------------------------------------------------------------------------------------------------
Box 1: Do women make up 60-80 percent of the agricultural labour force?
The statement is often seen that women constitute 60 to 80 percent of the agricultural labour force in developing countries. This statistic seems to have originated in an early study from the United Nations Economic Commission for Africa which states: “Few persons would argue against the estimate that women are responsible for 60-80 percent of the agricultural labour supplied on the continent of Africa….” (UNECA, 1972). A decade later, a number of country statements in a report from the Food and Agriculture Organization reported that women constitute between 70 and 90 percent of the agricultural labour force in many sub-Saharan African countries (FAO, 1984). Similar statements are still being made today for all developing countries (Action Aid; Gates Foundation fact sheet). Although the available data show that women play a significant – although highly varying - role in the agricultural labour force, the estimates reported above do not represent current conditions in the group of developing countries as a whole.
-------------------------------------------------------------------------------------------------------------------
Figure 2 shows that agriculture is, relative to manufacturing and services, the most important
source of employment for women by a wide margin in South Asia and in sub-Saharan Africa.
It is also the most important sector for women in East Asia and South-East Asia but nearly
equally so with services. Agriculture is much more important for women than for men in
terms of employment in South Asia and the Middle East. It is somewhat more important for
women than for men in East Asia, North Africa and sub-Saharan Africa. In Central and South
Eastern Europe and in Latin America women are much more concentrated in the service
sector. The figure shows that both the level of employment and the distribution of
employment in different sectors vary substantially across regions. However there is always a
significant gap between the level of male and female employment and for women the service
and/or agriculture sectors are relatively more important than the manufacturing sector.

6
Figure 2 Employment by sector, region and gender
2a Employed population as a share of total adult population, by sex and sector
0%10%
20%30%40%
50%60%70%
80%90%
Mal
es
Fem
ales
Mal
es
Fem
ales
Mal
es
Fem
ales
Mal
es
Fem
ales
Mal
es
Fem
ales
Mal
es
Fem
ales
Developingcountries
Sub-SaharanAfrica
Latin Americaand the
Caribbean
East andSoutheast
Asia
Near East andNorth Africa
South Asia
% o
f tot
al m
ale
and
fem
ale
popu
latio
n, r
espe
ctiv
ely
Agriculture Industry Services
2b Distribution of Male and Female Employment, by Sector
0%10%20%30%40%50%60%70%80%90%
100%
Mal
es
Fem
ales
Mal
es
Fem
ales
Mal
es
Fem
ales
Mal
es
Fem
ales
Mal
es
Fem
ales
Mal
es
Fem
ales
Developingcountries
Sub-SaharanAfrica
Latin Americaand the
Caribbean
East andSoutheast
Asia
Near East andNorth Africa
South Asia
% o
f mal
e an
d fe
mal
e em
ploy
men
t, re
spec
tivel
y
Agriculture Industry Services
Note: The ILO, KILM data covers only a subset of the countries in each region. Definitions of adult labour force differ by country, but usually refers to the population aged 15 and above. Source: ILO, Key Indicators of the Labour Market (KILM, 6th Edition).

7
Many researchers have questioned the gender patterns that emerge from the employment data
presented here and above (see for example Beneria, 1981). Deere (2005) identifies a number
of potential sources of underestimation of female employment in labour markets, and in
agriculture in particular. She notes that rural women in Latin America are likely to reply that
“their home” is their primary responsibility, even if they are heavily engaged in agriculture.
Other difficulties arise because censuses tend to emphasize income-generating activities -
therefore underestimating subsistence production - and because agricultural production is
often defined as fieldwork. Activities such as rearing small livestock, kitchen gardening, and
post-harvest processing are often undercounted. Deere focuses on critiquing the numbers for
Latin America, but similar criticisms are also valid for other regions, like South Asia.
Time spent in agricultural activities
Time use surveys attempt to provide a more complete account of time use by men and women
than are available from the labour force statistics reported above. Such studies usually are not
nationally representative and are not directly comparable because they usually cover small
samples, report on different types of activities (that are not always clearly specified) and use
different methodologies. Despite these caveats, a summary of the evidence from studies
which specify time use by agricultural activity suggests interesting patterns.
Time-use surveys that cover all agricultural activities (Figure 3) reveal considerable variation
across countries, and sometimes within countries, but the data are broadly similar to the
labour force statistics discussed above. In Africa, estimates of the time contribution of women
to agricultural activities ranges from about 30 percent in The Gambia to 60-80 percent in
different parts of Cameroon. In Asia, estimates range from 32 percent in India to over 50
percent in China. The range is lower in Latin America, but exceeds 30 percent in some parts
of Peru. Two separate studies are reported each for Zambia and Peru, and differences reflect
different time periods and locations within the countries.

8
Figure 3 Proportion of labour in all agricultural activities that is supplied by women
0%
10%
20%
30%
40%
50%
60%
70%
80%
90%
The G
ambia
Tanz
ania
Burki
na F
aso
Nige
ria
Zamb
ia (1)
Zamb
ia (2)
Came
roon (
Cente
r-Sou
th)
Came
roon
(Yas
ssa o
f Cam
po,
Came
roon
(Mva
e of C
ampo
,
Nige
r
Togo
Ghan
a
India/
Wes
t Ben
gal
India
India/
Rajas
than
Nepa
l
China
Peru
(1)
Peru
(2)
AfricaAfricaAfricaAfricaAfricaAfricaAfricaAfricaAfricaAfricaAfricaAfrica Asia Asia Asia Asia Asia Lat.Am.
Lat.Am.
Countries/Regions
Perc
ent o
f labo
ur su
pplie
d by w
omen
Sources and notes: Only the survey for India is nationally representative. Sources (from left to right): The Gambia: von Braun and Webb (1989); Tanzania: Fontana and Natali (2008); Burkina Faso: Saito, Mekonnen and Spurling (1994); Nigeria: Rahji and Falusi (2005); Zambia (1): Saito, Mekonnen and Spurling (1994); Zambia (2): Kumar (1994); Cameroon (Center-South): Leplaideur (1978), cited by Charmes (2006): Cameroon (Yasssa of Campo, Southwest): Charmes (2006) based on Pasquet and Koppert (1993 and 1996); Cameroon (Mvae of Campo, Southwest): Charmes (2006) based on Pasquet and Koppert (1993 and 1996); Niger: Baanante, Thompson and Acheampong (1999); Togo: Baanante, Thompson and Acheampong (1999); Ghana: Baananate, Thompson and Acheampong (1999); India (West Bengal): Jain (1996); India: Singh and Sengupta (2009); India (Rajasthan): Jain (1996); Nepal: Joshi (2000); China: De Brauw et al (2008); Peru (1): Deere (1982); Peru (2): Jacoby (1992)
A striking degree of within-country variation is shown by time-use data for India. While the
nationally representative data indicates that the national average for women’s share of total
time-use in agriculture is 32 percent, data for West Bengal and Rajasthan reports women’s
share as from less than 10 percent to more than 40 percent, respectively.5
5 We note that the difference between Rajasthan and West Bengal could be due to a difference in the total number of hours provided by women or due to a difference in the total number of hours provided by men.
But in both areas,
younger women contribute a higher share of the total time provided in agriculture by their age
group than older women do in theirs (Figure 4). In Rajasthan, for example, girls between 14
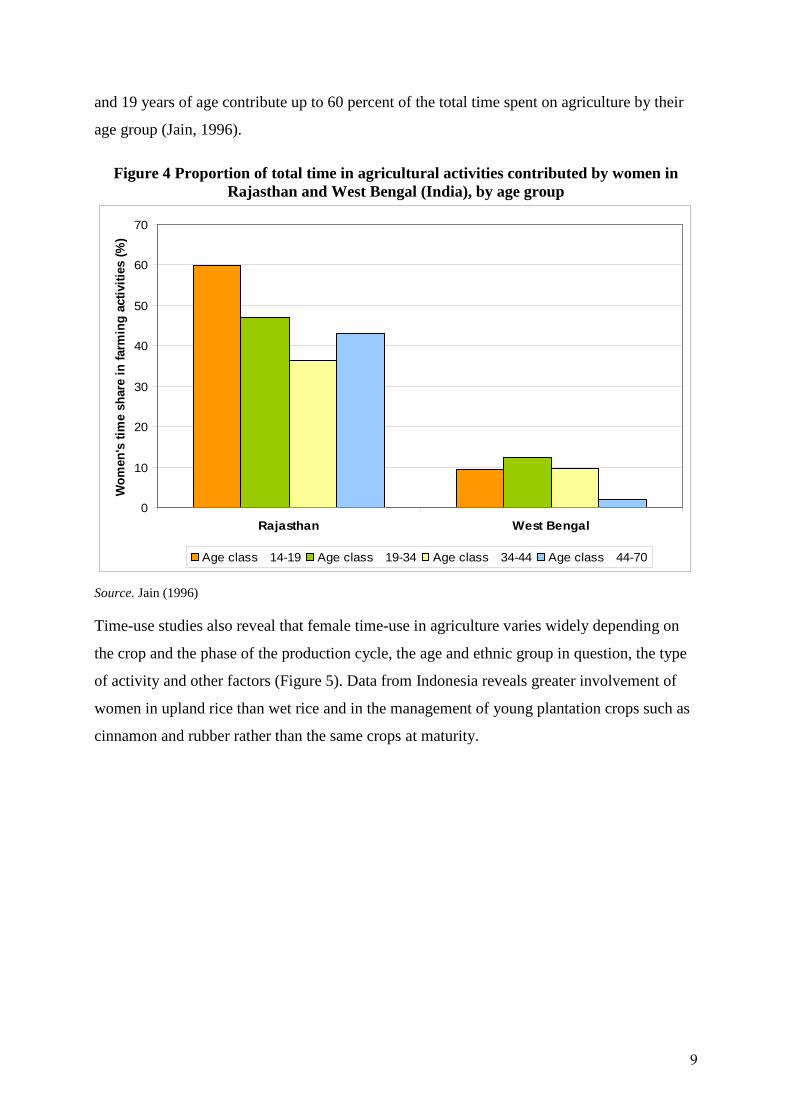
9
and 19 years of age contribute up to 60 percent of the total time spent on agriculture by their
age group (Jain, 1996).
Figure 4 Proportion of total time in agricultural activities contributed by women in Rajasthan and West Bengal (India), by age group
0
10
20
30
40
50
60
70
Rajasthan West Bengal
Wom
en's
tim
e sh
are
in fa
rmin
g ac
tiviti
es (%
)
Age class 14-19 Age class 19-34 Age class 34-44 Age class 44-70
Source. Jain (1996)
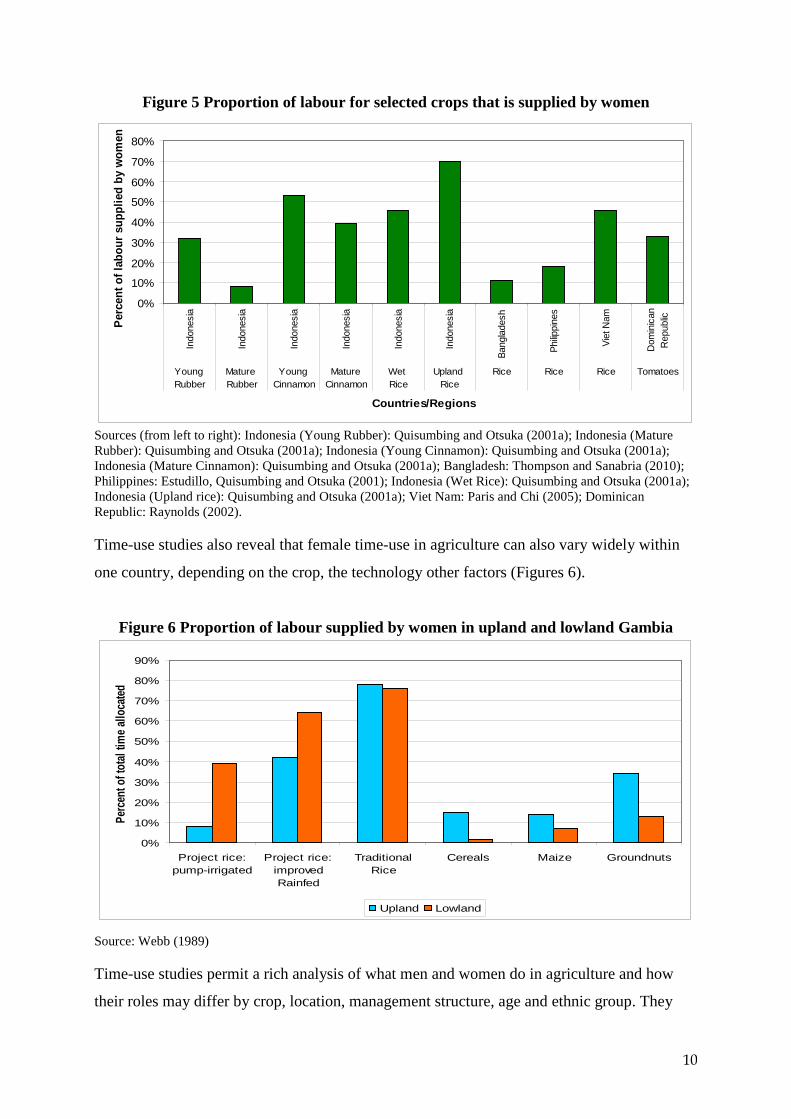
Time-use studies also reveal that female time-use in agriculture varies widely depending on
the crop and the phase of the production cycle, the age and ethnic group in question, the type
of activity and other factors (Figure 5). Data from Indonesia reveals greater involvement of
women in upland rice than wet rice and in the management of young plantation crops such as
cinnamon and rubber rather than the same crops at maturity.
10
Figure 5 Proportion of labour for selected crops that is supplied by women
0%
10%
20%
30%
40%
50%
60%
70%
80%
Indo
nesi
a
Indo
nesi
a
Indo
nesi
a
Indo
nesi
a
Indo
nesi
a
Indo
nesi
a
Bang
lade
sh
Philip
pine
s
Viet
Nam
Dom
inic
anR
epub
lic
Young Rubber
Mature Rubber
Young Cinnamon
Mature Cinnamon
Wet Rice
Upland Rice
Rice Rice Rice Tomatoes
Countries/Regions
Perc
ent o
f lab
our s
uppl
ied
by w
omen
Sources (from left to right): Indonesia (Young Rubber): Quisumbing and Otsuka (2001a); Indonesia (Mature Rubber): Quisumbing and Otsuka (2001a); Indonesia (Young Cinnamon): Quisumbing and Otsuka (2001a); Indonesia (Mature Cinnamon): Quisumbing and Otsuka (2001a); Bangladesh: Thompson and Sanabria (2010); Philippines: Estudillo, Quisumbing and Otsuka (2001); Indonesia (Wet Rice): Quisumbing and Otsuka (2001a); Indonesia (Upland rice): Quisumbing and Otsuka (2001a); Viet Nam: Paris and Chi (2005); Dominican Republic: Raynolds (2002).
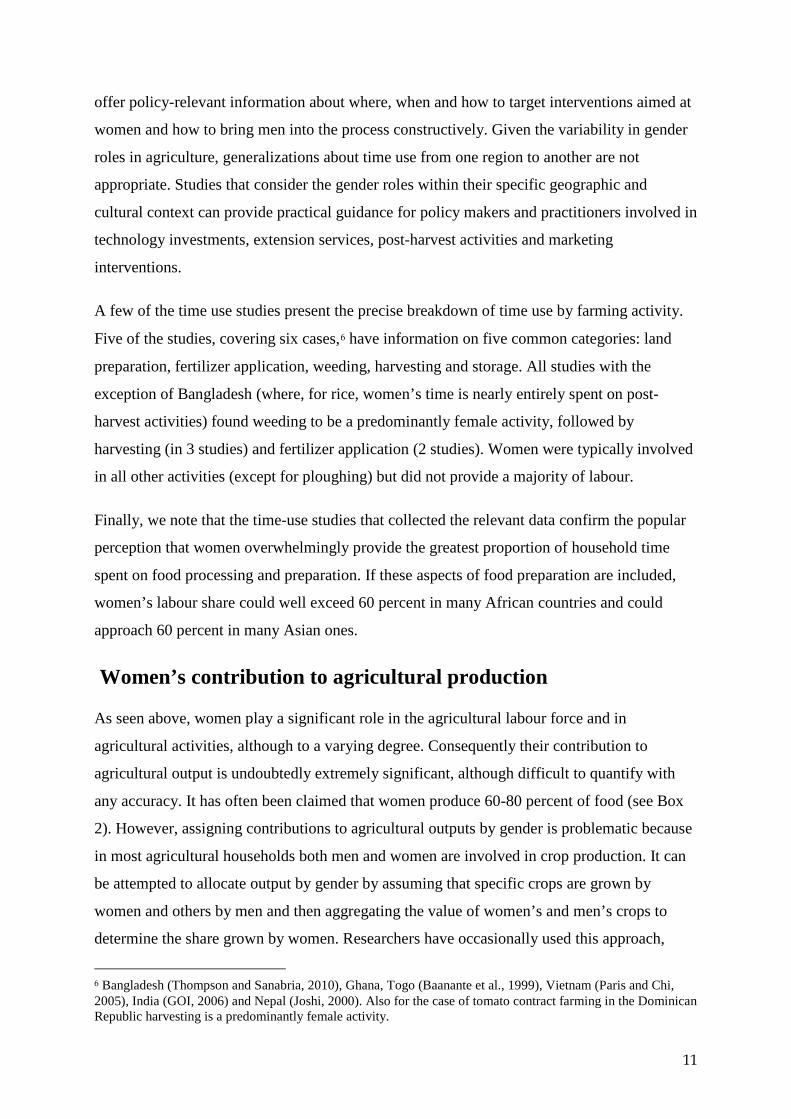
Time-use studies also reveal that female time-use in agriculture can also vary widely within
one country, depending on the crop, the technology other factors (Figures 6).
Figure 6 Proportion of labour supplied by women in upland and lowland Gambia
0%
10%
20%
30%
40%
50%
60%
70%
80%
90%
Project rice:pump-irrigated
Project rice:improvedRainfed
TraditionalRice
Cereals Maize Groundnuts
Perc
ent o
f tot
al tim
e allo
cated
Upland Lowland
Source: Webb (1989)
Time-use studies permit a rich analysis of what men and women do in agriculture and how
their roles may differ by crop, location, management structure, age and ethnic group. They
11
offer policy-relevant information about where, when and how to target interventions aimed at
women and how to bring men into the process constructively. Given the variability in gender
roles in agriculture, generalizations about time use from one region to another are not
appropriate. Studies that consider the gender roles within their specific geographic and
cultural context can provide practical guidance for policy makers and practitioners involved in
technology investments, extension services, post-harvest activities and marketing
interventions.
A few of the time use studies present the precise breakdown of time use by farming activity.
Five of the studies, covering six cases,6
Finally, we note that the time-use studies that collected the relevant data confirm the popular
perception that women overwhelmingly provide the greatest proportion of household time
spent on food processing and preparation. If these aspects of food preparation are included,
women’s labour share could well exceed 60 percent in many African countries and could
approach 60 percent in many Asian ones.
have information on five common categories: land
preparation, fertilizer application, weeding, harvesting and storage. All studies with the
exception of Bangladesh (where, for rice, women’s time is nearly entirely spent on post-
harvest activities) found weeding to be a predominantly female activity, followed by
harvesting (in 3 studies) and fertilizer application (2 studies). Women were typically involved
in all other activities (except for ploughing) but did not provide a majority of labour.
Women’s contribution to agricultural production
As seen above, women play a significant role in the agricultural labour force and in
agricultural activities, although to a varying degree. Consequently their contribution to
agricultural output is undoubtedly extremely significant, although difficult to quantify with
any accuracy. It has often been claimed that women produce 60-80 percent of food (see Box
2). However, assigning contributions to agricultural outputs by gender is problematic because
in most agricultural households both men and women are involved in crop production. It can
be attempted to allocate output by gender by assuming that specific crops are grown by
women and others by men and then aggregating the value of women’s and men’s crops to
determine the share grown by women. Researchers have occasionally used this approach,
6 Bangladesh (Thompson and Sanabria, 2010), Ghana, Togo (Baanante et al., 1999), Vietnam (Paris and Chi, 2005), India (GOI, 2006) and Nepal (Joshi, 2000). Also for the case of tomato contract farming in the Dominican Republic harvesting is a predominantly female activity.

12
especially in West Africa, where there are distinguishable cropping patterns by gender
(Hoddinott and Haddad, 1995; Duflo and Udry, 2001). Yet, a careful analysis of agriculture in
Ghana finds that while there are gendered patterns of cropping, the distinctions between
men’s and women’s crops do not hold up well enough to use them to make inferences about
men’s and women’s relative contribution to production. In addition, gendered patterns of
cropping may change over time (Doss, 2002).
A direct comparison of production is possible between male- and female-headed households,
but since the latter tend to have smaller farms and use fewer purchased inputs (see Chapter 3),
their output is naturally smaller. Table 1 presents a limited sample from a selected set of
countries for which data is available (Doss, 2009). Female-headed households represent
between 3 and 38 percent of all households and produce between 2 and 17 percent of the
value of food produced. These data suggest that female-headed households produce less than
their share would predict if resource use and productivity were equal with male-headed
households.
Table 1 Share of crops produced by female-headed household (FHH). Country % of rural households
headed by women % of total value of food
produced by rural FHHs China 3.1 2.1 Bosnia-Herzegovina 25 13.2 Ghana 33 12 Nicaragua 38 17
Source Calculated by author from data reported in DeBrauw et al, (2008) and from the Bosnia and Herzegovina Living Standards Measurement Study (LSMS) survey, the Nicaraguan Programa para el Mejoramiento de las Encuestasy la Medición de Condiciones de Vida (MECOVI) survey and Ghana Living Standards Survey (GLSS).
-------------------------------------------------------------------------------------------------------------
Box 2 Women’s contribution to food production.
The claim is often heard that women produce 60 to 80 percent of food in most developing countries and half of the world’s food supply (Momsen, 1991; Mehra and Rojas, 2008). Sometimes the statement is qualified in various ways, specifying that it refers to local food production or a particular geographic region, and it is often phrased poetically: “… in developing countries, between 60 and 80 percent of food crops grow from seeds that are planted by a woman’s hand…” (Gupta, 2009). These sources do not explain the methodology used in arriving at the estimate, although it may be have been derived from the estimates of the labour contribution discussed in Box 1. A rare sceptic notes: “It is interesting that this statement is so enduring, so effective—and so wrong…” Jackson (2005).
Doss (2009) provides a detailed analysis of the conceptual and empirical challenges involved in estimating the share of food produced by women. Challenges include, among others, (i) defining and
13
measuring food production, (ii) defining the resources to be included in the calculation and (iii) designating those resources according to the gender of the person who controls them. A summary of the available evidence, using a variety of definitions and methodologies, finds that the contribution of women in agriculture is probably substantial but cannot be estimated with any degree of analytical rigor. It is unlikely to approach the levels so frequently cited.
Food production can be defined in many different ways: primary crop production, food crop production, crop and livestock production, food processing and preparation, etc. It can be measured by weight, value, caloric content, etc. Each definition and metric gives a different picture of the contribution of women. Furthermore, food production requires a combination of different capital assets, including labour, land and finance, as well as intermediate goods and services, such as animal and mechanical power, seeds, fertilizer and water. A simple comparison is often made between the amount of time men and women work in agricultural production, yet in order to understand the contribution women make to food production it is necessary to consider a more complete range of inputs. Determining the gender of the person who controls these resources is far from simple: if a crop is grown on land owned by an extended family, ploughed by a man, planted by a woman, weeded by their children and harvested collectively, what share can be attributed to the woman?
----------------------------------------------------------------------------------------------------------------
In reality in most situations the question of women’s contribution to agricultural and food
production cannot be answered with any degree of accuracy. Women do not usually produce
food separately from men. Most food is produced with labour contributions of both men and
women in a collaborative process. Quantifying the share of food produced by women involves
making arbitrary assumptions about gender roles in the production process, which are not
likely to hold universally. For example, if men typically provide the labour to clear the field
and women plant and weed the crops, both men and women are involved in harvesting. In
these and other similar cases it becomes impossible to separate output by gender.
Nonetheless, all the indirect evidence presented above in terms of labour participation and
output by varying definitions of gender indicates that it is unlikely that women produce as
much as 60 to 80 percent of the food in developing countries. Women play a fundamental role
in all the stages of the food cycle in all regions, but these roles differ by region. Taking
account of the heterogeneity of their contribution is essential if policies and interventions are
to be effective.
Women as livestock keepers7
Within pastoralist and mixed farming systems, livestock play an important role in supporting
women and in improving their financial situation, and women are heavily engaged in the
sector. An estimated two-thirds of poor livestock keepers, totalling approximately 400 million
7 The material in this section was prepared by FAO’s Animal Production and Health Division.

14
people, are women (Thornton et al, 2002). They share responsibility with men and children
for the care of animals, and particular species and types of activity are more associated with
women than men. For example, women often have a prominent role in managing poultry
(FAO 1998; Guèye 2000; Tung 2005) and dairy animals (Okali and Mims 1998; Tangka,
Jabbar and Shapiro, 2000) and in caring for other animals that are housed and fed within the
homestead. When tasks are divided, men are more likely to be involved in constructing
housing and herding of grazing animals, and in marketing of products if women's mobility is
constrained. The influence of women is strong in the use of eggs, milk and poultry meat for
home consumption and they often have control over marketing and the income from these
products. Perhaps for this reason poultry and small scale dairy projects have been popular
investments for development projects aiming to improve the lot of rural women. In some
countries small-scale pig production is also dominated by women. Female-headed households
are as successful as male-headed households in generating income from their animals,
although they tend to own smaller numbers of animals, probably because of labour
constraints. Ownership of livestock is particularly attractive to women in societies where
access to land is restricted to men (Bravo-Baumann 2000).
While the role of women in small-scale livestock production is well recognized, much less has
been documented about the engagement of women in intensive production and the market
chains associated with large commercial enterprises. Demand for livestock products has
grown much faster than the demand for crop staples during the past 40 years, fuelled by rising
incomes, particularly in Asia and Latin America, and this trend is expected to continue. While
pastoralist and small scale mixed farming systems continue to be important in meeting the
needs of rural consumers, the demands of growing urban populations are increasingly
supplied with meat, milk and eggs from intensive commercial systems. This has important
implications for the engagement of women in the livestock sector because of the different
roles, responsibilities and access to resources that are evident within different scales of
production system and at different points on the production and marketing chain.
The available evidence suggests that the role of women in meeting these changing demands
may diminish, for two reasons. The first is that when livestock enterprises scale up, the
control of decisions and income and sometimes of the entire enterprise often shifts to men.
This is not a universal phenomenon – for example, in Viet Nam, many medium-sized duck-
breeding enterprises are managed by women – but it is common and can be explained by the
limited access that women have to land and credit. The second important factor is that all
15
smallholders face challenges when the livestock sector intensifies and concentrates and many
go out of business. This is particularly evident for pig and poultry owners (Rola et al. 2006)
but not confined to those species. Given the more limited ability of women to start their own
businesses, this implies that they will tend to become employees rather than self-employed. In
specialised activities like production of day-old chicks, in the provision of services, and in
slaughtering, processing and retail, women are visible wherever painstaking semi-skilled
work is to be done, but very little information is available about the extent of their
involvement compared to that of men, or their control over resources.
Women in fisheries and aquaculture8
In 2008, nearly 45 million people world-wide were directly engaged, full-time or part-time, in
the fishery primary sector (FAO fishery database). In addition, about 135 million people are
estimated to be employed in the secondary sector, including post-harvest activities. While
comprehensive data are not available on a sex-disaggregated basis, case studies suggest that
women may comprise up to 30 percent of the total employment in fisheries, including primary
and secondary activities.
Information provided to FAO from 86 countries indicates that in 2008, 5.4 million women
worked as fishers and fish farmers in the primary sector.9
Women have rarely engaged in commercial offshore and long distance capture fisheries
because of the vigorous work involved but also because of women’s domestic responsibilities
and/or social norms. Women are more commonly occupied in subsistence and commercial
fishing from small boats and canoes in coastal or inland waters. Women also contribute as
entrepreneurs and provide labour before, during and after the catch in both artisanal and
commercial fisheries. For example, in West Africa, the so called “Fish Mamas” play a major
role. They usually own capital and are directly and vigorously involved in the coordination of
the fisheries chain, from production to sale of fish.
This represents 12 percent of the
total. In two major producing countries, China and India, women represented a share of 21
percent and 24 percent, respectively, of all fishers and fish farmers.
8 The material in this section was prepared by FAO’s Fisheries and Aquaculture Division. 9 FAO Fisheries and Aquaculture Department regularly collects employment statistics in fisheries and aquaculture only related to the primary sector, therefore excluding post harvest activities.

16
Studies of women in aquaculture, especially in Asia where aquaculture has a long tradition,
indicate that the contribution of women in labour is often greater than men’s although there is
almost a complete absence of macro-level aquaculture-related sex- disaggregated data.
Women are reported to constitute 33 percent of the rural aquaculture workforce in China, 42
percent in Indonesia and 80 percent in Viet Nam (Kusabe and Kelker, 2001).
The most significant role played by women in both artisanal and industrial fisheries is at the
processing and marketing stages, where they are very active in all regions. In some countries,
women have become important entrepreneurs in fish processing; in fact, most fish processing
is performed by women, either in their own household-level industries or as wage labourers in
the large-scale processing industry.
Female participation in rural labour markets
Women and unpaid household responsibilities
Women are generally less able than men to participate in economic opportunities because they
face a work burden that men do not. In most societies, women are responsible for most of the
household and child-rearing activities as well rearing of small livestock, although norms differ
by culture and over time. This additional work burden is unpaid and limits women’s capacity
to engage in income-earning activities, which often require a minimum fixed time before
being profitable. Furthermore, the nature of tasks, such as caring for children and elderly
household members, requires women to stay near the home, thus limiting options to work for
a wage. Time scarcity forces many women to start-up cottage industries, such as handicrafts,
which are often characterized by low returns and limited potential for expansion (Lanjouw
and Lanjouw, 2001).10
Gender differences become clearer when looking at women’s workloads. It is estimated that
women provide 85 to 90 percent of the time spent on household food processing and
preparation across a wide range of countries (Fontana and Natalia, 2008; Jain, 1996; Acharya
and Bennett, 1982; Wrangham, 2009). Women are also usually responsible for child care and
household chores. Depending on the household structure and size, these tasks may be
extremely time intensive. Time-allocation studies have shown that women work significantly
10 As household chores are generally regarded as female tasks, the current opportunity cost of girls’ schooling time is higher compared to boys, provided that boys do not help out on the farm.
17
more than men if care giving is included in the calculations. (Ilahi, 2000; Kes and
Swaminathan, 2006; Budlender, 2008). Sharma et al (2007) find that girls do significantly
more work in household chores and on the farm as compared to boys in Himachal Pradesh,
India.
Ghanaian women carry a much heavier burden for household chores despite working outside
the home almost as much as men (Brown, 1994). In Uganda, Ellis et al (2006) report that
women, when asked about the causes of labour constraints, cited the time they spent looking
after their families, working in their husbands’ gardens and producing food for their
households as reasons for their inability to expand production in the market. Men, on the
other hand, simply noted that they had no money to hire labour.
Fontana and Natali (2008) find a marked gender bias in most unpaid work in Tanzania.
Women, and in particular women from low-income groups and living in areas with limited
facilities, spend long hours on water and fuel collection, food preparation and other domestic
and child care activities to compensate for poor infrastructure. Malmberg-Calvo’s (1994)
study of household surveys from Ghana, Tanzania and Zambia, shows that women (and
daughters) are responsible for about 65 percent of all transport activities in rural households,
including travel for firewood, water and transport to the grinding mill.
Due to the gender-specific assignment of tasks, any changes affecting the family or the
environment often have different implications for men and women. HIV/AIDS, for example,
has caused a significant increase in the time needed to care for sick family members or the
orphaned children of relatives (Addati and Cassirer, 2008). Deforestation leads women to
collect firewood from increasingly further distances from the homestead (Kumar and
Hotchkiss 1988, Nankhuni 2004). Fontana and Natali (2008) calculate that time-savings from
unpaid-work reducing infrastructure for water collection and food preparation as equivalent to
466 thousand and 4,590 thousand full-time jobs, respectively.
Gender differences within rural labour markets
In addition to differences in male and female labour participation rates noted earlier, there are
also major gender differences in employment patterns within labour markets for several
reasons which hold across cultures and regions. Most importantly, as a result of household
and child-rearing, women are not only much less likely to participate in the labour force, those
who do are also much more likely to engaged in self-employment activities rather than
18
higher-paying wage employment. Due to child care responsibilities economically active
women often leave the labour market and thus accumulate less work experience. As a result
of time constraints women are also more likely to work in part time jobs and in informal
arrangements that pay less and/or provide fewer benefits, but provide more flexibility.
Women are also more concentrated in certain phases or activities of the supply chain (e.g.
packaging, post-processing). Occupational segregation into low-technology occupations
limits the opportunities to generate new skills and capabilities, thus hindering future
professional development and reinforcing the discrimination towards these sectors as low-pay
and low-status occupations. Finally, there is a well documented pay gap in urban labour
markets - likely to exist in rural labour markets as well – in that women are paid less even for
equivalent jobs and comparable levels of education and experience. Wage gaps between men
and women are further discussed below.
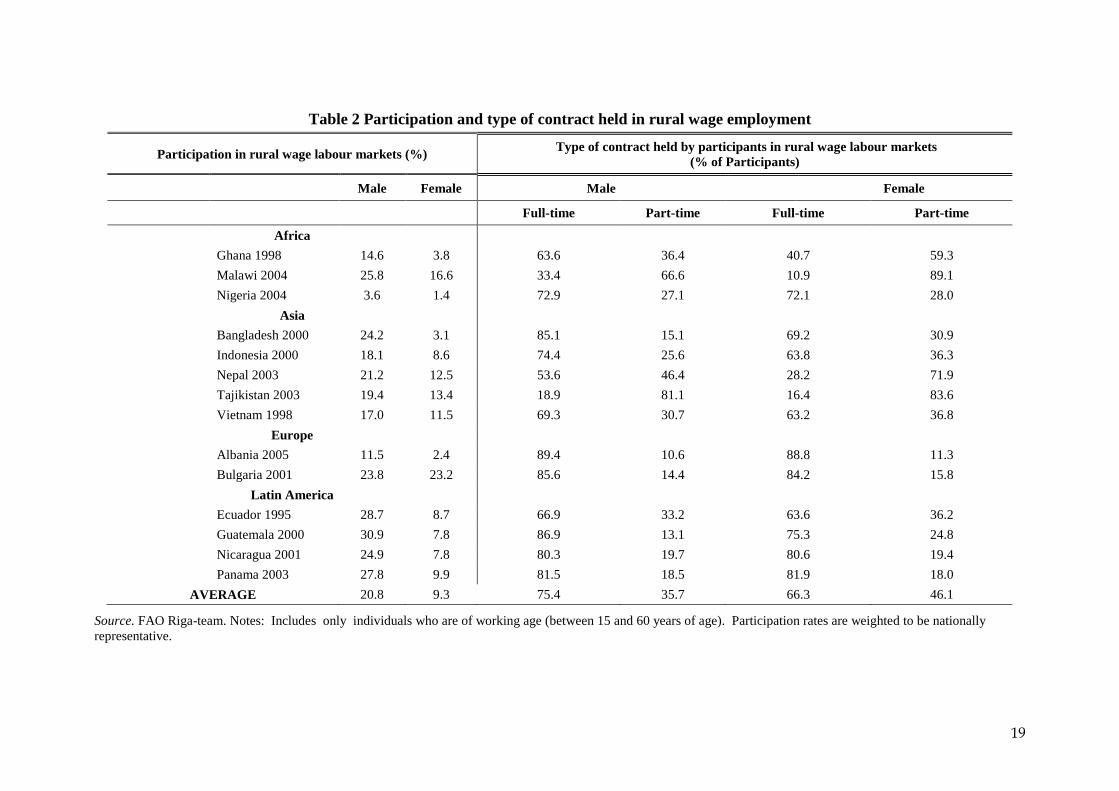
Table 2 illustrates gender differences in participation in full-time and part-time wage
employment for selected countries from the RIGA database11
The two columns on the left
show the previously discussed difference in participation rates; in all of the fourteen countries
female participation in rural wage labour markets is lower. The remaining part of the table
shows how women who participate in salaried labour markets (with the exception of
Nicaragua and Panama in this sample) also tend to be found more frequently in part-time jobs
than men. Additionally (but not shown in the table), in all eleven countries where the surveys
allowed for the distinction to be made, a larger proportion of female than male employment is
found in seasonal jobs rather then usually better paid year-round jobs which also tend to
include additional non-salary benefits.
11 The Rural Income Generating Activities (RIGA) is a FAO project that has created an internationally comparable database of rural household income sources from existing household living standards surveys for more than 27 countries. Most of the surveys used by the RIGA project were developed by national statistical offices in conjunction the World Bank as part of its Living Standards Measurement Study (LSMS). For more information see HTTP://WWW.FAO.ORG/ES/ESA/RIGA/ENGLISH/INDEX_EN.HTM.
19
Table 2 Participation and type of contract held in rural wage employment
Participation in rural wage labour markets (%) Type of contract held by participants in rural wage labour markets (% of Participants)
Male Female Male Female
Full-time Part-time Full-time Part-time
Africa
Ghana 1998 14.6 3.8 63.6 36.4 40.7 59.3
Malawi 2004 25.8 16.6 33.4 66.6 10.9 89.1
Nigeria 2004 3.6 1.4 72.9 27.1 72.1 28.0 Asia
Bangladesh 2000 24.2 3.1 85.1 15.1 69.2 30.9
Indonesia 2000 18.1 8.6 74.4 25.6 63.8 36.3
Nepal 2003 21.2 12.5 53.6 46.4 28.2 71.9
Tajikistan 2003 19.4 13.4 18.9 81.1 16.4 83.6
Vietnam 1998 17.0 11.5 69.3 30.7 63.2 36.8 Europe
Albania 2005 11.5 2.4 89.4 10.6 88.8 11.3
Bulgaria 2001 23.8 23.2 85.6 14.4 84.2 15.8 Latin America
Ecuador 1995 28.7 8.7 66.9 33.2 63.6 36.2
Guatemala 2000 30.9 7.8 86.9 13.1 75.3 24.8
Nicaragua 2001 24.9 7.8 80.3 19.7 80.6 19.4
Panama 2003 27.8 9.9 81.5 18.5 81.9 18.0 AVERAGE 20.8 9.3 75.4 35.7 66.3 46.1
Source. FAO Riga-team. Notes: Includes only individuals who are of working age (between 15 and 60 years of age). Participation rates are weighted to be nationally representative.

20
Frequently women are confined to working in particular sectors and in certain jobs, often as a
result of their disadvantaged position with respect to human capital and bargaining power. On
the basis of national-level case studies in Latin America, Katz (2003) concludes that, within
the non-farm sector, wage employment is almost universally dominated by men and self-
employment by women. Furthermore, even when women find formal sector employment,
they do not easily advance into managerial positions. In Colombia’s flower-cutting industry,
for example, between 60 and 80 percent of the unskilled workers are women, while they have
a much lower share of managerial or professional jobs (Meier, 1999). Moreover, in sectors
producing primarily for the export sector – such as textiles, electronics or some food
processing industries – women tend to be replaced by males, as profits increase (Fontana,
2003).
Intra-household inequality can also weaken a woman’s position also outside of the home
(Kapadia, 1993 and 1995). Women are over-represented in jobs characterized by low wages,
high job insecurity and generally poor labour standards. When women have limited decision-
making ability within the household or low access to resources and household income, they
are more likely to accept lower wages. Kantor (2008) notes that, for most women in northern
India, labour market participation is a survival strategy for the household, not a means of
improving standards of living or voice in the household.
Evidence confirms that women tend to cluster in lower-paying jobs. Hertz et al. 2009,
explore the issue of job distribution according to pay in rural areas. They acknowledge that
non-agricultural jobs tend to pay on average more than agricultural jobs. Based on this, they
define three categories of jobs: (i) low wage jobs, which pay less than the median agricultural
wage; (ii) medium wage activities, which pay more than the median agricultural wage, but
less than the median non-agricultural wage; and (iii) high wage jobs, which pay more than the
median non-agricultural wage. Applying this categorization to data from 14 countries from
the RIGA database, reveals that in all countries, with the exception of Panama the distribution
of women tends to be skewed much more than that of men towards lower-paid jobs (see Table
3). The inequality is found in both agricultural (with the additional exception of Ghana) and
non-agricultural activities.

21
Table 3 Participation in rural wage employment by wage levels and gender
All participants in rural wage employment Participants in agricultural wage
employment Participants in non-agricultural wage
employment Males Females Males Females Males Females Low Med High Low Med High Low Med High Low Med High Low Med High Low Med High
Africa Ghana 1998 30.4 19.0 50.6 50.6 16.3 33.1 51.0 22.1 27.0 50.3 16.7 33.1 25.5 18.3 56.2 50.6 16.3 33.1 Malawi 2004 37.0 28.0 35.0 61.4 20.8 17.8 41.8 28.6 29.6 63.5 20.7 15.8 21.2 25.9 52.9 45.1 21.1 33.8 Nigeria 2004 28.7 25.6 45.7 31.7 28.7 39.6 48.1 21.8 30.1 56.2 21.1 22.8 21.5 27.1 51.5 23.2 31.4 45.4
Asia Bangladesh 2000 39.8 29.5 30.8 80.8 7.4 11.8 56.0 32.7 11.4 91.5 7.4 1.1 20.6 25.8 53.6 73.8 7.5 18.8 Indonesia 2000 32.1 20.9 47.1 54.1 16.3 29.7 43.1 21.1 35.8 64.1 16.8 19.1 25.8 20.7 53.4 46.0 15.8 38.2 Tajikistan 2003 29.0 39.0 32.0 52.7 35.4 11.9 38.8 41.1 20.1 57.1 33.7 9.2 8.8 34.6 56.6 30.8 43.7 25.5 Nepal 2003 26.9 40.1 33.0 57.1 38.7 4.1 47.2 39.8 13.0 61.4 37.7 1.0 10.0 40.4 49.6 32.1 44.8 23.1 Vietnam 1998 47.5 - 52.5 67.1 - 32.9 39.4 - 60.6 67.7 - 32.3 52.9 - 47.1 66.6 - 33.5
Europe Albania 2005 83.2 - 16.8 98.0 - 2.0 43.3 - 56.7 68.9 - 31.1 88.9 - 11.0 99.3 - 0.7 Bulgaria 2001 48.6 - 51.4 52.5 - 47.5 46.3 - 53.8 54.3 - 45.7 49.4 - 50.6 52.0 - 48.0
Latin America & the Caribbean
Ecuador 1995 38.8 26.1 35.2 60.2 17.3 22.5 54.1 26.0 19.9 72.0 18.5 9.5 19.1 26.2 54.7 53.8 16.6 29.6 Guatemala 2000 43.8 22.4 33.8 59.3 18.5 22.1 57.9 23.0 19.1 67.9 19.7 12.4 23.1 21.5 55.4 54.9 17.9 27.2 Nicaragua 2001 36.0 31.3 32.7 39.1 23.0 37.9 49.3 32.7 18.1 57.3 26.5 16.2 16.7 29.4 53.9 34.9 22.2 43.0 Panama 2003 32.3 31.6 36.1 29.7 25.5 44.9 47.6 35.2 17.3 36.0 35.6 28.4 29.2 24.8 46.0 31.8 26.7 41.5 AVERAGE 39.6 28.5 38.0 56.7 22.5 25.6 47.4 29.5 29.5 62.0 23.1 19.8 29.5 26.8 49.5 49.6 24.0 31.5
Source. FAO Riga-team. Notes: (1) Low productivity = below median agricultural wage; median productivity = between the medians of agricultural wage and non-agricultural wage; high productivity = above median non-agricultural wage (2) We do not report on Vietnam98, Albania05 and Bulgaria01's median productivity because the median of agricultural wages is higher than that of non-agricultural wages. Thus, we set the threshold at the median of agricultural wages.

22
Women also suffer from wage gaps, although data documenting this in rural settings is
limited (Tzannatos, 1999; Fontana 2009). Wage inequalities are typically due to: i)
contractual arrangements that differ for men and women, with women usually having worse
conditions of employment, and; ii) typically women receive lower wages for the same work.
Evidence from a sample of 14 countries shows that on average women are paid 28 percent
less than males in rural areas, with the notable exception of women in rural Panama that are
paid 11 percent more than men (see Table 4) (Hertz et al., 2009). These wage gaps, tend to be
higher in rural than in urban areas for half of the countries sampled. Table 4 also gives a
decomposition of the wage gap in rural areas into: a) that part that is explained by the
difference in asset endowment (education, age, years of experience, industry of employment,
etc) and; b) that part which is due to differences in payment received for those assets – an
indicator, albeit imperfect, of discrimination. The results show that the differences in asset
ownership explain a much lower fraction of the wage inequalities. It is notable that in rural
Latin America women are better endowed with assets but, with the exception of rural Panama,
are still paid less.

23
Table 4 Wage gaps in rural labour markets Country Wage gap between
men and women Part of the rural wage gap
explained by Urban Rural Assets and
attributes “Discrimination”
Percentage Percentage
Africa Ghana 31 58 26 32 Malawi 18 35 8 26 Nigeria 30 14 ‐18 31
Asia Bangladesh 21 4 2 2 Indonesia 37 43 2 40 Nepal 9 4 2 2 Vietnam 23 20 4 15 Tajikistan 48 61 28 33
Europe Albania 29 40 15 25 Bulgaria 15 9 ‐3 12
Latin America Ecuador 36 38 2 36 Guatemala 23 27 ‐10 37 Nicaragua 11 6 ‐9 15 Panama 12 ‐11 ‐25 14 Source. Hertz et al (2009). Note : the wage gap is calculated as the difference between average male and female wages as a percentage of the average male wage. A positive wage gap means men are paid more than women. “Discrimination” is calculated as the difference in the returns to the assets and attributes of male and female workers. A positive “discrimination” value means that women are paid less than men for the same level of education, work experience and other attributes.
While women continue to face occupational segregation and discrimination in rural labour
markets, some new forms of organization in supply chains for export-oriented crops and agro-
processing have created better-paying employment opportunities for women in many
countries than existed before. Wages are typically higher and working conditions better than
in traditional agricultural employment. The large-scale incorporation of women in the packing
stage of non-traditional agro-export production may be one of the most important
developments for female employment over the last few decades (Deere, 2005).
Women are clearly an important part of the agricultural labour force, but agriculture and
agricultural value chains are equally important to women as a source of employment.

24
Commercial value chains for high-value products such as fresh fruit, vegetables, flowers and
livestock products are growing rapidly to supply urban supermarkets and export markets. The
growth of modern value chains and the broader structural transformation of the agricultural
sector in many developing countries have major implications for women’s employment, but
the impact of these trends for women has received relatively little analytical attention
(Maertens and Swinnen, 2009).
Women dominate employment in many of the high-value agricultural commodity chains in
sub-Saharan Africa and Latin America (Table 5). New jobs in export-oriented agro-industries
may not employ men and women on equal terms, however they often provide better
opportunities for women than exist within the confines of traditional agriculture and can also
be instruments of change with significant implications for women and rural development
(Maertens and Swinnen, 2009; Deere, 2005).
Table 5 Employment in selected high-value agro-industries Country Commodity Year of
survey Number of
employees in the agro-industry
Share of Female Employees
Cameroon Banana 2003 10,000 ..
Côte d'lvoire Banana and pineapple
2002 35,000 ..
Kenya Flowers 2002 40,000 – 70,000 75%
Senegal French beans Cherry tomatoes
2005 2006
12,000 3,000
90% 60%
Uganda Flowers 1998 3,300 75%
Zambia Vegetables Flowers
2002/3 2002/3
7,500 2,500
65% 35%
South Africa Deciduous fruit 1994 283,000 53%
Mexico Vegetables 1990s 950,000 90%
Colombia Flowers mid-90s 75,000 60-80%
Chile Fruits 1990s 300,000 ca 46%
Dominican Republic
Fruits, vegetables, flowers, plants
1989-90 16,955 ca 41%
Source. For Africa: Maertens and Swinnen (2009: Table 1), based on several sources. For South America: Deere (2005: Appendix II), based on several sources.

25
The flower industry in Latin America provides an interesting case in contrasting points of
view. In Colombia, for example, Friedemann-Sanchez (2006) finds that 64 percent of the
workforce directly growing fresh-cut flowers for export are women and consider this type of
agro-industrial work skilled, while others consider it unskilled (Meier, 1999). While women
do have supervisory jobs among those directly involved in cultivation activities, they have a
much lower share of managerial or professional jobs in other aspects of the sector
(Friedemann-Sanchez, 2006). Similarly, Fontana (2003) finds that in sectors producing
primarily for the export market, women tend to be replaced by males as profits increase.
The arrival of the flower industry in the Ecuadorian town of Cayambe in the late 1980s (in
combination with other household and individual factors) affected time use patterns in some
surprising ways (Newman, 2002). The total time spent by women in paid and unpaid work did
not increase, contrary to a frequent criticism of agricultural export development which
maintains that women are unduly burdened by work in the industry. Indeed, the most
compelling evidence of the industry’s impact was on men’s increased participation in
housework. In Cotocachi, Ecuador, in contrast, women were not prepared to move or even
commute to work in the flower industry despite the higher wages offered there. The women
did not view flower employment as an option, indicating either that their husbands would not
allow them to work or that the work would be detrimental to family relations (Newman,
2002).
In Senegal, the growth of modern horticulture supply chains has been associated with direct
beneficial effects for rural women and reduced gender inequalities in rural areas (Maertens
and Swinnen, 2009). That study also finds that women benefit more from employment in
large-scale estate production and agro-industrial processing than from high-value smallholder
contract-farming in which they often provide unpaid family labour (see Box 3 )
-----------------------------------------------------------------------------------------------
Box 3 Women farmers in modern contract farming
The emergence of modern supply chains is profoundly changing the way food and high-value agricultural products are produced and traded in developing countries, with important effects for rural women. While export-oriented value chains offer important employment opportunities for women (see rural labour market section below) female farmers are largely excluded from contracting with agro-industrial firms for the delivery of high-value produce.
Women comprise less than 10 percent of the farmers involved in smallholder contract-farming schemes in the Kenyan fresh fruit and vegetable export sector (Dolan, 2001). Eaton and
26
Shepherd (2001) find that in large contract-farming schemes involving many thousands of farmers in China, contracts were exclusively with men. In the French bean export sector in Senegal, only 1 out of the 59 contracted farmers is a woman. The exporting companies confirm that they strongly prefer contracting with men because women lack secure access to productive resources and so cannot guarantee delivery of a reliable flow of produce. For example, women lack statutory rights over land and have less authority over family labour compared to their husband and male siblings.
High-value contract-farming has direct implications for the allocation of productive resources within the household. It has been argued that contract-farming with the modern agroindustry – and the exclusion of women from contracts – could give rise to intra-household conflicts over the allocation of land and labour resources between contract requirements and women’s priorities with regard to food production (Sing, 2003). High-value contract-farming might result in decreased access to resources for female farmers concerned with subsistence food production, and ultimately lead to the deterioration of the food security situation of rural women and children (Bravo-Baumann, 2000).
Convincing quantitative evidence on this issue is lacking. What is available from descriptive studies is mixed and yields no consensus. Several authors point to the fact that – while men control the contracts as contracting party – the majority of the farm work done on contracted plots is performed by women as family labourers and necessarily reduces labour for food production. For example, Porter and Philips-Horward (1997) observe that in 70 percent of the cases of sugar contract-farming in South Africa the principal farmer working all year round on the sugar cane plots is a woman. Sing (2002) reports that women work longer hours than men in vegetable contract-farming schemes controlled by male farmers in the Indian Punjab. Eaton and Shepherd (2001) observe that in a large contract-farming scheme involving thousands of farmers in China women – while being completely excluded from signing contracts themselves – perform the bulk of the work related to contract farming. Qualitative studies also report cases were contracted tobacco production in East Africa conflicts with the cultivation of millet and sorghum, basic food crops, by female farmers. Dolan (2001) argues that specifically the growth of high-value horticulture supply chains has been detrimental for rural women in Kenya because land and labour resources that were traditionally used by women to cultivate vegetables for home consumption and sale in local markets have been appropriated by men for export vegetable production under contract.
Other studies do not find conflicts over productive resources between high value contract production controlled by men and basic food production by women, or that this reallocation of resources – especially female labour – leads to adverse food security effects and deteriorated child nutrition. On the contrary, Minten, Randrianarison and Swinnen (2009), although not explicitly addressing gender issues, find that high-value vegetable contract-farming in Madagascar leads to improved productivity for food (rice) production through technology spillovers, thereby improving the availability of food in the household and shortening the lean period or “hunger season”.
Analysis of the French bean export sector in Senegal also suggests that gender conflict over land and labour resources is quite limited. Beans are exported from Senegal to the EU only during the off-season (from November till April) and households only allocate part of their land and labour resources to contracted bean production and only during a confined period which does not coincide with the main “rainy” agricultural season when staple food crops and other subsistence crops are cultivated.
Source: Maertens and Swinnen (2009)
----------------------------------------------------------------------------------------------

27
The gender demographics of agriculture and rural areas
The preceding sections discussed gender differences in labour market participation and type
of employment in agriculture and in rural areas, with the data available revealing a significant
amount of regional diversity. This section concentrates on demographic gender imbalances in
rural areas. In this respect numerous studies find that agriculture and rural areas are becoming
“feminized” (Lastarria-Cornhiel, 2006; Deere, 2005). Not all authors have the same
understanding of the meaning of this word, although two concepts are generally considered:
women predominate in the agricultural sector or women are rapidly gaining a predominant
position.
Table 6 presents average female share of the working age population (aged 15-49) of all
major regions of the world, by urban and rural areas. Only in the rural areas of sub-Saharan
Africa are there more women than men. The opposite is true in Latin America, Eastern Asia
and countries in developed regions. These patterns reflect different economic and social
norms, which have produced different migration trends for men and women. Table 6 shows
that rural areas, with the exception of Africa, have not become feminized. We note that
feminization is also frequently observed in certain sectors such as unskilled labour in the fruit,
vegetable and cut-flower export sector.
Table 6 The female share of the adult population (aged 15-49) (in brackets the corresponding ratio of women per 100 men), by region
Urban Rural National Africa 50.0 (103.7) 52.4( 110.1) 51.7 (107) Sub-Saharan Africa 49.5 (98) 52.5 (110.5) 51.7(107) Latin America & Caribbean 51.5(106.2) 48.6(94.6) 50.9(103.7) Central Asia 50.8 (103.3) 49.7 (98.8) 50.1 (100.4) Eastern Asia, excl. Japan 48.8(95.3) 48.6 (94.6) 48.7 (94.9) South Eastern Asia 50.7 (102.8) 50.2(100.8) 50.4(101.6) Western Asia 48.9(95.7) 49.6(98.4) 49.2(96.9) Countries in developed regions 50.0(100) 48.7(94.9) 49.7(98.8)
World 49.6(98.4) 49.2(96.9) 49.4(97.6)
Source. Author’s calculations from a database of Census Sex/Age/Location Tables for the period 1980-2003 containing a total of 223 surveys.
De Brauw et al. (2008) do not find much evidence of feminization of agriculture in China;
rather, even after the high rate of migration out of rural China to its urban areas, the share of
women-managed farms rose only from 13.5 percent between 1990 and 1995 to 15 percent

28
between 1995 and 2000. They argue that, although there may be no general move towards
agricultural feminization in rural China, such a trend is observable among middle-aged
women. Whereas young men and women appear to obtain off-farm jobs in similar numbers,
middle-aged men are far more likely than similarly aged women to have non-agricultural
employment. Mu and van de Walle (2009) argue that the aggregate transformation of work
during China’s rapid economic development is leading to a substantial re-allocation of
traditional farm labour among women ─ the young farming much less and older women much
more.
In Africa, data for Niger, Tanzania and Mali reveal an over-representation of females in
working-age populations in rural areas (Figure 7). Females are under-represented both in
lower and higher age groups but over-represented in the central part of the age structure,
which results in an inverted U-shaped femininity ratio with a maximum of 133 percent for the
20-24 age group.

29
Figure 7 Number of women per 100 men in rural areas in Niger, Mali and Tanzania
0.0
20.0
40.0
60.0
80.0
100.0
120.0
140.0
0-4 5-9 10-14 15-19 20-24 25-29 30-34 35-39 40-44 45-49 50-54 55-59 60-64 >65
Ratio
of a
dult
fem
ale
for e
very
100
mal
es
Niger Mali Tanzania
Source. Mali Agricultural Census, 2004/05; Niger Agricultural Census 2005/07, Tanzania Agricultural Census 2002/03.
Feminization of rural areas may also vary over time. For example, during the economic
reform period in Viet Nam, which stared in 1986, male migration from rural areas initially led
to a rise in female participation in agriculture. Later, from 1992–97, women migrated in large
numbers to take advantage of opportunities in new factories and export processing zones. As
a result, the proportion of female workers in agriculture then fell from 68 percent to 56
percent, while that in non-farming occupations increased from 22 percent to 39 percent (Long
et al., 2000).
While global data and national data for most countries do not reveal a general pattern of
increasing female dominance in agriculture, evidence clearly supports the conclusion that
females are over-represented in rural areas of some countries and regions. Patterns vary
considerably by age cohort and can change rapidly as economic opportunities and social
norms accommodate freer movement of women between urban and rural settings.
Another demographic phenomenon is that of the female-headed household. These are a
significant portion of rural households in many countries in the world, although their share
shows significant variation (Appendix 1). Most countries have between 10 and 30 percent

30
female-headed households and there are some regional patterns: southern African countries,
for example, tend to have a very large proportion of female-headed households.
As a group these households are important for agricultural policy makers because many of
them will be involved in farming and they share some defining characteristics. For one, as the
companion working paper “Gender differences in assets” documents, they are nearly always
disadvantaged in terms of access to land, credit and other productive resources. They also
have less labour available because they have fewer male members, which also helps explain
why they very often support a higher dependency ratio, in particular of older family members.
But not all female-headed households are the same. When the husband has migrated for work
the households are labelled de facto female-headed. On the other hand when the female-head
of the household is divorced, separated or widowed the household is referred to as de jure.
The distinction is important because de facto FHHs may be receiving remittances which allow
them to mitigate the effect of an absent male. However this is possible mainly in situations
where remittances are regular and substantial enough to allow hiring in labour and/or
investment in farm machinery and inputs. Of course, when agro-climatic conditions are poor,
infrastructure is weak and agriculture gives a comparatively poor return on investment then
households do not invest remittances in agricultural activities.
Most FHHs appear to be de jure. Data is scarce but for Malawi, Uganda, and Panama about
70, 63 and 83 percent of all female-headed households fall into that category, respectively
(Chipande, 1987; Appleton, 1996; and Fuwa, 2000. Also in Cambodia the vast majority of
FHHs are widows or separated/divorced (FAO/GSO/MOP, 2010). In Laos widowhood is the
main reason for female-headedness and about one-fifth of such households are de facto due to
migration (FAO/MAF, 2010). Morada et al (2001) report that 68.5 percent of FHHs are de
jure in the Philippines.
It is commonly suggested that female-headed households are poorer and more vulnerable than
others and that their prevalence is growing, making poverty an increasingly female
phenomenon. The following quote is typical of this concern: “...the global economic
downturn has pressed most heavily on women-headed households, which are everywhere in
the world, the poorest of the poor” (Tinker, 1990). Evidence presented in Box 4 does not
indicate that this is universally true. However, their special situation, their role in agriculture
31
as well as the particular disadvantages that they may face, deserve attention, especially
because they represent such an important proportion of households in many countries.
----------------------------------------------------------------------------------------------------------------
Box 4 Women and rural poverty
It has been claimed that 60 to 70 percent of the world’s poor are women (UNDP, 1995; UNIFEM, 1995; United Nations, 1996).12
Whether households headed by women are poorer than those headed by men is a different question. In a survey of the available literature, Buvinic and Gupta (1997) found that female-headed households were over-represented among the poor in 38 out of 61 studies reviewed. Quisumbing, Haddad and Pena. (2001) found that female-headed households were over represented among the poor in only 3 of 10 household surveys. Most recently, Anriquez (2010) examined the evidence from 33 nationally representative household surveys from 18 different countries. Female-headed households were more likely to be poor in 10 of the 33 surveys, male-headed households were more likely to be poor in 16 of the studies and there was no statistical difference between male and female-headed households in the remaining surveys. This study also found that rural female-headed households were more likely to be poor than urban female-headed households, but it did not support the statement that female-headed households are everywhere and always the poorest of the poor.
However, this assertion does not stand up to careful analysis. Because poverty is measured at the household level, and because most households are comprised of both male and female members, including children, such an imbalance in the poverty rates would require an implausible gender distribution within households (Marcoux, 1998). Studies that have explored the question empirically find that in most cases, there is no statistical difference between the poverty levels faced by men and women (Anriquez, 2010).
----------------------------------------------------------------------------------------------------------------
Agricultural transformation and access to markets
Economic development has and will continue to transform the agricultural sector in many
developing countries. The process includes greater commercialization, urbanization and
integration into the global economy. These trends and changes bring with them challenges
and opportunities, some with a distinct gender dimension.
Economic development and rising incomes lead to greater demand for high-value
commodities, processed products, and pre-prepared foods. In turn, food supply chains become
increasingly vertically integrated, linking input suppliers, producers, processors, distributors
and retailers. Supermarkets are part of this vertical chain because they are convenient, meet
diversifying tastes, and set standards for quality and safety. The penetration of supermarkets
12 For and extensive review of these claims see Chant (2003).

32
is most pronounced in Latin America and parts of Asia, but is increasing in parts of Africa as
well (Reardon and Berdegué, 2006; Tschirley et al., 2004; Traill, 2006) (Table 8).
Table 8 Supermarket penetration in selected developing countries Country/Share of Supermarkets in retail food market (c. 2002) in %
Latin America Africa Asia
Chile 62 South Africa 55 China 11
Costa Rica 55 Egypt 10 India 2 Argentina 54 Kenya 10 Bangladesh 1 El Salvador 54 Morocco 5 Pakistan 1 Panama 50 Tunisia 5 Turkey 37 Brazil 49 Colombia 47 Mexico 45 Honduras 42 Guatemala 35 Paraguay 35
Source. Traill (2006)
Small-holder production systems in rapidly growing areas are facing increasing pressure to
commercialize, diversify and expand. Increasing scales of production are being observed
particularly in the livestock sector, which attempts to supply rapidly growing markets for
meat, milk and eggs. Small-scale producers face particular pressures as size and private health
and safety standards set by large retailers and wholesale buyers become increasingly
important (de Haen et al, 2003).
Studies cited in Reardon and Berdegue (2006) show that, in general, farmers who produce for
supermarkets are larger, more educated, have more access to information, are able to hire-in
labour, have greater access to irrigation and are closer to transport infrastructure. It is
frequently assumed that small farmers will be marginalised by these trends, and that women
farmers will be more severely penalized because of their smaller scale, lower education levels
and limited access to resources (for more evidence on the gender gaps in access to resources
see the companion working paper “Gender differences in assets”). However, a number of
studies suggest that this may not always be the case. In Eastern Europe and Central Asia,
Swinnen (2004) finds that transaction costs and investment constraints are important and that
companies prefer to work with few, large and modern suppliers, but they also find that small

33
farms play a much larger role in actual supermarket contracting than would be expected.
Zhang et al (2005) find that in Sichuan, China, small farms continue to supply fresh produce.
Box 5 suggests that female farmers can compete in high-value cash crops but illustrates some
of the constraints they face.
--------------------------------------------------------------------------------------------------------------
BOX 5 PRODUCING COCOA IN GHANA13
Cocoa production is an engine of growth for Ghana’s economy; it provides livelihoods for more than 700,000 smallholders. Cocoa has traditionally been considered a “man’s” crop because it requires a large amount of hard physical work and because it generates high returns, which typically imply a strong gender differentiation in their appropriation. Despite gender differences, male and female cocoa farmers were equally productive on their land. In 2004 the productivity of hired workers on land run by women was almost double that of workers on land run by men.
Cocoa smallholders typically own the land they cultivate to that crop and women usually cultivate smaller plots than men (5.4 ha vs. 7.9 ha). Labour on cocoa farms is clearly gender differentiated. Men are typically engaged in the more physically demanding work such as clearing and tree felling and women perform the less physically demanding tasks, such as weeding and harvesting. Women farmers face greater time constraints than do men because they spend more time than men do on domestic work (on average 1.5 times as many hours). Farmers need male labour for strength-demanding tasks such as tree felling, consequently, female farmers in the lower wealth ranks who have no other means of procuring male labour have to rely on wage or annual labour.
Female cocoa farmers from Ghana differ from their male counterparts in other important respects. They are usually older, less educated, more cash constrained, and use less farming inputs (such as fertilizer, insecticide, and agricultural equipment). Between 2002 and 2004, cocoa farmers (both female and male) increased the amount of fertilizer used by a factor of nine, but the percentage of women using fertilizer went up only 25 percent, compared to 42 percent for men.
In summary, the Ghana case study on women farming cocoa provides four important lessons about gender differences in high value cash crops. First, while most smallholders engaged in the cultivation of these crops are male, there are some clear signals that women are becoming more involved in cocoa farming. Secondly, female-managed farms are just as productive as those managed by males. Thirdly, due largely to cash constraints, women rely on labour intensive, low-tech production technologies and use non-labour inputs sparingly. Fourth, women who do not have male labour readily available must hire wage labourers; this is of course a serious constraint for the poorest female farmers.
---------------------------------------------------------------------------------------------------------------------------
Being able to produce for the market will be increasingly important for farmers. But the
ability to engage in output markets depends on the size of the farm, the quality of the produce
and the farmer’s capacity to process and market output at low cost. As two seminal studies
show (Fafchamps, 1992; Key, et al., 2000), scale becomes important for cash crop production
as a result of: (i) the price risk inherent in exchanging cash crops for cash and cash for food,
13 Based on Hill and Vigneri (2009).

34
and; (ii) the fixed costs involved in transacting with markets. Fafchamps (1992) argues that
food price volatility, resulting from poorly integrated food markets, can make it quite risky
being a net buyer of food. This is compounded by cash crop price volatility. Households that
produce surpluses in food crops are more likely to engage in cash crop production. Farm size,
and thus gender of household head, is an important factor in this regard. Box 6 illustrates
marketing constraints faced by women farmers.
--------------------------------------------------------------------------------------------------------------
BOX 6 CASE STUDY: MARKETING COFFEE IN UGANDA14
Coffee is Uganda’s largest export, providing employment directly and indirectly to an estimated 5 million people (Bank of Uganda, 2001; Kempaka, 2001). Coffee produced by smallholders is usually intercropped with staples such as matooke (a banana-like staple), beans, sweet potatoes and maize. To produce coffee; purchased inputs such as fertilizer or pesticides are used minimally, and modern farming methods, such as irrigation, are not widely used.
A study by Hill and Vigneri (2009) draws on a sample of 300 coffee farming households that were surveyed in 1999 and 2003. Twenty-three percent of the households surveyed were headed by females (mainly widows, but also unmarried, separated and divorced women). Female-headed households had on average less labour, land and coffee trees than male-headed households; they also had lower levels of wealth and education. Women household heads tended to be older. As a result of these basic differences in scale, liquidity and human capital, we may expect crop choice, production methods and access to markets to be quite different for male- and female-headed households.
The share of labour allocated to coffee production and the proportion of trees harvested were comparable between male-and female-headed households, as was the yield per producing tree. However, because female-headed households farmed on a much smaller scale, women sold smaller amounts than men (only 47 kg on average compared to 151 kg for men).
The majority of smallholders sold their coffee in the form of dry cherries locally known as kiboko, which are then milled by the traders who buy the coffee. Some farmers transported their coffee to market, which allowed them to sell it at a higher price. Members of male-headed households were more likely than those of female-headed households to travel to market to sell their coffee. Fifteen percent of the transactions made by male-headed households took place in the nearby coffee market, while only 7 percent of transactions by women did. This may be because men were more likely to own a bicycle and could therefore travel to the market more easily than women. Farmers received a higher price for their coffee if they chose to mill it at the market before selling it. Only 3 percent of transactions were for milled coffee, all of which were made by male-headed households.
The study by Hill and Vigneri (2009) concludes that gender differences in marketing are largely explained by the fact that women market smaller quantities of coffee and do not own bicycles. They also find that a major constraint facing women is their relative difficulty in accessing marketing channels that allow added value. By engaging in marketing channels in which they add value male headed households received 15 USD? cents per kilo of kiboko whereas female-headed households received less (14 USD cents per kilo).
---------------------------------------------------------------------------------------------------------------------------
14 Based on Hill and Vigneri (2009).

35
Conclusion
In this paper we collate the empirical evidence on women’s roles in agriculture, setting the
stage for subsequent analysis on gender differences in agriculture and the potential gains from
removing these gender differences. The main findings are:
Women comprise about 43 percent of the global agricultural labour force and of that in
developing countries, but this figure masks considerable variation across regions and within
countries according age and social class. Women comprise half or more of the agricultural
labour force in many African and Asian countries, but the share is much less in some.
Time use surveys, which provide a more comprehensive assessment of how men and women
spend their time, further emphasise the heterogeneity among countries and within countries in
women’s contribution to agriculture. The labour burden of rural women exceeds that of men,
and includes a higher proportion of unpaid household responsibilities related to preparing
food and collecting fuel and water.
The contribution of women to agricultural and food production is clearly significant.
However, it is impossible to verify empirically the share produced by women because
agriculture is usually a venture among household members and involves a range of resources
and inputs that cannot be readily assigned by gender.
Women’s participation in rural labour markets show much heterogeneity at the regional level,
but women are over represented in unpaid, seasonal and part-time work, and the available
evidence suggests that women are often paid less than men, for the same work.
We conclude that accurate, current, regionally specific information and analysis is necessary
for good gender-aware agricultural policy making. Data collection has improved substantially
over the last decades, as has our understanding of the complexity of women’s roles and the
need to collect data not only on primary activities but on all women’s activities. Data are
needed to better understand gender roles in agriculture and how they change over time and in
response to new opportunities.
We have shown that women’s roles are diverse and that they vary across regions and
countries. These roles cannot be understood properly, and interventions targeting cannot be
designed effectively, without also understanding their differential access to land, capital,
assets, human capital, and other productive resources.

36
References
Acharya, M. and L. Bennett. 1982. Women and the Subsistence Sector: Economic Participation and Household Decisionmaking in Nepal. World Bank Staff Working Papers, Number 526.
Addati, L. and N. Cassirer. 2008. Equal sharing of responsibilities between women and men, including care giving in the context of HIV/AIDS. Paper prepared for the Expert Group meeting on the equal sharing of responsibilities between women and men, including care giving in the context of HIV/AIDS, organized by the United Nations Division for the Advancement of Women, Geneva.
Anríquez, G. 2010. Demystifying the Agricultural Feminization Myth and the Gender Burden. Background paper prepared for The State of Food and Agriculture 2011.
Appleton, S. 1996. Women-Headed Households and Household Welfare: An Empirical Deconstruction for Uganda. World Development, Vol. 24(12): 1811-1827.
Baanante, C., T.P. Thompson and K. Acheampong. 1999. Labour contributions of women to crop production activities in three regions of West Africa: An analysis of farm-survey data. Institute of African Studies: Research Review, Vol. 15(1): 80-100.
Bank of Uganda. 2001. Annual Report 2000 - 2001. Kampala, Uganda.
Beneria, L. 1981. Conceptualizing the Labor Force: The Underestimation of Women’s Economic Activities. Journal of Development Studies, 17(3):10-28.
Bravo-Baumann, H. 2000. Gender and Livestock. Capitalisation of Experiences on Livestock Projects and Gender. Working document. Swiss Development Cooperation, Bern.
Brown, C.K. 1994. Gender Roles in Household Allocation of Resources and Decision Making in Ghana. Family and Development Programme (FADEP), Department of Geography and Resource Development, University of Ghana, Legon, Ghana.
Budlender, D. 2008. The statistical evidence on care and non-care work across six countries. Geneva: United Nations Research Institute for Social Development (UNRISD).
Buvinic, M. and G.R. Gupta. 1997. Female-Headed Households and Female-Maintained Families: Are They Worth Targeting to Reduce Poverty in Developing Countries? Economic Development and Cultural Change, 45(2): 259-80. Chant, S. 2003. Female Household Headship and the Feminisation of Poverty: Facts, Fictions and Forward Strategies. Gender Institute, New Working Paper Series, Issue 9, May 2003. Charmes, J. 2006. A Review of Empirical Evidence on Time Use in Africa from UN Sponsored Surveys. In Blackden, C.M. and Q. Wodon. (Eds.) Gender, Time Use, and Poverty in Sub-Saharan Africa. World Bank Working Paper No. 73. World Bank, Washington, D.C.

37
Chipande, G. H. R. 1987. Innovation adoption among female-headed households. Development and Change 18 (2): 315-327.
de Brauw, A., Q. Li, C. Liu, S. Rozelle and L. Zhang. 2008. Feminization of agriculture in China? Myths surrounding women’s participation in farming. The China Quarterly, 327-348.
de Haen, H., K. Stamoulis, P. Shetty and P. Pingali. 2003. The World Food Economy in the Twenty-first Century: Challenges for International Co-operation. Development Policy Review, Vol. 21(5-6): 683-696.
Deere, C.D., 1982. The Division of Labor by Sex in Agriculture: A Peruvian Case Study. Economic Development and Cultural Change, 30(4):795-811.
Deere, C.D. 2005. The Feminization of Agriculture? Economic Restructuring in Rural Latin America. United National Research Institute for Social Development, Occasional Paper 1.
Dolan, C.S. 2001. The 'good wife': Struggles over resources in the Kenyan horticultural sector. Journal of Development Studies, Vol. 37(3): 39-10.
Doss, C. 2002. Men’s crops? Women’s crops? The gender patterns of cropping in Ghana. World Development, Vol. 30, No. 11, pp. 1987-2000.
Doss, C. 2010. If Women Hold up Half the Sky, How Much of the World’s Food do they Produce? Background paper prepared for the State of Food and Agriculture 2010.
Duflo, E. and C. Udry. 2001. Intrahousehold Resource Allocation in Cote d’Ivoire: Social Norms, Separate Accounts, and Consumption Choices. Processed. Department of Economics, MIT, Cambridge, MA.
Eaton, C. and Shepherd, A. W. 2001. Contract Farming: Partnership for Growths, FAO Agricultural Services Bulletin 145, Food and Agricultural Organization, Rome.
Ellis, A., C. Manuel and C.M. Blackden. 2006. Gender and Economic Growth in Uganda: Unleashing the Power of Women. Washington, D.C.: The World Bank.
Estudillo, J.P., A. R. Quisumbing and K. Otsuka. 2001. Gender differences in land inheritance, schooling and lifetime income: Evidence from the rural Philippines. The Journal of Development Studies, Vol. 37(4): 23-48.
Fafchamps, M. 1992. Cash Crop Production, Food Price Volatility and Rural Market Integration in the Third World. American Journal Agricultural Economics, 74(1): 90– 99.
FAO. 1984. Women in Food Production and Food Security in Africa. Report of the Government Consultation held in Harare, Zimbabwe, 10-13 July 1984, Food and Agriculture Organization of the United Nations, Rome, Italy.
FAO. 1998. Village Chicken Production Systems in Rural Africa. Household Food Security and Gender Issues, by A.J. Kitalyi. The Food and Agriculture Organization, Rome.

38
FAO/GSO/MoP. 2010. National Gender Profile of Agricultural Households, 2010. Report based on the 2008 Cambodia Socio-Economic Survey. Food and Agriculture Organization of the United Nations, Rome and General Statistics Office and Ministry of Planning, Phnom Penh.
FAO/MAF. 2010. National Gender Profile of Agricultural Households, 2010. Report based on the Lao Expenditure and Consumption Surveys, National Agricultural Census and the National Population Census. Food and Agriculture Organization of the United Nations, Rome and Ministry of Agriculture and Forestry, Vientiane.
Fontana, M. 2003. The gender effects of trade liberalization in developing countries: A review of the literature. Discussion Papers in Economics, DP 101, University of Sussex.
Fontana, M. 2009. Gender dimensions of rural and agricultural employment: differentiated pathways out of poverty. Paper presented at the FAO-IFAD-ILO Workshop on Gaps, trends and current research in gender dimensions of agricultural and rural employment: differentiated pathways out of poverty, Rome, 31 March - 2 April 2009FAO (Italy).
Fontana, M. and L. Natali. 2008. Gendered patterns of time use in Tanzania: Public investment in infrastructure can help? Paper prepared for the IFPRI Project on ‘Evaluating the Long-Term Impact of Gender-focused Policy Interventions.
Fontana, M. and C. Paciello. 2009. Gender Dimensions of Rural and Agricultural Employment: Differentiated Pathways out of Poverty, A Global Perspective. Paper presented at the FAO-IFAD-ILO Workshop on Gaps, trends and current research in gender dimensions of agricultural and rural employment: differentiated pathways out of poverty. Rome, 31 March - 2 April, 2009.
Friedemann-Sanchez, G. 2006. Assembling Flowers and Cultivating Homes. Gender and Labor in Colombia. Lanham, Lenington Books.
Fuwa, N. 2000. The Poverty and Heterogeneity Among Female-Headed Households Revisited: The Case of Panama. World Development, Vol. 28(8): 1515-1542.
Government of India. 2006. Employment and Unemployment Situation in India 2004-05, part I and II. Report No. 515 (61/10/01). National Sample Survey Organisation, Ministry of Statistics & Programme Implementation, Government of India.
Guèye, E.F.2000. The Role of Family Poultry in Poverty Alleviation, Food Security and the Promotion of Gender Equality in Rural Africa. Outlook on Agriculture, Vol. 29(2): 129-136
Gupta, G.R. October 11, 2009. De Moines Register. Guest column: “When women farm, crops and economies grow.”
Haggblade, S., P. Hazell, and T. Reardon. Eds. 2007. Transforming the Rural Nonfarm Economy: Opportunities and Threats in the Developing World. Baltimore, The Johns Hopkins University Press.
Hertz, T., P. Winters, A.P. De La O, E.J. Quinones, C. Azzari, B. Davis and A. Zezza. 2009. Wage inequality in international perspective: effects of location, sector, and gender.
39
Paper presented at the FAO-IFAD-ILO Workshop on Gaps, trends and current research in gender dimensions of agricultural and rural employment: differentiated pathways out of poverty Rome, 31 March - 2 April 2009, FAO, Italy.
Hill, R.V. and M. Vigneri. 2009. Mainstreaming Gender Sensitivity in Cash Crop Market Supply Chains. Background paper prepared for the State of Food and Agriculture 2011.
Hoddinott, J. and L. Haddad. 1995. Does female income share influence household expenditure patterns? Oxford Bulletin of Economics and Statistics, Vol. 57(1): 77-96.
Ilahi, N. 2000. The intrahousehold allocation of time and tasks: What have we learnt from the empirical literature? Policy Research Report on Gender and Development, Working Paper Series No. 13, World Bank: Washington DC.
Jackson, C. 2005. Strengthening Food Policy Through Gender and Intrahousehold Analysis Impact Assessment of IFPRI Multicountry Research. Impact Assessment Discussion Paper, 2005. International Food Policy Research Institute, Washington, DC.
Jacoby, H.G. 1992. Productivity of men and women and the sexual division of labor in peasant agriculture of the Peruvian Sierra. Journal of Development Economics, 37: 265-287.
Jain, D. 1996. "Valuing work: Time as a measure." Economic and Political Weekly 31(43): WS46–57. (pp. 48-49)
Joshi, S. 2000. Counting Women’s Work in the Agricultural Census of Nepal: A Report. Gender, Technology, and Development, Vol. 4 (2):, pp. 255-270.
Kantor, P. 2008. Women’s Exclusion and Unfavorable Inclusion in Informal Employment in Lucknow, India: Barriers to Voice and Livelihood Security. World Development, Vol. 37(1): 194-207.
Kapadia, K. 1993. Mutuality and competition: Female landless labor and wage rates in Tamil Nadu. Journal of Peasant Studies, Vol. 20(2): 296-316.
Kapadia, K. 1995. The profitability of bonded labor: The gem-cutting industry in rural South India. Journal of Peasant Studies, Vol. 22(3): 446-483.
Katz, E. 2003. “The changing role of women in the rural economies of Latin America.” In Benjamin D. (ed.), Food, Agriculture and Rural Development: Current and Emerging Issues for Economic Analysis and Policy Research – II. Vol. I: Latin America and the Caribbean. Food and Agriculture Organization of the United Nations (FAO), Rome.
Kempaka, G. 2001. Coffee and its impact and relevance to PEAP (Poverty Eradication Action Plan). In The Coffee Yearbook 2000 - 2001. Uganda Coffee Trade Federation, Kampala, Uganda. Kes, A. and H. Swaminathan. 2006. Gender and Time Poverty in Sub-Saharan Africa. Chapter 2 in Blackden, C.M. and Q. Wodon. (Eds.). Gender, Time Use, and Poverty in Sub-Saharan Africa. World Bank Working Paper No. 73, The World Bank, Washington, D.C.

40
Key, N., E. Sadoulet, and A. de Janvry. 2000. Transactions Costs and Agricultural Household Supply Response. American Journal of Agricultural Economics, 82(2): 245- 259.
Kumar, S.K. 1994. Adoption of hybrid maize in Zambia: effects on gender roles, food consumption, and nutrition, Research Report No. 100, International Food Policy Research Institute, Washington, D.C.
Kumar S.K. and D. Hotchkiss. 1988. Consequences of deforestation for women’s time allocation, agricultural production, and nutrition in hill areas of Nepal. Research Report 69, International Food Policy Research Institute: Washington, D.C.
Kusabe, K. and G. Kelker. Eds. 2001. Gender Concerns in Aquaculture in Southeast Asia. Gender Studies Monograph 12. Gender and Development, Studies, School of Environment Resources and Development, Asian Institute of Technology, Bangkok, Thailand.
Lanjouw, J.O. and P. Lanjouw. 2001. The rural non-farm sector: issues and evidence from developing countries. World Development 26: 1-23.
Lastarria-Cornhiel, S. 2006. Feminization of Agriculture: Trends and Driving Forces. RIMISP, Background paper for the World Development Report 2008.
Leplaideur, A. 1978. Les travaux agricoles chez les paysans du Centre-Sud Cameroun, les techniques utilisées et les temps necessaries. Paris: IRAT.
Long, L.D., L.N. Hung, A. Truitt, L.T.P. Mai and D.N. Anh. 2000. Changing Gender Relations in Vietnam’s Post Doi Moi Era. Policy Research Report on Gender and Development, Working Paper Series No 14, World Bank, Washington, D.C.
Maertens, M. and J.F.M. Swinnen. 2009. Are Modern Supply Chains Bearers of Gender Inequality? Paper presented at the workshop “Gender Dimension of Rural Employment”, ILO-FAO, March 30-April 3, 2009, Rome.
Malmberg-Calvo, C. 1994. Case study on the role of women in rural transport: access of women to domestic facilities. SSATP Working Paper No. 12, Washington, DC, World Bank.
Marcoux, A. 1998. The feminization of poverty: Claims, facts, and data needs. Population and Development Review, 24(1): 131-139.
Mehra, R. and M.H. Rojas. 2008. “A Significant Shift: Women, Food Security and Agriculture in a Global Marketplace,” International Center for Research on Women (ICWR), p.2. citing FAO Focus on Women and Food Security. FAO. (available at www.fao.org/focus/e/women/sustin- e.htm ).
Meier, V. 1999. Cut-flower production in Colombia – a major development success story for women? Environment and Planning A, Vol. 31(2): 273 – 289.
Minten, B. L. Randrianarison and J.F.M. Swinnen. 2009. Global Retail Chains and Poor Farmers: Evidence from Madagascar. World Development, Vol. 37(11): 1728-41.
Momsen, J.H. 1991. Women and development in the Third World, Routledge, 1991.
41
Morada, H.B., M.A. Llaneta, T.N. Pangan and C.L. Pomentil. 2001. Female-Headed Households in the Philippines. A paper presented at the DOLE First Research Conference held on the Occupation Safety and Health Center on 5 December 2001, Quezon City.
Mu, R. and D. van de Walle. 2009. Left Behind to Farm? Women’s Labor Re-Allocation in Rural China. Policy Research Working paper 5107. The World Bank, Washington, D.C.
Nankhuni, F. 2004. Environmental Degradation, Resource Scarcity and Children’s Welfare
in Malawi: School Attendance, School Progress, and Children’s Health. In Agricultural Economics and Demography. University Park: The Pennsylvania State University.
Newman, C. 2002. Gender, Time use, and Change: The Impact of the Cut Flower Industry in Ecuador. The World Bank Economic Review, 16(3): 375-396.
Okali, C. and J. Mims. 1998. ‘Gender and Smallholder Diary Production in Tanzania.’ Report to the Livestock Production Programme of the Department for International Development (DFID): Appendix 1 and 2 pp. 37-38.
Paris, T.R. and T.T.N. Chi. 2005. The Impact of Row Seeder Technology on Women Labor: A Case Study in the Mekong Delta, Vietnam. Gender Technology and Development , Vol. 9(2): 157-184.
Pasquet, P. and G. Koppert. 1993. Activity Patterns and Energy Expenditures in Cameroonian Tropical Forest Populations. In Hladik, C.M., A. Hladik, O.F. Linares, H. Pagezy, A. Semple and M. Hadley. Tropical Forests, People and Food. Biocultural Interactions and Applications to Development. Man and the Bioshpere Series, 13. Paris: UNESCO and Carnforth, The Parthenon Publishing Group.
Pasquet, P. and G. Koppert. 1996. Budget-temps et dépense énergétique chez les essarteurs forestiers du Cameroun. In C.M. Hladik, A. Hladik, H. Pagezy, O.F. Linares, G. Koppert and A. Froment. Eds. L’alimentation en forêt tropicale: Interactions bioculturelles et perspectives de développement. L’Homme et la Biosphère, Editions. Paris: UNESCO.
Porter, G,. and K. Phillips-Howard. 1997. Contract farming in South Africa: A case study from Kwazulu-Natal. Geography: Journal of the Geographical Association, Vol. 82(354), Jan.1997, pp.1-38.
Quisumbing, A.R. and K. Otsuka. 2001. Land Inheritance and Schooling in Matrilineal Societies: Evidence from Sumatra. World Development, Vol. 29(12): 2093-2110.
Quisumbing, A. R., L. Haddad, and C. Peña. 2001. Are Women Overrepresented Among the Poor? An Analysis of Poverty in Ten Developing Countries. Journal of Development Economics, Vol. 66(1): 225-269.
Rahji, M.A.Y. and A.O. Falusi. 2005. A gender analysis of farm households labour use and its impacts on household income in southwestern Nigeria. Quarterly Journal of International Agriculture, Vol. 44(2): 155-166.

42
Raynolds, L.T. 2002. Wages for Wives: Renegotiating Gender and Production Relations in Contract Farming in the Dominican Republic. World Development, Vol.30(5): 783– 798.
Reardon, T. and J. Berdegué. 2006. The Retail-Led Transformation of Agrifood Systems and its Implications for Development Policies. Background paper for the WDR 2008.
Rola, A., Rola, W., Tiongco, M. and Delgado, C. 2006, An example of livestock intensification and the role of smallholders: Philippines hog and poultry sectors MTID DISCUSSION PAPER NO. 59, Markets Trade and Institutions Division, International Food Policy Research Institute, Washington, D.C., U.S.A..
Saito,K., H. Mekonnen & D. Spurling. 1994. Raising the Productivity of Women Farmers in Sub-Saharan Africa. World Bank Discussion Papers, Africa Technical Department Series, No. 230, Washington, D.C.: World Bank.
Sharma, S., S. Nagar, and G. Chopra. 2007. Household responsibilities of adolescent girls in Kangra and Kullu Districts in Himachal Pradesh. The Anthropologist 9(3): 199-201.
Singh, S. 2003. Contract Farming in India: Impacts on Women and Child Workers. International Institute for Environment and Development, Gatekeeper Series, No. 111, London.
Singh, R. and R. Sengupta. 2009. The EU FTA in Agriculture and Likely Impact on Indian Women. Consortium for Trade and Development (Centad) and Heinrich Böll Foundation, India.
Swinnen, J. 2004. The Dynamics of Vertical Coordination in ECA Agrifood Chains: Implications for Policy and Bank Operations. Final report, Washington DC: World Bank.
Tangka F.K., Jabbar M.A. and Shapiro B.I. 2000. Gender roles and child nutrition in livestock production systems in developing countries: A critical review. Socio-economics and Policy Research Working Paper 27. ILRI (International Livestock Research Institute), Nairobi, Kenya.
Thompson, T.P. and J. Sanabria. 2010. The division of labour and agricultural innovation in Bangladesh: dimensions of gender. International Center for Soil Fertility and Agricultural Development (IFDC), Alabama, USA.
Thornton P.K., Kruska R.L., Henninger N., Kristjanson P.M., Reid R.S., Atieno F., Odero A.N. and Ndegwa T. 2002. Mapping poverty and livestock in the developing world. ILRI (International Livestock Research Institute), Nairobi, Kenya. 124 pp.
Tinker, I. 1990. A Context for the Field and for the Book. In I. Tinker. Ed. Persistent Inequalities: Women and World Development, Oxford: Oxford University Press.
Traill, W.B. 2006. The rapid rise of supermarkets? Development Policy Review, Vol. 24(2): 163-174.
Tschirley, D., K.M. Muendo and M.T. Weber. 2004. Improving Kenya’s domestic horticultural production and marketing system: current competitiveness, forces for change, and challenges for the future, Volume II, Horticultural Marketing. Working

43
Paper 08B/2004. Nairobi: Tegemeo Institute of Agricultural Policy and Development, Egerton University.
Tung, D.X. 2005. “Smallholder Poultry Production in Vietnam: Marketing Characteristics and Strategies.” Paper presented at the workshop Does Poultry Reduce Poverty? A Need for Rethinking the Approaches, 30-31 August. Copenhagen, Network for Smallholder Poultry Development.
Tzannatos, Z. 1999. Women and Labor Market changes in the Global Economy: Growth Helps, Inequalities Hurt and Public Policy Matters. The World Bank, Washington DC, USA.
United Nations. 1996. Food Security for All, Food Security for Rural Women. Geneva: International Steering Committee on the Economic Advancement of Rural Women.
United Nations Development Programme. 1995. Human Development Report 1995. Oxford: Oxford University Press.
UNECA (United Nations Economic Commission for Africa). 1972. Women: The Neglected Human Resource for African Development,” Canadian Journal of African Studies / Revue Canadienne des Études Africaines, Special Issue: The Roles of African Women: Past, Present and Future, Vol. 6(2): 359-370.
United Nations Fund for Women. 1995. The Human Cost of Women’s Poverty: Perspectives from Latin America and the Caribbean. Mexico City: UNIFEM. United Nations Fund for Women. 2005. Progress of the World’s Women 2005. UNIFEM.
von Braun, J. and P.J.R. Webb. 1989. The Impact of New Crop Technology on the Agricultural Division of Labour in a West African Setting. Economic Development and Cultural Change, Vol. 37(3): 513-34.
Webb, P. 1989. Intrahousehold decisionmaking and resource allocation: The effects of rice commercialization in West Africa. International Food Policy Research Institute, Washington, D.C.
World Bank. 2007. World Development Report 2008: Agriculture for Development. Washington, D.C.: World Bank Publications.
World Bank, FAO & IFAD, 2009. Gender in Agriculture Sourcebook. The World Bank, Washington D.C.
Wrangham, R.T. 2009. Catching Fire: How Cooking Made Us Human. Basic Books, New York.
Zhang, X., X. Fu and J. Yang. 2005. The Vegetable Supply Chain of Supermarkets in Sichuan, China. Project Report. The Hague: Agricultural Economics Research Institute.
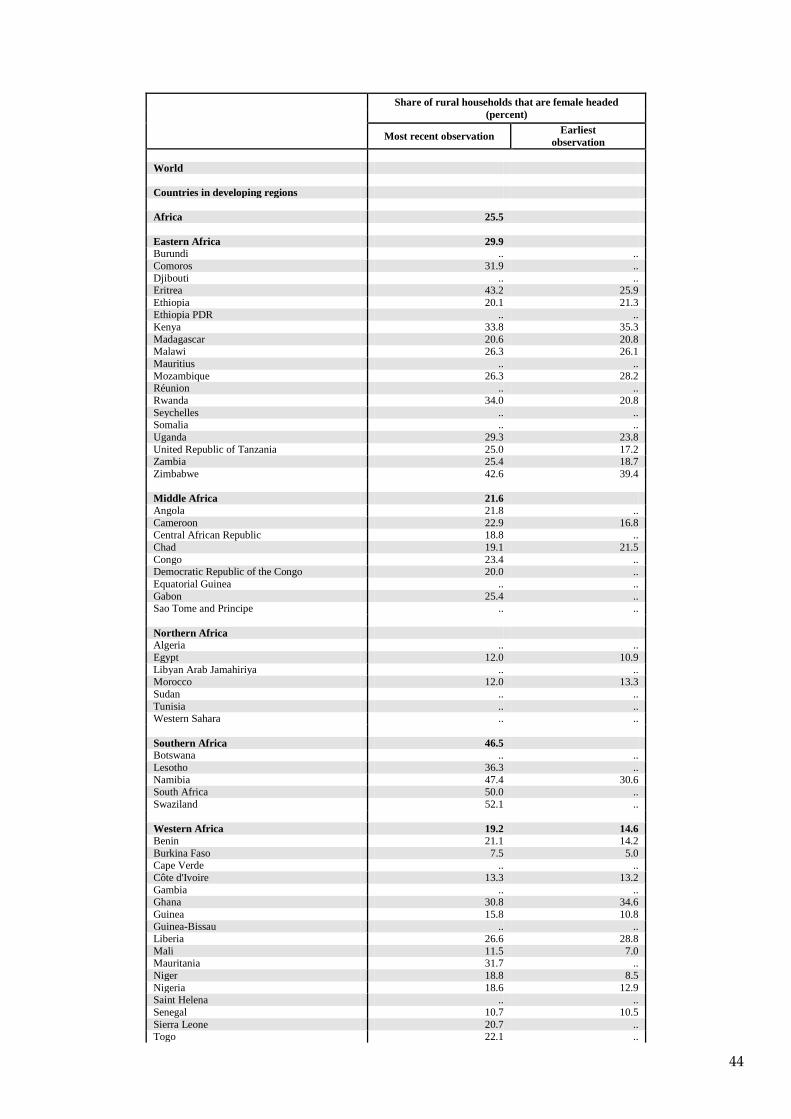
44
Share of rural households that are female headed (percent)
Most recent observation Earliest observation
World Countries in developing regions Africa 25.5 Eastern Africa 29.9 Burundi .. .. Comoros 31.9 .. Djibouti .. .. Eritrea 43.2 25.9 Ethiopia 20.1 21.3 Ethiopia PDR .. .. Kenya 33.8 35.3 Madagascar 20.6 20.8 Malawi 26.3 26.1 Mauritius .. .. Mozambique 26.3 28.2 Réunion .. .. Rwanda 34.0 20.8 Seychelles .. .. Somalia .. .. Uganda 29.3 23.8 United Republic of Tanzania 25.0 17.2 Zambia 25.4 18.7 Zimbabwe 42.6 39.4 Middle Africa 21.6 Angola 21.8 .. Cameroon 22.9 16.8 Central African Republic 18.8 .. Chad 19.1 21.5 Congo 23.4 .. Democratic Republic of the Congo 20.0 .. Equatorial Guinea .. .. Gabon 25.4 .. Sao Tome and Principe .. .. Northern Africa Algeria .. .. Egypt 12.0 10.9 Libyan Arab Jamahiriya .. .. Morocco 12.0 13.3 Sudan .. .. Tunisia .. .. Western Sahara .. .. Southern Africa 46.5 Botswana .. .. Lesotho 36.3 .. Namibia 47.4 30.6 South Africa 50.0 .. Swaziland 52.1 .. Western Africa 19.2 14.6 Benin 21.1 14.2 Burkina Faso 7.5 5.0 Cape Verde .. .. Côte d'Ivoire 13.3 13.2 Gambia .. .. Ghana 30.8 34.6 Guinea 15.8 10.8 Guinea-Bissau .. .. Liberia 26.6 28.8 Mali 11.5 7.0 Mauritania 31.7 .. Niger 18.8 8.5 Nigeria 18.6 12.9 Saint Helena .. .. Senegal 10.7 10.5 Sierra Leone 20.7 .. Togo 22.1 ..

45
Share of rural households that are female headed (percent)
Most recent observation Earliest observation
Americas excluding Northern America Caribbean Anguilla .. .. Antigua and Barbuda .. .. Aruba .. .. Bahamas .. .. Barbados .. .. British Virgin Islands .. .. Cayman Islands .. .. Cuba .. .. Dominica .. .. Dominican Republic 29.7 18.0 Grenada .. .. Guadeloupe .. .. Haiti 38.6 32.9 Jamaica .. .. Martinique .. .. Montserrat .. .. Netherlands Antilles .. .. Puerto Rico .. .. St. Kitts & Nevis .. .. Saint Lucia .. .. Saint Vincent and the Grenadines .. .. Trinidad & Tobago .. .. Turks and Caicos Islands .. .. United States Virgin Islands .. .. Central America Belize .. .. Costa Rica .. .. El Salvador .. .. Guatemala 16.1 18.0 Honduras 20.2 .. Mexico .. .. Nicaragua 19.3 20.0 Panama .. .. South America Argentina .. .. Bolivia (Plurinational State of) 17.1 17.3 Brazil (1) 13.7 16.8 Chile .. .. Colombia 21.7 16.7 Ecuador .. .. Falkland Islands (Malvinas) .. .. French Guiana .. .. Guyana .. .. Paraguay 13.4 .. Peru 16.3 13.3 Suriname .. .. Uruguay .. .. Venezuela (Bolivarian Republic of) .. .. Asia excluding Japan Central Asia 17.6 Kazakhstan 22.0 23.4 Kyrgyzstan 18.0 .. Tajikistan .. .. Turkmenistan 18.6 .. Uzbekistan 11.6 .. Eastern Asia excluding Japan .. .. China .. .. China, Hong Kong SAR .. .. China, Macao SAR .. .. China, mainland .. .. Democratic People's Republic of Korea .. .. Mongolia .. .. Republic of Korea .. ..
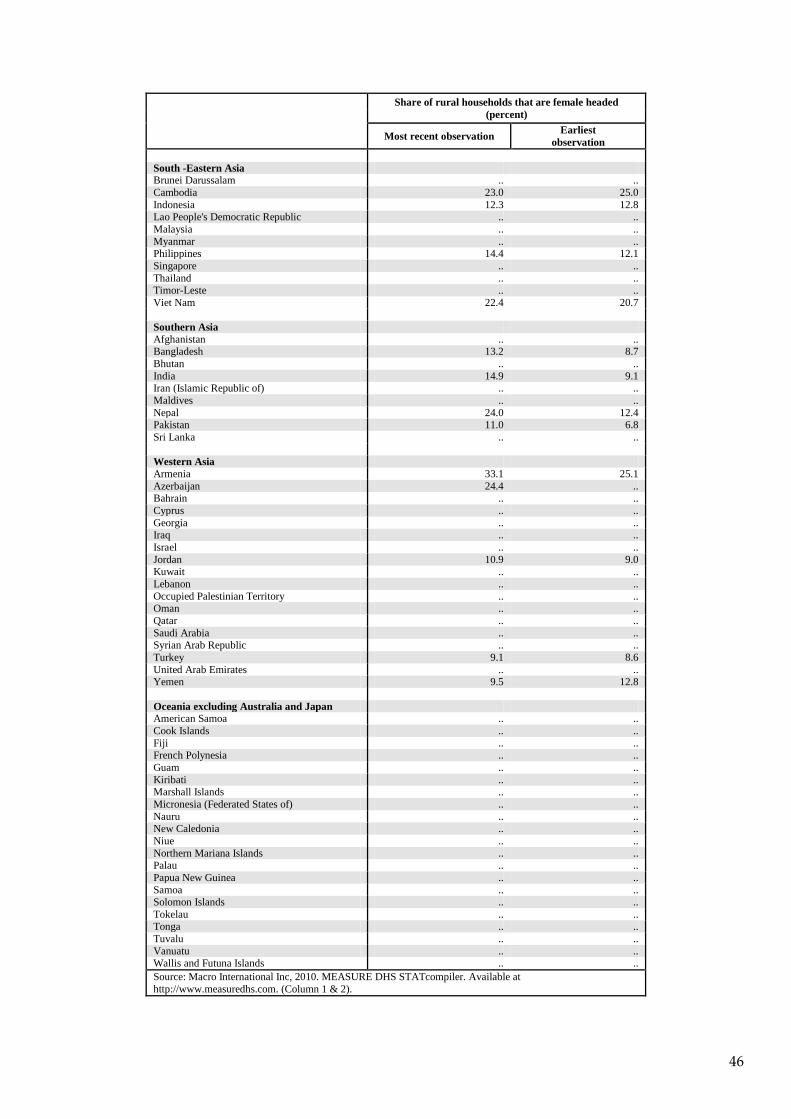
46
Share of rural households that are female headed (percent)
Most recent observation Earliest observation
South -Eastern Asia Brunei Darussalam .. .. Cambodia 23.0 25.0 Indonesia 12.3 12.8 Lao People's Democratic Republic .. .. Malaysia .. .. Myanmar .. .. Philippines 14.4 12.1 Singapore .. .. Thailand .. .. Timor-Leste .. .. Viet Nam 22.4 20.7 Southern Asia Afghanistan .. .. Bangladesh 13.2 8.7 Bhutan .. .. India 14.9 9.1 Iran (Islamic Republic of) .. .. Maldives .. .. Nepal 24.0 12.4 Pakistan 11.0 6.8 Sri Lanka .. .. Western Asia Armenia 33.1 25.1 Azerbaijan 24.4 .. Bahrain .. .. Cyprus .. .. Georgia .. .. Iraq .. .. Israel .. .. Jordan 10.9 9.0 Kuwait .. .. Lebanon .. .. Occupied Palestinian Territory .. .. Oman .. .. Qatar .. .. Saudi Arabia .. .. Syrian Arab Republic .. .. Turkey 9.1 8.6 United Arab Emirates .. .. Yemen 9.5 12.8 Oceania excluding Australia and Japan American Samoa .. .. Cook Islands .. .. Fiji .. .. French Polynesia .. .. Guam .. .. Kiribati .. .. Marshall Islands .. .. Micronesia (Federated States of) .. .. Nauru .. .. New Caledonia .. .. Niue .. .. Northern Mariana Islands .. .. Palau .. .. Papua New Guinea .. .. Samoa .. .. Solomon Islands .. .. Tokelau .. .. Tonga .. .. Tuvalu .. .. Vanuatu .. .. Wallis and Futuna Islands .. .. Source: Macro International Inc, 2010. MEASURE DHS STATcompiler. Available at http://www.measuredhs.com. (Column 1 & 2).

ESA Working Papers WORKING PAPERS The E SA Working P apers ar e pr oduced by t he A griculture and E conomic
Development Analysis Division (ESA) of the Economic and Social Department of the
United Nations Food and Agriculture Organization (FAO). The series presents ESA’s
ongoing r esearch. W orking paper s ar e c irculated t o s timulate di scussion
and comments. They are made available to the public through the Division’s website.
The a nalysis and c onclusions are t hose of t he a uthors an d do n ot i ndicate
concurrence by FAO.
AGRICULTURAL DEVELOPMENT ECONOMICS Agricultural Development Economics (ESA) i s F AO’s f ocal poi nt for ec onomic
research and policy analysis on issues relating to world food security and sustainable
development. E SA c ontributes t o t he g eneration of k nowledge and ev olution o f
scientific t hought on hunger a nd poverty al leviation t hrough i ts economic s tudies
publications w hich i nclude t his w orking paper s eries as w ell as per iodic a nd
occasional publications.
Agricultural Development Economics (ESA)
The Food and Agriculture Organization Viale delle Terme di Caracalla
00153 Rome, Italy
Contact: Office of the Director
Telephone: +39 06 57054368 Facsimile: + 39 06 57055522
Website: www.fao.org/economic/esa e-mail: [email protected]