the safe-asset share* - yale...
TRANSCRIPT

Yale ICF Working Paper No. 12-21
The Safe-Asset Share*
Gary Gorton
Yale and NBER
Stefan Lewellen
Yale
Andrew Metrick
Yale and NBER
January 17, 2012

Electronic copy available at: http://ssrn.com/abstract=1986945
The Safe-Asset Share*
Gary Gorton
Yale and NBER
Stefan Lewellen
Yale
Andrew Metrick
Yale and NBER
January 17, 2012
Prepared for AER Papers & Proceedings, 2012.
Abstract: We document that the percentage of all U.S. assets that are “safe” has remained stable
at about 33 percent since 1952. This stable ratio is a rare example of calm in a rapidly changing
financial world. Over the same time period, the ratio of U.S. assets to GDP has increased by a
factor of 2.5, and the main supplier of safe financial debt has shifted from commercial banks to
the “shadow banking system.” We analyze this pattern of stylized facts and offer some tentative
conclusions about the composition of the safe-asset share and its role within the overall
economy.
* We thank Susan Hume McIntosh, Robert Shiller, Paul Smith, and participants at the 2012 American
Economic Association Meetings for helpful comments.

Electronic copy available at: http://ssrn.com/abstract=1986945
1
Over the past sixty years, the total amount of assets in the United States economy has
exploded, growing from approximately four times GDP in 1952 to more than ten times GDP at
the end of 2010. Yet within this rapid increase in total assets lies a remarkable fact: the
percentage of all assets that can be considered “safe” has remained very stable over time.
Specifically, the percentage of all assets represented by the sum of U.S. government debt and by
the safe component of private financial debt, which we call the “safe-asset share”, has remained
close to 33 percent in every year since 1952. In this paper, we document the stability of the safe-
asset share, analyze its composition and dynamics, and briefly examine some of the policy
implications of our results.
The dynamics of the safe-asset share are important for economists, policymakers, and
regulators to understand because “safe” debt plays a major role in facilitating trade. Gary Gorton
and George Pennacchi (1990) argue that the main purpose of financial intermediaries is to
produce “safe” debt, with bank deposits as the quintessential example. Most financial-sector
debt has the primary feature that it is information-insensitive, that is, it is immune to adverse
selection in trading because agents have no desire to acquire private information about the
current health of the issuer (see Tri Vi Dang, Gorton, and Bengt Holmström (2010)). Treasuries,
Agencies, and other forms of highly-rated government debt also have this feature. To the extent
that debt is information-insensitive, it can be used efficiently as collateral in financial
transactions, a role in finance that is analogous to the role of money in commerce. Thus,
information-insensitive or “safe” debt is socially valuable. Importantly, the stability of the safe-
asset share implies that the demand for information-insensitive debt has been relatively constant
as a fraction of the total assets in the economy. Given the rapid amount of change within the
economy over the past sixty years, the relatively constant demand for safe debt suggests an

2
underlying transactions technology that is not well understood. Thus, we view this paper as part
of a larger research agenda aimed at understanding the role of financial-sector debt within the
economy.
While the safe-asset share has remained constant, the components of the safe-asset share
have changed dramatically over time. Historically, Treasuries and bank deposits constituted the
vast majority of safe debt. Over the past thirty years, however, an entirely new segment of the
financial sector known as the “shadow banking sector” has emerged which produces a material
fraction of the safe debt in the economy. The shadow banking sector has largely escaped (and
continues to escape) the attention of regulators and policymakers, much to the chagrin of many
participants in the economy. However, the constancy of the safe asset share implies that
regulators and policymakers should tread carefully when considering any new regulations or
legislation that would potentially limit the production function of the financial sector. If the
demand for information-insensitive debt is constant, attempts to regulate the shadow banking
sector too onerously may simply push the creation of safe debt to other sectors of the economy,
where it would (presumably) be produced less efficiently. Likewise, attempts to impose
additional regulation on the traditional banking sector may backfire by pushing more of the
production of safe debt into the shadow banking sector. In short, regulators and policymakers
must adroitly balance the need to improve financial stability with the simultaneous need to
maintain enough liquid, safe debt in the economy to meet the demand for such debt. This
requires a better understanding of the drivers of the demand for safe debt, which we believe
should be an important area of research interest in future years.
3
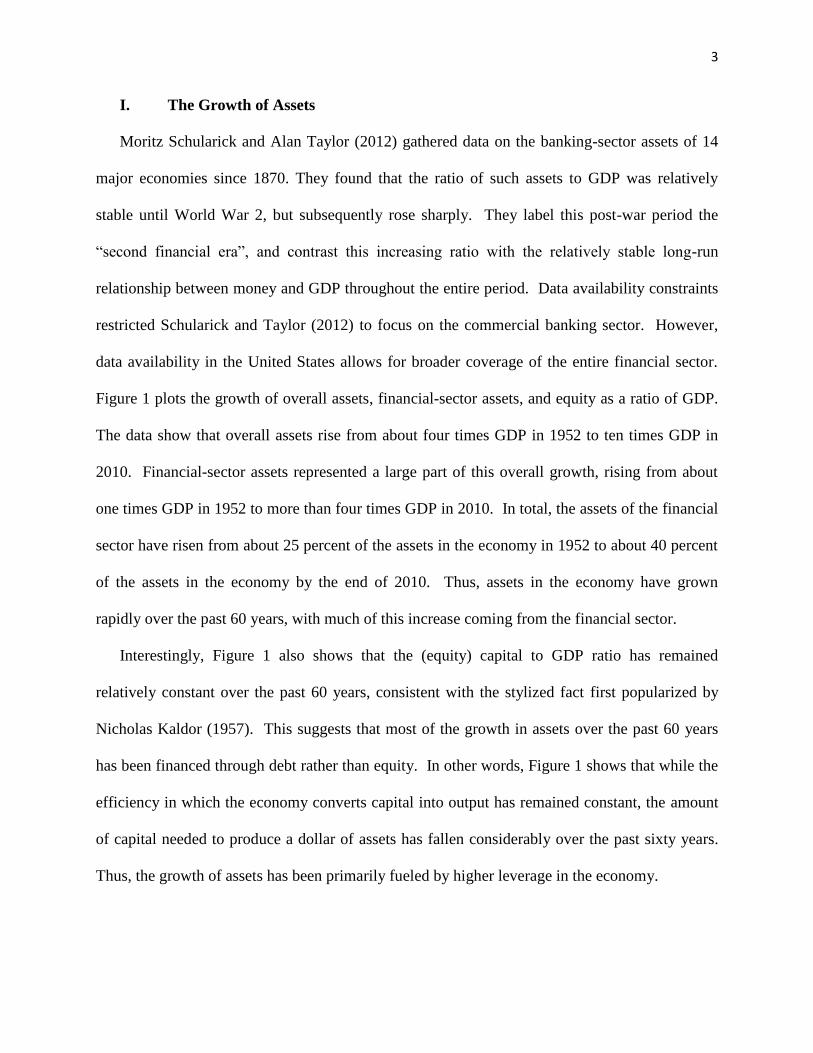
I. The Growth of Assets
Moritz Schularick and Alan Taylor (2012) gathered data on the banking-sector assets of 14
major economies since 1870. They found that the ratio of such assets to GDP was relatively
stable until World War 2, but subsequently rose sharply. They label this post-war period the
“second financial era”, and contrast this increasing ratio with the relatively stable long-run
relationship between money and GDP throughout the entire period. Data availability constraints
restricted Schularick and Taylor (2012) to focus on the commercial banking sector. However,
data availability in the United States allows for broader coverage of the entire financial sector.
Figure 1 plots the growth of overall assets, financial-sector assets, and equity as a ratio of GDP.
The data show that overall assets rise from about four times GDP in 1952 to ten times GDP in
2010. Financial-sector assets represented a large part of this overall growth, rising from about
one times GDP in 1952 to more than four times GDP in 2010. In total, the assets of the financial
sector have risen from about 25 percent of the assets in the economy in 1952 to about 40 percent
of the assets in the economy by the end of 2010. Thus, assets in the economy have grown
rapidly over the past 60 years, with much of this increase coming from the financial sector.
Interestingly, Figure 1 also shows that the (equity) capital to GDP ratio has remained
relatively constant over the past 60 years, consistent with the stylized fact first popularized by
Nicholas Kaldor (1957). This suggests that most of the growth in assets over the past 60 years
has been financed through debt rather than equity. In other words, Figure 1 shows that while the
efficiency in which the economy converts capital into output has remained constant, the amount
of capital needed to produce a dollar of assets has fallen considerably over the past sixty years.
Thus, the growth of assets has been primarily fueled by higher leverage in the economy.
4
Figure 1: The Asset-GDP Ratio
Source: Federal Reserve Flow of Funds
II. The Stability of the Safe-Asset Share
While the assets of the financial sector and the economy as a whole have rapidly grown, the
fraction of “safe” assets in the economy has remained relatively constant. In this section, we
document the stability of the safe-asset share. Our definition of “safe” assets includes assets that
are either directly or indirectly used in an information-insensitive fashion, i.e. as money. The
key components of “safe” debt include bank deposits, money market mutual fund shares,
commercial paper, federal funds and repurchase agreements (“repo”), short-term interbank loans,
Treasuries, agency debt, municipal bonds, securitized debt, and high-grade financial-sector
corporate debt. The latter five categories of debt are commonly used as collateral in repo
transactions and the asset-backed commercial paper market, and prior to the financial crisis, repo
lenders did not demand excess collateral (“haircuts”) from borrowers when these assets were
0
1
2
3
4
5
0
2
4
6
8
10
121
95
21
95
41
95
61
95
81
96
01
96
21
96
41
96
61
96
81
97
01
97
21
97
41
97
61
97
81
98
01
98
21
98
41
98
61
98
81
99
01
99
21
99
41
99
61
99
82
00
02
00
22
00
42
00
62
00
82
01
0
Total Assets / GDP
Financial Sector Assets / GDP (right axis)
Equity / GDP (right axis)

5
deposited as collateral. Hence, at least until the crisis, these assets were information-insensitive
(Gary Gorton and Andrew Metrick (2012)). From the list above, it is clear that most forms of
safe debt are issued by the government and the financial sector. While an argument can be made
that certain types of non-financial corporate debt are “safe” according to the definition above, the
size of the market for this debt is very small relative to the size of the other markets in question.
Thus, we restrict our attention to safe, information-insensitive debt issued by the government and
the financial sector.
We compute the fraction of safe debt in the economy using data from the Federal Reserve’s
Flow of Funds database. We begin by examining the total liabilities of the government and the
financial sector, as well as the total liabilities and equity in all sectors (which approximates total
assets). We then make a number of adjustments to arrive at a calculation for the amount of safe
debt in the economy. First, we remove U.S. government securities held by federal retirement
programs and loans from the federal government to states from both government liabilities and
total assets, since these essentially represent intra-governmental loans. We also move non-MBS
agency debt from the financial liabilities category into the government liabilities category, since
“plain” agency debt is effectively no different than Treasuries. Next, we remove taxes payable,
mortgages taken out by REITs, mutual fund shares, life insurance reserves, and pension fund
reserves from the Fed’s computation of financial liabilities, as these liabilities do not represent
information-insensitive security offerings by financial-sector participants. We also assume that
only 85% of MBS, ABS, and other forms of long-term debt issued by the financial sector are
considered information-insensitive, and therefore safe enough to use in financial transactions.
Likewise, we remove life insurance reserves and retiree health care funds from the computation
of “safe” government liabilities, as these liabilities are not information-insensitive. After making
6
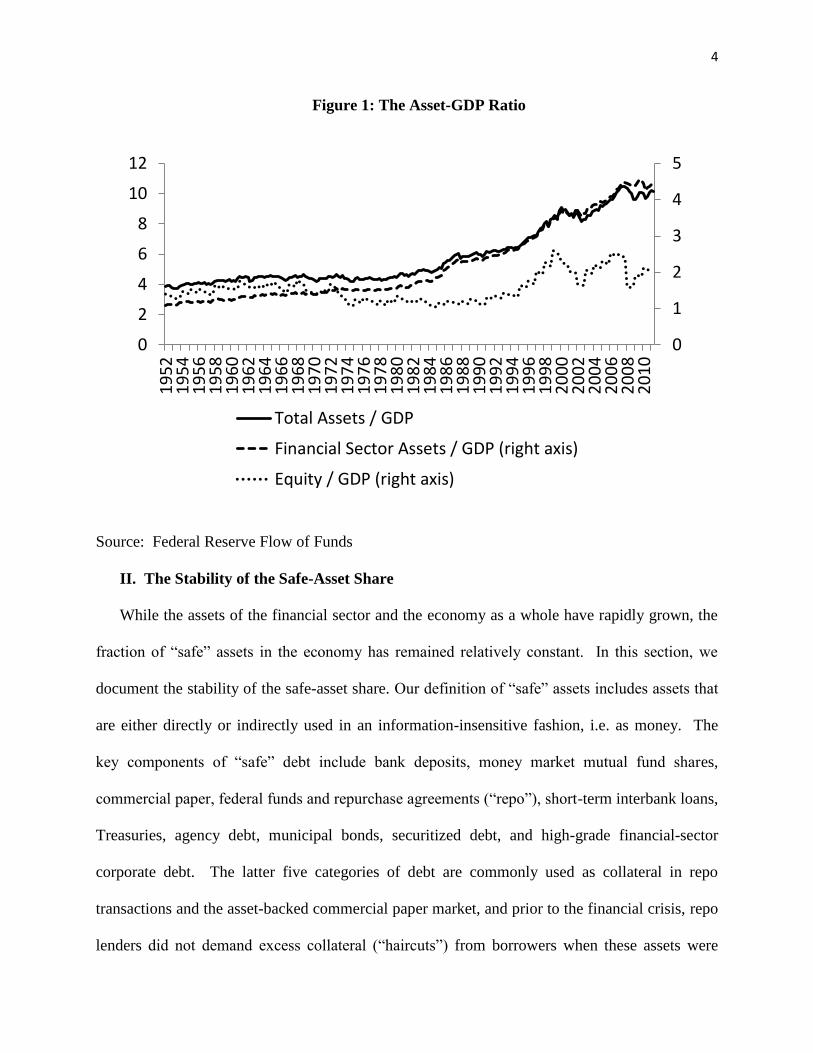
the adjustments listed above, we then compute a “high” and “low” estimate of the amount of safe
debt in the economy. Our high estimate of safe debt encompasses all remaining government and
financial-sector liabilities, which are largely comprised of Treasuries, municipal bonds, short-
term and long-term corporate debt, securitized debt, and other miscellaneous liabilities. Our low
estimate excludes miscellaneous financial liabilities, loans, a number of accounts involving
payables, and other liabilities that are not routinely traded. The Appendix posted on the AER
web site provides more detail on what items are included in both of our scenarios.
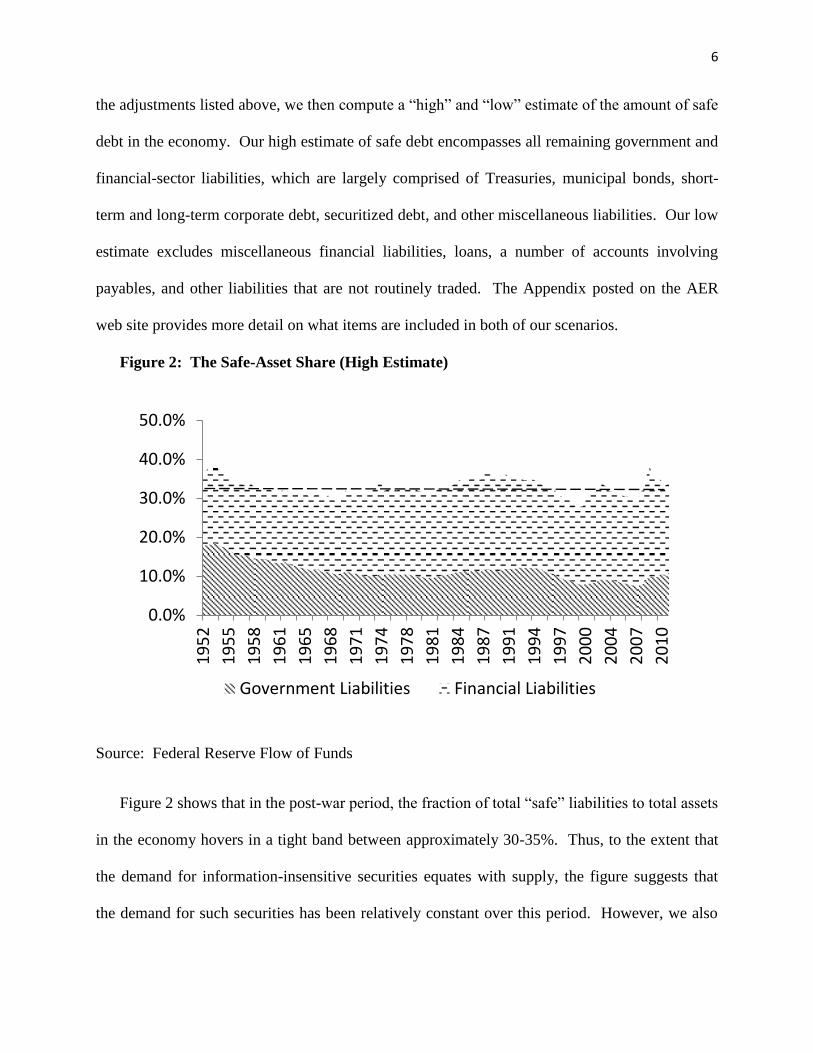
Figure 2: The Safe-Asset Share (High Estimate)
Source: Federal Reserve Flow of Funds
Figure 2 shows that in the post-war period, the fraction of total “safe” liabilities to total assets
in the economy hovers in a tight band between approximately 30-35%. Thus, to the extent that
the demand for information-insensitive securities equates with supply, the figure suggests that
the demand for such securities has been relatively constant over this period. However, we also
0.0%
10.0%
20.0%
30.0%
40.0%
50.0%
19
52
19
55
19
58
19
61
19
65
19
68
19
71
19
74
19
78
19
81
19
84
19
87
19
91
19
94
19
97
20
00
20
04
20
07
20
10
Government Liabilities Financial Liabilities

7
wish to stress that a number of the components of safe debt in Figure 2 are likely measured with
error. Hence, until better data becomes available, our results should be mostly viewed as
suggestive.
To examine the demand for safe debt more closely, we regress the ratio of (Financial +
Government Liabilities)/Total Assets against a time trend using quarterly data from 1952-2011.
Panel A of Table 1 shows that the ratio of financial and government liabilities to total assets has
remained fairly constant over the past 60 years at around 33% under our high estimate of safe
debt and 31% under our low estimate of safe debt. While the time trend variable in Table 1 is
statistically significant, its economic significance is marginal: over 239 quarters, the total
predicted decrease in the ratio is only 1.5% under the high estimate and 5% under the low
estimate. Figure 2 also suggests that government debt and bank debt may be substitutes; as
government debt decreases as a fraction of total assets, debt issued by financial intermediaries
tends to increase, and vice versa. To examine this possibility in more detail, we regress the
fraction of private financial liabilities in the economy against the fraction of government
liabilities in the economy. Consistent with the view that financial liabilities and government
liabilities are substitutes, Panel B of Table 1 shows that the coefficients on government liabilities
are strongly negative.
These results suggest that financial liabilities and government liabilities may be substitutes.
However, since both financial and government liabilities appear in the denominator on both
sides, it may be possible to obtain the results in Panel B through a mechanical relationship. To
analyze this possibility, we simulated 10,000 regressions identical to the regressions in Table 1
for our high estimate of safe debt using Monte Carlo methods. Specifically, for each of the
10,000 iterations, we constructed eight new time series (there are eight major series in the Fed

8
data) by growing each series’ initial value based on random shocks that were drawn from a
normal distribution using the mean and standard deviation of the series’ growth rate over our
sample period. We then computed the variables shown in Table 1 from our simulated data and
estimated the regressions reported in Table 1.
Table 1: The Safe-Asset Share and the Substitutability of Government and Financial Debt
Dependent Variable Independent Variable Coefficient Std. Error t-Statistic R2
Panel A. The Safe-Asset Share High Estimate Safe Assets / Total Assets Constant 0.332 0.003
0.00002
0.332
114.76 -1.72
0.012
Time Trend -0.00004 0.00002 -1.72
Low Estimate Safe Assets / Total Assets Constant 0.310 0.003 122.73 0.367
Time Trend -0.00021 0.00002 -11.71
Panel B. The Substitutability of Government and Financial Debt
High Estimate Financial-sector Liabilities / Constant 0.267 0.006 48.17 0.286
Total Assets Government Liabilities / -0.466 0.048 -9.74
Total Assets
Low Estimate Financial-sector Liabilities / Constant 0.195 0.004 55.44 0.105
Total Assets Government Liabilities / -0.168 0.032 -5.28
Total Assets
Notes: See text for variable definitions. The sample period spans 239 quarters from Q1 1952 to Q3 2011.
Sources: Federal Reserve Flow of Funds; Author calculations.
If the coefficients in Table 1 were the result of a mechanical relationship, we would expect
the coefficients in Table 1 to lie roughly in the middle of our simulated coefficients. However,
fewer than 7% of our 10,000 simulated regressions from Panel A produced point estimates
smaller than our reported coefficient. Thus, the simulations suggest that the constancy of the
safe-asset share is not simply an artifact of the ratio computations. In contrast, approximately
30% of our simulated regressions produced point estimates smaller than the coefficient reported
in Panel B of our table, leaving some combination of chance and the mechanical relationship as a
possible explanation for our results in Panel B. However, additional evidence in support of the
substitutability of financial and government debt is provided by Arvind Krishnamurthy and
Annette Vissing-Jorgensen (2010), who find, for example, that the spread between second-tier
commercial paper and first-tier commercial paper falls when the supply of Treasuries expands,
suggesting that top-tier commercial paper is a substitute for Treasuries. Robin Greenwood,

9
Samuel G. Hanson and Jeremy C. Stein (2010) also provide evidence that short-term financial-
sector debt and government debt are substitutes. Neither of these papers examines longer-term
financial-sector obligations that may be used as collateral for repo or other forms of short-term
debt. Hence, to our knowledge, our findings on safe debt are novel.
III. Safe Financial-Sector Debt: A Closer Look
The classic form of safe financial debt is bank deposits. But while bank deposits comprised
the vast majority of safe financial debt before 1980, the share of deposits has dropped by more
than one half from its peak. Figure 3 plots the details. In the figure, “money-like debt” refers to
commercial paper, net repurchase agreements, federal funds, money market mutual fund assets,
interbank transactions, broker-dealer payables, and broker-dealer security credits. More details
are provided in the Appendix.
The figure shows that bank deposits were near 80 percent of the total through the 1950s and
1960s, and remained as high as 70 percent as late as 1978. This percentage then began a steep
30-year decline, with the rise of money market mutual funds, broker-deal commercial paper,
securitized debt from GSEs, and other asset-backed securities. On the eve of the financial crisis,
the share of bank deposits had fallen to 27 percent. At the end of 2010, it stood at a little less
than 32 percent.

10
Figure 3 – The Components of Safe Financial Debt
Source: Federal Reserve Flow of Funds
Taken together, Figures 1, 2, and 3 provide a picture of calm stability (Figure 2) amidst rapid
change (Figures 1 and 3). While the financial system has grown rapidly relative to overall
economic activity, the system itself seems anchored to a constant share of safe, information-
insensitive debt. At the same time, a variety of changes in the financial sector has moved the
production of this debt from their traditional source in bank deposits to newer sources in the
shadow banking sector.
IV. Discussion
The recent financial crisis dramatically revealed that the U.S. financial system has changed
significantly over the last sixty years. The traditional concepts of a “bank” and of “money” are
no longer adequate to describe the world in which we live. In the past thirty years, the shadow
banking system has grown enormously. Furthermore, the ratio of total assets to GDP has grown
by a factor of 2.5 since 1952. Yet despite these significant changes, the safe-asset share has
0%
20%
40%
60%
80%
100%
19
52
19
54
19
56
19
58
19
60
19
62
19
64
19
66
19
68
19
70
19
72
19
74
19
76
19
78
19
80
19
82
19
84
19
86
19
88
19
90
19
92
19
94
19
96
19
98
20
00
20
02
20
04
20
06
20
08
20
10
Deposits Money-like debt
MBS/ABS Debt Corporate Bonds and Loans
Other Liabilities
11
remained constant. This constancy is not by chance and suggests an underlying transactions
technology. The production of total assets appears to require safe debt as an input. Little is
known about this transactions technology.
Figure 2 suggests that the demand for safe or information-insensitive debt exceeds the supply
of U.S. Treasuries outstanding. The private sector can produce substitutes for government debt
in the form of short-term instruments or long-term debt securities that can be used as collateral or
as safe stores of value. Consistent with the rise of the shadow banking system, the main
producers of safe debt are not commercial banks, whose share of private safe debt has been
shrinking. Of course, the government could attempt to completely satiate the demand for safe
debt by issuing more Treasuries. In such a world, there would be no need for “safe” private
financial-sector debt outside of banking deposits. However, recent developments in sovereign
debt markets suggest that even governments cannot issue too much debt without such debt
becoming information-sensitive. Thus, if the demand for safe assets cannot be met in whole by
the government, near-riskless debt issued by the financial sector plays an important role in
facilitating trade. This makes the “safe” debt provided by the financial sector socially valuable.
These findings are important for banking regulatory policy. The traditional banking system
is no longer the central actor in the production of safe debt. Small policy changes with regard to
this sector may well drive activity further into the shadow banking sector. Furthermore, since
the demand for safe assets is roughly constant, attempts to squelch the shadow banking sector
would simply push the production of safe debt into another, less efficient sector.
A more striking conclusion is that despite the size and importance of the financial system, we
currently know very little about the demand for and supply of “safe” debt. While we hope that
our work is a start in the right direction, our paper raises a number of important questions. Why

12
is the safe-asset share constant? Did the demand for safe assets play a role in the rise of the
shadow banking system? What is the underlying transactions technology that relates the safe-
asset share to the rest of the economy? We hope that these and other questions regarding safe
debt will be addressed through future research.

13
APPENDIX
Flow of Funds
Line item Identifier High estimate Low estimate
FINANCIAL LIABILITIES
Financial business; total liabilities FL794190005.Q
can be broken down as follows:
Financial business; net interbank transactions; liability FL794110005.Q Y Y
Financial business; checkable deposits and currency; liability FL793120005.Q Y Y
Financial business; total time and savings deposits; liability FL793130005.Q Y Y
Money market mutual funds; total financial assets FL634090005.Q Y Y
Financial business; federal funds and security repurchase agreements; liability FL792150005.Q Y Y
Security brokers and dealers; trade payables; liability FL663170003.Q Y N
Security brokers and dealers; security credit; liability FL663167005.Q Y N
Financial business; credit market instruments; liability FL794104005.Q
Financial business; open market paper; liability FL793169100.Q
U.S.-chartered commercial banks; asset-backed commercial paper; liability FL723169103.Q Y Y
Bank holding companies; commercial paper; liability FL733169103.Q Y Y
Issuers of asset-backed securities; commercial paper, excluding U.S.-chartered
commercial banks' asset-backed commercial paper; liability FL673169105.Q Y Y
Finance companies; commercial paper; liability FL613169100.Q Y Y
Real estate investment trusts; commercial paper; liability FL643169103.Q Y Y
Funding corporations; commercial paper; liability FL503169105.Q Y Y
Private depository institutions and money market mutual funds excluding bank
holding companies; bankers' acceptances; liability FL783169605.Q Y Y
Government-sponsored enterprises and federally related mortgage pools; U.S.
government agency securities; liability FL423161705.Q
Government-sponsored enterprises; other GSE issues; liability FL403161785.Q 85% 85%
Government-sponsored enterprises; securitized GSE issues; liability FL403161795.Q 85% 85%
Agency-and GSE-backed mortgage pools; total mortgages; asset FL413065005.Q 85% 85%
Financial business; corporate and foreign bonds; liability FL793163005.Q
U.S.-chartered commercial banks; corporate and foreign bonds; liability FL723163003.Q 85% 85%
Bank holding companies; corporate and foreign bonds; liability FL733163003.Q 85% 85%
Savings institutions OTS reporters; corporate and foreign bonds; liability FL443163053.Q 85% 85%
Issuers of asset-backed securities; corporate and foreign bonds; liability FL673163005.Q 85% 85%
Finance companies; corporate and foreign bonds; liability FL613163003.Q 85% 85%
Real estate investment trusts; corporate and foreign bonds; liability FL643163003.Q 85% 85%
Security brokers and dealers; corporate and foreign bonds; liability FL663163003.Q 85% 85%
Funding corporations; corporate and foreign bonds where the proceeds are down-
streamed to broker-dealer subsidiaries by investment banks that are holding-company
parents; liability FL503163005.Q 85% 85%
Private nonbank financial institutions; bank loans not elsewhere classified; liability FL693168005.Q 85% N
Financial business; other loans and advances; liability FL793169005.Q 85% N
Real estate investment trusts; total mortgages; liability FL643165005.Q N N
Mutual funds; mutual fund shares; liability FL653164205.Q N N
Life insurance companies; life insurance reserves; liability FL543140003.Q N N
Households and nonprofit organizations; pension fund reserves; asset FL153050005.Q N N
Financial business; taxes payable; liability FL793178005.Q N N
Financial business; total miscellaneous liabilities FL793190005.Q Y N
Included in "safe" category?

14
Definitions: Y = Included; N = Not included; 85% = Since not all financial debt is “safe,” only 85% of
the total amount was included in the “safe” category; X = Removed from calculation completely.
Other notes:
1) In both scenarios, “Government-sponsored enterprises; other GSE issues; liability” was moved from
Financial to Government liabilities.
2) In Figure 3, “MBS/ABS Debt” includes all GSE and private-label MBS debt, as well as all ABS debt.
“Corporate Bonds and Loans” includes "Financial business; corporate and foreign bonds; liability",
"Private nonbank financial institutions; bank loans not elsewhere classified; liability", and "Financial
business; other loans and advances; liability."
3) Series labeled with the term “asset” above represent series in which assets = liabilities. Hence, we are
actually measuring liabilities. This accounting mechanism comes directly from the Flow of Funds.
Flow of Funds
Line item Identifier High estimate Low estimate
GOVERNMENT LIABILITIES
Federal government; total liabilities FL314190005.Q
can be broken down as follows:
Federal government; special drawing rights (SDRs) allocations; liability FL313111303.Q Y Y
Monetary authority; SDR certificates issued by federal government; asset FL713014003.Q Y Y
Federal government; Treasury currency; liability FL313112003.Q Y Y
Federal government; credit market instruments; liability FL314104005.Q
Federal government; U.S. savings bonds; liability FL313161400.Q Y Y
Federal government; Treasury securities, excluding U.S. savings bonds, and including
special U.S. Treasury securities held by FHLB; liability FL313161105.Q Y Y
Federal government; budget agency securities; liability FL313161705.Q Y Y
Federal government; multifamily residential mortgages; liability FL313165403.Q Y Y
Federal government; trade payables; liability FL313170005.Q Y N
Federal government; life insurance reserves; liability FL313140003.Q N N
Federal government; total miscellaneous liabilities, including nonmarketable government
securities held by federal government retirement funds FL313190005.Q
Federal government retirement funds; nonmarketable Treasury securities; asset FL343150005.Q X X
Federal government; total miscellaneous liabilities, excluding nonmarketable
securities held by federal government retirement funds FL313190015.Q
Federal government; liability due to FICO FL313193013.Q Y N
Federal government; postal savings system deposits; liability FL313131003.Q Y Y
Federal government; retiree health care funds; liability FL313195105.Q N N
State and local governments, excluding employee retirement funds; total liabilities FL214190005.Q
can be broken down as follows:
State and local governments, excluding employee retirement funds; credit market
instruments; liability FL214104005.Q
State and local governments, excluding employee retirement funds; municipal
securities and loans; liability FL213162005.Q Y Y
State and local governments, excluding employee retirement funds; short-term
municipal securities and loans; liability FL213162400.Q Y Y
State and local governments, excluding employee retirement funds; long-term
municipal securities and loans; liability FL213162205.Q Y Y
State and local governments, excluding employee retirement funds; U.S. government
loans; liability FL213169203.Q X X
State and local governments, excluding employee retirement funds; trade payables;
liability FL213170003.Q Y N
Included in "safe" category?

15
REFERENCES
Dang, Tri Vi, Gary Gorton, and Bengt Holmström. 2010. “Ignorance, Debt and Financial
Crises.” Working paper.
Gorton, Gary and Andrew Metrick. 2012. “Securitized Banking and the Run on Repo.”
Journal of Financial Economics, forthcoming.
Gorton, Gary and George Pennacchi. 1990. “Financial Intermediaries and Liquidity
Creation.” Journal of Finance 45 (1): 49-71.
Greenwood, Robin, Samuel G. Hanson and Jeremy C. Stein. 2010. “A Comparative-
Advantage Approach to Government Debt Maturity.” Working paper.
Kaldor, Nicholas. 1957. “A Model of Economic Growth.” Economic Journal 67 (268): 591-
624.
Krishnamurthy, Arvind and Annette Vissing-Jorgensen. 2010. “The Aggregate Demand for
Treasury Debt.” Working paper.
Schularick, Moritz and Alan M. Taylor. 2012. “Credit Booms Gone Bust: Monetary Policy,
Leverage Cycles and Financial Crises, 1870-2008.” American Economic Review, forthcoming.