the safety impacts of increasing the speed limit to 70 …
TRANSCRIPT

THE SAFETY IMPACTS OF INCREASING THE SPEED LIMIT
TO 70 MPH IN THE STATE OF WISCONSIN
by
Kirsten L. Brose
A thesis submitted in partial fulfillment of
the requirements for the degree of
Master of Science
Civil and Environmental Engineering
At the
UNIVERSITY OF WISCONSIN-MADISON
2016

i
Abstract
The U.S. Department of Transportation’s National Highway Traffic Safety Administration
determined in May 2014 that the social and economic burden of vehicle crashes in 2010 cost
the United States $836 billion dollars (1). Several factors play a role in this price tag, one of
which is speed. The United States has undergone several significant nationwide
modifications to speed limit restrictions throughout its history. These changes include the
1974 National Maximum Speed Law which mandated a top posted speed of 55 mph, the
1987 Surface Transportation and Uniform Relocation Act which allowed states to increase
speeds to 65 mph and the 1995 National Highway System Designation Act which gave speed
limit authority back to individual states.
Today, only 7 states maintain a 65 mph speed limit (including Hawaii which has the nation’s
lowest maximum speed limit at 60 mph). Some states increased posted highway speeds to
as high as 80 mph, including Texas which now has posted speed limits as high as 85 mph.
On May 20, 2015, Wisconsin became the last Midwestern state to increase posted speed
limits on select Interstate highways to 70 mph. The first changes occurred on 14 select
roadway segments across the state, and since then, several other segments of Interstate
highway have been increased as well.
The increase in speed limit has brought with it great concern that the higher speeds will
correlate to more dangerous high speed driving, higher incident rates, greater fatalities on the
roadway and an overall more dangerous driving environment. Through the application of two
WisTransPortal web applications; the MV4000 crash database and the VSPOC (Volume,
ii
Speed and Occupancy) Traffic Detector database these concerns were evaluated by analyzing
incidents, traveled speeds and roadway volumes.
The posted speed limit increase occurred in mid-June of 2015 across the state of Wisconsin.
Therefore, the analysis of this research focused on data from July through December of the
calendar years 2005 to 2015. This allowed for 14 years of data prior to the increase in speed
limit to be compared to the most recent one year of data post speed limit increase,
maintaining the same monthly duration to allow for consistency. The research looked at
comparing total incidents occurring on the 14 routes, as well as fatal incidents, alcohol
related incidents and speed related incidents. The presumption that a 5 mph posted speed
limit increase directly correlates to a 5 mph operating speed increase was also evaluated. This
analysis was performed by randomly selecting eight days throughout the year and comparing
the average operating speed before and after the June 2015 posted speed limit increase.
Additionally the two datasets were combined to study incidents per thousand vehicles on the
roadway.
In the first five months after the posted speed increase to 70 mph, it was determined that the
higher speed limit did not show a statistically significant increase in the total number of
incidents occurring on the segments of roadway increased to 70 mph. Additionally, those
routes showed an increase in operating speed of 1.5 mph, well below the posted speed limit
increase of 5 mph. Incidents per thousand vehicles on the roadway was also statistically
lower in 2015, when the posted speed was increased to 70 mph. As of January 1, 2016, it can
be concluded that the increase in posted speed limit to 70 mph has not led to a greater

iii
number of crashes on the Interstate highways in the state of Wisconsin. Additionally, average
operating speeds have increased by 1.5 mph, well below the 5 mph posted speed increase.

iv
Acknowledgments
I would like to thank all those who supported me during this research. Specifically I would
like to thank my advisor, Dr. Noyce for his continued support from my undergraduate studies
into my graduate research. I would like to thank Dr. David Noyce, Dr. Sue Ahn and Dr.
Teresa Adams for being members of my thesis defense committee. Additionally I would like
to thank the Traffic Operations and Safety Lab for their guidance in the use of their web
based applications. And lastly I would like to thank my parents and family for their
unwavering support throughout my undergraduate and graduate career at the University of
Wisconsin-Madison.

v
Table of Contents
1 INTRODUCTION ................................................................................................................. 1
1.1 Contributing Factors to Incidents.................................................................................... 1
1.2 Speed as a Factor ............................................................................................................ 3
1.3 Objectives ....................................................................................................................... 6
2 LITERATURE REVIEW ...................................................................................................... 9
2.1 History............................................................................................................................. 9
2.2 Safety Impacts of the Surface Transportation and Uniform Relocation Act ................ 10
2.3 Safety Impacts of National Highway System Designation Act .................................... 13
2.4 Midwest Impacts ........................................................................................................... 16
2.4.1 Michigan ................................................................................................................ 16
2.4.2 Indiana.................................................................................................................... 17
2.4.3 Iowa........................................................................................................................ 18
2.4.4 Illinois .................................................................................................................... 20
2.4.5 Minnesota ............................................................................................................... 20
2.4.6 Ohio........................................................................................................................ 21
3 SETTING THE APPROPRIATE SPEED ........................................................................... 22
3.1 MUTCD ........................................................................................................................ 22
3.2 Four Approaches ........................................................................................................... 23
3.2.1 Engineering Approach ........................................................................................... 23
3.2.2 Expert System ........................................................................................................ 25
3.2.3 Optimal Speeds ...................................................................................................... 26
3.2.4 Injury Minimization ............................................................................................... 26
3.3 Sight Distances.............................................................................................................. 27
3.3.1 Stopping Sight Distance ......................................................................................... 27
3.3.2 Decision Sight Distance ......................................................................................... 30
3.3.3 Design Speed ......................................................................................................... 31
3.4 Solomon Curve ............................................................................................................. 33
4 DATA .................................................................................................................................. 38
4.1 MV4000 Crash Data ..................................................................................................... 38

vi
4.2 V-SPOC Traffic Detector ............................................................................................. 46
4.3 Incident & Volume Data ............................................................................................... 51
5 DATA ANALYSIS .............................................................................................................. 51
5.1 Crash Rates ................................................................................................................... 51
5.2 Speed Impacts ............................................................................................................... 55
5.3 Incidents and Volumes .................................................................................................. 58
6 CONCLUSIONS.................................................................................................................. 60
7 FUTURE RECOMMENDATIONS .................................................................................... 61
8 REFERENCES .................................................................................................................... 63
9 APPENDIXES ..................................................................................................................... 66
9.1 Appendix A: Incident Data ........................................................................................... 66
9.2 Appendix B: Route Detector ID Numbers .................................................................... 76
9.3 Appendix C: Historical Weather Data .......................................................................... 87
9.4 Appendix D: Incidents per 1,000 Vehicles ................................................................... 89

vii
LIST OF FIGURES
Figure 1: Maximum posted speeds for each state (2015) ......................................................... 4
Figure 2: Speed in relation to chances of being in a crash........................................................ 5
Figure 3: Initial segments of roadway in Wisconsin increased to 70 mph ............................... 6
Figure 4: Significance Levels in Response to Increasing Speed Limits from 55 to 65 mph .. 13
Figure 5: Fatality Rates for Study & Comparison Group from Farmer et al. ......................... 15
Figure 6: History of Michigan Speed Limit Laws .................................................................. 17
Figure 7: Iowa Study Fatal Crashes before and after speed change ....................................... 19
Figure 8: Illinois Interstates that increased speed limits to 70 mph ........................................ 20
Figure 9: Relationship between Posted, Operating & Design Speed...................................... 32
Figure 10: Solomon U-Shape Curve relationship for accident involvement rate ................... 33
Figure 11: West & Dunn relative involvement rate curve ...................................................... 35
Figure 12: Summary of U-shaped curve analysis ................................................................... 36
Figure 13: First round of 70 mph speed limit increases in Wisconsin.................................... 39
Figure 14: Routes 1-14: Total Incidents July – December (2005-2015) ................................ 42
Figure 15: Routes 1-14: Alcohol Related Incidents July – December (2005-2015)............... 44
Figure 16: Routes 1-14: Speed Related Incidents July – December (2005-2015) .................. 45
Figure 17: Routes 1-14: Fatal Incidents July – December (2005-2015) ................................. 46
Figure 18: Routes 1-14: Incidents per 1,000 Vehicles ............................................................ 59
Figure 19: Route 1 Total July thru December Incidents 2005 to 2015 ................................... 67
Figure 20: Route 2 Total July thru December Incidents 2005 to 2015 ................................... 67
Figure 21: Route 3 Total July thru December Incidents 2005 to 2015 ................................... 68
Figure 22: Route 4 Total July thru December Incidents 2005 to 2015 ................................... 68
Figure 23: Route 5 Total July thru December Incidents 2005 to 2015 ................................... 69
Figure 24: Route 6 Total July thru December Incidents 2005 to 2015 ................................... 69
Figure 25: Route 7 Total July thru December Incidents 2005 to 2015 ................................... 70
Figure 26: Route 8 Total July thru December Incidents 2005 to 2015 ................................... 70
Figure 27: Route 9 Total July thru December Incidents 2005 to 2015 ................................... 71
Figure 28: Route 10 Total July thru December Incidents 2005 to 2015 ................................. 71
Figure 29: Route 11 Total July thru December Incidents 2005 to 2015 ................................. 72
Figure 30: Route 12 Total July thru December Incidents 2005 to 2015 ................................. 72
Figure 31: Route 13 Total July thru December Incidents 2005 to 2015 ................................. 73
Figure 32: Route 14 Total July thru December Incidents 2005 to 2015 ................................. 73
Figure 33: Routes 1-14: Total Incidents July thru December 2005 to 2015 ........................... 74
Figure 34: Routes 1-14: Total Alcohol Related Incidents July thru December 2005 to 2015 74
Figure 35: Routes 1-14: Total Speed Related Incidents July thru December 2005 to 2015 ... 75
Figure 36: Routes 1-14 Total Fatalities July thru December 200 5 to 2015 ........................... 75
Figure 37: Route 1: Incidents per 1,000 Vehicles................................................................... 89
Figure 38: Route 2: Incidents per 1,000 Vehicles................................................................... 89
viii
Figure 39: Route 3: Incidents per 1,000 Vehicles................................................................... 90
Figure 40: Route 4: Incidents per 1,000 Vehicles................................................................... 90
Figure 41: Route 6: Incidents per 1,000 Vehicles................................................................... 91
Figure 42: Route 7: Incidents per 1,000 Vehicles................................................................... 91
Figure 43: Route 8: Incidents per 1,000 Vehicles................................................................... 92
Figure 44: Route 9: Incidents per 1,000 Vehicles................................................................... 92
Figure 45: Route 10: Incidents per 1,000 Vehicles................................................................. 93
Figure 46: Route 11: Incidents per 1,000 Vehicles................................................................. 93
Figure 47: Route 13: Incidents per 1,000 Vehicles................................................................. 94
Figure 48: Route 14: Incidents per 1,000 Vehicles................................................................. 94
LIST OF TABLES
Table 1: Phase 1 increases to 70 mph ....................................................................................... 7
Table 2: Posted maximum speed by state (2016) ................................................................... 10
Table 3: 85th percentile speeds for a sampling of Ohio Interstates ........................................ 22
Table 4: Road Risk Method base speed limits by Roadway Classifications .......................... 25
Table 5: Injury Minimization speed limits defined by fatality avoidance .............................. 27
Table 6: Breaking reaction distance, breaking distance & SSD ............................................. 30
Table 7: 14 Original sections of Interstate converted to 70 mph in Wisconsin ...................... 40
Table 8: Incidents totals for each Route July-Dec .................................................................. 41
Table 9: Route Numbers, and corresponding segments of Interstate ..................................... 43
Table 10: Injury Code and Definition ..................................................................................... 45
Table 11: Total Incidents, Alcohol Related, Speed Related & Fatal Incidents ...................... 46
Table 12: Average Traveled Speed per Route on Select Days ............................................... 50
Table 13: Route Incident Totals June thru December and Significance ................................. 54
Table 14: Total, Alcohol, Speed & Fatal Incidents and Significance ..................................... 55
Table 15: Difference in average speeds before and after the 70 mph increase ....................... 57
Table 16: Route 1-14: Incidents per 1,000 Vehicles............................................................... 60
Table 17: Route Numbers, and corresponding segments of Interstate ................................... 66
Table 18: Route 1 Detector ID Numbers ................................................................................ 76
Table 19: Route 2 Detector ID Numbers ................................................................................ 77
Table 20: Route 3 Detector ID Numbers ................................................................................ 78
Table 21: Route 4 Detector ID Numbers ................................................................................ 79
Table 22: Route 6 Detector ID Numbers ................................................................................ 80
Table 23: Route 7 Detector ID Numbers ................................................................................ 81
Table 24: Route 8 Detector ID Numbers ................................................................................ 82
Table 25: Route 9 Detector ID Numbers ................................................................................ 82

ix
Table 26: Route 10 Detector ID Numbers .............................................................................. 83
Table 27: Route 11 Detector ID Numbers .............................................................................. 83
Table 28: Route 12 Detector ID Numbers .............................................................................. 84
Table 29: Route 13 Detector ID Numbers .............................................................................. 85
Table 30: Route 14 Detector ID Numbers .............................................................................. 86
Table 31: Weather Data 1st Friday February .......................................................................... 87
Table 32: Weather Data 1st Tuesday February....................................................................... 87
Table 33: Weather Data 3rd Wednesday August .................................................................... 87
Table 34: Weather Data 3rd Saturday August ........................................................................ 87
Table 35: Weather Data 1st Tuesday October ........................................................................ 88
Table 36: Weather Data 1st Saturday October ....................................................................... 88
Table 37: Weather Data 1st Tuesday December ..................................................................... 88
Table 38: Weather Data 1st Saturday December .................................................................... 88
1
1 INTRODUCTION
1.1 Contributing Factors to Incidents
In May of 2014, the U.S. Department of Transportation’s National Highway Traffic Safety
Administration (NHTSA) released a study evaluating the social and economic burden of
vehicle crashes that occurred in the United States in 2010. NHTSA concluded, from the
study, that motor vehicle crashes cost the United States approximately $836 billion dollars
annually (1). Two costs contributed to this price tag including $242 billion dollars in
economic costs, and $594 billion dollars in societal harm such as loss of life, or living a
decreased quality of life as a result of an injury (1). Drunk driving, speeding, distraction,
pedestrian and bicycle involvement and seatbelt use, were all determined to be contributing
factors to the $836 billion dollar price tag. All of these factors play an important role in the
likelihood of being involved in a motor vehicle incident.
Driving under the influence of alcohol was a contributing factor to 18 percent of the
economic cost identified in 2010. Alcohol is classified as a depressant due to the nature of its
interaction with the central nervous system. Alcohol slows the functioning of the central
nervous system, causing a delay in normal brain function. Consumption of alcohol impacts
the information processing center of the brain as well as degrading psychomotor skills,
causing slower response time and reduced hand eye coordination (2). Consuming alcohol,
therefor, results in loss of judgment, loss of concentration on the roadway, reduced visual
perception and judgment as well as reduced reaction time to new information.
Distracted driving meanwhile accounted for 16 percent of the total economic cost (1).
Distracted driving can result from several outside factors including cell phone use, eating
2
while driving, dealing with vehicle passengers or changing the radio. All of these tasks take
the driver’s attention away from the roadway and can result in an incident.
Pedestrians and bicycles were involved in incidents that accounted for 7 percent of the total
economic cost (1). Shared-use roadways require drivers to focus on more than just the motor
vehicles around them, rather looking out for pedestrians and bicycles as well. When drivers
are required to process a significant amount of information, often in very complex
environments, the result can be problematic when the phenomena known as perceptual
blindness occurs. Perceptual blindness is when an individual fails to see something obvious
within their field of vision simply because that is not the stimuli they are looking for. When
vehicle drivers are making different driving maneuvers they are often looking for other
vehicles, rarely for pedestrians and bicycles. Adding the complexity of these roadway users’
results in injuries often more severe than incidents involving two motor vehicles.
Seatbelt use has been proven to be one of the most influential factors in injury severity when
it comes to motor vehicle incidents. Properly wearing safety belts can reduce the severity of
injuries and greatly increase the chances of passengers surviving incidents. Vehicle drivers
and passengers frequently choose not to wear seat belts, for numerous personal reasons,
resulting in 4 percent of the total economic cost of crashes (1).
Lastly, NHTSA looked at the impacts of speeding. Crashes resulting from drivers exceeding
the speed limit, or driving too fast for conditions resulted in 22 percent of the total economic
impact of crashes (2). When drivers exceed the speed limit, the speed variance of all vehicles
on the roadway tends to increase, which research has shown creates a more dangerous
3
driving environment. Increased speeds also increase the time required to stop in emergency
situations and result in a greater distance traveled during emergency braking situations.
1.2 Speed as a Factor
With speed contributing to such a high percentage of the economic burden it is no wonder
that there has been great debate about increasing the statutory speed limits across the United
States. Speed limit regulations have often been a topic of debate throughout the United
States, dating back to 1974, when laws were passed mandating a maximum posted speed of
55 miles per hour. This maximum speed limit debate continues to present day as speeds of 85
miles per hour were recently posted on select portions of Interstate highways throughout
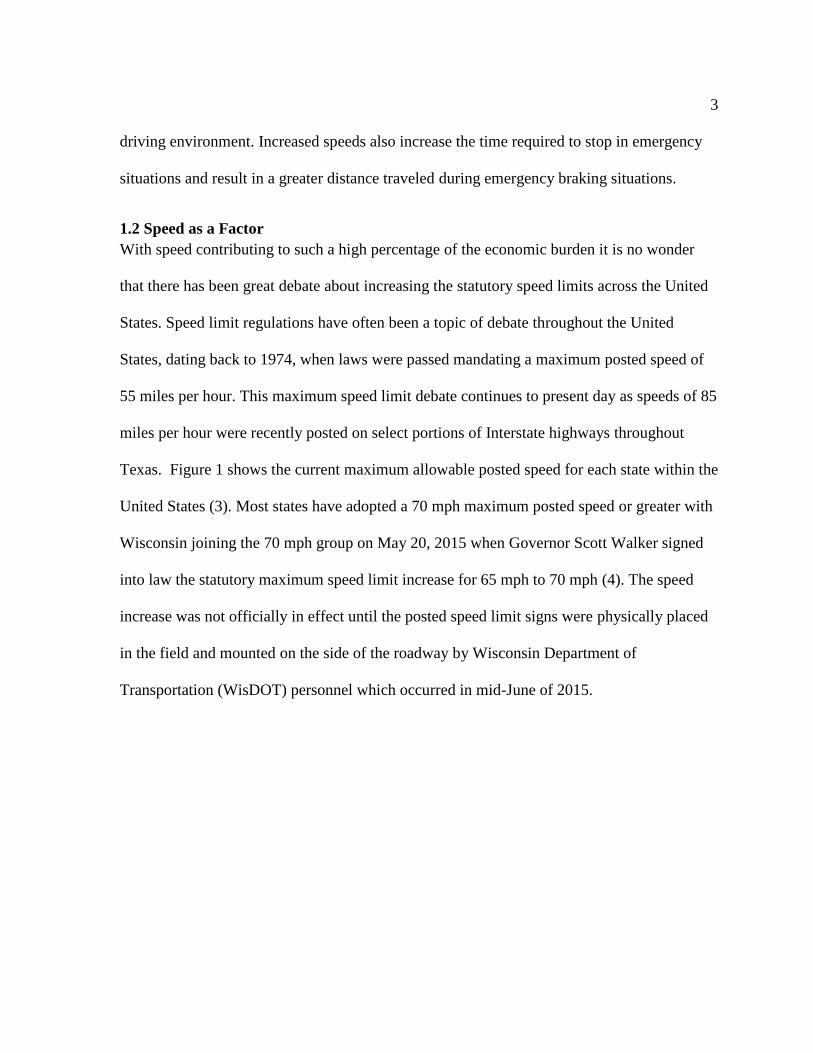
Texas. Figure 1 shows the current maximum allowable posted speed for each state within the
United States (3). Most states have adopted a 70 mph maximum posted speed or greater with
Wisconsin joining the 70 mph group on May 20, 2015 when Governor Scott Walker signed
into law the statutory maximum speed limit increase for 65 mph to 70 mph (4). The speed
increase was not officially in effect until the posted speed limit signs were physically placed
in the field and mounted on the side of the roadway by Wisconsin Department of
Transportation (WisDOT) personnel which occurred in mid-June of 2015.
4
Figure 1: Maximum posted speeds for each state (2015)
Increasing the speed limit to 70 mph in Wisconsin has brought with it great concern about the
impacts on safety. It is widely assumed that increasing the speed limit will put drivers at risk
by increasing the number of incidents and potentially fatalities. It is important to remember
that the speed limit alone should not dictate the speed at which vehicles choose to travel;
rather, the speed limit should represent what drivers are actually choosing to travel. Posted
speed limits are best operationally and in safety when they correlate to the 85th percentile
speed, also known as the prevailing speed. Modern geometric design suggests that the best
roadway conditions are achieved when posted speed equals design speed and equals
operating speed. Figure 2 depicts the relationship between chances of being in an accident in

5
relation to motorist speed, indicating that at the 85th percentile speed drivers are least likely
to be involved in an accident (5). One of the goals of increasing the maximum posted speed
limit to 70 mph to better capture this 85th percentile speed.
Figure 2: Speed in relation to chances of being in a crash
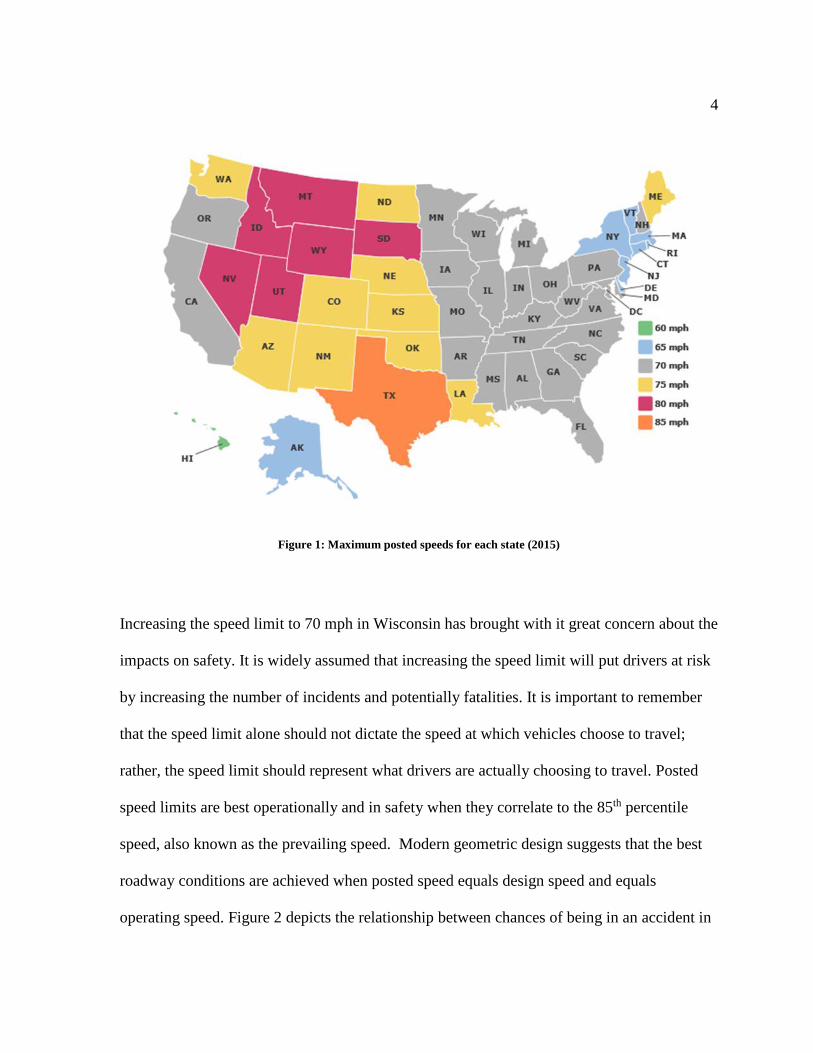
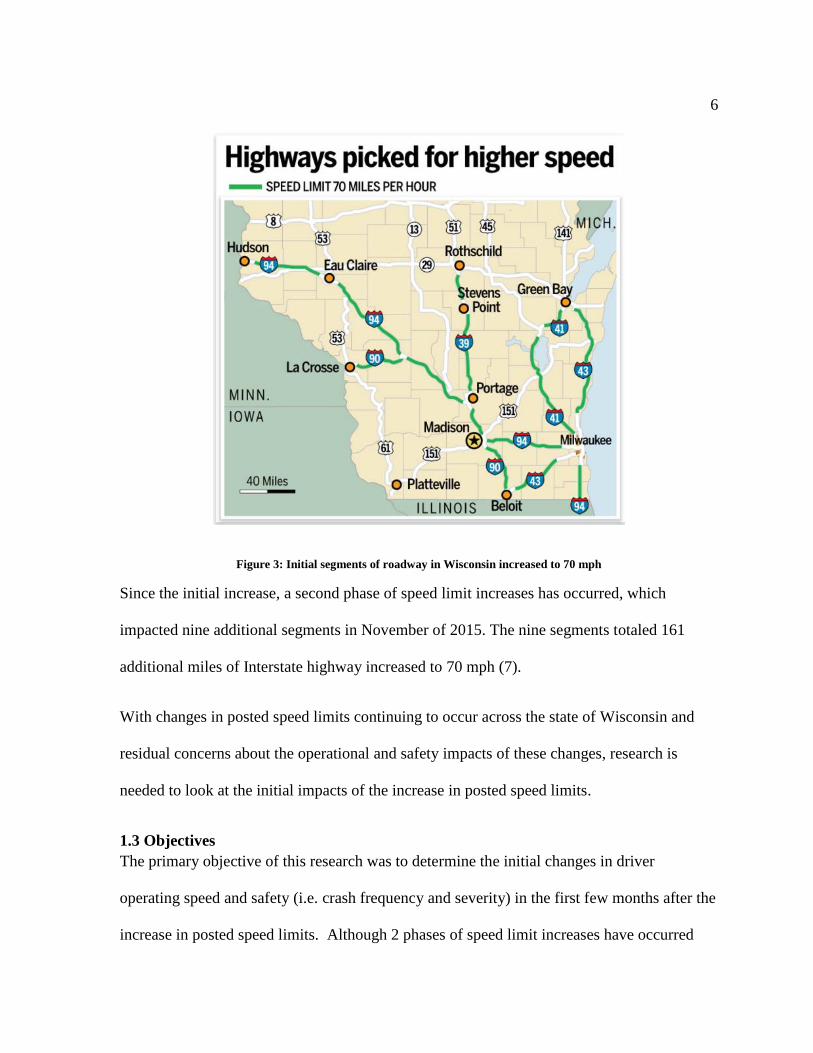
The initial posted speed limit increase in Wisconsin which occurred in June of 2015 impacted
14 segments of Interstate highway totaling 726 miles of roadway. Each of these roadways
are depicted in Figure 3 (6).
6
Figure 3: Initial segments of roadway in Wisconsin increased to 70 mph
Since the initial increase, a second phase of speed limit increases has occurred, which
impacted nine additional segments in November of 2015. The nine segments totaled 161
additional miles of Interstate highway increased to 70 mph (7).
With changes in posted speed limits continuing to occur across the state of Wisconsin and
residual concerns about the operational and safety impacts of these changes, research is
needed to look at the initial impacts of the increase in posted speed limits.
1.3 Objectives
The primary objective of this research was to determine the initial changes in driver
operating speed and safety (i.e. crash frequency and severity) in the first few months after the
increase in posted speed limits. Although 2 phases of speed limit increases have occurred

7
throughout the state, this research will focus on analyzing the initial changes and roadway
segments identified in Figure 2. Specifically, the segments of roadway included in the initial
posted speed limit increase are presented in Table 1 including the limits of each change.
Table 1: Phase 1 increases to 70 mph
The University of Wisconsin-Madison Civil and Environmental Department operates the
Wisconsin Traffic Operations and Safety (TOPS) Laboratory. Contained within the TOPS
lab are multiple sources of data that will meet the objectives of this research, including the
MV4000 Crash Data Resources retrieval facility and the V-SPOC Traffic Detector Database.
Crashes reported throughout the state of Wisconsin since 1994 are housed within the Crash
Data Retrieval Facility. For the purpose of this analysis, crashes reported from 2005 to 2015
will be used, again noting that the speed limit increase occurred in June of 2015. All crashes
occurring between July and December in years prior to 2015 will be considered ‘before’ data;
Highway From To Miles
I-94 Illinois State Line Milwaukee County Line 25
I-94 I-39/90 in Dane County WIS 164 in Waukesha County 57
I-39/90 Illinois State Line US 12 in Dane County 41
I-39/90/94 US 151 in Dane County I-39 split in Columbia County 22
I-39 I-90/94 split in Columbia County WIS 54 in Portage Ocunty 65
I-39 WIS 66 in Portage County Bus 51 in Marathon County 26
I-90/94 I-39/90/94 In Columbia County I-90 in Monroe County 63
I-90 I-94 in Monroe County US 53 in La Crosse County 37
I-94 I-90 in Monroe County US 53 in Eau Claire County 77
I-94 WIS 312 in Eau Claire County WIS 35 in St Croix County 55
I-43 County T in Ozaukee County WIS 29 in Brown County 91
I-43 I-39 in Rock County WIS 164 In waukeesha County 54
I-41 South Washington County Line WIS 441 in Winnebego County 93
I-41 WIS 441 In Outagmie County WIS 172 in Brown County 20

8
crashes from July through December of 2015 will be ‘after’ data. Total number of incidents
per year, incident severity including fatalities per year, speed as a contributing factor to
incidents and alcohol related incidents will all be considered within the analysis of the
aforementioned 14 segments of roadway.
V-SPOC (Volume, Speed, and Occupancy Application) Suite is the second database that will
be used. The V-SPOC Application contains ITS traffic detector data including speed, volume
and occupancy from the WisDOT Advanced Traffic Management System from 1997 to
present day. Five regions make up the state of Wisconsin including; Southeast, Southwest,
Northeast, Northcentral and Northwest, all of which have data within the V-SPOC
application. Due to the volume of data contained within this application analyzing the entire
year of speed data would not be feasible. Alternatively, eight days throughout the year were
randomly selected and analyzed. Days selected captured both summer and winter months as
well as weekdays and weekends. The goal of analyzing these speed data is to determine if
increasing the speed limit by 5 mph will directly correlate to an increase in average operating
speed of 5 mph. Again the 14 segments of roadway previously mentioned will be used in the
speed analysis.
Lastly the two data sources will be combined to assess incidents per thousand vehicles on the
roadway. Incorporating volumes into the analysis is necessary to determine incident rates in
addition to incident totals. Again the 14 segments of roadway are analyzed.
This data will be analyzed and a statistical determination will be performed to assess the
impacts of increasing the speed limit to 70 mph throughout the state of Wisconsin.

9
2 LITERATURE REVIEW
2.1 History
Speed limit laws and regulations have continued to change throughout the history of the
United States. Generally the power to set the speed limit has been in the hands of each
individual state; however, that changed in 1974 when the National Maximum Speed Law was
passed. The law was passed in response to the Emergency Highway Conservation Act and
the energy crisis the country was experiencing. There was hope that a maximum speed limit
of 55 mph would significantly reduce gasoline consumption. Just prior to the passing of the
Maximum Speed Law, posted speed limits were as high as 75 mph in some states. This
dramatic speed limit reduction to 55 mph was widely disregarded by motorists.
Approximately 13 years later, the Emergency Highway Conservation Act was replaced by
the Surface Transportation and Uniform Relocation Act of 1987 in which states were allowed
to increase the posted speed limit to 65 mph on rural Interstates. Following the enactment of
this law, 38 states increased their posted speed limit to 65 mph in 1987, with two additional
states following in 1988. In November of 1995, the National Highway System Designation
Act was passed which formally returned the authority for setting maximum speed limits to
the states (8).
Since authoring individual states to set maximum speed limits, several different strategies
have been chosen leading to variability amongst the states. The variability amongst states
can be seen in Table 2 which shows the speed limit maximum for each individual state, rural
and urban Interstates, as of 2016 (3). Hawaii has the lowest maximum speed limit of 60 mph,
while Texas has the highest maximum speed limit of 85 mph on select portions of roadways
throughout the state.

10
Table 2: Posted maximum speed by state (2016)
2.2 Safety Impacts of the Surface Transportation and Uniform Relocation Act
In 1987 the United States passed the Surface Transportation and Uniform Relocation Act
allowing states to raise the previously mandated maximum speed of 55 mph to 65 mph.
Increasing the allowable maximum speed limit by ten mph brought along with it an
abundance of safety studies to determine the impacts of increasing the speed limit; safety
State
Rural
Interstate
(mph)
Urban
Interstate
(mph)
State
Rural
Interstate
(mph)
Urban
Interstate
(mph)
Alabama 70 55 Montana 80 65
Alaska 65 65 Nebraska 75 65
Arizona 75 65 Nevada 80 65
Arkansas 70 65 New Hampshire 65 (70*) 65
California 70 65 New Jersey 65 55
Colorado 75 65 New Mexico 75 75
Connecticut 65 55 New York 65 65
Delaware 65 55 North Carolina 70 70
Florida 70 65 North Dakota 75 75
Georgia 70 70 Ohio 70 65
Hawaii 60 60 Oklahoma 75 70
Idaho 75 (80*) 75 (80*) Oregon 65 (70*) 55
Illinois 70 55 Pennsylvania 70 70
Indiana 70 55 Rhode Island 65 55
Iowa 70 55 South Carolina 70 70
Kansas 75 75 South Dakota 80 80
Kentucky 65 (70*) 65 Tennessee 70 70
Louisiana 75 70 Texas 75 (80,85*) 75
Maine 75 75 Utah 75 (80*) 65
Maryland 70 70 Vermont 65 55
Massachusetts 65 65 Virginia 70 70
Michigan 70 65 Washington 70 (75*) 60
Minnesota 70 65 West Virginia 70 55
Mississippi 70 70 Wisconsin 70 70
Missouri 70 60 Wyoming 75 (80*) 75 (80*)
(##*) indicates posted speed on specified
11
studies that are often referenced today when debating the merits of increasing the speed limit
to 70 mph in the state of Wisconsin.
In 1989, Garber and Graham released study results that examined the effects of increasing
the speed limit to 65 mph. Monthly Fatal Accident Reporting System (FARS) data was used
for the 40 states which increased their speed limit. Study results showed a 15 percent increase
in fatalities; however, this did not hold true at a state by state level. An increase in fatalities
attributed to the high speed limits were identified in 28 of the 40 states. Only 10 of these
increases in fatalities held statistical significance. Comparatively, a decrease in fatalities was
identified in 12 of the 40 states, with the increase in posted speed limit, with two holding
statistical significance (8).
Garber and Graham studied fatal crashes, rather than the increase in fatality rate or the
number of fatalities per vehicle mile traveled. Lave and Elias opted to study the impacts of
the speed increase by examining the change in fatality rate from 1986 to 1987 when the
speed limit laws were increased to 65 mph. Of the 40 states that increased their posted speed
limits to 65 mph, the fatality rate fell by 4.68 percent. Comparatively states which maintained
the 55 mph posted speed, fatality rates were essentially unchanged. Looking forward, states
which increased the posted speed limit in 1988 experienced an additional 1.55 percent
reduction in the fatality rate, and unchanged states experienced a reduction of 2.55 percent.
The combined results found a total reduction, from 1986 to 1988, of 6.15 percent for states
where speed limits were increased, compared to a drop of 2.62 percent fatality rate for those
states who maintained the 55 mph posted speed limit. This research showed that those states

12
that increased posted speed limits to 65 mph found a 3.53 percent greater decrease in fatality
rate than those who maintained 55 mph as a posted speed (9).
Ossiander and Cummings chose to look at the impacts of the speed increase on the state of
Washington, in particular, observing impacts on fatal crashes, total crashes and speed
variance (10). Data from 1970 to 1994 was studied, comparing actual number of crashes to
what would have been the predicted number of crashes based on historical trends. When
observing fatal crashes, it was determined that the number of crashes was more than double
the predicted value following the 1987 speed limit increase. When looking at total crashes,
there was no substantial difference between actual numbers and those which were predicted
from historical trends. Lastly, when considering speed variance, there was a negligent
change. The results indicated that motor vehicle drivers adjusted their operating speed in
accordance with the new posted speed (10).
Balkin and Ord further studied the relationship between the speed limit increase and fatal
crashes, looking at the number of fatal crashes by month from January 1975 to December
1998 for each state. The results showed that 40 states had an increase in fatal crashes
associated with the increase in posted speed from 55 to 65 mph. 19 of 40 states had a
statistically significant increase in fatal crashes, while the remaining 21 had increases in fatal
crashes that were not significant at the ten percent level. Figure 4 shows which states had
statistically higher fatal crashes depicted in dark gray (11).
13
Figure 4: Significance Levels in Response to Increasing Speed Limits from 55 to 65 mph
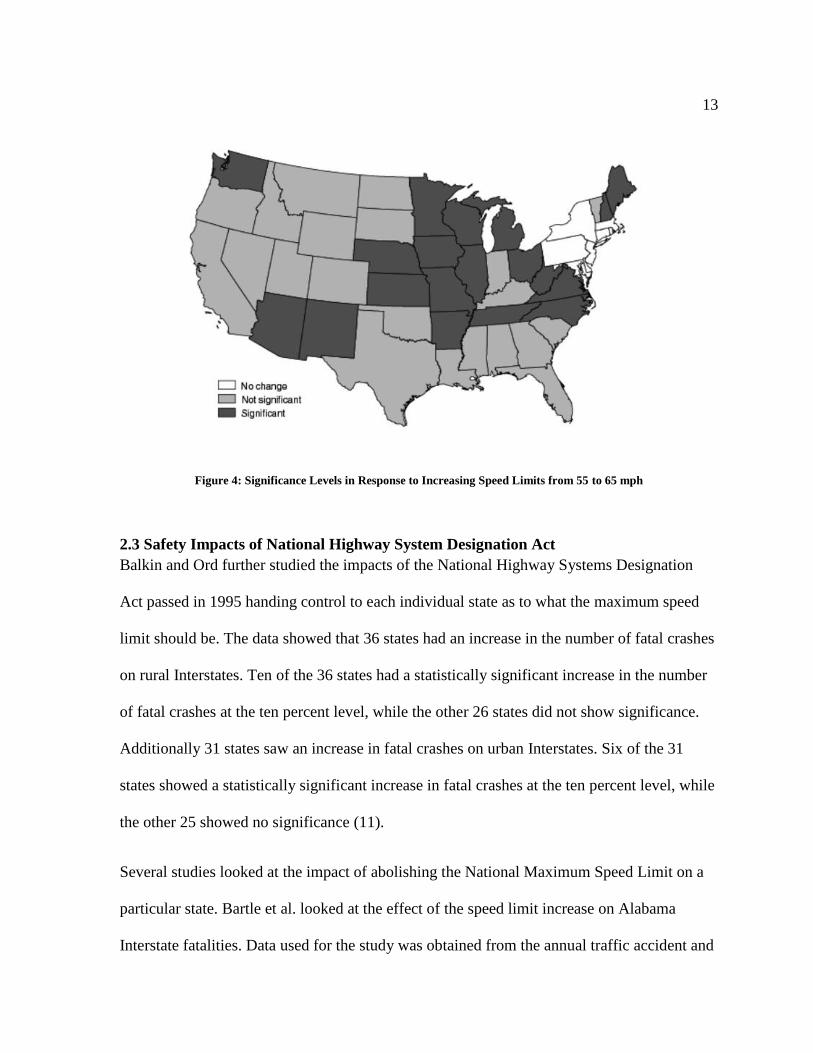
2.3 Safety Impacts of National Highway System Designation Act
Balkin and Ord further studied the impacts of the National Highway Systems Designation
Act passed in 1995 handing control to each individual state as to what the maximum speed
limit should be. The data showed that 36 states had an increase in the number of fatal crashes
on rural Interstates. Ten of the 36 states had a statistically significant increase in the number
of fatal crashes at the ten percent level, while the other 26 states did not show significance.
Additionally 31 states saw an increase in fatal crashes on urban Interstates. Six of the 31
states showed a statistically significant increase in fatal crashes at the ten percent level, while
the other 25 showed no significance (11).
Several studies looked at the impact of abolishing the National Maximum Speed Limit on a
particular state. Bartle et al. looked at the effect of the speed limit increase on Alabama
Interstate fatalities. Data used for the study was obtained from the annual traffic accident and

14
fatality data released by the State of Alabama from 1984 to 1999. General trends showed an
increase in fatal crashes over the analysis period, however statistically significant increases
were observed in 1997 and 1999 after the speed limit increase (12).
Comparatively, other studies looked at the collective impact of increasing the speed limit
across the United States. Friedman et al. looked at the long term impacts of the repeal,
observing the number of fatalities between 1995 and 2005 on rural Interstates. Data was
evaluated on a yearly basis to minimize seasonality influences and capture the long term
impacts of the speed change, rather than monthly fluctuations. It was concluded that there
was a 3.2 percent increase in road fatalities attributable to the speed limit increase on all road
types (13).
In a similar study, Farmer et al. assessed the number of motor vehicle occupant fatalities
from 1990 to 1995 compared to 1996. The study was performed using a study and
comparative group. The study group was composed of the 12 states which raised the
maximum speed limit to at least 70 mph, while the comparative group was composed of the
18 states that did not. Fatality rates for the study and comparative group can be observed in
Figure 5.

15
Figure 5: Fatality Rates for Study & Comparison Group from Farmer et al.
The general trend for both groups is similar showing an increase in fatalities from 1995 to
1996. The increase for the 12 study states is 16 percent compared to the 18 unchanged states
which had an increase in fatalities of four percent. Indicating that states which increased
posted speed limits to 70 mph had a 12 percent greater increase in fatalities in 1996 (14).
The aforementioned studies generally show that the increased speed limit resulted in an
increase in fatal crashes. However, several of the studies fail to normalize the fatality rate and
report total fatality numbers, instead, leaving out the consideration that total number of
drivers may have increased as well, and that fatal crashes on these roadways may not be
attributable to speed. Confounding variables of weather, seat belt compliance, alcohol
impairment and police officer enforcement are also not considered.

16
2.4 Midwest Impacts
Wisconsin in relation to the rest of the United States is well behind the times on increasing
the maximum posted speed limit to 70 mph. In fact, they are the 38th state to follow suit and
raise the maximum limit to at least 70 mph (6). Wisconsin was the last Midwest state to make
the change, following Michigan in August of 1996, Minnesota in 1997, Indiana and Iowa in
July of 2005, Ohio in July of 2013 (Turnpike in April of 2011), and Illinois in January of
2014. Just as the residents of Wisconsin have expressed concerns regarding the impact of
increasing the speed limit, the surrounding Midwest states have experienced the same. This
concern over safety has led to each state researching the impacts of the increase and has led
to the following conclusions.
2.4.1 Michigan
On August 1, 1996, the speed limit on segments of Michigan freeway was increased from 65
to 70 mph following the repeal of the National Maximum Speed Limit. Increasing the posted
speed limit to 70 mph was accompanied by a required study to examine the impacts of the
increase on capacity and safety of the roadways. Michigan Department of Transportation
(MDOT) in conjunction with the Department of Civil and Environmental Engineering at
Michigan State University took on the feat. Test and control sights were analyzed, those
which increased to 70 mph and those which remained the same, respectively. The sights were
selected on the basis of compass orientation, functionality level, level of service and
sufficiency rating. Speed data was collected from permanent MDOT traffic recorders and
portable traffic recorders used by Michigan State University. Data collected showed that the
50th and 85th percentile speed for the test segments did have an increase of 1 mph and 0.5
mph, respectively, even when the speed limit itself was raised by 5 mph (15). Data from this

17
study showed that a 5 mph increase in posted
speed did not lead to an equivalent increase in
operating speed. Drivers appear to travel at the
speed which they feel comfortable.
In February of 2016, Michigan sought to increase
the speed limits even further, pushing for 75 or
80 mph on segments of Interstate. If the law
passes, Michigan will have the highest speed
limits in the Midwest. The law is part of a
packaged bill that would allow for an increase to
80 mph only if both MDOT and the Michigan
State Police deem traveling at that pace safe (16).
Figure 6 summarizes the changes Michigan has
experienced over the years, and the continued
increase that is slated to take place later this year.
2.4.2 Indiana
Indiana raised its speed limit to 70 mph on rural
Interstates on July 1 of 2005. Researchers
Malyshkina and Mannering at Purdue University
studied the influence of the increase in posted speed on accident severity using accident data
from 2004 to 2006, encompassing the year in which the speed limit change was made. Data
was collected from the Indians Electronic Vehicle Crash Record System and included
Figure 6: History of Michigan Speed Limit Laws
18
204,382 accident reports from 2004, before the speed increase and 182,922 accidents from
2006, the year after the speed increase. Of the incidents which occurred in 2006, 5.78 percent
of these identified unsafe speed as the primary cause, compared to before the speed increase
in 2004, in which 7.28 percent of incidents were associated with unsafe speed as the cause.
Purdue University concluded from their study that the increase in maximum allowable speed
on Indiana Interstate roadways did not significantly affect the accident injury severity (17).
Malyshkina and Mannering also looks at a reported survey of Indiana drivers that was
administered in the fall of 2005 shortly after the speed limit was increased. Survey questions
assessed driver’s willingness to exceed the posted speed limit. Responses showed that
drivers reported traveling on average 11 mph over a posted speed of 55 mph, 9 mph over a
posted speed of 65 mph and 8 mph over a posted speed of 70 mph. Survey responses also
revealed a decrease in standard deviation of self-reported traveled speeds, from 6 mph with a
posted speed of 55 mph to 5 mph when the posted speed was 65 or 70 mph (18). Responses
from the survey shows that although the speed limit may increase 15 mph, the operating
speed of drivers does not necessary reflect this.
2.4.3 Iowa
Iowa joined the 70 mph implementation on July 1 of 2005, increasing speeds on most rural
Interstates. Iowa State University with the support of the Iowa Department of Transportation
studied the effects of increasing the speed limit, evaluating 17 total years of data,
encompassing data before and after the change. Included within the study was the assessment
of speed and volume data, crash data including totals, severity, cross-median crashes and day
and night breakdowns.

19
Speed and volume data were analyzed for 11 months prior to the change and 18 months after
the speed limit increase. This data was provided by the Office of Transportation Data and the
Iowa Department of Transportation. It was concluded that the mean and 85th percentile
speeds increased 2 mph with a posted speed limit change of 5 mph. Meanwhile the number
of drivers exceeding the speed limit by at least 10 mph decreased from 20 percent to 8
percent with the increase in posted speed limit.
Crash data was analyzed for the period of 1991 to 2007, which encompassed 14 and a half
years prior to the speed increase and 2 and a half years after the speed increase. Fatal crashes
did increase by 31.3 percent when comparing only 2 ½ year periods before and after the
change. However, when looking at the long term changes of the previous 14 years of fatal
crashes, and the annual variability, this change is similar to what would be expected. Figure 7
shows this trend, and although fatal crashes were up in 2005, the number of fatal crashes then
declined in 2006 regressing back to what would be the predicted and expected value based on
historical data (19).
Figure 7: Iowa Study Fatal Crashes before and after speed change
20
Similar results were determined for serious crashes (fatal or major injury), nighttime crashes
and cross median crashes. Statistical significance modeling determined that evidence does
not support the conclusion that the increase in speed
limit was associated with an increase in fatal or
serious injury crashes.
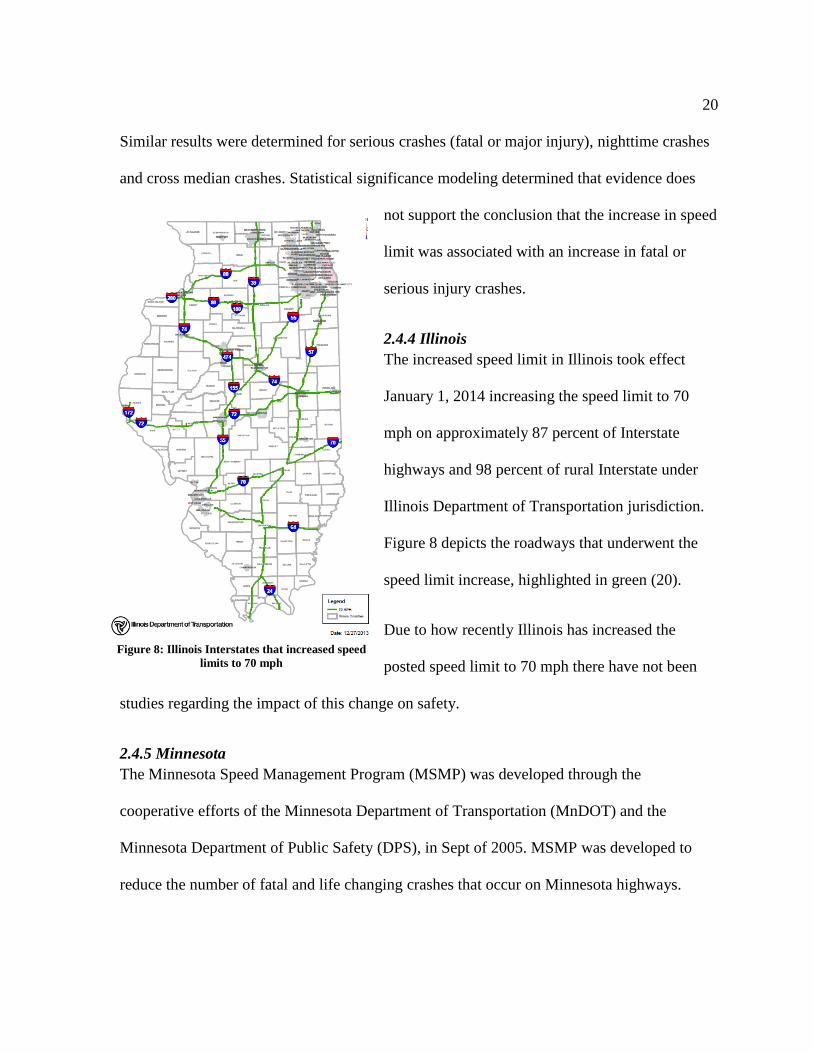
2.4.4 Illinois
The increased speed limit in Illinois took effect
January 1, 2014 increasing the speed limit to 70
mph on approximately 87 percent of Interstate
highways and 98 percent of rural Interstate under
Illinois Department of Transportation jurisdiction.
Figure 8 depicts the roadways that underwent the
speed limit increase, highlighted in green (20).
Due to how recently Illinois has increased the
posted speed limit to 70 mph there have not been
studies regarding the impact of this change on safety.
2.4.5 Minnesota
The Minnesota Speed Management Program (MSMP) was developed through the
cooperative efforts of the Minnesota Department of Transportation (MnDOT) and the
Minnesota Department of Public Safety (DPS), in Sept of 2005. MSMP was developed to
reduce the number of fatal and life changing crashes that occur on Minnesota highways.
Figure 8: Illinois Interstates that increased speed
limits to 70 mph

21
In 1997, following the repeal of the National Maximum Speed Limit, Minnesota increased
speed to 70 mph on rural Interstates. In 2005, MnDOT set out to study the impacts of this
increase by looking at five years of crash data before and after the speed limit change took
effect in 1997. Results showed that there was a 70 percent increase in fatalities on rural
freeways in which the speed limit was increased to 70 mph (21). This dramatic increase in
fatalities was thought to be the result of not educating the driving public, as well as, not
properly increasing the corresponding speed enforcement. Due to how significantly the
fatality rate increased, MSMP began to focus their efforts on how to reduce this rate.
MSMP was developed to reduce the number of rural freeway fatalities and consisted of four
components; engineering, enforcement, education and evaluation. After implementation,
speed and crash data were collected. Speed data showed that on Interstates with posted
speeds of 70 mph, there was a 42.0 percent decrease in the number of drivers traveling at
least 10 mph over the posted speed. Crash data was analyzed for five years prior to MSMP
implementation, and showed that during the program there was a statistically significant
reduction in the number of fatal crashes (21).
2.4.6 Ohio
Ohio increased the speed limit to 70 mph on segments of Interstate on July 1 of 2013, and did
not see an immediate impact on fatal crashes, reporting 255 fewer fatal crashes through May
2014, when compared to 2013 (22). The speed limit change also did not significantly impact
the 85th percentile speed. Multiple segments of Interstate that increased posted speeds from
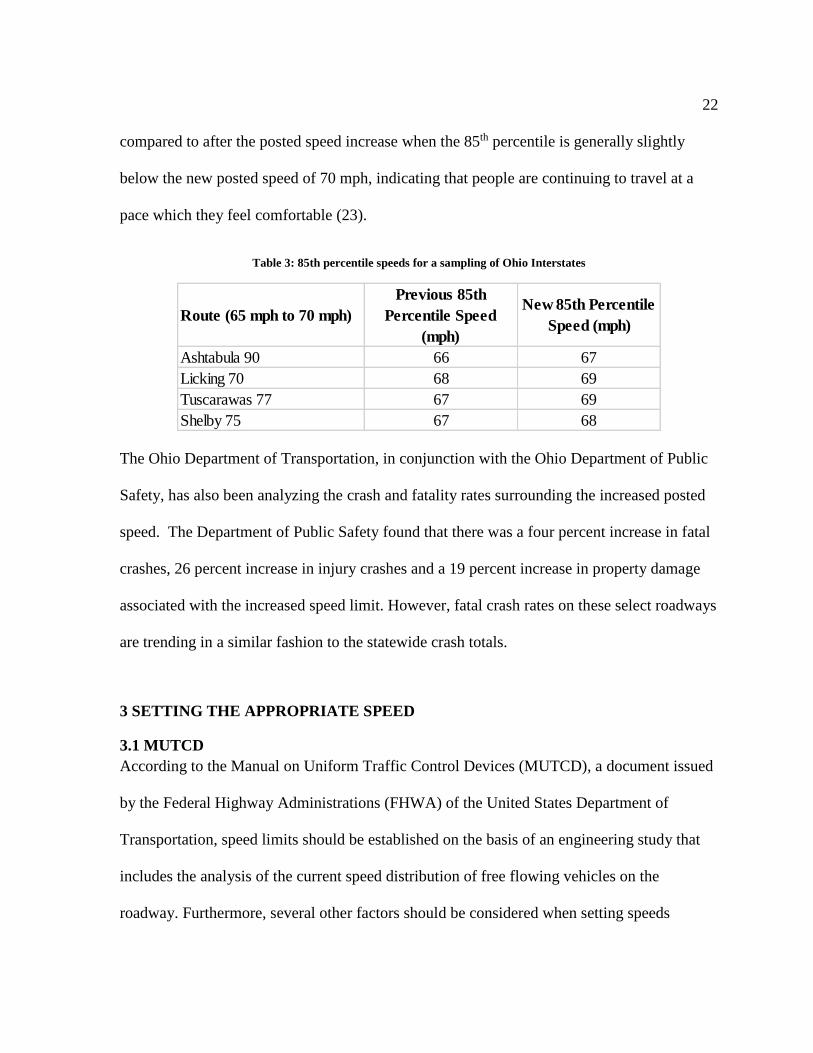
65 mph to 70 mph were studied, a sampling of which can be seen in Table 3. 85th percentile
speed, before the speed increase, was just slightly above the posted speed of 65 mph. This is
22
compared to after the posted speed increase when the 85th percentile is generally slightly
below the new posted speed of 70 mph, indicating that people are continuing to travel at a
pace which they feel comfortable (23).
Table 3: 85th percentile speeds for a sampling of Ohio Interstates
The Ohio Department of Transportation, in conjunction with the Ohio Department of Public
Safety, has also been analyzing the crash and fatality rates surrounding the increased posted
speed. The Department of Public Safety found that there was a four percent increase in fatal
crashes, 26 percent increase in injury crashes and a 19 percent increase in property damage
associated with the increased speed limit. However, fatal crash rates on these select roadways
are trending in a similar fashion to the statewide crash totals.
3 SETTING THE APPROPRIATE SPEED
3.1 MUTCD
According to the Manual on Uniform Traffic Control Devices (MUTCD), a document issued
by the Federal Highway Administrations (FHWA) of the United States Department of
Transportation, speed limits should be established on the basis of an engineering study that
includes the analysis of the current speed distribution of free flowing vehicles on the
roadway. Furthermore, several other factors should be considered when setting speeds
Route (65 mph to 70 mph)
Previous 85th
Percentile Speed
(mph)
New 85th Percentile
Speed (mph)
Ashtabula 90 66 67
Licking 70 68 69
Tuscarawas 77 67 69
Shelby 75 67 68

23
including roadway characteristics (e.g., grade), alignment and sight distances, the pace of
traffic (e.g. 10 mph range which encompasses the most vehicles on the roadway), roadside
features including parking, bike and pedestrian activity and crash records from at least 12
months prior (24). MUTCD does not include how to incorporate the impacts of these
variables into setting the safe speed for the roadway, rather that they need to be considered.
MUTCD requires that posted speed limits fall within 5 mph of the 85th percentile speed of
free-flowing traffic on a given road (24). 85th percentile speed is one at which 85 percent of
drivers travel at or below, and has long been considered the appropriate operating speed for
maximum speed determination. Setting the speed limit in this manner is considered to be the
Engineering approach to determining safe speed. This methodology is one of four approaches
considered in the Methods and Practices for Setting Speed Limits, a report developed by the
U.S. Department of Transportation Federal Highway Administration in conjunction with the
Institute of Transportation Engineers (ITE).
3.2 Four Approaches
The four approaches within the Methods and Practice for Setting Speed Limits include the
Engineering Approach, Expert System, Optimal Speeds and Injury Minimization. These four
approaches are used in different countries around the world and are described below.
3.2.1 Engineering Approach
Setting the appropriate speed limit is accomplished by one of four accepted methods
throughout the world. The first of which is the Engineering Approach. This approach relies
on setting a base speed, often determined to be the 85th percentile speed and then adjusting
this base speed according to several factors laid out in the MUTCD such as roadside features,

24
crash history and pedestrian presence (25). Within the Engineering Approach there are two
methods, the Operating Speed Method and the Road Risk Method.
Operating Speed Method as previously mentioned uses the 85th percentile speed as the first
base approximation for the speed of the roadway. This base speed should then be adjusted by
the consideration of several factors. Speed may be reduced as a result of crash data; however,
should normally not fall more than 7 mph below the 85th percentile speed (25). Narrow
roadways, horizontal and vertical curves that limit the driver’s line of sight, hidden
driveways, or high density driveways, higher presence of bikes and pedestrians and narrow
shoulder widths could all contribute to lower posted speed limits. Operating Speed Method
within the Engineering Approach to setting speed limits has widely been accepted in the
United States as the appropriate method.
Road Risk Method relies on setting the speed limit according to the functional classification
of the roadway and adjusting this speed based on the relative risk of roadside design features
(25). Table 4 shows the base speeds for the three functional classifications; arterial, collector
and local, as well as if the road is rural or urban.
Arterial roadways offer the highest traveled speeds and limited access, while local roadways
offer the highest level of access at the lowest speeds, which is reflected in the base speeds. In
addition to the classification and land use of the roadway, this method considers roadside
development, including housing development, the presence of schools, shops and businesses.
Additionally, roadway characteristics including the geometry, the presence of bike lanes or

25
sidewalks, parking, lane width and the number of lanes is considered. Currently this method
is used in Canada and New Zealand.
Table 4: Road Risk Method base speed limits by Roadway Classifications
3.2.2 Expert System
The Expert system also known as USLIMITS2 is a computer based algorithm system that
advises safe travel speeds based on user inputs. FHWA developed the system based on
results from previous research, inputs from experts as well as knowledge gained from the
first expert system developed by the Australian Road Research Board.
Users are first asked to select the roadway type under analysis from the following; limited
access freeway, road section in undeveloped areas, road section in developed areas including
residential subdivision, residential collector, commercial or street serving large complexes.
Based on this selection the user is prompted with several additional site characteristics
including current operating speeds, posted speeds and traffic characteristics. The program
then calculates the speed limit using one of two approaches. One approach is based on crash

26
rates of the roadway compared to average crash rates from the Highway Safety Information
System. The resulting speed limit is either the nearest 5 mph increment above or below the
85th percentile speed. Approach two is based on other roadway site characteristics including
Average Annual Daily Traffic, interchange spacing, roadside hazards, signals per mile,
pedestrian and bike activity, parking, driveways per mile, etc., resulting in a speed limit of
either the closest 5 mph to the 85th or 50th percentile speed (25).
3.2.3 Optimal Speeds
Optimal speed limit is determined to be the speed which minimizes total societal costs,
including vehicle operating costs, cost of crashes and travel time costs (25). This method is
difficult to implement due to the fact that different perspectives bring forth different optimal
speeds that often don’t align. Optimal Speed method can be beneficial when used on shared-
use roadways, so that motorists are more aware of the impact their speeds have on bicycles
and pedestrians who are also using the roadway. Otherwise, due to the difficulty in deciding
on one optimal speed, the method is rarely used.
3.2.4 Injury Minimization
Injury minimization is based on the tolerance of the human body to injury when involved in a
crash. It is based on the fact that it is unethical to create a roadway situation in which fatality
is a likely outcome of a crash, in order to reduce delay, fuel consumption or other societal
objectives. Injury minimization sets speeds at limits which in the event of a crash, the
resulting kinetic energy passed to the human would not results in a serious or fatal injury.
Under this thought process, the speed limits depicted in Table 5 would be required.

27
Table 5: Injury Minimization speed limits defined by fatality avoidance
This method would prove problematic in the United States, since it would result in lowering
speeds on most segments of roadway, resulting in non-compliance of the new speeds.
Each method has its advantages and disadvantages, however within the United States both
the Engineering and Expert Approach are heavily used. These methods look to capture
setting posted speeds at the 85th percentile speed. 85th percentile speeds are often higher than
the current posted speed, and states are looking to match this by increasing posted speed
limits.
3.3 Sight Distances
Increasing speed limits not only changes the traveled way speed but impacts several other
design parameters including sight distances. Roadway designers must provide adequate sight
distances for drivers to perceive and react to obstacles ahead, and have sufficient stopping
length to avoid collisions. The 2011 American Association of State Highway and
Transportation Officials (AASHTO) Green Book defines sight distances that must be
considered when altering speeds including stopping sight distance and decision sight distance
(26).
3.3.1 Stopping Sight Distance
Stopping Sight Distance (SSD) is defined as the length of roadway ahead that is visible to the
driver. The provided SSD should be adequate to allow drivers who are operating at or near

28
the design speed to stop in time before colliding with a stationary object in its path. Although
often design criteria provide much greater distance than the required minimum, it is
important to ensure that every point along the roadway meets at least this minimum.
SSD is determined by the sum of two separate distances; the distance traveled by the vehicle
from the moment the object is noticed to the time it takes the driver to begin applying the
brakes (brake reaction distance) and the distance traveled from when the driver initially
begins to brake to when the vehicle comes to a complete stop (braking distance). A design
standard of 2.5 seconds is used for the brake reaction time. This amount of time encompasses
the capabilities of most drivers, including older drivers with slower reaction times, and is
considered an adequate amount of time for slightly more complex situations. Braking
distance is determined using Equation 1 below (26):
𝑑𝐵 = 1.075𝑉2
𝑎 (1)
Where;
𝑑𝐵 = 𝑏𝑟𝑒𝑎𝑘𝑖𝑛𝑔 𝑑𝑖𝑠𝑡𝑎𝑛𝑐𝑒 (𝑓𝑡)
𝑉 = 𝑑𝑒𝑠𝑖𝑔𝑛 𝑠𝑝𝑒𝑒𝑑 (𝑚𝑝ℎ)
𝑎 = 𝑑𝑒𝑐𝑒𝑙𝑒𝑟𝑎𝑡𝑖𝑜𝑛 𝑟𝑎𝑡𝑒 (𝑓𝑡/𝑠2)
When confronted with an unexpected object in the roadway, drivers must react quicker than
normal, with 90 percent of drivers decelerating at rates greater than 11.2 feet per second
squared. This deceleration rate allows the driver enough control to stay within his/her lane
and maintain steering capabilities even on wet pavement surfaces. Therefore, this
deceleration rate is the assumed default rate in the AASHTO procedure (26). Braking

29
Distance within Table 6 is generated from this assumed deceleration rate and a series of
design speeds.
Stopping Sight Distance can then be determined from the summation of the brake reaction
distance and the braking distance. This relationship is shown in Equation 2.
𝑆𝑆𝐷 = 1.47𝑉𝑡 + 1.705𝑉2
𝑎 (2)
Where;
𝑆𝑆𝐷 = 𝑆𝑡𝑜𝑝𝑝𝑖𝑛𝑔 𝑆𝑖𝑔ℎ𝑡 𝐷𝑖𝑠𝑡𝑎𝑛𝑐𝑒 (𝑓𝑡)
𝑉 = 𝐷𝑒𝑠𝑖𝑔𝑛 𝑆𝑝𝑒𝑒𝑑 (𝑚𝑝ℎ)
𝑡 = 𝑏𝑟𝑎𝑘𝑒 𝑟𝑒𝑎𝑐𝑡𝑖𝑜𝑛 𝑡𝑖𝑚𝑒, 𝑑𝑒𝑓𝑎𝑢𝑙𝑡 𝑡𝑜 2.5 𝑠𝑒𝑐𝑜𝑛𝑑𝑠
𝑎 = 𝑑𝑒𝑐𝑒𝑙𝑒𝑟𝑎𝑡𝑖𝑜𝑛 𝑟𝑎𝑡𝑒 (𝑓𝑡/𝑠2), 𝑑𝑒𝑓𝑎𝑢𝑙𝑡𝑒𝑑 𝑡𝑜 11.2 𝑓𝑡/𝑠2
Using Equation 2 and the aforementioned default values the calculated SSD is determined
and displayed in the fourth column of Table 6. Design values show the calculated value
rounded up to the nearest multiple of 5 (26).

30
Table 6: Breaking reaction distance, breaking distance & SSD
3.3.2 Decision Sight Distance
Stopping Sight Distance encompasses situations that reasonably competent and alert driver
could react to and come to a stop. There often are situations encountered on the roadway that
require greater reaction distances. These situations are categorized as complex decisions,
those in which information is hard to perceive or process or when a complicated driving
maneuver is needed. In these situations, decision sight distance is employed.
Decision Sight Distance is defined by the AASHTO Green Book as, “the distance needed for
the driver to detect an unexpected source of information in the roadway environment,
recognize the condition or its potential threat, select an appropriate speed and path and begin
and complete the complex maneuver to avoid the unexpected source” (26). Decision Sight
Distances can be determined through Equation 3.

31
𝐷𝑆𝐷 = 1.47𝑉𝑡 + 1.075𝑉2
𝑎 (3)
Where
𝐷𝑆𝐷 = 𝐷𝑒𝑐𝑖𝑠𝑖𝑜𝑛 𝑆𝑖𝑔ℎ𝑡 𝐷𝑖𝑠𝑡𝑎𝑛𝑐𝑒 (𝑓𝑡)
𝑡 = 𝑝𝑟𝑒 − 𝑚𝑎𝑛𝑒𝑢𝑣𝑒𝑟 𝑡𝑖𝑚𝑒 (sec)
𝑉 = 𝑑𝑒𝑠𝑖𝑔𝑛 𝑠𝑝𝑒𝑒𝑑 (𝑚𝑝ℎ)
𝑎 = 𝑑𝑟𝑖𝑣𝑒𝑟 𝑑𝑒𝑐𝑒𝑙𝑒𝑟𝑎𝑡𝑖𝑜𝑛 (𝑓𝑡/𝑠2)
When increasing posted speed limits on Interstate highways it is necessary to ensure that
drivers have adequate stopping sight distance and decision sight distance.
3.3.3 Design Speed
Throughout the methodology to determine stopping sight distance and decision sight distance
a design speed value is used. Design speed as defined by AASHTO is a selected speed used
to determine the various geometric features of the roadway (27). Design speed should be
logical with respect to the topography, anticipated operating speed, adjacent land use and the
functional classification of the roadway (27). Due to the impact design speed has on so many
other features of the roadway, it is one of the most important choices that roadway designers
must make (27).Design speed is intended to encompass the regulatory speed, as well as the
speed at which drivers are operating comfortably on the roadway. Ideally these two values,
operating speed and posted speed, would be one in the same; however, this is often not the
case. Ideally, the relationship between design speed, posted speed and operating speed of
drivers would be represented by Figure 9.
32
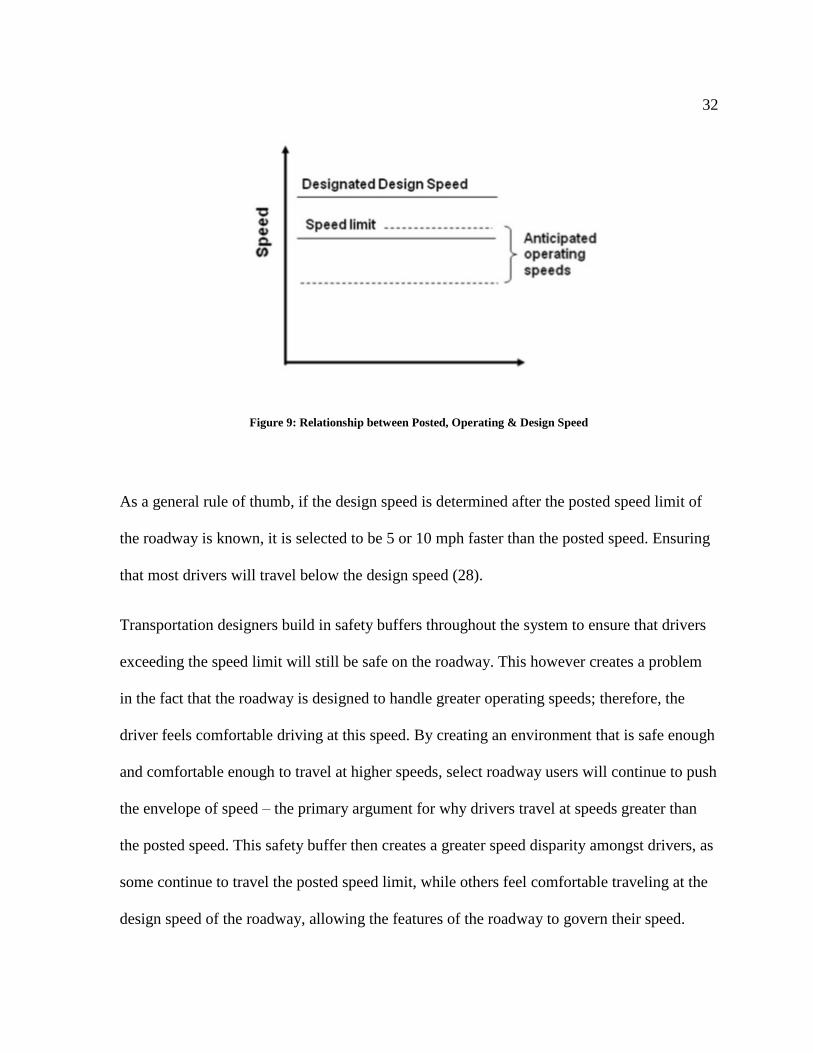
Figure 9: Relationship between Posted, Operating & Design Speed
As a general rule of thumb, if the design speed is determined after the posted speed limit of
the roadway is known, it is selected to be 5 or 10 mph faster than the posted speed. Ensuring
that most drivers will travel below the design speed (28).
Transportation designers build in safety buffers throughout the system to ensure that drivers
exceeding the speed limit will still be safe on the roadway. This however creates a problem
in the fact that the roadway is designed to handle greater operating speeds; therefore, the
driver feels comfortable driving at this speed. By creating an environment that is safe enough
and comfortable enough to travel at higher speeds, select roadway users will continue to push
the envelope of speed – the primary argument for why drivers travel at speeds greater than
the posted speed. This safety buffer then creates a greater speed disparity amongst drivers, as
some continue to travel the posted speed limit, while others feel comfortable traveling at the
design speed of the roadway, allowing the features of the roadway to govern their speed.
33
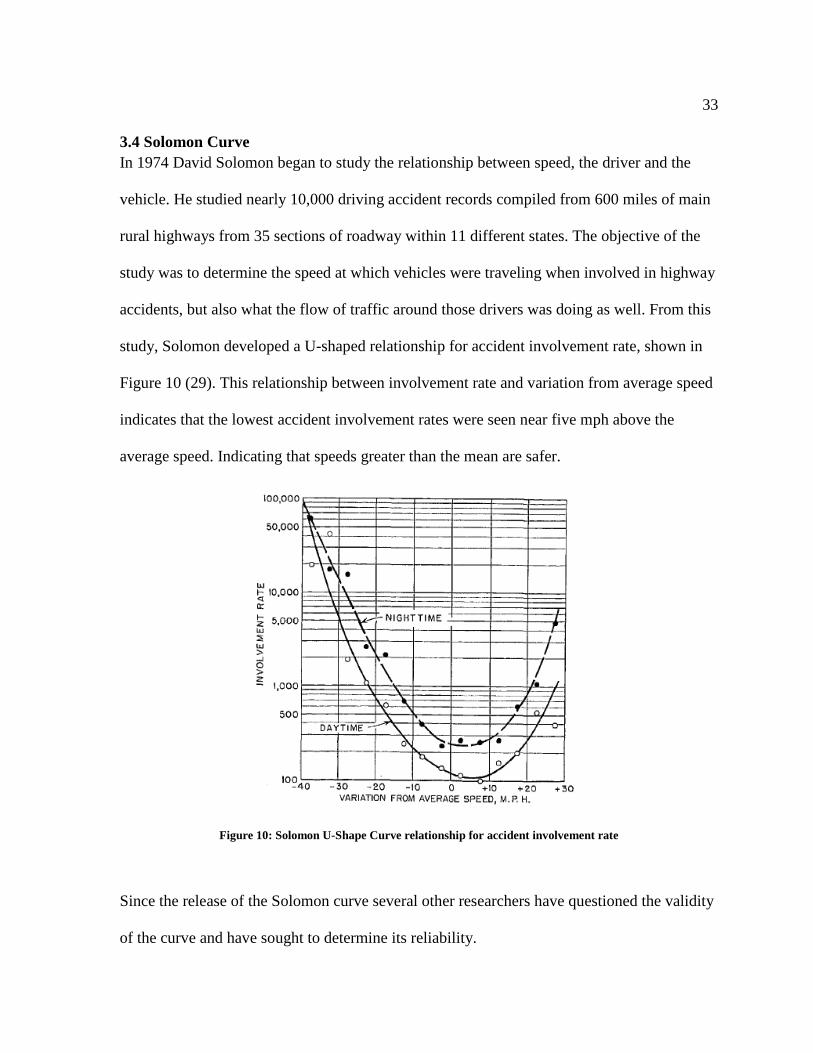
3.4 Solomon Curve
In 1974 David Solomon began to study the relationship between speed, the driver and the
vehicle. He studied nearly 10,000 driving accident records compiled from 600 miles of main
rural highways from 35 sections of roadway within 11 different states. The objective of the
study was to determine the speed at which vehicles were traveling when involved in highway
accidents, but also what the flow of traffic around those drivers was doing as well. From this
study, Solomon developed a U-shaped relationship for accident involvement rate, shown in
Figure 10 (29). This relationship between involvement rate and variation from average speed
indicates that the lowest accident involvement rates were seen near five mph above the
average speed. Indicating that speeds greater than the mean are safer.
Figure 10: Solomon U-Shape Curve relationship for accident involvement rate
Since the release of the Solomon curve several other researchers have questioned the validity
of the curve and have sought to determine its reliability.

34
In 1986, Cirillo similarly studied 2,000 daytime crashes collected from 20 state highway
departments, and confirmed the results determined by Solomon. Cirillo found that as the
speed of a vehicle varies from the mean speed, either above or below, the chance of the
vehicle being involved in an accident increase. Concerns were raised regarding the data
collection methods used by Solomon and Cirillo, since both were dependent on police or
driver reports which can be susceptible to error. Additionally the studies likely overestimated
the involvement of slower moving vehicles, due to the tendency of these accidents to occur at
turning or merging locations (30).
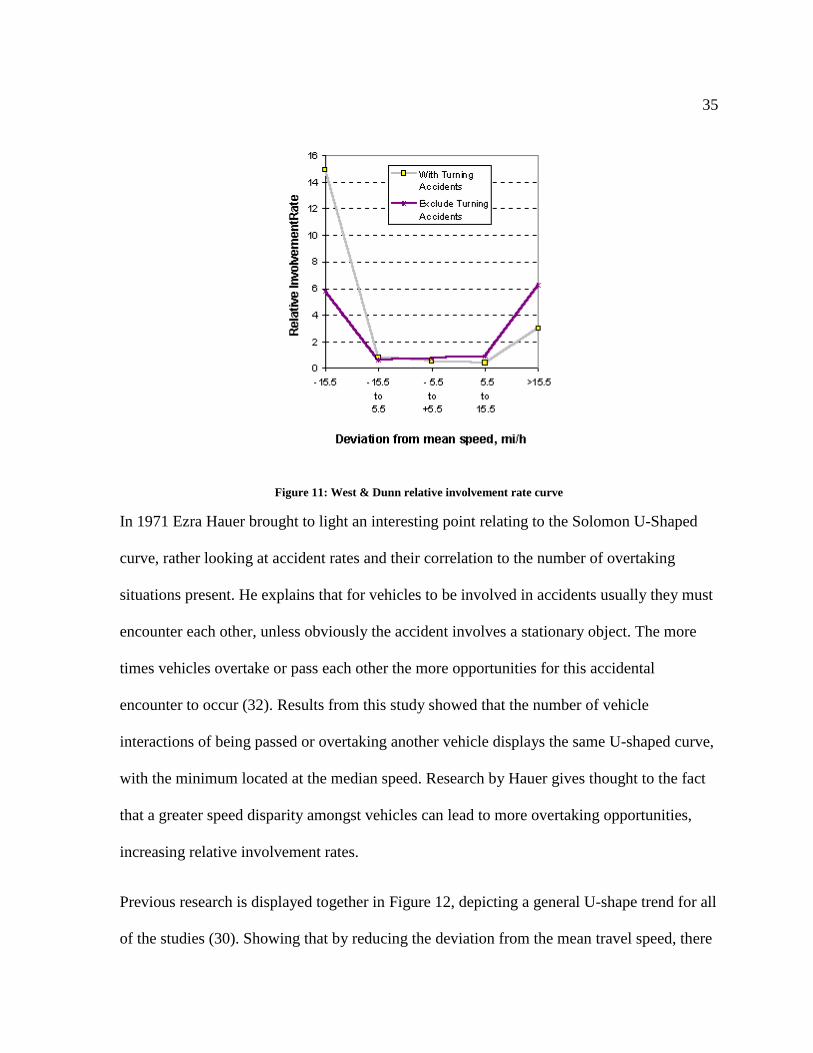
The Research Triangle Institute aimed to address these concerns by using continuous speed
monitoring stations to measure the speed of the vehicle involved in a crash as well as traffic
speed. West and Dunn reported the results of this study, finding that 44 percent of the crashes
analyzed involved turning vehicles (31). Removing these vehicles from the study produced
much different results than the Solomon curve depicted. The results are shown in Figure 11,
and include much sharper break points than the U-shape Solomon curve (30). It was
determined that traveling slower than the average speed was much less of a risk than
previously assumed. Figure 11 also shows that the relative risk of being involved in an
accident is relatively flat above and below 15 mph of the mean speed of traffic.
In 1990, Harkey, Robertson and Davis replicated Solomon’s U-shape curve by comparing
police estimated travel speeds of 532 vehicles involved in crashes, with mean travel speeds
determined from 24 hour speed data collected on the same stretch of roadway. Their analysis
was performed on data from a 3-year period and excluded any crash involving intersections,
alcohol influences or weekends.
35
Figure 11: West & Dunn relative involvement rate curve
In 1971 Ezra Hauer brought to light an interesting point relating to the Solomon U-Shaped
curve, rather looking at accident rates and their correlation to the number of overtaking
situations present. He explains that for vehicles to be involved in accidents usually they must
encounter each other, unless obviously the accident involves a stationary object. The more
times vehicles overtake or pass each other the more opportunities for this accidental
encounter to occur (32). Results from this study showed that the number of vehicle
interactions of being passed or overtaking another vehicle displays the same U-shaped curve,
with the minimum located at the median speed. Research by Hauer gives thought to the fact
that a greater speed disparity amongst vehicles can lead to more overtaking opportunities,
increasing relative involvement rates.
Previous research is displayed together in Figure 12, depicting a general U-shape trend for all
of the studies (30). Showing that by reducing the deviation from the mean travel speed, there

36
will be a reduction in relative involvement rate. This can be achieved by setting an
appropriate speed limit, which drivers feel comfortable traveling at.
Figure 12: Summary of U-shaped curve analysis
Although several research efforts have attempted to recreate the Solomon U-shaped
relationship between speed deviation and relative involvement in collisions, Gary A. Davis
from The University of Minnesota sought to analyze the validity of this relationship (33).
Davis hypothesized that the Solomon curve was a creation of several different crash types
into one analysis. Davis determined that it was necessary to analysis different crash types
independently of each other. Although this often reduced the number of incidents within the
study it was necessary, due to the fact that different crash types occur at different traveled

37
speeds. For example those vehicles involved in turning movement crashes are going to be
traveling at a much slower speed than that of which is posted on the roadway, creating that
lower bound of the U-shaped Solomon curve.
To determine if the relationship Solomon presented between speed and relative risk of being
involved within an accident was valid, Davis studied two cases (33). The first was conducted
by the Road Accident Research Unit (RARU) at the University of Adelaide. There they
looked at 151 case vehicles involved in serious and fatal crashes on roadways in which the
posted speed was at least 60 km/hr. They were able to determine the speed of the control
vehicles on the roadway by collecting radar speeds for four vehicles on the roadway in
similar driving conditions. Case study two involved 46 fatal crashes that occurred on
Minnesota highways between January 1, 1997 and June 30, 2000. Again, Davis determined
the control speeds by using fatal crashes that occurred on portions of the roadway in which
speed data was available. Using these two case-control study sections, Davis employed
Bayesian statistical modeling to determine if the Solomon U-shaped relationship was present.
From both studies it was determined that no such relationship exists when crashes are kept to
similar types for the analysis. Davis did conclude that although the U-shaped relationship did
not exist, there was evidence that an increased speed was associated to an increased crash
risk. The research performed by Davis concluded that a greater speed disparity may not be
more dangerous on the roadway after all (33).

38
4 DATA
To analyze the safety impacts of increasing the speed limit to 70 mph in Wisconsin, two
main data sources were used. Both sources come from the University of Wisconsin-Madison
Wisconsin Traffic Operations and Safety Laboratory (TOPS) WisTransPortal System. The
system houses several web based applications, two of which were selected for this research.
First is the MV4000 Crash Data Resources center. The MV4000 database contains all
reported crashes in Wisconsin from 1994, through present. Second is the Volume, Speed and
Occupancy (VSPOC) Traffic Detector Database. This database contains traffic detector data
(volume, speed and occupancy) from the Wisconsin Department of Transportation
(WisDOT) Advanced Traffic Management System (ATMS) from 1997 to present.
4.1 MV4000 Crash Data
One of the biggest concerns regarding increasing the speed limit to 70 mph is the implication
that this will also increase the frequency of crashes on the roadway. In order to assess this
assumption the MV4000 crash database was used.
Wisconsin has undergone several rounds of posted speed limit increases, meaning that new
roadway segments have been recently added to the lane mileage of 70 mph roadways.
However, this analysis will only consider the roadway segments in the first implementation
of 70 mph speed limits, as those speed changes have been in place the longest yielding the
most in-depth data set. The first implementation of speed limit increases is shown in Figure
13, and includes 14 segments of roadway throughout the state of Wisconsin. Those exact
segments are shown in Table 7 indicating which highway experienced the increase, the
starting and ending location, and the total segment of Interstate in miles that was increased to
70 mph.

39
The Crash Data Retrieval Facility was used to collect data on these 14 segments of roadway
from 2005 to 2015, encompassing 10½ years prior to the speed limit increase and
approximately one-half a year post speed limit increase. Each segment of roadway was
analyzed separately, before aggregating the crash data results.
Figure 13: First round of 70 mph speed limit increases in Wisconsin
In order to appropriately select incidents that occurred on the roadways indicated between the
starting and ending locations shown in Table 7, the data was narrowed down to incidents
which occurred on the crossroads which fell between the starting and ending locations.
Limiting data in this manner was necessary due to the fact that more recent data from 2015

40
had not been geocoded with the latitude and longitude markers within the crash database.
Since the 2015 crash data did not have latitude and longitude markers associated with the
crashes data could not be limited using these bounds, since 2015 data would yield unusually
low numbers of crashes. Due to this, data was narrowed down by determining all crossroads
that were on each segment of roadway.
Table 7: 14 Original sections of Interstate converted to 70 mph in Wisconsin
Data for each roadway was downloaded from the Crash Database for 2005 to 2015. This
dataset was then reduced on the basis of incidents which occurred on cross streets or
highways that fell between the starting and ending locations indicated in Table 7. Collecting
the crash data in this manner ensured that every year was represented in the same way, since
the same cross roads and highways were used for every year of data collection.
Once the correct sample of data had been identified the total number of crashes occurring
each year from 2005 to 2015, within the months of July thru December, were summed.
Highway From To Miles
I-94 Illinois State Line Milwaukee County Line 25
I-94 I-39/90 in Dane County WIS 164 in Waukesha County 57
I-39/90 Illinois State Line US 12 in Dane County 41
I-39/90/94 US 151 in Dane County I-39 split in Columbia County 22
I-39 I-90/94 split in Columbia County WIS 54 in Portage County 65
I-39 WIS 66 in Portage County Bus 51 in Marathon County 26
I-90/94 I-39/90/94 in Columbia County I-90 in Monroe County 63
I-90 I-94 in Monroe County US 53 in La Crosse County 37
I-94 I-90 in Monroe County US 53 in Eau Claire County 77
I-94 WIS 312 in Eau Claire County WIS 35 in St Croix County 55
I-43 County T in Ozaukee County WIS 29 in Brown County 91
I-43 I-39 in Rock County WIS 164 in Waukesha County 54
I-41 South Washington County Line WIS 441 in Winnebago County 93
I-41 WIS 441 in Outagamie County WIS 172 in Brown County 20
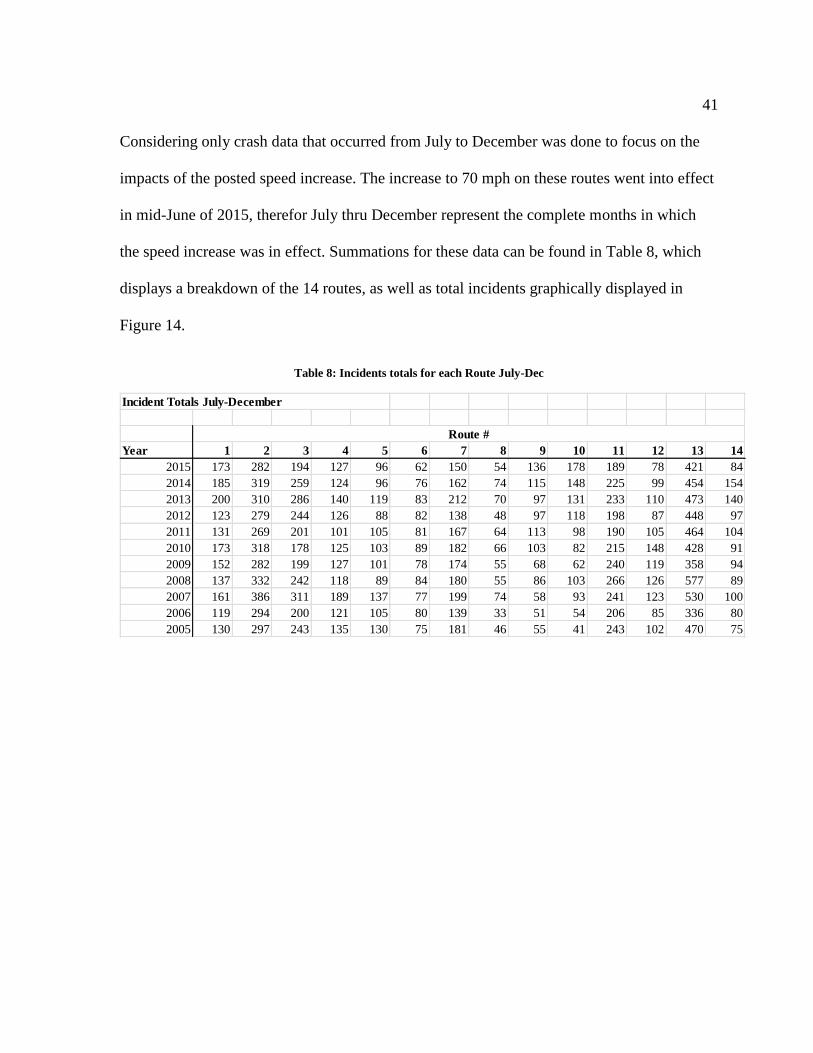
41
Considering only crash data that occurred from July to December was done to focus on the
impacts of the posted speed increase. The increase to 70 mph on these routes went into effect
in mid-June of 2015, therefor July thru December represent the complete months in which
the speed increase was in effect. Summations for these data can be found in Table 8, which
displays a breakdown of the 14 routes, as well as total incidents graphically displayed in
Figure 14.
Table 8: Incidents totals for each Route July-Dec
Year 1 2 3 4 5 6 7 8 9 10 11 12 13 14
2015 173 282 194 127 96 62 150 54 136 178 189 78 421 84
2014 185 319 259 124 96 76 162 74 115 148 225 99 454 154
2013 200 310 286 140 119 83 212 70 97 131 233 110 473 140
2012 123 279 244 126 88 82 138 48 97 118 198 87 448 97
2011 131 269 201 101 105 81 167 64 113 98 190 105 464 104
2010 173 318 178 125 103 89 182 66 103 82 215 148 428 91
2009 152 282 199 127 101 78 174 55 68 62 240 119 358 94
2008 137 332 242 118 89 84 180 55 86 103 266 126 577 89
2007 161 386 311 189 137 77 199 74 58 93 241 123 530 100
2006 119 294 200 121 105 80 139 33 51 54 206 85 336 80
2005 130 297 243 135 130 75 181 46 55 41 243 102 470 75
Incident Totals July-December
Route #

42
Figure 14: Routes 1-14: Total Incidents July – December (2005-2015)
Appendix A contains graphs for Incidents which occurred on each Route. Route numbers 1
through 14 correspond to the 14 segments of roadway part of the initial increase in posted
speeds. Those route numbers and segment identifications are shown in Table 9. These Route
numbers will be referenced throughout the report and will remain consistent with what is
indicated in Table 9.

43
Table 9: Route Numbers, and corresponding segments of Interstate
Beyond just incident totals, alcohol related incidents, speed related crashes and fatal incidents
were also studied. Summations of these incidents types are displayed in Table 11.
In order to assess the different crash related types, different flags within the MV4000 crash
database retrieval system were used, which represent different components of the crash.
Alcohol related incidents are filtered out of the data using the ALCFLAG crash flag (34).
This flag represents crashes in which the driver, bicyclist or pedestrian was listed on the
police report as drinking alcohol before the crash occurred. Total incidents that correlated to
the ALCFLAG from 2005 to 2015 from July thru December are summed in “Alcohol
Related” column of Table 11, and displayed graphically in Figure 15.
Route Number On Interstate From To
1 I-94 Illinois State Line Milwaukee County Line
2 I-94 I-39/90 in Dane County WIS 164 in Waukesha County
3 I-39/90 Illinois State Line US 12 in Dane County
4 I-39/90/94 US 151 in Dane County I-39 split in Columbia County
5 I-39 I-90/94 split in Columbia County WIS 54 in Portage County
6 I-39 WIS 66 in Portage County Bus 51 in Marathon County
7 I-90/94 I-39/90/94 in Columbia County I-90 in Monroe County
8 I-90 I-94 in Monroe County US 53 in La Crosse County
9 I-94 I-90 in Monroe County US 53 in Eau Claire County
10 I-94 WIS 312 in Eau Claire County WIS 35 in St Croix County
11 I-43 County T in Ozaukee County WIS 29 in Brown County
12 I-43 I-39 in Rock County WIS 164 in Waukesha County
13 I-41 South Washington County Line WIS 441 in Winnebago County
14 I-41 WIS 441 in Outagamie County WIS 172 in Brown County

44
Figure 15: Routes 1-14: Alcohol Related Incidents July – December (2005-2015)
To determine if speed was considered a contributing factor in the crash the DRVRPC flag
was used. This flag lists possible driver contributing circumstances within the crash,
including driver condition, failure to yield, inattentive driving, exceeding the speed limit, etc.
For the purposes of this study the focus was on SPD; exceeding the speed limit (34). This
flag can occur for either Driver 1 or Driver 2. Therefore, it was necessary to run the filter on
both drivers and then remove duplicate incidents. The total speed related incidents that
occurred on all routes from July to December are displayed in Table 11, and graphically in
Figure 16.
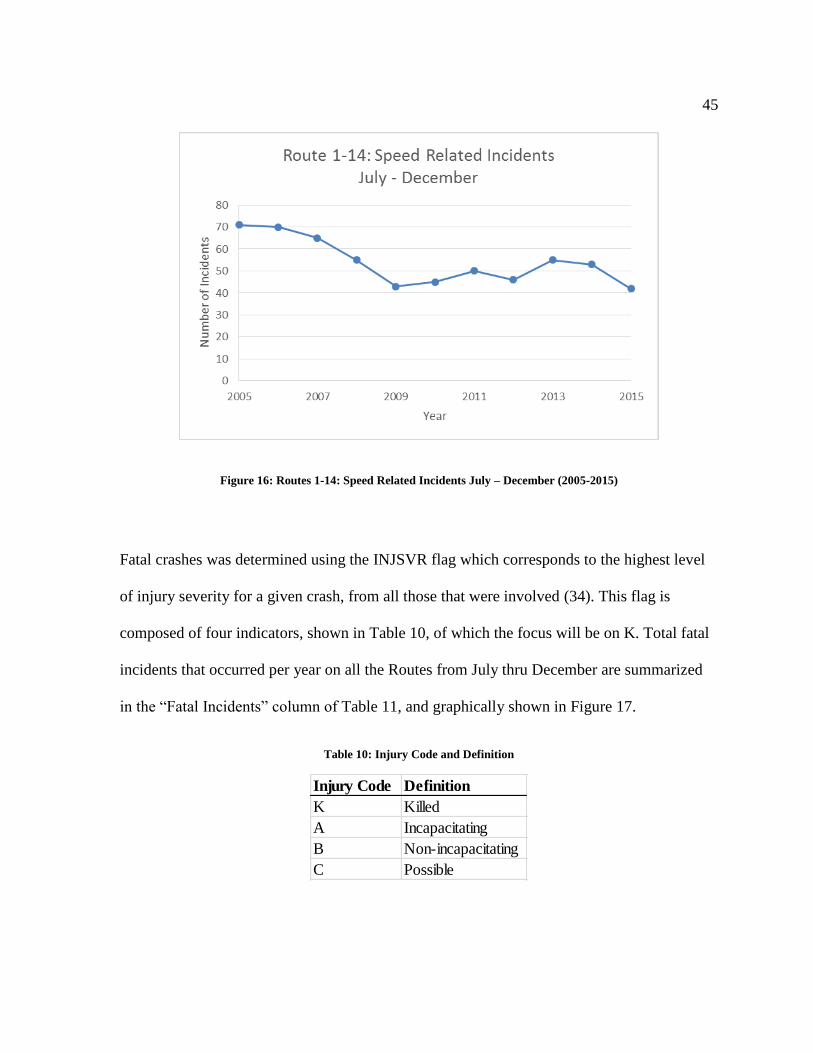
45
Figure 16: Routes 1-14: Speed Related Incidents July – December (2005-2015)
Fatal crashes was determined using the INJSVR flag which corresponds to the highest level
of injury severity for a given crash, from all those that were involved (34). This flag is
composed of four indicators, shown in Table 10, of which the focus will be on K. Total fatal
incidents that occurred per year on all the Routes from July thru December are summarized
in the “Fatal Incidents” column of Table 11, and graphically shown in Figure 17.
Table 10: Injury Code and Definition
Injury Code Definition
K Killed
A Incapacitating
B Non-incapacitating
C Possible
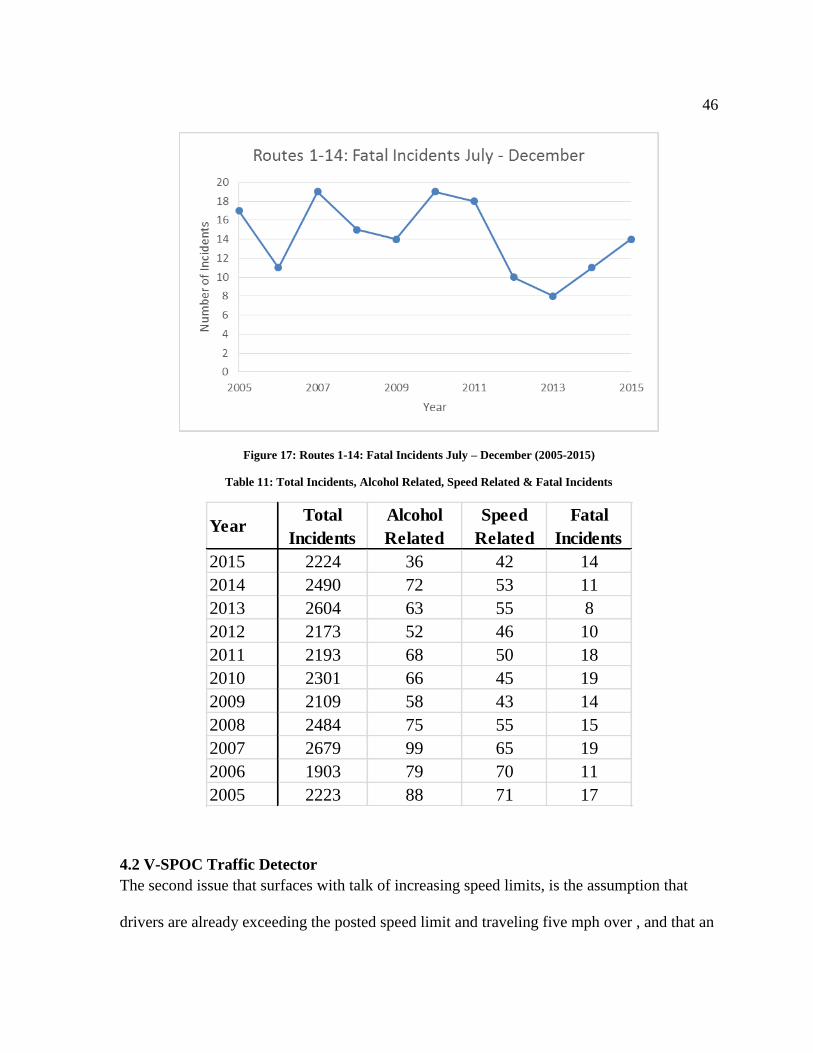
46
Figure 17: Routes 1-14: Fatal Incidents July – December (2005-2015)
Table 11: Total Incidents, Alcohol Related, Speed Related & Fatal Incidents
4.2 V-SPOC Traffic Detector
The second issue that surfaces with talk of increasing speed limits, is the assumption that
drivers are already exceeding the posted speed limit and traveling five mph over , and that an
YearTotal
Incidents
Alcohol
Related
Speed
Related
Fatal
Incidents
2015 2224 36 42 14
2014 2490 72 53 11
2013 2604 63 55 8
2012 2173 52 46 10
2011 2193 68 50 18
2010 2301 66 45 19
2009 2109 58 43 14
2008 2484 75 55 15
2007 2679 99 65 19
2006 1903 79 70 11
2005 2223 88 71 17

47
increase in posted speed of five mph will directly correlate to an increase in traveled speed of
five mph. To evaluate this assumption V-SPOC Traffic Detector data was utilized.
V-SPOC (Volume, Speed and Occupancy) Application has several retrieval facilities for data
regarding volume, speed and occupancy associated with cameras set up throughout the state
of Wisconsin. The focus of this study was to pull data from the “General Detector Data
Retrieval” facility that corresponded to the cameras placed along the 14 segments of roadway
originally converted to 70 mph. Therefore, the first step in this process was to determine the
camera identification numbers that were related to each corridor. In order to do this,
appropriate regions of the state must first be selected (SE, SW, NE, NC, NW), followed by
the corridor, and then analyzing the map to determine which Detector ID numbers fell within
the limits of each stretch of roadway. Furthermore, only Detector ID’s that were located
along the main corridor were included, omitting any that were associated with on and off
ramps due to drivers slowing down to make these maneuvers, which would yield speeds not
truly reflective of the general travel. Beyond omitting on and off ramp detector ID’s, the first
mile inward from either boundary of speed change were omitted to allow for a buffer in
which drivers are likely to still be increasing speed, and not yet traveling at the desired pace.
Detector ID’s associated with each route are displayed in Appendix B. Those highlighted in
yellow indicate that they fell within that one mile buffer zone and are not included in the
speed analysis. Detectors existed on all routes except route 5; therefore, it was omitted from
this portion of the data analysis. Route 12 only had detectors that fell within the one mile
buffer zone on either end of the route, so it was additionally omitted from this section of the

48
analysis. The number of detectors on each route varied significantly; however, all of the
remaining 12 segments of roadway had at least four detectors present.
Once the detector ID numbers were identified for each route, 5-minute Detector Data for
Speed was collected. Data was collected for eight different randomly selected days
throughout the year to encompass the impacts of changing season and weekend versus
weekday traffic for four years prior to the speed limit increase, and one year post speed limit
increase. Select dates include the first Tuesday and Friday of February, the third Wednesday
and Saturday of August, the first Tuesday and Saturday of October and the first Tuesday and
Saturday of December.
In order to ensure that weather was not impacting the speed of vehicles, historical weather
data was extracted from underground weather. The historical weather data for each day is
summarized in Appendix C. Heavy rain and heavy snowfall according to the National
Oceanic and Atmospheric Administration (NAOO) can reduce average traveled speed 3 – 16
percent and 5 – 40 percent respectively. Heavy snow is defined as snowfall accumulating to 6
inches or more in depth in 24 hours or less, and heavy rain as 3.93 inches of rainfall in 24
hours of less (35). The greatest snowfall experienced on the days selected was 2.5 inches on
February 3rd, 2015, while the greatest rainfall was 0.79 inches on December 3rd, 2011. Both
of these maximums experienced fall under the heavy rainfall and snowfall thresholds defined
by NAOO. Therefor the speed of vehicles should not have been reduced due to weather.
Data are summarized in Table 12 which shows average speeds in two sections. The top
section of Table 13 displays average speeds collected from four years prior to the speed limit

49
increase, for August, October and December this includes 2011-2014, and for February this
includes 2012-2015. The bottom half of the table shows the average traveled speeds for each
Route after the posted speed limit was increased to 70 mph, for August, October and
December this is data from 2015 and for February this is data from 2016, as the increase
occurred in June of 2015.

50
Table 12: Average Traveled Speed per Route on Select Days
Year Date 1 2 3 4 6 7 8 9** 10 11 13 14
Aug_3_Sat 66.67 69.42 69.62 69.58 68.75 70.14 69.83 66.81 72.91 69.46 66.88 58.33
Aug_3_Wed 64.45 68.02 68.14 66.56 68.66 68.04 70.43 65.08 69.89 67.73 63.66 55.63
Dec_Sat 65.30 68.17 68.50 67.80 66.48 67.41 68.26 62.90 68.39 69.31 65.21 56.49
Dec_Tues 62.65 65.29 66.19 64.56 64.34 66.07 68.79 60.85 64.27 67.62 62.15 56.83
Feb_Fri 63.75 65.62 65.82 63.84 66.91 66.62 67.28 64.33 63.71 68.28 63.04 61.02
Feb_Tues 62.87 65.00 63.83 63.65 66.00 64.76 66.47 61.28 63.97 67.14 62.63 57.57
Oct_Sat 65.93 67.81 68.36 68.80 68.72 68.80 69.94 62.61 70.55 69.11 64.63 55.33
Oct_Tues 62.79 66.34 66.46 64.37 67.35 66.68 70.11 56.42 67.41 68.95 63.33 53.48
Aug_3_Sat 70.11 71.66 70.73 74.16 62.87 71.62 70.71 68.00 71.61 72.16 70.20 58.14
Aug_3_Wed 68.30 69.46 68.09 70.00 61.57 67.74 68.04 64.84 71.10 66.16 67.02 53.35
Dec_Sat 71.11 70.40 69.51 73.10 55.95 71.09 69.68 64.75 70.32 72.57 64.16 53.13
Dec_Tues 67.58 67.95 66.79 67.29 52.31 65.93 67.41 60.10 64.70 70.30 62.43 55.30
Feb_Fri 68.08 68.97 67.69 70.01 54.62 68.88 69.11 63.17 69.31 71.57 67.37 65.29
Feb_Tues 67.48 67.36 64.59 65.24 44.29 59.32 62.27 54.41 61.02 68.85 59.91 58.84
Oct_Sat 70.45 70.80 69.09 70.16 56.96 71.54 73.54 66.43 68.91 72.51 67.31 53.76
Oct_Tues 68.28 69.22 67.73 68.98 58.08 66.97 71.90 64.19 67.16 71.62 65.10 52.35
Previous 4
Year
Average:
Posted 65
MPH
(**only 2
yrs data)
Year of
Change:
Posted 70
MPH
Route

51
4.3 Incident & Volume Data
Beyond just reporting the number of incidents, incident rates are necessary as well. By
combining the incident data from the MV4000 with volume data from the V-SPOC
application, incidents per thousand vehicles on the roadway could be determined.
This calculation allows for the observation of not just raw number of incidents but also the
number of incidents relative to the number of drivers on the roadway. It is hypothesized that
if the number of drivers on the roadway increase the number of incidents will as well,
causing just the raw number of incidents to not always reflect the safety of the roadway.
Calculating an incident rate eliminates the confounding impacts that an increase in vehicles
on the roadway could add to the increase in number of incidents.
5 DATA ANALYSIS
Once data from the V-SPOC application and MV4000 crash data base was collected, the
significance of the data needed to be determined. First addressing the concern of an increase
in crash rates, second the concern regarding a direct link to an increased traveled speed of
five mph, and lastly the impacts of traffic volumes on incidents.
5.1 Crash Rates
The MV4000 crash data was analyzed using tests of significance, which allow us to either
support or reject claims based on a sample set of data. Every test of significance begins with
a null hypothesis. This hypothesis represents a claim that has been made regarding the data
that is believed to be true. In this instance this claim is that increasing the posted speed of the
roadway has no impact on the number of roadway crashes. This is then contradicted by an
alternative hypothesis, whose job is to state what the statistical hypothesis is to prove. Again,

52
in this instance that would be that increasing the posted speed on the roadway has an impact
on the number of incidents. The resulting conclusion of the test is given in terms of the null
hypothesis. We either reject the null hypothesis in favor of the alternative, i.e., that increasing
the posted speed did impact the number of roadway incidents. Or, we accept the null that
increasing the posted speed did not impact the number of roadway incidents.
When stating an alternative hypothesis there are two options; one-sided or two-sided. A one
sided hypothesis looks to address the fact that the resulting data is either larger or smaller
than the stated null hypothesis. Comparatively a two sided hypothesis claims that the data is
simply not equal to the stated null hypothesis. This research employed a two-sided
hypothesis in order to address the fact that the number of incidents could have increased or
decreased from previous years, even with the increase in the posted speed limit.
Once statistical hypothesis have been established, the next step was calculating a z-score. A
z-score is calculated using Equation 4.
𝑧 =�̅�−𝜇0
𝜎
√𝑛
(4)
Where
�̅� = 𝑡ℎ𝑒 𝑠𝑎𝑚𝑝𝑙𝑒 𝑚𝑒𝑎𝑛
𝜇0 = 2015 𝑦𝑒𝑎𝑟𝑙𝑦 𝑐𝑟𝑎𝑠ℎ 𝑠𝑡𝑎𝑡𝑖𝑠𝑡𝑖𝑐
𝜎 = 𝑠𝑡𝑎𝑛𝑑𝑎𝑟𝑑 𝑑𝑒𝑣𝑎𝑡𝑖𝑜𝑛
𝑛 = 𝑛𝑢𝑚𝑏𝑒𝑟 𝑜𝑓 𝑠𝑎𝑚𝑝𝑙𝑒𝑠

53
Statistical analysis for this research was performed at an alpha value of 0.05. To achieve a
significance level of 0.05 for a two-sided test, the absolute value of the test statistic (|z|) must
be greater than or equal to the critical value 1.96.
Results of the significance testing are displayed in Table 13, showing the data for each route,
the sample mean and sample standard deviation and the calculated z-score using Equation 4.
Route numbers highlighted in red and green indicate an absolute z-score greater than the
critical value of 1.96. When the z-score was greater than +/- 1.96, the null hypothesis was
rejected in favor of the alternative that increasing the posted speed on the roadway did impact
the number of incidents. Those routes highlighted in red (1, 9 and 10) show statistical
significance indicating that the increase in speed limit increased the number of incidents.
Comparatively, the Routes highlighted in Green (2, 3, 5-7, 11, 12 & 14) indicate statistical
significance in the opposite respect, that the number of incidents occurring in 2015 along
those routes is statistically significant below the previous 10 years.

54
Table 13: Route Incident Totals June thru December and Significance
Incidents occurring on each Route were summed for each given year, leading to the totals
shown in Table 14. Also included in Table 14 are total alcohol related crashes, speed related
crashes and fatal crashes on all routes for each given year. Due to the smaller number of
these three types of incidents breaking them down by Route number did not hold value.
Statistical significance of the four incident groups was tested with the same null and
alternative hypothesis and the results are displayed in Table 14. The z-score calculated for
the total number of incidents was 1.26. Both alcohol and speed related incidents showed
significant z-scores; however, the significance indicated that these numbers were lower for
2015 than the previous five years. Fatal incidents, like total incidents, showed no
significance.
Year 1 2 3 4 5 6 7 8 9 10 11 12 13 14
2015 173 282 194 127 96 62 150 54 136 178 189 78 421 84
2014 185 319 259 124 96 76 162 74 115 148 225 99 454 154
2013 200 310 286 140 119 83 212 70 97 131 233 110 473 140
2012 123 279 244 126 88 82 138 48 97 118 198 87 448 97
2011 131 269 201 101 105 81 167 64 113 98 190 105 464 104
2010 173 318 178 125 103 89 182 66 103 82 215 148 428 91
2009 152 282 199 127 101 78 174 55 68 62 240 119 358 94
2008 137 332 242 118 89 84 180 55 86 103 266 126 577 89
2007 161 386 311 189 137 77 199 74 58 93 241 123 530 100
2006 119 294 200 121 105 80 139 33 51 54 206 85 336 80
2005 130 297 243 135 130 75 181 46 55 41 243 102 470 75
Sample Mean 151.10 308.60 236.30 130.60 107.30 80.50 173.40 58.50 84.30 93.00 225.70 110.40 453.80 102.40
Std. Deviation 26.43 31.99 40.07 21.80 15.61 4.03 22.20 12.81 23.16 32.44 22.27 18.20 67.43 23.97
Z-score -2.62 2.63 3.34 0.52 2.29 14.51 3.33 1.11 -7.06 -8.28 5.21 5.63 1.54 2.43
Incident Totals July-December
Route #

55
Table 14: Total, Alcohol, Speed & Fatal Incidents and Significance
5.2 Speed Impacts
Increasing the speed limit five mph often leads to the assumption that operating speeds will
also increase by the same five mph. However, data analysis and results suggest this is not the
case. Drivers prefer to travel at a speed they feel comfortable, this does not always correlate
to five mph above the posted speed. Average traveled speed on all 14 routes were compared,
for four years of data prior to the increase, and the one year post increase. These averages are
previously displayed in Table 12. Differences between pre-speed increase average and post-
speed increase were determined and displayed in Table 15. Those highlighted in yellow
indicate days and corresponding routes that showed an increase of at least five mph in the
average traveled speed. Of the 112 potential day and route combinations the average speed
Incident Totals July- Dec
Year Totals Alcohol Speed Fatal
2015 2224 36 42 14
2014 2490 72 53 11
2013 2604 63 55 8
2012 2173 52 46 10
2011 2193 68 50 18
2010 2301 66 45 19
2009 2109 58 43 14
2008 2484 75 55 15
2007 2679 99 65 19
2006 1903 79 70 11
2005 2223 88 71 17
Sample Mean 2315.90 72.00 55.30 14.20
Std. Deviation 230.45 13.31 9.66 3.82
Z-score 1.26 8.55 4.35 0.17

56
increased by at least five mph in only six instances. Omitting route six from the averages,
the remaining routes showed an average speed increase of 1.5 mph.

57
Table 15: Difference in average speeds before and after the 70 mph increase
Year Date 1 2 3 4 6 7 8 9** 10 11 13 14
Aug_3_Sat 3.44 2.24 1.11 4.58 -5.88 1.48 0.88 1.19 -1.30 2.70 3.32 -0.19
Aug_3_Wed 3.85 1.44 -0.05 3.44 -7.09 -0.30 -2.39 -0.24 1.21 -1.57 3.36 -2.28
Dec_Sat 5.81 2.23 1.01 5.30 -10.53 3.68 1.42 1.85 1.93 3.26 -1.05 -3.36
Dec_Tues 4.93 2.66 0.60 2.73 -12.03 -0.14 -1.38 -0.75 0.43 2.68 0.28 -1.53
Feb_Fri 4.33 3.35 1.87 6.17 -12.29 2.26 1.83 -1.16 5.60 3.29 4.33 4.27
Feb_Tues 4.61 2.36 0.76 1.59 -21.71 -5.44 -4.20 -6.87 -2.95 1.71 -2.72 1.27
Oct_Sat 4.52 2.99 0.73 1.36 -11.76 2.74 3.60 3.82 -1.64 3.40 2.68 -1.57
Oct_Tues 5.49 2.88 1.27 4.61 -9.27 0.29 1.79 7.77 -0.25 2.67 1.77 -1.13
Difference
Route

58
Omitting Route six from the averages was necessary due to the drastic decrease in speed that
was present. After further research it was concluded that this stretch of roadway was under
construction during the six months of post speed limit increase, creating lane closures,
reduced lane widths and lower posted speeds (36). Additionally Route six only has one set of
detectors within the entire stretch of roadway therefor the road construction dramatically
impacts the traveled speed of commuters. For these reasons this Route was not included
within the average speed increase related to the five mph increased posted speed.
5.3 Incidents and Volumes
Beyond looking at total number of incidents on the roadway, the research also considered the
impact of the volume of vehicles on the roadway. Considering the fact that an increase in the
number of incidents could be associated with an increase in the number of vehicles on the
roadway. In order to test this, data from the MV4000 database was combined with vehicle
per hour data from the VSPOC application.
Combining two data sources allowed for incidents per thousand vehicles to be calculated.
From the VSPOC application average vehicles per hour were determined for the eight select
days mentioned previously, for the same five year span (2011-2015). These eight days were
then averaged over the entire year and converted to yearly traffic volumes. Yielding an
average vehicles per year total for each of the five years, encompassing four years prior to
the posted speed increase and one year post. Crash totals from the MV4000 were used for
the same five year span (2011-2015). Using these two figures (vehicles/year and incidents/
year) incidents per thousand vehicles were calculated for each of the five years. Calculation
were performed for each of the individual roadway segments, as well as the total segments of

59
roadway combined. Figure 18 shows the results of the total segments combined, with the
graphs of each segment displayed in Appendix D. 2015 showed a lower number of incidents
per thousand vehicles than the two years passed, even with the increase in posted speed to 70
mph.
Figure 18: Routes 1-14: Incidents per 1,000 Vehicles
Statistical significance testing was performed using the same methods previously discussed
in section 5.1. With a null hypothesis that increasing the posted speed limit to 70 mph did not
impact the number of incidents per thousand vehicles, with the alternative being that it did.
Employing the same z-score calculation yielded a z-score of 2.63. This information is
displayed in Table 16. Any z-score greater than the critical value of 1.96 indicates statistical
significance. Therefor a z-score of 2.63 shows that there was a statistically lower number of
incidents per thousand vehicles in 2015 than compared to the previous 4 years when the
posted speed was five mph lower. This data again shows that increasing the posted speed
limit to 70 mph did not negatively impact the safety of the roadway.
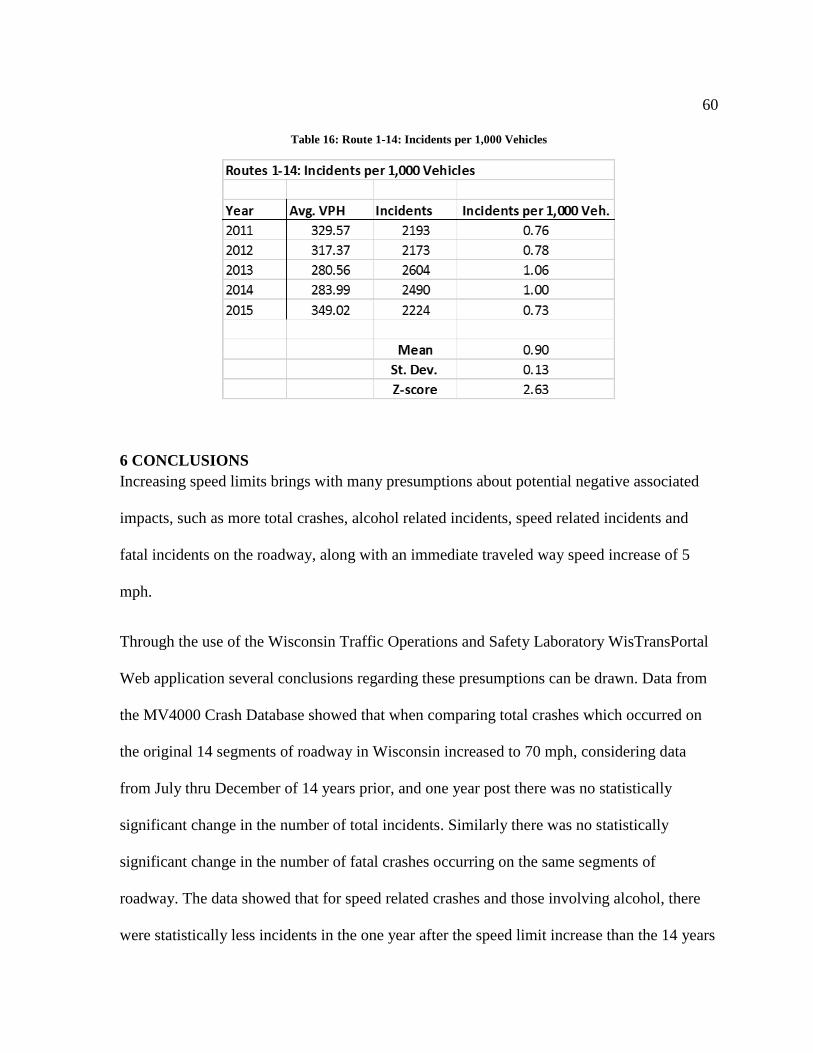
60
Table 16: Route 1-14: Incidents per 1,000 Vehicles
6 CONCLUSIONS
Increasing speed limits brings with many presumptions about potential negative associated
impacts, such as more total crashes, alcohol related incidents, speed related incidents and
fatal incidents on the roadway, along with an immediate traveled way speed increase of 5
mph.
Through the use of the Wisconsin Traffic Operations and Safety Laboratory WisTransPortal
Web application several conclusions regarding these presumptions can be drawn. Data from
the MV4000 Crash Database showed that when comparing total crashes which occurred on
the original 14 segments of roadway in Wisconsin increased to 70 mph, considering data
from July thru December of 14 years prior, and one year post there was no statistically
significant change in the number of total incidents. Similarly there was no statistically
significant change in the number of fatal crashes occurring on the same segments of
roadway. The data showed that for speed related crashes and those involving alcohol, there
were statistically less incidents in the one year after the speed limit increase than the 14 years
61
prior. Therefore, there is no evidence to suggest that the increase to a 70 mph maximum
speed limit had a negative impact on safety.
Through the application of the VSPOC traffic detector data, the assumption that a five mph
speed limit increase correlates directly to a traveled way increase of five mph was tested. Due
to data quantities eight random days throughout the year were tested for the average traveled
way speed on the 14 different segments of roadway. On average, after omitting one route
under construction, the average traveled way speed increased only 1.5 mph, even when the
posted speed was increased 5 mph. Therefore, the increase in the posted speed limit to 70
mph has resulted in only a 1.5 mph increase in average operating speeds.
Combining the two data sources in order to determine the impact of vehicle volumes yielded
statistically significant results that the number of incidents per thousand vehicles was lower
in 2015 than the four years prior to the posted speed limit increase. Again indicating that the
increase in posted speed limit was not negatively impacting safety.
7 FUTURE RECOMMENDATIONS
The speed limit increase in Wisconsin occurred in June of 2015. This analysis used data from
July to December from the years of 2005 to 2015. In order to have a more in depth analysis,
this research should be continued with time up to the point in which three years of data post
speed limit increase is available.
Additionally since the initial increase on the 14 select segments of Interstate highway, several
other portions of roadway throughout the state have been changed from a posted speed of 65

62
mph to 70 mph. Expanding the dataset to include all segments of roadway operating at 70
mph will provide a more comprehensive look at this issue.
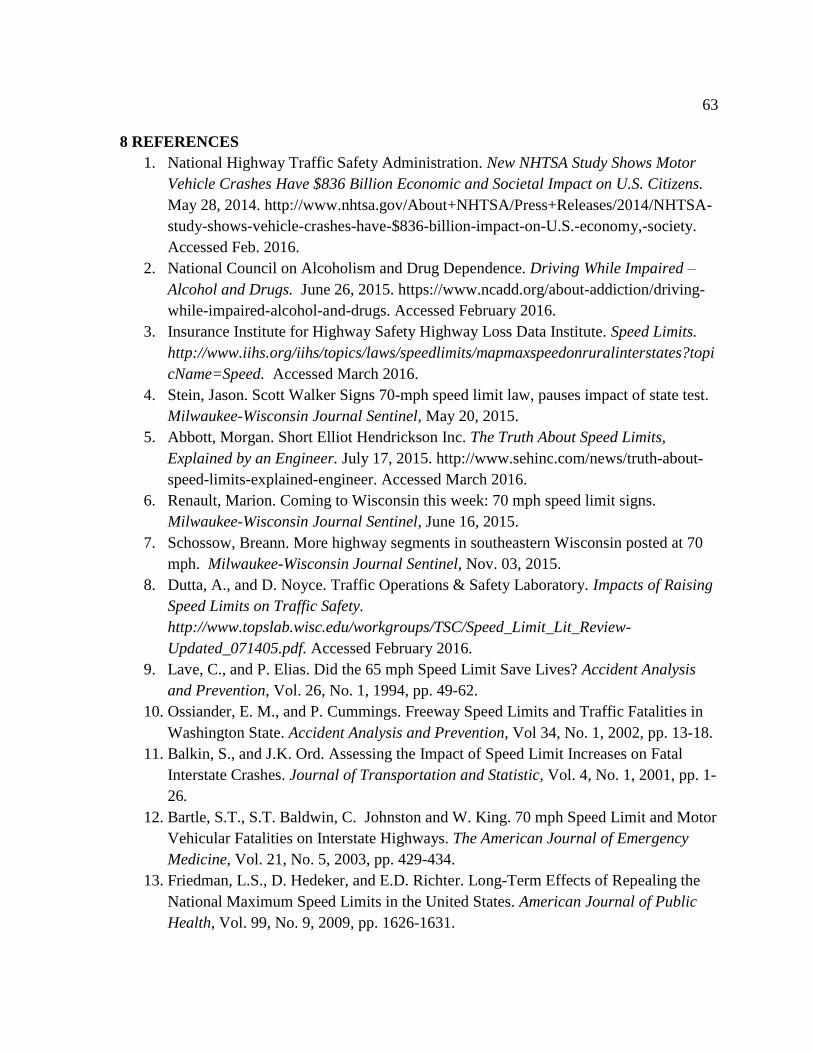
63
8 REFERENCES
1. National Highway Traffic Safety Administration. New NHTSA Study Shows Motor
Vehicle Crashes Have $836 Billion Economic and Societal Impact on U.S. Citizens.
May 28, 2014. http://www.nhtsa.gov/About+NHTSA/Press+Releases/2014/NHTSA-
study-shows-vehicle-crashes-have-$836-billion-impact-on-U.S.-economy,-society.
Accessed Feb. 2016.
2. National Council on Alcoholism and Drug Dependence. Driving While Impaired –
Alcohol and Drugs. June 26, 2015. https://www.ncadd.org/about-addiction/driving-
while-impaired-alcohol-and-drugs. Accessed February 2016.
3. Insurance Institute for Highway Safety Highway Loss Data Institute. Speed Limits.
http://www.iihs.org/iihs/topics/laws/speedlimits/mapmaxspeedonruralinterstates?topi
cName=Speed. Accessed March 2016.
4. Stein, Jason. Scott Walker Signs 70-mph speed limit law, pauses impact of state test.
Milwaukee-Wisconsin Journal Sentinel, May 20, 2015.
5. Abbott, Morgan. Short Elliot Hendrickson Inc. The Truth About Speed Limits,
Explained by an Engineer. July 17, 2015. http://www.sehinc.com/news/truth-about-
speed-limits-explained-engineer. Accessed March 2016.
6. Renault, Marion. Coming to Wisconsin this week: 70 mph speed limit signs.
Milwaukee-Wisconsin Journal Sentinel, June 16, 2015.
7. Schossow, Breann. More highway segments in southeastern Wisconsin posted at 70
mph. Milwaukee-Wisconsin Journal Sentinel, Nov. 03, 2015.
8. Dutta, A., and D. Noyce. Traffic Operations & Safety Laboratory. Impacts of Raising
Speed Limits on Traffic Safety.
http://www.topslab.wisc.edu/workgroups/TSC/Speed_Limit_Lit_Review-
Updated_071405.pdf. Accessed February 2016.
9. Lave, C., and P. Elias. Did the 65 mph Speed Limit Save Lives? Accident Analysis
and Prevention, Vol. 26, No. 1, 1994, pp. 49-62.
10. Ossiander, E. M., and P. Cummings. Freeway Speed Limits and Traffic Fatalities in
Washington State. Accident Analysis and Prevention, Vol 34, No. 1, 2002, pp. 13-18.
11. Balkin, S., and J.K. Ord. Assessing the Impact of Speed Limit Increases on Fatal
Interstate Crashes. Journal of Transportation and Statistic, Vol. 4, No. 1, 2001, pp. 1-
26.
12. Bartle, S.T., S.T. Baldwin, C. Johnston and W. King. 70 mph Speed Limit and Motor
Vehicular Fatalities on Interstate Highways. The American Journal of Emergency
Medicine, Vol. 21, No. 5, 2003, pp. 429-434.
13. Friedman, L.S., D. Hedeker, and E.D. Richter. Long-Term Effects of Repealing the
National Maximum Speed Limits in the United States. American Journal of Public
Health, Vol. 99, No. 9, 2009, pp. 1626-1631.
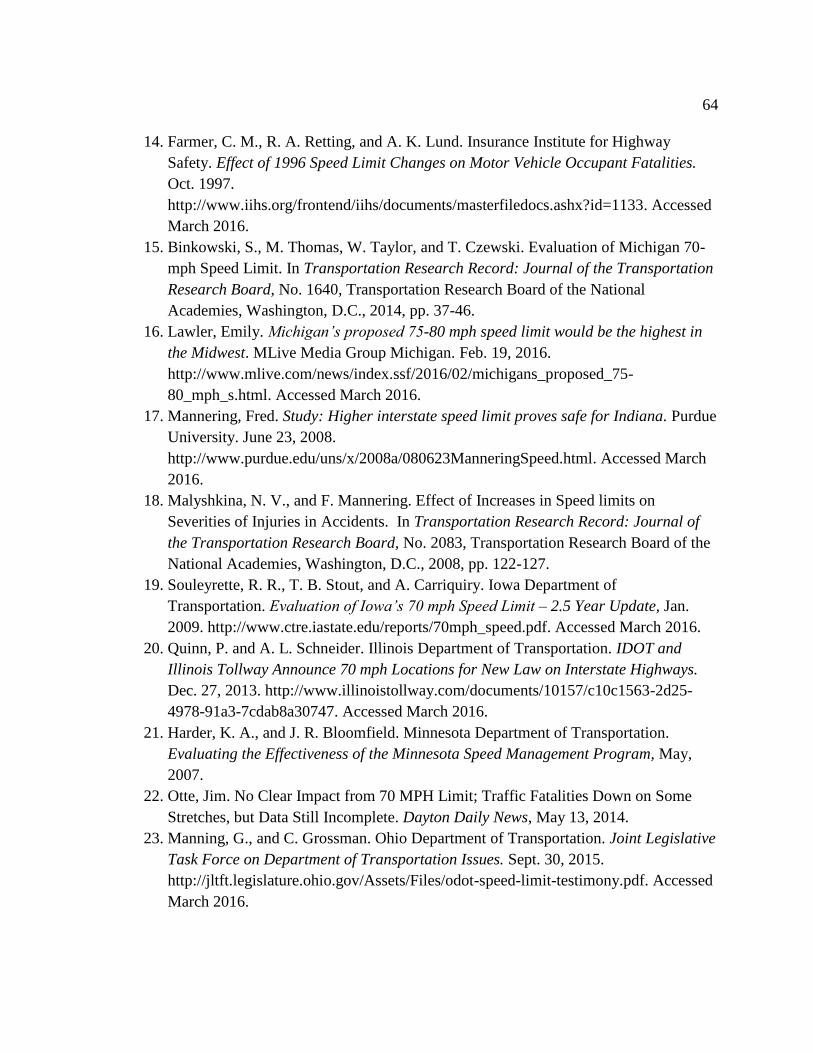
64
14. Farmer, C. M., R. A. Retting, and A. K. Lund. Insurance Institute for Highway
Safety. Effect of 1996 Speed Limit Changes on Motor Vehicle Occupant Fatalities.
Oct. 1997.
http://www.iihs.org/frontend/iihs/documents/masterfiledocs.ashx?id=1133. Accessed
March 2016.
15. Binkowski, S., M. Thomas, W. Taylor, and T. Czewski. Evaluation of Michigan 70-
mph Speed Limit. In Transportation Research Record: Journal of the Transportation
Research Board, No. 1640, Transportation Research Board of the National
Academies, Washington, D.C., 2014, pp. 37-46.
16. Lawler, Emily. Michigan’s proposed 75-80 mph speed limit would be the highest in
the Midwest. MLive Media Group Michigan. Feb. 19, 2016.
http://www.mlive.com/news/index.ssf/2016/02/michigans_proposed_75-
80_mph_s.html. Accessed March 2016.
17. Mannering, Fred. Study: Higher interstate speed limit proves safe for Indiana. Purdue
University. June 23, 2008.
http://www.purdue.edu/uns/x/2008a/080623ManneringSpeed.html. Accessed March
2016.
18. Malyshkina, N. V., and F. Mannering. Effect of Increases in Speed limits on
Severities of Injuries in Accidents. In Transportation Research Record: Journal of
the Transportation Research Board, No. 2083, Transportation Research Board of the
National Academies, Washington, D.C., 2008, pp. 122-127.
19. Souleyrette, R. R., T. B. Stout, and A. Carriquiry. Iowa Department of
Transportation. Evaluation of Iowa’s 70 mph Speed Limit – 2.5 Year Update, Jan.
2009. http://www.ctre.iastate.edu/reports/70mph_speed.pdf. Accessed March 2016.
20. Quinn, P. and A. L. Schneider. Illinois Department of Transportation. IDOT and
Illinois Tollway Announce 70 mph Locations for New Law on Interstate Highways.
Dec. 27, 2013. http://www.illinoistollway.com/documents/10157/c10c1563-2d25-
4978-91a3-7cdab8a30747. Accessed March 2016.
21. Harder, K. A., and J. R. Bloomfield. Minnesota Department of Transportation.
Evaluating the Effectiveness of the Minnesota Speed Management Program, May,
2007.
22. Otte, Jim. No Clear Impact from 70 MPH Limit; Traffic Fatalities Down on Some
Stretches, but Data Still Incomplete. Dayton Daily News, May 13, 2014.
23. Manning, G., and C. Grossman. Ohio Department of Transportation. Joint Legislative
Task Force on Department of Transportation Issues. Sept. 30, 2015.
http://jltft.legislature.ohio.gov/Assets/Files/odot-speed-limit-testimony.pdf. Accessed
March 2016.

65
24. U.S. Department of Transportation, Federal Highway Administration. Manual on
Uniform Traffic Control Devices. 2009.
http://mutcd.fhwa.dot.gov/htm/2009/part2/part2b.htm. Accessed Feb. 2016.
25. Forbes, G. J., T. Gardner, H. McGee, and R. Srinivasan. Methods and Practices for
Setting Speed Limits: An Informational Report. Publication FHWA-SA-12-004.
FHWA, U.S. Department of Transportation, 2012.
26. American Association of State Highway and Transportation Officials. A Policy on
Geometric Design of Highways and Streets. AASHTO, Washington D.C., 2011.
27. U.S. Department of Transportation, Federal Highway Administration. Safety; Design
Speed. Oct. 15, 2014.
http://safety.fhwa.dot.gov/geometric/pubs/mitigationstrategies/chapter3/3_designspee
d.cfm. Accessed March 2016.
28. Donnell, E. T., S. C. Hines, K. M. Mahoney, R. J. Porter, and H. McGee. Speed
Concepts: Informational Guide. Publication FHWA-SA-10-001. FHWA, U.S.
Department of Transportation, 2009.
29. Solomon, D. H. Accidents on Main Rural Highways Related to Speed, Driver and
Vehicle. Publication HE5614.2.A45. Bureau of Public Records, U.S. Department of
Commerce, 1964.
30. Stuster, J., Z. Coffman, and D. Warren. Synthesis of Safety Research Related to Speed
and Speed Management. Publication FHWA-RD-98-154. FHWA, U.S. Department
of Transportation, 1998.
31. West, L. B., and J. W. Dunn. Accidents, Speed Deviation and Speed Limits. July
1971. http://safety.fhwa.dot.gov/speedmgt/ref_mats/fhwasa1304/Resources3/36%20-
%20Accidents,%20Speed%20Deviation%20and%20Speed%20Limits.pdf. Accessed
March 2016.
32. Hauer, E. Accidents, Overtaking and Speed Control. Accident Analysis & Prevention,
Vol. 3, 1971, pp. 1-13.
33. Davis, G. A., S. Davuluri, and J. P. Pei. A Case Control Study of Speed and Crash
Risk. In Center for Transportation Studies: Intelligent Transportation Systems
Initiative, CTS 06-01, Center for Transportation Studies, 2006, pp. 1-44.
34. Wisconsin Traffic Operations and Safety Laboratory. Wisconsin Crash Data
Resources. https://transportal.cee.wisc.edu/services/crash-data/. Accessed Feb. 2016.
35. National Oceanic and Atmospheric Administration. National Weather Service.
http://www.weather.gov/. Accessed August 2016.
36. Department of Transportation, 511 Wisconsin Construction Projects. North Central
Region. May 19, 2016. http://projects.511wi.gov/weeklyupdates-nc/. Accessed May
2016.

66
9 APPENDIXES
9.1 Appendix A: Incident Data Table 17: Route Numbers, and corresponding segments of Interstate
Route Number On Interstate From To
1 I-94 Illinois State Line Milwaukee County Line
2 I-94 I-39/90 in Dane County WIS 164 in Waukesha County
3 I-39/90 Illinois State Line US 12 in Dane County
4 I-39/90/94 US 151 in Dane County I-39 split in Columbia County
5 I-39 I-90/94 split in Columbia County WIS 54 in Portage County
6 I-39 WIS 66 in Portage County Bus 51 in Marathon County
7 I-90/94 I-39/90/94 in Columbia County I-90 in Monroe County
8 I-90 I-94 in Monroe County US 53 in La Crosse County
9 I-94 I-90 in Monroe County US 53 in Eau Claire County
10 I-94 WIS 312 in Eau Claire County WIS 35 in St Croix County
11 I-43 County T in Ozaukee County WIS 29 in Brown County
12 I-43 I-39 in Rock County WIS 164 in Waukesha County
13 I-41 South Washington County Line WIS 441 in Winnebago County
14 I-41 WIS 441 in Outagamie County WIS 172 in Brown County

67
Figure 19: Route 1 Total July thru December Incidents 2005 to 2015
Figure 20: Route 2 Total July thru December Incidents 2005 to 2015

68
Figure 21: Route 3 Total July thru December Incidents 2005 to 2015
Figure 22: Route 4 Total July thru December Incidents 2005 to 2015
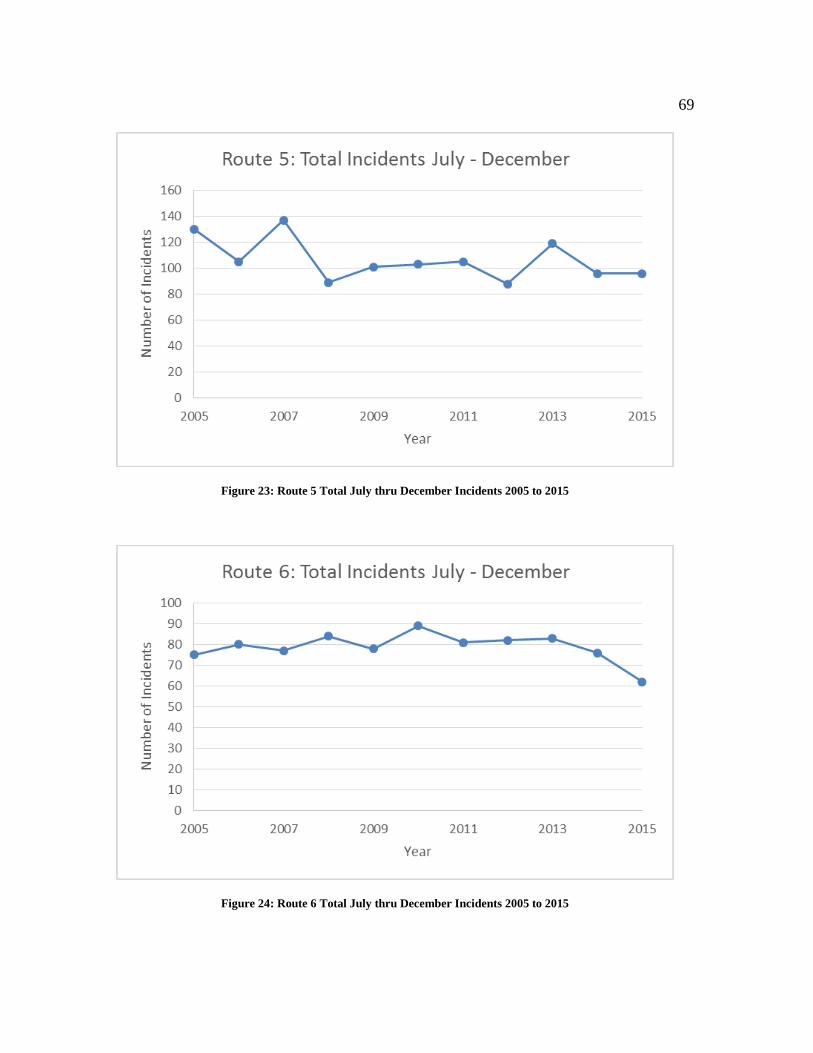
69
Figure 23: Route 5 Total July thru December Incidents 2005 to 2015
Figure 24: Route 6 Total July thru December Incidents 2005 to 2015

70
Figure 25: Route 7 Total July thru December Incidents 2005 to 2015
Figure 26: Route 8 Total July thru December Incidents 2005 to 2015
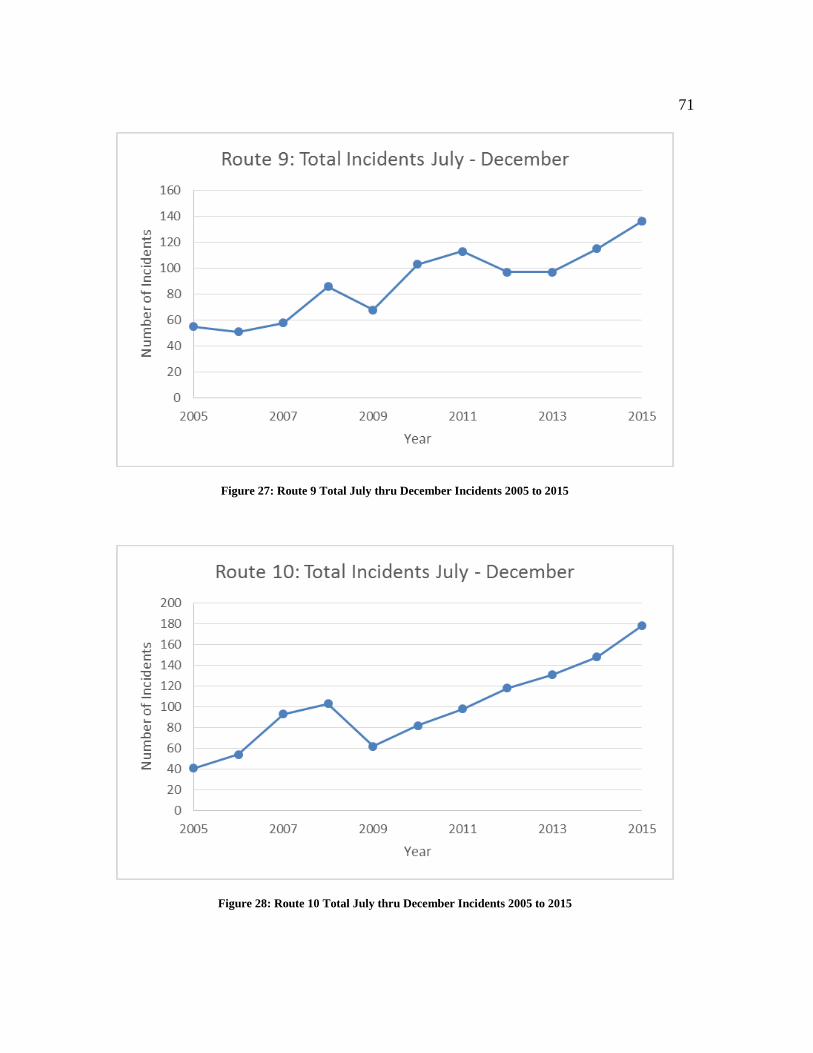
71
Figure 27: Route 9 Total July thru December Incidents 2005 to 2015
Figure 28: Route 10 Total July thru December Incidents 2005 to 2015

72
Figure 29: Route 11 Total July thru December Incidents 2005 to 2015
Figure 30: Route 12 Total July thru December Incidents 2005 to 2015
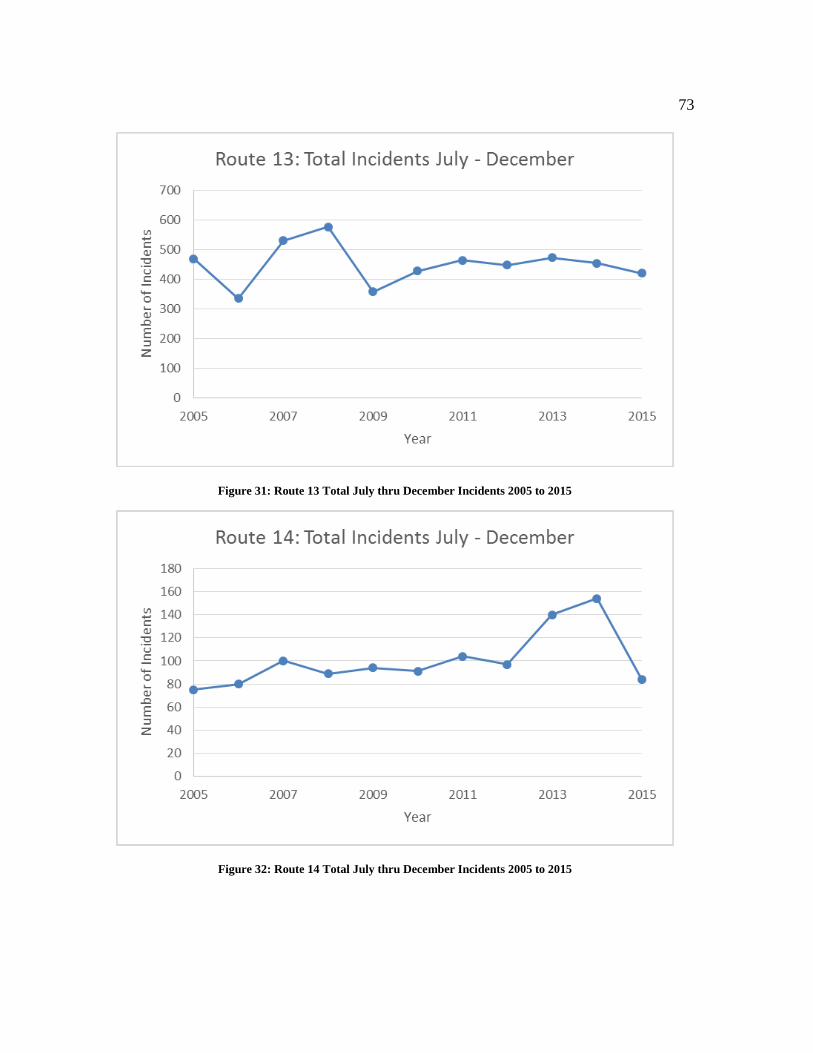
73
Figure 31: Route 13 Total July thru December Incidents 2005 to 2015
Figure 32: Route 14 Total July thru December Incidents 2005 to 2015
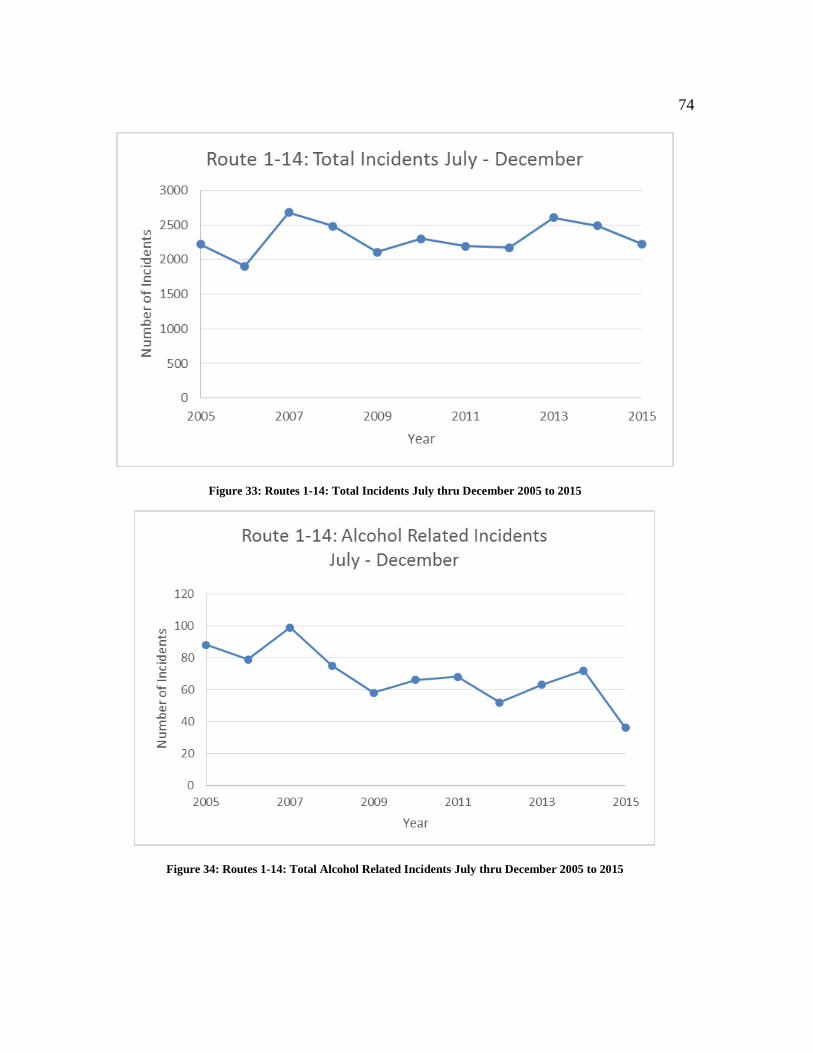
74
Figure 33: Routes 1-14: Total Incidents July thru December 2005 to 2015
Figure 34: Routes 1-14: Total Alcohol Related Incidents July thru December 2005 to 2015

75
Figure 35: Routes 1-14: Total Speed Related Incidents July thru December 2005 to 2015
Figure 36: Routes 1-14 Total Fatalities July thru December 200 5 to 2015

76
9.2 Appendix B: Route Detector ID Numbers Table 18: Route 1 Detector ID Numbers
Number Cross Street Number Cross Street Number Cross Street Number Cross Street
30007 N of Hwy 142 6217 S of WIS 142 6081 CTH ML 6259 CTH E
30008 N of Hwy 142 6220 S of WIS 142 6082 CTH ML 6261 CTH E
30009 N of Hwy 142 6263 CTH E 6084 CTH ML 6282 CTH A
30010 N of Hwy 142 6265 CTH E 6086 CTH ML 6284 CTH A
6088 CTH ML 6267 CTH E 6107 WIS 165 6286 CTH A
6090 CTH ML 6288 CTH A 6109 WIS 165 6307 CTH KR
6092 CTH ML 6290 CTH A 6111 WIS 165 6309 CTH KR
6094 CTH ML 6292 CTH A 6123 WIS 165 6311 CTH KR
6113 WIS 165 6313 CTH KR 30032 S of County C
6115 WIS 165 6315 CTH KR 30033 S of County C
6117 WIS 165 6317 CTH KR 30034 S of County C
6121 WIS 165 6338 N of WIS 20 30035 S of County C
6138 CTH C 6340 N of WIS 20 6132 CTH C
6140 CTH C 6342 N of WIS 20 6134 CTH C
6142 CTH C 6363 CTH K 6136 CTH C
6146 CTH C 6365 CTH K 6144 CTH C
30040 S of County C 6367 CTH K 30061 S of WIS 50
30041 S of County C 51007 S of Hwy G 30062 S of WIS 50
30042 S of County C 51008 S of Hwy G 30063 S of WIS 50
30044 S of County C 51009 S of Hwy G 30064 S of WIS 50
30045 S of County C 51003 N of Hwy G 30016 S of WIS 158
30050 S of WIS 50 51004 N of Hwy G 30017 S of WIS 158
30051 S of WIS 50 51005 N of Hwy G 30018 S of WIS 158
30052 S of WIS 50 30019 S of WIS 158
30053 S of WIS 50 30080 N of WIS 158
30027 N of WIS 50 30081 N of WIS 158
30028 N of WIS 50 30082 N of WIS 158
30029 N of WIS 50 30083 N of WIS 158
30030 N of WIS 50 30011 N of WIS 142
30075 N of WIS 158 30012 N of WIS 142
30076 N of WIS 158 30013 N of WIS 142
30077 N of WIS 158 6232 N of STH 142
30078 N of WIS 158 6234 N of STH 142
6213 S of WIS 142 6236 N of STH 142
6215 S of WIS 142 6257 CTH E
I-94 EB Controllers I-94 WB Controllers
Route 1 Detector ID Numbers (SE Region)

77
Table 19: Route 2 Detector ID Numbers
Number Cross Street Number Cross Street Number Cross Street Number Cross Street
67643 Hwy BB 67641 Hwy BB 1320 Sprecher Rd 1325 Sprecher Rd
67644 Hwy BB 67642 Hwy BB 1321 Sprecher Rd 1326 Sprecher Rd
67647 1 mile W of Hwy 67 67645 1 mile W of WIS 67 1322 Sprecher Rd 1327 Sprecher Rd
67648 1 mile W of Hwy 67 67646 1 mile W of WIS 67 1323 Sprecher Rd 130713 Gaston Rd
67632 WIS 67 67630 WIS 67 130711 Gaston Rd 130714 Gaston Rd
67633 WIS 67 67631 WIS 67 130712 Gaston Rd 130716 Gaston Rd
67602 Hwy 67 67652 Hwy 67 130715 Gaston Rd 13450 County N
67603 Hwy 67 67653 Hwy 67 16454 County N 13452 County N
67180 E of Hwy P 67177 W of Hwy P 16456 County N 13458 County N
67181 E of Hwy P 67178 W of Hwy P 16460 County N 13111 Ridge Rd
67637 Waterville Rd 67639 Waterville Rd 13113 Ridge Rd 13112 Ridge Rd
67638 Waterville Rd 67640 Waterville Rd 13114 Ridge Rd 13017 WIS 73
67660 Hwy C 67663 Hwy C 13015 WIS 73 13018 WIS 73
67661 Hwy C 67664 Hwy C 13016 WIS 73 13121 Jacobs Rd
27305 Hwy 83 67667 Hwy 83 13123 Jacobs Rd 13122 Jacobs Rd
27307 Hwy 83 67668 Hwy 83 13124 Jacobs Rd 28013 Newville Rd
67656 Hwy E/ Maple Ave 67670 Hwy 83 28011 Newville Rd 28014 Newville Rd
67657 Hwy E/ Maple Ave 67671 Hwy 83 28012 Newville Rd 28023 WIS 89
67127 Elmhurst Rd 67658 Hwy E/ Maple Ave 28021 WIS 89 28024 WIS 89
67128 Elmhurst Rd 67659 Hwy E/ Maple Ave 28022 WIS 89 28031 Hwy Q
3021 Hwy SS 67125 Elmhurst 28033 Hwy Q 28032 Hwy Q
3023 Hwy SS 67126 Elmhurst 28034 Hwy Q 28043 Hwy N
3046 CTH SS 3013 Hwy SS 28041 Hwy N 28044 Hwy N
3048 CTH SS 3015 Hwy SS 28042 Hwy N 28005 WIS 26
2919 County G 3017 Hwy SS 28007 WIS 26 28006 WIS 26
2921 County G 2913 County G 28008 WIS 26 28051 Schweppe Lane/ Hwy. X
2923 County G 2915 County G 28053 Schweppe Lane/ Hwy X 28052 Schweppe Lane/ Hwy. X
2938 CTH G 2917 County G 28054 Schweppe Lane/ Hwy X 28061 Farmington Lane
2940 CTH G 2944 CTH G 28063 Farmington Lane 28062 Farmington Lane
2942 CTH G 2946 CTH G 28064 Farmington Lane 28071 Amaranth Dr./Hwy E
5017 1/2 mile W of CTH T 2948 CTH G 28073 Amaranth Drive/ Hwy E 28072 Amaranth Dr./Hwy E
5019 1/2 mile W of CTH T 5011 1/2 mile W of CTH T 28074 Amaranth Drive/ Hwy E 28001 CTH F
5021 1/2 mile W of CTH T 5013 1/2 mile W of CTH T 28003 CTH F 28002 CTH F
1692 Hwy T 5015 1/2 mile W of CTH T 28004 CTH F 28083 Willow Glen Rd
1694 Hwy T 2788 Hwy T 28081 Willow Glen Rd 28084 Willow Glen Rd
1696 Hwy T 2790 Hwy T 28082 Willow Glen Rd
4992 STH 16 2792 Hwy T
4994 STH 16 1686 Hwy T
4996 STH 16 1688 Hwy T
1667 CTH J 1690 Hwy T
1669 CTH J 4986 STH 16
1671 CTH J 4988 STH 16
4990 STH 16
I-94 WB Controllers
Route 2 Detector ID Numbers (SW Region)Route 2 Detector ID Numbers (SE Region)
I-94 EB Controllers I-94 WB Controllers I-94 EB Controller
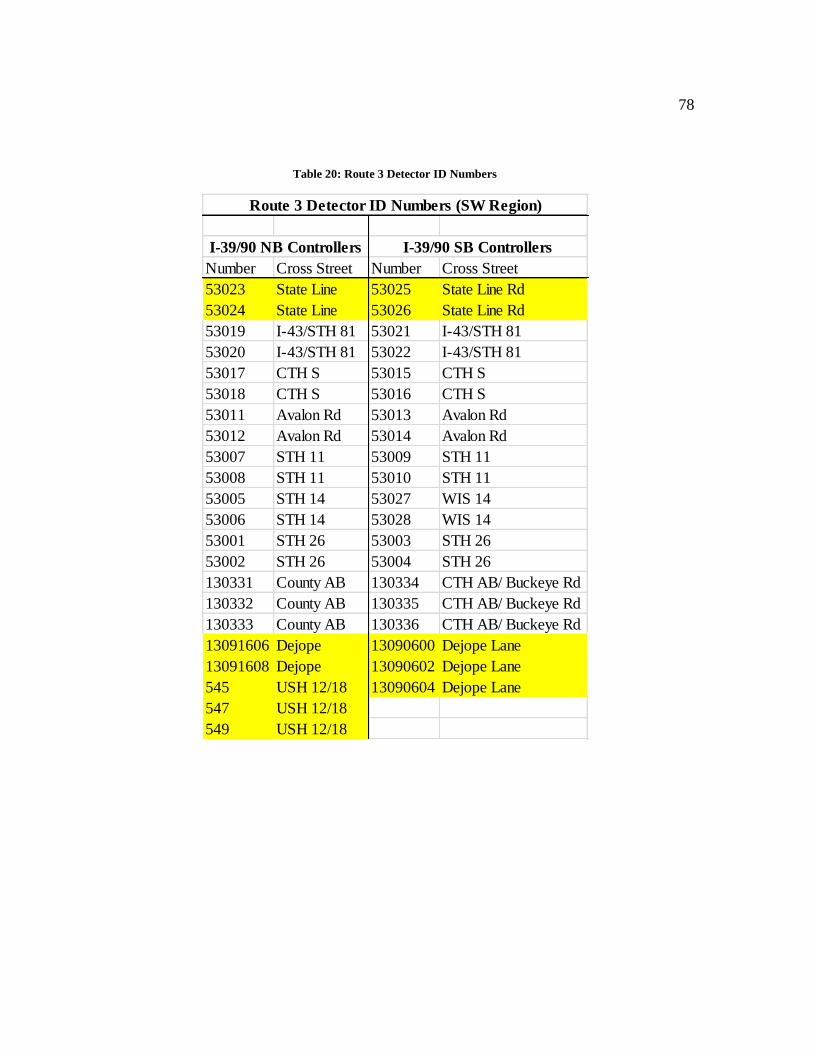
78
Table 20: Route 3 Detector ID Numbers
Number Cross Street Number Cross Street
53023 State Line 53025 State Line Rd
53024 State Line 53026 State Line Rd
53019 I-43/STH 81 53021 I-43/STH 81
53020 I-43/STH 81 53022 I-43/STH 81
53017 CTH S 53015 CTH S
53018 CTH S 53016 CTH S
53011 Avalon Rd 53013 Avalon Rd
53012 Avalon Rd 53014 Avalon Rd
53007 STH 11 53009 STH 11
53008 STH 11 53010 STH 11
53005 STH 14 53027 WIS 14
53006 STH 14 53028 WIS 14
53001 STH 26 53003 STH 26
53002 STH 26 53004 STH 26
130331 County AB 130334 CTH AB/ Buckeye Rd
130332 County AB 130335 CTH AB/ Buckeye Rd
130333 County AB 130336 CTH AB/ Buckeye Rd
13091606 Dejope 13090600 Dejope Lane
13091608 Dejope 13090602 Dejope Lane
545 USH 12/18 13090604 Dejope Lane
547 USH 12/18
549 USH 12/18
Route 3 Detector ID Numbers (SW Region)
I-39/90 NB Controllers I-39/90 SB Controllers

79
Table 21: Route 4 Detector ID Numbers
Number Cross Street Number Cross Street
1000 USH 151 1006 USH 151
1002 USH 151 1008 USH 151
1004 USH 151 1010 USH 151
1114 US 51 130411 Portage Rd
1115 US 51 130412 Portage Rd
130414 Portage Rd 130413 Portage Rd
130415 Portage Rd 130423 Hoepker Rd
130416 Portage Rd 130424 Hoepker Rd
130420 Hoepker Rd 130425 Hoepker Rd
130421 Hoepker Rd 1206 USH 51
130422 Hoepker Rd 1208 USH 51
1200 USH 51 1210 USH 51
1202 USH 51 13004 US 51
1204 USH 51 13005 US 51
13001 US 51 13006 US 51
13002 US 51 1250 WIS 19
13003 US 51 1252 WIS 19
1256 WIS 19 1254 WIS 19
1258 WIS 19 13470 Cuba Valley Rd
1260 WIS 19 13471 Cuba Valley Rd
13475 Cuba Valley Rd 13472 Cuba Valley Rd
13476 Cuba Valley Rd 13483 County V
13477 Cuba Valley Rd 13484 County V
13480 County V 13485 County V
13481 County V 11010 Richards Rd
13482 County V 11011 Richards Rd
11013 Richards Road 11012 Richards Rd
11014 Richards Road 11042 Wisconsin River
11015 Richards Road 11043 Wisconsin River
11040 Wisconsin River
11041 Wisconsin River
Route 4 Detector ID Numbers (SW Region)
I-39/90/94 NB Controllers I-39/90/94 SB Controllers

80
Table 22: Route 6 Detector ID Numbers
Number Cross Street Number Cross Street
9010 Kowalski Rd 9012 Kowalski Rd
9011 Kowalski Rd 9013 Kowalski Rd
9020 County XX 9022 County XX
9021 County XX 9023 County XX
I-39 SB ControllersI-39 NB Controllers
Route 6 Detector ID Numbers (NC Region)

81
Table 23: Route 7 Detector ID Numbers
Number Cross Street Number Cross Street
110011 WIS 33 110009 WIS 33
110012 WIS 33 110010 WIS 33
110019 Statz Road 110017 Statz Road
110020 Statz Road 110018 Statz Road
65004 US 12 56001 US 12 Dells
65005 US 12 56002 US 12 Dells
56020 WIS 23 56022 WIS 23
56021 WIS 23 56023 WIS 23
56015 Trout Rd 56017 Trout Rd
56016 Trout Rd 56018 Trout Rd
56012 WIS 13 56010 WIS 13
56013 WIS 13 56011 WIS 13
29030 US 12/ WIS 16 29032 US 12/WIS 16
29031 US 12/ WIS 16 29033 US 12/WIS 16
29003 Bridge St 29001 Bridge St
29004 Bridge St 29002 Bridge St
29007 S. of 6th ST 29005 S. of 6th St
29008 S. of 6th ST 29006 S. of 6th St
29013 Belchure Rd 29015 Belchure Rd
29014 Belchure Rd 29016 Belchure Rd
29018 CTH C 29017 CTH C
29019 CTH C 29020 CTH C
29011 Keichinger Rd 29009 Keichinger Rd
29012 Keichinger Rd 29010 Keichinger Rd
41009 S of Grover Rd 41011 S. of Grover Rd
41010 S of Grover Rd 41012 S. of Grover Rd
41013 CTH PP 41015 CTH PP
41014 CTH PP 41016 CTH PP
41019 Tomah Split
41020 Tomah Split
41045 Tomah Split
41046 Tomah Split
Route 7 Detector ID Numbers (SW Region)
I-90/94 EB Controllers I-90/94 WB Controllers

82
Table 24: Route 8 Detector ID Numbers
Table 25: Route 9 Detector ID Numbers
Number Cross Street Number Cross Street
41023 Tomah Split 41021 Tomah Split
41024 Tomah Split 41022 Tomah Split
41025 US 12/16 41027 US 12/16
41026 US 12/16 41028 US 12/16
41031 STH 131 41029 STH 131
41032 STH 131 41030 STH 131
32004 WIS 16 32001 WIS 16
32005 WIS 16 32002 WIS 16
32009 WIS 53/157 32006 WIS 53/157
32010 WIS 53/157 32007 WIS 53/157
I-90 EB Controllers I-90 WB Controllers
Route 8 Detector ID Numbers (SW Region)
Number Cross Street Number Cross Street
41033 Industrial Dr 41035 Industrial Dr
41034 Industrial Dr 41036 Industrial Dr
41039 WIS 21 41037 WIS 21
41040 WIS 21 41038 WIS 21
41041 N of US 12 41043 N of US 12
41043 N of US 12 41044 N of US 12
41003 N of Derby Ave 41001 N of Derby Ave
41004 N of Derby Ave 41002 N of Derby Ave
41007 County OO 41005 County OO
41008 County OO 41006 County OO
41051 County EW 41055 County EW
41052 County EW 41056 County EW
41063 Arms Rd./ Aspen Ave 41061 Arms Rd/Aspen Ave
41064 Arms Rd./ Aspen Ave 41062 Arms Rd/Aspen Ave
18001 County HH 18005 County HH ****NW Region
18002 County HH 18006 County HH
Route 9 Detector ID Numbers (SW Region)
I-94 EB Controllers I-94 WB Controllers

83
Table 26: Route 10 Detector ID Numbers
Table 27: Route 11 Detector ID Numbers
Number Cross Street Number Cross Street
55027 WIS 65 55025 WIS 65
55028 WIS 65 55026 WIS 65
55021 Kinney Rd 55023 Kinney Rd
55022 Kinney Rd 55024 Kinney Rd
55001 US 12 Hudson Lane 55004 US 12 Hudson Lane
55002 US 12 Hudson Lane 55005 US 12 Hudson Lane
55003 US 12 Hudson Lane 55006 Carmichael Rd
55009 Carmichael Rd 55007 Carmichael Rd
55010 Carmichael Rd 55008 Carmichael Rd
55011 Carmichael Rd 55018 11th St/ Hegen Lane
55015 11th St/ Hegen Lane 55019 11th St/ Hegen Lane
55016 11th St/ Hegen Lane 55020 11th St/ Hegen Lane
55017 11th St/ Hegen Lane
I-94 EB Controllers I-94 WB Controllers
Route 10 Detector ID Numbers (NW Region)
Number Cross Street Number Cross Street
8269 Falls Road 8263 Falls Rd
8271 Falls Road 8265 Falls Rd
5569 STH 60 5563 STH 60
5571 STH 60 5565 STH 60
Route 11 Detector ID Numbers (SE Region)
I-43 NB Controllers I-43 SB Controllers
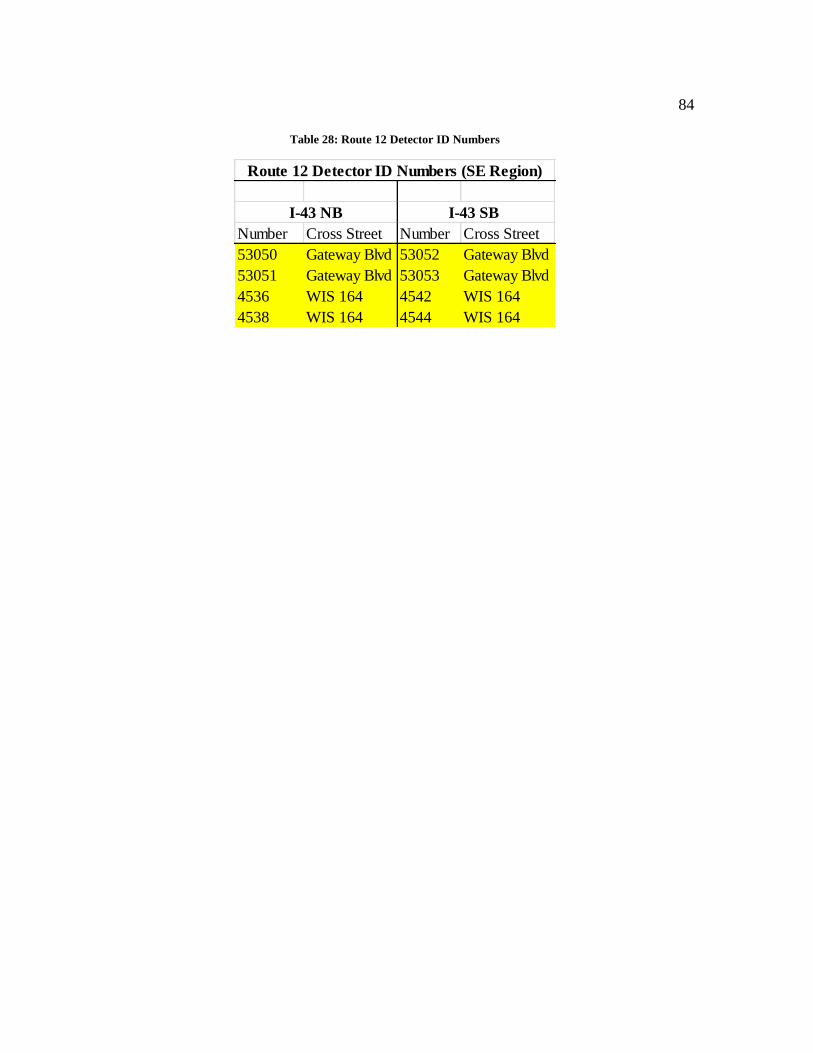
84
Table 28: Route 12 Detector ID Numbers
Number Cross Street Number Cross Street
53050 Gateway Blvd 53052 Gateway Blvd
53051 Gateway Blvd 53053 Gateway Blvd
4536 WIS 164 4542 WIS 164
4538 WIS 164 4544 WIS 164
I-43 NB I-43 SB
Route 12 Detector ID Numbers (SE Region)

85
Table 29: Route 13 Detector ID Numbers
Number Cross Street Number Cross Street Number Cross Street Number Cross Street
67244 County Line Rd 67238 County Line Rd 21051 US 151 21055 US 151
67246 County Line Rd 67240 County Line Rd 21052 US 151 21056 US 151
67248 County Line Rd 67242 County Line Rd 21053 US 151 21057 US 151
5594 N. of County Line Rd 5588 N of County Line Rd 21054 US 151 21058 US 151
5596 N. of County Line Rd 5590 N of County Line Rd 21005 Military Rd 21001 Military Rd
5598 N. of County Line Rd 5592 N of County Line Rd 21007 Military Rd 21003 Military Rd
2744 Lannon Rd 2738 Lannon Rd 21065 STH 23 21067 STH 23
2746 Lannon Rd 2740 Lannon Rd 21066 STH 23 21068 STH 23
2748 Lannon Rd 2742 Lannon Rd 700033 S of WIS 26 700031 S of WIS 26
66001 US 45 66005 US 45 700034 S of WIS 26 700032 S of WIS 26
66002 US 45 66006 US 45 700055 S of WIS 26 700054 S of WIS 26
66010 Mayfield Rd 66015 Mayfield Rd 700029 S of WIS 44 700027 WIS 44
66011 Mayfield Rd 66016 Mayfield Rd 700030 S of WIS 44 700028 WIS 44
66020 WIS 60 66025 WIS 60 700060 S of WIS 44 700059 WIS 44
66021 WIS 60 66026 WIS 60 700037 N of 9th Ave 700035 S of 9th Ave
700038 N of 9th Ave 700036 S of 9th Ave
700092 N of 9th Ave 700064 S of 9th Ave
70102 S of WIS 21 700023 N of WIS 21
70103 S of WIS 21 700024 N of WIS 21
70104 S of WIS 21 700084 N of WIS 21
700004 N of WIS 76 70098 S of WIS 21
700005 N of WIS 76 70099 S of WIS 21
700081 N of WIS 76 70100 S of WIS 21
700013 Nee-Vin Rd 700066 N of US 45
700014 Nee-Vin Rd 700067 N of US 45
700078 Nee-Vin Rd 700090 N of US 45
700017 Breezewood Lane 700010 S of WIS 76
700018 Breezewood Lane 700011 S of WIS 76
700019 Breezewood Lane 700082 S of WIS 76
70115 WIS 114/Hwy JJ 700015 Nee-Vin Rd
70116 WIS 114/Hwy JJ 700016 Nee-Vin Rd
70117 WIS 114/Hwy JJ 700079 Nee-Vin Rd
44013 WIS 441 700020 N of Breezewood Lane
44014 WIS 441 700021 N of Breezewood Lane
700086 N of Breezewood Lane
70110 WIS 114/Hwy JJ
70111 WIS 114/Hwy JJ
70112 WIS 114/Hwy JJ
44010 WIS 441
44011 WIS 441
US 41 NB Controllers US 41 SB Controllers US 41 NB Controllers US 41 SB Controllers
Route 13 Detector ID Numbers (SE Region) Route 13 Detector ID Numbers (NE Region)
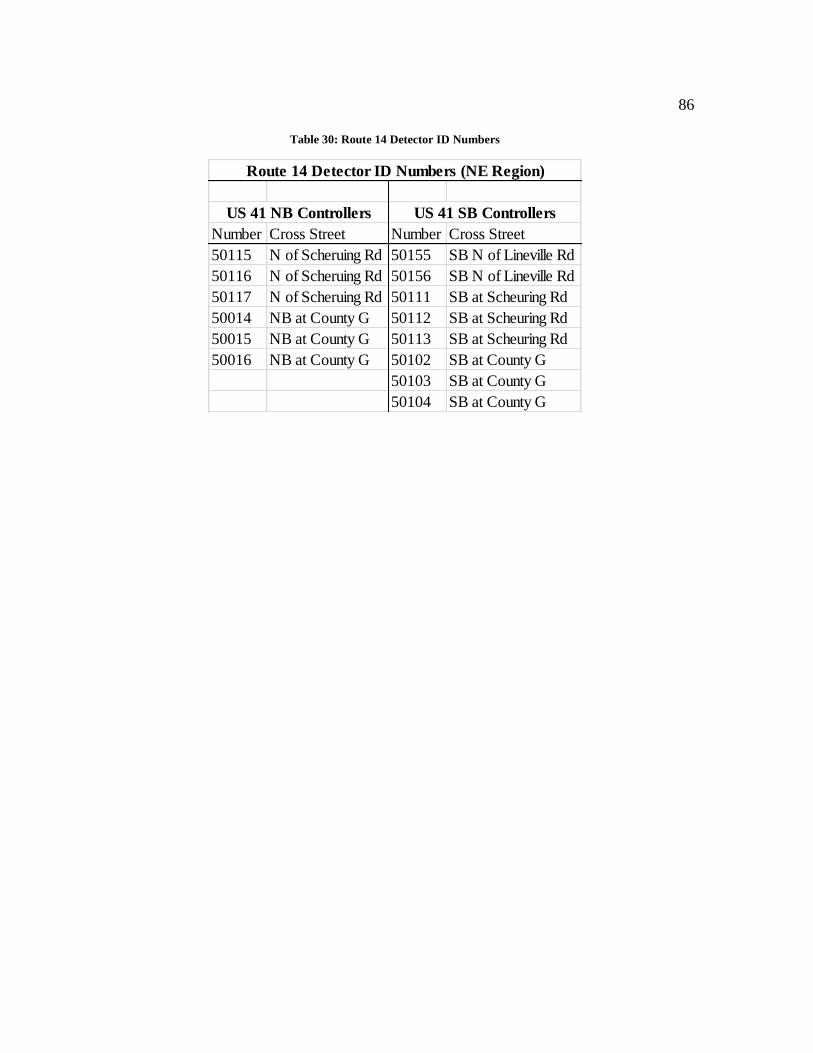
86
Table 30: Route 14 Detector ID Numbers
Number Cross Street Number Cross Street
50115 N of Scheruing Rd 50155 SB N of Lineville Rd
50116 N of Scheruing Rd 50156 SB N of Lineville Rd
50117 N of Scheruing Rd 50111 SB at Scheuring Rd
50014 NB at County G 50112 SB at Scheuring Rd
50015 NB at County G 50113 SB at Scheuring Rd
50016 NB at County G 50102 SB at County G
50103 SB at County G
50104 SB at County G
Route 14 Detector ID Numbers (NE Region)
US 41 NB Controllers US 41 SB Controllers

87
9.3 Appendix C: Historical Weather Data
Table 31: Weather Data 1st Friday February
Table 32: Weather Data 1st Tuesday February
Table 33: Weather Data 3rd Wednesday August
Table 34: Weather Data 3rd Saturday August
Day Temperature (F) Snowfall (in.)
2/3/2012 32 0.00
2/1/2013 0 1.70
2/7/2014 1 0.00
2/6/2015 19 0.00
2/5/2016 26 0.00
1st Friday in February
Day Temperature (F) Snowfall (in.)
2/7/2012 25 0.00
2/5/2013 17 0.10
2/4/2014 9 0.00
2/3/2015 7 2.50
2/2/2016 30 2.00
1st Tuesday in February
Day Temperature (F) Rainfall (in.)
8/17/2011 72 0.05
8/15/2012 74 0.00
8/21/2013 81 0.00
8/20/2014 73 0.00
8/19/2015 65 0.01
3rd Wednesday in August
Day Temperature (F) Rainfall (in.)
8/20/2011 72 0.33
8/18/2012 60 0.00
8/17/2013 66 0.00
8/16/2014 75 0.00
8/15/2015 80 0.00
3rd Saturday in August
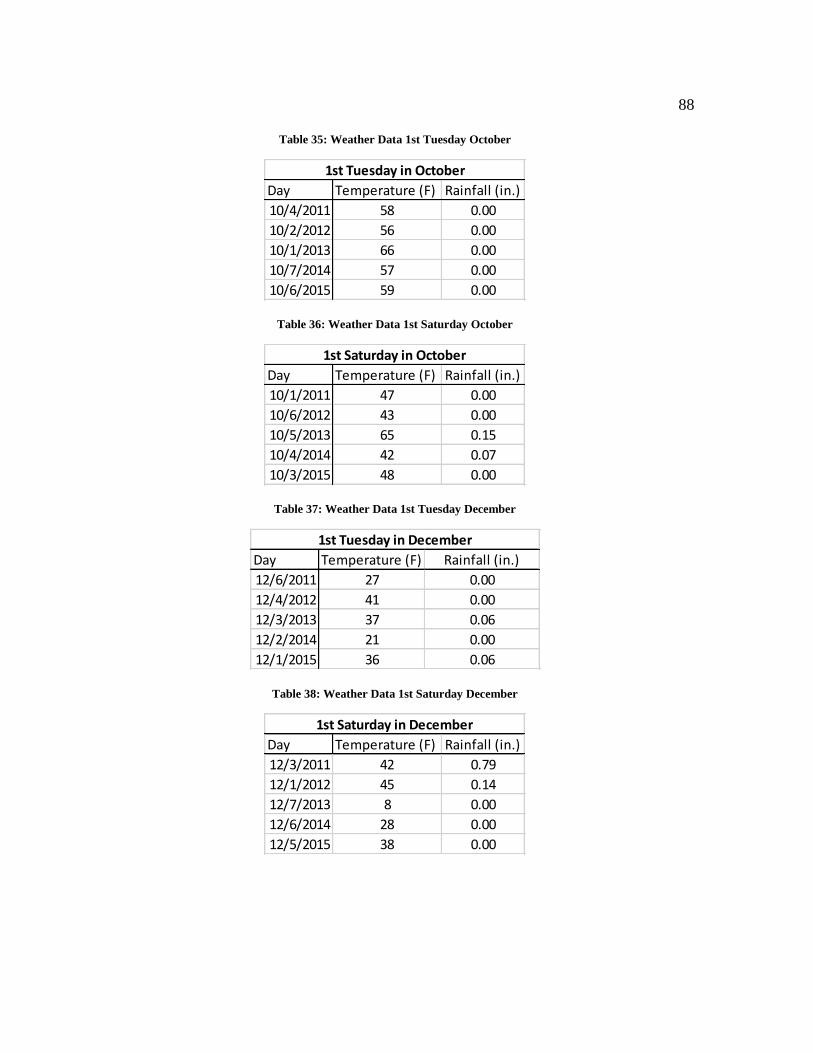
88
Table 35: Weather Data 1st Tuesday October
Table 36: Weather Data 1st Saturday October
Table 37: Weather Data 1st Tuesday December
Table 38: Weather Data 1st Saturday December
Day Temperature (F) Rainfall (in.)
10/4/2011 58 0.00
10/2/2012 56 0.00
10/1/2013 66 0.00
10/7/2014 57 0.00
10/6/2015 59 0.00
1st Tuesday in October
Day Temperature (F) Rainfall (in.)
10/1/2011 47 0.00
10/6/2012 43 0.00
10/5/2013 65 0.15
10/4/2014 42 0.07
10/3/2015 48 0.00
1st Saturday in October
Day Temperature (F) Rainfall (in.)
12/6/2011 27 0.00
12/4/2012 41 0.00
12/3/2013 37 0.06
12/2/2014 21 0.00
12/1/2015 36 0.06
1st Tuesday in December
Day Temperature (F) Rainfall (in.)
12/3/2011 42 0.79
12/1/2012 45 0.14
12/7/2013 8 0.00
12/6/2014 28 0.00
12/5/2015 38 0.00
1st Saturday in December

89
9.4 Appendix D: Incidents per 1,000 Vehicles
Figure 37: Route 1: Incidents per 1,000 Vehicles
Figure 38: Route 2: Incidents per 1,000 Vehicles

90
Figure 39: Route 3: Incidents per 1,000 Vehicles
Figure 40: Route 4: Incidents per 1,000 Vehicles

91
Figure 41: Route 6: Incidents per 1,000 Vehicles
Figure 42: Route 7: Incidents per 1,000 Vehicles

92
Figure 43: Route 8: Incidents per 1,000 Vehicles
Figure 44: Route 9: Incidents per 1,000 Vehicles

93
Figure 45: Route 10: Incidents per 1,000 Vehicles
Figure 46: Route 11: Incidents per 1,000 Vehicles

94
Figure 47: Route 13: Incidents per 1,000 Vehicles
Figure 48: Route 14: Incidents per 1,000 Vehicles