the saguaros of “section 17” in saguaro national … · the saguaros of “section 17” in...
TRANSCRIPT
The Saguaros of “Section 17” in Saguaro National Park:
Re-survey of a One-Square-Mile Section First Surveyed in 1941
Final Report to Friends of Saguaro National Park
May 21, 2013
Joshua Conver1, Irene Weber
1, Theresa Foley
2, Don E. Swann
1, Becky MacEwen
1,
Emma Fajardo1 and Yesenia Gamez
1
1Saguaro National Park
3693 South Old Spanish Trail
Tucson, Arizona 85730-5601 2 University of Arizona, Dept. of Atmospheric Sciences
2
Contents
List of Figures and Tables................................................................................................... 3
Acknowledgements ............................................................................................................. 4
Executive Summary ............................................................................................................ 4
Introduction ......................................................................................................................... 5
Methods............................................................................................................................... 9
Results .............................................................................................................................. 11
Discussion ......................................................................................................................... 22
Conclusion ........................................................................................................................ 23
Literature cited .................................................................................................................. 24
Appendix A. History of the Section 17 Saguaro Survey in Saguaro National Park. ........ 27
Appendix B. Survey Protocol. Field Guidelines for the Saguaro Census at
Saguaro National Park (January 8, 2011) ............................................................. 37
Appendix C. Section 17 Volunteer Brochure ................................................................... 46
Appendix D. Plot-level comparison of the 1941 and 2012 census ................................... 47
Appendix E. Using repeat photography to predict the visual characteristics of the
Cactus Forest in 2050............................................................................................ 48
3
List of Figures and Tables
Figure 1. Repeat photography of the Cactus Forest, 1935 and 2010 .................................. 5
Figure 2. Photographs from the 1942 saguaro disease study .............................................. 6
Figure 3. Location of the Rincon Mountain District (RMD) and Tucson Mountain
District (TMD) of Saguaro National Park around Tucson, Arizona ....................... 8
Figure 4a. Saguaro census plot locations in the RMD of Saguaro National Park .............. 9
Figure 4b. Plot-level map of the 1941 census with saguaro locations ............................... 9
Table 1. Saguaro height class from Gill and Lightle (1942) and the corresponding age
range from Steenbergh and Lowe (1983) ............................................................. 11
Figure 5. Percent change in saguaro density per plot ....................................................... 12
Figure 6. Correlation scatter plot of cacti per plot, 1941 and 2012 .................................. 13
Figure 7. Comparison of the 1941 and 2012 census by height class ................................ 14
Figure 8a. Calculated germination date with detectability correction for saguaro cacti,
1973-2003 ............................................................................................................. 14
Figure 8b. Calculated germination date for all saguaro cacti, 1903-2003 ........................ 15
Figure 9. Saguaro locations within Section 17 for the 2012 census ................................. 16
Figure 10. Section 17 saguaro point density surface map ................................................ 17
Figure 11. Section 17 soil map with saguaro locations .................................................... 18
Figure 12. High school science students participating in collecting census data ............. 20
Figure 13. Middle school student Meena Ravishankar’s science project based on
data collected during the Section 17 census ........................................................ 20
Figure 14. All-employee field day in February 2012. ...................................................... 21
Figure 15. Volunteer intern, student employee, and SCA participation ........................... 21
4
Acknowledgements
The project would not have been possible without the support of the Friends of Saguaro National
Park. Along with the National Park Service and Western National Park Association, the Friends
provided funding for our student interns who supervised volunteers and organized the project,
especially Student Conservation Associate Irene Weber and University of Arizona graduate
student Theresa Foley. And of course, we thank the literally hundreds of volunteers who did the
work on this project, in particular Gene Issacs, Bernice Issacs, Tony Schall, Bruce Garrett, Bill
Hanby, Bonnie Maclean, Katie Keck, Bill Thornton, Barb Kern, Ron Kern, Tom Gillam, and
Albi von Dach. We are very grateful to Superintendent Darla Sidles and many Saguaro
National Park staff who provided safety, logistical, financial, administrative, scientific, and
moral support. Tom Orum, Nancy Ferguson, and Jessie Hampton reviewed the report.
Most importantly, we are grateful to Tom Orum, Nancy Ferguson, and Ray Turner, who have
dedicated so many years of their lives, many as volunteers, to long-term monitoring of the
saguaro in Saguaro National Park. Tom and Nancy generously shared their data for this project,
volunteered during the BioBlitz, and provided their support and encouragement throughout the
year. Saguaros live longer than we humans do – but fortunately Tom, Nancy and Ray have
helped sow the seeds for the next generation of students.
Executive Summary
We re-surveyed all saguaro cacti (Carnegiea gigantea) in a 1-square mile section (section 17,
R16E, T14S) in the Rincon Mountain District, Saguaro National Park, that was first surveyed in
1941. This survey was a “citizen science” project initiated during the 2011 BioBlitz at the park.
Student interns trained and supervised more than 300 middle and high school students and adult
volunteers during October 2011 through July 2012. We systematically searched 64 4-hectare
subplots, measured each saguaro detected, and recorded its coordinates, nurse tree, and the
number of bird holes and arms. In 1941-1942, researchers at the park measured 13,304 saguaros,
with 80% being > 3.66 m (12 ft) tall. In 2011-2012, we measured 9,034 saguaros, with 80%
being < 3.66 m tall. In general, the saguaro population in 1941 was dominated by large
individuals estimated to be more than 50 years of age, whereas today the population is dominated
by younger individuals that have germinated since 1960. Our results complement and are
consistent with a long-term study of six smaller plots surveyed annually within Section 17 for
every year since 1941. They indicate that the saguaro population in the Cactus Forest, which was
in decline for many decades before and after the establishment of Saguaro National Monument in
1933, has re-bounded due to a surge in establishment of young saguaros during the period from
the 1960s through the early 1990s. However, establishment of new saguaros has all but ceased
since the mid-1990s, presumably in response to drought conditions.
5
Introduction
Saguaro National Park has a rich history of ecological research and intensive study of the
giant saguaro (Carnegiea gigantea) cactus (McAuliffe 1993, 1996; Ahnmark and Swann 2009).
The Rincon Mountain District of the park was originally established as a national monument in
1933 by President Herbert Hoover (the Tucson Mountain District was added in 1962, and
Saguaro was designed as a national park in 1994). The area’s “outstanding scientific interest
because of the exceptional growth…of various species of cacti, including the so-called giant
cactus” formed the basis for federal protection of this landscape.
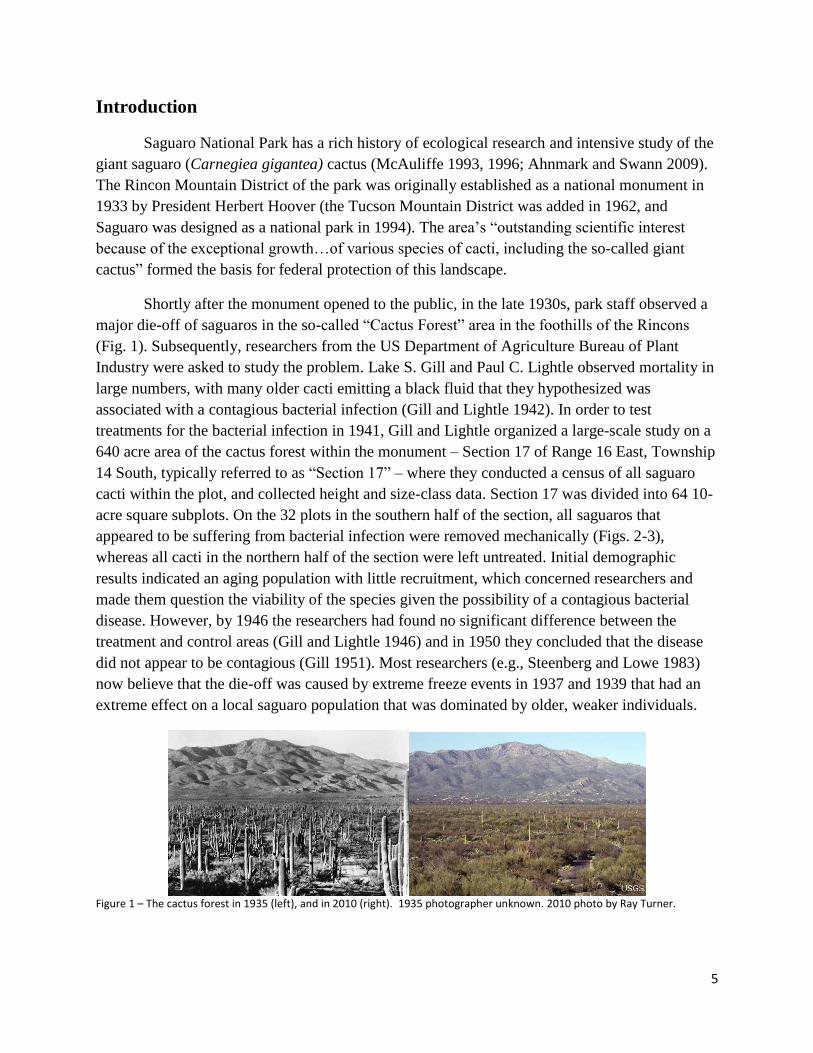
Shortly after the monument opened to the public, in the late 1930s, park staff observed a
major die-off of saguaros in the so-called “Cactus Forest” area in the foothills of the Rincons
(Fig. 1). Subsequently, researchers from the US Department of Agriculture Bureau of Plant
Industry were asked to study the problem. Lake S. Gill and Paul C. Lightle observed mortality in
large numbers, with many older cacti emitting a black fluid that they hypothesized was
associated with a contagious bacterial infection (Gill and Lightle 1942). In order to test
treatments for the bacterial infection in 1941, Gill and Lightle organized a large-scale study on a
640 acre area of the cactus forest within the monument – Section 17 of Range 16 East, Township
14 South, typically referred to as “Section 17” – where they conducted a census of all saguaro
cacti within the plot, and collected height and size-class data. Section 17 was divided into 64 10-
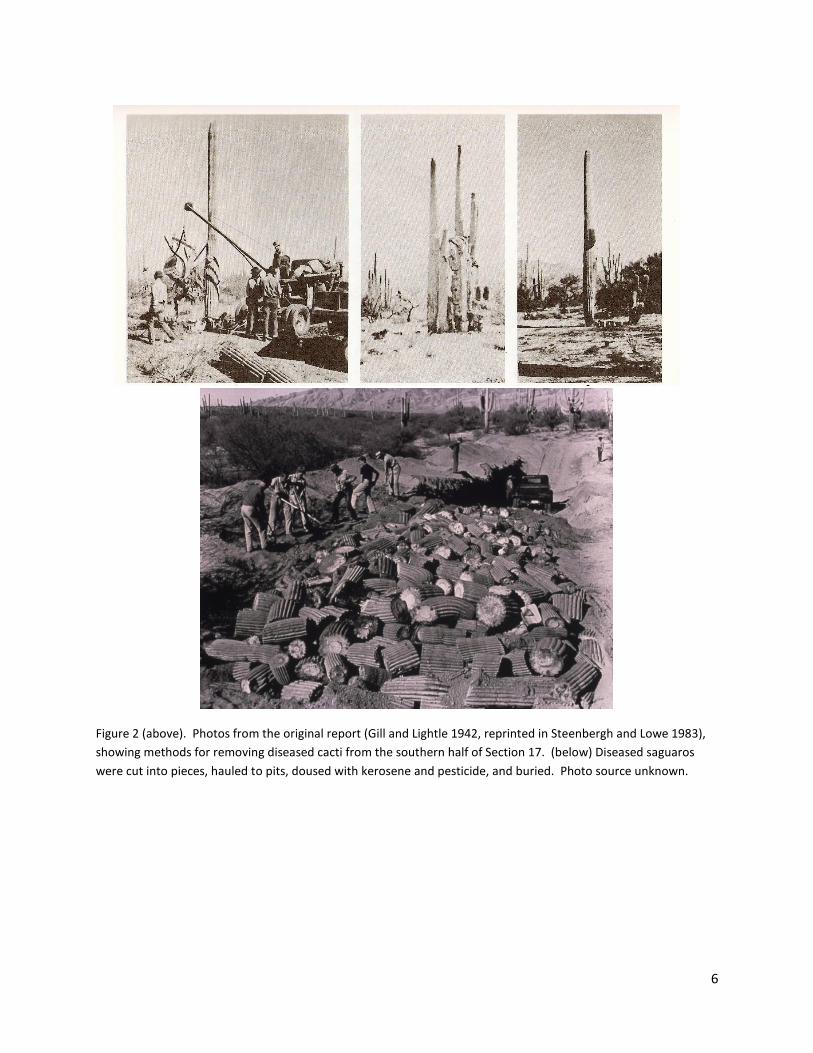
acre square subplots. On the 32 plots in the southern half of the section, all saguaros that
appeared to be suffering from bacterial infection were removed mechanically (Figs. 2-3),
whereas all cacti in the northern half of the section were left untreated. Initial demographic
results indicated an aging population with little recruitment, which concerned researchers and
made them question the viability of the species given the possibility of a contagious bacterial
disease. However, by 1946 the researchers had found no significant difference between the
treatment and control areas (Gill and Lightle 1946) and in 1950 they concluded that the disease
did not appear to be contagious (Gill 1951). Most researchers (e.g., Steenberg and Lowe 1983)
now believe that the die-off was caused by extreme freeze events in 1937 and 1939 that had an
extreme effect on a local saguaro population that was dominated by older, weaker individuals.
Figure 1 – The cactus forest in 1935 (left), and in 2010 (right). 1935 photographer unknown. 2010 photo by Ray Turner.
6
Figure 2 (above). Photos from the original report (Gill and Lightle 1942, reprinted in Steenbergh and Lowe 1983),
showing methods for removing diseased cacti from the southern half of Section 17. (below) Diseased saguaros
were cut into pieces, hauled to pits, doused with kerosene and pesticide, and buried. Photo source unknown.

7
Although the large-scale experiment in Section 17 was effectively concluded in 1946,
research and monitoring in the area has continued to this day. In particular, Gill, Lightle, and
Craig Bryan continued to monitor saguaros on six 10-acre subplots within the section. These
plots have been surveyed ever since on an annual basis – after Bryan by Stan Alcorn and his
colleagues, and more recently by Tom Orum and Nancy Ferguson – making Section 17 the site
of one of the longest running monitoring studies conducted in any national park. In addition,
many other studies have been conducted in Section 17. Appendix A and Ahnmark and Swann
(2009) provide a history of the removal experiment and other research in Section 17.
Long-lived species, like the giant saguaro, require long-term site-specific monitoring
studies in order to determine whether changes in population dynamics represent significant
trends or short-term random variations (Pierson and Turner 1998). The results of research in
Section 17 and elsewhere in Saguaro National Park indicate that the population of this plant can
be highly dynamic on a decadal scale. Saguaro recruitment in the Cactus Forest was very low
from the 1910s through the 1940s (Shreve 1911, Gill and Lightle 1942); subsequent studies
(Alcorn and May 1962) identified the negative effects of cattle grazing on saguaro establishment
through trampling and crushing, among other causes. In addition, the prolific harvesting of wood
for lime kilns and other human activities removed vital nurse plants that sheltered young
saguaros (McAuliffe 1996). Large-scale removal of wood ended when the monument was
established, and grazing ceased in the Cactus Forest area in 1958, which undoubtedly affected
recruitment and recovery of the population (McAuliffe 1996).
Following Gill and Lightle’s large-scale study, saguaros continued to decline in Section
17 for many years. By 1962, researchers predicted that, “assuming no changes in the rate of
decline in the future, this plant population will theoretically (at the rate of 95% level of
confidence) cease to exist between 1995 and 1998” (Alcorn and May 1963). Surveys conducted
in the 1970s concluded that the saguaro population as a whole was still declining, but by the
1980s researchers (e.g., Steenbergh and Lowe 1983) noticed that young saguaros were becoming
established. By the end of the decade, long-term monitoring results were beginning to indicate
that juveniles had proliferated over the previous two decades and that an overall increase in
visible saguaro would soon occur (Turner 1989, Orum et al. 2010). In 1990, Saguaro National
Park established 45 permanent plots, randomly located throughout the park, to study epidermal
browning of saguaro cacti and to provide baseline demographic data for long-term monitoring
(Duriscoe and Graban 1991). Results of the second and third Saguaro Census (Turner and
Funicelli 2001, O’Brien et al. 2011) have confirmed earlier predictions that the saguaro
population is recovering throughout the park. In addition, data from the six long-term study plots
established by Gill and Lightle indicate that the saguaro population has also increased
dramatically in Section 17 (Orum et al. 2010).
The objective of this study was to resample Section 17 in its entirety for the first time in
70 years. Age structure data are important to ecologists and resource managers because they
8
provide an estimate of overall population health (Pierson and Turner 1998) as well as monitor
the pattern of vegetation change over time (Bakker et al. 1996). A thorough demographic study
on a large scale is valuable for land management and provides insight into the future state of an
iconic and ecologically important southwestern cactus species. Although the six long-term plots
in the section have been monitored continuously for many decades, the entire 640-square acre
area had not been resurveyed since the original 1941 census. Fortunately, the original map and
detailed log books created by Lake Gill and Paul Lightle had been preserved by Tom Orum and
Nancy Ferguson, who generously provided copies to the park; all of these data were digitized in
a heroic effort by graduate student Theresa Foley.
In addition, the 70th
anniversary of the original survey of Section 17 coincided with the
2011 BioBlitz, a huge citizen science event scheduled in Saguaro National Park in October,
2011. Staff at the park felt that the BioBlitz presented a great opportunity to kick off a major
project that would highlight the research history of Saguaro National Park, to involve literally
hundreds of high school students and volunteers, and to educate Tucsonans about the park’s
namesake plant that is such an iconic symbol of the American Southwest.
Study Area
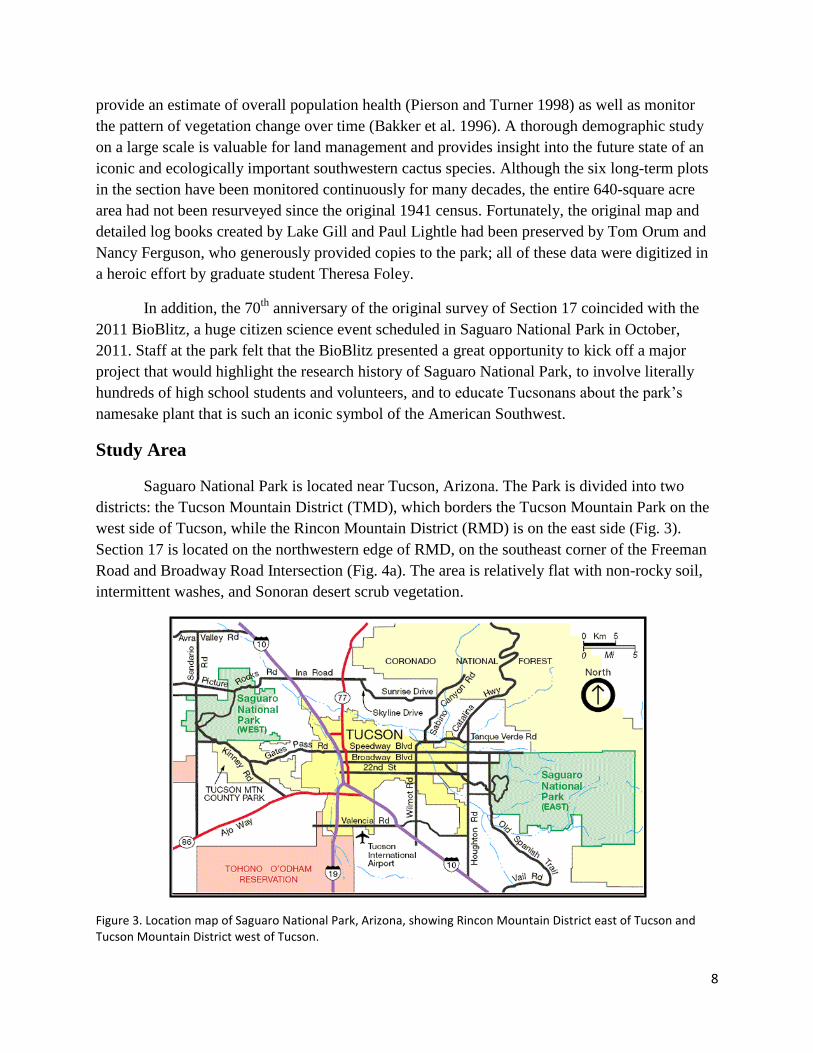
Saguaro National Park is located near Tucson, Arizona. The Park is divided into two
districts: the Tucson Mountain District (TMD), which borders the Tucson Mountain Park on the
west side of Tucson, while the Rincon Mountain District (RMD) is on the east side (Fig. 3).
Section 17 is located on the northwestern edge of RMD, on the southeast corner of the Freeman
Road and Broadway Road Intersection (Fig. 4a). The area is relatively flat with non-rocky soil,
intermittent washes, and Sonoran desert scrub vegetation.
Figure 3. Location map of Saguaro National Park, Arizona, showing Rincon Mountain District east of Tucson and Tucson Mountain District west of Tucson.
9
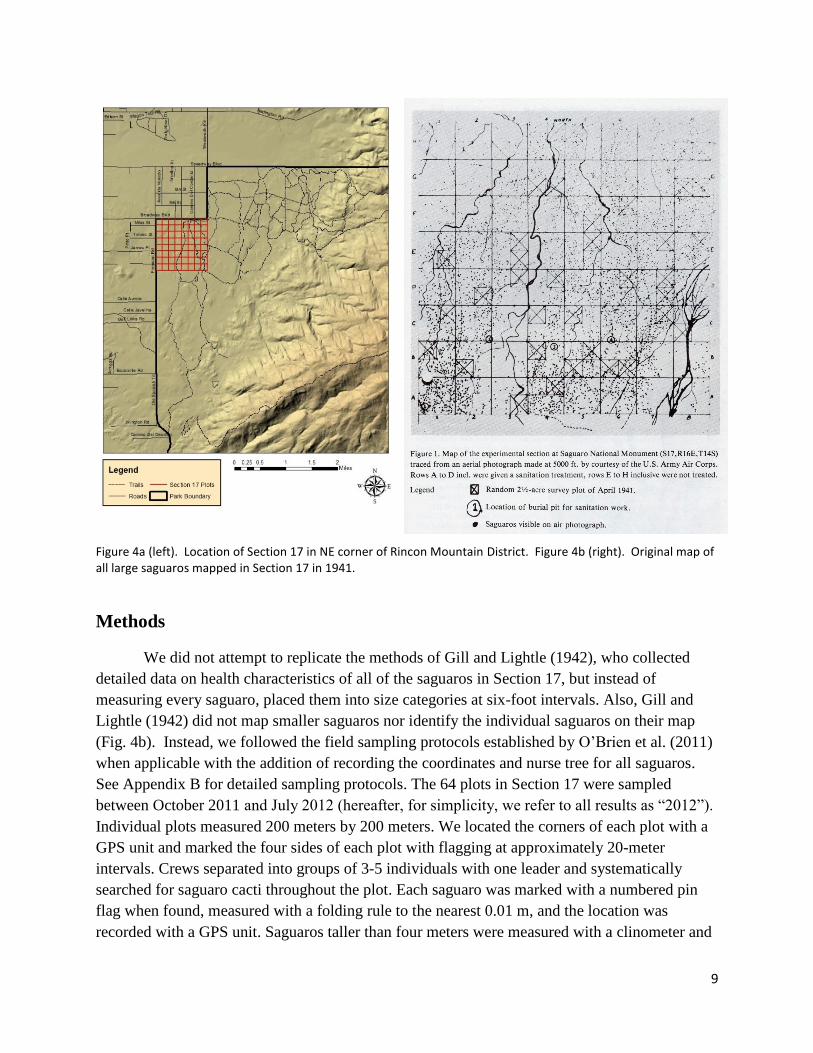
Figure 4a (left). Location of Section 17 in NE corner of Rincon Mountain District. Figure 4b (right). Original map of all large saguaros mapped in Section 17 in 1941.
Methods
We did not attempt to replicate the methods of Gill and Lightle (1942), who collected
detailed data on health characteristics of all of the saguaros in Section 17, but instead of
measuring every saguaro, placed them into size categories at six-foot intervals. Also, Gill and
Lightle (1942) did not map smaller saguaros nor identify the individual saguaros on their map
(Fig. 4b). Instead, we followed the field sampling protocols established by O’Brien et al. (2011)
when applicable with the addition of recording the coordinates and nurse tree for all saguaros.
See Appendix B for detailed sampling protocols. The 64 plots in Section 17 were sampled
between October 2011 and July 2012 (hereafter, for simplicity, we refer to all results as “2012”).
Individual plots measured 200 meters by 200 meters. We located the corners of each plot with a
GPS unit and marked the four sides of each plot with flagging at approximately 20-meter
intervals. Crews separated into groups of 3-5 individuals with one leader and systematically
searched for saguaro cacti throughout the plot. Each saguaro was marked with a numbered pin
flag when found, measured with a folding rule to the nearest 0.01 m, and the location was
recorded with a GPS unit. Saguaros taller than four meters were measured with a clinometer and
10
tape measure, using two independent observers, to the nearest 0.1 m (Appendix B). In addition,
we counted the number of bird holes (round holes that showed evidence of an inner chamber)
and arms.
This surveying process required three “passes” through the plot: one pass to record, one
pass to check for any missed saguaros, and a third pass to collect survey flags. The crew leader
maintained responsibility for flagging the plot perimeter, double-checking the accuracy of
measurements, monitoring crew progress and safety, and facilitating efficient communication
among crew members. The group leaders were responsible for data quality, on-the-ground
training, and educating participants about the project, saguaros, and the park.
We used volunteer “citizen scientists” for most of the data collection, except for a subset
of plots that were completed during the summer of 2012 by the park’s Youth Internship Program
crew. Many of the volunteers were high school and middle school students, especially from the
Arizona College Preparatory Academy, who participated during the BioBlitz on October 21,
2011 as well as throughout the following school year. We also recruited volunteers through the
park’s web site and by contacting groups such as hiking clubs, scout troops, college groups, and
others. Volunteers were provided with pre-visit information (Appendix C) and then received an
on-site training before going into the field. The crew leader was a trained park biological
technician or very experienced intern (for most of the project, Student Conservation Intern Irene
Weber was in this role). Small group leaders were either park staff or experienced volunteers
who had participated in the activity previously and had the knowledge and experience to train
volunteers on data collection, clinometer and GPS use, and other skills.
Data Analysis
All collected field data were entered into an Excel spreadsheet by a technician and
checked by a second technician. Data from each plot were kept in individual spreadsheets before
being aggregated into a single spreadsheet. In addition to entering the data collected during the
2012 census, Theresa Foley also digitized the written record from 1941 into a series of Excel
spreadsheets. We examined differences between the 1941 census and 2012 census by directly
comparing the number of saguaros observed on each plot and summing by height class. Height
class definitions and the corresponding age range according to Steenbergh and Lowe (1983) are
given in Table 1.
Measuring each saguaro allowed us to use height-age equations from Steenbergh and
Lowe (1977) to determine germination dates and provide a clearer picture of the recruitment and
regeneration of the saguaro cactus in Section 17. The regression equation is:
log Y = -0.309 + 0.884 log X + 0.609 (log X)2
where Y equals stem height in centimeters and X equals age in years (Steenbergh and Lowe
1977, pg. 140).

11
In order to solve for age, the equation was rearranged and modified to:
X=10(-0.609+.884*SQRT(1.493+2*log(Y)))
where Y equals stem height in centimeters and X equals age in years. We modified and corrected
the original equation so that the results conformed to the age-height tables presented in
Steenbergh and Lowe (1977). The uncorrected equation did not determine age from height
correctly according to the age-height tables. This equation is applicable only for saguaro cacti
less than 2.2 meters, or approximately 33 years. After this age, saguaros change growth form
and rate. Since our study focused on recent germination and establishment, the given equation
should be sufficient.
After determining the germination date for saguaro cacti less than 2.2 meters tall, we
applied a correction factor to account for juvenile saguaro cacti that may have been overlooked
during surveys. The correction factor is based on data from six study plots in RMD that are
sampled annually and estimates mean detection probability based on the age-height relationship
of known saguaros (Orum et al. 2011).
Results
Changes in the saguaro population, 1941-2011. We counted 9,023 saguaro cacti in the
2012 census (Fig. 6). Total numbers of saguaro cacti are 31.4% lower than the 1941 count of
13,304. Gill and Lightle’s 1941 census study reported a count of 12,968 saguaro cacti within
Section 17, but we discovered slight mathematical errors when digitizing the raw data from the
1941 logbooks. The mistake is understandable given the technology of the time. Each plot
averaged 144.1 saguaros in 2012, 61.4 fewer than the 205.4 average in 1941. The range of
observed saguaros on each plot varied greatly for both periods. In 1941, the census found that
plots had a minimum value of 21 and a maximum of 519. The 2012 data has a similar range,
with a low of 20 and a max of 546. See Appendix D for plot-level histograms comparing
observed saguaros between 1941 and 2012.
Height Class Feet Meters Age
1 0-6ft 0-1.8m 0-36
2 6-12ft 1.8-3.66m 37-52
3 12-18ft 3.66-5.49m 53-68
4 18-24ft 5.49-7.32m 68-85
5 25+ 7.33+ 85+
Table 1 – Height class definitions (Gill and Lightle 1942) and corresponding age based on model of Steenbergh and
Lowe (1983).
12
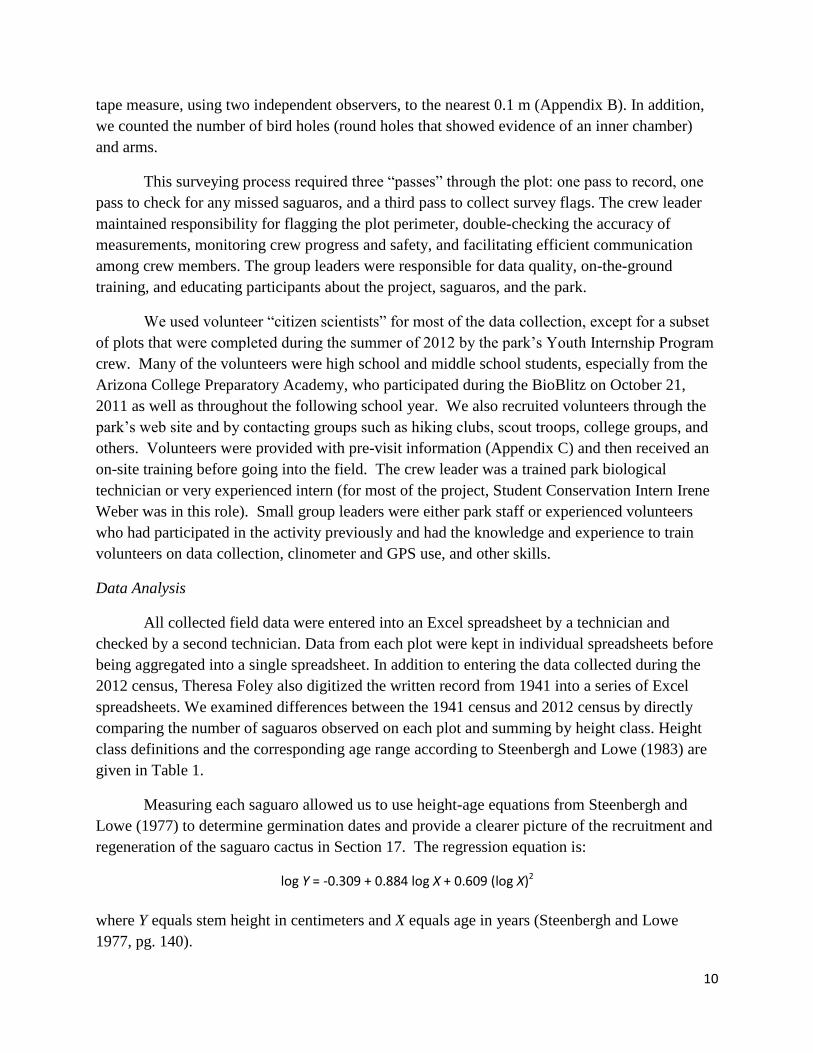
We assessed change at the plot level in addition to the global scale (Fig. 5). Saguaro
cacti density declined from 1941 to 2012 for most plots, which reflects the global trend. Density
declined by 50% or more in nearly 22% of all plots. The most negative change occurred along
the drainage that runs through the third and fourth columns of the Section 17 plot array. Nearly
19% of plots increased density from 1941 to 2012, including 75% of the plots along Broadway
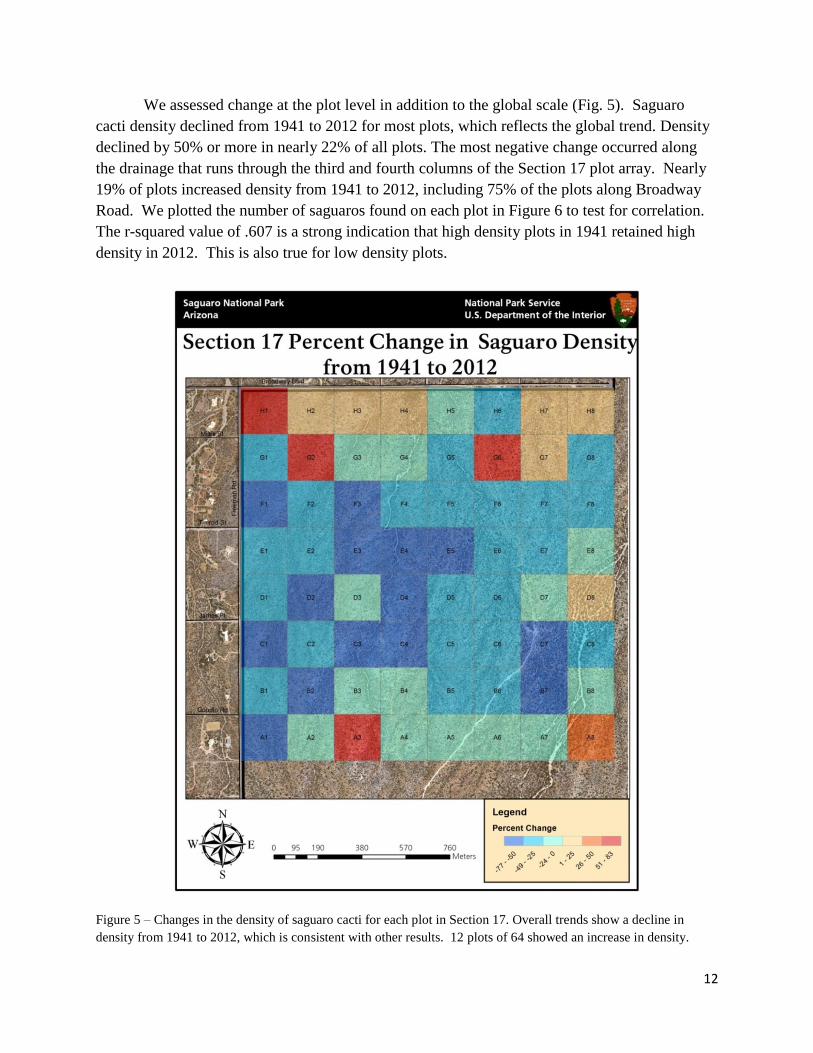
Road. We plotted the number of saguaros found on each plot in Figure 6 to test for correlation.
The r-squared value of .607 is a strong indication that high density plots in 1941 retained high
density in 2012. This is also true for low density plots.
Figure 5 – Changes in the density of saguaro cacti for each plot in Section 17. Overall trends show a decline in
density from 1941 to 2012, which is consistent with other results. 12 plots of 64 showed an increase in density.
13
Figure 6 – Correlation of the number of saguaro cacti per plot from the 1941 and 2012 studies. The r-squared value
indicates a moderately high level of correlation, which means plots with few saguaro cacti in 1941 had relatively
few cacti in 2012.
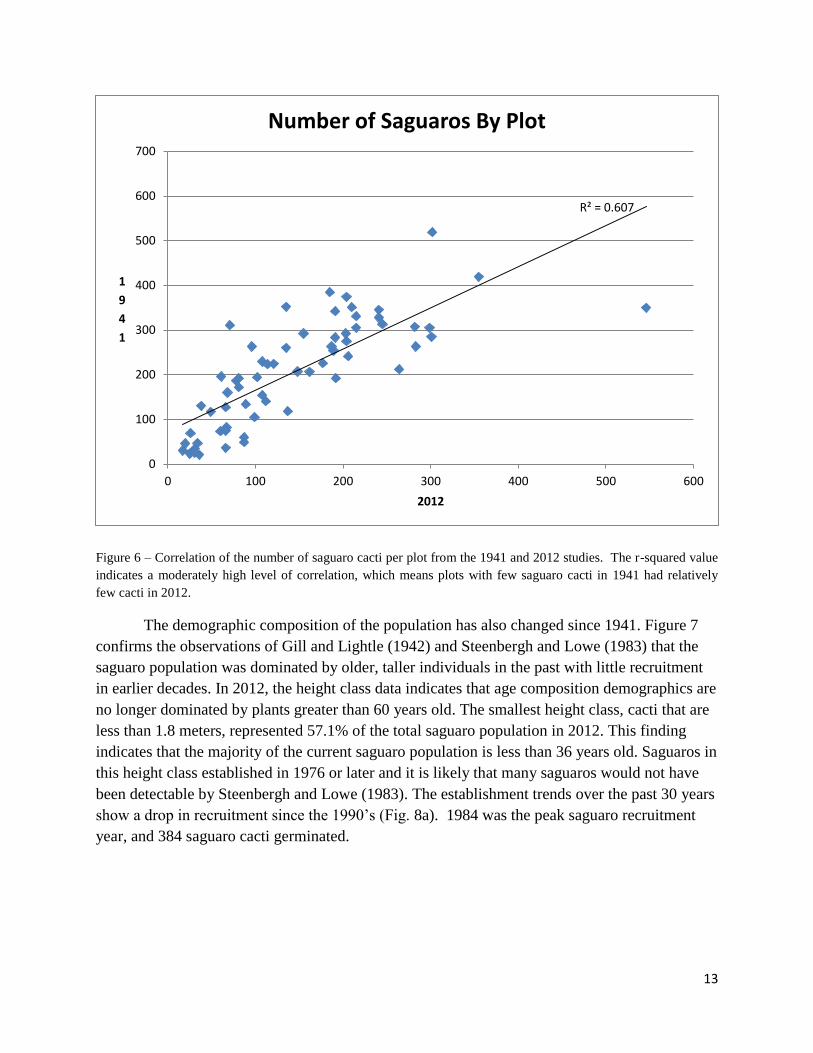
The demographic composition of the population has also changed since 1941. Figure 7
confirms the observations of Gill and Lightle (1942) and Steenbergh and Lowe (1983) that the
saguaro population was dominated by older, taller individuals in the past with little recruitment
in earlier decades. In 2012, the height class data indicates that age composition demographics are
no longer dominated by plants greater than 60 years old. The smallest height class, cacti that are
less than 1.8 meters, represented 57.1% of the total saguaro population in 2012. This finding
indicates that the majority of the current saguaro population is less than 36 years old. Saguaros in
this height class established in 1976 or later and it is likely that many saguaros would not have
been detectable by Steenbergh and Lowe (1983). The establishment trends over the past 30 years
show a drop in recruitment since the 1990’s (Fig. 8a). 1984 was the peak saguaro recruitment
year, and 384 saguaro cacti germinated.
R² = 0.607
0
100
200
300
400
500
600
700
0 100 200 300 400 500 600
1
9
4
1
2012
Number of Saguaros By Plot

14
Figure 7 – Number of saguaros by height class in 2012 and 1941. See Table 1 for height class values.
Figure 8a – Number of saguaro cacti that germinated annually, 1973 to 2003. Corrected detectability number derived from Orum et al. (2011).
897
1655
4155
3479
2826
5154
2019
1116
479 255
0
1000
2000
3000
4000
5000
6000
1 2 3 4 5
Nu
mb
er
of
Sagu
aro
s
Height Class
1941 Census
2012 Census
0
50
100
150
200
250
300
350
400
450
19
73
19
74
19
75
19
76
19
77
19
78
19
79
19
80
19
81
19
82
19
83
19
84
19
85
19
86
19
87
19
88
19
89
19
90
19
91
19
92
19
93
19
94
19
95
19
96
19
97
19
98
19
99
20
00
20
01
20
02
20
03
Section 17 Population Germination Date, 1973-2003
Number
CorrectedDetectabilityNumber
15
Figure 8b – Germination date for every saguaro measured during the 2012 census.
0 25 50 75 100 125 150 175 200 225 250 275 300 325 350 375 400 425
1902
1904
1906
1908
1910
1912
1914
1916
1918
1920
1922
1924
1926
1928
1930
1932
1934
1936
1938
1940
1942
1944
1946
1948
1950
1952
1954
1956
1958
1960
1962
1964
1966
1968
1970
1972
1974
1976
1978
1980
1982
1984
1986
1988
1990
1992
1994
1996
1998
2000
2002
Number of Saguaros Germinated
Ge
rmin
atio
n D
ate
16
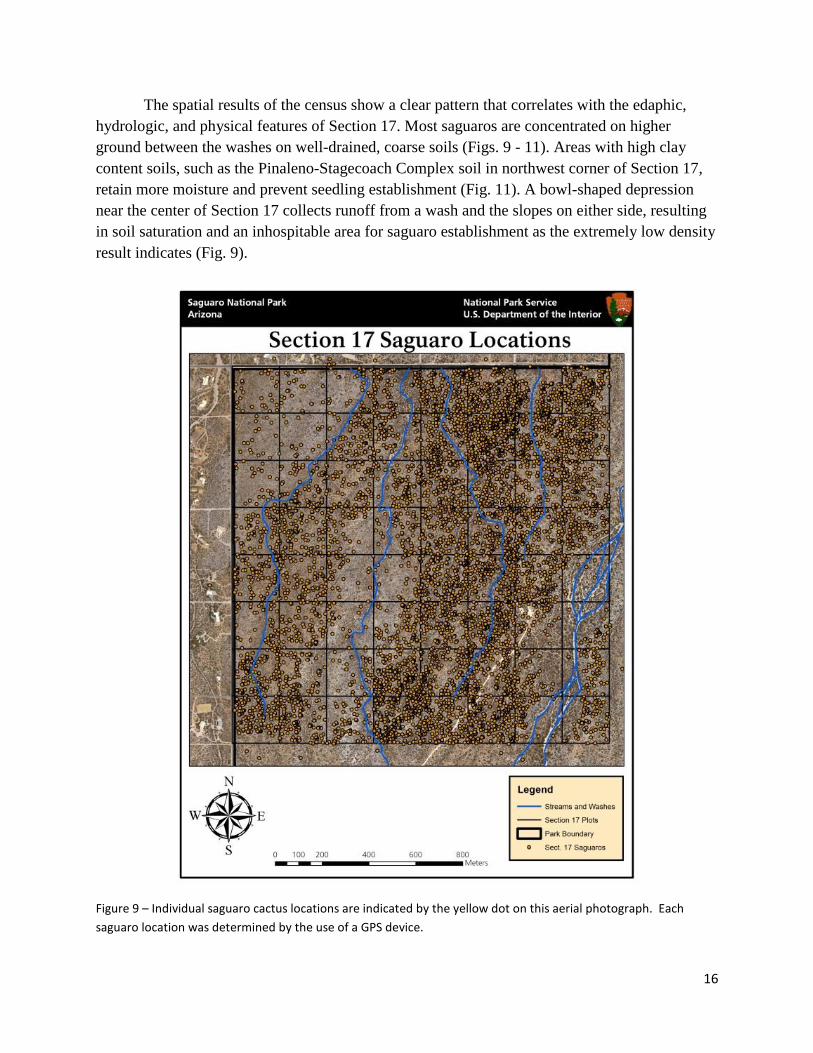
The spatial results of the census show a clear pattern that correlates with the edaphic,
hydrologic, and physical features of Section 17. Most saguaros are concentrated on higher
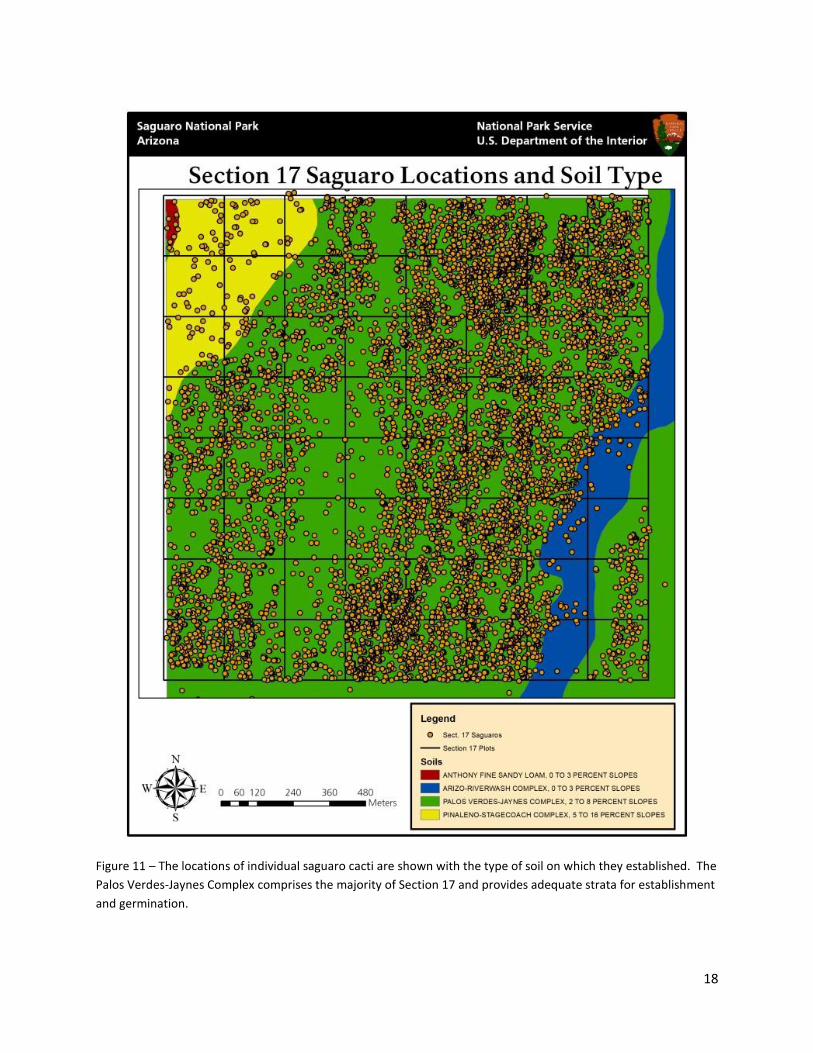
ground between the washes on well-drained, coarse soils (Figs. 9 - 11). Areas with high clay
content soils, such as the Pinaleno-Stagecoach Complex soil in northwest corner of Section 17,
retain more moisture and prevent seedling establishment (Fig. 11). A bowl-shaped depression
near the center of Section 17 collects runoff from a wash and the slopes on either side, resulting
in soil saturation and an inhospitable area for saguaro establishment as the extremely low density
result indicates (Fig. 9).
Figure 9 – Individual saguaro cactus locations are indicated by the yellow dot on this aerial photograph. Each
saguaro location was determined by the use of a GPS device.

17
Figure 10 – The highest density of saguaro cacti are found in the eastern half of Section 17 with the exception of
the large wash. High numbers of saguaro cacti are present in the southwestern corner, as well.
18
Figure 11 – The locations of individual saguaro cacti are shown with the type of soil on which they established. The
Palos Verdes-Jaynes Complex comprises the majority of Section 17 and provides adequate strata for establishment
and germination.

19
Volunteers. More than 170 volunteers, many of them high school students, participated in
the Section 17 on the first day of the BioBlitz on October 21, 2011 (Figs. 12-15); another 15
volunteers joined us for the second day. Approximately 130 volunteers, including both one-day
and multiple-day volunteers, but not including group volunteers, supported this project after the
BioBlitz, during November 2011-March 2012. Prior to late April, when we ceased using
volunteer groups due to warming summer temperatures, volunteers contributed more than 3,000
volunteer hours to the project. During summer, our Youth Internship Program (YIP) crew
included several volunteers who contributed more than 100 additional volunteer hours to the
project.
Education and web site. We created a website dedicated to the Section 17 project
(https://sites.google.com/site/sagusection17) where volunteers and other participants could learn
about the study before going out into the field, observe photos, and compare the results of their
work with those of 1941 when they returned from the field. The website was updated regularly
through the end of volunteer sampling in April, 2012. In addition, the Section 17 received
publicity, particularly during the 2011 BioBlitz, on a number of media internet sites including
National Parks Traveler, National Geographic, University of Arizona, and others, and
throughout the year on the park’s Facebook page. The project is also being featured in the
children’s book The Park Scientists by Mary Kay Carson, to be published in 2014.
The project spurred a number of educational programs, in addition to the many school
groups that participated during the BioBlitz and throughout the year. Students from Arizona
College Preparatory Academy, in addition to helping plan the Section 17 event for the BioBlitz
and participated in it as part of the National Park Foundation Park Stewards Program (Fig. 12),
also devoted part of their spring semester in helping study the vegetation associated with
saguaros in Section 17. Meena Ravishankar volunteered frequently, and used Section 17 data to
study the height and age of saguaros when they first begin to attract cavity-nesting woodpeckers;
she won an award at the regional science fair for her project (Fig. 13). Park staff and interns
also participated in the project (Fig. 14; Fig. 15). In addition, students from City High School,
Ha:san Preparatory and Leadership School, and Sabino High School studied saguaros in and near
Section 17 for educational and service learning programs during the 2012-2013 school year.

20
Figure 12. High school students from Arizona College Preparatory Academy sampled saguaros in Section 17 during
the BioBlitz on October 21, 2011.
Figure 13. Middle school student Meena Ravishankar won an award from the regional science fair for her project
on saguaros in Section 17 that focused on how old saguaros are before birds begin to build cavity nests in them.
21
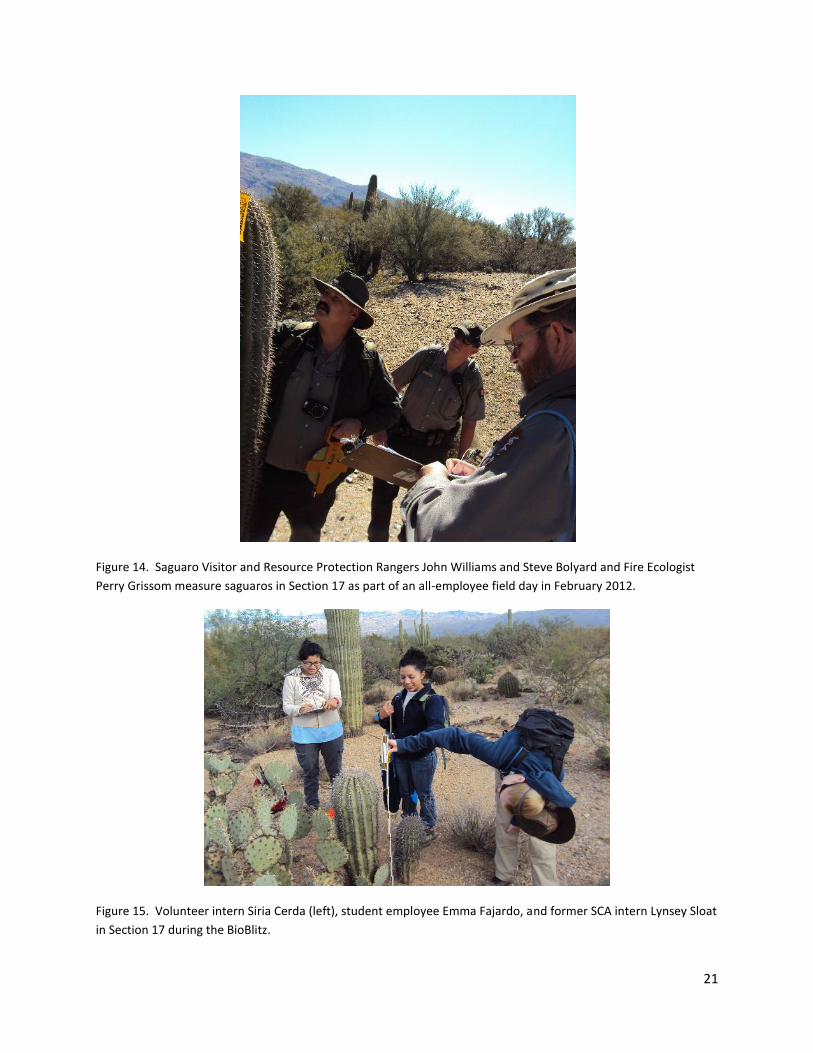
Figure 14. Saguaro Visitor and Resource Protection Rangers John Williams and Steve Bolyard and Fire Ecologist
Perry Grissom measure saguaros in Section 17 as part of an all-employee field day in February 2012.
Figure 15. Volunteer intern Siria Cerda (left), student employee Emma Fajardo, and former SCA intern Lynsey Sloat
in Section 17 during the BioBlitz.
22
Discussion
The demographic results of this study confirm the findings of many studies completed
within the past 20 years, including the major study within Section 17 that documented the
decline of the original Cactus Forest and the tremendous increase in young saguaros during the
decades of the 1960s-1990s (Orum et al. 2010). Other studies have documented the recruitment
surge of the last 40 years in areas of Saguaro National Park outside of Section 17 (Duriscoe and
Graben 1991, Turner and Funicelli 2001, O’Brien et al. 2011). The results of our Section 17 re-
survey indicate that the saguaro population, as a whole, has yet to fully recover from the decline
observed in the early 1940s. However, it is important to recognize that 70 years represents only
approximately two generations for saguaro reproduction. In that regard, the saguaro population
appears to be recovering at a surprisingly rapid rate. The current ecological trajectory and
demographic pattern suggest that the saguaros in Section 17 may become more evenly
distributed in age by the year 2053 in the absence of any disturbances previously discussed.
During that time, we may predict that the youngest saguaro cacti in the RMD will reach
reproductive age and begin to produce the third generation of saguaro cacti since the
establishment of Saguaro National Park. By the fourth generation, the saguaro population has the
potential to surpass the 1941 count. After 2060, visitors to Saguaro National Park may witness
the Cactus Forest full of “grandfather” saguaros as seen in 1941, although the overall appearance
may not be quite the same due to differences both in the ages of saguaros and in abundance of
other plant species, especially trees (Appendix E).
However, there are many other factors that may determine the direction of saguaro
demographics in the Cactus Forest in the coming decades. The appearance of the Cactus Forest
landscape in 1941 was the result of a number of natural and anthropogenic factors, some of them
unknown. Some factors that negatively impacted saguaros, such as grazing and wood
harvesting, have been remedied through the protection afforded by the National Park Service.
Climate variables, such as temperature and precipitation, remain well beyond the reach of
management. In addition, there are other factors that have not influenced saguaro populations in
the past but may in the future. This category includes increases in non-native invasive species,
particularly buffelgrass, which have the potential to permanently alter the ecological trajectory of
the Sonoran desert ecosystem (Stevens and Falk 2009). Although present in only a few areas of
Section 17 in 2012, buffelgrass is abundant in many parts of Saguaro National Park and appears
to be impacting saguaros through competition. More importantly, when buffelgrass spreads
rapidly over large areas it provides a continuous fuel source for wildfire, burns exceptionally hot,
and grows against the base of the giant saguaro. Saguaros are not fire adapted and a severe fire
within a buffelgrass-infested area has the potential to kill every saguaro within the fire perimeter.
Buffelgrass decreases the fire return interval, meaning desert fires may occur more frequently in
the future than in the past.
23
The potential effects of long-term climate changes cannot be overlooked in any
discussion about the future of the saguaro population. Climate models predict mixed effects for
the future of the saguaro cactus in the southwestern United States. Saguaro National Park is
located near the environmental optimum of the species’ range (Niering et al. 1963, Drezner
2006) so any significant climatological change could have important implications for the
distribution of cacti throughout the Park. Freezing temperatures during winter months are a
primary limiting factor for the survival of saguaro seedlings (Steenbergh and Lowe 1976,
Steenbergh and Lowe 1983). Most climate models predict warming temperatures for the
southwestern United States on the order of five to seven degrees Fahrenheit by the year 2100
(Christensen et al. 2007, Lenart et al. 2007). Temperature increases may reduce the number of
freeze events (Archer and Predick 2008) that result in saguaro mortality, however warmer
temperatures increase water demands of plants during the summer months. The frequency of
drought is expected to increase along with temperature over the next century (Seager et al. 2007,
Archer and Predick 2008), which may have the effect of changing the limiting factor for saguaro
cactus saguaro from freezing temperature to water availability.
Climate models correlate well with past observations and explain up to 95% of the
variability inherent to climate systems (Bader et al. 2008), but models and forecasts do not, and
cannot, fully describe the future. Some research shows that extremes in both hot and cold
temperatures may become the norm and deep freezes in the Sonoran Desert are linked to the
Arctic Oscillation and El Niño-La Niña phases (Guido 2011). During drier La Niña years and a
negative phase in the Arctic Oscillation associated with high pressure over the North Pole, cold
arctic air dips south into the mid-latitudes. Warmer polar temperatures influence the pressure
system associated with the Arctic Oscillation, which may push more polar air further south in the
future and lead to more freeze events and a higher winter mortality rate for the saguaro cactus
(Guido 2011).
Conclusion
The saguaro population within the Cactus Forest, the primary tourist area of Saguaro
National Monument in 1941, was in decline prior to the 1941 census of Section 17 due to both
the highly visible mortality of many larger individuals and the less visible absence of young
saguaros. The creation of Saguaro National Monument, by providing protection for the Cactus
Forest, appears to have significantly improved the conditions that promote saguaro
establishment. Section 17 has enjoyed this protection for more than 70 years, which is
approximately half the life span of the saguaro cactus. Recovery of a long-lived species
population requires patience and monitoring over time. This census study shows that much has
been accomplished since 1941 and the saguaro population is significantly healthier than it was
decades ago, but recovery is not yet complete. Management of the population and the
disturbances that affect it must continue to mitigate the negatives and maximize the benefits to
24
ensure that future generations of visitors to Saguaro National Park enjoy the cactus forest
landscape.
Literature cited
Ahnmark, E. and D. E. Swann. 2009. A history of saguaro cactus monitoring in Saguaro
National Park, 1939–2007. Natural Resource Technical Report NPS/SODN/NRTR–
2007/093. National Park Service, Fort Collins, Colorado.
Alcorn, S.M., and C. May. 1962. Attrition of a saguaro forest. Plant Disease Reporter 46: 156-
158.
Archer, S.R. and K.I. Predick. 2008. Climate Change and the Ecosystems of the Southwestern
United States. Rangelands 30(3): 23-28.
Bader, D.C., C. Covey, W.J. Gutowski, I.M. Held, K.E. Kunkel, R.L. Miller, R.T. Tokmakian,
and M.H. Zhang. 2008. Climate models: An assessment of strengths and limitations. A
Report by the U.S. Climate Change Science Program and the Subcommittee on Global
Change Research. Department of Energy, Office of Biological and Environmental
Research, Washington, D.C.
Bakker, J.P., H Olff, J.H. Willems, and M. Zobel. 1996. Why do we need permanent plots in the
study of long-term vegetation dynamics? Journal of Vegetation Science 7(2): 147-155.
Christensen, J.H., B. Hewitson, A. Busuioc, A. Chen, X. Gao, I. Held, R. Jones, R.K. Kolli, W.-
T. Kwon, R. Laprise, V. Magaña Rueda, L. Mearns, C.G. Menéndez, J. Räisänen, A.
Rinke, A. Sarr and P. Whetton. 2007. Regional Climate Projections. In: Climate Change
2007:The Physical Science Basis. Contribution of Working Group I to the Fourth
Assessment Report of the Intergovernmental Panel on Climate Change [Solomon, S., D.
Qin, M. Manning, Z. Chen, M. Marquis, K.B. Averyt, M. Tignor and H.L. Miller (eds.)].
Cambridge University Press, Cambridge, United Kingdom and New York, NY, USA.
Drezner, T.D. 2006. Regeneration of Carnegia gigantea (Cactaceae) since 1850 in three
population in the northern Sonoran Desert. Acta Oecologica 29: 178-186.
Duriscoe, D. M., and S.L. Graban. 1991. Epidermal browning and population structure of giant
saguaro cactus (Carnegiea gigantea) in Saguaro National Monument, Arizona. Eridanus
Research Associates, California. Unpublished report to Saguaro National Park.
Gill, L.S. 1951. Mortality in the giant cactus at Saguaro National Monument, 1941-1950. U.S.
Department of Agriculture, Bureau of Plant Industry. 23 pp.
Gill, L. S. and P. C. Lightle. 1942. Cactus disease investigations: an outline of objectives, plans,
and accomplishments on project j-2-8. Report to the Bureau of Plant Industry. Reprinted
as p. 158 – 188 in W. F. Steenbergh and C. H. Lowe. 1983. Ecology of the saguaro: III,
growth and demography. Scientific Monograph Series, No. 17. USDI, National Park
Service, Washington, D. C.
25
Gill, L. S., and P. C. Lightle. 1946. Analysis of mortality in the saguaro cactus: a progress
report on the experimental area (Section 17 R16ET14S) established in the Saguaro
National Monument in 1941 for the study of bacterial rot. Report to Saguaro National
Monument.
Guido, Z. 2011. Deep Freezes: Will Future Warming Paradoxically Cause More Extreme Cold
Events? Southwest Climate Outlook Feb. 2011. 1-2.
Lenart, M., (ed.) et al. 2007. Global warming in the Southwest: projections, observations and
impacts. University of Arizona, Climate Assessment for the Southwest, Tucson, Arizona.
McAuliffe, J.R. 1993. Case study of research, monitoring, and management programs associated
with the saguaro cactus (Carnegiea gigantea) at Saguaro National Monument, Arizona.
Tech. Rept. NPS/WRUA/NRTR-93/01. Coop. NP Res. Study Unit, Tucson.
McAuliffe, J.R. 1996. Saguaro cactus dynamics. Pps. 96-131 in W. L. Halvorson and G. E.
Davis, eds. Science and ecosystem management in the National Parks. University of
Arizona Press, Tucson.
Niering, W.A., R.H. Whittaker, C.H. Lowe. 1963. The Saguaro: A population in relation to
environment. Science 142: 15-23.
O’Brien, K., D. E. Swann, and A. C. Springer. 2011. Results of the 2010 Saguaro Census,
Saguaro National Park. Unpublished report to Friends of Saguaro National Park.
Orum, T. V., N. Ferguson, J. D. Mihail, and S. M. Alcorn. 2010. A multi-decadal episode of
saguaro (Carnegiea gigantea) population regeneration. Unpublished manuscript.
Pierson, E. A. and R. M. Turner. 1998. An 85-year study of saguaro (Carnegiea gigantea)
demography. Ecology 79(8): 2676 – 2693.
Seager, R., M. Ting, I. Held, Y. Kushnir, J. Lu, G. Vecchi, M. Huang, N. Harnik, A. Leetmaa, N.
Lau, C. Li, J. Velez, and N. Naik. 2007. Model projections of an imminent transition to a
more arid climate in southwestern North America. Science, 316(5828), 1181-1184.
Shreve, F. 1911. The influence of low temperatures on the distribution of the giant cactus. The
Plant World 14:136-146.
Steenbergh W.F. and C.H. Lowe. 1976. Ecology of the saguaro: I. The role of freezing weather
in a warm-desert plant population. In: Research in the parks. National Park Service
Symposium Series, No 1. Washington, DC: US Government Printing Office. 49-92
Steenbergh W.F. and C.H. Lowe. 1977. Ecology of the saguaro: II. Reproduction, Germination,
Establishment, Growth, and Survival of the Young Plant. National Park Service Scientific
Monograph Series 8. US Government Printing Office, Washington, DC.
Steenbergh, W. F. and C. H. Lowe. 1983. Ecology of the saguaro: III. Growth and demography.
Scientific Monograph Series 17. National Park Service, Washington, D.C.

26
Stevens, J. and D.A. Falk. 2009. Can buffelgrass invasions be controlled in the American
Southwest? Using invasion ecology theory to understand buffelgrass success and develop
comprehensive restoration and management. Ecological Restoration 27(4): 417-427.
Swann, D.E., A.C. Springer, and K. O’Brien. 2011. Using citizen science to study saguaros and
climate change at Saguaro National Park. Park Science 28(1): 65-68.
Turner, D. S. and C. S. Funicelli. 2001. Ten-year resurvey of epidermal browning and population
structure of saguaro cactus (Carnegiea gigantea) in Saguaro National Park. Technical
Report 69, USGS Sonoran Desert Field Station, The University of Arizona, 29 pp.
Turner, R.M. 1989. Long-term saguaro population studies at Saguaro National Monument.
National Park Service. 11 pp.
27
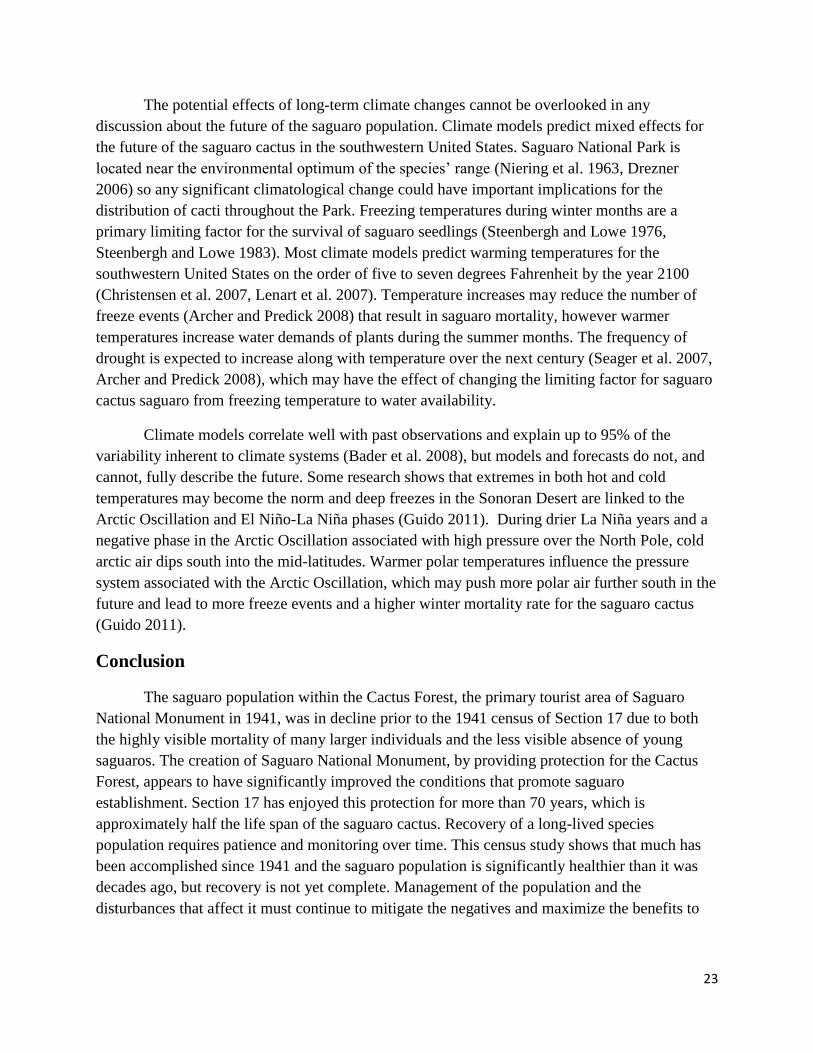
Appendix A –History of the Section 17 Saguaro Survey in Saguaro National
Park
Figure from Gill (1950) showing results of the 10-year saguaro mortality study in Section 17.
Summary
In 1941, scientists studied saguaros in a one-mile-square section (no. 17 of R 16E and T 14S) of
Saguaro National Park’s Rincon Mountain District as part of an experiment to determine if a
contagious disease was killing saguaros in the park’s “Cactus Forest” area. A total of 12,898
saguaros were measured, and monitored in Section 17. Saguaros that appeared to be dying were
removed from half the section, while the saguaros in the other half were left in place. After 10
years, scientists found no difference between the two areas and determined that a contagious
disease was not killing the saguaros. Because long-term monitoring has continued in Section 17
since 1941, many of the records from the 1941 study have survived, including the original maps,
reports, and data. In 2011, Saguaro National Park worked with school groups and citizen
scientists to study long-term changes in saguaros by repeating the survey of Section 17, seventy
years after the original survey in 1941.
28
Introduction
Saguaro National Monument was created by presidential proclamation in 1933 (it became a
national park in 1994). At that time, the so-called “Cactus Forest,” located in the foothills of the
Rincon Mountains east of Tucson, was considered to be the finest stand of saguaros in the world
(Steenbergh and Lowe 1983). However, only a few years after the Monument was established,
staff and others became alarmed at a major die-off of saguaros in the Cactus Forest.
Scientists from the University of Arizona and the U.S. Department of Agriculture were called in
try to understand what was causing the die-off, and if it could be reversed. In 1941, two plant
pathologists with the USDA Bureau of Plant Industry, Lake S. Gill and Paul C. Lightle, began a
large-scale, long-term study in a one-mile square section of the park. Gill and Lightle also
studied saguaros at Organ Pipe Cactus National Monument and throughout the Arizona Sonoran
Desert during this period. The section of land in Saguaro National Park, Section 17 of Range
16E and Township 14S (Figures 1-2), was the focus of intense research for several years.
In 1941 it was believed that a contagious bacterial disease may be responsible for the death of
the saguaros, which were observed to be oozing a black fluid prior to dying. The main
experiment in Section 17 was to test whether removing the diseased individuals would result in a
higher survival of those that showed no signs of the “bacterial rot” disease, but the project
gathered a significant amount of data on saguaros that continue to serve the Park to this day.
Study design
In the winter of 1941-1942, every saguaro in Section 17 was ranked according to height,
examined for disease, numbered, and marked with a wooden stake. Each saguaro visible in an
aerial photo was also mapped (Figure 2). In all, 12,898 saguaros were recorded (Gill 1950).
To experimentally determine whether removing the diseased saguaros would increase the
survivorship of those that showed no signs of the disease, Section 17 was divided into treatment
control areas. In the northern half of the section, all saguaros were left alone, and simply
monitored. But in the southern half of the section, all saguaros that showed signs of disease were
removed by park staff working with Gill and Lightle (Figure 3). The giant cacti were pulled
down, sawed into small sections, transported to a pit where they were fumigated with a mixture
of kerosene and paradichlorobenzene (a pesticide), and buried (Gill and Lightle 1942; Figure 4).
29
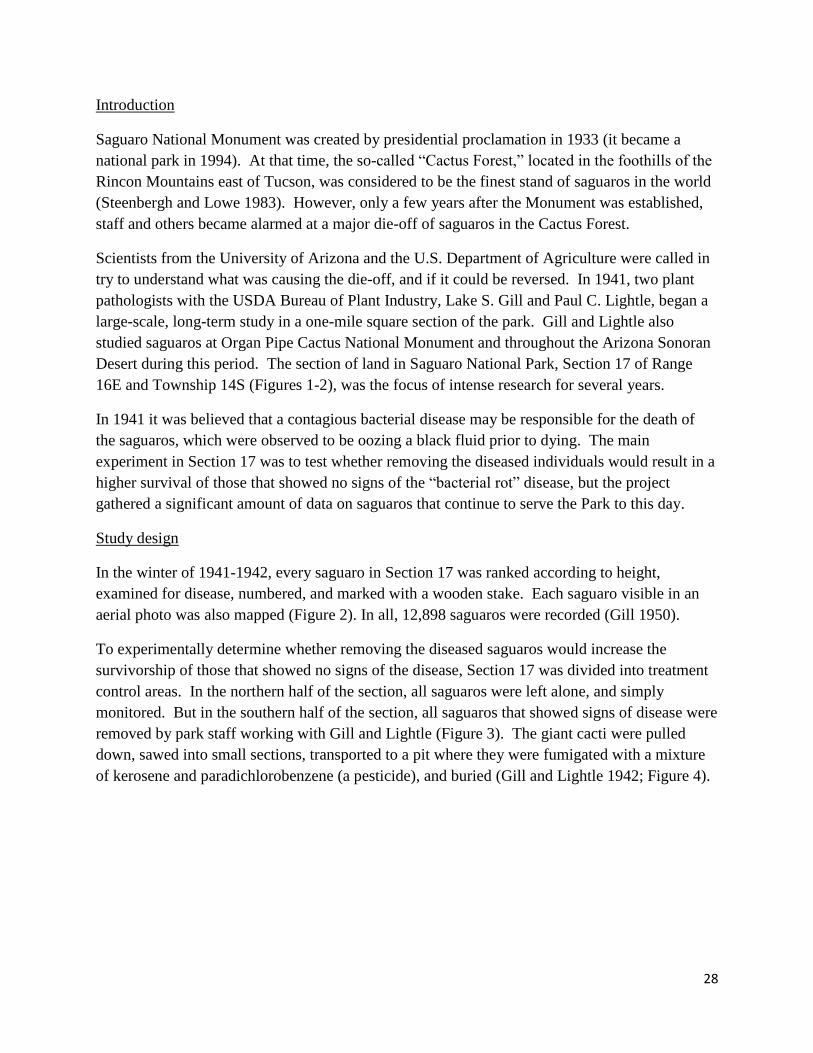
Figure 1: Location of “Section 17” (indicated by orange square), Rincon Mountain District,
Saguaro National Park.
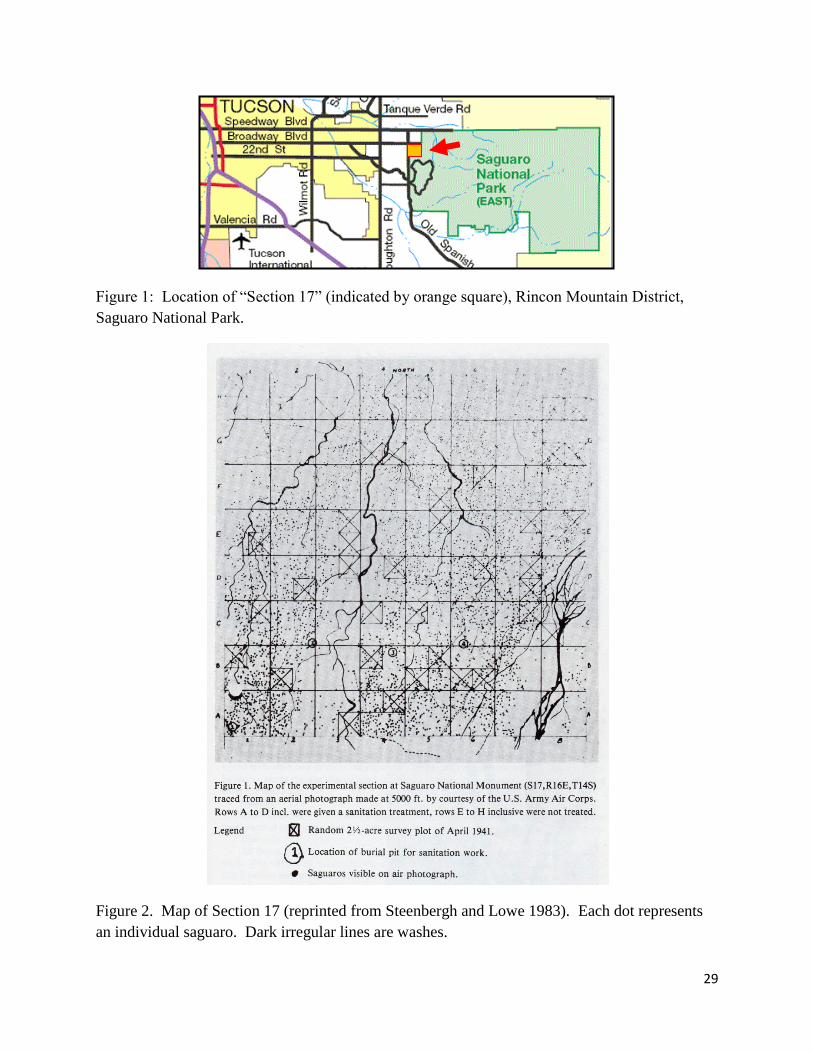
Figure 2. Map of Section 17 (reprinted from Steenbergh and Lowe 1983). Each dot represents
an individual saguaro. Dark irregular lines are washes.

30
Figure 3. Photos from the original report (Gill and Lightle 1942, reprinted in Steenbergh and
Lowe 1983), showing methods for removing diseased saguaros from the southern half of Section
17.
Figure 4. Diseased saguaros were cut into pieces, hauled to pits, doused with kerosene and
pesticide, and buried. Photo source unknown.
31
Although the original intent of the experiment was for saguaros in the southern half of the
section to continue to be removed as they showed signs of the disease, this was not done due to
labor shortages during World War II (Gill 1950). However, all cacti in Section 17 were
monitored as planned for 5 years, and a subset were monitored for 5 more years.
Results, 1941 – 1950
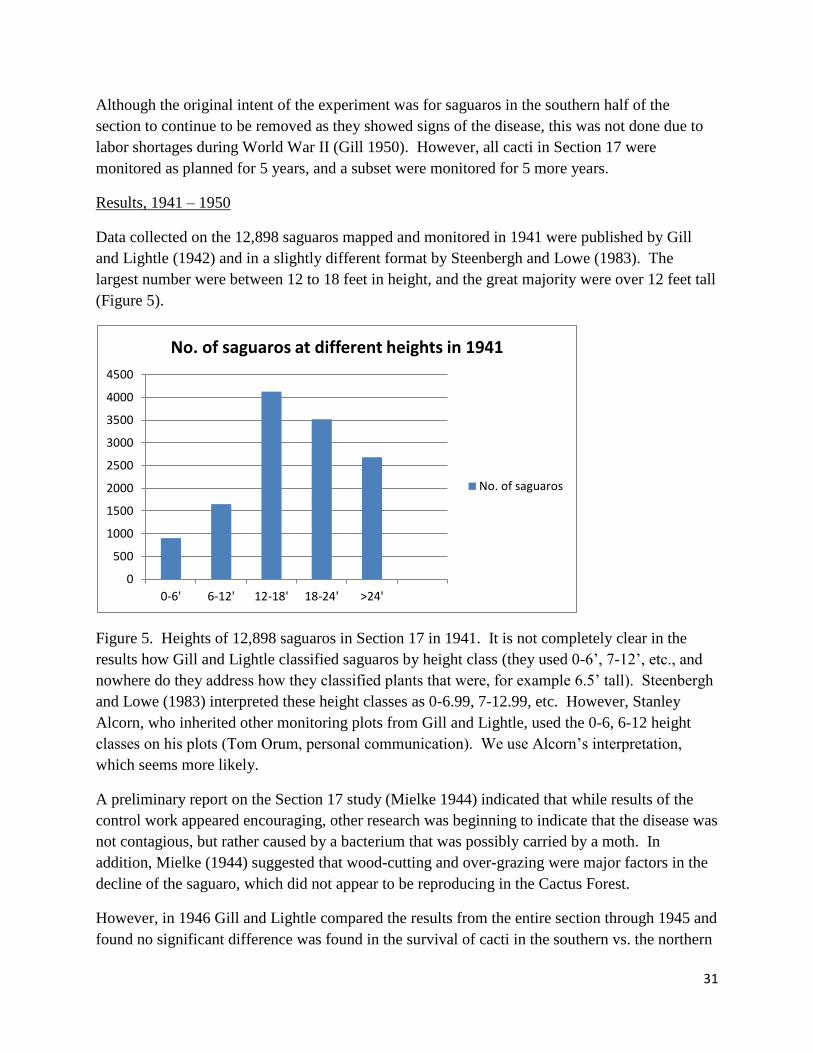
Data collected on the 12,898 saguaros mapped and monitored in 1941 were published by Gill
and Lightle (1942) and in a slightly different format by Steenbergh and Lowe (1983). The
largest number were between 12 to 18 feet in height, and the great majority were over 12 feet tall
(Figure 5).
Figure 5. Heights of 12,898 saguaros in Section 17 in 1941. It is not completely clear in the
results how Gill and Lightle classified saguaros by height class (they used 0-6’, 7-12’, etc., and
nowhere do they address how they classified plants that were, for example 6.5’ tall). Steenbergh
and Lowe (1983) interpreted these height classes as 0-6.99, 7-12.99, etc. However, Stanley
Alcorn, who inherited other monitoring plots from Gill and Lightle, used the 0-6, 6-12 height
classes on his plots (Tom Orum, personal communication). We use Alcorn’s interpretation,
which seems more likely.
A preliminary report on the Section 17 study (Mielke 1944) indicated that while results of the
control work appeared encouraging, other research was beginning to indicate that the disease was
not contagious, but rather caused by a bacterium that was possibly carried by a moth. In
addition, Mielke (1944) suggested that wood-cutting and over-grazing were major factors in the
decline of the saguaro, which did not appear to be reproducing in the Cactus Forest.
However, in 1946 Gill and Lightle compared the results from the entire section through 1945 and
found no significant difference was found in the survival of cacti in the southern vs. the northern
0
500
1000
1500
2000
2500
3000
3500
4000
4500
0-6' 6-12' 12-18' 18-24' >24'
No. of saguaros at different heights in 1941
No. of saguaros

32
halves of Section 17 (Figure 6). Although they expressed uncertainty about the implications of
the research, a few years later Gill (1950) reported that results over the 10 full years of data on
the six monitoring plots were consistent with the conclusion that the disease did not appear to be
contagious. Although Gill was disappointed that the experiment could not be carried out as
originally planned, with continued removal of diseased saguaros after 1941, he concluded that
“rot” did not appear to be a disease that threatened to wipe out the saguaro as a species. He noted
that mortality increased with the size of the plants and like Mielke (1944) pointed out that the
continued lack of reproduction in the Cactus Forest was a major problem (Gill 1950).
Figure 6. Number of living saguaros in Section 17 showing results of Section 17 saguaro
experiment, 1941-1946, based on Table 1 in Gill and Lightle (1946). Removal of diseased
saguaros did not increase survival of healthy ones remaining; indeed, more saguaros survived in
the northern, control section.
Continued research on saguaros, 1941-present
Due to the negative results of the Section 17 experiment, attention turned to other potential
causes of the decline of saguaros in Saguaro National Park. The decline continued for several
decades (Figure 7) until the population began to show clear signs of rebounding in the early
1990s. Research in the 1950s focused on the disease called bacterial necrosis and potential insect
vectors, while in the 1960s and 1970s the focus turned increasingly to ecological factors such as
the relationship between saguaros and nurse trees, the role of rodent herbivory, and the
importance of climate, particularly freezing weather (see McAuliffe 1993, Ahnmark and Swann
2009).
0
1000
2000
3000
4000
5000
6000
7000
South treatment North control
Nu
mb
er
of
Sagu
aro
s
1941
1946
33
It is noteworthy that, after Gill and Lightle completed their study, the 6 plots subsampled during
1946-1950 continued to be monitored annually – first by Stanley Alcorn, plant pathologist at the
University of Arizona, and then by his research technician, Tom Orum, and Nancy Ferguson.
These plots also formed the basis of many University of Arizona-based research studies. As of
2013, Orum and Ferguson are continuing to collect data on the 6 plots (Orum et al. 2010) in one
of the longest monitoring studies conducted in any national park.
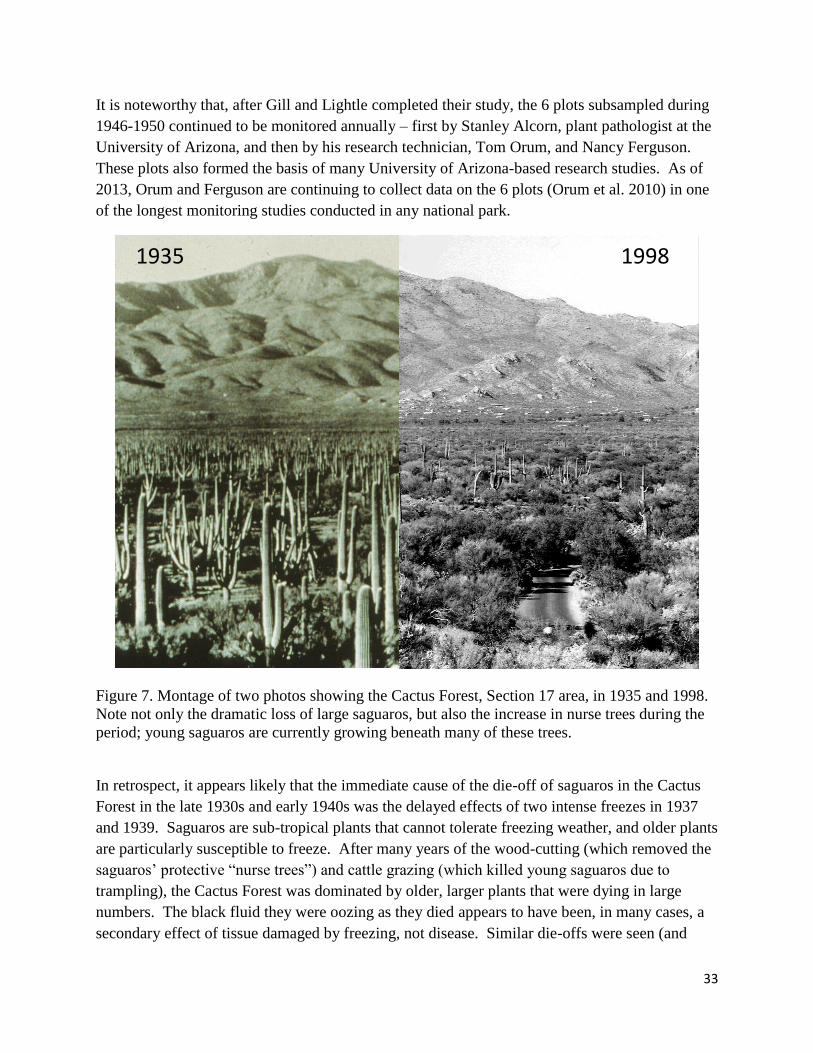
Figure 7. Montage of two photos showing the Cactus Forest, Section 17 area, in 1935 and 1998.
Note not only the dramatic loss of large saguaros, but also the increase in nurse trees during the
period; young saguaros are currently growing beneath many of these trees.
In retrospect, it appears likely that the immediate cause of the die-off of saguaros in the Cactus
Forest in the late 1930s and early 1940s was the delayed effects of two intense freezes in 1937
and 1939. Saguaros are sub-tropical plants that cannot tolerate freezing weather, and older plants
are particularly susceptible to freeze. After many years of the wood-cutting (which removed the
saguaros’ protective “nurse trees”) and cattle grazing (which killed young saguaros due to
trampling), the Cactus Forest was dominated by older, larger plants that were dying in large
numbers. The black fluid they were oozing as they died appears to have been, in many cases, a
secondary effect of tissue damaged by freezing, not disease. Similar die-offs were seen (and
1935 1998
08
34
studied) after freeze events in the 1970s (Steenbergh and Lowe 1983), and older saguaros now
also appear to be dying as a result of the deep freeze of February, 2011.
Also, Mielke (1946), Gill (1950), and many other researchers noted, the Cactus Forest was
missing the most important age class of saguaros – the younger ones. As older individuals died
in the 1940s, most were simply not being replaced. Gill (1950) predicted that the small classes
of saguaro would be “practically non-existent by 1980” in the Cactus Forest.
This prediction was largely correct, but since 1980 a significant change has occurred. Beginning
in the 1990s (Turner 1992), scientists began to see a large increase in the number of saguaros in
Section 17 and throughout the Cactus Forest – younger individuals, now surviving under the palo
verde and mesquite nurse trees that began to flourish after Saguaro National Monument was
created, probably due to the protective policies of the National Park Service. Survival of young
saguaros surged during the rainy years of the 1980s and early 1990s (Orum et al. 2010, O’Brien
et al. 2011). Although this great increase has slowed since, it seems possible that the number of
saguaros living in Section 17 is beginning to approach what it was in 1941. However, saguaros
are very slow-growing, and the resurgence of the Cactus Forest cannot be seen on a landscape
scale (Figure 7). An individual that germinated from a seed in 1970 is about 8 feet tall, and still
hidden in the branches of its nurse tree.
The intensive study of saguaros in Section 17 provides Saguaro National Park with a great
opportunity to study ecological change in the park’s Cactus Forest. In repeating the 1941 survey
during 2011-2012, seventy years after the first survey, we were interested in these questions,
including: How many saguaros are there in Section 17 today? How have the demographics of
the population changed? Will the Cactus Forest someday resemble what it looked like when
Saguaro National Park was created, and if so when?
Appendix: Notes on 1941 data sources and detailed methods
We are fortunate that much of the original data and many details and reports from the original
Section 17 study have survived. In 1983, a number of documents that were held at Saguaro
National Park were preserved by NPS scientist Warren Steenbergh and published in the Ecology
of the Saguaro series that he co-wrote with University of Arizona professor Charles Lowe
(Steenbergh and Lowe 1983). Although the location of the original photographs is unknown, the
park possesses a copy of the original map of the saguaros in Section 17 (copies in Resource
Management office and at the Western Archeological Conservation Center). The original log
books, with the records for all of the 12,898 saguaros, have been preserved by long-time saguaro
researchers Tom Orum and Nancy Ferguson, who have generously provided the park with a
copy.

35
Prior to the experiment, beginning in 1940, engineering students from the University of Arizona
divided Section 17 into a total of 64, 10-acre blocks. Each corner was marked by a wooden stake.
In September, 1941, work began on collecting data on all saguaros in the section. Every living
saguaro was identified with a wooden numbered stake. The numbers started with No. 1 in the in
the Southwest corner of each 10-acre quadrat, and progressing in north-south strips to the east
edge of the quadrat.
Data collected on saguaros in southern half of Section 17 coincided with the removal of diseased
saguaros on this half between November 1941 and January 1942, and continued through March
1942 on the northern half. Data collected on each cactus included height to the nearest 6 feet;
serious mechanical injuries, if any, due to removal of nearby diseased saguaros; extent and
degree of disease condition; and misc. notes. The data were recorded in the log books. It is not
reported what method the researchers in 1941 used to measure height. Following the original
establishment of the study, all saguaros were examined annually through 1945, and notes were
made regarding their disease condition or death. Between 1945 and 1950, these notes were only
made on a subsample of 6 of the original 64 blocks.
At some point during 1941, large saguaros were recorded on a map (Figure 1) that was traced
from an aerial photograph taken from 5000 feet by the U.S. Army Air Corps. Different versions
of this map exist; on the version published by Steenbergh and Lowe (1983), the burial pits, main
plots, and subplots are clearly marked. Unfortunately, because the saguaros on the map are not
numbered it seems unlikely that we will be able to locate, with certainty, those that have survived
until today.
The 6 plots used to monitor saguaros during 1945-1950 (Gill 1950) are the same ones now
monitored by Tom Orum and Nancy Ferguson (Orum et al. 2010). Gill and Lightle (1942) also
established 6 smaller plots in Saguaro National Monument; two of these are in Section 17.
These plots have been re-surveyed 3 times: in the 1970s, 2000, and 2011 (Steenbergh and Lowe
1983; Funicelli and Turner 2002; Saguaro National Park, unpublished data).
36
Literature Cited
Ahnmark, E. and D. E. Swann (2009). A history of saguaro cactus monitoring in
Saguaro National Park, 1939–2007. Natural Resource Technical Report
NPS/SODN/NRTR–2007/093.
Gill, L. S. 1950. Mortality in the giant cactus in Saguaro National Monument 1941-1950.
Report to Saguaro National Monument.
Gill, L. S., and P. C. Lightle. 1942. Cactus disease investigations, Saguaro National
Monument Headquarters (Tucson, Arizona). Official Report.
Gill, L. S., and P. C. Lightle. 1946. Analysis of mortality in the saguaro cactus: a progress
report on the experimental area (Section 17 R16ET14S) established in the Saguaro
National Monument in 1941 for the study of bacterial rot. Report to Saguaro National
Monument.
McAuliffe, J. R. 1993. Case study of research, monitoring, and management programs
associated with the saguaro cactus (Carnegiea gigantea) at Saguaro National
Monument, Arizona. Tech. Rept. NPS/WRUA/NRTR-93/01. Coop. NP Res.
Study Unit, Tucson.
Mielke, J. L. 1944. Summary of results of control experiments on saguaro disease, Saguaro
National Monument. Report to Saguaro National Monument.
Orum, T. V., N. Ferguson, J. D. Mihail, and S. M. Alcorn. 2010. A multi-decadal episode of
saguaro (Carnegiea gigantea) population. Unpublished manuscript.
O’Brien, K., D. E. Swann, and A. C. Springer. 2011. Results of the 2010 Saguaro Census,
Saguaro National Park. Unpublished report to Friends of Saguaro National Park.
Steenbergh, W. F., and C. H. Lowe. 1983. Ecology of the saguaro III: growth and demography.
USDS, National Park Service Scientific Monograph Series No. 17. Washington, D.C.
Turner. R. M. 1992. Long-term saguaro population studies at Saguaro National Monument. In
Stone, C. P., and E. S. Bellantoni, eds. Proceedings of the symposium on research in
Saguaro National Monument. National Park Service, 1992.
37
Appendix B - Survey Protocol for Saguaro Census
(January 8, 2011)
Supplies and Equipment
Park radio
Digital camera for recording field data and volunteer photos
1-2 extra park radio batteries
Emergency contact sheet (radio, phone numbers)
Large crew first aid kit
GPS Garmin unit
Clipboards with volunteer forms
Plot maps with UTMs of corners
Leader’s binder with safety topics to cover, extra volunteer forms and data sheets, list of
UTM plot coordinates, census calendar, and How to use a clinometer worksheet
Orientation poster (for interpreting why we do the Census to volunteers)
Pin flags to mark saguaros – up to 200, numbered (e.g., A-1, A-2…Z-99)
Pink and blue boundary flagging
Gatorade and extra water
Complete census equipment bags (see below) – one for each 3-4 person group
Census Equipment Bag Contents
1-2 clinometers
2 wooden stick measures
1 metal tape measure
1 20-m roll tape
Clipboard with plenty of data sheets, map and coordinates of plot
1 two-way radio
Extra batteries for two-way radio
Writing implements
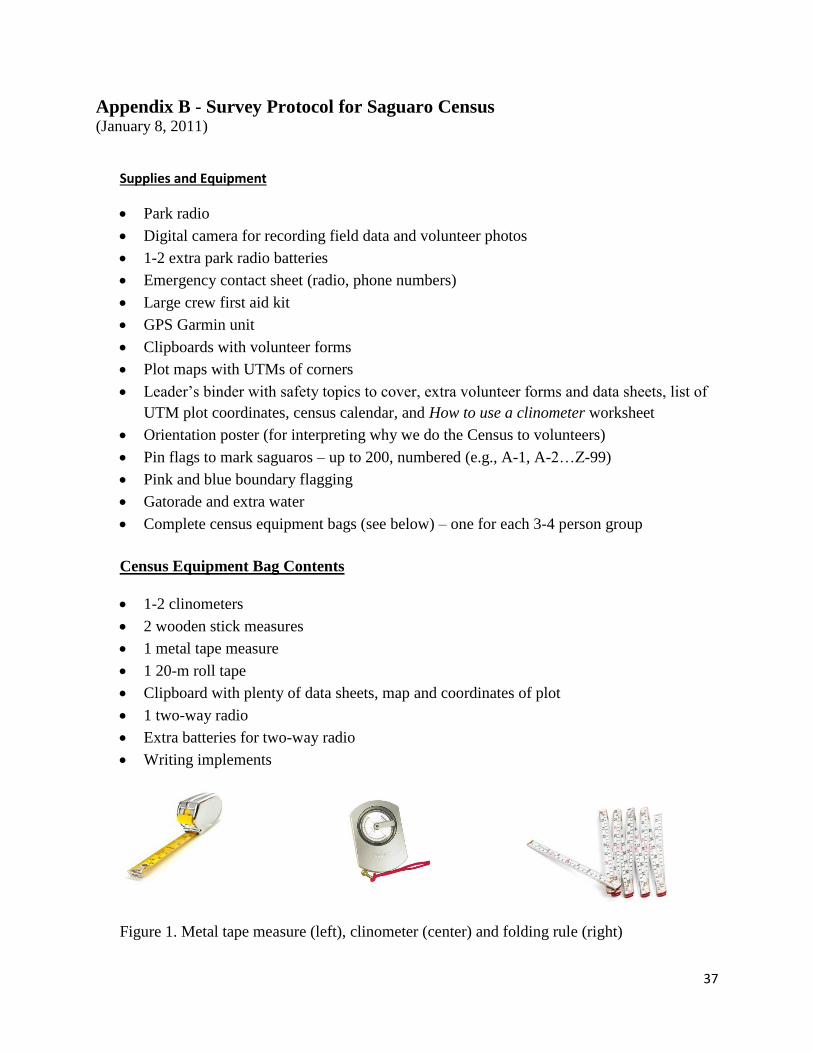
Figure 1. Metal tape measure (left), clinometer (center) and folding rule (right)

38
Safety
Please refer to two documents from the 2010 Saguaro Census: the Safety Plan and the Green-
Amber-Red review, which is an attachment to the Safety Plan. These lay out many of the safety
concerns that are relevant to the Census and working with volunteers. The Saguaro Census has
some inherent safety concerns that must be addressed – take them seriously!
Recruiting Volunteers and Selecting Plots
In 2010, when contacting new volunteers or volunteer groups, we explained how difficult the
Census work was. We requested that they describe their physical ability and experience hiking in
the desert (see Safety Plan for more information). We explained in detail what is involved in the
Census, including safety, the difficulty of the terrain, need for the right clothing – hats, good
boots, and long pants required! For individual volunteers, we invited them to join an easy plot
first and monitor how well they do. Then, if they were interested in more challenging plots, we
would progressively take them to more difficult plots. When receiving RSVPs for Census dates,
we established a cut off point for each plot, typically about 15 volunteers for “public” plots, or
about 5 more for groups (beyond this number, confusion begins to reign!). In 2010, we had a
single intern, Kimberly Diamond, in charge of recruitment, volunteer organization,
documentation, and logistics with the project manager (Don Swann). Kim usually went out with
volunteers, accompanied by other park staff (Don Swann, student employees, or other
experienced staff).
Groups ranged in ability, but nearly all were recruited because of their outdoor experience. We
used groups from local hiking societies, the Friends of Saguaro National Park, the Summit Hut,
the Sky Island Alliance, the University of Arizona, and many others.
Each month in 2010 we surveyed a variety of plots, ranging from easy to difficult, in both
districts of the Park. In 2010, the last Saturday of each month was considered a ‘public plot’ for
individual volunteers – for this, we selected one of the plots at RMD that was easy enough for all
levels of physical ability. At the beginning of the month an email was sent to all census
participants that described the plots in terms of whether they were easy, intermediate, or difficult.
Based on this email, volunteers could determine if they were capable of participating in the plot
surveys. Very difficult plots were left off the mass email, but we would invite individual
volunteers that we believed, based on our experience in working with them, were fully capable
of the physical work. Plot difficulty assessments were based on distance from road, slope,
vegetation, and number of saguaros during last survey.
Flagging the Plot
Pre-flagging is important so that the plot can be scouted out in advance. Pre-flagging helps make
the day of the Census go much faster and smoother. Pre-flagging also provides an opportunity to
determine where parking should occur, the easiest route to hike to the plot, and what type of
terrain to expect. We recommend pre-flagging the plot before the day of the Census, but no more

39
than a week in advance. We also made a point to let the rangers know that we had flagged a plot,
in case a question about it came up.
If the plot is off-trail, flag a route to the plot using flagging other than pink or blue. Take a radio,
extra battery, plot map, pink and blue flagging and other flagging color if necessary. One of the
appendices of the Saguaro Safety plan is a data sheet for flagging the plot.
To flag the plot, we recommend the following steps:
1. Locate one corner of the plot using GPS. Ideally, locate the corner stake.
2. Flag the corner with pink and blue flagging.
3. Using the view on the GPS unit that shows the coordinates, follow the north-south
coordinate to the next corner (200 meters). Every twenty meters or so, tie a pink flag on a
shrub (consider using Velcro or other easy-to-remove tape in future). In brushy areas,
flag more frequently than every 20 meters.
4. We recommend a knot that can be easily removed with one hand. Put the flag high
enough so that it can be seen, but not so high that it cannot be easily removed. Avoid
flagging cholla.
5. There will be some drift in the GPS coordinate. Follow it anyway, and adjust the flags
slightly if one is way off. GPS drift is random and there is no need to create an absolutely
straight line.
6. When you arrive at the next corner, find the corner stake. Flag the corner with pink and
blue flags.
7. Follow the east-west coordinate to the next corner, flagging in pink every 20 meters.
8. Continue until the entire plot is flagged.
Before the Volunteers Arrive
Check RSVPs and prepare a list of the volunteers that are attending. Once the list reaches 15, do
not allow more volunteers to sign up. Sign out a park vehicle for the census date. Gather all
equipment the day before, and load the park vehicle the morning of the census. Send an email to
law enforcement rangers notifying them of the date, location and contact persons for the census
for that day. In addition, provide law enforcement and a fees or visitor center employee a copy of
the plot map and emergency contact info, and post this in the Resource Management office. The
plot maps can be found under P:/Resources/Saguaro 2010/Maps and data, and are in a
PowerPoint document titled Plot finder maps.
For each public saguaro census, there should be at least two park staff members/interns, or one
park staff/intern, and one very experienced volunteer to lead the volunteer group. The Census
seemed to work best with about 5 groups of 4 people each, with one experienced person in each
group and one “roving supervisor,” usually one of the leaders, who roamed around the plot to
check in with groups, take photos, check data quality, make sure the groups stayed on track and
did not get separated, and answer questions.
Orientation to Volunteers
40
Staff members/interns should arrive early in the park vehicle to meet the volunteers at the visitor
center. Once everyone has arrived (in 2009-2010, we usually started at 7 AM until December,
then 8 AM until April), have one of the park staff or interns provide an orientation about the
census. Orientation should include a greeting/introduction, brief history, explanation of how the
survey is conducted, a safety message, and a check to ensure that everyone has enough water and
food. We used a stiff poster board with repeat photos of the Cactus Forest and simple data graphs
of previous results to interpret changes in the saguaro population in the park over time during the
orientation, and this is also a good time to show pictures of small saguaros and demonstrate
equipment operation.
Drive to the plot – we usually carpooled, with several of the volunteers driving, and with one
park vehicle. At the parking spot, we divided the gear to carry to the plot. One staff
member/intern should lead the group (preferably the person who flagged the plot) to the plot.
The other staff member/intern should remain at the back of the group to make sure no one gets
lost or lags too far behind.
Surveying the plot
1. Training. Once the plot is reached, a detailed training is essential. It is easiest if this is
done in groups of about 4, with an experienced leader in each group explaining the
procedures. If this is not possible, it is best to do an orientation with the larger group.
The orientation should cover:
a. How to identify a small saguaro compared to other cacti
b. How to measure a saguaro using a tape measure
c. How to measure a saguaro using a clinometer
d. How to record data
e. Other important “census rules” (see below)
2. Moving through the plot. Once the groups are trained, the leader will spread them out
along a boundary line, approximately 20 meters apart. The groups will walk together
in their designated swaths, and count and measure each saguaro within their group’s
boundary (see figure 2). How wide the swaths are will depend on how dense the
saguaros are, and very dense plots will go better if the swaths are less than 20 m wide.
As an example: One group will start in the northwest corner and follow the boundary
flags 200 m east to the northeast corner. The next group will start 20 meters south,
and follow a 20 m wide swath 200 m east to the eastern boundary line. The next 2-3
groups will do the same. An experienced person in the most southern group will
follow a GPS coordinate designed by the leader and flag the bottom line of the
section of the plot that being sampled. This line (southern line in this case) will form
the northern boundary of the second half of the plot in a “typical” plot where the plot
can be covered in two sessions; plots with many saguaros will need to be broken into
3-4 sections.
41
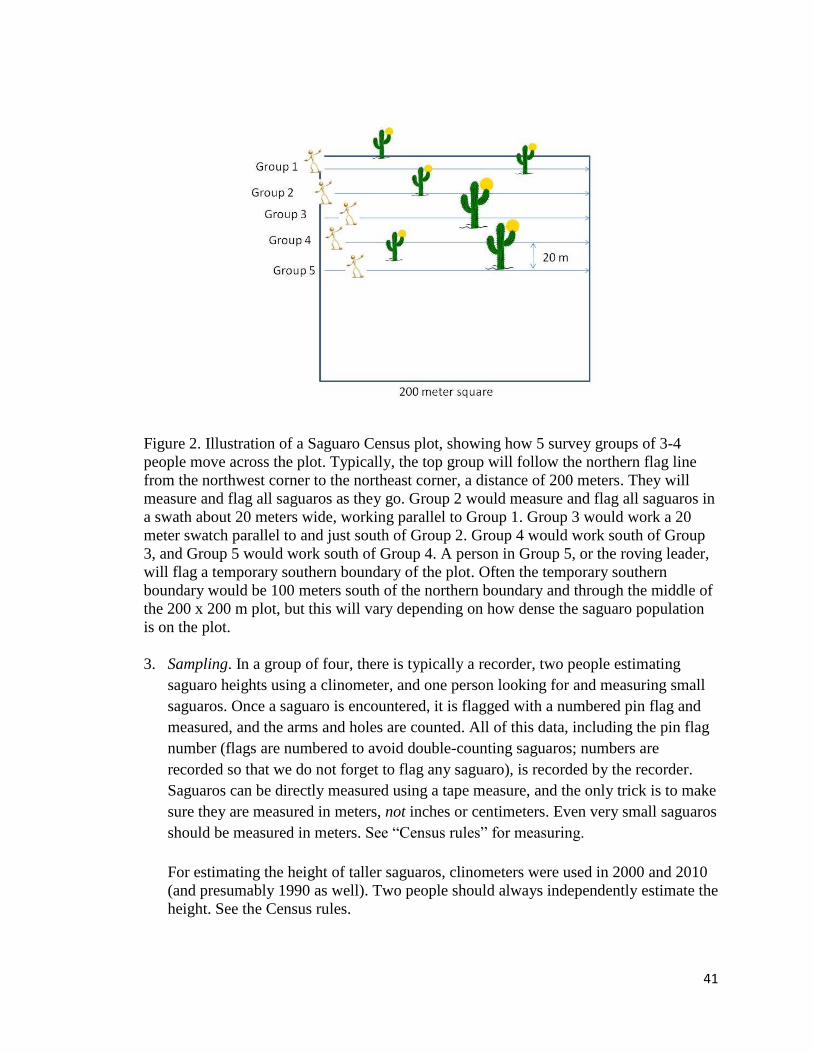
Figure 2. Illustration of a Saguaro Census plot, showing how 5 survey groups of 3-4
people move across the plot. Typically, the top group will follow the northern flag line
from the northwest corner to the northeast corner, a distance of 200 meters. They will
measure and flag all saguaros as they go. Group 2 would measure and flag all saguaros in
a swath about 20 meters wide, working parallel to Group 1. Group 3 would work a 20
meter swatch parallel to and just south of Group 2. Group 4 would work south of Group
3, and Group 5 would work south of Group 4. A person in Group 5, or the roving leader,
will flag a temporary southern boundary of the plot. Often the temporary southern
boundary would be 100 meters south of the northern boundary and through the middle of
the 200 x 200 m plot, but this will vary depending on how dense the saguaro population
is on the plot.
3. Sampling. In a group of four, there is typically a recorder, two people estimating
saguaro heights using a clinometer, and one person looking for and measuring small
saguaros. Once a saguaro is encountered, it is flagged with a numbered pin flag and
measured, and the arms and holes are counted. All of this data, including the pin flag
number (flags are numbered to avoid double-counting saguaros; numbers are
recorded so that we do not forget to flag any saguaro), is recorded by the recorder.
Saguaros can be directly measured using a tape measure, and the only trick is to make
sure they are measured in meters, not inches or centimeters. Even very small saguaros
should be measured in meters. See “Census rules” for measuring.
For estimating the height of taller saguaros, clinometers were used in 2000 and 2010
(and presumably 1990 as well). Two people should always independently estimate the
height. See the Census rules.
42
4. Checking the work. Walking a 20 meter wide swath that is 200 meters long,
measuring every saguaro, will often take a couple of hours. This is usually a good
time to take a break if one has not been taken. When the groups reach the end, we
then switch them. For example, the 5th
group could walk down to where the 1st group
was, and then everyone else can bump up 20 meters. The main point is that the groups
will all walk back through a different area than the one they sampled, looking for any
saguaros the first group missed. And yes, it is a contest! The goal is to look hard and
find new saguaros (or cacti that are not saguaros and must be removed from the first
group’s data); walking back we have more time, new lighting, and a new perspective.
If any new saguaros are found, they are flagged and measured as before. The recorder
makes a note that they were found on the second pass, such as by marking them with
an asterisk and a line. Then, a line should be put below this section also before
starting another transect. The second pass does not usually take more than 20
minutes.
5. The third pass to pick up all the flags. This usually takes about 10 minutes. On the
third pass we do not look for new saguaros, and do not measure one if we find it
unless we are ABSOLUTELY convinced that someone before us has not removed the
flag. On the third pass all the side and corner flags are picked up as well except, of
course, the side that will become the new boundary of the rest of the plot. If we
thought we might have a hard time finding our way back to the start, we might leave
those flags up too.
6. The second half of the plot. This proceeds similarly to the first half. On plots with
many saguaros, of course there may be thirds, or quarters, or other divisions. On the
most difficult plots in 2010, we used a large crew (more than 20) for 3 or more days.
7. Closing out. At the end of the day, all flags should be removed from the plot unless
the plot is not yet done. We generally provided cold Gatorade to all volunteers when
we returned to the vehicles. We took a group photo and thanked everyone!
Additional information on closing out is in the Safety Plan.
8. Data entry. Data should be entered as soon as possible when the field work is
completed – preferably the same day. All data was entered into an Excel spreadsheet
and then checked by a second person.
Census “rules”that everyone should know
* Measure to the top of a saguaro’s spines, not the green fleshy part.
* A saguaro is considered a double or triple if two or more saguaros appear to be
connected, or are sharing the same base. (In the case of a double saguaro, measure the
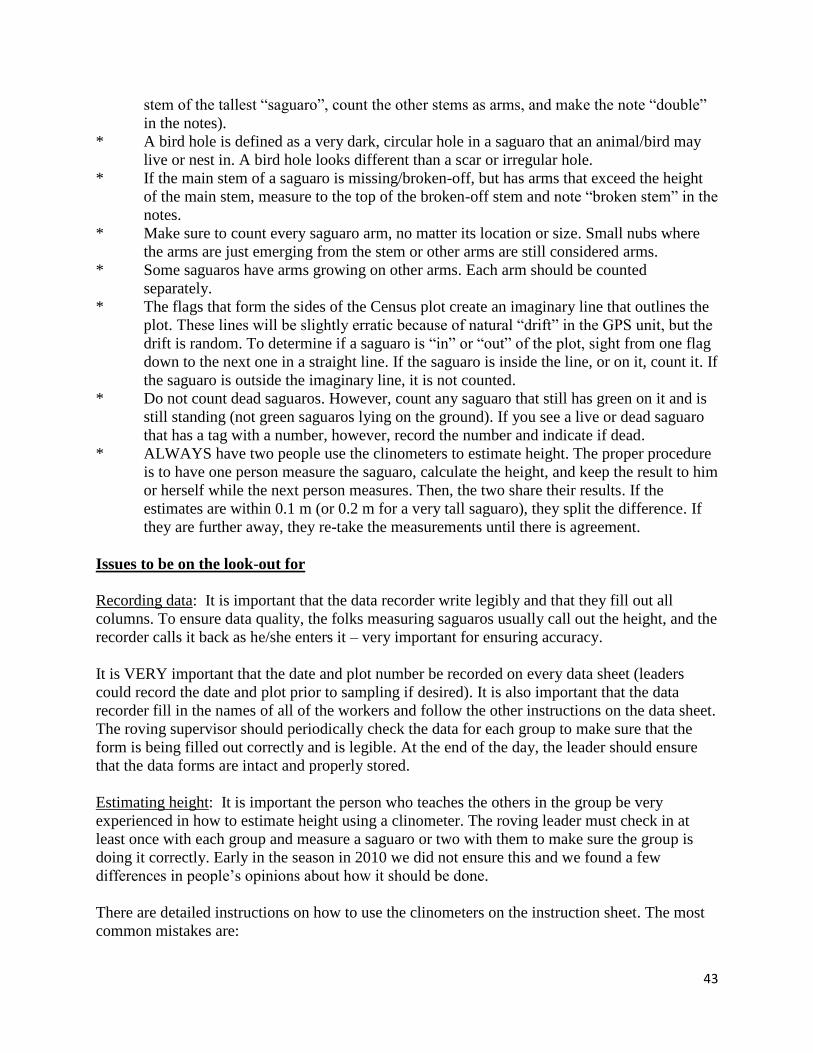
43
stem of the tallest “saguaro”, count the other stems as arms, and make the note “double”
in the notes).
* A bird hole is defined as a very dark, circular hole in a saguaro that an animal/bird may
live or nest in. A bird hole looks different than a scar or irregular hole.
* If the main stem of a saguaro is missing/broken-off, but has arms that exceed the height
of the main stem, measure to the top of the broken-off stem and note “broken stem” in the
notes.
* Make sure to count every saguaro arm, no matter its location or size. Small nubs where
the arms are just emerging from the stem or other arms are still considered arms.
* Some saguaros have arms growing on other arms. Each arm should be counted
separately.
* The flags that form the sides of the Census plot create an imaginary line that outlines the
plot. These lines will be slightly erratic because of natural “drift” in the GPS unit, but the
drift is random. To determine if a saguaro is “in” or “out” of the plot, sight from one flag
down to the next one in a straight line. If the saguaro is inside the line, or on it, count it. If
the saguaro is outside the imaginary line, it is not counted.
* Do not count dead saguaros. However, count any saguaro that still has green on it and is
still standing (not green saguaros lying on the ground). If you see a live or dead saguaro
that has a tag with a number, however, record the number and indicate if dead.
* ALWAYS have two people use the clinometers to estimate height. The proper procedure
is to have one person measure the saguaro, calculate the height, and keep the result to him
or herself while the next person measures. Then, the two share their results. If the
estimates are within 0.1 m (or 0.2 m for a very tall saguaro), they split the difference. If
they are further away, they re-take the measurements until there is agreement.
Issues to be on the look-out for
Recording data: It is important that the data recorder write legibly and that they fill out all
columns. To ensure data quality, the folks measuring saguaros usually call out the height, and the
recorder calls it back as he/she enters it – very important for ensuring accuracy.
It is VERY important that the date and plot number be recorded on every data sheet (leaders
could record the date and plot prior to sampling if desired). It is also important that the data
recorder fill in the names of all of the workers and follow the other instructions on the data sheet.
The roving supervisor should periodically check the data for each group to make sure that the
form is being filled out correctly and is legible. At the end of the day, the leader should ensure
that the data forms are intact and properly stored.
Estimating height: It is important the person who teaches the others in the group be very
experienced in how to estimate height using a clinometer. The roving leader must check in at
least once with each group and measure a saguaro or two with them to make sure the group is
doing it correctly. Early in the season in 2010 we did not ensure this and we found a few
differences in people’s opinions about how it should be done.
There are detailed instructions on how to use the clinometers on the instruction sheet. The most
common mistakes are:
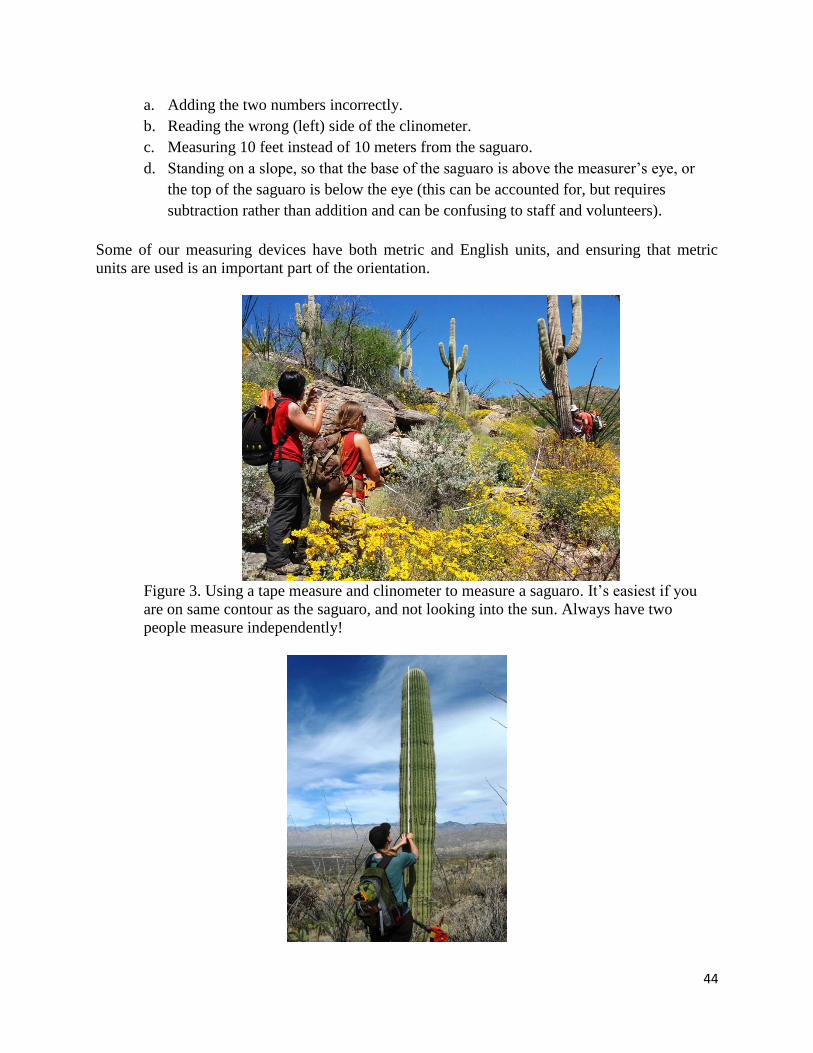
44
a. Adding the two numbers incorrectly.
b. Reading the wrong (left) side of the clinometer.
c. Measuring 10 feet instead of 10 meters from the saguaro.
d. Standing on a slope, so that the base of the saguaro is above the measurer’s eye, or
the top of the saguaro is below the eye (this can be accounted for, but requires
subtraction rather than addition and can be confusing to staff and volunteers).
Some of our measuring devices have both metric and English units, and ensuring that metric
units are used is an important part of the orientation.
Figure 3. Using a tape measure and clinometer to measure a saguaro. It’s easiest if you
are on same contour as the saguaro, and not looking into the sun. Always have two
people measure independently!
45
Figure 4. Using a folding rule to measure a saguaro. You can usually measure up to a 4 meter
saguaro this way, especially if someone else lets you know when the stick is at the top.
Saguaro Identification
It’s important to do a bit of training on this starting out and to make sure volunteers know to ask
questions when they find what they think is a small saguaro. Develop and visuals before the
season if possible, and use them. The most important things to note are the following:
1. Saguaros always have straight spines (barrel and pincushions have curved spines).
2. A small saguaro (less than a foot or two) is rounded at the top, narrows at the bottom, and
resembles the shape of a thin hot air balloon.
3. A very small saguaro (less than an inch) may look different than a small one; it is more
globular.
4. Saguaro spines are almost always white. Hedgehog cacti usually grow in clumps, are
shaped like a cylinder (not narrow at the base), and have brown or golden-brown spines.
5. Very small hedgehogs can have single stems, and distinguishing them from saguaros can
be tricky. Fortunately, this is rarely an issue, but it is occasionally. Look for the shape and
spine color. In the rare occasion where confusion persists, take a good photo and record
the pin flag number, and submit to an expert back at the office. Don’t guess!
It is always a good idea to bring everyone over to inspect the first very small saguaro you find,
and the first single stem hedgehog. This helps in the training.

46
Appendix C – Section 17 Volunteer Brochure
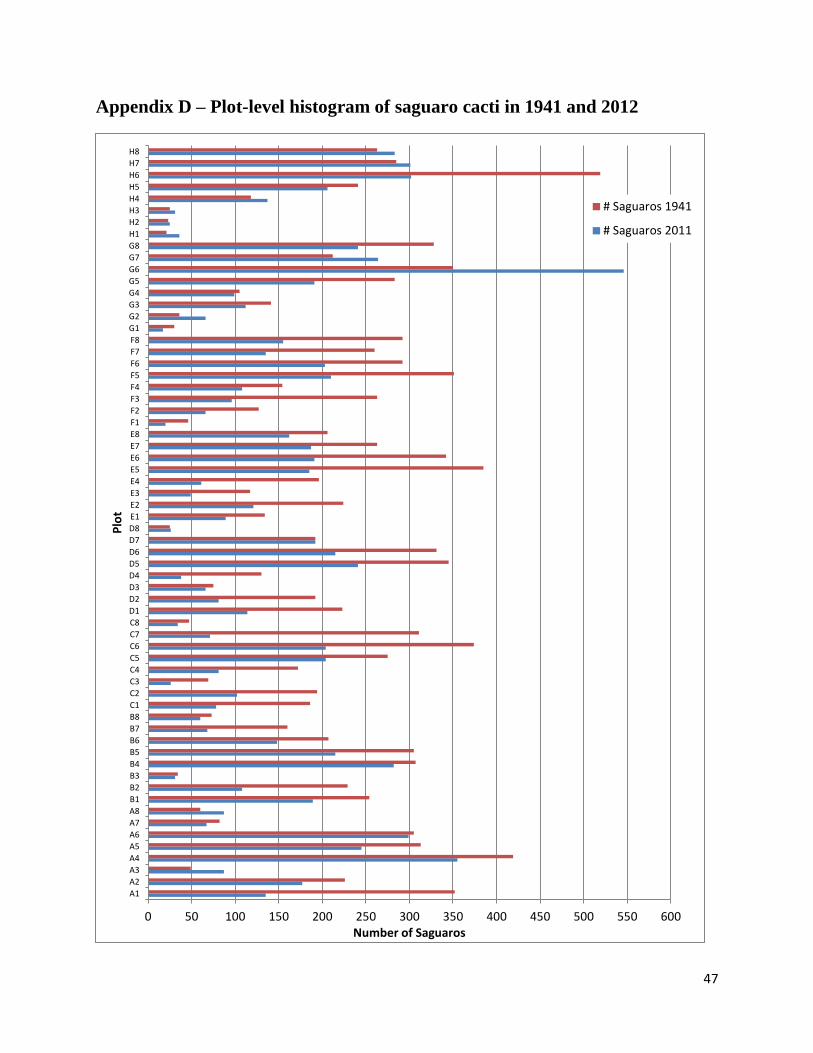
47
Appendix D – Plot-level histogram of saguaro cacti in 1941 and 2012
0 50 100 150 200 250 300 350 400 450 500 550 600
A1
A2
A3
A4
A5
A6
A7
A8
B1
B2
B3
B4
B5
B6
B7
B8
C1
C2
C3
C4
C5
C6
C7
C8
D1
D2
D3
D4
D5
D6
D7
D8
E1
E2
E3
E4
E5
E6
E7
E8
F1
F2
F3
F4
F5
F6
F7
F8
G1
G2
G3
G4
G5
G6
G7
G8
H1
H2
H3
H4
H5
H6
H7
H8
Number of Saguaros
Plo
t
# Saguaros 1941
# Saguaros 2011
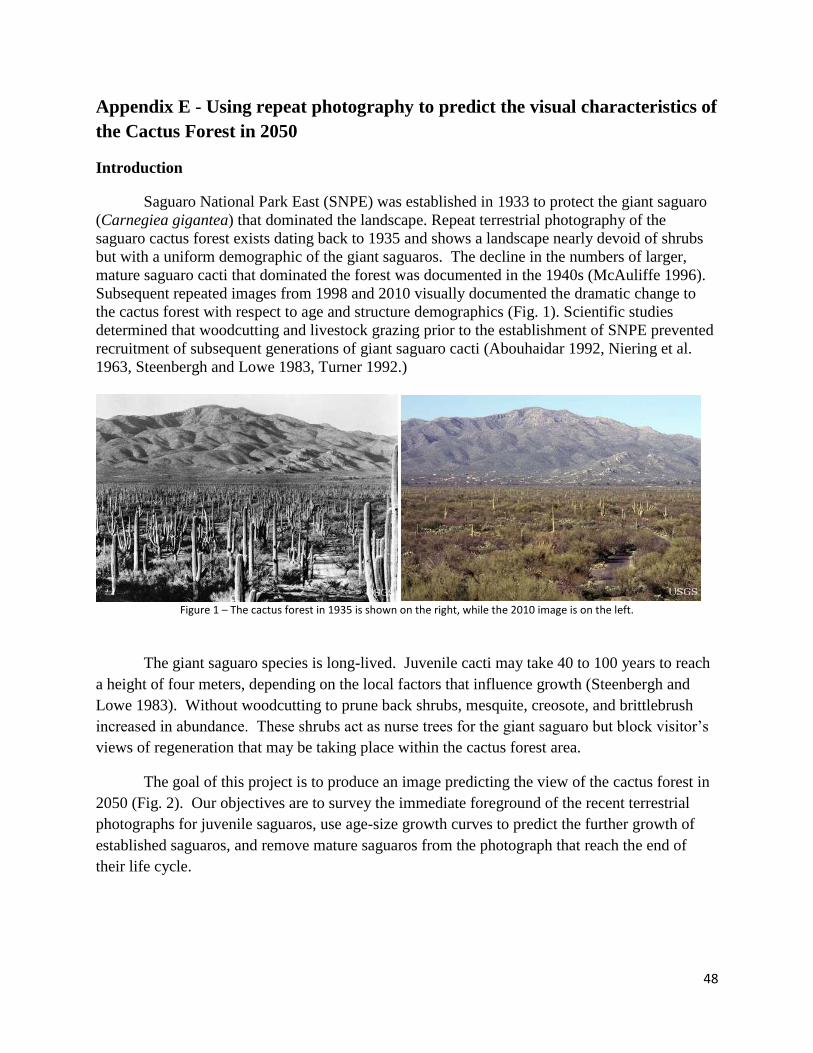
48
Appendix E - Using repeat photography to predict the visual characteristics of
the Cactus Forest in 2050
Introduction
Saguaro National Park East (SNPE) was established in 1933 to protect the giant saguaro
(Carnegiea gigantea) that dominated the landscape. Repeat terrestrial photography of the
saguaro cactus forest exists dating back to 1935 and shows a landscape nearly devoid of shrubs
but with a uniform demographic of the giant saguaros. The decline in the numbers of larger,
mature saguaro cacti that dominated the forest was documented in the 1940s (McAuliffe 1996).
Subsequent repeated images from 1998 and 2010 visually documented the dramatic change to
the cactus forest with respect to age and structure demographics (Fig. 1). Scientific studies
determined that woodcutting and livestock grazing prior to the establishment of SNPE prevented
recruitment of subsequent generations of giant saguaro cacti (Abouhaidar 1992, Niering et al.
1963, Steenbergh and Lowe 1983, Turner 1992.)
Figure 1 – The cactus forest in 1935 is shown on the right, while the 2010 image is on the left.
The giant saguaro species is long-lived. Juvenile cacti may take 40 to 100 years to reach
a height of four meters, depending on the local factors that influence growth (Steenbergh and
Lowe 1983). Without woodcutting to prune back shrubs, mesquite, creosote, and brittlebrush
increased in abundance. These shrubs act as nurse trees for the giant saguaro but block visitor’s
views of regeneration that may be taking place within the cactus forest area.
The goal of this project is to produce an image predicting the view of the cactus forest in
2050 (Fig. 2). Our objectives are to survey the immediate foreground of the recent terrestrial
photographs for juvenile saguaros, use age-size growth curves to predict the further growth of
established saguaros, and remove mature saguaros from the photograph that reach the end of
their life cycle.
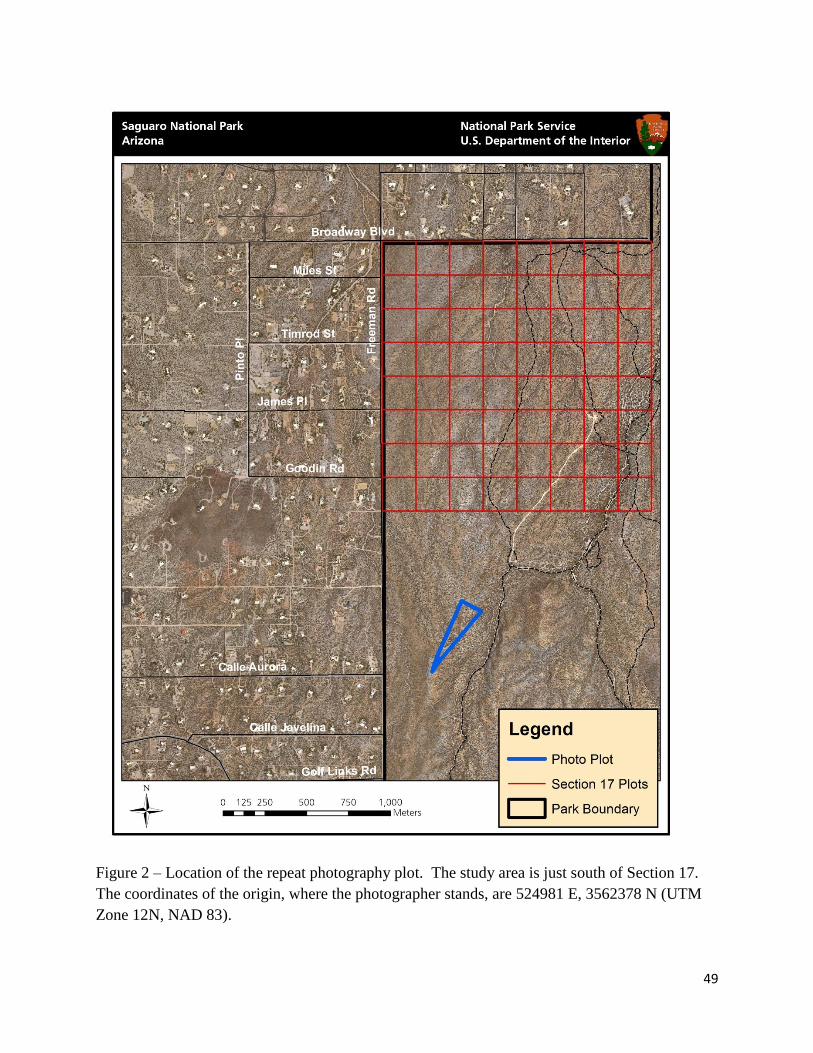
49
Figure 2 – Location of the repeat photography plot. The study area is just south of Section 17.
The coordinates of the origin, where the photographer stands, are 524981 E, 3562378 N (UTM
Zone 12N, NAD 83).
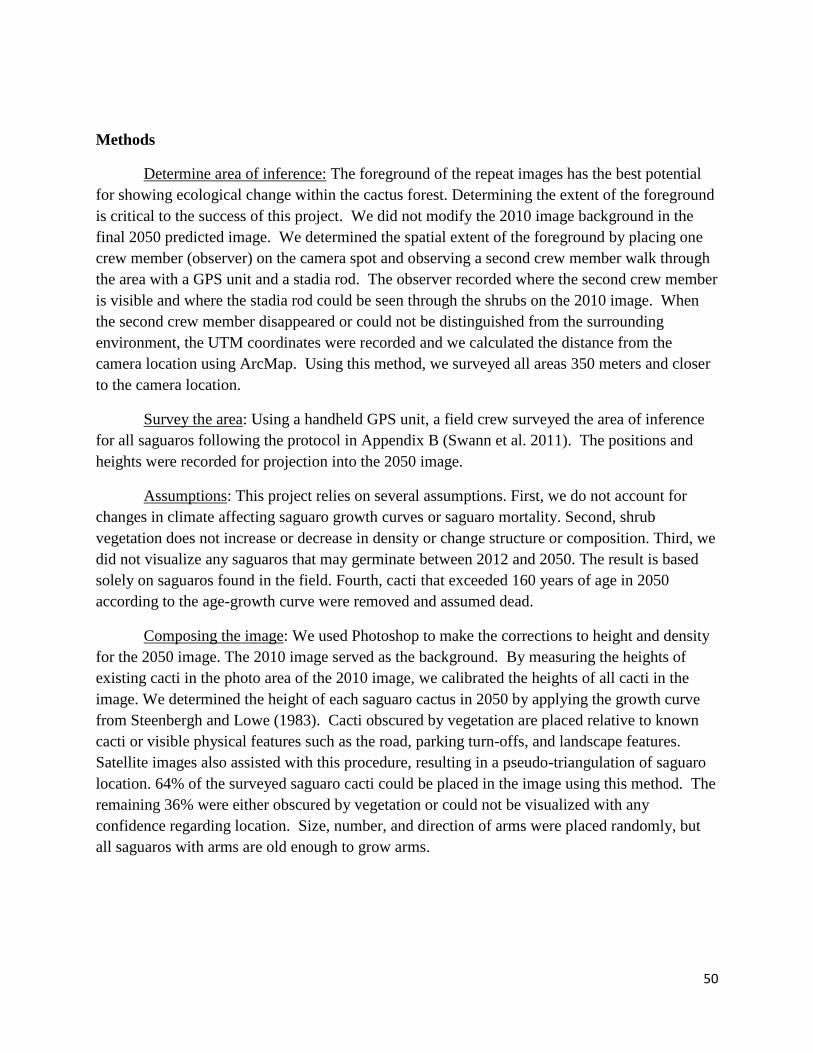
50
Methods
Determine area of inference: The foreground of the repeat images has the best potential
for showing ecological change within the cactus forest. Determining the extent of the foreground
is critical to the success of this project. We did not modify the 2010 image background in the
final 2050 predicted image. We determined the spatial extent of the foreground by placing one
crew member (observer) on the camera spot and observing a second crew member walk through
the area with a GPS unit and a stadia rod. The observer recorded where the second crew member
is visible and where the stadia rod could be seen through the shrubs on the 2010 image. When
the second crew member disappeared or could not be distinguished from the surrounding
environment, the UTM coordinates were recorded and we calculated the distance from the
camera location using ArcMap. Using this method, we surveyed all areas 350 meters and closer
to the camera location.
Survey the area: Using a handheld GPS unit, a field crew surveyed the area of inference
for all saguaros following the protocol in Appendix B (Swann et al. 2011). The positions and
heights were recorded for projection into the 2050 image.
Assumptions: This project relies on several assumptions. First, we do not account for
changes in climate affecting saguaro growth curves or saguaro mortality. Second, shrub
vegetation does not increase or decrease in density or change structure or composition. Third, we
did not visualize any saguaros that may germinate between 2012 and 2050. The result is based
solely on saguaros found in the field. Fourth, cacti that exceeded 160 years of age in 2050
according to the age-growth curve were removed and assumed dead.
Composing the image: We used Photoshop to make the corrections to height and density
for the 2050 image. The 2010 image served as the background. By measuring the heights of
existing cacti in the photo area of the 2010 image, we calibrated the heights of all cacti in the
image. We determined the height of each saguaro cactus in 2050 by applying the growth curve
from Steenbergh and Lowe (1983). Cacti obscured by vegetation are placed relative to known
cacti or visible physical features such as the road, parking turn-offs, and landscape features.
Satellite images also assisted with this procedure, resulting in a pseudo-triangulation of saguaro
location. 64% of the surveyed saguaro cacti could be placed in the image using this method. The
remaining 36% were either obscured by vegetation or could not be visualized with any
confidence regarding location. Size, number, and direction of arms were placed randomly, but
all saguaros with arms are old enough to grow arms.
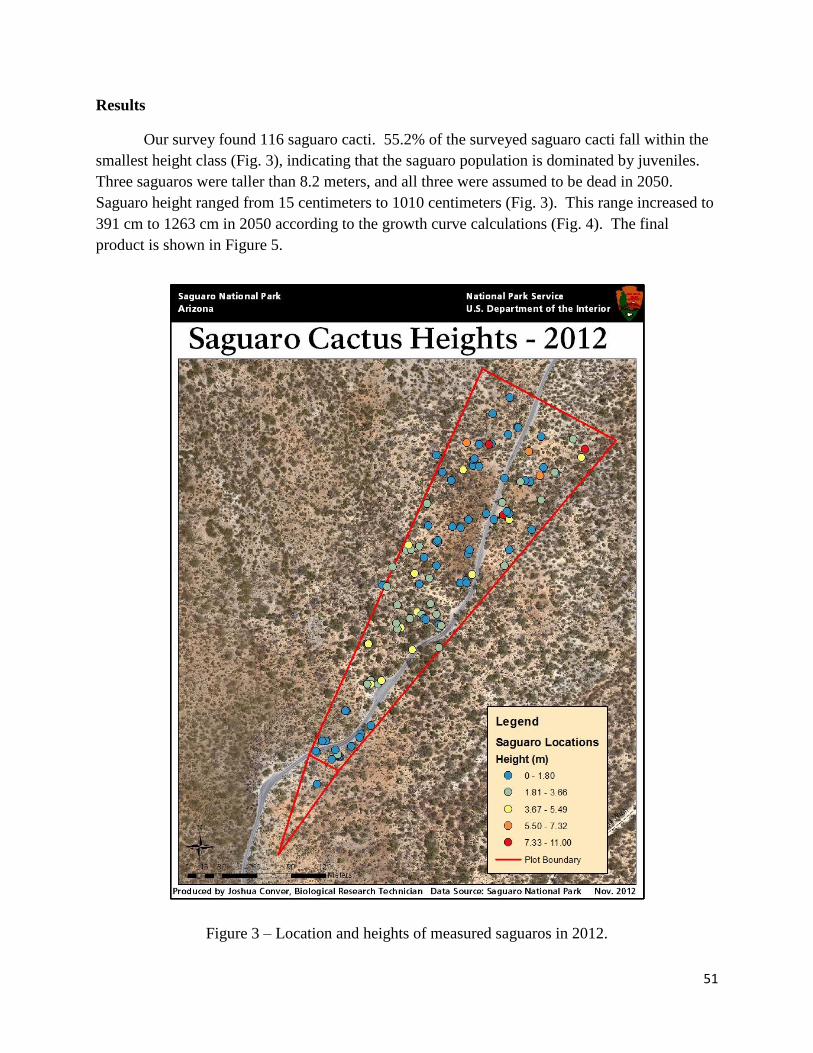
51
Results
Our survey found 116 saguaro cacti. 55.2% of the surveyed saguaro cacti fall within the
smallest height class (Fig. 3), indicating that the saguaro population is dominated by juveniles.
Three saguaros were taller than 8.2 meters, and all three were assumed to be dead in 2050.
Saguaro height ranged from 15 centimeters to 1010 centimeters (Fig. 3). This range increased to
391 cm to 1263 cm in 2050 according to the growth curve calculations (Fig. 4). The final
product is shown in Figure 5.
Figure 3 – Location and heights of measured saguaros in 2012.
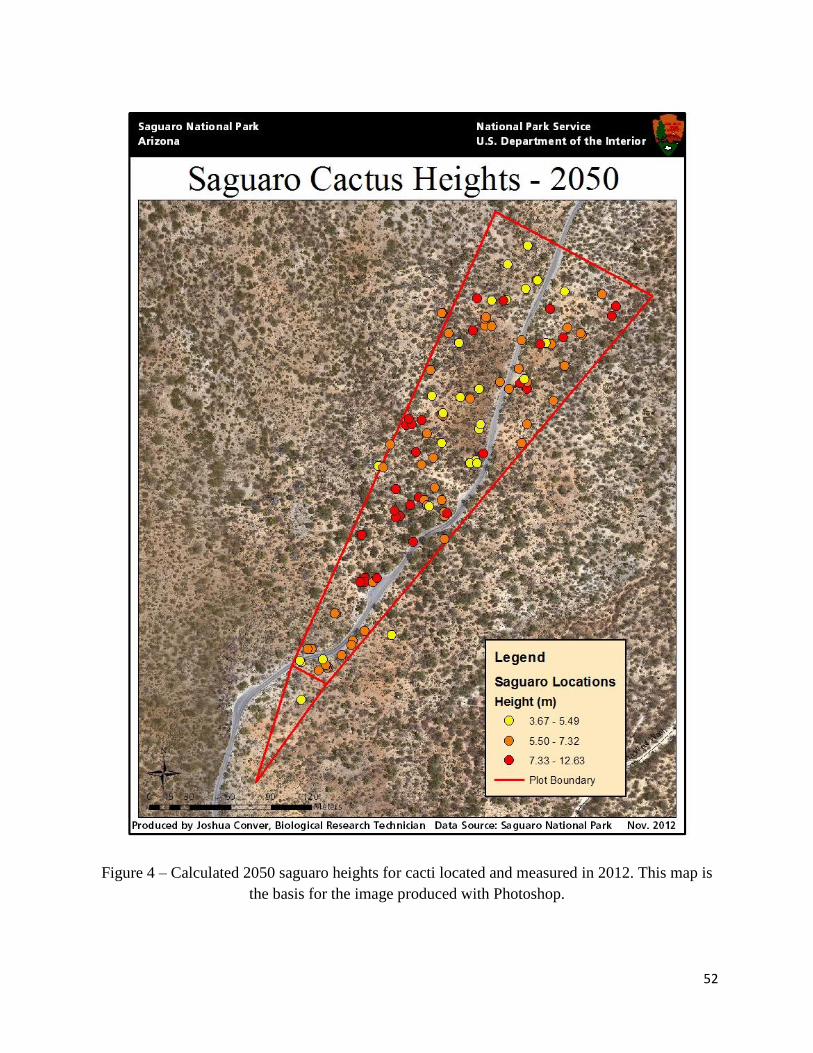
52
Figure 4 – Calculated 2050 saguaro heights for cacti located and measured in 2012. This map is
the basis for the image produced with Photoshop.
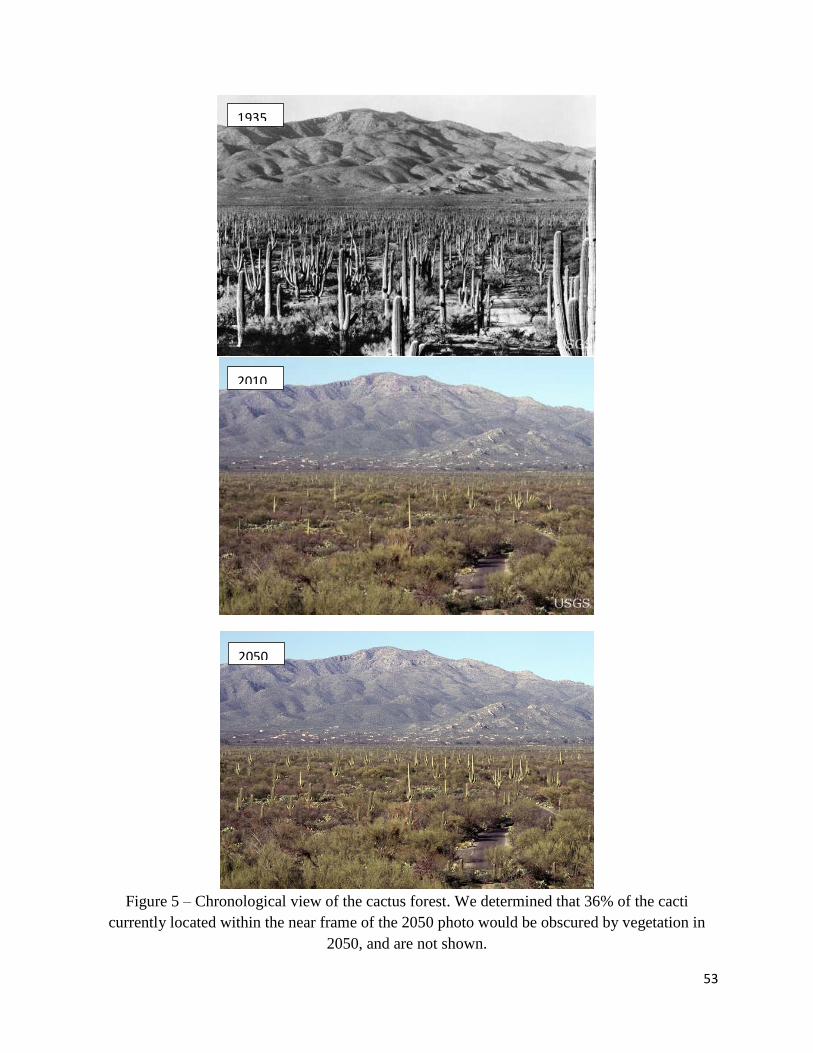
53
Figure 5 – Chronological view of the cactus forest. We determined that 36% of the cacti
currently located within the near frame of the 2050 photo would be obscured by vegetation in
2050, and are not shown.
1935
2010
2050

54
Discussion
The 2050 image shows a significant number of saguaro cacti will be visible above the
shrubs in the foreground compared to the 2010 image. The number of saguaro cacti will not
return to the 1935 level for some time, but the predicted 2050 image provides some indication of
what visitors can expect to see. The aesthetic quality of the Cactus Loop Drive is predicted to
increase, ensuring that future visitors to Saguaro National Park will enjoy the view of the cactus
forest. Technicians from Saguaro National Park should be encouraged to continue the repeat
photography on a regular basis to document the change in land cover and viewshed. Repeating
the photography project will also serve as a validation of the method presented. This method is
not recommended for locations that are subject to changes in physical terrain, such as steep
slopes, areas susceptible to erosion or other mass movement phenomenon, or drastic changes in
land use. The stability of this landscape and National Park Service protection add significant
confidence to the result.
Literature Cited
Abouhaidar, F. 1992. Influence of livestock grazing on saguaro seedling establishment. In C. P.
Stone and E. S. Bellatoni, editors. Proceedings of the Symposium on Research in Saguaro
National Monument, 23-24 January 1991. Southwest Parks and Monuments Association,
Globe, Arizona, USA.
McAuliffe, J.R. 1996. Saguaro cactus dynamics, p. 96-131 In W. L. Halvorson and G. E. Davis
[eds.], Science and ecosystem management in the National Parks. University of Arizona
Press, Tucson.
Niering, W.A., R.H. Whittaker, C.H. Lowe. 1963. The Saguaro: A population in relation to
environment. Science 142: 15-23.
Steenbergh, W. F., and C. H. Lowe. 1983. Ecology of the saguaro III: growth and demography.
USDS, National Park Service Scientific Monograph Series No. 17. Washington, D.C.
Swann, D.E., A.C. Springer, and K. O’Brien. 2011. Using citizen science to study saguaros and
climate change at Saguaro National Park. Park Science 28(1): 65-68.
Turner. R. M. 1992. Long-term saguaro population studies at Saguaro National Monument. In
Stone, C. P., and E. S. Bellantoni, eds. Proceedings of the symposium on research in
Saguaro National Monument. National Park Service, 1992.