the salinity signal of the shelf-deep ocean exchange in the swa: satellite observations
DESCRIPTION
The salinity signal of the shelf-deep ocean exchange in the SWA: Satellite observations. 1 Instituto Nacional de Investigacion y Desarrollo Pesquero, Argentina - PowerPoint PPT PresentationTRANSCRIPT

The salinity signal of the shelf-deep ocean exchange in the SWA: Satellite observations
Raul A. Guerrero1, Alberto R. Piola2,7, Harold Fenco1, Ricardo P. Matano3, Vincent Combes3, Yi Chao4,5,
Corinne James3, Elbio D. Palma6, Martin Saraceno7, and P. Ted Strub3
1 Instituto Nacional de Investigacion y Desarrollo Pesquero, Argentina2 Servicio de Hidrografıa Naval and Departamento de Ciencias de la Atmosfera y los
Oceanos, Universidad de Buenos Aires and UMI/IFAECI, CONICET, Argentina3 College of Earth, Ocean and Atmospheric Sciences, Oregon State, USA
4 Remote Sensing Solutions, Inc., Pasadena, California5oUniversity of California, Los Angeles, California, USA
6 Universidad Nacional del Sur and Instituto Argentino de Oceanografıa, Argentina7 Departamento de Ciencias de la Atmosfera y los Oceanos, Universidad de Buenos Aires,
and UMI/IFAECI, CONICET, Argentina
9th Aquarius/SAC-D Sc. MeetingSeattle, USA Nov. 2014

Mean SSS-Aquarius
L3 (v2.0) -SSS from Aquarius shows the main ocean-basin features of the South Atlantic, already proven since the early results of the mission.

Stand.Deviation of SSS-Aquarius
The export of shelf waters to the deep ocean near 35ºS creates the largest signal of SSS variability in the SA (south of the tropics).

SWA – Shelf / Deep-Ocean - SSSaq SWA – Shelf / Deep-Ocean – SSSin-situ
PPW Plata Plume Water
SASW Subant. Shelf Water
STSWSubtrop. Shelf Water
Deep ocean (>200m)upper 50m water

MESO-SCALE processestime scales weeks
Spatial scales 100 km
Remote SST
48° W60° W 50° W52° W54° W56° W58° W
32
° S
34
° S
36
° S
38
° S
• Kernel density estimator (K)• Gaussian function (k(z))
• Bandwidth = 0.75 (h)• L2 – weekly
• SSS range: 20 38• Grid size: 0.5 x 0..5
• Search Radius = 1° x 1° • Smoothing Factor = 0.001
A Challenge for Aquarius???Gridding technique:
Local polynomial
(Lilly and lagerloef (2008)
Individual polynomial adjustments every search radius; optimizing in its environment for a better representation of the local variation
Remote SSHRemote SSS

3 Weeks Weighted Moving Averange
(3WeMA)
42° W62° W 46° W50° W54° W58° W
28°
S32
° S
36°
S40
° S
42° W62° W 46° W50° W54° W58° W
28°
S32
° S
36°
S40
° S
42° W62° W 46° W50° W54° W58° W
28°
S32
° S
36°
S40
° S
25%(WEEK 1)
20-60-20%
25%(WEEK 3)
15-70-15%
50%(WEEK 2)
In either case SEAM TO BE IMPROVEMENTS in the error levels
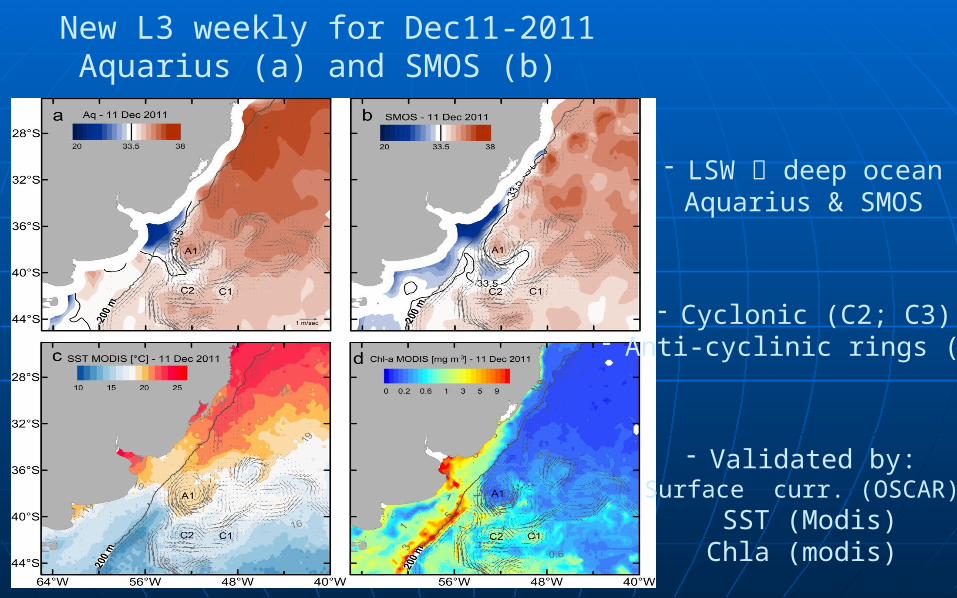
New L3 weekly for Dec11-2011 Aquarius (a) and SMOS (b)
- LSW deep oceanAquarius & SMOS
- Cyclonic (C2; C3)- Anti-cyclinic rings (A1)
- Validated by:Surface curr. (OSCAR)
SST (Modis)Chla (modis)

Time serie 27Nov-2011 / 1Jan-2012 Evolution of a Low SSS intrusion into the deep ocean
and tracking of warn-salty and cold-fresh rings

SSS variability along tracks(cross shelf break)
- FresherSpring-Summer
- Salty autumn and winter
Seasonal
LSW detrainments into the deep
ocean
Intra-seasonal
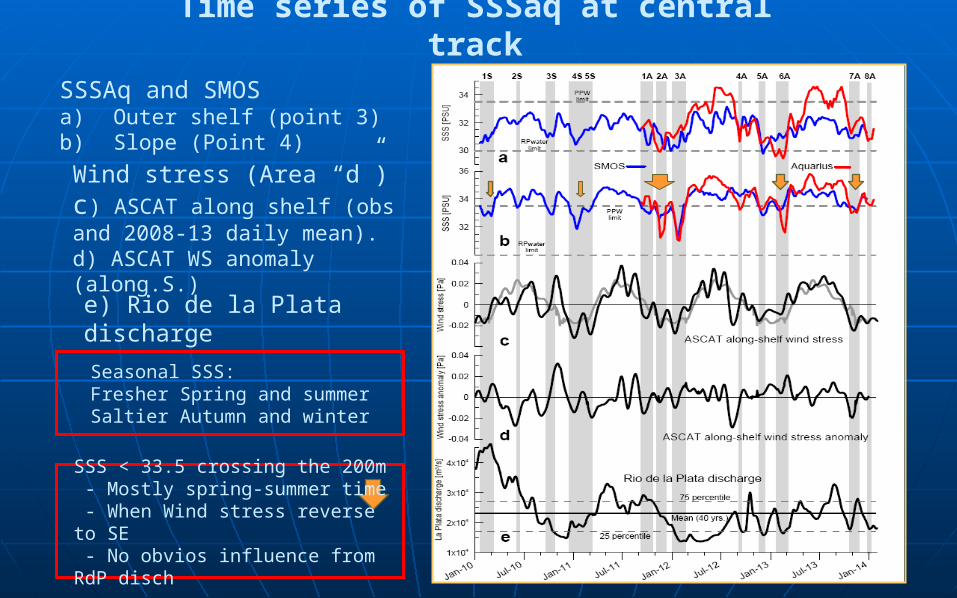
SSSAq and SMOSa) Outer shelf (point 3)b) Slope (Point 4)
Wind stress (Area “d”)c) ASCAT along shelf (obs and 2008-13 daily mean).d) ASCAT WS anomaly (along.S.)
e) Rio de la Plata discharge
Time series of SSSaq at central track
SSS < 33.5 crossing the 200m - Mostly spring-summer time - When Wind stress reverse to SE - No obvios influence from RdP disch
Seasonal SSS:Fresher Spring and summerSaltier Autumn and winter

Detrainment events (SSS<33.5 crossing 200m)
Aquarius
Track
Start date Weeks at 200m
SSS min
SSS mean
Event number
Overlapped SMOS
Northern (NT)
22 Nov 2011
4.2 33.1 33.4 2A 6S
3 Jan 2012
3.4 33.0 33.3 3A 7S
21 Aug 2012
5.0 32.3 33.0 4A 8S
8 Jan 2013 3.9 32.1 32.8 6A 10S
8 Oct 2013
7.0 31.6 32.7 7A 11S
17 Dec 2013
4.9 31.9 33.1 8A -
Central (CT)
08 Oct 2011
7.3 28.6 32.2 2A 5S
7 Jan 2012
7.7 30.4 31.8 3A 5S
17 Nov 2012
5.4 32.5 33.0 5A 9S
19 Jan 2013
8.1 30.6 32.4 6A -
19 Oct 2013
7.2 32.6 33.0 7A 11S
28 Dec 2013
2.6 32.5 33.0 8A -
Southern (ST)
1 Sep 2011
2.9 32.9 32.9 1A 5S
19 Nov 2011
6.5 31.1 31.9 2A 5S
14 Jan 2012
6.6 29.8 31.4 3A 5S
SMOSregion
Start date Weeks
S<33.5
SSS min
SSS mean
Event number
Overlapped Aquarius
Northern (point 6)
09 Feb 2010 3.7 33.0 33.2 1S -
07 May 2010
8.4 32.5 32.9 2S -
11 Aug 2010
16.0 32.1 32.9 3S -
12 Dec 2010
6.3 32.5 32.9 4S -
17 Sep 2011
6.0 32.5 33.0 5S 1A
22 Nov 2011
2.1 33.1 33.2 6S 2A
25 Dec 2011
3.7 33.0 33.3 7S 3A
12 Ago 2012
4.6 32.7 33.0 8S 4A
25 Nov 2012
2.6 32.8 33.1 9S -
22 Dec 2012
5.0 32.8 33.0 10S 6A
06 Sep 2013
11.4 32.7 33.0 11S 7A
Central (point 4)
19 Jan 2010 7.9 32.7 32.7 1S -
3 Jun 2010 2.6 33.1 33.1 2S -
19 Sep 2010
5.6 32.4 32.4 3S -
6 Dec 2010 15.0 31.7 31.7 4S -
5 Sep 2011 24.0 31.0 31.0 5S 6S 7S* 1A 2A 3A
13 Nov 2012
15.1 32.3 32.3 9S 5A
6 Sep 2013 11.9 32.6 32.6 11S 8A
Southern (point 2)
9 Feb 2010 4.1 32.8 33.2 1S -
10 Oct 2010 2.5 33.2 33.3 3S -
18 Dec 2010
13.7 31.0 32.2 4S -
2 Oct 2011 26.3 30.6 32.5 5S 6S 7S* 1A 2A 3A
16 Nov 2012
5.1 32.6 33.0 9S 7A

Summer mean SSSaq anomaly and dynamic topography
anomaly
LSW along the BMCObs: Gordon 1989Provost et al. 1996
Modelling: Palma et al. 2008
SSSaq and SmosLSW derives from RdlPDriven by the BMC and occurs mostly in late spring and summer.
Location ~ 37°S In agremment with
numerical simulations (Matano et al., 2014)

Winter SSS fields and anomalies (Smos and Aquarius)
Weaker detrainments
in SSS: - Fewer events- Under wind
reversal cond.
- NO RdlP discharge
influ.
Location: 27°S 35°S
also in agremment
with numerical
simulations (Matano et al., 2014)
Still intense Low Salinity (< -.5) into the deep ocean (in contrast
to Brazil Water) resulting in a warm variety of Shelf Waters (Gordon 1989; Piola et al., 2008)

Summary and ConclusionsAquarius and SMOS SSS capture the detrainment of
shelf waters into the deep ocean
The export of shelf waters near the RdlP causes the strongest salinity signal throughout the South Atlantic (south of 10°S)
The detrainments of low-salinity waters present a strong seasonal signal which is associated with the alongshore wind stress variability over the shelf: Summer 36-37°S; Winter 27-35°S
The low-salinity waters cause an extensive negative salinity anomaly whose core follows the path of the BMC
The general agreement with the numerical simulations and in situ observations indicate an outstanding overall performance of the satellite-based salinity sensors