the sand cone model revisited: the impact of service flexibility on
TRANSCRIPT
The Sand Cone Model Revisited: The Impact of Service Flexibility on Quality, Delivery, and Cost
Chao Wang
Department of Management Science and Operations London Business School
Email: [email protected] Phone: +44.(0)20.7000.8822 Fax: +44.(0)20.7000.8801
Andrea Masini
Department of Management Science and Operations London Business School
Email: [email protected] Phone: +44.(0)20.7000.8814 Fax: +44.(0)20.7000.8801
December 2009
Under 2nd round review: Production and Operations Management
Please do not cite or quote without the authors’ permission Abstract This study complements and extends the literature on service operations strategy by examining the relationship between the development of flexibility and the quality, delivery, and cost performance of service organizations. Using longitudinal data from 84 workshops belonging to a major vehicle repair company in the U.K., we assess the impact of building flexibility on the other competitive capabilities of the firm. Our results shed new light on the sand cone model and suggest that the nexus between flexibility and quality, delivery, and cost is more complex than has been hypothesized. First, the results demonstrate that tradeoffs between capabilities do exist: when companies add a new capability to an existing and well-consolidated base, they tend to sacrifice some of the capabilities already established. Second, the analysis indicates that the optimal capability-building sequence proposed by the sand cone model holds even when applied in reverse order: if constrained by resource scarcity, companies that need to add flexibility to their existing base start diverting resources, first from cost, then from delivery, whereas they do not let quality deteriorate. Finally, our results confirm that adding a new capability is more problematic for companies with high levels of ex-ante efficiency. However, our results also indicate that the impact of efficiency on the capability-building process is not homogeneous across capabilities. Keywords: Operations strategy; Flexibility; Service operations; Data Envelopment Analysis

2
1 Introduction
The ability of an organization to achieve operational excellence along multiple competitive
capabilities such as cost, quality, delivery, and flexibility simultaneously is increasingly regarded
as a source of competitive advantage. Initially developed in the field of manufacturing and
dubbed agility (D'Aveni and Gunther 1994; Yusuf, Sarhadi, and Gunasekaran. 1999), this concept
has recently attracted the attention of service management scholars as well (Menor, Roth, and
Mason 2001; Aranda 2003). Building on this literature, this paper aims to shed new light on the
process by which service companies achieve operational excellence along multiple competitive
dimensions, and on the impact that developing capabilities to handle output variations has on
cost, quality, and delivery performance.
Whilst the importance of agility is widely recognized in the literature (Anand and Ward
2004; Narasimhan, Swink, and Kim 2006), it has also been suggested that the existence of
tradeoffs prevents firms from developing different competitive capabilities simultaneously
(Hayes and Wheelwright 1984). Researchers have dedicated considerable attention to studying
these tradeoffs and to identifying strategies to overcome them. The sand cone model (Ferdows
and De Meyer 1990; Noble 1995) and the competitive progression theory (Roth 1996) argue that,
to become excellent along multiple dimensions, companies should develop capabilities in a pre-
specified sequence. The capability-building process can be visualized as a sort of pyramid in
which each capability constitutes the foundation for the development of the next. Before
addressing new competitive priorities, firms need to be sure that the operational competencies
supporting the capabilities already developed are fully codified into organizational routines, and
sufficiently ingrained in the organization to guarantee stable and consistent performance along
the required dimensions. That is, firms must consolidate the capabilities at the base of the
3
pyramid before adding those situated near the top (Nakane 1986; Ferdows and De Meyer 1990;
Rosenzweig and Roth 2004).
One assumption underlying this perspective is that the firm’s existing capabilities (i.e., the
base of the pyramid, henceforth referred to as the existing capabilities base) will support the new
capability being added, without being weakened by it. Not surprisingly, when organizations
identify a new competitive priority, they devote attention primarily to the development of the
competencies required to sustain it, presuming that the existing capabilities base will not be
weakened by this effort. Yet, it may be difficult to build new capabilities without influencing the
ones already acquired, because the emergence of new competitive priorities may divert scarce
critical resources from established capabilities.
This risk becomes particularly relevant for those capabilities that are situated at the top of
the pyramid, such as flexibility. Flexibility, i.e., the ability to rapidly handle output variations
swiftly and with minimal disruptions, is a fundamental source of competitive advantage in
turbulent markets (de Groote 1994). Its importance is even greater in a service context, because
the highly heterogeneous nature of customer demand creates additional sources of variability as
compared to a manufacturing environment (Frei, Kalakota. Leon, and Marx 1999; Frei 2006).
Not surprisingly, research has sought to determine whether and how flexibility interacts with the
other capabilities (White 1996). Yet, so far, scholars have analyzed primarily the question of how
the development of flexibility may be facilitated by existing capabilities, but they have not fully
investigated the consequences that this quest for flexibility may have on the competitive
capabilities that have been already developed and consolidated.
This paper aims to shed light on this issue. Building on extant theory and using empirical
observations, our study addresses three specific research questions: (1) What is the impact of
handling output variations on preexisting capabilities such as quality, delivery, and cost?, (2) Is

4
the impact more significant for some of these capabilities?, and (3) Is the impact contingent on
the efficiency level of the organization (i.e., is the development of flexibility more difficult for
organizations with limited resource slack)?
To answer these questions, we analyze longitudinal data from 84 workshops belonging to a
vehicle repair company in the U.K. Using Data Envelopment Analysis and hierarchical
regressions, the paper sheds new light on the nexus between flexibility and the other competitive
capabilities. First, we show that some tradeoffs between quality, delivery, cost, and flexibility do
exist, even when flexibility is developed after the other capabilities are fully consolidated.
Second, we shed new light on the validity of the sand cone model. We demonstrate that the
resource reallocation process associated with the development of flexibility affects cost, delivery,
and quality to different degrees and that it follows the sand cone sequence in reverse order. Cost
is the capability most affected by the development of flexibility, followed by delivery, then
quality. Finally, the paper also makes a methodological contribution by proposing a method for
measuring capabilities that is based on objective data rather than on perceptual measures.
The remainder of the paper is organized as follows. Section 2 reviews the literature. Section
3 discusses the impact of flexibility on the other competitive capabilities and proposes testable
hypotheses. Sections 4 and 5 describe the methodology and present our results. Section 6
concludes with a discussion of the limitations and suggested directions for future research.
2 Theoretical background
2.1 Competitive capabilities, the sand cone model, and service agility
The simultaneous mastery of quality, delivery, cost, and flexibility defines an agile
organization (Hayes and Wheelwright 1984; Menor et al. 2001), and is often regarded as a
necessary condition for achieving competitive advantage. In spite of the clear advantages that

5
agility brings, however, it is extremely difficult for companies to become excellent along
multiple competitive dimensions at the same time. When resources are limited, the dispersion of
investments across various capabilities may cause firms to lack focus, waste scarce resources,
and ultimately remain inferior in every dimension (Skinner 1974; Hayes and Wheelwright 1984).
Most of the literature addresses the question of how to build new capabilities, but it
somehow neglects the issue of how to preserve the ones already acquired. The cumulative model
(Noble 1995) proposes effective guidelines for the building of multiple capabilities. Originally
introduced by Nakane (1985), this model proposes that companies should develop capabilities
not just sequentially, but according to a predetermined sequence, because the generation of a new
capability will be impossible unless a minimum level of the preexisting capabilities is first
achieved. The original formulation, based on the analysis of Japanese manufacturing firms,
suggests that quality is the basis for the development of every other capability, followed by
dependability (i.e., delivery). In turn, quality and dependability serve as preconditions for the
achievement of cost efficiency. Finally, flexibility can be developed only when the previous three
capabilities have been fully established.
Further support for the cumulative model is provided by several follow-up studies
(Ferdows, Miller et al. 1986; Ferdows and De Meyer 1988; De Meyer, Nakane et al. 1989). In
their seminal paper, Ferdows and De Meyer (1990) extend the original idea by depicting the
capability building process as a sand cone, in which the capabilities already established by a firm
constitute the basis for its acquisition of subsequent capabilities. This model differs from the
cumulative model in that it places cost efficiency as the last capability in the sequence.
Conclusive empirical support for the idea that some capabilities serve as the necessary
foundation for the establishment of new capabilities was provided by Rosenzweig and Roth
(2004), who formalize the mechanism into the competitive progression theory (CPT). In spite of

6
their slight differences, all the studies in this area clearly identify quality, delivery, cost efficiency,
and flexibility as key competitive capabilities and suggest that they should be built step by step
in a precise order. The prescribed order, however, differs among the various theories.
The majority of the empirical studies thus far have attempted to establish whether
possessing certain levels of the first capabilities in the sequence facilitates the acquisition of
subsequent capabilities. More limited attention has been paid, however, to the question of
whether the acquisition of a new capability reinforces or hampers the capabilities that have
already been built. This is a significant gap: due to resource scarcity (Mahoney and Pandian
1992), acquiring new competencies and shifting the focus to new competitive priorities may
divert resources and management attention from the existing capabilities base. While the
focused-factory perspective suggests that due to “inevitable limitations of equipment and process
technology […] a factory cannot perform well on every yardstick” (Skinner 1974, p. 115), in
today’s hypercompetitive markets, focusing on a single capability may no longer be a viable
option (Flynn and Flynn 2004). Increasing levels of rivalry oblige firms to become excellent
along multiple competitive dimensions simultaneously (Boyer, Ward, and Leong 1996). In the
service sector, the need for agility has induced companies to devise various approaches to break
some of these tradeoffs (Frei 2006). Nevertheless, the risks and tradeoffs described by the
proponents of the focused-factory perspective cannot be completely ruled out, even when
companies build capabilities in accordance with the sand cone sequence. Firms desiring to attain
agility must therefore be able to assess whether the development of a new capability will affect
the capabilities that they have already developed, as well as which, among these capabilities, will
be most affected. The likelihood that the efforts for the acquisition of a new capability will have
an impact on existing capabilities is especially great when the capability to be acquired is
situated at the top of the sand cone. This is the case for flexibility.

7
2.2 Flexibility in service operations
Flexibility has been generically defined as the ability of an organization to effectively
handle uncertainty in its operational environment (Koste and Malhotra 1999). Although different
aspects of the construct have also been emphasized in the literature, depending on the nature of
the environmental uncertainty requiring flexibility (Gerwin 1993; Browne, Dubois et al. 1984;
Sethi and Sethi 1990;Vokurka and O'Leary-Kelly 2000; D'Souza and Williams 2000), for the
purposes of this paper we refer to flexibility as volume flexibility. This type of flexibility is
required to address uncertainty in demand quantity, i.e., variations in the volume of output. It
represents “the ability of an organization to change volume levels in response to changing socio-
economic conditions profitably and with minimal disruptions” (Jack and Raturi 2003, p. 519).
In addition to recent efforts to conceptualize and operationalize the construct, the
operations management literature has also focused attention on flexibility in relation to its impact
on organizational or operational performance (Swamidass and Newell 1987; Fiegenbaum and
Karnani 1991; Parthasarthy and Sethi 1993). Although numerous studies have addressed the
question, a consensus has not yet been reached. Some scholars argue that there is a direct link
between flexibility and performance (Swamidass and Newell 1987; Gupta and Somers 1996;
Vickery, Droge, and Markland 1997). Flexibility was found to directly improve growth in return
on equity, sales, and return on sales in Swamidass and Newell’s (1987) study. Kekre and
Srinivasan (1990) have also found the positive impact of product line breadth on market share
and profitability. Other studies, however, have found that the relationship between flexibility and
performance is not direct, but rather dependent on certain moderating factors, such as
organizational attributes (Fiegenbaum and Karnani 1991), technology (Vokurka and O’Leary-
Kelly 2000), and environmental variables (Ward et al. 1995).
In an attempt to shed further light on the value of flexibility, other studies shift the focus of

8
the analysis to the interaction between flexibility and other capabilities. The cumulative and sand
cone models emphasize the importance of coordinating flexibility with quality, delivery, and cost
to achieve agility (Noble 1995; Menor et al. 2001; Yusuf et al. 1999; Nakane 1986). These
studies suggest that the first three of these capabilities provide the necessary foundation for the
subsequent establishment of flexibility (Nakane 1986; Ferdows and De Meyer 1990).
Previous studies, however, have not considered whether adding flexibility affects quality,
delivery, and cost after these capabilities have been built and consolidated, nor have they
examined whether or not this impact changes with the degree of efficiency of an organization.
The tradeoff argument implicitly suggests that the development of a new capability should be
more difficult for organizations that are closer to the efficiency frontier. Yet, to our knowledge,
the role of efficiency and resource slack in the capability building process has been somehow
overlooked by the literature. The literature reviewed above indicates that the nexus among
flexibility, other capabilities, and performance is complex and deserves further investigation. The
review also reveals that most of the empirical studies in this field use perceptual measures to
assess capabilities. A validation of the above findings using objective measures would therefore
represent another useful contribution.
3 Hypotheses
3.1 Direct impact of flexibility on quality, delivery, and cost
The tradeoff hypothesis that is at the core of the focused factory paradigm implies the
existence of a negative relationship between flexibility and the other capabilities. We argue that,
even when companies build capabilities according to the sand cone model sequence, the presence
of tradeoffs cannot be completely ruled out. The ability to accommodate rapid and unpredictable
changes in demand with minimal disruptions provides evidence of flexibility. Yet, as service

9
firms creating buffers is not an option, rapid changes in demand can only be addressed through
correspondingly rapid variations in the output level. In turn these variations cause fluctuations in
the level of utilization of resources and may negatively affect quality, delivery, and cost.
There are economic factors underlying this negative relationship. For instance, addressing
changes in the output level affects cost through several mechanisms. A first mechanism pertains
to the changes in the equipment required to achieve flexibility. Firms can address changes in the
aggregate level of demand by investing in flexible equipment. However, flexible technologies are
usually more expensive to acquire (Gaimon and Singhal 1992). To build flexibility, firms can
also allocate additional resources to the development of extra capacity. However, since excess
resources can only be used for closely related activities (Hoskisson and Hitt 1990), when demand
decreases, excess resources remain idle and also cause a concomitant increase in operating costs.
A second economic mechanism pertains to the impact of flexibility on labor expenses. In a
service environment, as a result of the non-repetitive nature of the tasks and of the customers co-
participation in the process, changes in the volume of output are often associated with changes in
the type of output. Therefore, organizations willing to develop volume flexibility often need to
acquire asset and capabilities to deal with mix flexibility as well. They need multi-skilled
employees (Boyle, Kumar, and Kuman 2006), who are usually more expensive to recruit and to
train. Finally, increases in flexibility have been found to cause an increase in operational
complexity, which is also a source of cost (Salvador, Rungtusanatham, Forza, and Trentin 2007).
Delivery performance is also negatively affected by increases in the output volume. Well-
known results from queueing theory suggest that waiting time increases more than linearly when
server utilization increases. In a service environment, this effect is further amplified by the
limited tolerance that human operators display for work overload (Glaser, Tatum, Nebeker,
Sorenson, and Aiello 1999). Even output reductions may cause deterioration in performance, if

10
they occur frequently. Continuous changes in utilization result in process variability, which is a
determinant of poor quality (Oakland 1996). The operations literature identified other negative
consequences of these variations, including an increase in costs due to frequent production
overages or underages (Lee and Yano 1988) and unreliable delivery (Avram and Wein 1992).
There are also cognitive mechanisms suggesting that coping with output variations may
have a negative impact on the other competitive capabilities of the firm, particularly in a service
environment. Due to the non-repetitive nature of services, dealing with demand spikes causes
increases in the degree of task complexity and task variety (Dunk 1995). These increases have
negative consequences for both quality and delivery performance. Task complexity has been
found to affect task performance directly (Campbell 1988) and also indirectly through its impact
on perceived complexity (Maynard and Hakel 1997), which reduces workers’ motivation and
self-efficacy (Gist and Mitchell 1992). Task variety causes process variability too, which has
been recognized by the TQM literature as a barrier to quality (Oakland 1996); it also requires
operators with greater cognitive ability, as they must search for more efficient strategies for
successful task execution. When this ability is not present, increased task variety may lead to
more errors and affect either quality or delivery performance. On the one hand, if not quickly
discovered and properly fixed, errors are transferred to the costumer, with a consequent
deterioration of perceived quality. On the other hand, fixing defects reduces the deterioration of
quality performance, but the process requires extra time and affects dependability. Some of these
effects may be attenuated if flexibility is built after the other capabilities have been consolidated,
but they cannot be completely disregarded. We therefore propose the following hypotheses:
H1: Handling changes in output volume is associated with an increase in operating costs.
H2: Handling changes in output volume is associated with a decrease in delivery timeliness.
H3: Handling changes in output volume is associated with a decrease in service quality.

11
3.2 Differences in the magnitude of impacts
The impact of building flexibility on quality, delivery and cost is expected to differ across
capabilities, because the consequences of the resource reallocation process may not necessarily
be the same for all capabilities. Firms should therefore decide which capabilities they are willing
to let deteriorate to facilitate the development of new competitive strengths. We expect that firms
would choose either the capabilities judged the least important from a competitive standpoint, or
those less likely to be affected by the resource reallocation process. We also expect that, to
identify these capabilities, firms apply the sand cone sequence in the reverse order, either
deliberately or unintentionally.
A first argument underlying this idea considers that firms apply the sand cone sequence in
the reverse order deliberately. Competitive capabilities have been defined as “the firm’s actual,
or ‘realized,’ competitive strengths relative to primary competitors in its target markets”
(Rosenzweig and Roth 2004, p. 354). As the capabilities at the base of the pyramid support all
the other capabilities, dismantling them will also threaten the capabilities lying on this
foundation and built after them. Therefore, rational firms are expected to purposely subtract
resources first from the competitive strengths that they deem the least important in their target
market, i.e., the capabilities near the top of the sand cone, such as cost. Conversely, they would
subtract resources from the capabilities at the base of the pyramid (i.e. quality) only if no extra
resources are available even after cost or delivery have been already sacrificed to the purpose.
Another perspective supports this hypothesis. Over time, the tacit knowledge and the
operational competencies that underlie each competitive capability get consolidated, i.e., they are
codified, made explicit, and eventually embedded into organizational routines that facilitate their
retention (Nonaka and Tekeuchi, 1996). Therefore, even if a firm subtracts resources evenly from
all the capabilities in its base, the capability with the greatest degree of consolidation will be the
12
one least affected by the resource reallocation process. If capabilities are developed progressively,
the degree of consolidation will be higher for older capabilities, i.e., those lying at the bottom of
the pyramid. Therefore, if quality, delivery, and cost are developed in accordance to the sand
cone model sequence, quality will be the capability with the greatest degree of consolidation and
the one least affected by a shift in resources, followed by delivery, and then cost. Based on the
above arguments, we propose the following hypotheses:
H4: Handling changes in output volume has a greater negative impact on cost than on delivery timeliness.
H5: Handling changes in output volume has a greater negative impact on cost than on service quality.
H6: Handling changes in output volume has a greater negative impact on delivery timeliness than on service quality.
3.3 Moderating effect of resource slack
The focused factory hypothesis suggests that firms face tradeoffs between different
competitive priorities when they operate on, or close to, the efficient frontier (i.e., when they
have no resource slack). Ceteris paribus, the presence of slack helps firms develop the
organizational competencies required to support the new competitive capability without
subtracting resources from the existing capabilities base. For instance, the increased number of
quality problems induced by higher variability can be fixed ex-post if extra time is available,
before they are transferred to customers. Without slack, the additional workload caused by
quality problems increases server utilization and negatively affects delivery performance.
However, if idle resources are available, the extra work required to fix problems ex-post may not
necessarily produce delays. Resource slack also has some indirect effects on the relationship
between flexibility and quality and delivery and cost performance, for instance, by reducing the
negative impact of task variety and task complexity on task performance (Dunk 1995).

13
Although the sand cone model implies that even efficient firms can minimize the impact of
tradeoffs if they follow the appropriate capability-building sequence, the role of resource slack
remains important even when firms build capabilities according to the sand cone sequence. We
argue that resource slack moderates the relationship between flexibility and quality and delivery
and cost and that the moderating effect is different for each of the three capabilities. That is, we
expect that addressing output variations has different consequences for quality cost and delivery
performance, depending on the degree of ex-ante efficiency of the organization.
Firms with great amounts of resource slack (i.e., firms with low levels of ex-ante efficiency)
can afford the development of a new capability without diverting resources from their existing
base. For these firms, the additional resources required to build the new capability would not
necessarily be subtracted from those supporting the existing base. They could be made available
through efficiency improvement efforts conducted ex-ante, i.e., before the development of the
new competitive priority. Thus, it is unlikely that their cost, delivery, or quality performance are
affected by the development of flexibility.
Conversely, firms with moderate amounts of resource slack will have to divert at least some
of the resources already allocated to other capabilities for the development of flexibility, because
resources in excess are typically insufficient to achieve this goal. Thus, some capabilities in their
existing base, although not all of them, will be affected. Consistent with what discussed above,
we expect the capabilities near the top of the sand cone to be the ones most significantly affected,
either because judged the least important competitive strengths, or because the degree of
consolidation of the underlying organizational competencies is not sufficiently high.
Finally, efficient firms with no resource slack at all are forced to divert resources not only
from the less important capabilities but also from the capabilities at the bottom of the sand cone,
such as quality. Thus, we not only expect the relationship between ‘flexibility and quality’ and

14
‘delivery and cost’ to depend on the degree of ex-ante efficiency; we also expect the negative
impact of addressing output variations on quality, delivery, and cost to be more significant for the
capabilities closer to the base of the sand cone. We therefore propose the following hypotheses:
H7: The moderating effect of resource slack on the relationship between output changes and delivery is stronger than the moderating effect of resource slack on the relationship between output changes and cost.
H8: The moderating effect of resource slack on the relationship between output changes and
quality is stronger than the moderating effect of resource slack on the relationship between output changes and cost.
H9: The moderating effect of resource slack on the relationship between output changes and
quality is stronger than the moderating effect of resource slack on the relationship between output changes and delivery.
4 Methods
4.1 Research setting
We tested the research hypotheses by using longitudinal data collected from a vehicle
repair company (hereafter referred to as ServCo) that operates through a network of 84
workshops in the UK (Table 1). Originally established as a subsidiary of a large telecom operator
(hereafter referred to as TechCo) to manage its fleet, ServCo recently revised its business model
and decided to provide services to outside organizations and private customers as well.
<< Insert Table 1 about here >>
ServCo’s workshops were an ideal research setting for our study. After developing the first
three competitive capabilities in accordance with the sand cone model prescription (quality,
delivery, then cost), the company was forced to increase the flexibility of its operations to
respond to the new business mandate. Quality (i.e., the ability to correctly repair a vehicle) and
then delivery were identified as the most important competitive priorities for ServCo, since its
inception. In the high-margin telecom sector, the opportunity cost of idle vehicles for TechCo

15
was extremely high (vehicles failing the Ministry of Transport Roadworthiness test were denied
permission to circulate and could not be used by TechCo). This pressure led ServCo to develop
operational skills in the area of quality management and delivery. When competition increased,
the ability to control cost also became an important priority. As ServCo is a subsidiary of TechCo,
its wages are in line with the telecom sector and are higher than that of other vehicle repair
companies. To compensate for these higher wages, the company was obliged to develop an
outstanding ability to control non labor-related costs.
To profit from its quality reputation, and to compensate for its higher wages the company
decided to target the more lucrative market of private external customers. Quality and delivery
remained important competitive priorities under this new mandate (to recoup its higher wages,
ServCo is obliged to charge higher prices than its direct competitors and must therefore
guarantee extremely high service standards in terms of quality and delivery to justify these
higher prices). At the same time, in this new environment service flexibility has also become an
important competitive priority. The new business mandate that requires ServCo to manage
vehicles both from TechCo and from external customers significantly increased the variety of
customers and caused large demand fluctuations.
After some discussions with ServCo, we decided to analyze the period comprised of the
time between first quarter 2006 and first quarter 2007. This specific window was chosen because
the company suggested the changes required to respond to the new business mandate (extension
of service to external customers) were mostly felt during that period. Accordingly, ServCo
provided access to two data sets with detailed information on all the jobs completed in each of its
84 workshops during two time intervals. The first data set included workshop-level statistics for
all the jobs completed between January 1, 2006, and March 30, 2006, which was representative
of the pre-flexibility environment. The second data set included workshop-level statistics for all

16
the jobs completed between January 1, 2007, and March 30, 2007 and was representative of the
new environment with flexible operations. The data sets were extracted from ServCo’s IT system
and validated by the company management (the data used for this study was also used to
compute quarterly performance indicators presented to the executive committee). Descriptive
statistics of the workshop operations are displayed in Table 2.
<< Insert Table 2 about here >>
4.2 Operationalization of variables
4.2.1 Competitive capabilities
With few exceptions (Upton 1997), management scholars have mostly relied on perceptual
variables to measure competitive capabilities. To overcome some of the limitations of perceptual
measures (Milliken 1987; Vokurka and O'Leary-Kelly 2000), in this study we use an objective
approach to the measurement of competitive capabilities. Changes in the quality, delivery, and
cost capabilities were operationalized as changes occurred in the quality, delivery, and cost
indicators between Q1 2006 and Q1 2007. Quality was measured as the percentage of Large
Goods Vehicles passing the heavy Roadworthiness test carried out in Department of Transport
test stations (the most important quality indicator for ServCo). Delivery performance was
measured as the percentage of jobs completed on-time (a job is considered on-time if the vehicle
is returned to the customer no later than 30 minutes after the quoted due date/time). Changes in
the cost capability were measured as changes in total material cost, total labor cost,
accommodation charges and other overheads after adjusting for inflation and location. The
adjustment was necessary, especially for labor-related expenses. As ServCo offers more generous
wages to employees working in expensive areas, workshops located in these expensive areas
could display efficiencies spuriously reduced by this wage effect. Changes in labor cost were

17
adjusted for changes in the average earnings per head at the county level (minimum level of
disaggregation at which these statistics were available from UK National Statistics). Likewise,
changes in material cost were adjusted to take into account changes in the consumer price index
for vehicle spares (also available from UK National Statistics).
Flexibility was conceptualized as volume flexibility (Sethi and Sethi 1990; Jack and Raturi
2003), i.e., as the ability of a workshop to modify its output level from time t to time t+1
profitably and with minimal disruptions. Accordingly, flexibility was measured through changes
in the average output of each workshop from Q1 2006 to Q2 2007 after controlling for
profitability changes. Changes in total revenue from sales could effectively be used as a valid
measurement for this variable, after adjusting for exogenous changes in the economic
environment of each geographical area.
4.2.2 Multidimensional efficiency The test of hypotheses 7, 8, and 9 (moderating impact of resource slack) required the
computation of multidimensional efficiency ratios, which reflect the capacity of a workshop to
provide high-quality services with the shortest delay using the minimum amount of resources. To
this end, we used Data Envelopment Analysis (DEA) (Boussofiane, Dyson, and Thanassoulis.
1991). We employed an output-oriented model in which the inputs were held constant and the
efficiency ratios were determined by the extent to which the outputs could be improved to reach
maximal efficiency (Frei and Harker 1999). The optimization problem was formulated as follows:
03
10M rjr r yax ∑ ==Ω μ (1)
subject to: νxj0 = 1,
njxy jrjr r ,...,1,003
1=≤−∑ =
νμ
- μr ≤ -ε, r = 1, 2, 3
18
where yrj is the amount of output r from workshop j; xj is the amount of input to workshop j; μr is
the weight given to output r; ν is the weight given to input; n is the number of workshops; and ε
is a small positive number. We used three variables as output measures; in addition to the quality
and delivery measures described above (percentage of large goods vehicles passing the Ministry
of Transport test first time and percentage of jobs completed on-time), total revenue from sales
was also included as an output to account for the total amount of work completed. The same four
major expenses used to measure cost were used as inputs, i.e., total material cost, total labor cost,
accommodation charges, and other overheads.
4.2.3 Control variables
We used three control variables in the model. First, as economies of scale could make
larger workshops more efficient regardless of their inherent capability level, we controlled for
workshop size (measured by the number of full time technicians working at each site). Second,
we controlled for the percentage of business originating from non-recurrent customers (named
percentage of external trade by ServCo). This control was necessary because changes in this
variable could also cause changes in the complexity of tasks (and hence in cost, quality, and
delivery performance). Finally, in order to tease out the performance changes induced by output
variations, we controlled for changes in the degree of profitability of each workshop. Pearson
correlations for the regression variables are displayed in Table 3.
<< Insert Tables 3 >>
4.3 Econometric models and analysis
To assess the impact of output variations on quality, delivery, and cost, we first estimated
the general models:
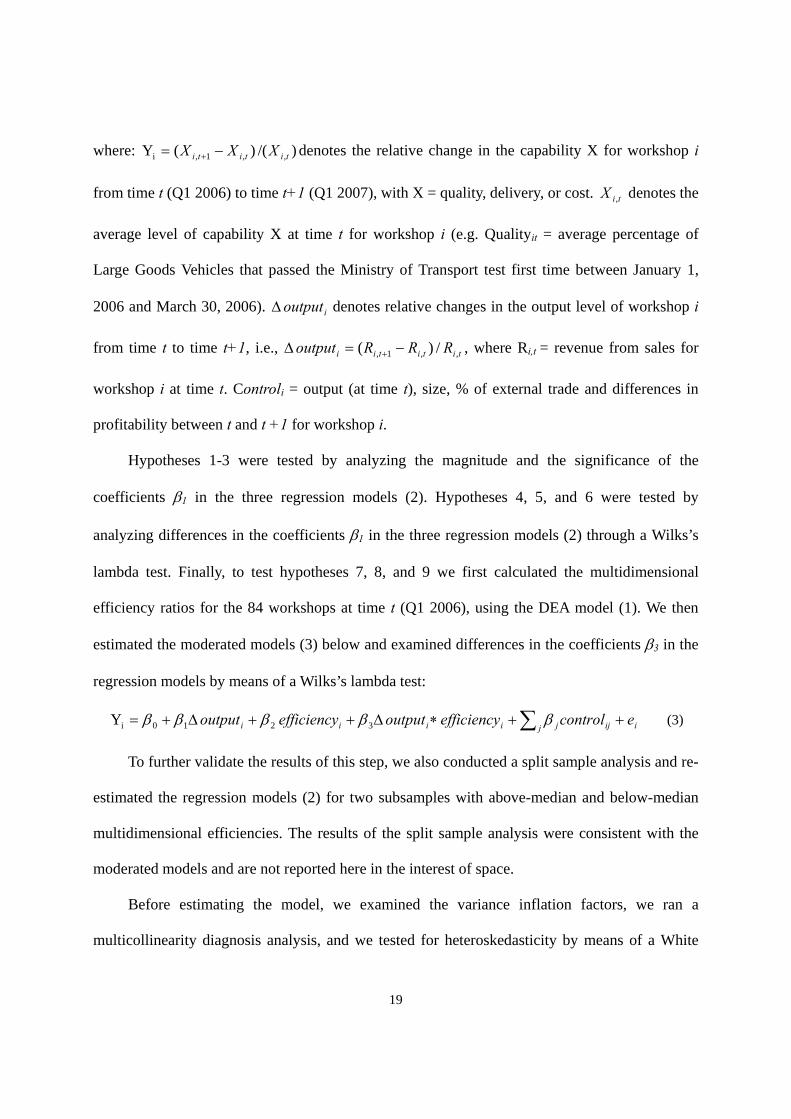
iijj ji econtroloutput ++Δ+= ∑ βββ 10iY (2)
19
where: )/()(Y ,,1,i tititi XXX −= + denotes the relative change in the capability X for workshop i
from time t (Q1 2006) to time t+1 (Q1 2007), with X = quality, delivery, or cost. tiX , denotes the
average level of capability X at time t for workshop i (e.g. Qualityit = average percentage of
Large Goods Vehicles that passed the Ministry of Transport test first time between January 1,
2006 and March 30, 2006). ioutputΔ denotes relative changes in the output level of workshop i
from time t to time t+1, i.e., tititii RRRoutput ,,1, /)( −=Δ + , where Ri,t = revenue from sales for
workshop i at time t. Controli = output (at time t), size, % of external trade and differences in
profitability between t and t +1 for workshop i.
Hypotheses 1-3 were tested by analyzing the magnitude and the significance of the
coefficients β1 in the three regression models (2). Hypotheses 4, 5, and 6 were tested by
analyzing differences in the coefficients β1 in the three regression models (2) through a Wilks’s
lambda test. Finally, to test hypotheses 7, 8, and 9 we first calculated the multidimensional
efficiency ratios for the 84 workshops at time t (Q1 2006), using the DEA model (1). We then
estimated the moderated models (3) below and examined differences in the coefficients β3 in the
regression models by means of a Wilks’s lambda test:
iijj jiiii econtrolefficiencyoutputefficiencyoutput ++∗Δ++Δ+= ∑ βββββ 3210iY (3)
To further validate the results of this step, we also conducted a split sample analysis and re-
estimated the regression models (2) for two subsamples with above-median and below-median
multidimensional efficiencies. The results of the split sample analysis were consistent with the
moderated models and are not reported here in the interest of space.
Before estimating the model, we examined the variance inflation factors, we ran a
multicollinearity diagnosis analysis, and we tested for heteroskedasticity by means of a White

20
test and an examination of the plot of residuals. No evidence of multicollinearity or
heteroskedasticity was found in the data. All variance inflation factors were below 2, correlation
coefficients indicated no signs of multicollinearity. The hypothesis of homoskedastic errors could
not be rejected. All models were therefore estimated using ordinary least squares regressions in
the interest of maximizing the efficiency of the estimators.
5 Discussion of results
First, it is interesting to discuss the average changes that occurred in ServCo’s operations
from Q1 2006 to Q1 2007. In this time interval, the workshops faced an increase in both their
average delivery and average quality performance, with the latter being particularly significant.
The operational capabilities developed by ServCo in these two areas were well consolidated and
remained particularly effective. Conversely, in the same period, the company faced an increase in
overall cost (despite a slight decrease in the volume of output), and a decrease in both overall
efficiency and profitability. Apparently, despite the efforts undertaken to improve the efficiency
of operations (a series of operational improvement programs were launched right after the
decision to accept external customers), the company could not fully manage the disruptions
generated by the new business model. It is also worth noting that the trends observed are
consistent with our hypothesis that companies—faced with tradeoffs among capabilities—decide
(or are able) to preserve only the capabilities at the bottom of the sand cone.
The results of the hierarchical regressions assessing the relationship between flexibility and
the existing capability base are reported in Table 4. The direct models (2) provide strong support
for hypotheses 1 and 2 but no support for hypothesis 3. Coping with variations in the volume of
output determined an increase in operating costs, a deterioration of on-time delivery performance,
but no statistically significant changes in service quality.

21
<< Insert Table 4 about here >>
The Wilks’s lambda test used to assess differences in the magnitude of the flexibility
coefficients provided strong support for hypotheses 4 and 5 (F = 9.96 with p < 0.01 and F = 4.30
with p = 0.04, respectively) and no support for hypothesis 6 (F = 1.03, p = 0.31). The
standardized regression coefficients indicate that modifying the volume of output by one
standard deviation increased cost by 0.57 standard deviations, but caused a decrease of only 0.28
standard deviations in the percentage of vehicles delivered on-time and a decrease of 0.17
standard deviations in the percentage of vehicles that passed the MOT test first time. Everything
else being equal, the deterioration of cost performance that followed the development of volume
flexibility is significantly greater than is the deterioration of delivery and quality performance.
These results shed some light on how ServCo resolved the tradeoffs involved with the
development of multiple capabilities. Given that it was extremely difficult to cope with demand
fluctuations without affecting quality, cost, and delivery performance, the workshops used the
sand cone sequence in reverse order to decide which of the existing capabilities had to be
sacrificed in the first place. The ability to control cost—i.e., the capability at the very top of the
sand cone—was the capability most significantly affected by the development of flexibility,
either because ServCo deliberately decided so, or because, being the least consolidated capability,
it was simply the most difficult to protect. Delivery—which is just one step below cost in the
sand cone sequence and slightly less consolidated—was also affected, but to a lesser extent than
cost. Quality—the capability at the very bottom of the sand cone and the most consolidated
one—was not affected at all. Once again, this could be the result of a deliberate choice: the
company judged service quality to be its most important competitive strength and protected it
accordingly (for instance, by refusing to cut resources dedicated to quality management).
However, it could also be the result of a capability consolidation process. The operational
22
routines developed over time by ServCo in the area of quality management might have become
so ingrained in the organization as to produce tacit knowledge, and to guarantee consistent levels
of quality performance, even after some resources had been reassigned to different tasks.
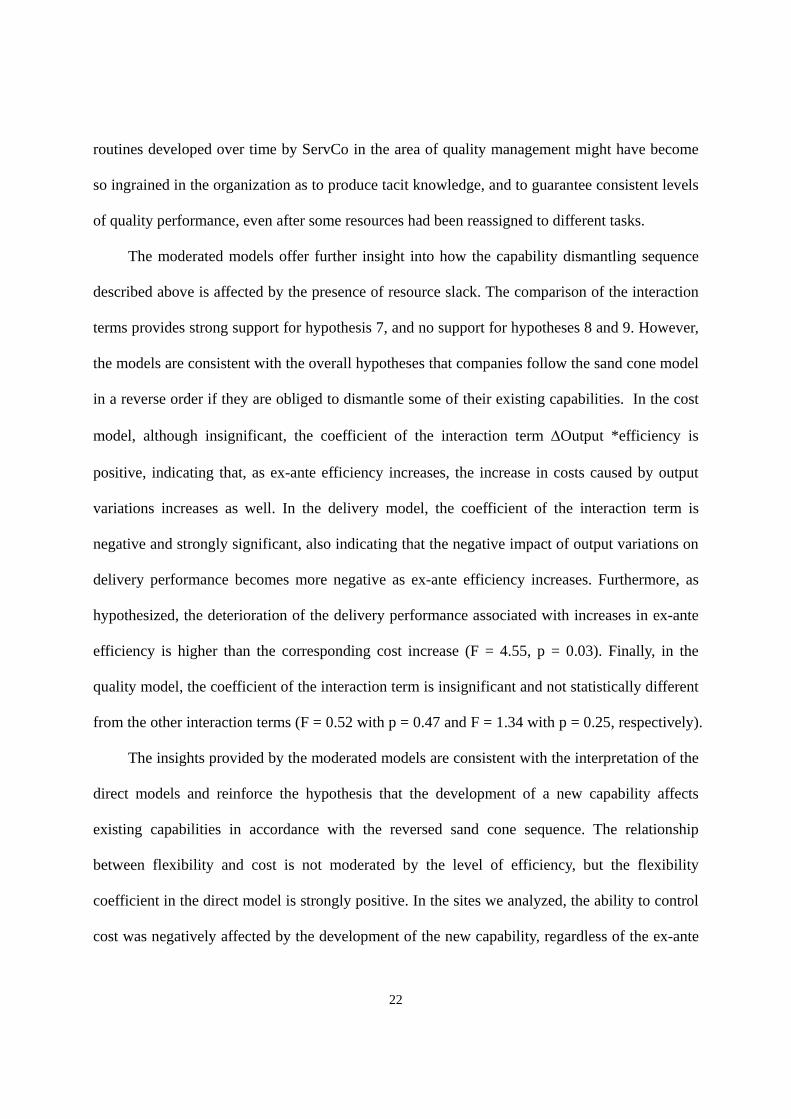
The moderated models offer further insight into how the capability dismantling sequence
described above is affected by the presence of resource slack. The comparison of the interaction
terms provides strong support for hypothesis 7, and no support for hypotheses 8 and 9. However,
the models are consistent with the overall hypotheses that companies follow the sand cone model
in a reverse order if they are obliged to dismantle some of their existing capabilities. In the cost
model, although insignificant, the coefficient of the interaction term ΔOutput *efficiency is
positive, indicating that, as ex-ante efficiency increases, the increase in costs caused by output
variations increases as well. In the delivery model, the coefficient of the interaction term is
negative and strongly significant, also indicating that the negative impact of output variations on
delivery performance becomes more negative as ex-ante efficiency increases. Furthermore, as
hypothesized, the deterioration of the delivery performance associated with increases in ex-ante
efficiency is higher than the corresponding cost increase (F = 4.55, p = 0.03). Finally, in the
quality model, the coefficient of the interaction term is insignificant and not statistically different
from the other interaction terms (F = 0.52 with p = 0.47 and F = 1.34 with p = 0.25, respectively).
The insights provided by the moderated models are consistent with the interpretation of the
direct models and reinforce the hypothesis that the development of a new capability affects
existing capabilities in accordance with the reversed sand cone sequence. The relationship
between flexibility and cost is not moderated by the level of efficiency, but the flexibility
coefficient in the direct model is strongly positive. In the sites we analyzed, the ability to control
cost was negatively affected by the development of the new capability, regardless of the ex-ante

23
efficiency level. Even inefficient workshops could not cope with demand variations without
accepting a deterioration of at least one of their existing capabilities. When forced to select the
capability that had to be sacrificed, most of these sites chose cost—either because cost was
identified as their least important competitive strength, or because it was simply not consolidated
enough to be protected from the required reallocation of resources.
Conversely, the relationship between flexibility and delivery is strongly moderated by
efficiency: the impact of flexibility on delivery performance is higher for more efficient
workshops. The split-sample analysis confirms that only workshops with a significant amount of
resource slack could deal with changes in their output volume without deteriorating their
delivery performance (of course they did face an increase in cost). On the contrary, more
efficient workshops that had fewer resources to spare were forced to accept a deterioration of
their delivery performances in addition to the increase in costs.
Finally, the relationship between flexibility and quality is also not moderated by efficiency.
However, and in sharp contrast with cost, the flexibility coefficient in the direct model is non-
significant. The relationships between flexibility and cost and between flexibility and quality are
both unaffected by the ex-ante degree of efficiency, but for very different reasons. Cost is always
affected by changes in the output volume, regardless of the ex-ante efficiency level, because it is
the least important competitive priority and the least consolidated capability. Quality is never
affected by changes in the output volume, regardless of the ex-ante efficiency level, because it is
the most important competitive strength and the most consolidated capability.
6 Conclusions
The increasing level of rivalry and the high customer sophistication that characterize
today’s markets require service companies to improve their agility, i.e., to become excellent

24
along several competitive dimensions, such as quality, delivery, cost, and flexibility. This has
historically been one of the central themes in the field of operations strategy. The sand cone
model and the competitive progression theory have argued that firms can overcome some of the
tradeoffs associated with the development of multiple capabilities if they build these capabilities
according to a precise sequence. Yet, the fact that numerous companies have failed in their
attempts to become agile suggests that this capability development process is not fully
understood and that negative interactions may occur between different capabilities, even when
companies follow the sequence proposed by the sand cone model.
This paper sheds new light on the capability-building process of service firms, and it makes
three contributions to the literature. The first and main contribution pertains to the relationship
between flexibility and the other competitive capabilities of the firm. We originally argued that
even when companies develop multiple competitive capabilities in accordance with the sand
cone model, some of the tradeoffs advocated by the proponents of the “focused factory”
perspective cannot be completely ruled out. That is, even though following the “quality, delivery,
cost, flexibility” sequence may facilitate the development of each new capability that is added to
the existing base, the added capability will affect the levels of those already established.
Our results suggest that the nexus between flexibility and the other capabilities is, indeed,
complex. Although the analysis confirms that the presence of tradeoffs limits the ability of a firm
to become excellent along multiple competitive capabilities, it also suggests that the magnitude
of these tradeoffs is contingent on the capability considered. Whereas cost and, to a more limited
extent, delivery are affected by the development of flexibility, quality remains virtually unaltered.
Second, our results shed new light on how the sand cone model contributes to the
development of agility and further confirm its validity in a service environment. The sand cone
sequence (quality, delivery, cost, and flexibility) has been recognized as the capability-building

25
sequence that most facilitates the development of new competitive strengths. Our results suggest
that firms follow the sequence prescribed by the model (in reverse order) also when they are
forced to dismantle the capabilities in their existing base. The implicit consequence of this
finding is that, once more, quality emerges as the true foundation of a firm’s set of operational
strengths, and the last competitive capability that organizations are willing to let deteriorate.
A third contribution of our work is methodological. The majority of prior studies in this
area have relied on perceptual measures, usually computed via single- or multi-item scales, to
assess the competitive capabilities constructs. Our paper provides an alternative, more objective
method that relies on quantitative data readily available from most service organizations. This
represents another valuable tool for researchers to use in future studies in this area,
complementing the more subjective perceptual measures used in prior studies.
Finally, our results also provide some managerial guidelines that help companies develop
multiple capabilities and offer some insights into why the number of successful cases of agile
service organizations is still limited (Hill 2000). Our analysis suggests that the incorporation of
flexibility into service processes is not free. However, it also indicates that companies needing to
address greater shifts in demand volume can build volume flexibility without too much concern
about the deterioration of their quality performance. On the other hand, these companies should
be aware that the development of flexibility may affect their ability to control cost and to deliver
on time. When firms need to address demand fluctuations, they should consider whether the
additional benefits obtained by being able to provide services to a greater number of customers is
worth the deterioration of cost and delivery performance that is likely to result from this decision.
Our study is not exempt from limitations. First, the study was restricted to a specific
empirical context. The variables used in the DEA model to measure the competitive capabilities
of quality, cost, delivery, and flexibility are objective, but also industry-specific. Second, we have
26
examined the impact of one specific type of flexibility (volume flexibility), while neglecting
other types, such as mix flexibility (i.e., variations in the type of service provided). As volume
flexibility can be built more easily because uncertainty related to the quantity of work is easier to
manage than uncertainty related to changes in the nature of the work, the impact of flexibility on
quality, delivery, and cost may be underestimated by our analysis.
These limitations naturally indicate several avenues for future research. First, an extension of
this study to other industries and/or countries would be required to improve the generalizability
of our results. Second, it would be interesting to examine the impact of other flexibility types,
including those incorporating the customer’s perspective. Our study focuses on service agility
mainly from a business viewpoint: we consider the advantages that multiple capabilities bring to
service providers, not to customers. Yet, an emerging stream of literature emphasizes the role of
customers as “co-owners” in the design and operation of service delivery processes and proposes
the concept of customer agility (Xue, Hitt, and Harker 2006). It remains to be verified whether
the strategies that maximize agility from the service provider’s point of view are also beneficial
when examined from the customer’s perspective.
7 References
Anand, G., P. T. Ward. 2004. Fit, flexibility and performance in Manufacturing: Coping with dynamic
environments. Production and Operations Management, 13 (4), 369-85.
Aranda, D.A. 2003, Service Operations Strategy, Flexibility and Performance in Engineering Consultants
Firms, International J. of Operations & Production Management, 23(12), 1401-1421.
Avram, F., L. M. Wein. 1992. A product design problem in semiconductor manufacturing. Operations
Research, 40 (5), 986-98.
Boussofiane, A. R., G. Dyson, and E. Thanassoulis. 1991. Applied data envelopment analysis. European J.
of Operational Research, 52, 1-15.

27
Boyer, K. K., Peter T. Ward, and G. K. Leong. 1996. Approaches to the factory of the future: An empirical
taxonomy. J. of Operations Management, 14 (4), 297-313.
Boyle, T., V. Kumar, and U. Kumar. 2006. Determinants of integrated product development diffusion.
R&D Management, 36 (1), 37-54.
Browne, J., D. Dubois, K. Rathmill, S.P. Sethi, and K.E. Stecke 1984, Classification of Flexible
Manufacturing Systems, The FMS Magazine, 2(2), 114-117
Campbell, D. 1988. Task complexity: A Rev. and analysis. Academy of Management Rev., 13, 40-52.
D'Aveni, R. A., R. Gunther. 1994. Hypercompetition: Managing the Dynamics of Strategic Maneuvering.
New York: The Free Press.
D'Souza, D. E., F. P. Williams. 2000. Toward a taxonomy of manufacturing flexibility dimensions. J. of
Operations Management, 18 (5), 577-93.
De Groote, X. 1994. The flexibility of production processes: A general framework. Management Science,
40 (7), 933-45.
De Meyer, A. J. Nakane, J.G. Miller, and K. Ferdows 1989, Flexibility: The Next Competitive Battle the
Manufacturing Futures Survey, Strategic Management J., 10(2), 135-144
Dunk, Alan, S., 1995. The joint effects of budgetary slack and task uncertainty on subunit performance,
Accounting and Finance, 35 (November), 61-75.
Feigenbaum, A., A. Karnani. 1991. Output flexibility—A competitive advantage for small firms. Strategic
Management J., 12 (2), 101-14.
Ferdows, K., A. De Meyer. 1988. European manufacturers: The danger of complacency. Columbia J. of
World Business, 23 (3), 15-23.
Ferdows, K. J.G. Miller, J. Nakane, and T.E. Vollmann 1986, Evolving Global Manufacturing Strategies:
Projections into the 1990’s, International J. of Operations and Production Management, 6(4), 6-16
Ferdows, K., A. De Meyer. 1990. Lasting improvements in manufacturing performance: In search of a
new theory. J. of Operations Management, 9 (2), 168-84.

28
Flynn, B. B., E. J. Flynn, 2004, An exploratory study of the nature of cumulative capabilities. J. of
Operations Management, 22 (5), 439-57.
Frei, F. X., P. T. Harker, 1999. Measuring the efficiency of service delivery processes: An application to
retail banking. J. of Service Research, 1 (4), 300-312.
Frei, F. X., R. Kalakota, A. J. Leone, and L. M. Marx. 1999. Process variation as a determinant of bank
performance: Evidence from the retail banking study. Management Science, 45 (9), 1210-20.
Frei, F. X. 2006. Breaking the trade-off between efficiency and service. Harvard Business Rev., 84(11),
92-101.
Gaimon, C., V. Singhal. 1992. Flexibility and the choice of manufacturing facilities under short product
life cycles. European J. of Operational Research, 60 (2), 211-223.
Gerwin, D. 1993. Manufacturing flexibility: A strategic perspective. Management Science. 39(4), 395-410.
Gist, M. E., T. R. Mitchell. 1992. Self-efficacy: A theoretical analysis of its determinants and malleability.
Academy of Management Rev., 17, 183-211.
Glaser, D. N., B. C. Tatum,. D. M. Nebeker, , R .C. Sorenson, and J. Aiello. 1999. Workload and Social
Support: Effects on Performance and Stress. Human Performance, 12 (2), 155-177.
Gupta, Y., T. Somers, 1996. Business strategy, manufacturing flexibility, and organizational performance
relationships: A path analysis approach. Production and Operations Management. 5 (3), 204-233.
Hayes, R. H. 2002. Challenges posted to operations management by the "new economy." Production and
Operations Management, 11 (1), 21-32.
Hayes, R. H., S. C. Wheelwright. 1984. Restoring Our Competitive Edge: Competing Through
Manufacturing. New York: John Wiley.
Hill, T. 2000. Manufacturing Strategy: Text and Cases. Boston: McGraw Hill.
Hoskisson, R. E., M. A. Hitt, 1990. Antecedents and performance outcomes of diversification: A Rev. and
critique of theoretical perspectives. J. of Management, 16 (2), 461.
Jack, E. P., A. S. Raturi, 2003. Measuring and comparing volume flexibility in the capital goods industry.
29
Production and Operations Management, 12 (4), 480-501.
Kekre, S., K. Srinivasan. 1990. Broader product line: A necessity to achieve success? Management
Science, 41 (4), 577-94.
Koste, L. L., M. K. Malhotra, 1999. A theoretical framework for analyzing the dimensions of
manufacturing flexibility. J. of Operations Management, 18 (1), 75-93.
Lee, H. L., C. A. Yano, 1988. Production control in multistage systems with variable yield losses.
Operations Research, 36, 269-78.
Mahoney, J.T. and J.R. Pandian 1992, The Resource-Based View Within the Conversation of Strategic
Management, Strategic Management J., 13(5), 363-380
Maynard, Douglas, C., Milton D. Hakel. 1997. Effects of objective and subjective task complexity on
performance. Human Performance, 10 (4), 303-30.
Menor, L. J., A. V. Roth, and C. H. Mason. 2001. Agility in retail banking: A numerical taxonomy of
strategic service groups. Manufacturing & Service Operations Management, 3 (4), 273-92.
Milliken, F. J. 1987. Three types of perceived uncertainty about the environment: State, effect, and
response uncertainty. Academy of Management J., 12 (1), 133-43.
Nakane, J. 1986. Manufacturing futures survey in Japan: A comparative survey 1983-1986. System
Science Institute, Waseda University.
Narasimhan, R., M. Swink, and S. W. Kim. 2006. Disentangling leanness and agility: An empirical
investigation. J. of Operations Management, 24 (5), 440-57.
Noble, M. A. 1995. Manufacturing strategy: Testing the cumulative model in a multiple country context.
Decision Sciences, 26 (5), 693-721.
Nonaka, I., H. Takeuchi. 1996. A theory of organizational knowledge creation. International J. of
Technology Management, 11 (7/8), 833-845.
Oakland, J. S. 1996, Statistical Process Control. Woburn, MA: Butterworth-Heinemann.
Parthasarthy, R. and S.P. Sethi 1993, Relating Strategy and Structure to Flexible Automation: A Test of Fit

30
and Performance Implications, Strategic Management J., 14(7), 529-549
Rosenzweig, E. D., A. V. Roth. 2004. Towards a theory of competitive progression: Evidence from high-
tech manufacturing. Production and Operations Management, 13 (4), 354-68.
Roth, A. V. 1996. Competitive progression theory: Explanation and evidence. In C. Voss, ed.
Manufacturing Strategy in a Global Context. London: London Business School Press.
Salvador, F. Rungtusanatham, C. Forza, and A. Trentin. 2007. Mix flexibility and volume flexibility in a
build-to-order environment: Synergies and trade-offs. International J. of Operations and Production
Management, 27 (11), 1173-91.
Sethi, A. K., S. P. Sethi. 1990. Flexibility manufacturing: A survey. International J. of Flexible
Manufacturing Systems, 2 (4), 289-328.
Skinner, W. 1974. The focused factory. Harvard Business Rev., 52 (3), 113-21.
Swamidass, P. M., W. T. Newell, 1987. Manufacturing strategy, environmental uncertainty, and
performance: A path analytic model. Management Science, 33 (4), 509-24.
Upton, D. M. 1997. Process range in manufacturing: An empirical study of flexibility. Management
Science, 43 (8), 1079.
Vickery, S. K., C. Droge, and R. E. Markland. 1997. Dimensions of manufacturing strength in the
furniture industry. J. of Operations Management, 15 (4), 317-30.
Vokurka, R. J., S.W. O'Leary-Kelly. 2000. A Rev. of empirical research on manufacturing flexibility. J. of
Operations Management, 18 (4), 485-501.
White, G.., 1996. A meta-analysis model of manufacturing capabilities. J. of Operations Management, 14
(4), 315-31.
Xue, M., L. M. Hitt, and P. T. Harker. 2006. Customer efficiency, channel usage and firm performance in
retail banking. Manufacturing & Service Operations Management, Forthcoming.
Yusuf, Y. Y., M. Sarhadi, and A. Gunasekaran. 1999. Agile manufacturing: The drivers, concepts and attributes. International J. of Production Economics, 62 (1/2), 33-43.

31
Tables
Table 1: Workshops’ geographical distribution Region N % South East 13 15.48% London 10 11.90% North West 10 11.90% South West 10 11.90% East of England 8 9.52% Scotland 8 9.52% West Midlands 7 8.33% East Midlands 6 7.14% Yorks & Humber 6 7.14% Wales 4 4.76% North East 1 1.19% Northern Ireland 1 1.19% TOTAL 84 100%
Table 2: Workshops’ operational characteristics 1st Quarter 2006 1st Quarter 2007 Mean St dev Mean St dev
Average output [th. £] 223.99 119.98 217.54 115.94 Total cost [th. £] 187.52 94.72 195.53 99.97 % vehicles delivered on time 0.84 0.06 0.86 0.05 % of vehicles passing the MOT test 0.73 0.21 0.80 0.20 DEA Efficiency 0.426 0.228 0.419 0.221 Profitability 0.140 0.114 0.074 0.144 Number of technicians 6.71 3.02 n.a. n.a.
Table 3: Pearson Correlations (N = 84) Variable Mean Std Dev Min Max 1 2 3 4 5 6 7 81. ΔOutput (changes in output ) -0.08 0.08 -0.28 0.14 2. Changes in total cost 0.03 0.11 -0.28 0.28 0.42 3. Changes in delivery 0.03 0.05 -0.12 0.19 -0.19 -0.09 . 4. Changes in quality 0.16 0.52 -1.00 3.00 -0.16 -0.07 -0.04 5. Profitability changes -0.07 0.10 -0.30 0.24 0.39 -0.61 -0.09 -0.04 6. DEA Efficiency 2006 0.43 0.22 0.12 1.00 -0.03 0.04 -0.05 -0.20 -0.12 7. Output Q1 2006 (sales in th. £ ) 223.99 119.98 51.91 574.08 -0.02 -0.02 -0.09 0.07 0.06 -0.83 8. Workshop size (N.of technicians) 6.71 3.02 2.00 14.00 0.01 0.00 0.05 0.08 0.07 -0.82 0.86 9. % external trade 0.37 0.12 0.09 0.70 0.40 0.03 -0.06 -0.01 0.35 -0.37 0.38 0.24

32
Table 4: Impact of output changes on quality delivery and cost performance Model 1 Model 2 Model 3 (n = 84) (n = 84) (n = 84)
Dep. variable: Cost Par. estimate St. error p-value Par. estimate St. error p-value Par. estimate St. error p-value Output Q1 2006 -0.144 0.000 0.568 0.093 0.000 0.681 0.159 0.000 0.508 Workshop size 0.117 0.009 0.628 -0.017 0.008 0.937 0.126 0.009 0.602 % of external trade 0.083 0.124 0.537 -0.175 0.119 0.181 -0.160 0.122 0.229 Profitability changes -0.102 0.007 0.406 -0.241 0.006 0.033 -0.329 0.007 0.016 ΔOutput 0.574 0.175 <.0001 0.347 0.352 0.160 DEA Efficiency 2006 0.368 0.134 0.182 ΔOutput x Efficiency 0.332 0.730 0.284 Model F 0.250 0.908 4.770 0.001 3.670 0.002 R2 0.014 0.254 0.274 ΔR2 0.240 0.020 Dep. variable: Delivery Par. estimate St. error p-value Par. estimate St. error p-value Par. estimate St. error p-value Output Q1 2007 -0.542 0.000 0.029 -0.657 0.000 0.009 -0.753 0.000 0.004 Workshop size 0.515 0.004 0.030 0.580 0.004 0.014 0.318 0.005 0.206 % of external trade 0.044 0.060 0.737 0.168 0.064 0.232 0.153 0.063 0.269 Profitability changes -0.079 0.003 0.506 -0.012 0.003 0.918 0.183 0.004 0.190 ΔOutput -0.277 0.094 0.037 0.255 0.183 0.320 Efficiency -0.707 0.069 0.015 ΔOutput x Efficiency -0.775 0.379 0.018 Model F 1.420 0.236 2.090 0.076 2.65 0.0176 R2 0.074 0.131 0.214 ΔR2 0.057 0.083
Dep. variable: Quality Par. estimate St. error p-value Par. estimate St. error p-value Par. estimate St. error p-value Output Q1 2007 -0.022 0.001 0.930 -0.093 0.001 0.719 -0.292 0.001 0.273 Workshop size 0.116 0.042 0.629 0.156 0.043 0.520 -0.026 0.047 0.921 % of external trade -0.015 0.593 0.912 0.062 0.651 0.676 -0.008 0.646 0.955 Profitability changes -0.084 0.032 0.494 -0.043 0.033 0.735 -0.085 0.038 0.562 ΔOutput -0.170 0.951 0.220 -0.393 1.864 0.149 Efficiency -0.329 0.708 0.279 ΔOutput x Efficiency 0.318 3.863 0.352 Model F 0.260 0.900 0.520 0.761 1.260 0.284 R2 0.015 0.035 0.114 ΔR2 0.020 0.079